ALGEBRIS UCITS FUNDS PLC (an umbrella fund with segregated ...
164
ALGEBRIS UCITS FUNDS PLC (an umbrella fund with segregated liability between Sub-Funds) INTERIM REPORT AND UNAUDITED CONDENSED FINANCIAL STATEMENTS FOR THE PERIOD FROM 1 JANUARY 2019 TO 30 JUNE 2019
Transcript of ALGEBRIS UCITS FUNDS PLC (an umbrella fund with segregated ...

ALGEBRIS UCITS FUNDS PLC
(an umbrella fund with segregated liability between Sub-Funds)
INTERIM REPORT AND UNAUDITED CONDENSED FINANCIAL STATEMENTS
FOR THE PERIOD FROM 1 JANUARY 2019 TO 30 JUNE 2019

ALGEBRIS UCITS FUNDS PLC
Contents
1
Management and Administration 2-3
Investment Manager’s Report
4-10
Unaudited Statement of Financial Position 11-14
Unaudited Statement of Comprehensive Income 15-22
Unaudited Statement of Changes in Net Assets Attributable to Holders of Redeemable
Participating Shares 23-26
Unaudited Statement of Cash Flows 27-30
Notes to the Unaudited Financial Statements 31-79
Unaudited Schedule of Investments 80-139
Unaudited Schedule of Significant Changes in Investments 140-151
Other Additional Disclosures 152-163

ALGEBRIS UCITS FUNDS PLC
Management and Administration
2
Registered Office 33 Sir John Rogerson’s Quay
Dublin 2
Ireland
Directors* Alexander Lasagna
Carl O’Sullivan**
Desmond Quigley**
Investment Manager, Distributor
and Promoter
Algebris (UK) Limited
1 St James’s Market
London
SW1Y 4AH
United Kingdom
Sub Investment Managers Algebris Investments (Asia) Pte Limited
9 Straits View
#05-08 Marina One West Tower
Singapore 018937
Algebris Investments (US) Inc.
1209 Orange Street
Wilmington
New Castle County
Delaware 19801
USA
Depositary Prior to 1 April 2019
HSBC Institutional Trust Services (Ireland) DAC
1 Grand Canal Square
Grand Canal Harbour
Dublin 2
Ireland From 1 April 2019
HSBC France, Dublin Branch
1 Grand Canal Square
Grand Canal Harbour
Dublin 2
Ireland Administrator, Registrar and
Transfer Agent
HSBC Securities Services (Ireland) DAC
1 Grand Canal Square
Grand Canal Harbour
Dublin 2
Ireland
Independent Auditor
KPMG
1 Harbourmaster Place
IFSC
Dublin 1
Ireland
ALGEBRIS UCITS FUNDS PLC
Management and Administration (continued)
3
Legal Adviser Dillon Eustace
33 Sir John Rogerson’s Quay
Dublin 2
Ireland
Company Secretary Tudor Trust Limited
33 Sir John Rogerson’s Quay
Dublin 2
Ireland
Representative in Switzerland ACOLIN Fund Services AG
Leutschenbachstrasse 50
CH-8050 Zurich
Switzerland
Paying Agent in Switzerland Bank Vontobel Limited
43 Gotthardstrasse
CH-8022 Zurich
Switzerland
* All directors are non-executive
** Independent director

ALGEBRIS UCITS FUNDS PLC
Algebris Financial Credit Fund
Investment Manager’s Report
for the period from 1 January 2019 to 30 June 2019
4
2019 started on a positive note for risk assets as recessionary concerns reversed. The combination of favourable market
conditions and improved technical backdrop was positive for financial hybrids (particularly for those issued by high beta and
periphery names), whose spreads moved tighter across segments and geographies and recovered the losses suffered in Q4 2018.
In March, the dovish twist from the main Central Banks took the spotlight and fuelled the credit markets in the following
months. The Fed made clear there wouldn’t be more raises in 2019 and even discussed the possibility of cuts in the second
semester, while the ECB announced downgrades that drove rates lower, and committed to a new TLTRO3 (Targeted longer-
term refinancing operations). This dovish rhetoric was one of the main drivers of performance for our asset class. On the other
hand, a marked increase in headlines around AML issues in March put significant pressure on spreads, mostly in Northern and
Eastern European names.
Meanwhile, fundamentals remained solid, particularly on the core names in the portfolio. The full 2018 year results showed
good resiliency of balance sheet and capital buffers to the recent volatility.
The second quarter started with resilient economic data, low volatility and positive developments in trade negotiations, all
contributing to a positive backdrop for risk assets. Italian names also benefitted from S&P’s decision to affirm its BBB rating
for Italy. April also marked the kick-off of the Q1 earnings season, with banks reporting pressure on interest margins and an
increase in Risk weighted assets, due to the much-anticipated introduction of IFRS16 and TRIM. RWA inflation however was
offset by strong organic capital generation, leaving capital ratios broadly unchanged.
The positive backdrop only reversed in May as trade tensions jumped back into the spotlight along with uncertainty around
global growth. Financial hybrids suffered from the general rise in spreads, particularly our Italian names as the country
remained under pressure due to renewed threats of an excessive budget deficit procedure and ongoing tensions between the two
coalition parties.
Confirmation of ongoing dovish rhetoric by key Central Banks in June pushed the markets again, with rates tightening, curves
bull flattening, credit indices rallying, and broader equity indices back to historic highs. Performance across the financials’
capital structure was mixed, with a significant decoupling between the deeper subordinated parts of credit and equities, which in
effect pushed the average AT1 yields through the respective European GSIFIs’ dividend yields. German banks were in the
spotlight this time due to the ongoing media coverage of the sector’s potential restructuring plans via M&A and the impeding
enactment of the ADI law.
Primary activity picked up in the first months of the year but demand was strong across deals showing the sentiment shift from
late 2018. Banks have almost filled their entire AT1 and Tier 2 buffers, and we expect net new supply to be limited going
forward. We think this should provide support for further spread tightening in the coming months.

ALGEBRIS UCITS FUNDS PLC
Algebris Financial Income Fund
Investment Manager’s Report
for the period from 1 January 2019 to 30 June 2019
5
2019 started on a positive note for risk assets as recessionary concerns reversed. The combination of favourable market
conditions and improved technical backdrop was positive for financials. On the Equity side, bank indices recovered a good part
of the losses posted in December. Our portfolio did particularly well in January and February, as we started the year with a bank
sector trading at historic lows while most of the significant and persistent drags kept falling away (deleveraging, restructuring
costs, capital increases, provisions…). Q4 2018 earnings appeared to confirm our view that the December swoon was not driven
by fundamental factors. In fact, fundamentals remained quite strong across regions, while valuations were highly attractive and
estimates looked achievable. On the credit side, spreads moved tighter across segments and geographies and recovered the
losses suffered in Q4 2018.
In March, dovish commentary from both the ECB and the Fed sparked a sell off of financials stocks relative to the market. On
the other hand however, this triggered a positive repricing in credit markets. The ECB also announced a new round of TLTRO
(Targeted longer-term refinancing operations), which was positive for bank credit too.
In the meantime, bank fundamentals remained solid during the first quarter, particularly on the core names in the portfolio. The
full year results showed good resiliency of balance sheet and capital buffers to the recent volatility.
The second quarter started with a continuation of dovish statements from the central banks, resilient economic data, low
volatility and trade developments all contributing to a positive backdrop. The strong market and technical backdrops, combined
with the ECB’s renewed commitment to TLTRO3 continued to drive gains in the sector and particularly in peripherals, with
Italian names further benefitting from S&P’s decision to affirm its BBB rating for Italy. In Europe, Q1 earnings results
confirmed the market had grown overly bearish with respect to capital and earnings generation. In the US, we had a positive
upside catalyst in the Alts as Blackstone and Apollo announced they will convert C-Corp from a publicly traded partnership
(PTP), opening the door to a wider investor base and index inclusion.
In May however, the backdrop reversed as trade tensions between US and China jumped back into the spotlight along with
uncertainty around central banks’ monetary policy. Financial hybrids suffered from the general rise in spreads, particularly our
Italian names, as the country remained under pressure due to renewed threats of an excessive budget deficit procedure and
ongoing tensions between the two coalition parties. In equities, the sell-off pressured our long book and the Fund gave back
some of April’s strong performance.
Confirmation of ongoing dovish rhetoric by key Central Banks fuelled the markets again in June, with rates tightening, curves
bull flattening, credit indices rallying, and broader equity indices back to historic highs. Performance across the financials’
capital structure was mixed, with a significant decoupling between the deeper subordinated parts of credit and equities, which in
effect pushed the average AT1 yields through the respective European GSIFIs’ dividend yields.
We are mindful of an increasingly uncertain backdrop around rates and trade. However, we very much retain our high
conviction across our core equity ideas in US alternative asset managers, life insurers, and select US and European banks. In
credit, we remained overweight in European AT1s, where we see more value.

ALGEBRIS UCITS FUNDS PLC
Algebris Allocation Fund (formerly Algebris Asset Allocation Fund)
Investment Manager’s Report
for the period from 1 January 2019 to 30 June 2019
6
At the beginning of January, investors in the Fund received a notification of proposed changes to the investment objective and
policy for the Algebris Asset Allocation Fund. After obtaining the required shareholder and regulatory approvals in February,
the Fund transitioned to a new investment process, which is implemented mainly via investments in other Algebris Funds, and,
to a lesser extent, direct investments in eligible assets. The Fund name also changed to “Algebris Allocation Fund” and it now
offers a solution for investors looking to access Algebris investment expertise through a single product.
After a tough end of 2018, the fund had a good start of the year. Both equity and credit recovered a big part of the losses
suffered in Q4 2018, as the recessionary concerns sharply reversed and economic growth consolidated across the US (+2%),
Eurozone (+1%) and China (+6%). The combination of favourable market conditions and improved technical backdrop was
very positive for financial assets, particularly for high beta and periphery names where the fund was overweight. The Italian
stock market also outperformed in the first months of the year.
March was an eventful month for risky assets across geographies and the fund managed to keep the volatility under control. A
new dovish Fed meeting and downgrades by the ECB drove rates lower, triggered a positive repricing in credit markets.
However, the move in rates was negative for bank equities across the US and Europe, who gave back some of January and
February performance.
The fund was up again in April, which was another strong month for risk assets. Main central banks turning dovish, resilient
economic data, low volatility and trade developments created a favourable backdrop across sectors and geographies. Both
financial credit and equities performed well, which made the allocation to the Algebris Financial Income Fund and the Algebris
Financial Credit Fund the major contributors to the Fund’s performance.
In May, the fund made its first allocation to the recently launched Algebris Quant Arbitrage Fund, a quant driven strategy that
intends to benefit from changes in the volatility regime. We also reduced the overall risk of the fund by decreasing the exposure
to all underlying funds. However, the spike in tensions between US and China jumped back and the renewed uncertainty around
central banks’ monetary policy brought the monthly return of the fund into negative territory.
Confirmation of ongoing dovish rhetoric by key Central Banks fuelled the markets again in June, with rates tightening, curves
bull flattening, credit indices rallying, and broader equity indices back to historic highs. Performance across the financials’
capital structure was mixed, with a significant decoupling between deeper subordinated parts of credit and equities, which in
effect pushed the average AT1 yields through the respective European GSIFIs’ dividend yields.

ALGEBRIS UCITS FUNDS PLC
Algebris Financial Equity Fund
Investment Manager’s Report
for the period from 1 January 2019 to 30 June 2019
7
The fund started the year on a positive note, with bank indices recovering a good part of the losses posted in December. Our
portfolio did particularly well in January and February, as we started the year with a bank sector trading at historic lows while
most of the significant and persistent drags kept falling away (deleveraging, restructuring costs, capital increases, provisions…).
Q4 2018 earnings appeared to confirm our view that the December swoon was not driven by fundamental factors. In fact,
fundamentals remained quite strong across regions, while valuations were highly attractive and estimates looked achievable.
In March, dovish commentary from both the ECB and the Fed sparked a sell off of financials stocks relative to the market. In
the US, Chairman Powell once again surprised markets with a marked shift in sentiment, causing rates to rally and the yield
curve to invert. After the comments, the market was clearly expecting a significant likelihood that the Fed cuts rates by the end
of 2019. In Europe, prevailing Brexit uncertainty and the dovish commentary out of the ECB saw European banks giving back
some of January and February performance.
April was again a strong month for financials. In Europe, Q1 earnings results confirmed the market had grown overly bearish
with respect to capital and earnings generation. In the US, we had a positive upside catalyst in the Alts as Blackstone and
Apollo announced they will convert C-Corp from a publicly traded partnership (PTP), opening the door to a wider investor base
and index inclusion. Following these positive developments in both Europe and the US, we significantly reduced our overall
gross and net exposures.
Despite our more conservative positioning, the magnitude of the sell-off in May pressured our long book and the
Fund gave back some of April’s strong performance. June was again positive for the fund, but financials
significantly lagged broader indices, and in a market where multiple expansion has delivered the vast majority of the
overall total return, financials have generally not benefited from re-rating as the negative sentiment and underweight
positioning continues. We are mindful of an increasingly uncertain backdrop around rates and trade, and have
somewhat increased the size of our hedge book to protect against further volatility. However, we very much retain
our high conviction across our core ideas in US alternative asset managers, life insurers, and select US and
European banks.

ALGEBRIS UCITS FUNDS PLC
Algebris Macro Credit Fund
Investment Manager’s Report
for the period from 1 January 2019 to 30 June 2019
8
The fund started with a strong performance in January amid a rebound in risk assets from a December trough. The broad selloff
in risk that characterized 2018 reversed on the back of central banks guidance. Both the Fed and the ECB have signalled more
easing coming, following weaker growth and choppy markets. At the same time, the market moved away from the worst-case
scenario (recession), so that weak but not extremely weak growth co-exist with strong monetary support. This scenario supports
both duration and risky assets. In June, we took advantage of the rally to take profits on some long positions in European and
US high yield indices, and high beta EM rates and credit positions. We maintain exposure to European selected credits and
idiosyncratic opportunities in the EM space.
In February, our bond portfolio continued to benefit from the tightening in corporate spreads that started in January, as well as
from the stabilisation in global PMIs. The main performance drivers were a recovery in financial hybrids and Emerging
Markets. The release of its updated “dot plots” by the Fed in March communicated no hikes in 2019 and only 1 in 2020. The
dovish turn continued to support risk-assets, particularly in EM - where we had added since the beginning of the year. To
diversify our risk exposure, we trimmed down our exposure to Italy and Spain by the end of the first quarter.
In April, risk assets continued to perform as global-growth data showed signs of stabilisation and trade-war risks remained low.
European credit spreads rallied, but cash spreads lagged CDS spreads as investors awaited May’s European election results.
Despite this positive macro backdrop, EM assets underperformed mainly due to weakness in Argentina and Turkey. In Europe,
we started to take profit on the most volatile names or the outperformers and added some hedges in EM in anticipation of
volatility around US-China negotiations, Turkey’s re-run of Istanbul elections, and South Africa’s elections in May.
Trade war risks re-emerged in May and brought prices of risky assets down. The trade war between the US and China re-
escalated, with President Trump raising tariffs targeting Chinese telecom company Huawei, and China retaliating in equal
measure. Further, President Trump announced new tariffs on Mexican goods, claiming Mexico wasn’t doing enough to contain
illegal immigration into the US. Anticipating the risk of a market correction ahead of the summer, we kept increasing the
hedges for the overall long credit portfolio with rate duration longs and equity put options.
After the small risk-off in May, June had a strong performance for risk-assets as central bankers broadly capitulated, notably
with Fed Chairman Powell discussing the possibility of rate cuts as early as July. We took profits from our long positions in
rates, but maintain exposure to credits. Spreads are not as tight as duration and the initial phase post cuts will support selected
risky assets.

ALGEBRIS UCITS FUNDS PLC
Algebris Core Italy Fund
Investment Manager’s Report
for the period from 1 January 2019 to 30 June 2019
9
The Italian stock market started the new year on a very positive note. Global markets were up on January after the 2018 global
downturn. We continued to add names that had de-rated significantly in the sell-off but had significant revenue growth
strategies, and added some high quality names where we expected positive news flows. These investments where funded by
profit taking in positions that had a strong performance in January. Overall, we reduced our net exposure to equities to 40%.
For the rest of the first quarter, our fund continued its upward trend as Italian stock markets continued to rally thanks to well-
received progress in the US-China negotiations and the results of Italian local elections. Italian macro environment remained
negative, with forecasted GDP growth for the current year close to zero. However, market sentiments stabilised, as the market
did not expect lower estimates. Our credit portfolio rallied on the back of the ECB’s decision of postponing a potential interest
rate hike and the launch of a new round of TLTRO (Targeted longer-term refinancing operations). After three months of
straight positive performance, and with Italian company valuations reaching fair levels. We started to sell some of the best
performing stocks to add lower risk names with higher visibility and good dividend yield.
Financial hybrids performed well through April. The strong market and technical backdrops, combined with the ECB’s renewed
commitment to TLTRO3 continued to drive gains in the space. This, added to S&P’s decision to affirm its BBB rating of Italy,
led to a positive although weaker performance of the fund compared to previous month. However, the complexity of European
macro and political situation including Italian budgetary problem still posed notable risks to the market.
May was a turbulent month for the Italian stock market, amid escalating trade tension and an unstable domestic political
situation. Italian companies reported weaker than expected Q1 results, with revenue results broadly flat and deteriorating EPS.
At a macro level, poor results from domestic consumption and investments negatively contributed to the market confidence. EU
general election results in Italy triggered more instability within the government coalition, further straining the economic
situation in the country. Responding to uncertainty on a macro level, we kept on hedging the portfolio on both equity and credit,
reducing our overall net exposure to the market.
After a turbulent month of May, June proved to be a strong month for Italian assets again. Despite this positive performance, the
Italian companies are still facing uncertainties in the domestic political scenario due to prolonged tensions within the coalition
government. However, the positive resolution of the negotiations with the EU on excessive deficit, as well as a continued
dovish approach of the ECB on interest rates have benefited the market and held investor confidence. Although 2Q company
results are expected to be weak, this should have already been discounted in the prices, leaving space for a potential upside in
the coming months. The markets still appear to be heavily dependent by external factors, such as Central Banks actions on
interest rates levels and the US-China trade dispute. Our strategy is to continue to rebalance our portfolio and opportunistically
increase exposure in equities.

ALGEBRIS UCITS FUNDS PLC
Algebris Quant Arbitrage Fund (formerly Algebris Tail Risk Fund)
Investment Manager’s Report
for the period from 1 January 2019 to 30 June 2019
10
Due to a change in the strategy, the former Algebris Tail Risk Fund remained un-invested until May 2019, when it was renamed
as Algebris Quant Arbitrage Fund and its investment policy was changed. The Algebris Quant Arbitrage Fund follows an
investment strategy that has close to zero correlation to the overall market behaviour. Since the portfolio is market neutral, it
shows a cyclical, elastic behaviour, whereas a lower trough is followed by a higher peak. The elastic movement depends,
among other factors, on volatility and dispersion, where in high volatility environment, we experience wider waves at a faster
speed of reversion. The gross exposure of the portfolio increases in an environment of high volatility and dispersion, as the
model finds plenty of arbitrage opportunities and increases the weight allocation.
In May, equity markets had a partial retracement globally after four positive months of double-digit performance. However,
analysing the month of May behaviour through the lens of our indicators seems to confirm that the month was not particularly
relevant from the volatility structure perspective. There has been indeed a partial increase in the level of volatility, but it didn’t
translate into higher dispersion within equity indices. We believe the market is rebalancing its expectations due to several global
geopolitical risks, but there has not been any signs of structural change in volatility. We expect this situation to be temporary,
with more statistical arbitrages opportunities coming shortly.
During the month of June, equity market indices had a strong upward movement mainly driven by an acceleration in the dovish
turn of Central banks that now foresee a comeback of more easing stances in monetary policy. Equity markets volatility indices
fell by 20% from the previous month. The fund closed the month with a positive performance, recovering from May’s
contraction and supporting the elastic dynamic and cyclical movement nature of our portfolio, as mentioned above. This
positive result was achieved in a market scenario far from ideal for our strategy, in terms of volatility and market dynamics,
where identifying arbitrage opportunities becomes harder.
Algebris (UK) Limited
28 August 2019

ALGEBRIS UCITS FUNDS PLC
Unaudited Statement of Financial Position
as at 30 June 2019
The accompanying notes form an integral part of these financial statements
11
Algebris Algebris Algebris Algebris
Financial Financial Allocation Financial Equity
Total Credit Fund Income Fund Fund** Fund 30 June 30 June 30 June 30 June 30 June 2019 2019 2019 2019 2019
Notes EUR EUR EUR EUR EUR
Assets
Financial assets at fair value through profit or loss 4
- Investment funds* - - - 7,158,037 -
- Transferable securities 4,834,826,033 3,855,555,502 417,358,254 2,001,970 64,086,446
- Financial derivative instruments 59,422,399 27,386,706 3,579,849 3,100 1,563,406
- Fixed income pledged as collateral 25,925,765 3,159,844 - - -
Financial assets at amortized cost
Cash and cash equivalents 3 785,428,677 602,860,158 71,911,550 788,379 18,444,693
Cash collateral received 3 79,488,314 288,308 18,731,462 - 7,853,371
Due from broker 15,220,801 14,471 343 - 1,416,702
Due from members 42,303,288 40,305,708 227,274 645,480 144,122
Dividends receivable 521,753 141,147 354,017 - 22,834
Accrued income and other receivables 52,116,236 41,180,983 3,316,689 60,239 17,045
Total assets 5,895,253,266 4,570,892,827 515,479,438 10,657,205 93,548,619
Liabilities
Financial liabilities at fair value through profit or loss 4
- Transferable securities - - - - -
- Financial derivative instruments 64,966,717 16,943,931 21,599,242 6 7,217,436
- Repurchase Agreements 27,708,748 3,052,196 - - -
Financial liabilities at amortized cost
Cash collateral pledged 3 15,752,596 15,747,678 - 4,918 -
Due to broker 9,352,934 645 - - 2,949,374
Due to members 30,168,049 24,293,668 3,164,952 43,634 40,297
Performance fees payable 5 8,053,527 8,053,430 - 3 -
Investment management fees payable 5 3,808,948 2,663,430 436,191 6,531 50,277
Audit fee payable 5 70,011 45,279 10,214 127 1,545
Administration fee payable 5 142,636 86,471 22,444 687 7,191
Depositary fee payable 5 114,497 86,727 10,992 234 1,923
Directors’ fee payable 5 32,232 5,713 4,203 4,203 4,790
Accrued expenses and other payables 945,749 300,973 136,143 23,372 85,248
Liabilities (excluding net assets attributable to
holders of redeemable participating shares) 161,116,644 71,280,141 25,384,381 83,715 10,358,081
Net assets attributable to holders of redeemable
participating shares 5,734,136,622 4,499,612,686 490,095,057 10,573,490 83,190,538
*Cross holdings of EUR 7,158,037 in financial assets at fair value through profit or loss have been eliminated from the Company total. ** Formerly known as Algebris Asset Allocation Fund.

ALGEBRIS UCITS FUNDS PLC
Unaudited Statement of Financial Position (continued)
as at 30 June 2019
The accompanying notes form an integral part of these financial statements
12
Algebris Algebris Algebris
Macro Credit Core Italy Quant Arbitrage
Fund Fund Fund** 30 June 30 June 30 June 2019 2019 2019
Notes EUR EUR EUR
Assets
Financial assets at fair value through profit or loss 4
- Investment funds - - -
- Transferable securities 442,014,073 40,591,027 13,218,761
- Financial derivative instruments 26,613,451 237,806 38,081
- Fixed income pledged as collateral 22,765,921 - -
Financial assets at amortized cost
Cash and cash equivalents 3 86,516,932 2,145,607 2,761,358
Cash collateral received 3 51,485,173 - 1,130,000
Due from broker 13,651,164 3,496 134,625
Due from members 980,704 - -
Dividends receivable - - 3,755
Accrued income and other receivables 7,169,235 211,466 160,579
Total assets 651,196,653 43,189,402 17,447,159
Liabilities
Financial liabilities at fair value through profit or loss 4
- Transferable securities - - -
- Financial derivative instruments 18,904,571 213,690 87,841
- Repurchase Agreements 24,656,552 - -
Financial liabilities at amortized cost
Cash collateral pledged 3 - - -
Due to broker 5,922,744 428,415 51,756
Due to members 2,276,192 349,306 -
Performance fees payable 5 79 6 9
Investment management fees payable 5 643,031 8,675 813
Audit fee payable 5 8,068 3,767 1,011
Administration fee payable 5 22,833 1,954 1,056
Depositary fee payable 5 13,324 978 319
Directors’ fee payable 5 4,203 4,203 4,917
Accrued expenses and other payables 354,493 17,983 27,537
Liabilities (excluding net assets attributable to
holders of redeemable participating shares) 52,806,090 1,028,977 175,259
Net assets attributable to holders of redeemable
participating shares 598,390,563 42,160,425 17,271,900
** Formerly known as Algebris Tail Risk Fund.

ALGEBRIS UCITS FUNDS PLC
Unaudited Statement of Financial Position
as at 31 December 2018
The accompanying notes form an integral part of these financial statements
13
Algebris Algebris Algebris Algebris
Financial Financial Allocation Financial Equity
Total Credit Fund Income Fund Fund** Fund 2018 2018 2018 2018 2018 Notes EUR EUR EUR EUR EUR Assets Cash and cash equivalents 3 380,075,012 289,512,984 16,869,466 1,448,072 4,108,256 Cash collateral received 3 89,277,836 2,690,805 34,209,960 489,058 6,473,994
Financial assets at fair value through profit or loss 4
- Transferable securities 5,163,914,621 4,001,151,960 450,427,193 10,737,352 73,093,219
- Financial derivative instruments 69,374,886 21,497,546 4,466,677 241,406 5,048,956
- Fixed income pledged as collateral 42,172,538 4,924,688 - - -
Due from broker 713,618 4,682 - - 708,936
Due from members 6,416,366 4,872,588 1,118,056 44,740 275,818
Dividends receivable 402,724 141,448 204,561 880 55,835
Accrued income and other receivables 63,265,644 49,424,334 3,276,992 84,481 3,637
Total assets 5,815,613,245 4,374,221,035 510,572,905 13,045,989 89,768,651
Liabilities Cash collateral pledged 3 12,756,145 10,066,145 - - -
Financial liabilities at fair value through profit or loss 4
- Financial derivative instruments 81,266,958 9,263,654 36,528,825 841,908 9,249,934
- Repurchase Agreements 48,066,619 5,215,764 - - -
Due to broker 13,144 12,998 4 - 142
Due to members 27,733,127 23,023,426 1,034,310 22,653 65,664
Performance fees payable 5 956 - - - -
Investment management fees payable 5 4,322,988 2,883,258 518,040 18,275 58,231
Audit fee payable 5 107,306 63,594 16,200 300 2,800
Administration fee payable 5 156,530 95,269 22,371 630 7,936
Depositary fee payable 5 129,906 95,756 12,434 314 2,144
Directors’ fee payable 5 2,813 1,511 - - 588
Accrued expenses and other payables 757,931 185,770 130,077 27,655 92,430
Liabilities (excluding net assets attributable to
holders of redeemable participating shares) 175,314,423 50,907,145 38,262,261 911,735 9,479,869
Net assets attributable to holders of redeemable
participating shares 5,640,298,822 4,323,313,890 472,310,644 12,134,254 80,288,782
** Formerly known as Algebris Asset Allocation Fund.

ALGEBRIS UCITS FUNDS PLC
Unaudited Statement of Financial Position (continued)
as at 31 December 2018
The accompanying notes form an integral part of these financial statements
14
Algebris Algebris Algebris
Macro Credit Core Italy Quant Arbitrage
Fund Fund Fund** 2018 2018 2018 Notes EUR EUR EUR Assets Cash and cash equivalents 3 63,624,139 794,750 3,717,345
Cash collateral received 3 45,324,019 - 90,000
Financial assets at fair value through profit or loss 4
- Transferable securities 585,164,807 35,063,798 8,276,292
- Financial derivative instruments 37,976,122 58,576 85,603
- Fixed income pledged as collateral 37,215,337 32,513 -
Due from broker - - -
Due from members 75,833 29,331 -
Dividends receivable - - -
Accrued income and other receivables 10,128,360 323,018 24,822
Total assets 779,508,617 36,301,986 12,194,062
Liabilities
Cash collateral pledged 3 2,690,000 - - Financial liabilities at fair value through profit or loss 4
- Financial derivative instruments 25,380,059 279 2,299
- Repurchase Agreements 42,579,231 271,624 -
Due to broker - - -
Due to members 3,587,074 - -
Performance fees payable 5 - - 956
Investment management fees payable 5 835,705 7,935 1,544
Audit fee payable 5 19,000 4,357 1,055
Administration fee payable 5 27,641 1,644 1,039
Depositary fee payable 5 17,837 922 499
Directors’ fee payable 5 - - 714
Accrued expenses and other payables 276,742 19,715 25,542
Liabilities (excluding net assets attributable to
holders of redeemable participating shares) 75,413,289 306,476 33,648
Net assets attributable to holders of redeemable
participating shares 704,095,328 35,995,510 12,160,414
** Formerly known as Algebris Tail Risk Fund.

ALGEBRIS UCITS FUNDS PLC
Unaudited Statement of Comprehensive Income
for the period from 1 January 2019 to 30 June 2019
The accompanying notes form an integral part of these financial statements
15
Algebris
Financial
Algebris
Financial
Algebris
Allocation
Algebris
Financial
Total Credit Fund Income Fund Fund** Equity Fund
30 June 30 June 30 June 30 June 30 June
2019 2019 2019 2019 2019
Notes EUR EUR EUR EUR EUR
Investment income
Interest income
- Financial assets measured at FVTPL 157,273,755 128,903,594 8,047,960 27,549 22,924
- Financial assets measured at amortised cost 273,048 68,847 83,568 2,846 28,228
Dividend income 6,096,253 402,375 4,123,203 13,559 1,044,603
Other income 3,177,817 2,420,216 356,360 63,113 4,683
Net gain on financial assets and liabilities
at fair value through profit or loss* 416,127,473 293,629,880 54,561,549 700,628 9,637,944
Net (loss)/gain on foreign exchange (351,784) (249,414) (120,894) 6,020 12,012
Total investment income 582,596,562 425,175,498 67,051,746 813,715 10,750,394
Operating expenses
Performance fees 5 8,590,735 8,590,549 - 3 -
Preliminary expense 2,579 - - - -
Investment management fees 5 24,659,240 16,834,460 2,966,353 48,364 342,189
Administration fees 5 1,271,906 817,967 180,496 7,856 61,096
Directors’ fees 5 30,052 4,834 4,203 4,203 4,203
Dividend expense 46,545 - - - 18,848
Depositary fees 5 739,458 552,292 73,599 1,709 12,809
Audit fees 5 76,834 60,665 6,619 151 888
Transaction cost 624,529 23,155 169,564 6,678 263,018
Other expenses 2,270,779 1,314,227 148,346 76,242 75,626
Total operating expenses 38,312,657 28,198,149 3,549,180 145,206 778,677
Net investment income 544,283,905 396,977,349 63,502,566 668,509 9,971,717
* Net gain on financial assets and liabilities at fair value through profit & loss of EUR 254,058 due to cross holdings have been eliminated from the Company total. ** Formerly known as Algebris Asset Allocation Fund.
ALGEBRIS UCITS FUNDS PLC
Unaudited Statement of Comprehensive Income (continued)
for the period from 1 January 2019 to 30 June 2019
The accompanying notes form an integral part of these financial statements
16
Algebris
Financial
Algebris
Financial
Algebris
Allocation
Algebris
Financial
Total Credit Fund Income Fund Fund** Equity Fund
30 June 30 June 30 June 30 June 30 June
2019 2019 2019 2019 2019
Notes EUR EUR EUR EUR EUR
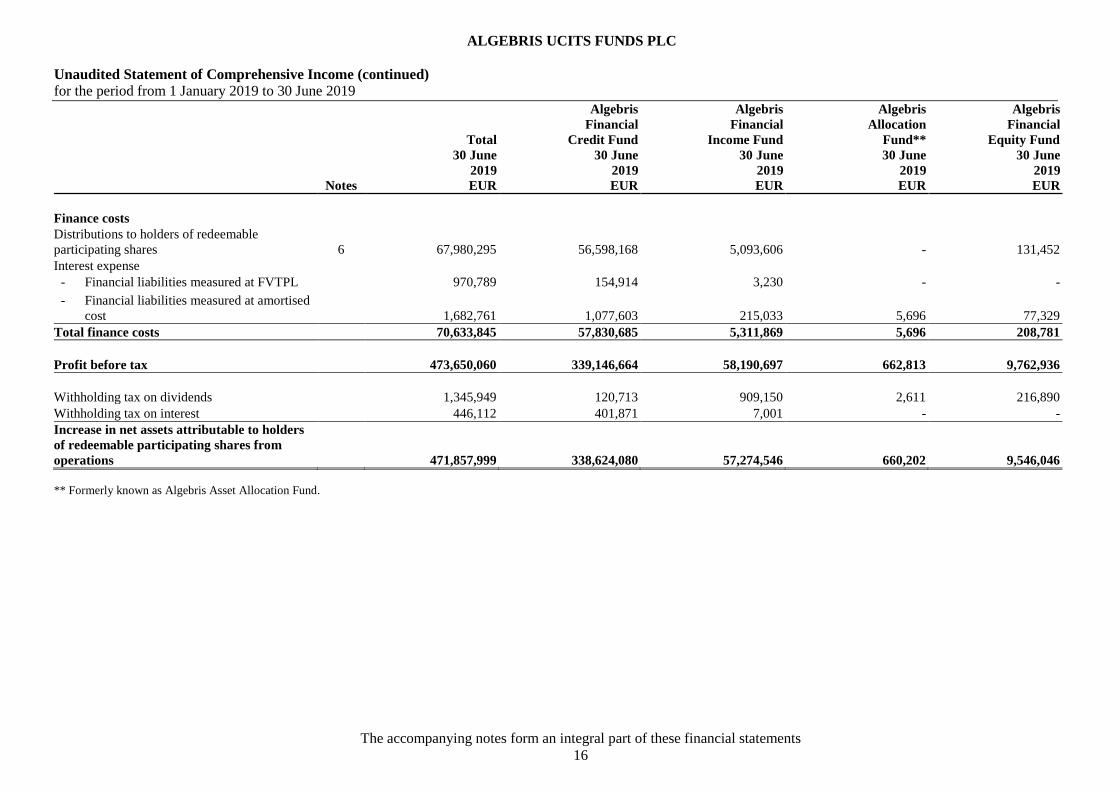
Finance costs
Distributions to holders of redeemable
participating shares 6 67,980,295 56,598,168 5,093,606 - 131,452
Interest expense
- Financial liabilities measured at FVTPL 970,789 154,914 3,230 - -
- Financial liabilities measured at amortised
cost 1,682,761 1,077,603 215,033 5,696 77,329
Total finance costs 70,633,845 57,830,685 5,311,869 5,696 208,781
Profit before tax 473,650,060 339,146,664 58,190,697 662,813 9,762,936
Withholding tax on dividends 1,345,949 120,713 909,150 2,611 216,890
Withholding tax on interest 446,112 401,871 7,001 - -
Increase in net assets attributable to holders
of redeemable participating shares from
operations 471,857,999 338,624,080 57,274,546 660,202 9,546,046
** Formerly known as Algebris Asset Allocation Fund.

ALGEBRIS UCITS FUNDS PLC
Unaudited Statement of Comprehensive Income (continued)
for the period from 1 January 2019 to 30 June 2019
The accompanying notes form an integral part of these financial statements
17
Algebris
Macro Credit
Algebris
Core Italy
Algebris
Quant Arbitrage
Fund Fund Fund**
30 June 30 June 30 June
2019 2019 2019
Notes EUR EUR EUR
Investment income
Interest income
- Financial assets measured at FVTPL 19,803,842 404,841 63,045
- Financial assets measured at amortised
cost 89,305 167 87
Dividend income - 512,513 -
Other income 294,631 11,618 27,196
Net gain on financial assets and liabilities
at fair value through profit or loss 54,325,579 3,470,080 55,871
Net (loss)/gain on foreign exchange (2,347) 8,423 (5,584)
Total investment income 74,511,010 4,407,642 140,615
Operating expenses
Performance fees 5 84 6 93
Preliminary expense - 97 2,482
Investment management fees 5 4,412,587 52,765 2,522
Administration fees 5 186,644 13,448 4,399
Directors’ fees 5 4,203 4,203 4,203
Dividend expense - 27,697 -
Depositary fees 5 91,358 6,015 1,676
Audit fees 5 7,860 370 281
Transaction cost 106,145 55,965 4
Other expenses 553,683 59,204 43,451
Total operating expenses 5,362,564 219,770 59,111
Net investment income 69,148,446 4,187,872 81,504
** Formerly known as Algebris Tail Risk Fund.

ALGEBRIS UCITS FUNDS PLC
Unaudited Statement of Comprehensive Income (continued)
for the period from 1 January 2019 to 30 June 2019
The accompanying notes form an integral part of these financial statements
18
Algebris
Macro Credit
Algebris
Core Italy
Algebris
Quant Arbitrage
Fund Fund Fund**
30 June 30 June 30 June
2019 2019 2019
Notes EUR EUR EUR
Finance costs
Distributions to holders of redeemable
participating shares 6 6,157,069 - -
Interest expense
- Financial liabilities measured at FVTPL 803,367 9,278 -
- Financial liabilities measured at
amortised cost 287,474 11,277 8,349
Total finance costs 7,247,910 20,555 8,349
Profit before tax 61,900,536 4,167,317 73,155
Withholding tax on dividends 8,642 87,943 -
Withholding tax on interest 37,240 - -
Increase in net assets attributable to holders
of redeemable participating shares from
operations 61,854,654 4,079,374 73,155
** Formerly known as Algebris Tail Risk Fund.

ALGEBRIS UCITS FUNDS PLC
Unaudited Statement of Comprehensive Income (continued)
for the period from 1 January 2018 to 30 June 2018
The accompanying notes form an integral part of these financial statements
19
Algebris
Financial
Algebris
Financial
Algebris
Allocation
Algebris
Financial
Total Credit Fund Income Fund Fund** Equity Fund
30 June 30 June 30 June 30 June 30 June
2018 2018 2018 2018 2018
Notes EUR EUR EUR EUR EUR
Investment expense
Interest income
- Financial assets measured at FVTPL 162,187,966 136,996,962 5,910,140 99,028 49,438
- Financial assets measured at amortised cost 272,945 109,477 18,220 3,449 4,060
Dividend income 7,788,456 623,144 5,623,245 85,328 875,568
Other income 5,564,041 3,831,822 889,460 10,793 185,360
Net loss on financial assets and liabilities
at fair value through profit or loss (430,718,419) (310,566,948) (39,639,602) (638,493) (8,450,368)
Net (loss)/gain on foreign exchange (1,634,603) (696,379) (203,245) (2,196) (47,416)
Total investment expense (256,539,614) (169,701,922) (27,401,782) (442,091) (7,383,358)
Operating expenses
Performance fees 5 551,803 350,841 - 359 53,849
Preliminary expense 38,461 - - - -
Investment management fees 5 28,792,663 19,020,885 3,173,188 54,268 380,455
Administration fees 5 1,506,600 950,959 201,018 27,186 72,977
Directors’ fees 5 31,744 5,915 4,846 6,300 4,521
Dividend expense 21,430 - 17,864 449 3,117
Depositary fees 5 898,317 644,906 80,551 11,650 16,073
Audit fees 5 82,438 60,459 3,066 117 986
Transaction cost 3,437,575 553,589 328,015 10,854 394,062
Other expenses 2,373,801 1,509,889 118,999 49,745 83,700
Total operating expenses 37,734,832 23,097,443 3,927,547 160,928 1,009,740
Net investment expenses (294,274,446) (192,799,365) (31,329,329) (603,019) (8,393,098)
** Formerly known as Algebris Asset Allocation Fund.

ALGEBRIS UCITS FUNDS PLC
Unaudited Statement of Comprehensive Income (continued)
for the period from 1 January 2018 to 30 June 2018
The accompanying notes form an integral part of these financial statements
20
Algebris
Financial
Algebris
Financial
Algebris
Allocation
Algebris
Financial
Total Credit Fund Income Fund Fund** Equity Fund
30 June 30 June 30 June 30 June 30 June
2018 2018 2018 2018 2018
Notes EUR EUR EUR EUR EUR
Finance costs
Distributions to holders of redeemable
participating shares 6 55,692,365 46,198,148 2,812,977 - 90,720
Interest expense
- Financial liabilities measured at FVTPL 786 553 35 - -
- Financial liabilities measured at amortised
cost 3,754,121 1,473,277 274,380 11,075 41,506
Total finance costs 59,447,272 47,671,978 3,087,392 11,075 132,226
Loss before tax (353,721,718) (240,471,343) (34,416,721) (614,094) (8,525,324)
Withholding tax on dividends 1,500,912 186,943 977,358 18,483 172,319
Withholding tax on interest 824,174 715,322 91,891 - -
Decrease in net assets attributable to holders
of redeemable participating shares from
operations (356,046,804) (241,373,608) (35,485,970) (632,577) (8,697,643)
** Formerly known as Algebris Asset Allocation Fund.

ALGEBRIS UCITS FUNDS PLC
Unaudited Statement of Comprehensive Income (continued)
for the period from 1 January 2018 to 30 June 2018
The accompanying notes form an integral part of these financial statements
21
Algebris
Macro Credit
Algebris
Core Italy
Algebris
Quant Arbitrage
Fund Fund Fund**
30 June 30 June 30 June
2018 2018 2018
Notes EUR EUR EUR
Investment expense
Interest income
- Financial assets measured at FVTPL 18,757,926 374,472 -
- Financial assets measured at amortised
cost 137,581 158 -
Dividend income 333,046 248,125 -
Other income 599,296 46,299 1,011
Net loss on financial assets and liabilities
at fair value through profit or loss (70,026,072) (1,346,857) (50,079)
Net (loss)/gain on foreign exchange (705,900) 17,312 3,221
Total investment expense (50,904,123) (660,491) (45,847)
Operating expenses
Performance fees 5 146,048 - 706
Preliminary expense - 38,461 -
Investment management fees 5 6,139,065 24,261 541
Administration fees 5 241,804 11,611 1,045
Directors’ fees 5 5,322 4,163 677
Dividend expense - - -
Depositary fees 5 136,537 8,089 511
Audit fees 5 17,369 298 143
Transaction cost 2,068,819 79,786 2,450
Other expenses 553,637 52,846 4,985
Total operating expenses 9,308,601 219,515 11,058
Net investment expenses (60,521,685) (880,006) (56,905)
** Formerly known as Algebris Tail Risk Fund.

ALGEBRIS UCITS FUNDS PLC
Unaudited Statement of Comprehensive Income (continued)
for the period from 1 January 2018 to 30 June 2018
The accompanying notes form an integral part of these financial statements
22
Algebris
Macro Credit
Algebris
Core Italy
Algebris
Quant Arbitrage
Fund Fund Fund**
30 June 30 June 30 June
2018 2018 2018
Notes EUR EUR EUR
Finance costs
Distributions to holders of redeemable
participating shares 6 6,590,520 - -
Interest expense
- Financial liabilities measured at FVTPL - 198 -
- Financial liabilities measured at amortised
cost 1,948,135 5,748 -
Total finance costs 8,538,655 5,946 -
Loss before tax (68,751,379) (885,952) (56,905)
Withholding tax on dividends 88,218 57,591 -
Withholding tax on interest 11,355 5,606 -
Decrease in net assets attributable to holders
of redeemable participating shares from
operations (68,850,952) (949,149) (56,905)
** Formerly known as Algebris Tail Risk Fund.

ALGEBRIS UCITS FUNDS PLC
Unaudited Statement of Changes in Net Assets Attributable to Holders of Redeemable Participating Shares
for the period from 1 January 2019 to 30 June 2019
The accompanying notes form an integral part of these financial statements
23
Algebris Algebris Algebris Algebris
Financial Financial Allocation Financial
Total Credit Fund Income Fund Fund** Equity Fund
30 June 30 June 30 June 30 June 30 June
2019 2019 2019 2019 2019
EUR EUR EUR EUR EUR
Net assets attributable to holders of redeemable
participating shares at beginning of financial period 5,640,298,822 4,323,313,890 472,310,644 12,134,254 80,288,782
Increase in net assets attributable to holders
of redeemable participating shares from operations 471,857,999 338,624,080 57,274,546 660,202 9,546,046
Proceeds from redeemable participating shares issued*
issued
1,036,631,194 859,764,382 137,302,230 942,775 13,167,639
Payment on redemption of redeemable participating shares
issued (1,414,651,393) (1,022,089,666) (176,792,363) (3,163,741) (19,811,929)
Net assets attributable to holders of redeemable
participating shares at end of financial period 5,734,136,622 4,499,612,686 490,095,057 10,573,490 83,190,538
*Share transactions of EUR 6,903,979 due to cross holdings have been eliminated from the Company total.
** Formerly known as Algebris Asset Allocation Fund.

ALGEBRIS UCITS FUNDS PLC
Unaudited Statement of Changes in Net Assets Attributable to Holders of Redeemable Participating Shares (continued)
for the period from 1 January 2019 to 30 June 2019
The accompanying notes form an integral part of these financial statements
24
Algebris Algebris Algebris
Macro Credit Core Italy Quant Arbitrage
Fund Fund Fund**
30 June 30 June 30 June
2019 2019 2019
EUR EUR EUR
Net assets attributable to holders of redeemable
participating shares at beginning of financial period 704,095,328 35,995,510 12,160,414
Increase in net assets attributable to holders
of redeemable participating shares from operations 61,854,654 4,079,374 73,155
Proceeds from redeemable participating shares issued
issued
20,500,332 4,736,359 7,121,456
Payment on redemption of redeemable participating shares
issued (188,059,751) (2,650,818) (2,083,125)
Net assets attributable to holders of redeemable
participating shares at end of financial period 598,390,563 42,160,425 17,271,900
** Formerly known as Algebris Tail Risk Fund.

ALGEBRIS UCITS FUNDS PLC
Unaudited Statement of Changes in Net Assets Attributable to Holders of Redeemable Participating Shares (continued)
for the period from 1 January 2018 to 30 June 2018
The accompanying notes form an integral part of these financial statements
25
Algebris Algebris Algebris Algebris
Financial Financial Allocation Financial
Total Credit Fund Income Fund Fund** Equity Fund
30 June 30 June 30 June 30 June 30 June
2018 2018 2018 2018 2018
EUR EUR EUR EUR EUR
Net assets attributable to holders of redeemable
participating shares at beginning of financial period 5,833,557,561 4,710,036,848 220,919,587 9,474,984 70,484,955
Decrease in net assets attributable to holders
of redeemable participating shares from operations (356,046,804) (241,373,608) (35,485,970) (632,577) (8,697,643)
Proceeds from redeemable participating shares issued
issued
2,632,612,566 1,638,955,831 517,152,311 6,255,199 46,521,294
Payment on redemption of redeemable participating shares
issued (1,410,111,068) (1,116,458,433) (110,443,107) (743,890) (9,034,158)
Net assets attributable to holders of redeemable
participating shares at end of financial period 6,700,012,255 4,991,160,638 592,142,821 14,353,716 99,274,448
** Formerly known as Algebris Asset Allocation Fund.

ALGEBRIS UCITS FUNDS PLC
Unaudited Statement of Changes in Net Assets Attributable to Holders of Redeemable Participating Shares (continued)
for the period from 1 January 2018 to 30 June 2018
The accompanying notes form an integral part of these financial statements
26
Algebris Algebris Algebris
Macro Credit Core Italy Quant Arbitrage
Fund Fund Fund**
30 June 30 June 30 June
2018 2018 2018
EUR EUR EUR
Net assets attributable to holders of redeemable
participating shares at beginning of financial period 795,280,000 27,361,187 -
Decrease in net assets attributable to holders
of redeemable participating shares from operations (68,850,952) (949,149) (56,905)
Proceeds from redeemable participating shares issued
issued
386,942,792 11,429,411 25,355,728
Payment on redemption of redeemable participating shares
issued (173,431,480) - -
Net assets attributable to holders of redeemable
participating shares at end of financial period 939,940,360 37,841,449 25,298,823
** Formerly known as Algebris Tail Risk Fund.
ALGEBRIS UCITS FUNDS PLC
Unaudited Statement of Cash Flows
for the period from 1 January 2019 to 30 June 2019
The accompanying notes form an integral part of these financial statements
27
Algebris Algebris Algebris Algebris
Financial Financial Allocation Financial Total Credit Fund Income Fund Fund** Equity Fund 30 June 30 June 30 June 30 June 30 June 2019 2019 2019 2019 2019 EUR EUR EUR EUR EUR
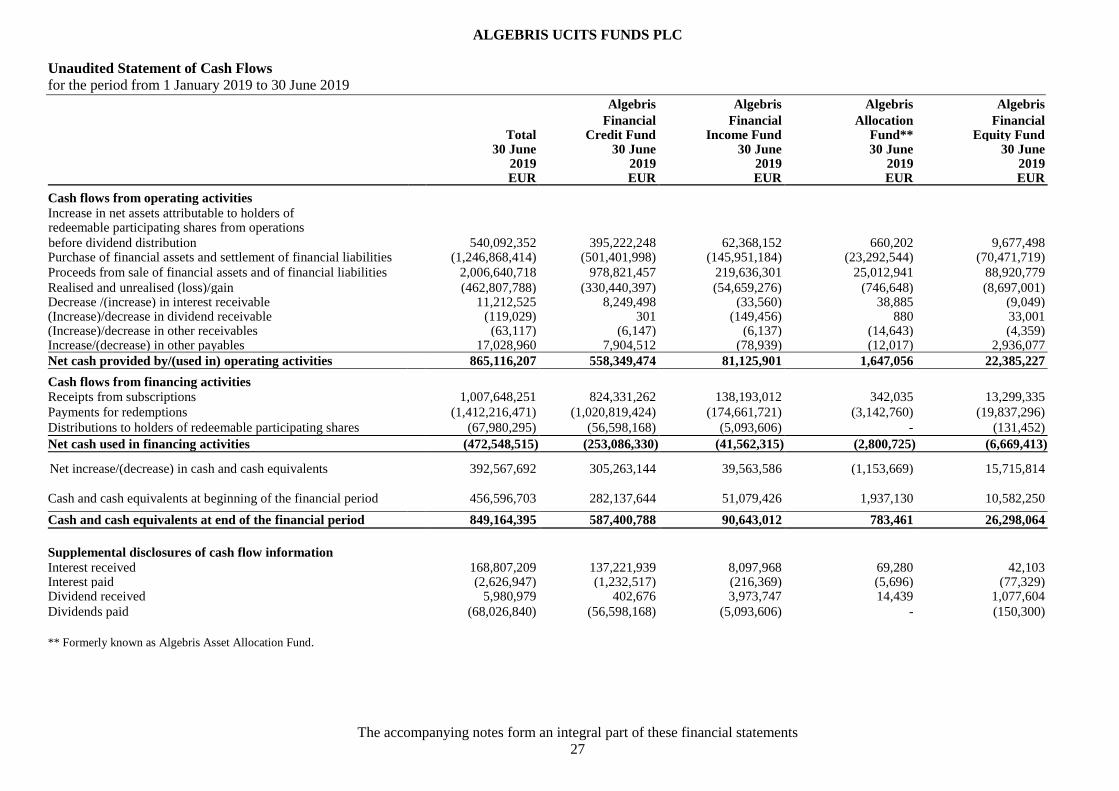
Cash flows from operating activities
Increase in net assets attributable to holders of redeemable participating shares from operations
before dividend distribution 540,092,352 395,222,248 62,368,152 660,202 9,677,498 Purchase of financial assets and settlement of financial liabilities (1,246,868,414) (501,401,998) (145,951,184) (23,292,544) (70,471,719)
Proceeds from sale of financial assets and of financial liabilities 2,006,640,718 978,821,457 219,636,301 25,012,941 88,920,779
Realised and unrealised (loss)/gain
(462,807,788) (330,440,397) (54,659,276) (746,648) (8,697,001) Decrease /(increase) in interest receivable 11,212,525 8,249,498 (33,560) 38,885 (9,049) (Increase)/decrease in dividend receivable (119,029) 301 (149,456) 880 33,001 (Increase)/decrease in other receivables (63,117) (6,147) (6,137) (14,643) (4,359) Increase/(decrease) in other payables 17,028,960 7,904,512 (78,939) (12,017) 2,936,077
Net cash provided by/(used in) operating activities 865,116,207 558,349,474 81,125,901 1,647,056 22,385,227
Cash flows from financing activities
Receipts from subscriptions 1,007,648,251 824,331,262 138,193,012 342,035 13,299,335
Payments for redemptions (1,412,216,471) (1,020,819,424) (174,661,721) (3,142,760) (19,837,296)
Distributions to holders of redeemable participating shares (67,980,295) (56,598,168) (5,093,606) - (131,452)
Net cash used in financing activities
(472,548,515) (253,086,330) (41,562,315) (2,800,725) (6,669,413)
Net increase/(decrease) in cash and cash equivalents 392,567,692 305,263,144 39,563,586 (1,153,669) 15,715,814
Cash and cash equivalents at beginning of the financial period 456,596,703 282,137,644 51,079,426 1,937,130 10,582,250
Cash and cash equivalents at end of the financial period 849,164,395 587,400,788 90,643,012 783,461 26,298,064
Supplemental disclosures of cash flow information
Interest received 168,807,209 137,221,939 8,097,968 69,280 42,103 Interest paid (2,626,947) (1,232,517) (216,369) (5,696) (77,329) Dividend received 5,980,979 402,676 3,973,747 14,439 1,077,604
Dividends paid (68,026,840) (56,598,168) (5,093,606) - (150,300)
** Formerly known as Algebris Asset Allocation Fund.

ALGEBRIS UCITS FUNDS PLC
Unaudited Statement of Cash Flows (continued)
for the period from 1 January 2019 to 30 June 2019
The accompanying notes form an integral part of these financial statements
28
Algebris Algebris Algebris
Macro Credit Core Italy Quant Arbitrage Fund Fund Fund** 30 June 30 June 30 June 2019 2019 2019 EUR EUR EUR
Cash flows from operating activities
Decrease in net assets attributable to holders of redeemable participating shares from operations
before dividend distribution 68,011,723 4,079,374 73,155 Purchase of financial assets and settlement of financial liabilities (449,656,796) (34,268,076) (21,826,097)
Proceeds from sale of financial assets and of financial liabilities 645,386,717 31,906,927 16,955,596
Realised and unrealised (loss)/gain
(64,816,431) (3,374,506) (73,529) Decrease /(increase) in interest receivable 2,961,806 115,958 (111,013) (Increase)/decrease in dividend receivable - - (3,755) (Increase)/decrease in other receivables (2,681) (4,406) (24,744) Increase/(decrease) in other payables 5,791,850 431,408 56,069
Net cash (used in)/provided by operating activities 207,676,188 (1,113,321) (4,954,318)
Cash flows from financing activities
Receipts from subscriptions 19,595,461 4,765,690 7,121,456
Payments for redemptions (189,370,633) (2,301,512) (2,083,125)
Distributions to holders of redeemable participating shares (6,157,069) - -
Net cash used in/provided by financing activities
(175,932,241) 2,464,178 5,038,331 Net increase in cash and cash equivalents 31,743,947 1,350,857 84,013
Cash and cash equivalents at beginning of the financial period 106,258,158 794,750 3,807,345
Cash and cash equivalents at end of the financial period 138,002,105 2,145,607 3,891,358
Supplemental disclosures of cash flow information
Interest received 22,854,953 520,966 - Interest paid (1,066,347) (20,325) (8,364) Dividend received - 512,513 -
Dividends paid (6,157,069) (27,697) -
** Formerly known as Algebris Tail Risk Fund.

ALGEBRIS UCITS FUNDS PLC
Unaudited Statement of Cash Flows (continued)
for the period from 1 January 2018 to 30 June 2018
The accompanying notes form an integral part of these financial statements
29
Algebris Algebris Algebris Algebris
Financial Financial Allocation Financial Total Credit Fund Income Fund Fund** Equity Fund 30 June 30 June 30 June 30 June 30 June 2018 2018 2018 2018 2018 EUR EUR EUR EUR EUR
Cash flows from operating activities
Decrease in net assets attributable to holders of redeemable participating shares from operations
before dividend distribution (300,354,439) (195,175,460) (32,672,993) (632,577) (8,606,923) Purchase of financial assets and settlement of financial liabilities (3,874,723,543) (1,470,320,449) (630,332,540) (12,034,178) (204,725,449)
Proceeds from sale of financial assets and of financial liabilities 2,593,961,260 842,033,140 215,353,232 7,248,960 169,455,973
Realised and unrealised gain
366,656,683 243,488,712 43,932,797 519,740 7,578,170 (Increase)/decrease in interest receivable (7,029,745) (5,486,163) (1,639,933) (6,503) 837 (Increase)/decrease in dividend receivable (656,917) 15,544 (446,212) (14,916) (210,132) Decrease/(increase) in other receivables 305,648 (24,905) 127,167 50,701 138,853 Increase in other payables 39,625,621 36,269,316 4,625,472 (190,035) 3,192,640
Net cash (used in)/provided by operating activities (1,182,215,432) (549,200,265) (401,053,010) (5,058,808) (33,176,031)
Cash flows from financing activities
Receipts from subscriptions 2,670,043,737 1,647,414,896 518,795,513 6,268,971 50,850,337
Payments for redemptions (1,411,152,256) (1,118,054,767) (108,656,474) (741,947) (8,337,697)
Distributions to holders of redeemable participating shares (55,692,365) (46,198,148) (2,812,977) - (90,720)
Net cash provided by financing activities
1,203,199,116 483,161,981 407,326,062 5,527,024 42,421,920
Net increase/(decrease) in cash and cash equivalents 20,983,684 (66,038,284) 6,273,052 468,216 9,245,889
Cash and cash equivalents at beginning of the financial period 882,715,557 649,437,631 36,398,899 1,378,897 11,384,800
Cash and cash equivalents at end of the financial period 903,699,241 583,399,347 42,671,951 1,847,113 20,630,689
Supplemental disclosures of cash flow information
Interest received 155,432,555 131,620,276 4,288,427 95,974 54,335 Interest paid (3,398,900) (1,473,830) (274,415) (11,075) (41,519)
Dividend received 7,131,539 638,688 5,177,033 70,412 665,436
Dividends paid (55,713,795) (46,198,148) (2,830,841) (449) (93,837)
** Formerly known as Algebris Asset Allocation Fund.

ALGEBRIS UCITS FUNDS PLC
Unaudited Statement of Cash Flows (continued)
for the period from 1 January 2018 to 30 June 2018
The accompanying notes form an integral part of these financial statements
30
Algebris Algebris Algebris
Macro Credit Core Italy Quant Arbitrage Fund Fund Fund** 30 June 30 June 30 June 2018 2018 2018 EUR EUR EUR
Cash flows from operating activities
Decrease in net assets attributable to holders of redeemable participating shares from operations
before dividend distribution (62,260,432) (949,149) (56,905) Purchase of financial assets and settlement of financial liabilities (1,506,142,757) (48,723,085) (2,445,085)
Proceeds from sale of financial assets and of financial liabilities 1,319,820,695 37,143,201 2,906,059
Realised and unrealised gain
69,730,341 1,377,453 29,470 (Increase)/decrease in interest receivable 203,561 (100,155) (1,389) (Increase)/decrease in dividend receivable (1,201) - - Decrease/(increase) in other receivables 4,401 11,081 (1,650) Increase in other payables (4,300,491) 7,360 21,359
Net cash (used in)/provided by operating activities (182,945,883) (11,233,294) 451,859
Cash flows from financing activities
Receipts from subscriptions 411,269,185 11,098,392 24,346,443
Payments for redemptions (175,361,371) - -
Distributions to holders of redeemable participating shares (6,590,520) - -
Net cash provided by financing activities
229,317,294 11,098,392 24,346,443 Net increase/(decrease) in cash and cash equivalents 46,371,411 (134,902) 24,798,302
Cash and cash equivalents at beginning of the financial period 182,398,811 1,716,519 -
Cash and cash equivalents at end of the financial period 228,770,222 1,581,617 24,798,302
Supplemental disclosures of cash flow information
Interest received 19,099,068 274,475 - Interest paid (1,592,115) (5,946) - Dividend received 331,845 248,125 -
Dividends paid (6,590,520) - -
** Formerly known as Algebris Tail Risk Fund.

ALGEBRIS UCITS FUNDS PLC
Notes to the Unaudited Financial Statements
for the period from 1 January 2019 to 30 June 2019
31
1. Principal accounting policies
The principal accounting policies adopted by the Company in the preparation of these financial statements are set out
below.
(a) Basis of preparation
The condensed financial statements of the Company have been prepared in accordance with IAS 34, Interim Financial
Reporting, Irish Statute comprising the Companies Acts 2014 (as amended), and the European Communities (Undertakings
for Collective Investment in Transferable Securities) Regulations, 2011, as amended (the “UCITS Regulations”).
These condensed interim financial statements do not contain all of the information and disclosures required in the full annual
financial statements and should be read in conjunction with the financial statements of the Company for the financial year
ended 31 December 2018, which have been prepared in accordance with International Financial Reporting Standards
(“IFRS”).
The accounting policies and methods of computation applied by the Company in these condensed financial statements are the
same as those applied by the Company in its annual financial statements as at and for the year ended 31 December 2018, with
the exception of IFRIC 23 – Uncertainty over Income Tax Treatments which is applicable from 1 January 2019.
(b) Financial assets and liabilities at fair value through profit or loss
Derivative financial instruments
Forward foreign exchange contracts A forward foreign currency contract involves an obligation to purchase or sell a specific currency at a future date, at a price
set at the time the contract is made. Forward foreign currency contracts are valued by reference to the forward price at which
a new forward foreign currency contract of the same size and maturity could be undertaken at the valuation date. The
unrealised gain or loss on open forward foreign currency contracts is calculated as the difference between the contract rate
and the forward price and is recognised in the Statement of Financial Position and the Statement of Comprehensive Income.
Realised and change in unrealised gains or losses on forward contracts are recognised in the Statement of Comprehensive
Income. Where a forward foreign currency contract is purchased to hedge the currency risk of a specific class which is issued
in a currency other than the measurement currency of the Company, all gains and losses on that forward foreign currency
contract are allocated to that class.
Contracts for difference Contracts for difference are agreements between the Company and third parties, which allow the Company to acquire an
exposure to the price movement of specific securities without actually purchasing the securities. The changes in contract
values are recorded as unrealised gains or losses and the Company recognises a realised gain or loss when the contract is
closed. Realised and unrealised gains and losses on contracts for difference are recognised in the Statement of Comprehensive
Income. At each valuation point the difference in price between the contract price of the contracts for difference and the
market price of the underlying equity is recorded as the fair value (unrealised gain or loss) of the contracts for difference.
When a contract for difference is closed the difference between the contract price of the contract for difference and the market
price is recorded as a realised fair value gain or loss in the Statement of Comprehensive Income.
Futures Futures are valued at fair value based on the settlement price on the relevant valuation date. Futures are contracts for delayed delivery in which the seller agrees to make delivery at a specific future date of a specific
security, at a specified price or yield. Gains and losses on futures are recorded by the Sub-Funds based on market fluctuations
and are recorded as realised or unrealised gains/(losses) or other income dependent upon settlement terms of the contracts
held.

ALGEBRIS UCITS FUNDS PLC
Notes to the Unaudited Financial Statements (continued)
for the period from 1 January 2019 to 30 June 2019
32
1. Principal accounting policies (continued)
(b) Financial assets and liabilities at fair value through profit or loss (continued)
Options Options are valued at fair value based on the closing price on the relevant valuation date provided by the relevant counterparty. The premium on written call options exercised is added to the proceeds from the sale of the underlying security or foreign currency in determining the realised gain or loss. The premium on written put options exercised is subtracted from the cost of the securities or foreign currencies purchased. Premiums received from written options, which expire unexercised, are treated as realised gains. For unsettled positions, unrealised gains or losses are recognised in the Statement of Comprehensive Income. Swaps Generally, a swap contract is an agreement that obligates two parties to exchange a series of cash flows at specified intervals based upon or calculated by reference to changes in specified prices or rates for a specified notional amount of the underlying assets. The payment flows are usually netted against each other, with the difference being paid by one party to the other. Equity swaps are valued based on the underlying security. OTC swaps are valued at fair value by an external vendor Markit. Repurchase agreements A repurchase agreement is when the Company enters into an agreement with a counterparty to lend them a specific investment in exchange for cash as collateral. The Company values repurchase agreements at fair value. Equity Warrants Warrants are recorded as an asset or liability at their fair value on the Statement of Financial Position. Fair value as determined by the Administrator is the quoted market price as provided by electronic feed from one or more reputable price vendors. The change in fair value, if any, is recorded as an unrealised gain or loss in the Statement of Comprehensive Income. Realised gains or losses on warrants are shown in the Statement of Comprehensive Income. On the expiry of a warrant the amount previously recognised in the Statement of Financial Position is recognised in the Statement of Comprehensive Income as a realised gain or loss. Realised and unrealised gains and losses on all derivative contracts are recognised in the Statement of Comprehensive Income. (c) Elimination of cross holdings Algebris Allocation Fund in the Company holds investments in Algebris Financial Income Fund Class M Accumulating, Algebris Financial Credit Fund Class M Accumulating, Algebris Macro Credit Fund Class M Accumulating, Algebris Core Italy Fund Class M Accumulating and Algebris Quant Arbitrage Fund Class M Accumulating within the Company. For the purposes of determining the net assets and results of the Company, these cross holdings are eliminated so that the total amounts only reflect external assets and liabilities of the Company as a whole. This elimination for the purpose of ascertaining the total Company results and net assets does not have any effect on the results and net assets of any individual Sub-Fund.

ALGEBRIS UCITS FUNDS PLC
Notes to the Unaudited Financial Statements (continued)
for the period from 1 January 2019 to 30 June 2019
33
2. Financial assets and liabilities at fair value through profit or loss Algebris Algebris Algebris Algebris
Financial Financial Allocation Financial
Total Credit Fund Income Fund Fund Equity Fund
30 June 2019 30 June 2019 30 June 2019 30 June 2019 30 June 2019
EUR EUR EUR EUR EUR
Financial assets at fair value through profit or loss
Investment funds - - - 7,158,037 -
Transferable securities
- Equity securities* 275,037,402 15,953,826 168,399,946 - 58,424,893
- Fixed income 4,559,788,631 3,839,601,676 248,958,308 2,001,970 5,661,553
- Fixed income pledged as collateral 25,925,765 3,159,844 - - -
Financial derivatives
- Contracts for difference 656,552 - - - 656,552
- Equity warrants 258,629 - 47,969 - -
- Forward foreign exchange contracts 29,363,737 24,030,007 2,662,339 502 423,016
- Futures 10,275 - - - -
- Options 6,383,040 3,356,699 869,541 2,598 483,838
- Other swaps 22,750,166 - - - -
Total financial assets at fair value through profit or loss 4,920,174,197 3,886,102,052 420,938,103 9,163,107 65,649,852
Financial liabilities at fair value through profit or loss
Financial derivatives
- Contracts for difference (28,099,340) - (18,892,347) - (6,450,370)
- Forward foreign exchange contracts (12,374,755) (9,146,194) (1,742,865) (6) (486,780)
- Futures (9,381,615) (7,797,737) (956,220) - (250,987)
- Options (908,842) - (7,810) - (29,299)
- Other swaps (14,202,165) - - - -
Repurchase Agreements (27,708,748) (3,052,196) - - -
Total financial liabilities at fair value through profit or loss (92,675,465) (19,996,127) (21,599,242) (6) (7,217,436)
Net gain on financial assets and liabilities at fair value through
profit or loss 416,127,473 293,629,880 54,561,549 700,628 9,637,944

ALGEBRIS UCITS FUNDS PLC
Notes to the Unaudited Financial Statements (continued)
for the period from 1 January 2019 to 30 June 2019
34
2. Financial assets and liabilities at fair value through profit or loss (continued) Algebris Algebris Algebris
Macro Credit Core Italy Quant Arbitrage
Fund Fund Fund
30 June 2019 30 June 2019 30 June 2019
EUR EUR EUR
Financial assets at fair value through profit or loss
Investment funds - - -
Transferable securities
- Equity securities* 1,717,318 30,541,419 -
- Fixed income 440,296,755 10,049,608 13,218,761
- Fixed income pledged as collateral 22,765,921 - -
Financial derivatives
- Contracts for difference - - -
- Equity warrants - 210,660 -
- Forward foreign exchange contracts 2,239,015 8,858 -
- Futures 10,275 - -
- Options 1,652,076 18,288 -
- Other swaps 22,712,085 - 38,081
Total financial assets at fair value through profit or loss 491,393,445 40,828,833 13,256,842
Financial liabilities at fair value through profit or loss
Financial derivatives
- Contracts for difference (2,756,623) - -
- Forward foreign exchange contracts (997,376) (530) (1,004)
- Futures (163,511) (213,160) -
- Options (871,733) - -
- Other swaps (14,115,328) - (86,837)
Repurchase Agreements (24,656,552) - -
Total financial liabilities at fair value through profit or loss (43,561,123) (213,690) (87,841)
Net gain on financial assets and liabilities at fair value
through profit or loss 54,325,579 3,470,080 55,871
*The equity securities per the above table relate to preferred stock on all securities held by the Algebris Financial Credit Fund, and certain securities held by the
Algebris Financial Income Fund, Algebris Financial Equity Fund, Algebris Macro Credit Fund and Algebris Core Italy Fund.

ALGEBRIS UCITS FUNDS PLC
Notes to the Unaudited Financial Statements (continued)
for the period from 1 January 2019 to 30 June 2019
35
2. Financial assets and liabilities at fair value through profit or loss (continued)
Algebris Algebris Algebris Algebris
Financial Financial Allocation Financial
Total Credit Fund Income Fund Fund Equity Fund
31 December 31 December 31 December 31 December 31 December
2018 2018 2018 2018 2018
EUR EUR EUR EUR EUR
Financial assets at fair value through profit or loss
Transferable securities
- Equity securities* 323,927,534 15,814,045 209,192,046 4,727,243 73,093,219
- Fixed income 4,839,987,087 3,985,337,915 241,235,147 6,010,109 -
- Fixed income pledged as collateral 42,172,538 4,924,688 - - -
Financial derivatives
- Contracts for difference 4,124,526 - 213,742 108,173 3,802,611
- Equity warrants 61,290 - 10,803 500 -
- Forward foreign exchange contracts 26,386,513 21,335,981 2,682,984 51,713 704,508
- Futures 1,502,187 161,565 - 58,386 76,700
- Options 8,652,656 - 1,559,148 22,634 465,137
- Other swaps 28,647,714 - - - -
Total financial assets at fair value through profit or loss 5,275,462,045 4,027,574,194 454,893,870 10,978,758 78,142,175
Financial liabilities at fair value through profit or loss
Financial derivatives
- Contracts for difference (43,468,307) - (33,908,294) (814,484) (8,745,529)
- Forward foreign exchange contracts (10,111,528) (7,368,134) (2,040,782) (7,670) (435,470)
- Futures (2,188,042) (1,895,520) (279,780) (12,742) -
- Options (4,765,315) - (299,969) (7,012) (68,935)
- Other swaps (20,733,766) - - - -
Repurchase Agreements (48,066,619) (5,215,764) - - -
Total financial liabilities at fair value through profit or loss (129,333,577) (14,479,418) (36,528,825) (841,908) (9,249,934)
Net loss on financial assets and liabilities at fair value through
profit or loss (837,770,899) (536,867,166) (113,605,690) (2,178,033) (28,486,067)

ALGEBRIS UCITS FUNDS PLC
Notes to the Unaudited Financial Statements (continued)
for the period from 1 January 2019 to 30 June 2019
36
2. Financial assets and liabilities at fair value through profit or loss (continued) Algebras Algebris Algebris
Macro Credit Core Italy Quant Arbitrage
Fund Fund Fund
31 December 31 December 31 December 2018 2018 2018
EUR EUR EUR
Financial assets at fair value through profit or loss
Transferable securities
- Equity securities* 2,087,032 19,013,949 -
- Fixed income 583,077,775 16,049,849 8,276,292
- Fixed income pledged as collateral 37,215,337 32,513 -
Financial derivatives - - -
- Contracts for difference - - -
- Equity warrants - 49,987 -
- Forward foreign exchange contracts 1,517,135 8,589 85,603
- Futures 1,205,536 - -
- Options 6,605,737 - -
- Other swaps 28,647,714 - -
Total financial assets at fair value through profit or loss 660,356,266 35,154,887 8,361,895
Financial liabilities at fair value through profit or loss
Financial derivatives
- Contracts for difference - - -
- Forward foreign exchange contracts (256,894) (279) (2,299)
- Futures - - -
- Options (4,389,399) - -
- Other swaps (20,733,766) - -
- Repurchase Agreements (42,579,231) (271,624) -
Total financial liabilities at fair value through profit or loss (67,959,290) (271,903) (2,299)
Net loss on financial assets and liabilities at fair value
through profit or loss (150,536,949) (5,888,962) (208,032)
*The equity securities per the above table relate to preferred stock on all securities held by the Algebris Financial Credit Fund, and certain securities held by the
Algebris Financial Income Fund, Algebris Allocation Fund and Algebris Financial Equity Fund.

ALGEBRIS UCITS FUNDS PLC
Notes to the Unaudited Financial Statements (continued)
for the period from 1 January 2019 to 30 June 2019
37
3. Cash and cash equivalents
The break-up of cash and cash equivalents with different custodians is detailed below:
Algebris Financial Credit Fund
Foreign
currency
equivalent
HSBC Bank Plc
EUR
BNP Paribas
EUR
Cash
- held in local currency 394,247,306 172,556,107
- held in foreign currency (Cost: Euro 4,283,486) GBP 3,836,307 4,283,369 -
- held in foreign currency (Cost: Euro 5,982,050) USD 6,802,150 5,982,542 -
- held in foreign currency (Cost: Euro 0) (JPY 45) - -
- held in foreign currency (Cost: Euro 355,512) CHF 394,768 355,666 -
- held in foreign currency (Cost: Euro 1,137) SGD 1,751 1,138 -
Total 404,870,021 172,556,107
JP Morgan
EUR
Total
30 June 2019
EUR
Cash
- held in local currency 9,974,660 576,778,073
- held in foreign currency (Cost: Euro 4,283,486) - 4,283,369
- held in foreign currency (Cost: Euro 5,982,050) - 5,982,542
- held in foreign currency (Cost: Euro 0) - -
- held in foreign currency (Cost: Euro 355,512) - 355,666
- held in foreign currency (Cost: Euro 1,137) - 1,138
Total 9,974,660 587,400,788
Algebris Financial Income Fund
Foreign
currency
equivalent
HSBC Bank Plc
EUR
BNP Paribas
EUR
Cash
- held in local currency 70,445,081 19,957,461
- held in foreign currency (Cost: Euro 14,370) GBP 12,798 14,289 -
- held in foreign currency (Cost: Euro (98,248)) (USD 111,610) 145,957 -
- held in foreign currency (Cost: Euro 80,973) JPY 9,933,482 80,973 -
- held in foreign currency (Cost: Euro 13) AUD 20 12 -
- held in foreign currency (Cost: Euro 42) CAD 64 43 -
- held in foreign currency (Cost: Euro 0) DKK 1 - -
- held in foreign currency (Cost: Euro 7) HKD 57 6 -
- held in foreign currency (Cost: Euro 3) NOK 29 3 -
- held in foreign currency (Cost: Euro 10) PLN 43 10 -
- held in foreign currency (Cost: Euro (78)) (SEK 801) (76) -
- held in foreign currency (Cost: Euro (665)) (SGD 1,017) (661) -
Total 70,685,637 19,957,461

ALGEBRIS UCITS FUNDS PLC
Notes to the Unaudited Financial Statements (continued)
for the period from 1 January 2019 to 30 June 2019
38
3. Cash and cash equivalents (continued)
Algebris Financial Income Fund (continued)
Merrill Lynch
EUR
Total
30 June 2019
EUR
Cash
- held in local currency 244,033 90,646,575
- held in foreign currency (Cost: Euro 14,370) - 14,289
- held in foreign currency (Cost: Euro (98,248)) (244,119) (98,162)
- held in foreign currency (Cost: Euro 80,973) - 80,973
- held in foreign currency (Cost: Euro 13) - 12
- held in foreign currency (Cost: Euro 42) - 43
- held in foreign currency (Cost: Euro 0) - -
- held in foreign currency (Cost: Euro 7) - 6
- held in foreign currency (Cost: Euro 3) - 3
- held in foreign currency (Cost: Euro 10) - 10
- held in foreign currency (Cost: Euro (78)) - (76)
- held in foreign currency (Cost: Euro (665)) - (661)
Total (86) 90,643,012
Algebris Allocation Fund
Foreign
currency
equivalent
HSBC Bank
Plc
EUR
Total
30 June 2019
EUR
Cash
- held in local currency 783,478 783,478
- held in foreign currency (Cost: Euro 5) USD 6 5 5
- held in foreign currency (Cost: Euro (5)) (JPY 625) (5) (5)
- held in foreign currency (Cost: Euro (2)) (AUD 2) (2) (2)
- held in foreign currency (Cost: Euro 57) CAD 87 59 59
- held in foreign currency (Cost: Euro (3)) (DKK 22) (3) (3)
- held in foreign currency (Cost: Euro 7) HKD 58 7 7
- held in foreign currency (Cost: Euro (1)) (MXN 14) (1) (1)
- held in foreign currency (Cost: Euro 8) NOK 79 8 8
- held in foreign currency (Cost: Euro (10)) (SGD 15) (10) (10)
- held in foreign currency (Cost: Euro (76)) (SEK 798) (76) (76)
- held in foreign currency (Cost: Euro 0) ZAR 7 1 1
Total 783,461 783,461

ALGEBRIS UCITS FUNDS PLC
Notes to the Unaudited Financial Statements (continued)
for the period from 1 January 2019 to 30 June 2019
39
3. Cash and cash equivalents (continued)
Algebris Financial Equity Fund
Foreign
currency
equivalent
HSBC Bank
Plc
EUR
BNP Paribas
EUR
Cash
- held in local currency 10,621,484 14,029,070
- held in foreign currency (Cost: Euro 20,085) GBP 17,996 20,093 -
- held in foreign currency (Cost: Euro 252,182) USD 286,447 217,278 -
- held in foreign currency (Cost: Euro 37,078) JPY 4,548,644 37,078 -
- held in foreign currency (Cost: Euro 1,166) AUD 1,890 1,167 -
- held in foreign currency (Cost: Euro 868) CAD 1,227 26,239 -
- held in foreign currency (Cost: Euro (1,614)) (CHF 1,792) (1,614) -
- held in foreign currency (Cost: Euro (36)) (DKK 265) (35) -
- held in foreign currency (Cost: Euro (2)) (HKD 22) (3) -
- held in foreign currency (Cost: Euro 0) NOK 1 - -
- held in foreign currency (Cost: Euro (31)) (PLN 138) (33) -
- held in foreign currency (Cost: Euro (567)) (SEK 5,991) (567) -
- held in foreign currency (Cost: Euro (166)) (SGD 254) (165) -
- held in foreign currency (Cost: Euro 0) ZAR 7 - -
Total 10,920,922 14,029,070
Merrill
Lynch
Morgan
Stanley
Total
30 June 2019
EUR EUR EUR
Cash
- held in local currency (39,782) 1,378,615 25,989,387
- held in foreign currency (Cost: Euro 20,085) - - 20,093
- held in foreign currency (Cost: Euro 252,182) 34,655 (1) 251,932
- held in foreign currency (Cost: Euro 37,078) - - 37,078
- held in foreign currency (Cost: Euro 1,166) - - 1,167
- held in foreign currency (Cost: Euro 868) (25,415) - 824
- held in foreign currency (Cost: Euro (1,614)) - - (1,614)
- held in foreign currency (Cost: Euro (36)) - - (35)
- held in foreign currency (Cost: Euro (2)) - - (3)
- held in foreign currency (Cost: Euro 0) - - -
- held in foreign currency (Cost: Euro (31)) - - (33)
- held in foreign currency (Cost: Euro (567)) - - (567)
- held in foreign currency (Cost: Euro (166)) - - (165)
- held in foreign currency (Cost: Euro 0) - - -
Total (30,542) 1,378,614 26,298,064

ALGEBRIS UCITS FUNDS PLC
Notes to the Unaudited Financial Statements (continued)
for the period from 1 January 2019 to 30 June 2019
40
3. Cash and cash equivalents (continued)
Algebris Macro Credit Fund
Foreign
currency
equivalent
HSBC Bank
Plc
EUR
Bank of
America
EUR
Cash
- held in local currency 79,280,103 (4,409,738)
- held in foreign currency (Cost: Euro (968)) (GBP 660) 8,412 (9,156)
- held in foreign currency (Cost: Euro 3,904,983) USD 4,434,583 8,639,962 690,147
- held in foreign currency (Cost: Euro (586)) (JPY 71,099) (579) -
- held in foreign currency (Cost: Euro 372,997) AUD 604,214 (1,577,689) 1,950,687
- held in foreign currency (Cost: Euro (443)) (CAD 661) (444) -
- held in foreign currency (Cost: Euro 23) CNY 185 24 -
- held in foreign currency (Cost: Euro 1) HKD 9 1 -
- held in foreign currency (Cost: Euro (4)) (HUF 1,153) (4) -
- held in foreign currency (Cost: Euro (2,085)) (MXN 46,591) - (2,132)
- held in foreign currency (Cost: Euro (7,070)) (NZD 1,931) (1,051,770) 1,050,628
- held in foreign currency (Cost: Euro (1,883)) (PLN 8,016) (1,889) -
- held in foreign currency (Cost: Euro 70) RUB 5,024 69 -
- held in foreign currency (Cost: Euro 478) SEK 5,115 485 -
- held in foreign currency (Cost: Euro 0) (TRY 1) - -
- held in foreign currency (Cost: Euro (29)) (ZAR 597) (106) 69
Total 85,296,575 (729,495)
Barclays
Bank Plc
EUR
BNP
Paribas
EUR
CITI Bank
EUR
Cash
- held in local currency 2,420,024 27,072,399 929,081
- held in foreign currency (Cost: Euro (968)) - - -
- held in foreign currency (Cost: Euro 3,904,983) - (1) 150,005
- held in foreign currency (Cost: Euro (586)) - - -
- held in foreign currency (Cost: Euro 372,997) - - -
- held in foreign currency (Cost: Euro (443)) - - -
- held in foreign currency (Cost: Euro 23) - - -
- held in foreign currency (Cost: Euro 1) - - -
- held in foreign currency (Cost: Euro (4)) - - -
- held in foreign currency (Cost: Euro (2,085)) - - -
- held in foreign currency (Cost: Euro (7,070)) - - -
- held in foreign currency (Cost: Euro (1,883)) - - -
- held in foreign currency (Cost: Euro 70) - - -
- held in foreign currency (Cost: Euro 478) - - -
- held in foreign currency (Cost: Euro 0) - - -
- held in foreign currency (Cost: Euro (29)) - - -
Total 2,420,024 27,072,398 1,079,086

ALGEBRIS UCITS FUNDS PLC
Notes to the Unaudited Financial Statements (continued)
for the period from 1 January 2019 to 30 June 2019
41
3. Cash and cash equivalents (continued)
Algebris Macro Credit Fund (continued)
Goldman
Sachs JP Morgan
Merrill
Lynch
EUR EUR EUR
Cash
- held in local currency 7,696,647 8,329,063 12,327,663
- held in foreign currency (Cost: Euro (968)) - - 7
- held in foreign currency (Cost: Euro 3,904,983) (6,601,437) - 1,021,573
- held in foreign currency (Cost: Euro (586)) - - -
- held in foreign currency (Cost: Euro 372,997) - - -
- held in foreign currency (Cost: Euro (443)) - - -
- held in foreign currency (Cost: Euro 23) - - -
- held in foreign currency (Cost: Euro 1) - - -
- held in foreign currency (Cost: Euro (4)) - - -
- held in foreign currency (Cost: Euro (2,085)) - - -
- held in foreign currency (Cost: Euro (7,070)) - - -
- held in foreign currency (Cost: Euro (1,883)) - - -
- held in foreign currency (Cost: Euro 70) 1 - -
- held in foreign currency (Cost: Euro 478) - - -
- held in foreign currency (Cost: Euro 0) - - -
- held in foreign currency (Cost: Euro (29)) - - -
Total 1,095,211 8,329,063 13,349,243
Morgan
Stanley
Total
30 June 2019
EUR EUR
Cash
- held in local currency 90,000 133,735,242
- held in foreign currency (Cost: Euro (968)) - (737)
- held in foreign currency (Cost: Euro 3,904,983) - 3,900,249
- held in foreign currency (Cost: Euro (586)) - (579)
- held in foreign currency (Cost: Euro 372,997) - 372,998
- held in foreign currency (Cost: Euro (443)) - (444)
- held in foreign currency (Cost: Euro 23) - 24
- held in foreign currency (Cost: Euro 1) - 1
- held in foreign currency (Cost: Euro (4)) - (4)
- held in foreign currency (Cost: Euro (2,085)) - (2,132)
- held in foreign currency (Cost: Euro (7,070)) - (1,142)
- held in foreign currency (Cost: Euro (1,883)) - (1,889)
- held in foreign currency (Cost: Euro 70) - 70
- held in foreign currency (Cost: Euro 478) - 485
- held in foreign currency (Cost: Euro 0) - -
- held in foreign currency (Cost: Euro (29)) - (37)
Total 90,000 138,002,105

ALGEBRIS UCITS FUNDS PLC
Notes to the Unaudited Financial Statements (continued)
for the period from 1 January 2019 to 30 June 2019
42
3. Cash and cash equivalents (continued)
Algebris Core Italy Fund
Foreign
currency
equivalent
HSBC Bank
Plc
EUR
BNP
Paribas
EUR
Total
30 June 2019
EUR
Cash
- held in local currency 2,146,964 69 2,147,033
- held in foreign currency (Cost: Euro (2,393)) (GBP 2,143) (2,393) - (2,393)
- held in foreign currency (Cost: Euro 972) USD 1,099 967 - 967
Total 2,145,538 69 2,145,607
Algebris Quant Arbitrage Fund
Foreign
currency
equivalent
HSBC Bank
Plc
EUR
BNP
Paribas
EUR
Cash
- held in local currency 2,160,014 597,337
- held in foreign currency (Cost: Euro (1,574)) (GBP 1,412) (2,393) -
- held in foreign currency (Cost: Euro 1,099) USD 1,249 967 -
- held in foreign currency (Cost: Euro 381) CAD 567 (12) -
- held in foreign currency (Cost: Euro 1) (CHF 1) 1 -
- held in foreign currency (Cost: Euro 0) (DKK 1) - -
- held in foreign currency (Cost: Euro 0) MXN 30 1 -
- held in foreign currency (Cost: Euro 0) NOK 1 - -
- held in foreign currency (Cost: Euro 52) RUB 3,939 55 -
- held in foreign currency (Cost: Euro (58)) (SEK 618) (58) -
- held in foreign currency (Cost: Euro (11)) (ZAR 176) (11) -
Total 2,158,564 597,337
Morgan
Stanley
Total
30 June 2019
EUR EUR
Cash
- held in local currency 1,134,118 3,891,469
- held in foreign currency (Cost: Euro (1,574)) 816 (1,577)
- held in foreign currency (Cost: Euro 1,099) 131 1,098
- held in foreign currency (Cost: Euro 381) 393 381
- held in foreign currency (Cost: Euro 1) (1) -
- held in foreign currency (Cost: Euro 0) - -
- held in foreign currency (Cost: Euro 0) - 1
- held in foreign currency (Cost: Euro 0) - -
- held in foreign currency (Cost: Euro 52) - 55
- held in foreign currency (Cost: Euro (58)) - (58)
- held in foreign currency (Cost: Euro (11)) - (11)
Total 1,135,457 3,891,358
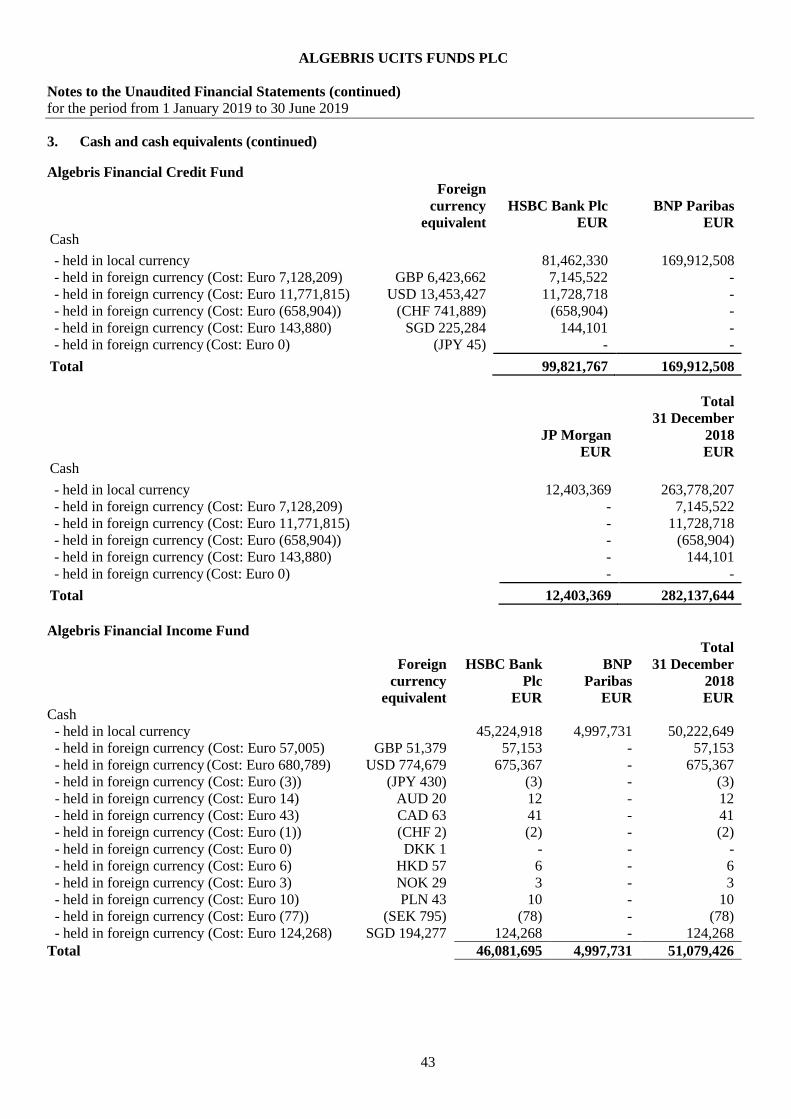
ALGEBRIS UCITS FUNDS PLC
Notes to the Unaudited Financial Statements (continued)
for the period from 1 January 2019 to 30 June 2019
43
3. Cash and cash equivalents (continued)
Algebris Financial Credit Fund
Foreign
currency
equivalent
HSBC Bank Plc
EUR
BNP Paribas
EUR
Cash
- held in local currency 81,462,330 169,912,508
- held in foreign currency (Cost: Euro 7,128,209) GBP 6,423,662 7,145,522 -
- held in foreign currency (Cost: Euro 11,771,815) USD 13,453,427 11,728,718 -
- held in foreign currency (Cost: Euro (658,904)) (CHF 741,889) (658,904) -
- held in foreign currency (Cost: Euro 143,880) SGD 225,284 144,101 -
- held in foreign currency (Cost: Euro 0) (JPY 45) - -
Total 99,821,767 169,912,508
JP Morgan
EUR
Total
31 December
2018
EUR
Cash
- held in local currency 12,403,369 263,778,207
- held in foreign currency (Cost: Euro 7,128,209) - 7,145,522
- held in foreign currency (Cost: Euro 11,771,815) - 11,728,718
- held in foreign currency (Cost: Euro (658,904)) - (658,904)
- held in foreign currency (Cost: Euro 143,880) - 144,101
- held in foreign currency (Cost: Euro 0) - -
Total 12,403,369 282,137,644
Algebris Financial Income Fund
Foreign
currency
equivalent
HSBC Bank
Plc
EUR
BNP
Paribas
EUR
Total
31 December
2018
EUR
Cash
- held in local currency 45,224,918 4,997,731 50,222,649
- held in foreign currency (Cost: Euro 57,005) GBP 51,379 57,153 - 57,153
- held in foreign currency (Cost: Euro 680,789) USD 774,679 675,367 - 675,367
- held in foreign currency (Cost: Euro (3)) (JPY 430) (3) - (3)
- held in foreign currency (Cost: Euro 14) AUD 20 12 - 12
- held in foreign currency (Cost: Euro 43) CAD 63 41 - 41
- held in foreign currency (Cost: Euro (1)) (CHF 2) (2) - (2)
- held in foreign currency (Cost: Euro 0) DKK 1 - - -
- held in foreign currency (Cost: Euro 6) HKD 57 6 - 6
- held in foreign currency (Cost: Euro 3) NOK 29 3 - 3
- held in foreign currency (Cost: Euro 10) PLN 43 10 - 10
- held in foreign currency (Cost: Euro (77)) (SEK 795) (78) - (78)
- held in foreign currency (Cost: Euro 124,268) SGD 194,277 124,268 - 124,268
Total 46,081,695 4,997,731 51,079,426
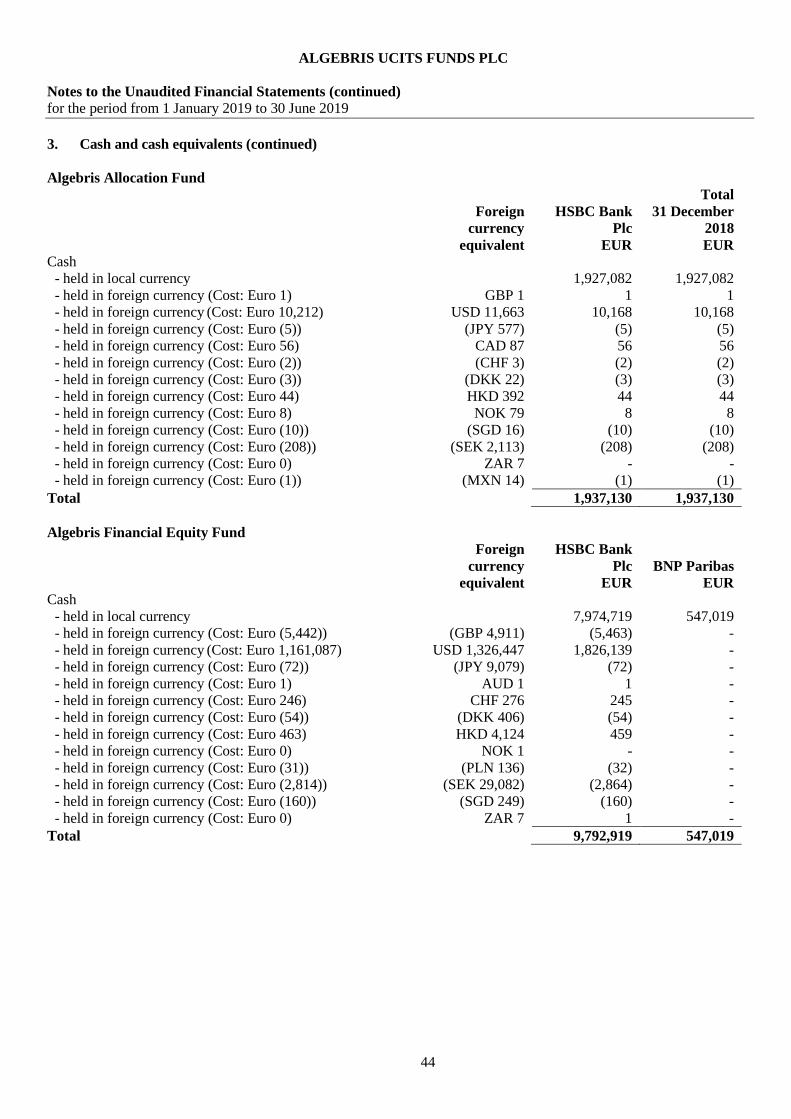
ALGEBRIS UCITS FUNDS PLC
Notes to the Unaudited Financial Statements (continued)
for the period from 1 January 2019 to 30 June 2019
44
3. Cash and cash equivalents (continued)
Algebris Allocation Fund
Foreign
currency
equivalent
HSBC Bank
Plc
EUR
Total
31 December
2018
EUR
Cash
- held in local currency 1,927,082 1,927,082
- held in foreign currency (Cost: Euro 1) GBP 1 1 1
- held in foreign currency (Cost: Euro 10,212) USD 11,663 10,168 10,168
- held in foreign currency (Cost: Euro (5)) (JPY 577) (5) (5)
- held in foreign currency (Cost: Euro 56) CAD 87 56 56
- held in foreign currency (Cost: Euro (2)) (CHF 3) (2) (2)
- held in foreign currency (Cost: Euro (3)) (DKK 22) (3) (3)
- held in foreign currency (Cost: Euro 44) HKD 392 44 44
- held in foreign currency (Cost: Euro 8) NOK 79 8 8
- held in foreign currency (Cost: Euro (10)) (SGD 16) (10) (10)
- held in foreign currency (Cost: Euro (208)) (SEK 2,113) (208) (208)
- held in foreign currency (Cost: Euro 0) ZAR 7 - -
- held in foreign currency (Cost: Euro (1)) (MXN 14) (1) (1)
Total 1,937,130 1,937,130
Algebris Financial Equity Fund
Foreign
currency
equivalent
HSBC Bank
Plc
EUR
BNP Paribas
EUR
Cash
- held in local currency 7,974,719 547,019
- held in foreign currency (Cost: Euro (5,442)) (GBP 4,911) (5,463) -
- held in foreign currency (Cost: Euro 1,161,087) USD 1,326,447 1,826,139 -
- held in foreign currency (Cost: Euro (72)) (JPY 9,079) (72) -
- held in foreign currency (Cost: Euro 1) AUD 1 1 -
- held in foreign currency (Cost: Euro 246) CHF 276 245 -
- held in foreign currency (Cost: Euro (54)) (DKK 406) (54) -
- held in foreign currency (Cost: Euro 463) HKD 4,124 459 -
- held in foreign currency (Cost: Euro 0) NOK 1 - -
- held in foreign currency (Cost: Euro (31)) (PLN 136) (32) -
- held in foreign currency (Cost: Euro (2,814)) (SEK 29,082) (2,864) -
- held in foreign currency (Cost: Euro (160)) (SGD 249) (160) -
- held in foreign currency (Cost: Euro 0) ZAR 7 1 -
Total 9,792,919 547,019
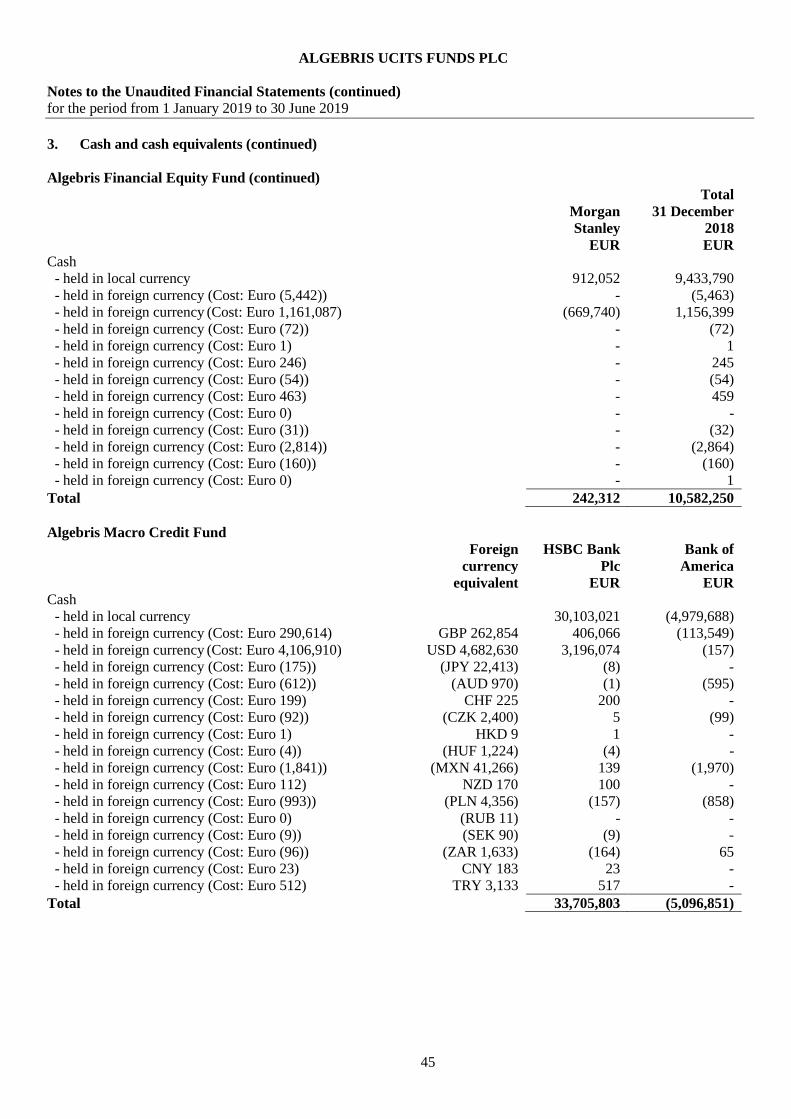
ALGEBRIS UCITS FUNDS PLC
Notes to the Unaudited Financial Statements (continued)
for the period from 1 January 2019 to 30 June 2019
45
3. Cash and cash equivalents (continued)
Algebris Financial Equity Fund (continued)
Morgan
Stanley
Total
31 December
2018
EUR EUR
Cash
- held in local currency 912,052 9,433,790
- held in foreign currency (Cost: Euro (5,442)) - (5,463)
- held in foreign currency (Cost: Euro 1,161,087) (669,740) 1,156,399
- held in foreign currency (Cost: Euro (72)) - (72)
- held in foreign currency (Cost: Euro 1) - 1
- held in foreign currency (Cost: Euro 246) - 245
- held in foreign currency (Cost: Euro (54)) - (54)
- held in foreign currency (Cost: Euro 463) - 459
- held in foreign currency (Cost: Euro 0) - -
- held in foreign currency (Cost: Euro (31)) - (32)
- held in foreign currency (Cost: Euro (2,814)) - (2,864)
- held in foreign currency (Cost: Euro (160)) - (160)
- held in foreign currency (Cost: Euro 0) - 1
Total 242,312 10,582,250
Algebris Macro Credit Fund
Foreign
currency
equivalent
HSBC Bank
Plc
EUR
Bank of
America
EUR
Cash
- held in local currency 30,103,021 (4,979,688)
- held in foreign currency (Cost: Euro 290,614) GBP 262,854 406,066 (113,549)
- held in foreign currency (Cost: Euro 4,106,910) USD 4,682,630 3,196,074 (157)
- held in foreign currency (Cost: Euro (175)) (JPY 22,413) (8) -
- held in foreign currency (Cost: Euro (612)) (AUD 970) (1) (595)
- held in foreign currency (Cost: Euro 199) CHF 225 200 -
- held in foreign currency (Cost: Euro (92)) (CZK 2,400) 5 (99)
- held in foreign currency (Cost: Euro 1) HKD 9 1 -
- held in foreign currency (Cost: Euro (4)) (HUF 1,224) (4) -
- held in foreign currency (Cost: Euro (1,841)) (MXN 41,266) 139 (1,970)
- held in foreign currency (Cost: Euro 112) NZD 170 100 -
- held in foreign currency (Cost: Euro (993)) (PLN 4,356) (157) (858)
- held in foreign currency (Cost: Euro 0) (RUB 11) - -
- held in foreign currency (Cost: Euro (9)) (SEK 90) (9) -
- held in foreign currency (Cost: Euro (96)) (ZAR 1,633) (164) 65
- held in foreign currency (Cost: Euro 23) CNY 183 23 -
- held in foreign currency (Cost: Euro 512) TRY 3,133 517 -
Total 33,705,803 (5,096,851)

ALGEBRIS UCITS FUNDS PLC
Notes to the Unaudited Financial Statements (continued)
for the period from 1 January 2019 to 30 June 2019
46
3. Cash and cash equivalents (continued)
Algebris Macro Credit Fund (continued)
BNP
Paribas CITI Bank
Goldman
Sachs
EUR EUR EUR
Cash
- held in local currency 57,618,012 2,164,576 1,118,331
- held in foreign currency (Cost: Euro 290,614) - - -
- held in foreign currency (Cost: Euro 4,106,910) (1) - (1)
- held in foreign currency (Cost: Euro (175)) - - -
- held in foreign currency (Cost: Euro (612)) - - -
- held in foreign currency (Cost: Euro 199) - - -
- held in foreign currency (Cost: Euro (92)) - - -
- held in foreign currency (Cost: Euro 1) - - -
- held in foreign currency (Cost: Euro (4)) - - -
- held in foreign currency (Cost: Euro (1,841)) - - -
- held in foreign currency (Cost: Euro 112) - - -
- held in foreign currency (Cost: Euro (993)) - - -
- held in foreign currency (Cost: Euro 0) - - -
- held in foreign currency (Cost: Euro (9)) - - -
- held in foreign currency (Cost: Euro (96)) - - -
- held in foreign currency (Cost: Euro 23) - - -
- held in foreign currency (Cost: Euro 512) - - -
Total 57,618,011 2,164,576 1,118,330
JP Morgan
Merrill
Lynch
Total
31 December
2018
EUR EUR EUR
Cash
- held in local currency 19,297,367 (3,435,192) 101,886,427
- held in foreign currency (Cost: Euro 290,614) - (124) 292,393
- held in foreign currency (Cost: Euro 4,106,910) 1 886,408 4,082,324
- held in foreign currency (Cost: Euro (175)) - (171) (179)
- held in foreign currency (Cost: Euro (612)) - - (596)
- held in foreign currency (Cost: Euro 199) - - 200
- held in foreign currency (Cost: Euro (92)) - - (94)
- held in foreign currency (Cost: Euro 1) - - 1
- held in foreign currency (Cost: Euro (4)) - - (4)
- held in foreign currency (Cost: Euro (1,841)) - - (1,831)
- held in foreign currency (Cost: Euro 112) - - 100
- held in foreign currency (Cost: Euro (993)) - - (1,015)
- held in foreign currency (Cost: Euro 0) - - -
- held in foreign currency (Cost: Euro (9)) - - (9)
- held in foreign currency (Cost: Euro (96)) - - (99)
- held in foreign currency (Cost: Euro 23) - - 23
- held in foreign currency (Cost: Euro 512) - - 517
Total 19,297,368 (2,549,079) 106,258,158

ALGEBRIS UCITS FUNDS PLC
Notes to the Unaudited Financial Statements (continued)
for the period from 1 January 2019 to 30 June 2019
47
3. Cash and cash equivalents (continued)
Algebris Core Italy Fund
Foreign
currency
equivalent
HSBC Bank
Plc
EUR
Total
31 December
2018
EUR
Cash
- held in local currency 794,663 794,663
- held in foreign currency (Cost: Euro (1)) (GBP 1) (1) (1)
- held in foreign currency (Cost: Euro 82) USD 101 88 88
Total 794,750 794,750
Algebris Quant Arbitrage Fund
Foreign
currency
equivalent
HSBC Bank
Plc
EUR
Bank of
America
EUR
Cash
- held in local currency 1,687,192 82,021
- held in foreign currency (Cost: Euro (860)) (GBP 765) 1 (852)
- held in foreign currency (Cost: Euro (36,635)) (USD 42,210) (2,483) -
- held in foreign currency (Cost: Euro 1) MXN 29 1 -
- held in foreign currency (Cost: Euro 50) RUB 3,799 48 -
- held in foreign currency (Cost: Euro (10)) (ZAR 169) (10) -
Total 1,684,749 81,169
BNP
Paribas
Merrill
Lynch
Total
31 December
2018
EUR EUR EUR
Cash
- held in local currency 1,596,900 478,843 3,844,956
- held in foreign currency (Cost: Euro (860)) - - (851)
- held in foreign currency (Cost: Euro (36,635)) - (34,316) (36,799)
- held in foreign currency (Cost: Euro 1) - - 1
- held in foreign currency (Cost: Euro 50) - - 48
- held in foreign currency (Cost: Euro (10)) - - (10)
Total 1,596,900 444,527 3,807,345

ALGEBRIS UCITS FUNDS PLC
Notes to the Unaudited Financial Statements (continued)
for the period from 1 January 2019 to 30 June 2019
48
4. Fair value measurement
IFRS 13 establishes a fair value hierarchy that prioritises the inputs to valuation techniques used to measure fair value. The
hierarchy gives the highest priority to unadjusted quoted prices in active markets for identical assets or liabilities (Level 1
measurements) and the lowest priority to unobservable inputs (Level 3 measurements). The three levels of the fair value
hierarchy are described in the table below. In determining an instrument's placement within the hierarchy, the Directors
separate the Company's investment portfolio into two categories: investments and derivative instruments.
Level 1 Inputs that reflect unadjusted quoted prices in active markets for identical assets or liabilities that the
Company has the ability to access at the measurement date;
Level 2 Inputs other than quoted prices that are observable for the asset or liability either directly or indirectly,
including inputs in markets that are not considered to be active;
Level 3 Inputs that are unobservable.
Inputs are used in applying the various valuation techniques and broadly refer to the assumptions that market participants
use to make valuation decisions, including assumptions about risk. Inputs may include price information, volatility
statistics, specific and broad credit data, liquidity statistics, and other factors. A financial instrument’s level within the fair
value hierarchy is based on the lowest level of any input that is significant to the fair value measurement. However, the
determination of what constitutes “observable” requires significant judgment by the Directors. The Directors consider
observable data to be that market data which is readily available, regularly distributed or updated, reliable and verifiable,
not proprietary, and provided by independent sources that are actively involved in the relevant market. The categorisation
of a financial instrument within the hierarchy is based upon the pricing transparency of the instrument and does not
necessarily correspond to the Directors' perceived risk of that instrument.
The following table presents the financial instruments carried on the Statement of Financial Position by caption and
by level within the valuation hierarchy as at 30 June 2019.
Algebris Financial Credit Fund Level 1 Level 2 Level 3 Total
EUR EUR EUR EUR
Financial assets at fair value through profit or loss
- Equity securities - 15,953,826 - 15,953,826
- Fixed income 3,729,294,956 110,306,720 - 3,839,601,676
- Fixed income pledged as collateral 3,159,844 - - 3,159,844
- Forward foreign exchange contracts - 24,030,007 - 24,030,007
- Options 3,356,699 - - 3,356,699
Total financial assets at fair value through profit or loss 3,735,811,499 150,290,553 - 3,886,102,052 Financial liabilities at fair value through profit or loss
- Forward foreign exchange contracts - (9,146,194) - (9,146,194)
- Futures (7,797,737) - - (7,797,737)
- Repurchase Agreements - (3,052,196) - (3,052,196)
Total financial liabilities at fair value through profit
or loss (7,797,737) (12,198,390) - (19,996,127)
There were no transfers between Level 1 and Level 2 during the financial period. There were two Level 3 investments held
during the financial period with nil value. Refer to Note 12 for details of such investments.

ALGEBRIS UCITS FUNDS PLC
Notes to the Unaudited Financial Statements (continued)
for the period from 1 January 2019 to 30 June 2019
49
4. Fair value measurement (continued)
The following table presents the financial instruments carried on the Statement of Financial Position by caption and
by level within the valuation hierarchy as at 30 June 2019.
Algebris Financial Income Fund Level 1 Level 2 Level 3 Total
EUR EUR EUR EUR
Financial assets at fair value through profit or loss
- Equity securities 167,585,962 813,984 - 168,399,946
- Fixed income 225,956,553 23,001,755 - 248,958,308
- Equity warrants 47,969 - - 47,969
- Forward foreign exchange contracts - 2,662,339 - 2,662,339
- Options 869,541 - - 869,541
Total financial assets at fair value through profit or loss 394,460,025 26,478,078 - 420,938,103
Financial liabilities at fair value through profit or loss
- Contracts for difference - (18,892,347) - (18,892,347)
- Forward foreign exchange contracts - (1,742,865) - (1,742,865)
- Futures (956,220) - - (956,220)
- Options (7,810) - - (7,810)
Total financial liabilities at fair value through profit or
loss (964,030)
(20,635,212) - (21,599,242)
There were no transfers between Level 1 and Level 2 during the financial period. There was one Level 3 investments held
during the financial period with nil value. Refer to Note 12 for details of such investments.
The following table presents the financial instruments carried on the Statement of Financial Position by caption and
by level within the valuation hierarchy as at 30 June 2019.
Algebris Allocation Fund Level 1 Level 2 Level 3 Total
EUR EUR EUR EUR
Financial assets at fair value through profit or loss
- Investment funds 7,158,037 - - 7,158,037
- Fixed income 2,001,970 - - 2,001,970
- Forward foreign exchange contracts - 502 - 502
- Options 2,598 - - 2,598
Total financial assets at fair value through profit or loss 9,162,605 502 - 9,163,107
Financial liabilities at fair value through profit or loss
- Forward foreign exchange contracts - (6) - (6)
Total financial liabilities at fair value through profit or
loss - (6) - (6)
There were no transfers between Level 1 and Level 2 during the financial period. There were no Level 3 investments held
during the financial period.

ALGEBRIS UCITS FUNDS PLC
Notes to the Unaudited Financial Statements (continued)
for the period from 1 January 2019 to 30 June 2019
50
4. Fair value measurement (continued)
The following table presents the financial instruments carried on the Statement of Financial Position by caption and
by level within the valuation hierarchy as at 30 June 2019.
Algebris Financial Equity Fund Level 1 Level 2 Level 3 Total
EUR EUR EUR EUR
Financial assets at fair value through profit or loss
- Equity securities 58,424,893 - - 58,424,893
- Fixed income 5,661,553 - - 5,661,553
- Contracts for difference - 656,552 - 656,552
- Forward foreign exchange contracts - 423,016 - 423,016
- Options 483,838 - - 483,838
Total financial assets at fair value through profit or loss 64,570,284 1,079,568 - 65,649,852
Financial liabilities at fair value through profit or loss
- Contracts for difference - (6,450,370) - (6,450,370)
- Forward foreign exchange contracts - (486,780) - (486,780)
- Futures (250,987) - - (250,987)
- Options (29,299) - - (29,299)
Total financial liabilities at fair value through profit or
loss (280,286) (6,937,150) - (7,217,436)
There were no transfers between Level 1 and Level 2 during the financial period. There was one Level 3 investments held
during the financial period with nil value. Refer to Note 12 for details of such investments.
The following table presents the financial instruments carried on the Statement of Financial Position by caption and
by level within the valuation hierarchy as at 30 June 2019.
Algebris Macro Credit Fund Level 1 Level 2 Level 3 Total
EUR EUR EUR EUR
Financial assets at fair value through profit or loss
- Equity securities 1,717,318 - - 1,717,318
- Fixed income 384,901,593 54,702,162 693,000 440,296,755
- Fixed income pledged as collateral 20,344,666 2,421,255 - 22,765,921
- Forward foreign exchange contracts - 2,239,015 - 2,239,015
- Futures 10,275 - - 10,275
- Options 1,652,076 - - 1,652,076
- Swaps - 22,712,085 - 22,712,085
Total financial assets at fair value through profit or
loss 408,625,928
82,074,517 693,000
491,393,445
Financial liabilities at fair value through profit or loss
- Contract for difference - (2,756,623) - (2,756,623)
- Forward foreign exchange contracts - (997,376) - (997,376)
- Options (871,733) - - (871,733)
- Repurchase Agreements - (24,656,552) - (24,656,552)
- Futures (163,511) - - (163,511)
- Swaps - (14,115,328) - (14,115,328)
Total financial liabilities at fair value through profit
or loss (1,035,244) (42,525,879) - (43,561,123)
There were no transfers between Level 1 and Level 2 during the financial period.

ALGEBRIS UCITS FUNDS PLC
Notes to the Unaudited Financial Statements (continued)
for the period from 1 January 2019 to 30 June 2019
51
4. Fair value measurement (continued)
The following table presents a Level 3 reconciliation as at 30 June 2019.
Algebris Macro Credit Fund Fixed Income
EUR
Balance at 1 January 2019 693,000
Total gains or losses recognised in Statement of Comprehensive Income -
Balance at 30 June 2019 693,000
Refer to Note 12 for details of level 3 investments.
The following table sets out information about significant unobservable inputs used at 30 June 2019 in measuring
financial instruments categorised as Level 3 in the fair value hierarchy.
Algebris Macro Credit Fund
Description
Fair value at
30 June 2019
Valuation
technique
Significant
unobservable inputs
Range of
estimates
(weighted
average) for
unobservable
input
Sensitivity to change
in significant
unobservable inputs
Fixed Income -
Banco Popular
Tier 2 693,000
Average of broker
quotes discounted
for risk of
recoverability Risk of recoverability 80% - 100%
The estimated fair value
would increase if
recoverability increased
The following table presents the financial instruments carried on the Statement of Financial Position by caption and
by level within the valuation hierarchy as at 30 June 2019.
Algebris Core Italy Fund Level 1 Level 2 Level 3 Total
EUR EUR EUR EUR
Financial assets at fair value through profit or loss
- Equity securities 30,316,419 - 225,000 30,541,419
- Fixed income 9,303,825 745,783 - 10,049,608
- Equity warrants 210,660 - - 210,660
- Forward foreign exchange contracts - 8,858 - 8,858
- Options 18,288 - - 18,288
Total financial assets at fair value through profit or loss 39,849,192 754,641 225,000 40,828,833
Financial liabilities at fair value through profit or loss
- Forward foreign exchange contracts - (530) - (530)
- Futures (213,160) - - (213,160)
Total financial liabilities at fair value through profit or loss (213,160) (530) - (213,690)
There were no transfers between Level 1 and Level 2 during the financial period.

ALGEBRIS UCITS FUNDS PLC
Notes to the Unaudited Financial Statements (continued)
for the period from 1 January 2019 to 30 June 2019
52
4. Fair value measurement (continued)
The following table presents a Level 3 reconciliation as at 30 June 2019.
Algebris Core Italy Fund Equity
EUR
Balance at 1 January 2019 -
Purchases 180,180
Total gains recognised in Statement of Comprehensive Income 44,820
Balance at 30 June 2019 225,000
The following table presents the financial instruments carried on the Statement of Financial Position by caption and
by level within the valuation hierarchy as at 30 June 2019.
Algebris Quant Arbitrage Fund Level 1 Level 2 Level 3 Total
EUR EUR EUR EUR
Financial assets at fair value through profit or loss
- Fixed income 13,218,761 - - 13,218,761
- Swap - 38,081 - 38,081
Total financial assets at fair value through profit or loss 13,218,761 38,081 - 13,256,842
Financial liabilities at fair value through profit or loss
- Forward foreign exchange contracts - (1,004) - (1,004)
- Swap - (86,837) - (86,837)
Total financial liabilities at fair value through profit or
loss - (87,841) - (87,841)
There were no transfers between Level 1 and Level 2 during the financial period. There were no Level 3 investments held
during the financial period.

ALGEBRIS UCITS FUNDS PLC
Notes to the Unaudited Financial Statements (continued)
for the period from 1 January 2019 to 30 June 2019
53
4. Fair value measurement (continued)
The following table presents the financial instruments carried on the Statement of Financial Position by caption
and by level within the valuation hierarchy as at 31 December 2018.
Algebris Financial Credit Fund Level 1 Level 2 Level 3 Total
EUR EUR EUR EUR
Financial assets at fair value through profit or loss
- Equity securities - 15,814,045 - 15,814,045
- Fixed income 3,898,006,370 87,331,545 - 3,985,337,915
- Fixed income pledged as collateral 4,924,688 - - 4,924,688
- Forward foreign exchange contracts - 21,335,981 - 21,335,981
- Futures 161,565 - - 161,565
Total financial assets at fair value through profit or loss
3,903,092,623 124,481,571 - 4,027,574,194 Financial liabilities at fair value through profit or loss
- Forward foreign exchange contracts - (7,368,134) - (7,368,134)
- Futures (1,895,520) - - (1,895,520)
- Repurchase Agreements - (5,215,764) - (5,215,764)
Total financial liabilities at fair value through profit or
loss (1,895,520) (12,583,898) - (14,479,418)
There were no transfers between Level 1 and Level 2 during the financial year. There were two Level 3 investments held
during the financial year with nil Value.
The following table presents the financial instruments carried on the Statement of Financial Position by caption and
by level within the valuation hierarchy as at 31 December 2018.
Algebris Financial Income Fund Level 1 Level 2 Level 3 Total
EUR EUR EUR EUR
Financial assets at fair value through profit or loss
- Equity securities 208,385,194 806,852 - 209,192,046
- Fixed income 227,419,819 13,815,328 - 241,235,147
- Contracts for difference - 213,742 - 213,742
- Equity warrants 10,803 - - 10,803
- Forward foreign exchange contracts - 2,682,984 - 2,682,984
- Options 544,824 1,014,324 - 1,559,148
Total financial assets at fair value through profit or loss 436,360,640 18,533,230 - 454,893,870
Financial liabilities at fair value through profit or loss
- Contracts for difference - (33,908,294) - (33,908,294)
- Forward foreign exchange contracts - (2,040,782) - (2,040,782)
- Futures (279,780) - - (279,780)
- Options - (299,969) - (299,969)
Total financial liabilities at fair value through profit or
loss (279,7480) (36,249,045) - (36,528,825) There were no transfers between Level 1 and Level 2 during the financial year. There was one Level 3 investments held
during the financial year with nil value.

ALGEBRIS UCITS FUNDS PLC
Notes to the Unaudited Financial Statements (continued)
for the period from 1 January 2019 to 30 June 2019
54
4. Fair value measurement (continued) The following table presents the financial instruments carried on the Statement of Financial Position by caption
and by level within the valuation hierarchy as at 31 December 2018. Algebris Allocation Fund Level 1 Level 2 Level 3 Total
EUR EUR EUR EUR
Financial assets at fair value through profit or loss
- Equity securities 4,727,243 - - 4,727,243
- Fixed income 6,010,109 - - 6,010,109
- Contracts for difference - 108,173 - 108,173
- Equity warrants 500 - - 500
- Forward foreign exchange contracts - 51,713 - 51,713
- Futures 58,386 - - 58,386
- Options 5,922 16,712 - 22,634
Total financial assets at fair value through profit or loss 10,802,160 176,598 - 10,978,758
Financial liabilities at fair value through profit or loss
- Contracts for difference - (814,484) - (814,484)
- Forward foreign exchange contracts - (7,670) - (7,670)
- Futures (12,742) - - (12,742)
- Options - (7,012) - (7,012)
Total financial liabilities at fair value through profit or
loss (12,742) (829,166) - (841,908)
There were no transfers between Level 1 and Level 2 during the financial year. There were no Level 3 investments held
during the financial year.
The following table presents the financial instruments carried on the Statement of Financial Position by caption and
by level within the valuation hierarchy as at 31 December 2018.
Algebris Financial Equity Fund Level 1 Level 2 Level 3 Total
EUR EUR EUR EUR
Financial assets at fair value through profit or loss
- Equity securities 73,093,219 - -
73,093,219
- Contracts for difference - 3,802,611 - 3,802,611
- Forward foreign exchange contracts - 704,508 - 704,508
- Futures 76,700 - - 76,700
- Options 136,947 328,190 - 465,137
Total financial assets at fair value through profit or loss 73,306,866 4,835,309 - 78,142,175
Financial liabilities at fair value through profit or loss
- Contracts for difference - (8,745,529) -
(8,745,529)
- Forward foreign exchange contracts - (435,470) - (435,470)
- Options (3,818) (65,117) - (68,935)
Total financial liabilities at fair value through profit or
loss (3,818) (9,246,116) - (9,249,934)
There were no transfers between Level 1 and Level 2 during the financial year. There was one Level 3 investments held
during the financial year with nil value.

ALGEBRIS UCITS FUNDS PLC
Notes to the Unaudited Financial Statements (continued)
for the period from 1 January 2019 to 30 June 2019
55
4. Fair value measurement (continued)
The following table presents the financial instruments carried on the Statement of Financial Position by caption and
by level within the valuation hierarchy as at 31 December 2018.
Algebris Macro Credit Fund Level 1 Level 2 Level 3 Total
EUR EUR EUR EUR
Financial assets at fair value through profit or loss
- Equity securities 2,087,032 - - 2,087,032
- Fixed income 488,030,827 94,353,948 693,000 583,077,775
- Fixed income pledged as collateral 37,215,337 - - 37,215,337
- Forward foreign exchange contracts - 1,517,135 - 1,517,135
- Futures 1,205,536 - - 1,205,536
- Options 2,069,027 4,536,710 - 6,605,737
- Swaps - 28,647,714 - 28,647,714
Total financial assets at fair value through profit or
loss 530,607,759 129,055,507 693,000 660,356,266
Financial liabilities at fair value through profit or loss
- Forward foreign exchange contracts - (256,894) - (256,894)
- Options (297,588) (4,091,811) - (4,389,399)
- Repurchase Agreements - (42,579,231) - (42,579,231)
- Swaps - (20,733,766) - (20,733,766)
Total financial liabilities at fair value through profit
or loss (297,588) (67,661,702) - (67,959,290)
There were no transfers between Level 1 and Level 2 during the financial year.
The following table presents a Level 3 reconciliation as at 31 December 2018. Algebris Macro Credit Fund Fixed Income
EUR
Balance at 1 January 2018 1,122,000
Total gains or losses recognised in Statement of Comprehensive Income (429,000)
Balance at 31 December 2018 693,000 The following table sets out information about significant unobservable inputs used at 31 December 2018 in
measuring financial instruments categorised as Level 3 in the fair value hierarchy.

ALGEBRIS UCITS FUNDS PLC
Notes to the Unaudited Financial Statements (continued)
for the period from 1 January 2019 to 30 June 2019
56
4. Fair value measurement (continued) Algebris Macro Credit Fund
Description
Fair value at
31 December
2018 Valuation technique
Significant
unobservable inputs
Range of
estimates
(weighted
average) for
unobservable
input
Sensitivity to change
in significant
unobservable inputs
Fixed Income -
Banco Popular
Tier 2 693,000
Average of broker
quotes discounted for
risk of recoverability Risk of recoverability 80% - 100%
The estimated fair
value would increase
if recoverability
increased
Fixed Income -
Banco Popular
AT1 -
Expected cash flows
discounted for risk of
recoverability
Expected cash flow
Recoverability of
claim 0
An increase in the
expected cash flow
and recoverability of
the claim would result
in an increased fair
value. The following table presents the financial instruments carried on the Statement of Financial Position by caption and
by level within the valuation hierarchy as at 31 December 2018. Algebris Core Italy Fund Level 1 Level 2 Level 3 Total
EUR EUR EUR EUR
Financial assets at fair value through profit or loss
- Equity securities 19,013,949 - - 19,013,949
- Fixed income 14,893,239 1,156,610 - 16,049,849
- Fixed income pledged as collateral 32,513 - - 32,513
- Equity warrants 49,987 - - 49,987
- Forward foreign exchange contracts - 8,589 - 8,589
Total financial assets at fair value through profit or loss 33,989,688 1,165,199 - 35,154,887
Financial liabilities at fair value through profit or loss
- Forward foreign exchange contracts - (279) - (279)
- Repurchase Agreements - (271,624) - (271,624)
Total financial liabilities at fair value through profit or
loss - (271,903) - (271,903)
There were no transfers between Level 1 and Level 2 during the financial period. There were no Level 3 investments
held during the financial year.

ALGEBRIS UCITS FUNDS PLC
Notes to the Unaudited Financial Statements (continued)
for the period from 1 January 2019 to 30 June 2019
57
4. Fair value measurement (continued)
The following table presents the financial instruments carried on the Statement of Financial Position by caption and
by level within the valuation hierarchy as at 31 December 2018.
Algebris Quant Arbitrage Fund Level 1 Level 2 Level 3 Total
EUR EUR EUR EUR
Financial assets at fair value through profit or loss
- Fixed income 8,276,292 - - 8,276,292
- Forward foreign exchange contracts - 85,603 - 85,603
Total financial assets at fair value through profit or loss 8,276,292 85,603 - 8,361,895
Financial liabilities at fair value through profit or loss
- Forward foreign exchange contracts - (2,299) - (2,299)
Total financial liabilities at fair value through profit or loss - (2,299) - (2,299)
There were no transfers between Level 1 and Level 2 during the financial year. There were no Level 3 investments held
during the financial year.
Investments
Investments whose values are based on quoted market prices in active markets are classified within level 1. These include
active listed equities and bonds with high value. The Directors do not adjust the quoted price for such instruments, even in
situations where the Company holds a large position and a sale could reasonably impact the quoted price.
Investments that trade in markets that are not considered to be active, but are valued based on quoted market prices, dealer
quotations or alternative pricing sources supported by observable inputs are classified within level 2.
Investments classified within level 3 have significant unobservable inputs, as they trade infrequently or not at all. There are
level 3 investments held at period end. (31 December 2018: EUR 693,000)
Derivative instruments
Derivative instruments can be exchange-traded or privately negotiated over-the-counter (“OTC”). Exchange-traded
derivatives, such as futures contracts and exchange traded option contracts, are typically classified within level 1 or level 2
of the fair value hierarchy depending on whether or not they are deemed to be actively traded. OTC derivatives, such as
forward foreign exchange contracts and equity swaps have inputs which can generally be corroborated by market data and
are therefore classified within level 2.
The Company has not disclosed the fair values for financial instruments such as cash and cash equivalents, due to/from
broker, due to/from members and short-term receivables and payables because their carrying amounts are a reasonable
approximations of fair values.

ALGEBRIS UCITS FUNDS PLC
Notes to the Unaudited Financial Statements (continued)
for the period from 1 January 2019 to 30 June 2019
58
4. Fair value measurement (continued) Derivative instruments (continued)
A Sub-Fund may, subject to the requirements laid down by the Central Bank, enter into financial derivative
instruments (“FDIs”) for investment, efficient portfolio management and hedging (e.g. currency risk management)
purposes. A Sub-Fund may also invest in convertible securities, CoCo-Bonds and Exchange Traded Notes
(“ETNs”) which have embedded leverage or embed derivatives component. The Sub-Fund will take both long and
short positions synthetically through the use of FDIs. These may include swaps, put and call options, futures and
forward contracts. Efficient portfolio management techniques include contracts for difference, futures contracts,
forward foreign exchange contracts, credit default swaps, equity warrants, interest rate swaps and option contracts.
The option contracts are not covered. The risks associated with the use of financial derivative instruments are
described in the annual audited financial statements for the year ended 31 December 2018. The gains and (losses)
and costs associated with these efficient portfolio management techniques are listed below:
Algebris
Financial
Algebris
Financial Algebris
Algebris
Financial
Total Credit Fund Income Fund Allocation Fund Equity Fund
30 June 30 June 30 June 30 June 30 June
2019 2019 2019 2019 2019
EUR EUR EUR EUR EUR
Financial derivatives
- Contracts for difference 3,039,045 - 7,220,751 (793) (1,343,028)
- Equity warrants 182,265 - 21,593 - -
- Forward foreign exchange
contracts (43,770,671) (35,919,082) (2,466,022) (95,552)
(535,189)
- Futures (28,590,082) (23,237,885) (1,910,424) (93,997) (1,416,426)
- Options (28,794,237) (18,558,190) (7,034,084) (32,294) (1,035,022)
- Swaps 26,370,811 - - - -
(71,562,869) (77,715,157) (4,168,186) (222,636) (4,329,665)
Algebris
Macro
Algebris
Core
Algebris
Quant Arbitrage
Credit Fund Italy Fund Fund
30 June 30 June 30 June
2019 2019 2019
EUR EUR EUR
Financial derivatives
- Contracts for difference (3,202,729) 364,844 -
- Equity warrants - 160,672 -
- Forward foreign exchange
contracts (4,810,518) 95,593 (39,901)
- Futures (1,395,065) (536,285) -
- Options (2,056,417) (78,230) -
- Swaps (26,376,161) - (5,350)
14,911,432 6,594 (45,251)

ALGEBRIS UCITS FUNDS PLC
Notes to the Unaudited Financial Statements (continued)
for the period from 1 January 2019 to 30 June 2019
59
4. Fair value measurement (continued)
Algebris
Financial
Algebris
Financial
Algebris
Allocation
Algebris
Financial
Total Credit Fund Income Fund Fund Equity Fund
30 June 30 June 30 June 30 June 30 June
2018 2018 2018 2018 2018
EUR EUR EUR EUR EUR
Financial derivatives
- Contracts for difference (18,297,888) - (8,633,758) 77,572 (2,939,964)
- Equity warrants 11,984 - 8,232 381 -
- Forward foreign exchange
contracts (75,124,131) (73,666,935) 432,743 (160,718) (1,995,317)
- Futures (14,407,534) 12,672,474 429,684 31,410 (559,078)
- Options 31,726,188 13,431,376 (237,612) (8,720) (5,082)
- Swaps (185,665) - - - -
(76,277,046) (47,563,085) (8,000,711) (60,075) (5,499,441)
Algebris
Macro
Algebris
Core
Algebris
Quant
Arbitrage
Credit Fund Italy Fund Fund
30 June 30 June 30 June
2018 2018 2018
EUR EUR EUR
Financial derivatives
- Contracts for difference (6,908,377) 106,639 -
- Equity warrants - 3,371 -
- Forward foreign exchange
contracts 283,978 24,076 (41,958)
- Futures (26,870,203) (107,978) (3,843)
- Options 18,524,435 9,190 12,601
- Swaps (191,020) - 5,355
(15,161,187) 35,298 (27,845)
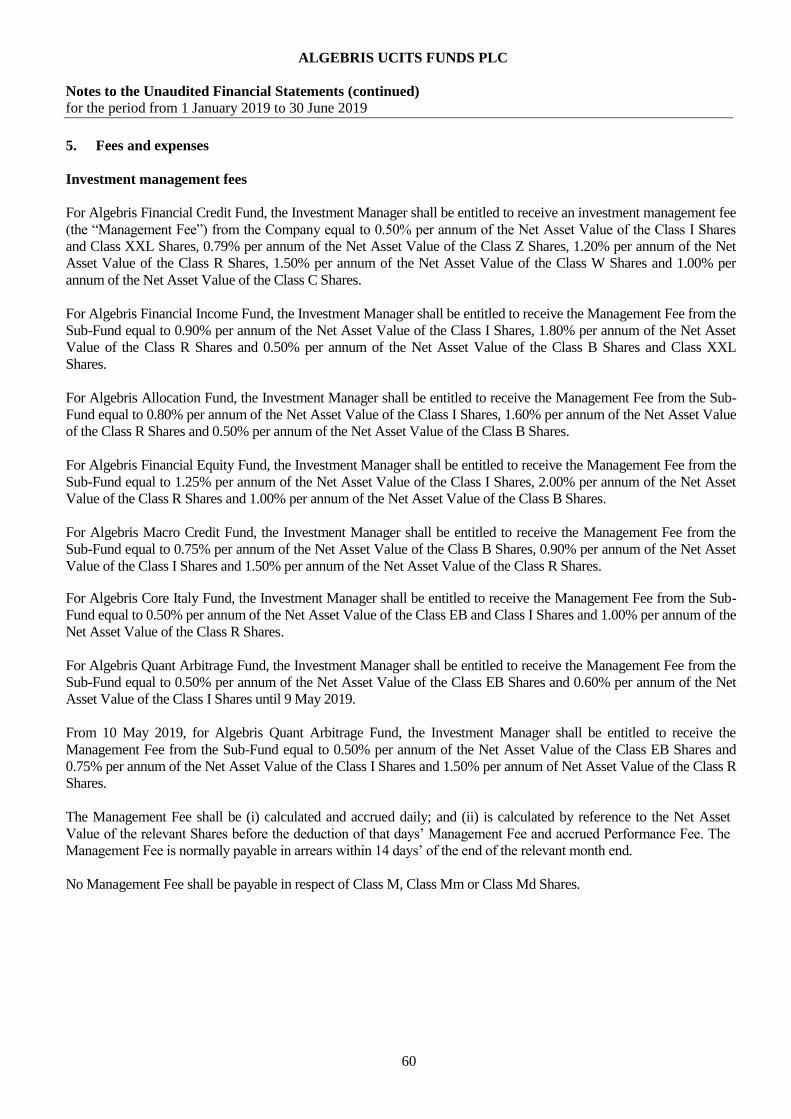
ALGEBRIS UCITS FUNDS PLC
Notes to the Unaudited Financial Statements (continued)
for the period from 1 January 2019 to 30 June 2019
60
5. Fees and expenses
Investment management fees
For Algebris Financial Credit Fund, the Investment Manager shall be entitled to receive an investment management fee
(the “Management Fee”) from the Company equal to 0.50% per annum of the Net Asset Value of the Class I Shares
and Class XXL Shares, 0.79% per annum of the Net Asset Value of the Class Z Shares, 1.20% per annum of the Net
Asset Value of the Class R Shares, 1.50% per annum of the Net Asset Value of the Class W Shares and 1.00% per
annum of the Net Asset Value of the Class C Shares.
For Algebris Financial Income Fund, the Investment Manager shall be entitled to receive the Management Fee from the
Sub-Fund equal to 0.90% per annum of the Net Asset Value of the Class I Shares, 1.80% per annum of the Net Asset
Value of the Class R Shares and 0.50% per annum of the Net Asset Value of the Class B Shares and Class XXL
Shares.
For Algebris Allocation Fund, the Investment Manager shall be entitled to receive the Management Fee from the Sub-
Fund equal to 0.80% per annum of the Net Asset Value of the Class I Shares, 1.60% per annum of the Net Asset Value
of the Class R Shares and 0.50% per annum of the Net Asset Value of the Class B Shares.
For Algebris Financial Equity Fund, the Investment Manager shall be entitled to receive the Management Fee from the
Sub-Fund equal to 1.25% per annum of the Net Asset Value of the Class I Shares, 2.00% per annum of the Net Asset
Value of the Class R Shares and 1.00% per annum of the Net Asset Value of the Class B Shares.
For Algebris Macro Credit Fund, the Investment Manager shall be entitled to receive the Management Fee from the
Sub-Fund equal to 0.75% per annum of the Net Asset Value of the Class B Shares, 0.90% per annum of the Net Asset
Value of the Class I Shares and 1.50% per annum of the Net Asset Value of the Class R Shares.
For Algebris Core Italy Fund, the Investment Manager shall be entitled to receive the Management Fee from the Sub-
Fund equal to 0.50% per annum of the Net Asset Value of the Class EB and Class I Shares and 1.00% per annum of the
Net Asset Value of the Class R Shares.
For Algebris Quant Arbitrage Fund, the Investment Manager shall be entitled to receive the Management Fee from the
Sub-Fund equal to 0.50% per annum of the Net Asset Value of the Class EB Shares and 0.60% per annum of the Net
Asset Value of the Class I Shares until 9 May 2019.
From 10 May 2019, for Algebris Quant Arbitrage Fund, the Investment Manager shall be entitled to receive the
Management Fee from the Sub-Fund equal to 0.50% per annum of the Net Asset Value of the Class EB Shares and
0.75% per annum of the Net Asset Value of the Class I Shares and 1.50% per annum of Net Asset Value of the Class R
Shares.
The Management Fee shall be (i) calculated and accrued daily; and (ii) is calculated by reference to the Net Asset
Value of the relevant Shares before the deduction of that days’ Management Fee and accrued Performance Fee. The
Management Fee is normally payable in arrears within 14 days’ of the end of the relevant month end.
No Management Fee shall be payable in respect of Class M, Class Mm or Class Md Shares.

ALGEBRIS UCITS FUNDS PLC
Notes to the Unaudited Financial Statements (continued)
for the period from 1 January 2019 to 30 June 2019
61
5. Fees and expenses (continued)
Investment management fees (continued)
In addition, the Investment Manager shall be entitled to be reimbursed its reasonably vouched out-of-pocket expenses.
Each Sub-Fund shall bear its pro-rata share of such out-of-pocket expenses. Investment management fees for the
financial period ended 30 June 2019 amounted to EUR 24,659,240 (30 June 2018: EUR 28,792,663) of which EUR
3,808,948 (31 December 2018: EUR 4,770,636) was payable at financial period end.
Performance fees
Algebris Financial Credit Fund
The Performance Fee in respect of the Class I and Class R Accumulating Classes is equal to 10% of the excess of the
Net Asset Value per Share of the relevant Class I Shares and Class R Shares (after the deduction of the Management
Fee and all other payments and expenses but before the deduction of any accrued Performance Fee) at the end of a
Performance Period over the High Water Mark.
The Performance Fee in respect of the Class I and Class R Distributing Classes is equal to 10% of the excess of the
Adjusted NAV over the Adjusted High Water Mark.
“Adjusted NAV” means the Net Asset Value per Share of the Class I and Class R Distributing Class after the
deduction of the Management Fee and all other payments and expenses but before the deduction of any accrued
Performance Fee at the end of a Performance Period adjusted by the aggregate amount of all distributions per Share
declared in respect of the Distributing Class since the initial issue of Shares in the Class.
“High Water Mark” means the previous highest of (i) the highest Net Asset Value per Share of the Class I and Class R
Accumulating Classes (before any accrual for the Performance Fee) at the end of any previous Performance Period
(occurring on a quarter end) on which the Performance Fee was paid; and (ii) the Initial Offer Price of the relevant
Class I and Class R Accumulating Shares.
“Performance Period” means a calendar quarter ending on 31 March, 30 June, 30 September and 31 December (each
quarter end) in each year, save that the first Performance Period will commence upon the initial issue of Shares and
will end on the following quarter end.
“Adjusted High Water Mark” means the previous highest of (i) the highest Adjusted NAV (before any accrual for the
Performance Fee) at the end of any previous Performance Period (occurring on a quarter end) on which the
Performance Fee was paid; and (ii) the Initial Offer Price of the Class I Accumulating Shares and Class R
Accumulating Shares, respectively.
The Performance Fee (if any) will accrue daily. The amount accrued on each day will be determined by calculating
the Performance Fee that would be payable if that day was the last day of the current Performance Period. The
Performance Fee will be payable by the relevant Sub-Fund to the Investment Manager quarterly in arrears normally
within 14 calendar days of the end of each Performance Period.
The Performance Fee, if any, is calculated on Net Asset Value per Share (after the deduction of the Management Fee
and all other payments and expenses but before the deduction of any accrued Performance Fee) at the end of each
Performance Period (with respect to the Class I and Class R Accumulating Share Classes) and the Adjusted NAV
(with respect to the Class I and Class R Distributing Share Classes) including in each case, for the avoidance of doubt
the net realised and unrealised gains and losses. As a result, a Performance Fee may be paid on unrealised gains which
may subsequently never be realised. There is no repayment of any Performance Fee already paid if the Net Asset
Value per Share subsequently falls back below the High Water Mark or Adjusted High Water Mark, as appropriate,
even if an investor redeems its holding. Accrued Performance Fee will be crystallised upon any redemption.
The calculation of the performance fee shall be verified by the Depositary.

ALGEBRIS UCITS FUNDS PLC
Notes to the Unaudited Financial Statements (continued)
for the period from 1 January 2019 to 30 June 2019
62
5. Fees and expenses (continued)
Performance fees (continued)
Algebris Financial Credit Fund (continued)
No performance fees shall be payable in respect of Class M, Class XXL, Class W and Class Z Shares.
Performance fees for the financial period ended 30 June 2019 amounted to EUR 8,590,549 (30 June 2018: EUR
350,841) of which EUR 8,053,430 (31 December 2018: EUR Nil) was payable at financial period end.
Algebris Financial Income Fund
There are no performance fees in respect of Algebris Financial Income Fund.
Algebris Allocation Fund
The Performance Fee in respect of the Class B, Class I and Class R Shares is equal to 10% of the excess of the Net
Asset Value per Share of the relevant Class B Shares, Class I Shares and Class R Shares (after the deduction of the
Management Fee and all other payments and expenses but before the deduction of any accrued Performance Fee) at
the end of a Performance Period over the High Water Mark.
No performance fees shall be payable in respect of Class M shares.
Performance fees for the financial period ended 30 June 2019 amounted to EUR 3 (30 June 2018: EUR 359) of which
EUR 3 (31 December 2018: EUR Nil) was payable at financial period end.
Algebris Financial Equity Fund
The Performance Fee in respect of the Class B and Class Bm Shares is equal to 10% of the excess of the Net Asset
Value per Share and Class I, Class Im, Class R and Class Rm Shares is equal to 15% of the excess of the Net Asset
Value per Share of the relevant Class B, Class Bm, Class I, Class Im, Class R and Class Rm Shares (after the
deduction of the Management Fee and all other payments and expenses but before the deduction of any accrued
Performance Fee) at the end of a Performance Period over the High Water Mark.
No performance fees shall be payable in respect of Class M, Class Mm Shares and Class Md Shares.
Performance fees for the financial period ended 30 June 2019 amounted to EUR Nil (30 June 2018: EUR 53,849) of
which EUR Nil (31 December 2018: Nil) was payable at financial period end.
The Performance Fee, if any, is calculated on Net Asset Value per Share (after the deduction of the Management Fee
and all other payments and expenses but before the deduction of any accrued Performance Fee) at the end of each
Performance Period (with respect to the Class B, Class Bm, Class I, Class Im, Class R and Class Rm Shares)
including in each case, for the avoidance of doubt the net realised and unrealised gains and losses. As a result, a
Performance Fee may be paid on unrealised gains which may subsequently never be realised. There is no repayment
of any Performance Fee already paid if the Net Asset Value per Share subsequently falls back below the High Water
Mark or Adjusted High Water Mark, as appropriate, even if an investor redeems its holding. Accrued Performance
Fee will be crystallised upon any redemption.
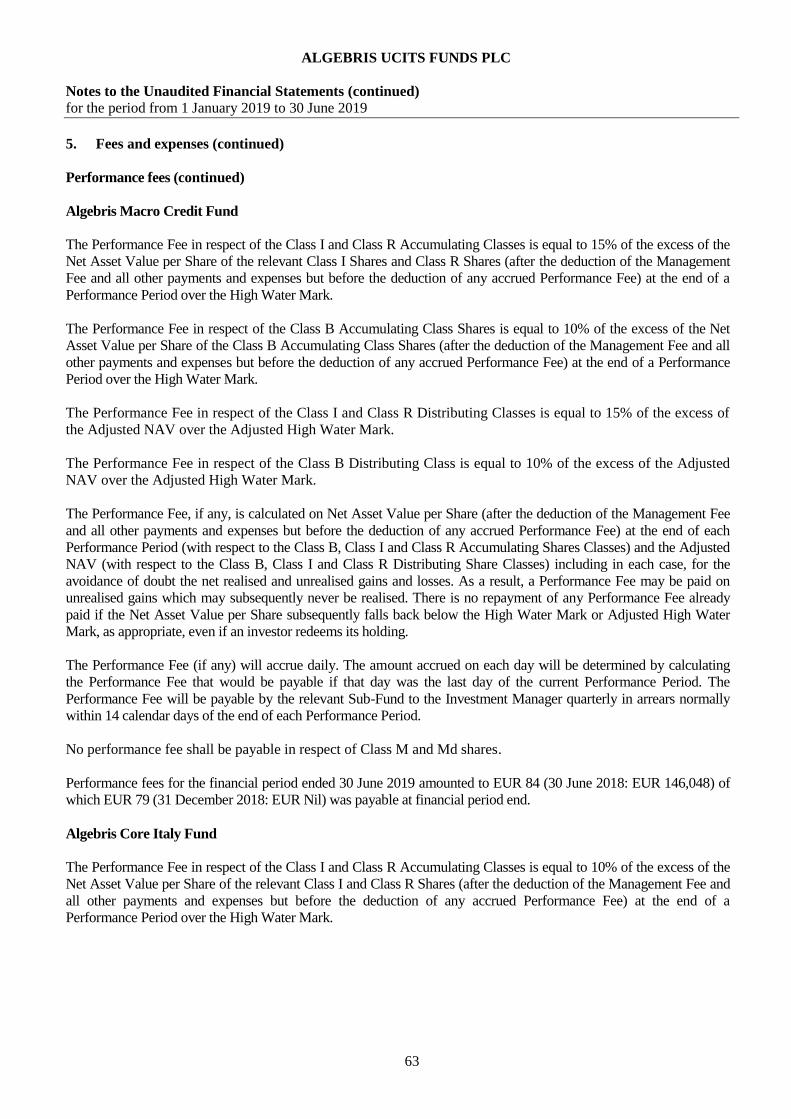
ALGEBRIS UCITS FUNDS PLC
Notes to the Unaudited Financial Statements (continued)
for the period from 1 January 2019 to 30 June 2019
63
5. Fees and expenses (continued)
Performance fees (continued)
Algebris Macro Credit Fund
The Performance Fee in respect of the Class I and Class R Accumulating Classes is equal to 15% of the excess of the
Net Asset Value per Share of the relevant Class I Shares and Class R Shares (after the deduction of the Management
Fee and all other payments and expenses but before the deduction of any accrued Performance Fee) at the end of a
Performance Period over the High Water Mark.
The Performance Fee in respect of the Class B Accumulating Class Shares is equal to 10% of the excess of the Net
Asset Value per Share of the Class B Accumulating Class Shares (after the deduction of the Management Fee and all
other payments and expenses but before the deduction of any accrued Performance Fee) at the end of a Performance
Period over the High Water Mark.
The Performance Fee in respect of the Class I and Class R Distributing Classes is equal to 15% of the excess of
the Adjusted NAV over the Adjusted High Water Mark.
The Performance Fee in respect of the Class B Distributing Class is equal to 10% of the excess of the Adjusted
NAV over the Adjusted High Water Mark.
The Performance Fee, if any, is calculated on Net Asset Value per Share (after the deduction of the Management Fee
and all other payments and expenses but before the deduction of any accrued Performance Fee) at the end of each
Performance Period (with respect to the Class B, Class I and Class R Accumulating Shares Classes) and the Adjusted
NAV (with respect to the Class B, Class I and Class R Distributing Share Classes) including in each case, for the
avoidance of doubt the net realised and unrealised gains and losses. As a result, a Performance Fee may be paid on
unrealised gains which may subsequently never be realised. There is no repayment of any Performance Fee already
paid if the Net Asset Value per Share subsequently falls back below the High Water Mark or Adjusted High Water
Mark, as appropriate, even if an investor redeems its holding.
The Performance Fee (if any) will accrue daily. The amount accrued on each day will be determined by calculating
the Performance Fee that would be payable if that day was the last day of the current Performance Period. The
Performance Fee will be payable by the relevant Sub-Fund to the Investment Manager quarterly in arrears normally
within 14 calendar days of the end of each Performance Period.
No performance fee shall be payable in respect of Class M and Md shares.
Performance fees for the financial period ended 30 June 2019 amounted to EUR 84 (30 June 2018: EUR 146,048) of
which EUR 79 (31 December 2018: EUR Nil) was payable at financial period end.
Algebris Core Italy Fund
The Performance Fee in respect of the Class I and Class R Accumulating Classes is equal to 10% of the excess of the
Net Asset Value per Share of the relevant Class I and Class R Shares (after the deduction of the Management Fee and
all other payments and expenses but before the deduction of any accrued Performance Fee) at the end of a
Performance Period over the High Water Mark.
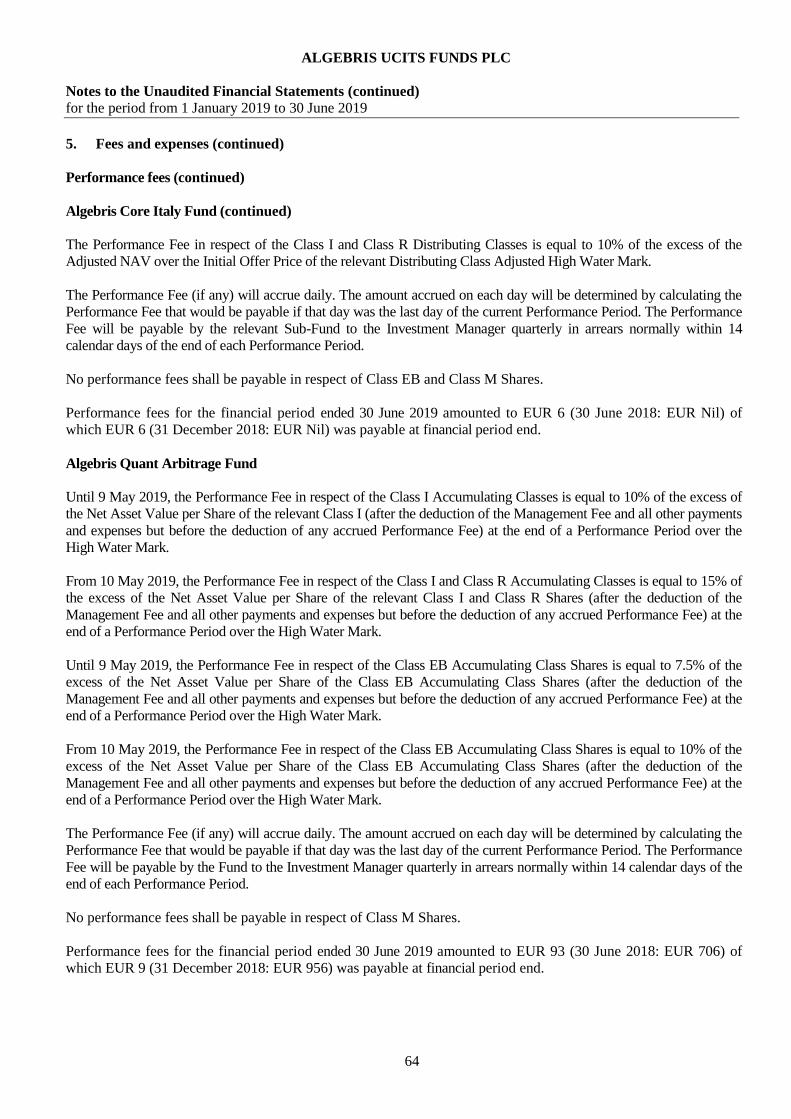
ALGEBRIS UCITS FUNDS PLC
Notes to the Unaudited Financial Statements (continued)
for the period from 1 January 2019 to 30 June 2019
64
5. Fees and expenses (continued)
Performance fees (continued)
Algebris Core Italy Fund (continued)
The Performance Fee in respect of the Class I and Class R Distributing Classes is equal to 10% of the excess of the
Adjusted NAV over the Initial Offer Price of the relevant Distributing Class Adjusted High Water Mark.
The Performance Fee (if any) will accrue daily. The amount accrued on each day will be determined by calculating the
Performance Fee that would be payable if that day was the last day of the current Performance Period. The Performance
Fee will be payable by the relevant Sub-Fund to the Investment Manager quarterly in arrears normally within 14
calendar days of the end of each Performance Period.
No performance fees shall be payable in respect of Class EB and Class M Shares.
Performance fees for the financial period ended 30 June 2019 amounted to EUR 6 (30 June 2018: EUR Nil) of
which EUR 6 (31 December 2018: EUR Nil) was payable at financial period end.
Algebris Quant Arbitrage Fund
Until 9 May 2019, the Performance Fee in respect of the Class I Accumulating Classes is equal to 10% of the excess of
the Net Asset Value per Share of the relevant Class I (after the deduction of the Management Fee and all other payments
and expenses but before the deduction of any accrued Performance Fee) at the end of a Performance Period over the
High Water Mark.
From 10 May 2019, the Performance Fee in respect of the Class I and Class R Accumulating Classes is equal to 15% of
the excess of the Net Asset Value per Share of the relevant Class I and Class R Shares (after the deduction of the
Management Fee and all other payments and expenses but before the deduction of any accrued Performance Fee) at the
end of a Performance Period over the High Water Mark.
Until 9 May 2019, the Performance Fee in respect of the Class EB Accumulating Class Shares is equal to 7.5% of the
excess of the Net Asset Value per Share of the Class EB Accumulating Class Shares (after the deduction of the
Management Fee and all other payments and expenses but before the deduction of any accrued Performance Fee) at the
end of a Performance Period over the High Water Mark.
From 10 May 2019, the Performance Fee in respect of the Class EB Accumulating Class Shares is equal to 10% of the
excess of the Net Asset Value per Share of the Class EB Accumulating Class Shares (after the deduction of the
Management Fee and all other payments and expenses but before the deduction of any accrued Performance Fee) at the
end of a Performance Period over the High Water Mark.
The Performance Fee (if any) will accrue daily. The amount accrued on each day will be determined by calculating the
Performance Fee that would be payable if that day was the last day of the current Performance Period. The Performance
Fee will be payable by the Fund to the Investment Manager quarterly in arrears normally within 14 calendar days of the
end of each Performance Period.
No performance fees shall be payable in respect of Class M Shares.
Performance fees for the financial period ended 30 June 2019 amounted to EUR 93 (30 June 2018: EUR 706) of
which EUR 9 (31 December 2018: EUR 956) was payable at financial period end.

ALGEBRIS UCITS FUNDS PLC
Notes to the Unaudited Financial Statements (continued)
for the period from 1 January 2019 to 30 June 2019
65
5. Fees and expenses (continued)
Administration fees
The Administrator shall be entitled to receive out of the assets of each Sub-Fund a fee, accrued and calculated daily and
payable monthly in arrears, at a rate of up to 0.05% per annum of a Sub-Fund’s Net Asset Value for the first EUR 250
million, 0.035% per annum of a Sub-Fund’s Net Asset Value between EUR 250 million and EUR 500 million and
0.02% per annum of a Sub-Fund’s Net Asset Value above EUR 500 million subject to a minimum monthly fee of up to
EUR 300 per Share Class (which shall be reduced by 50% for the first six months after the launch of a Sub-Fund). The
Administrator shall receive an annual reporting fee of EUR 3,000 per Sub-Fund.
In addition, the Company shall pay out of the assets of each Sub-Fund its portion of the Administrator’s financial
statement production fee of EUR 5,000 (per set) for the preparation of audited and unaudited financial statements for the
Company. In addition, the Administrator shall be entitled to be reimbursed its reasonable vouched out-of-pocket
expenses, transaction and account fees. Administration fees for the financial period ended 30 June 2019 amounted to
EUR 1,271,906 (30 June 2018: EUR 1,506,600) of which EUR 142,636 (31 December 2018: EUR 156,530) was
payable at financial period end.
Depositary fees
The Depositary shall be entitled to receive out of the assets of each Sub-Fund a fee, accrued and calculated daily and
payable monthly in arrears, at a rate of 0.03% per annum of a Sub-Fund’s Net Asset Value for the first EUR500 million
and 0.025% per annum of a Sub-Fund’s Net Asset Value above EUR500 million subject to a minimum annual fee of
EUR 250,000 at Algebris UCITS Funds plc umbrella level.
The Depositary shall also be entitled to receive a flat fee of USD 7,000 per annum for UCITS V related depositary
charges.
The Depositary shall also be entitled to receive transaction charges and all Sub-Custodian charges will be recovered by
the Depositary from the Company as they are incurred by the relevant sub- Custodian. All such charges shall be charged
at normal commercial rates. The Depositary is also entitled to reimbursement of its reasonable vouched out-of-pocket
expenses. Depositary fees for the financial period ended 30 June 2019 amounted to EUR 739,458 (30 June 2018: EUR
898,317) of which EUR 114,497 (31 December 2018: EUR 129,906) was payable at financial period end.
Directors’ fees and expenses
The Directors shall be entitled to be paid a fee from the assets of the Company by way of remuneration for their services
at a rate to be determined from time to time by the Directors, provided that the aggregate amount of Directors’
remuneration in any one financial year shall not exceed EUR 75,000 plus VAT or such other maximum amount as may
be determined by the Directors, notified to Shareholders in advance, and disclosed in the Prospectus or the Company’s
annual report. Mr Lasagna shall not receive a Directors’ fee. The Directors will be entitled to be reimbursed by the
Company for all reasonable disbursements and out-of-pocket expenses incurred by them. The Directors’ fees for the
financial period ended 30 June 2019 amounted to EUR 30,052 (30 June 2018: EUR 31,744) of which EUR 32,232 (31
December 2018: EUR 2,813) was payable at financial period end.
Auditors’ fees
Fees accrued for the statutory auditors, KPMG, in respect of the financial period ending 30 June 2019, relate entirely to
the audit of the financial statements and tax advisory services provided by KPMG to the Company. Auditors’ fees
accrued for the financial period ended 30 June 2019 amounted to EUR 76,834 (30 June 2018: EUR 82,438) of which
EUR 70,011 (31 December 2018: EUR 107,306) was payable at financial period end. Tax advisory fees accrued for the
financial period ended 30 June 2019 amounted to EUR Nil (30 June 2018: EUR 133,863) of which EUR Nil (31
December 2018: EUR 36,406) was payable at financial period end.
Company secretarial fees
The Company has appointed Tudor Trust Limited as Company Secretary. Company secretarial fees for the financial
period ended 30 June 2019 amounted to EUR 13,497 (30 June 2018: EUR 10,444) of which EUR 13,178 (31 December
2018: EUR 9,698) was payable at financial period end.

ALGEBRIS UCITS FUNDS PLC
Notes to the Unaudited Financial Statements (continued)
for the period from 1 January 2019 to 30 June 2019
66
6. Distributions
The Directors are permitted to declare distributions in respect of any Class of Shares. Distributions may not be
payable for all Classes of Shares. A distribution may include accrued revenue which may subsequently never be
received. The amount of the net income to be distributed is determined at the discretion of the Directors in
accordance with Articles and the Directors will also determine what proportion of a Sub-Fund’s expenses may be
netted against the income to arrive at the net income figure. For the Distributing Classes, the current distribution
policy is to distribute net income (consisting of revenue, including any accrued interest and dividends less
expenses).
Algebris Financial Credit Fund
30 June 2019 30 June 2018
Share Class Ex-Date Rate Ex-Date Rate
CHF Class Rd 9-Jan-2019 CHF 1.5066 9-Jan-2018 CHF 1.2485
EUR Class Id 9-Jan-2019 EUR 1.7558 9-Jan-2018 EUR 1.3807
EUR Class Md 9-Jan-2019 EUR 1.9621 9-Jan-2018 EUR 1.3466
EUR Class Rd 9-Jan-2019 EUR 1.6202 9-Jan-2018 EUR 1.3912
EUR Class Wd 9-Jan-2019 EUR 1.6521 9-Jan-2018 EUR 1.8139
EUR Class XXLd 9-Jan-2019 EUR 1.5809 9-Jan-2018 EUR 1.3469
GBP Class Id 9-Jan-2019 GBP 1.8857 9-Jan-2018 GBP 1.4487
GBP Class Md 9-Jan-2019 GBP 1.0042 - -
GBP Class Rd 9-Jan-2019 GBP 1.4503 9-Jan-2018 GBP 0.9646
GBP Class Wd 9-Jan-2019 GBP 1.3765 9-Jan-2018 GBP 1.0543
GBP Class Zd 9-Jan-2019 GBP 1.6158 9-Jan-2018 GBP 1.3236
SGD Class Rd 9-Jan-2019 SGD 1.5764 9-Jan-2018 SGD 1.2752
SGD Class Wd 9-Jan-2019 SGD 1.4867 - -
USD Class Id 9-Jan-2019 USD 1.8417 9-Jan-2018 USD 1.3541
USD Class Md 9-Jan-2019 USD 2.8599 9-Jan-2018 USD 1.3902
USD Class Rd 9-Jan-2019 USD 1.6005 9-Jan-2018 USD 1.2822
USD Class Wd 9-Jan-2019 USD 1.6621 9-Jan-2018 USD 1.3198
USD Class Zd 9-Jan-2019 USD 1.3230 9-Jan-2018 USD 1.1110
CHF Class Rd 8-Apr-2019 CHF 1.4058 10-Apr-2018 CHF 1.2817
EUR Class Id 8-Apr-2019 EUR 1.6374 10-Apr-2018 EUR 1.4150
EUR Class Md 8-Apr-2019 EUR 1.4806 10-Apr-2018 EUR 1.3267
EUR Class Rd 8-Apr-2019 EUR 1.4115 10-Apr-2018 EUR 1.2874
EUR Class Wd 8-Apr-2019 EUR 1.4855 10-Apr-2018 EUR 0.6462
EUR Class XXLd 8-Apr-2019 EUR 1.4682 10-Apr-2018 EUR 1.3249
GBP Class Id 8-Apr-2019 GBP 1.6987 10-Apr-2018 GBP 1.4051
GBP Class Md 8-Apr-2019 GBP 1.4909 10-Apr-2018 GBP 1.1067
GBP Class Rd 8-Apr-2019 GBP 1.3754 - -
GBP Class Wd 8-Apr-2019 GBP 1.3889 10-Apr-2018 GBP 1.1600
GBP Class Zd 8-Apr-2019 GBP 1.4932 10-Apr-2018 GBP 1.3125
SGD Class Rd 8-Apr-2019 SGD 1.5316 10-Apr-2018 SGD 1.1104
SGD Class Wd 8-Apr-2019 SGD 1.3859 10-Apr-2018 SGD 0.2831
USD Class Id 8-Apr-2019 USD 1.7102 10-Apr-2018 USD 1.2270
USD Class Md 8-Apr-2019 USD 1.5774 10-Apr-2018 USD 1.3624
USD Class Rd 8-Apr-2019 USD 1.5134 10-Apr-2018 USD 1.1365
USD Class Wd 8-Apr-2019 USD 1.5166 10-Apr-2018 USD 1.5459
USD Class Zd 8-Apr-2019 USD 1.2486 10-Apr-2018 USD 1.2036

ALGEBRIS UCITS FUNDS PLC
Notes to the Unaudited Financial Statements (continued)
for the period from 1 January 2019 to 30 June 2019
67
6. Distributions (continued)
Algebris Financial Income Fund
30 June 2019 30 June 2018
Share Class Ex-Date Rate Ex-Date Rate
CHF Class Id 9-Jan-2019 CHF 0.8920 - -
CHF Class Rd 9-Jan-2019 CHF 0.8572 - -
EUR Class Bd 9-Jan-2019 EUR 1.2775 9-Jan-2018 EUR 0.9840
EUR Class Id 9-Jan-2019 EUR 1.0007 9-Jan-2018 EUR 0.8171
EUR Class Md 9-Jan-2019 EUR 1.0197 9-Jan-2018 EUR 0.8447
EUR Class Rd 9-Jan-2019 EUR 0.9710 9-Jan-2018 EUR 0.3336
GBP Class Bd 9-Jan-2019 GBP 1.1465 9-Jan-2018 GBP 0.9920
GBP Class Id 9-Jan-2019 GBP 1.1753 9-Jan-2018 GBP 0.8950
GBP Class Rd 9-Jan-2019 GBP 0.8871 - -
SGD Class Id 9-Jan-2019 SGD 1.0336 9-Jan-2018 SGD 0.3694
SGD Class Rd 9-Jan-2019 SGD 0.9205 - -
USD Class Bd 9-Jan-2019 USD 1.2012 9-Jan-2018 USD 1.0239
USD Class Id 9-Jan-2019 USD 1.1513 9-Jan-2018 USD 0.7585
USD Class Md 9-Jan-2019 USD 1.2196 9-Jan-2018 USD 1.0342
USD Class Rd 9-Jan-2019 USD 1.0729 - -
CHF Class Id 8-Apr-2019 - 10-Apr-2018 CHF 0.4200
CHF Class Rd 8-Apr-2019 CHF 0.9252 10-Apr-2018 CHF 0.5931
EUR Class Bd 8-Apr-2019 EUR 1.1272 10-Apr-2018 EUR 1.0709
EUR Class Id 8-Apr-2019 EUR 1.1788 10-Apr-2018 EUR 0.8895
EUR Class Md 8-Apr-2019 EUR 0.9650 10-Apr-2018 EUR 0.9208
EUR Class Rd 8-Apr-2019 EUR 1.0393 10-Apr-2018 EUR 0.6536
GBP Class Bd 8-Apr-2019 GBP 1.1578 10-Apr-2018 GBP 1.0859
GBP Class Id 8-Apr-2019 GBP 1.1986 10-Apr-2018 GBP 0.9276
GBP Class Rd 8-Apr-2019 GBP 1.0353 10-Apr-2018 GBP 0.6753
SGD Class Id 8-Apr-2019 SGD 1.0029 10-Apr-2018 SGD 0.5322
SGD Class Rd 8-Apr-2019 SGD 1.1711 10-Apr-2018 SGD 0.5954
USD Class Bd 8-Apr-2019 USD 1.2239 10-Apr-2018 USD 1.1230
USD Class Id 8-Apr-2019 USD 1.2881 10-Apr-2018 USD 0.7218
USD Class Md 8-Apr-2019 USD 1.2395 10-Apr-2018 USD 1.1320
USD Class Rd 8-Apr-2019 USD 0.9940 10-Apr-2018 USD 0.5174
Algebris Financial Equity Fund
30 June 2019 30 June 2018
Share Class Ex-Date Rate Ex-Date Rate
GBP Class Md 9-Jan-2019 GBP 0.2983 - -
USD Class Md 9-Jan-2019 USD 0.3960 9-Jan-2018 USD 0.1543
GBP Class Md 8-Apr-2019 GBP 0.2020 10-Apr-2018 GBP 0.3105
USD Class Md 8-Apr-2019 USD 0.2701 10-Apr-2018 USD 0.3408

ALGEBRIS UCITS FUNDS PLC
Notes to the Unaudited Financial Statements (continued)
for the period from 1 January 2019 to 30 June 2019
68
6. Distributions (continued)
Algebris Macro Credit Fund
30 June 2019 30 June 2018
Share Class Ex-Date Rate Ex-Date Rate
CHF Class Bd 9-Jan-2019 CHF 0.7093 9-Jan-2018 CHF 0.7278
EUR Class Bd 9-Jan-2019 EUR 0.4706 9-Jan-2018 EUR 0.9322
EUR Class Id 9-Jan-2019 EUR 0.5937 9-Jan-2018 EUR 0.4796
EUR Class Md 9-Jan-2019 EUR 0.8220 - -
EUR Class Rd 9-Jan-2019 EUR 0.4414 9-Jan-2018 EUR 0.8008
GBP Class Id 9-Jan-2019 GBP 0.5761 - -
GBP Class Md 9-Jan-2019 GBP 0.8187 9-Jan-2018 GBP 1.3026
USD Class Md 9-Jan-2019 USD 0.8377 9-Jan-2018 USD 1.3810
CHF Class Bd 8-Apr-2019 CHF 1.0581 10-Apr-2018 CHF 0.7023
EUR Class Bd 8-Apr-2019 EUR 1.0630 10-Apr-2018 EUR 0.6066
EUR Class Id 8-Apr-2019 EUR 1.0070 10-Apr-2018 EUR 0.6397
EUR Class Md 8-Apr-2019 EUR 1.2398 - -
EUR Class Rd 8-Apr-2019 EUR 0.8870 10-Apr-2018 EUR 0.4271
GBP Class Id 8-Apr-2019 GBP 0.9376 10-Apr-2018 GBP 0.5219
GBP Class Md 8-Apr-2019 GBP 1.2235 10-Apr-2018 GBP 0.6996
USD Class Md 8-Apr-2019 USD 1.3287 10-Apr-2018 USD 0.9586
7. Taxation
Under current law and practice the Company qualifies as an investment undertaking as defined in Section 739B of
the Taxes Consolidation Act, 1997, as amended. As such, it is not chargeable to Irish tax on its income or gains.
However, Irish tax may arise on the happening of a “chargeable event”. A chargeable event includes any
distribution payments to shareholders or any encashment, redemption, cancellation or transfer of shares.
No Irish tax will arise on the Company regarding chargeable events in respect of:
(a) a shareholder who is neither Irish resident nor ordinarily resident in Ireland for tax purposes, at the time of the
chargeable event, provided appropriate valid declarations in accordance with the provisions of the Taxes
Consolidation Act, 1997, as amended, are held by the Company; and
(b) certain exempted Irish tax resident shareholders who have provided the Company with the necessary signed
statutory declarations.
Dividends, interest and capital gains (if any) received on investments made by the Company may be subject to
withholding taxes imposed by the country from which the investment income/gains are received and such taxes may
not be recoverable by the Company or its shareholders.
8. Soft commissions
There were no soft commission arrangements affecting the Company during the financial period ended 30 June
2019 (30 June 2018: Nil).

ALGEBRIS UCITS FUNDS PLC
Notes to the Unaudited Financial Statements (continued)
for the period from 1 January 2019 to 30 June 2019
69
9. Net asset value table
The following table discloses the dealing Net Asset Value, the shares in issue and Net Asset Value per Share for
each Share Class as at 30 June 2019 and 31 December 2018.
30 June 2019 Algebris Financial Credit Fund
Net Asset Value Shares in Issue
Rounded
Net Asset Value per Share
CHF Class I Shares CHF 22,498,905 147,071 CHF 152.98
CHF Class R Shares CHF 5,742,675 49,199 CHF 116.72
CHF Class Rd Shares CHF 2,536,533 26,124 CHF 97.10
CHF Class Z Shares CHF 34,621,704 303,713 CHF 113.99
EUR Class I Shares EUR 1,405,574,950 8,807,026 EUR 159.60
EUR Class Id Shares EUR 526,488,041 4,631,705 EUR 113.67
EUR Class M Shares EUR 8,031,946 48,009 EUR 167.30
EUR Class Md Shares EUR 224,335 2,188 EUR 102.55
EUR Class R Shares EUR 544,427,510 3,884,426 EUR 140.16
EUR Class Rd Shares EUR 573,961,852 5,635,999 EUR 101.84
EUR Class W Shares EUR 27,174,196 227,314 EUR 119.54
EUR Class Wd Shares EUR 47,444,868 461,487 EUR 102.81
EUR Class XXLD Shares EUR 72,824,724 715,357 EUR 101.80
EUR Class Z Shares EUR 133,615,606 1,153,760 EUR 115.81
GBP Class I Shares GBP 6,758,568 51,627 GBP 130.91
GBP Class Id Shares GBP 298,816,887 2,702,981 GBP 110.55
GBP Class M Shares GBP 102,180 794 GBP 128.71
GBP Class Md Shares GBP 1,487,220 14,150 GBP 105.11
GBP Class R Shares GBP 5,107,502 43,674 GBP 116.95
GBP Class Rd Shares GBP 13,133,028 130,868 GBP 100.35
GBP Class W Shares GBP 315,781 3,004 GBP 105.13
GBP Class Wd Shares GBP 2,562,547 25,667 GBP 99.84
GBP Class Z Shares GBP 11,698,612 100,247 GBP 116.70
GBP Class Zd Shares GBP 15,529,162 148,188 GBP 104.79
JPY Class I Shares JPY 604,350 5,700 JPY 106.03
SGD Class I Shares SGD 108,851 1,016 SGD 107.14
SGD Class Id Shares SGD 102,227 1,000 SGD 102.23
SGD Class R Shares SGD 3,495,222 30,313 SGD 115.30
SGD Class Rd Shares SGD 6,319,682 62,399 SGD 101.28
SGD Class Wd Shares SGD 671,265 6,949 SGD 96.59
USD Class I Shares USD 83,773,791 638,629 USD 131.18
USD Class Id Shares USD 98,002,499 933,477 USD 104.99
USD Class M Shares USD 59,313 417 USD 142.08
USD Class Md Shares USD 267,248 2,428 USD 110.05
USD Class R Shares USD 174,509,604 1,290,314 USD 135.25
USD Class Rd Shares USD 233,553,233 2,269,253 USD 102.92
USD Class W Shares USD 49,033,912 380,062 USD 129.02
USD Class Wd Shares USD 35,720,965 341,150 USD 104.71
USD Class XXL Shares USD 21,893,139 164,148 USD 133.37
USD Class Z Shares USD 87,524,254 710,037 USD 123.27
USD Class Zd Shares USD 8,177,095 74,724 USD 109.43

ALGEBRIS UCITS FUNDS PLC
Notes to the Unaudited Financial Statements (continued)
for the period from 1 January 2019 to 30 June 2019
70
9. Net asset value table (continued)
30 June 2019 (continued)
Algebris Financial Income Fund
Net Asset Value Shares in Issue
Rounded
Net Asset Value per Share
CHF Class B Shares CHF 135,136 974 CHF 138.70
CHF Class R Shares CHF 740,471 6,164 CHF 120.13
CHF Class Rd Shares CHF 327,094 3,999 CHF 81.80
EUR Class B Shares EUR 174,223 1,250 EUR 139.34
EUR Class Bd Shares EUR 5,507,021 50,998 EUR 107.99
EUR Class I Shares EUR 195,199,156 1,435,729 EUR 135.96
EUR Class Id Shares EUR 25,453,755 261,197 EUR 97.45
EUR Class M Shares EUR 2,839,723 19,697 EUR 144.17
EUR Class Md Shares EUR 145,888 1,577 EUR 92.54
EUR Class R Shares EUR 52,814,246 413,887 EUR 127.61
EUR Class Rd Shares EUR 43,916,760 486,092 EUR 90.35
GBP Class Bd Shares GBP 55,679 500 GBP 111.36
GBP Class I Shares GBP 425,553 4,630 GBP 91.91
GBP Class Id Shares GBP 7,606,321 76,407 GBP 99.55
GBP Class M Shares GBP 59,629 465 GBP 128.36
GBP Class R Shares GBP 1,278,774 10,571 GBP 120.96
GBP Class Rd Shares GBP 903,664 10,587 GBP 85.36
JPY Class I Shares JPY 584,846 5,700 JPY 102.60
SGD Class I Shares USD 226,745 2,500 SGD 90.70
SGD Class Id Shares USD 6,353,988 68,248 SGD 93.10
SGD Class R Shares USD 1,754,713 19,399 SGD 90.45
SGD Class Rd Shares USD 8,737,460 100,960 SGD 86.45
USD Class Bd Shares USD 1,956,970 16,566 USD 118.13
USD Class I Shares USD 18,351,346 185,686 USD 98.83
USD Class Id Shares USD 34,349,467 315,976 USD 108.71
USD Class M Shares USD 119,374 817 USD 146.07
USD Class Md Shares USD 22,115,962 183,650 USD 120.42
USD Class R Shares USD 41,159,543 310,850 USD 132.41
USD Class Rd Shares USD 41,495,770 465,131 USD 89.21
Algebris Allocation Fund
Net Asset Value Shares in Issue
Rounded
Net Asset Value per Share
CHF Class R Shares CHF 46,066 499 CHF 92.31
EUR Class B Shares EUR 1,017 10 EUR 101.71
EUR Class I Shares EUR 9,720,883 99,218 EUR 97.98
EUR Class M Shares EUR 202,374 2,000 EUR 101.19
EUR Class R Shares EUR 612,441 6,525 EUR 93.86
JPY Class B Shares JPY 126,488 1,250 JPY 101.19

ALGEBRIS UCITS FUNDS PLC
Notes to the Unaudited Financial Statements (continued)
for the period from 1 January 2019 to 30 June 2019
71
9. Net asset value table (continued)
30 June 2019 (continued)
Algebris Financial Equity Fund
Net Asset Value
Shares in
Issue
Rounded
Net Asset Value per Share
CHF Class B Shares CHF 2,948,519 22,905 CHF 128.73
CHF Class R Shares CHF 247,563 2,048 CHF 120.91
EUR Class B Shares EUR 13,924,578 130,900 EUR 106.38
EUR Class Bm Shares EUR 714,322 505 EUR 1,413.57
EUR Class I Shares EUR 17,745,403 174,345 EUR 101.78
EUR Class M Shares EUR 3,375,477 29,545 EUR 114.25
EUR Class R Shares EUR 2,359,079 25,508 EUR 92.49
EUR Class Rm Shares EUR 21 0.02 EUR 1,067.40
GBP Class B Shares GBP 4,108,231 49,595 GBP 82.84
GBP Class I Shares GBP 5,862 63 GBP 92.78
GBP Class M Shares GBP 568,912 4,897 GBP 116.18
GBP Class Md Shares GBP 2,339,747 31,689 GBP 73.83
GBP Class Mm Shares GBP 13,997 8 GBP 1,658.35
JPY Class B Shares JPY 542,527 5,700 JPY 95.18
USD Class B Shares USD 17,933,438 156,636 USD 114.49
USD Class Bm Shares USD 203,293 125 USD 1,626.34
USD Class M Shares USD 2,644,709 21,534 USD 122.82
USD Class Md Shares USD 18,222,667 184,089 USD 98.99
USD Class Mm Shares USD 43,257 18 USD 2,417.95 Algebris Macro Credit Fund
Net Asset Value Shares in Issue
Rounded
Net Asset Value per Share
CHF Class B Shares CHF 313,734 2,978 CHF 105.36
CHF Class Bd Shares CHF 48,699 500 CHF 97.40
CHF Class R Shares CHF 30,504 303 CHF 100.80
EUR Class B Shares EUR 1,036,345 9,591 EUR 108.06
EUR Class Bd Shares EUR 11,673,978 118,890 EUR 98.19
EUR Class I Shares EUR 27,604,470 260,136 EUR 106.12
EUR Class Id Shares EUR 18,455,557 192,271 EUR 95.99
EUR Class M Shares EUR 4,531,922 40,565 EUR 111.72
EUR Class Md Shares EUR 79,122 800 EUR 98.90
EUR Class R Shares EUR 176,563,725 1,684,756 EUR 104.80
EUR Class Rd Shares EUR 348,966,540 3,618,059 EUR 96.45
GBP Class B Shares GBP 16,725 150 GBP 111.69
GBP Class I Shares GBP 113,661 1,151 GBP 98.73
GBP Class Id Shares GBP 329,218 3,517 GBP 93.60
GBP Class M Shares GBP 12,389 124 GBP 99.88
GBP Class Md Shares GBP 42,718 435 GBP 98.11
GBP Class R Shares GBP 116,578 1,114 GBP 104.67
JPY Class I Shares JPY 599,410 5,700 JPY 105.16
USD Class B Shares USD 57,997 500 USD 115.99
USD Class I Shares USD 3,760,221 38,172 USD 98.51
USD Class M Shares USD 3,954,758 34,975 USD 113.08

ALGEBRIS UCITS FUNDS PLC
Notes to the Unaudited Financial Statements (continued)
for the period from 1 January 2019 to 30 June 2019
72
9. Net asset value table (continued)
30 June 2019 (continued)
Algebris Macro Credit Fund (continued)
Net Asset Value Shares in Issue
Rounded
Net Asset Value per Share
USD Class Md Shares USD 1,152,527 10,734 USD 107.38
USD Class R Shares USD 674,916 6,199 USD 108.87
Algebris Core Italy Fund
Net Asset Value Shares in Issue
Rounded
Net Asset Value per Share
EUR Class Eb Shares EUR 21,258,665 215,858 EUR 98.48
EUR Class I Shares EUR 1,018 10 EUR 101.76
EUR Class M Shares EUR 20,546,934 206,850 EUR 99.33
EUR Class R Shares EUR 405,202 4,240 EUR 95.56
JPY Class I Shares JPY 127,396 1,250 JPY 101.92
USD Class I Shares USD 1,119 11 USD 101.75
Algebris Quant Arbitrage Fund
Net Asset Value Shares in Issue
Rounded
Net Asset Value per Share
EUR Class Eb Shares EUR 5,455,384 55,350 EUR 98.56
EUR Class I Shares EUR 1,002 10 EUR 100.24
EUR Class M Shares EUR 11,747,753 118,550 EUR 99.10
EUR Class R Shares EUR 1,002 10 EUR 100.21
JPY Class I Shares JPY 125,502 1,250 JPY 100.40
USD Class Eb Shares USD 101,627 1,000 GBP 101.63
USD Class I Shares USD 1,102 11 GBP 100.21

ALGEBRIS UCITS FUNDS PLC
Notes to the Unaudited Financial Statements (continued)
for the period from 1 January 2019 to 30 June 2019
73
9. Net asset value table (continued)
31 December 2018 (continued)
Algebris Financial Credit Fund
Net Asset Value Shares in Issue
Rounded
Net Asset Value per Share
CHF Class I Shares CHF 24,216,818 172,568 CHF 140.33
CHF Class R Shares CHF 4,439,724 41,355 CHF 107.36
CHF Class Rd Shares CHF 1,655,631 17,975 CHF 92.11
CHF Class Z Shares CHF 27,420,671 262,087 CHF 104.62
EUR Class I Shares EUR 1,410,399,560 9,641,538 EUR 146.28
EUR Class Id Shares EUR 484,264,262 4,507,411 EUR 107.44
EUR Class M Shares EUR 6,988,646 45,778 EUR 152.67
EUR Class Md Shares EUR 211,988 2,188 EUR 96.91
EUR Class R Shares EUR 516,938,406 4,014,442 EUR 128.77
EUR Class Rd Shares EUR 521,736,206 5,408,292 EUR 96.47
EUR Class W Shares EUR 26,315,869 239,469 EUR 109.89
EUR Class Wd Shares EUR 43,471,662 445,686 EUR 97.54
EUR Class XXLD Shares EUR 68,720,663 715,357 EUR 96.06
EUR Class Z Shares EUR 137,459,132 1,295,712 EUR 106.09
GBP Class I Shares GBP 5,903,363 49,399 GBP 119.50
GBP Class Id Shares GBP 309,650,615 2,966,314 GBP 104.39
GBP Class M Shares GBP 127,336 1,090 GBP 116.85
GBP Class Md Shares GBP 1,368,184 14,000 GBP 97.73
GBP Class R Shares GBP 3,825,500 35,739 GBP 107.04
GBP Class Rd Shares GBP 10,679,404 112,988 GBP 94.52
GBP Class W Shares GBP 288,573 3,004 GBP 96.08
GBP Class Wd Shares GBP 2,313,309 24,631 GBP 93.92
GBP Class Z Shares GBP 10,329,025 97,193 GBP 106.27
GBP Class Zd Shares GBP 11,275,048 114,542 GBP 98.44
JPY Class I Shares JPY 555,325 5,700 JPY 97.43
SGD Class I Shares SGD 99,065 1,016 SGD 97.51
SGD Class R Shares SGD 2,713,396 25,824 SGD 105.07
SGD Class Rd Shares SGD 5,782,743 60,715 SGD 95.25
SGD Class Wd Shares SGD 403,148 4,449 SGD 90.61
USD Class I Shares USD 101,639,187 854,488 USD 118.95
USD Class Id Shares USD 78,858,268 800,076 USD 98.56
USD Class M Shares USD 53,301 417 USD 127.68
USD Class Md Shares USD 2,995,821 29,016 USD 103.25
USD Class R Shares USD 174,921,824 1,423,734 USD 122.86
USD Class Rd Shares USD 204,322,321 2,117,712 USD 96.48
USD Class W Shares USD 48,001,428 410,980 USD 116.80
USD Class Wd Shares USD 30,524,204 311,991 USD 97.84
USD Class XXL Shares USD 19,722,484 164,148 USD 120.15
USD Class Z Shares USD 84,631,781 761,009 USD 111.21
USD Class Zd Shares USD 4,538,269 44,852 USD 101.18

ALGEBRIS UCITS FUNDS PLC
Notes to the Unaudited Financial Statements (continued)
for the period from 1 January 2019 to 30 June 2019
74
9. Net asset value table (continued)
31 December 2018 (continued)
Algebris Financial Income Fund
Net Asset Value Shares in Issue
Rounded
Net Asset Value per Share
CHF Class B Shares CHF 276,925 2,254 CHF 122.88
CHF Class I Shares CHF 197,043 2,500 CHF 78.82
CHF Class Id Shares CHF 232,101 2,981 CHF 77.86
CHF Class R Shares CHF 700,648 6,539 CHF 107.15
CHF Class Rd Shares CHF 1,172,539 15,700 CHF 74.68
EUR Class B Shares EUR 746,011 6,048 EUR 123.35
EUR Class Bd Shares EUR 6,748,036 68,967 EUR 97.84
EUR Class I Shares EUR 122,256,975 1,013,784 EUR 120.59
EUR Class Id Shares EUR 34,254,609 387,194 EUR 88.47
EUR Class M Shares EUR 1,002,242 7,872 EUR 127.32
EUR Class Md Shares EUR 131,755 1,577 EUR 83.57
EUR Class R Shares EUR 57,947,884 509,714 EUR 113.69
EUR Class Rd Shares EUR 50,058,588 607,725 EUR 82.37
GBP Class Bd Shares GBP 50,074 500 GBP 100.15
GBP Class I Shares GBP 374,602 4,622 GBP 81.06
GBP Class Id Shares GBP 10,150,755 112,785 GBP 90.00
GBP Class M Shares GBP 43,617 387 GBP 112.75
GBP Class R Shares GBP 1,161,869 10,842 GBP 107.17
GBP Class Rd Shares GBP 1,135,435 14,672 GBP 77.39
JPY Class I Shares JPY 517,504 5,700 JPY 90.79
SGD Class I Shares SGD 198,839 2,500 SGD 79.54
SGD Class Id Shares SGD 6,164,909 73,795 SGD 83.54
SGD Class R Shares SGD 2,035,686 25,538 SGD 79.71
SGD Class Rd Shares SGD 12,214,118 156,206 SGD 78.19
USD Class Bd Shares USD 5,843,287 55,487 USD 105.31
USD Class I Shares USD 22,795,896 264,325 USD 86.24
USD Class Id Shares USD 47,726,294 491,072 USD 97.19
USD Class M Shares USD 103,776 817 USD 126.98
USD Class Md Shares USD 19,644,199 183,650 USD 106.97
USD Class R Shares USD 46,873,409 403,602 USD 116.14
USD Class Rd Shares USD 51,227,663 639,075 USD 80.16
Algebris Allocation Fund
Net Asset Value Shares in Issue
Rounded
Net Asset Value per Share
CHF Class R Shares CHF 113,500 1,292 CHF 87.83
EUR Class I Shares EUR 11,146,424 120,116 EUR 92.80
EUR Class R Shares EUR 796,549 8,925 EUR 89.25
GBP Class B Shares GBP 37,995 400 GBP 94.99
USD Class R Shares USD 70,265 800 USD 87.86

ALGEBRIS UCITS FUNDS PLC
Notes to the Unaudited Financial Statements (continued)
for the period from 1 January 2019 to 30 June 2019
75
9. Net asset value table (continued)
31 December 2018 (continued)
Algebris Financial Equity Fund
Net Asset Value Shares in Issue
Rounded
Net Asset Value per Share
CHF Class B Shares CHF 3,015,667 26,000 CHF 115.99
CHF Class R Shares CHF 192,203 1,755 CHF 109.50
EUR Class B Shares EUR 16,311,707 170,292 EUR 95.79
EUR Class Bm Shares EUR 643,222 505 EUR 1,272.87
EUR Class I Shares EUR 19,317,973 210,516 EUR 91.76
EUR Class M Shares EUR 1,692,575 16,533 EUR 102.37
EUR Class R Shares EUR 2,312,855 27,636 EUR 83.69
EUR Class Rm Shares EUR 47,962 50 EUR 959.44
GBP Class B Shares GBP 2,917,631 39,328 GBP 74.19
GBP Class I Shares GBP 5,639 68 GBP 83.18
GBP Class M Shares GBP 425,105 4,105 GBP 103.57
GBP Class Md Shares GBP 2,095,243 31,618 GBP 66.27
GBP Class Mm Shares GBP 12,476 8 GBP 1,478.16
JPY Class B Shares JPY 484,571 5,700 JPY 85.01
USD Class B Shares USD 15,274,489 150,523 USD 101.48
USD Class Bm Shares USD 180,121 125 USD 1,440.96
USD Class M Shares USD 2,331,786 21,534 USD 108.29
USD Class Md Shares USD 17,800,230 202,489 USD 87.91
USD Class Mm Shares USD 38,139 18 USD 2,131.88
Algebris Macro Credit Fund
Net Asset Value Shares in Issue
Rounded
Net Asset Value per Share
CHF Class B Shares CHF 282,164 2,978 CHF 94.76
CHF Class Bd Shares CHF 98,224 1,100 CHF 89.29
CHF Class I Shares CHF 86,797 970 CHF 89.48
CHF Class R Shares CHF 27,536 303 CHF 90.99
EUR Class B Shares EUR 6,121,129 63,098 EUR 97.01
EUR Class Bd Shares EUR 37,667,450 420,382 EUR 89.60
EUR Class I Shares EUR 44,448,494 466,222 EUR 95.34
EUR Class Id Shares EUR 16,873,883 192,271 EUR 87.76
EUR Class M Shares EUR 5,005,742 50,093 EUR 99.93
EUR Class Md Shares EUR 72,343 800 EUR 90.43
EUR Class R Shares EUR 190,249,726 2,014,646 EUR 94.43
EUR Class Rd Shares EUR 395,495,687 4,485,465 EUR 88.17
GBP Class B Shares GBP 1,900,910 19,150 GBP 99.27
GBP Class I Shares GBP 54,045 613 GBP 88.17
GBP Class Id Shares GBP 255,700 3,007 GBP 85.04
GBP Class M Shares GBP 9,846 111 GBP 88.82

ALGEBRIS UCITS FUNDS PLC
Notes to the Unaudited Financial Statements (continued)
for the period from 1 January 2019 to 30 June 2019
76
9. Net asset value table (continued)
31 December 2018 (continued)
Algebris Macro Credit Fund (continued)
Net Asset Value Shares in Issue
Rounded
Net Asset Value per Share
GBP Class Md Shares GBP 38,832 435 GBP 89.18
GBP Class R Shares GBP 135,627 1,446 GBP 93.78
JPY Class I Shares JPY 542,436 5,700 JPY 95.16
USD Class B Shares USD 358,279 3,500 USD 102.37
USD Class I Shares USD 217,279 2,490 USD 87.26
USD Class M Shares USD 3,483,673 34,975 USD 99.61
USD Class Md Shares USD 1,037,210 10,734 USD 96.63
USD Class R Shares USD 740,173 7,660 USD 96.62
Algebris Core Italy Fund
Net Asset Value Shares in Issue
Rounded
Net Asset Value per Share
EUR Class EB Shares EUR 17,892,657 201,192 EUR 88.93
EUR Class M Shares EUR 17,797,368 198,900 EUR 89.48
EUR Class R Shares EUR 366,801 4,240 EUR 86.50
Algebris Quant Arbitrage Fund
Net Asset Value Shares in Issue
Rounded
Net Asset Value per Share
EUR Class EB Shares EUR 355,084 3,599 EUR 98.66
EUR Class M Shares EUR 9,890,511 99,950 EUR 98.95
GBP Class EB Shares GBP 1,645,549 16,394 GBP 100.38
GBP Class M Shares GBP 19,845 199 GBP 99.93
USD Class EB Shares USD 100,303 1,000 USD 100.30

ALGEBRIS UCITS FUNDS PLC
Notes to the Unaudited Financial Statements (continued)
for the period from 1 January 2019 to 30 June 2019
77
10. Exchange rates
The following exchange rates were used to translate assets and liabilities into the functional currency Euro for the
Sub-Funds:
Currenc 30 June 2019 31 December 2018
Swiss francs 0.9010 0.8881
Euro 1.0000 1.0000
Japanese Yen 0.0082 0.0080
Pound Sterling 1.1165 1.1124
Singapore Dollar 0.6501 0.6396
United States Dollar 0.8795 0.8718
11. Related & connected parties
The below table provides an analysis of related party transactions for the period ended 30 June 2019.
Name Relationship Transaction type Fees paid
Algebris (UK) Limited Investment Manager,
Promoter
Investment management
services
See note 5
The Investment Manager is a subsidiary of Algebris Investments (Luxembourg) S.a.r.l. Alexander Lasagna,
Director of the Company, is also a Director of both the Investment Manager and Algebris Investments
(Luxembourg) S.a.r.l. Alexander Lasagna holds 31,796 shares in Algebris Financial Equity Fund.
Fees paid to the Directors and the Company Secretary for the financial period ended 30 June 2019 are included in
Note 5 of these financial statements.
Algebris Investments (Asia) PTE LTD, a subsidiary of Algebris Investments (Luxembourg) S.a.r.l. holds 28,348
shares in Algebris Financial Credit Fund, 5,700 shares in Algebris Financial Income Fund, 10 shares in Algebris
Allocation Fund, 19,410 shares in Algebris Financial Equity Fund, 5,700 shares in Algebris Macro Credit Fund,
200,023 shares in Algebris Core Italy Fund and hold 100,050 shares in Algebris Quant Arbitrage Fund.
In accordance with the requirements of UCITS Regulations, all transactions carried out with the Company by the
promoter, manager, depositary, investment adviser and associates/group companies (“connected parties”) must be
carried out as if negotiated at arm’s length and be in the best interests of shareholders. The Directors are satisfied
that there are arrangements in place to ensure that the obligations set out in the UCITS Notices are applied to all
transactions with connected parties and transactions with connected parties entered into during the period
complied with the obligations set out in the UCITS Notices.
Cross Sub-Fund Investments
For Algebris Allocation Fund, as at 30 June 2019, the cross Sub-Fund investments were as follows –
Currenc EUR
Algebris UCITS Funds Plc - Algebris Financial Credit Fund Class M Accumulating 1,895,904
Algebris UCITS Funds Plc - Algebris Financial Income Fund Class M Accumulating 1,774,068
Algebris UCITS Funds Plc - Algebris Macro Credit Fund Class M Accumulating 857,857
Algebris UCITS Funds Plc - Algebris Core Italy Fund Class M Accumulating 785,460
Algebris UCITS Funds Plc - Algebris Quant Arbitrage Fund Class M Accumulating 1,844,748
Total 7,158,037
There was net gain on financial assets and liabilities at fair value through profit & loss of EUR 254,058 due to
such cross holdings.

ALGEBRIS UCITS FUNDS PLC
Notes to the Unaudited Financial Statements (continued)
for the period from 1 January 2019 to 30 June 2019
78
12. Litigation
On 6 June 2017, the Single Resolution Board (the European Banking Union's bank resolution authority) (the
“SRB”) adopted a resolution plan with respect to Banco Popular Español S.A. (“Banco Popular”), citing a
“significant deterioration of the liquidity situation of the bank” (the “Resolution”). As part of the Resolution,
Banco Popular’s outstanding AT1 securities were converted to equity and written down, while its Tier 2 securities
were converted to equity, written down and transferred to Banco Santander, S.A. (“Santander”) for one Euro. In
the wake of the Resolution (and without conceding its validity), it was decided that the net asset value of Algebris
Financial Credit Fund, Algebris Macro Credit Fund, Algebris Financial Income Fund and the Algebris Financial
Equity Fund (the “Impacted Funds”) should be reduced.
Algebris (UK) Limited, as Investment Manager on behalf of the Impacted Funds, has joined a group of affected
bondholders (the “Bondholders”) that have jointly appointed the law firm Quinn Emanuel Urquhart & Sullivan
UK LLP (“Quinn Emanuel”) to pursue various legal claims and actions in an effort to recover losses suffered by
the Bondholders in connection with the Resolution.
To date, Quinn Emanuel (acting on behalf of the Bondholders, including the Impacted Funds) has, inter alia, taken
the following actions:
(i) appointed (i) Andersen Tax and Legal and (ii) SLJ Abogados to advise the Bondholders with respect to their
rights under Spanish law;
(ii) retained experts to assess, inter alia, the value of Banco Popular at the time of the Resolution, and
allegations of improper conduct at or involving Banco Popular prior to the Resolution;
(iii) filed multiple applications to access critical documents from the SRB, the European Central Bank and the
European Commission (“EC”), and Santander;
(iv) filed actions for annulment against both the SRB and the EC before the General Court of the European
Union challenging the Resolution;
(v) filed an administrative claim in Spain challenging the conduct of the Spanish National Resolution Authority
(the Fondo de reestructuración ordenada bancaria) in giving effect to the Resolution in Spain;
(vi) filed writs joining the Bondholders as “aggrieved parties” in ongoing criminal proceedings in Spain
concerning allegations of improper conduct at and involving Banco Popular prior to the Resolution;
(vii) filed written submissions challenging the SRB’s preliminary decision not to grant affected creditors of
Banco Popular (including the Bondholders) compensation pursuant to the “no creditor worse off”
principle; and
(viii) filed an action for annulment against the SRB challenging its failure to commission definitive, ex-post
versions of the valuations it was required to conduct/commission prior to adopting the Resolution.
As at 30 June 2019, the Impacted Funds account for approximately 12.64% of the Bondholders’ holdings in the
affected AT1 and Tier 2 securities. As funds join or leave the Bondholder group, that figure will change.
Associated legal costs will be borne by the Impacted Funds.
It is not yet possible to ascertain the likely outcome of the various claims and actions being pursued by the
Bondholders or the anticipated recovery. As a result, with respect to the AT1 bonds, no fair value has been
recognised in these financial statements. The claims for the Tier 2 positions are being actively traded and therefore
such positions have been valued at the average of available broker quotes.

ALGEBRIS UCITS FUNDS PLC
Notes to the Unaudited Financial Statements (continued)
for the period from 1 January 2019 to 30 June 2019
79
13. Significant events during the period
The Algebris Asset Allocation Fund was renamed the Algebris Allocation Fund and the Supplement to the
Prospectus dated 5 December 2018 was revised and issued with an effective date of 21 February 2019. The revised
investment objective for the Algebris Allocation Fund is to achieve positive absolute returns, primarily from capital
appreciation on investments in collective investment schemes, over an investment cycle of approximately 3 to 5
years. To achieve the investment objective, the assets will be invested primarily in a range of underlying collective
investment schemes which comply with the Central Bank’s requirements as regards investment by a UCITS in other
Collective Investment Schemes.
The Algebris Tail Risk Fund was renamed the Algebris Quant Arbitrage Fund and the Supplement to the Prospectus
dated 5 December 2018 was revised and issued with effective date 10 May 2019. The revised investment objective
for the Algebris Quant Arbitrage Fund is to generate positive returns from capital appreciation over a broad range of
market environments by investing in a portfolio of equity and equity-related securities on a global basis whilst
keeping a net market exposure close to zero. The Fund would seek to achieve its investment objective by taking
long and short exposure to equity and equity-related securities globally, either directly or indirectly through the use
of financial derivative instruments (“FDI”). For the avoidance of doubt, the Fund may only take synthetic short
exposure to these asset classes through the use of FDIs but may take long exposure through direct investment and/or
through the use of FDIs.
Under the Algebris Quant Arbitrage Fund, the management fee in respect of Class EB shares would be 0.5% per
annum, Class I shares would be 0.75% per annum and Class R shares would be 1.5% per annum. The performance
fee in respect of Class EB would be 10% and for Class I and R shares would be 15% of the excess of the Net Asset
Value per share of the relevant Class EB, Class I and Class R shares (after the deduction of the management fee and
all other payments and expenses but before the deduction of any accrued performance fee) at the end of a
performance period over the High Water Mark.
On 1 April 2019, the Depositary merged into HSBC France. Its business operates from a Dublin branch of HSBC
France.
Supplements to the Prospectus dated 5 December 2018 were issued for Algebris Core Italy Fund with an effective
date of 28 February 2019.
14. Significant events subsequent to the period end
Supplements to the Prospectus dated 5 December 2018 were issued for Algebris Financial Income Fund and Algebris
Financial Credit Fund with an effective date 12 June 2019 and for Algebris Macro Credit Fund with an effective date
9 August 2019.
15. Approval of financial statements
The financial statements were approved and authorised for issue by the Board of Directors on 28 August 2019.

ALGEBRIS UCITS FUNDS PLC
Algebris Financial Credit Fund
Unaudited Schedule of Investments
as at 30 June 2019
80
Holdings Financial Assets at Fair Value Through Profit or Loss Fair Value % of Net
EUR Asset Value
Equity Securities
United States 15,953,826 0.35
24,186 First Tennessee Bank (144A) (Preferred) Perpetual 15,953,826 0.35
Total Equity Securities 15,953,826 0.35
Fixed Income Securities
Austria 32,656,500 0.73
32,800,000 Bawag Group 32,656,500 0.73
Denmark 40,450,680 0.90
45,165,000 Danske Bank Perpetual 40,450,680 0.90
Finland 36,545,295 0.81
39,200,000 Nordea Bank Abp Perpetual 36,545,295 0.81
France 490,514,933 10.90
60,000,000 BNP Paribas Perpetual (AX7277939) 55,156,464 1.22
15,900,000 BNP Paribas Perpetual (EG5801956) 15,198,484 0.34
11,500,000 BNP Paribas VAR Perpetual 11,262,010 0.25
134,100,000 Credit Agricole 7.875% Perpetual 130,250,965 2.89
68,630,000 Credit Agricole VAR Perpetual 69,980,568 1.55
62,544,000 Societe Generale 7.875% Perpetual 59,236,649 1.32
38,500,000 Societe Generale Perpetual 35,382,076 0.79
54,700,000 Societe Generale Perpetual (LUX) 47,528,142 1.06
68,355,000 Societe Generale VAR Perpetual 66,519,575 1.48
Germany 89,553,076 1.99
17,200,000 Aareal Bank 7.625% Perpetual 17,984,750 0.40
18,080,000 Deutsche Bank 24/05/2028 14,587,872 0.32
74,400,000 Deutsche Bank 01/12/2032 56,980,454 1.27
Italy 703,021,329 15.63
9,605,000 Credito Valtellinese 4.7% 04/08/2021 9,646,205 0.21
5,125,000 Credito Valtellinese VAR 12/04/2027 5,311,089 0.12
87,877,000 Intesa Sanpaolo (144A) 5.71% 15/01/2026 78,064,455 1.73
158,978,000 Intesa Sanpaolo (144A) Perpetual 137,922,154 3.07
96,600,000 Intesa Sanpaolo Perpetual (AM0179896 Corporation) 109,027,590 2.42
70,975,000 Unicredit 19/06/2032 59,893,037 1.33
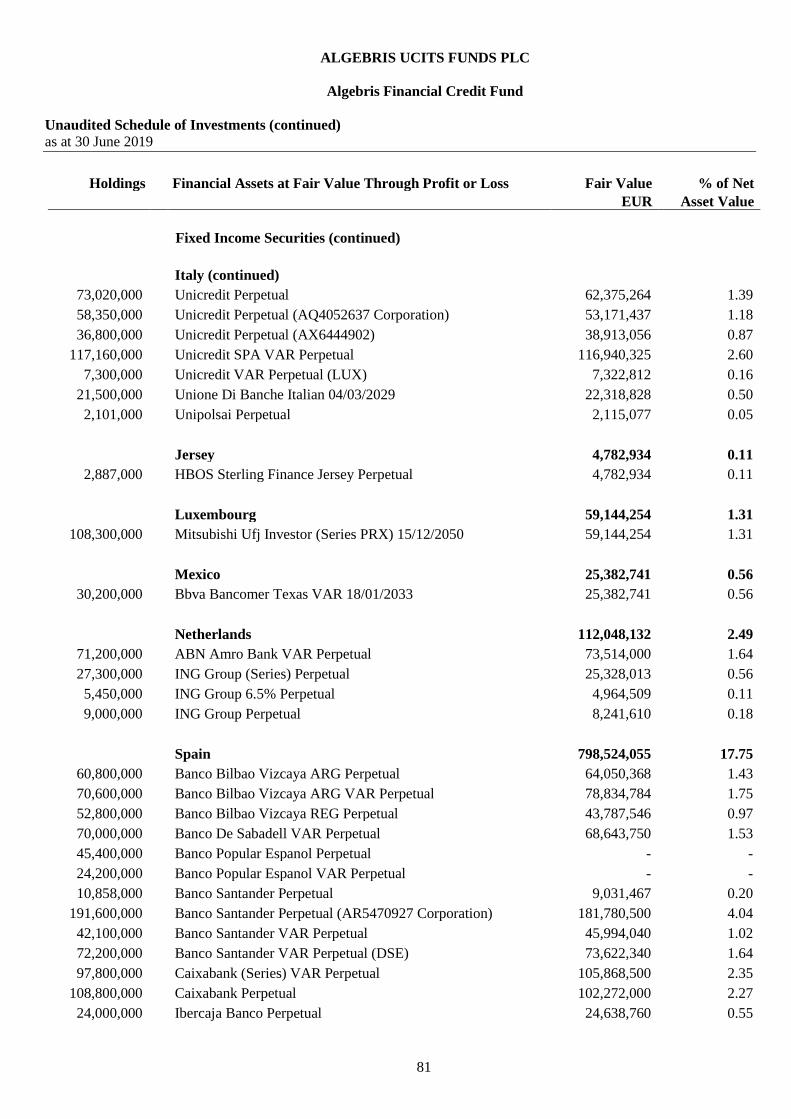
ALGEBRIS UCITS FUNDS PLC
Algebris Financial Credit Fund
Unaudited Schedule of Investments (continued)
as at 30 June 2019
81
Holdings Financial Assets at Fair Value Through Profit or Loss Fair Value % of Net
EUR Asset Value
Fixed Income Securities (continued)
Italy (continued)
73,020,000 Unicredit Perpetual 62,375,264 1.39
58,350,000 Unicredit Perpetual (AQ4052637 Corporation) 53,171,437 1.18
36,800,000 Unicredit Perpetual (AX6444902) 38,913,056 0.87
117,160,000 Unicredit SPA VAR Perpetual 116,940,325 2.60
7,300,000 Unicredit VAR Perpetual (LUX) 7,322,812 0.16
21,500,000 Unione Di Banche Italian 04/03/2029 22,318,828 0.50
2,101,000 Unipolsai Perpetual 2,115,077 0.05
Jersey 4,782,934 0.11
2,887,000 HBOS Sterling Finance Jersey Perpetual 4,782,934 0.11
Luxembourg 59,144,254 1.31
108,300,000 Mitsubishi Ufj Investor (Series PRX) 15/12/2050 59,144,254 1.31
Mexico 25,382,741 0.56
30,200,000 Bbva Bancomer Texas VAR 18/01/2033 25,382,741 0.56
Netherlands 112,048,132 2.49
71,200,000 ABN Amro Bank VAR Perpetual 73,514,000 1.64
27,300,000 ING Group (Series) Perpetual 25,328,013 0.56
5,450,000 ING Group 6.5% Perpetual 4,964,509 0.11
9,000,000 ING Group Perpetual 8,241,610 0.18
Spain 798,524,055 17.75
60,800,000 Banco Bilbao Vizcaya ARG Perpetual 64,050,368 1.43
70,600,000 Banco Bilbao Vizcaya ARG VAR Perpetual 78,834,784 1.75
52,800,000 Banco Bilbao Vizcaya REG Perpetual 43,787,546 0.97
70,000,000 Banco De Sabadell VAR Perpetual 68,643,750 1.53
45,400,000 Banco Popular Espanol Perpetual - -
24,200,000 Banco Popular Espanol VAR Perpetual - -
10,858,000 Banco Santander Perpetual 9,031,467 0.20
191,600,000 Banco Santander Perpetual (AR5470927 Corporation) 181,780,500 4.04
42,100,000 Banco Santander VAR Perpetual 45,994,040 1.02
72,200,000 Banco Santander VAR Perpetual (DSE) 73,622,340 1.64
97,800,000 Caixabank (Series) VAR Perpetual 105,868,500 2.35
108,800,000 Caixabank Perpetual 102,272,000 2.27
24,000,000 Ibercaja Banco Perpetual 24,638,760 0.55

ALGEBRIS UCITS FUNDS PLC
Algebris Financial Credit Fund
Unaudited Schedule of Investments (continued)
as at 30 June 2019
82
Holdings Financial Assets at Fair Value Through Profit or Loss Fair Value % of Net
EUR Asset Value
Fixed Income Securities (continued)
Switzerland 340,601,232 7.57
45,500,000 Credit Suisse Group Perpetual 41,780,965 0.93
88,500,000 Credit Suisse Group 7.5% Perpetual 85,850,449 1.91
27,600,000 Credit Suisse Group VAR Perpetual 26,016,338 0.58
50,600,000
Credit Suisse Group VAR Perpetual (AU3887497
Corporation) 47,931,373 1.07
15,800,000 UBS Group Perpetual 15,259,854 0.34
64,650,000 UBS Group Perpetual (JK4458820) 59,322,772 1.31
8,300,000 UBS Group Perpetual (QZ1261762) 7,683,376 0.17
60,200,000 UBS Group Perpetual (UV4180070) 56,756,105 1.26
United Kingdom 1,007,206,114 22.38
4,675,000 Bank of Scotland (Series B) Perpetual 6,392,689 0.14
5,000,000 Barclays 07/02/2028 4,930,250 0.11
28,900,000 Barclays 20/06/2030 26,009,238 0.58
36,100,000 Barclays Perpetual 32,560,009 0.72
33,900,000 Barclays Perpetual (AM6775317) 39,553,801 0.88
117,950,000 Barclays Perpetual (AO6220567) 128,238,272 2.85
16,900,000 Barclays Perpetual (AX7752402) 15,618,602 0.35
26,100,000 Barclays Perpetual (AZ0489668) 30,525,781 0.68
3,500,000 Barclays Perpetual (QZ3177313) 3,225,833 0.07
67,766,000 Barclays Perpetual (UV4299359) 80,392,037 1.79
12,800,000 HSBC Holdings (Series) Perpetual 11,539,138 0.26
51,932,000 HSBC Holdings Perpetual (AO1326237) 54,723,345 1.22
33,300,000 HSBC Holdings Perpetual (AU6128063) 39,121,063 0.87
64,800,000 HSBC Holdings VAR Perpetual (DSE) 59,627,968 1.32
5,000,000 Lloyds Banking Group Perpetual 4,596,086 0.10
70,800,000 Lloyds Banking Group Perpetual (GBP) 86,313,439 1.92
34,750,000 Lloyds Banking Group VAR Perpetual 44,110,275 0.98
18,600,000 Lloyds Banking Group (144A) VAR Perpetual 17,309,042 0.38
43,500,000 Lloyds Banking Group (144A) VAR Perpetual (LSE) 40,062,658 0.89
50,676,400 Nationwide Building Society Perpetual 85,414,997 1.90
69,346,000 Royal Bank of Scotland Group Perpetual (BYRQWJ1) 66,001,596 1.47
20,450,000 Royal Bank of Scotland Group VAR Perpetual 19,355,556 0.43
17,500,000 Royal Bank of Scotland Group (Series U) Perpetual 14,643,821 0.32
18,400,000 Santander UK Group Holdings VAR Perpetual 21,545,771 0.48
21,800,000 Santander UK Group Perpetual 25,953,013 0.58
500,000 Scottish Widows 5.5% 16/06/2023 625,111 0.01
38,900,000 Standard Chartered Perpetual (LSE) 28,853,741 0.64
21,400,000 Standard Chartered Perpetual (QZ2259237 Corporation) 19,962,982 0.44

ALGEBRIS UCITS FUNDS PLC
Algebris Financial Credit Fund
Unaudited Schedule of Investments (continued)
as at 30 June 2019
83
Holdings Financial Assets at Fair Value Through Profit or Loss Fair Value % of Net
EUR Asset Value
Fixed Income Securities (continued)
United States 102,330,245 2.27
21,200,000 American International Group (Series A-9) 01/04/2048 19,018,470 0.42
31,800,000 Discover Financial Services (Series C) Perpetual 27,252,488 0.61
25,902,000 Dresdner Funding Trust I 8.151% 30/06/2031 30,784,538 0.68
325,000 HVB Funding Trust I (144A) 8.741% 30/06/2031 383,026 0.01
3,380,000 HVB Funding Trust III (144A) 9% 22/10/2031 3,969,612 0.09
26,000,000 Voya Financial (144A) 23/01/2048 20,922,111 0.46
Total Fixed Income Securities 3,842,761,520 85.40
Options
1,192 DAX Index 11350 Put 20/09/2019 495,872 0.01
2,970
Dow Jones EURO STOXX 50 (Price) Index 3175 Put
16/08/2019 279,180 0.01
188,200,000 GBP Put / CHF Call 1.15 19/09/2019 201,527 -
139,300,000 GBP Put / USD Call 1.165 19/12/2019 746,457 0.02
143 Nasdaq 100 Stock Index 6925 Put 16/08/2019 557,159 0.01
135 Nasdaq 100 Stock Index 6950 Put 19/07/2019 152,691 -
496 S&P 500 Index 2540 Put 20/09/2019 523,483 0.01
765 S&P 500 Index 2775 Put 19/07/2019 400,330 0.01
Total Options 3,356,699 0.07
Forward Contracts*
Buy EUR 1,901,181,339 Sell USD 2,141,007,000 17/07/2019 20,899,024 0.47
Buy EUR 584,083,757 Sell GBP 521,558,000 17/07/2019 2,082,889 0.05
Buy EUR 33,909,470 Sell USD 38,187,000 17/07/2019 372,755 0.01
Buy CHF 33,748,700 Sell EUR 30,110,035 17/07/2019 302,031 0.01
Buy CHF 23,939,769 Sell EUR 21,358,668 17/07/2019 214,247 -
Buy CHF 6,311,108 Sell EUR 5,630,667 17/07/2019 56,481 -
Buy EUR 7,075,979 Sell GBP 6,318,500 17/07/2019 25,233 -
Buy CHF 1,994,100 Sell EUR 1,779,103 17/07/2019 17,846 -
Buy SGD 5,833,260 Sell EUR 3,780,457 17/07/2019 7,124 -
Buy SGD 3,417,300 Sell EUR 2,214,706 17/07/2019 4,174 -
Buy USD 2,080,000 Sell EUR 1,823,378 17/07/2019 3,327 -
Buy CHF 498,000 Sell EUR 446,467 17/07/2019 2,298 -
Buy CHF 341,400 Sell EUR 305,583 17/07/2019 2,064 -
Buy USD 750,000 Sell EUR 656,687 17/07/2019 1,981 -

ALGEBRIS UCITS FUNDS PLC
Algebris Financial Credit Fund
Unaudited Schedule of Investments (continued)
as at 30 June 2019
84
Holdings Financial Assets at Fair Value Through Profit or Loss Fair Value % of Net
EUR Asset Value
Forward Contracts* (continued)
Buy EUR 131,858 Sell USD 147,900 17/07/2019 1,969 -
Buy CHF 303,900 Sell EUR 272,017 17/07/2019 1,837 -
Buy EUR 164,366 Sell USD 185,100 17/07/2019 1,807 -
Buy EUR 180,018 Sell USD 203,200 17/07/2019 1,563 -
Buy EUR 275,542 Sell USD 312,100 17/07/2019 1,449 -
Buy EUR 122,453 Sell USD 137,900 17/07/2019 1,346 -
Buy EUR 84,634 Sell USD 95,000 17/07/2019 1,203 -
Buy EUR 78,277 Sell USD 87,800 17/07/2019 1,169 -
Buy EUR 202,088 Sell USD 228,900 17/07/2019 1,063 -
Buy EUR 89,956 Sell USD 101,300 17/07/2019 992 -
Buy EUR 269,892 Sell GBP 241,000 17/07/2019 962 -
Buy EUR 133,774 Sell GBP 119,100 17/07/2019 872 -
Buy CHF 249,900 Sell EUR 224,325 17/07/2019 868 -
Buy SGD 654,600 Sell EUR 424,237 17/07/2019 799 -
Buy USD 297,900 Sell EUR 260,836 17/07/2019 787 -
Buy EUR 137,550 Sell USD 155,800 17/07/2019 723 -
Buy USD 250,000 Sell EUR 218,896 17/07/2019 660 -
Buy CHF 142,500 Sell EUR 127,754 17/07/2019 657 -
Buy EUR 124,518 Sell GBP 111,000 17/07/2019 654 -
Buy EUR 43,150 Sell USD 48,400 17/07/2019 644 -
Buy EUR 122,274 Sell GBP 109,000 17/07/2019 642 -
Buy CHF 69,500 Sell EUR 62,030 17/07/2019 599 -
Buy EUR 65,292 Sell USD 73,700 17/07/2019 567 -
Buy EUR 106,345 Sell GBP 94,800 17/07/2019 558 -
Buy USD 210,600 Sell EUR 184,398 17/07/2019 556 -
Buy CHF 157,700 Sell EUR 141,561 17/07/2019 548 -
Buy EUR 102,499 Sell USD 116,100 17/07/2019 537 -
Buy USD 199,100 Sell EUR 174,328 17/07/2019 526 -
Buy EUR 679,303 Sell USD 772,900 17/07/2019 524 -
Buy GBP 3,160,000 Sell EUR 3,525,729 17/07/2019 481 -
Buy CHF 76,400 Sell EUR 68,385 17/07/2019 462 -
Buy EUR 85,901 Sell USD 97,300 17/07/2019 450 -
Buy EUR 38,805 Sell USD 43,700 17/07/2019 427 -
Buy EUR 76,191 Sell USD 86,300 17/07/2019 401 -
Buy USD 250,000 Sell EUR 219,164 17/07/2019 392 -
Buy EUR 57,621 Sell GBP 51,300 17/07/2019 376 -
Buy GBP 250,000 Sell EUR 278,624 17/07/2019 348 -
Buy EUR 30,991 Sell USD 34,900 17/07/2019 341 -

ALGEBRIS UCITS FUNDS PLC
Algebris Financial Credit Fund
Unaudited Schedule of Investments (continued)
as at 30 June 2019
85
Holdings Financial Assets at Fair Value Through Profit or Loss Fair Value % of Net
EUR Asset Value
Forward Contracts* (continued)
Buy EUR 63,717 Sell GBP 56,800 17/07/2019 335 -
Buy EUR 30,103 Sell USD 33,900 17/07/2019 331 -
Buy EUR 21,308 Sell USD 23,900 17/07/2019 318 -
Buy SGD 250,000 Sell EUR 162,030 17/07/2019 297 -
Buy EUR 54,743 Sell GBP 48,800 17/07/2019 287 -
Buy EUR 43,114 Sell GBP 38,400 17/07/2019 264 -
Buy EUR 18,352 Sell USD 20,600 17/07/2019 261 -
Buy EUR 309,989 Sell USD 352,700 17/07/2019 239 -
Buy EUR 270,965 Sell USD 308,300 17/07/2019 209 -
Buy EUR 54,874 Sell GBP 49,000 17/07/2019 196 -
Buy EUR 22,591 Sell USD 25,500 17/07/2019 196 -
Buy EUR 36,903 Sell USD 41,800 17/07/2019 193 -
Buy EUR 51,851 Sell GBP 46,300 17/07/2019 185 -
Buy EUR 20,376 Sell USD 23,000 17/07/2019 177 -
Buy USD 60,000 Sell EUR 52,535 17/07/2019 158 -
Buy USD 100,000 Sell EUR 87,666 17/07/2019 157 -
Buy CHF 43,900 Sell EUR 39,407 17/07/2019 152 -
Buy CHF 24,500 Sell EUR 21,930 17/07/2019 148 -
Buy EUR 22,240 Sell GBP 19,800 17/07/2019 145 -
Buy EUR 21,456 Sell GBP 19,100 17/07/2019 143 -
Buy EUR 26,751 Sell USD 30,300 17/07/2019 141 -
Buy EUR 180,702 Sell USD 205,600 17/07/2019 139 -
Buy EUR 12,165 Sell USD 13,700 17/07/2019 134 -
Buy USD 50,300 Sell EUR 44,042 17/07/2019 133 -
Buy SGD 106,400 Sell EUR 68,956 17/07/2019 130 -
Buy EUR 48,669 Sell GBP 43,500 17/07/2019 128 -
Buy SGD 100,000 Sell EUR 64,809 17/07/2019 122 -
Buy EUR 22,777 Sell USD 25,800 17/07/2019 119 -
Buy USD 75,000 Sell EUR 65,749 17/07/2019 118 -
Buy EUR 32,589 Sell GBP 29,100 17/07/2019 116 -
Buy USD 73,200 Sell EUR 64,171 17/07/2019 115 -
Buy EUR 7,221 Sell USD 8,100 17/07/2019 108 -
Buy EUR 137,900 Sell USD 156,900 17/07/2019 106 -
Buy USD 34,900 Sell EUR 30,558 17/07/2019 92 -
Buy EUR 60,795 Sell GBP 54,400 17/07/2019 91 -
Buy EUR 10,188 Sell USD 11,500 17/07/2019 88 -
Buy EUR 104,238 Sell USD 118,600 17/07/2019 80 -
Buy EUR 130,524 Sell GBP 116,900 17/07/2019 77 -

ALGEBRIS UCITS FUNDS PLC
Algebris Financial Credit Fund
Unaudited Schedule of Investments (continued)
as at 30 June 2019
86
Holdings Financial Assets at Fair Value Through Profit or Loss Fair Value % of Net
EUR Asset Value
Forward Contracts* (continued)
Buy EUR 20,382 Sell GBP 18,200 17/07/2019 73 -
Buy EUR 11,452 Sell GBP 10,200 17/07/2019 70 -
Buy GBP 48,700 Sell EUR 54,276 17/07/2019 68 -
Buy EUR 112,771 Sell GBP 101,000 17/07/2019 67 -
Buy USD 42,700 Sell EUR 37,433 17/07/2019 67 -
Buy EUR 5,950 Sell USD 6,700 17/07/2019 65 -
Buy EUR 12,115 Sell GBP 10,800 17/07/2019 64 -
Buy EUR 9,098 Sell GBP 8,100 17/07/2019 59 -
Buy SGD 98,900 Sell EUR 64,160 17/07/2019 56 -
Buy EUR 8,533 Sell GBP 7,600 17/07/2019 52 -
Buy CHF 13,600 Sell EUR 12,208 17/07/2019 47 -
Buy EUR 77,488 Sell GBP 69,400 17/07/2019 46 -
Buy EUR 5,728 Sell GBP 5,100 17/07/2019 37 -
Buy EUR 5,951 Sell GBP 5,300 17/07/2019 36 -
Buy EUR 12,756 Sell GBP 11,400 17/07/2019 35 -
Buy EUR 5,391 Sell GBP 4,800 17/07/2019 35 -
Buy EUR 5,277 Sell GBP 4,700 17/07/2019 32 -
Buy EUR 5,052 Sell GBP 4,500 17/07/2019 31 -
Buy EUR 4,830 Sell GBP 4,300 17/07/2019 31 -
Buy EUR 11,524 Sell GBP 10,300 17/07/2019 30 -
Buy EUR 20,116 Sell GBP 18,000 17/07/2019 30 -
Buy EUR 4,381 Sell GBP 3,900 17/07/2019 29 -
Buy EUR 42,652 Sell GBP 38,200 17/07/2019 25 -
Buy CHF 10,400 Sell EUR 9,348 17/07/2019 23 -
Buy GBP 13,300 Sell EUR 14,822 17/07/2019 20 -
Buy EUR 12,740 Sell GBP 11,400 17/07/2019 19 -
Buy EUR 6,490 Sell GBP 5,800 17/07/2019 18 -
Buy EUR 2,807 Sell GBP 2,500 17/07/2019 17 -
Buy EUR 4,592 Sell GBP 4,100 17/07/2019 16 -
Buy GBP 8,600 Sell EUR 9,582 17/07/2019 15 -
Buy USD 5,500 Sell EUR 4,816 17/07/2019 15 -
Buy EUR 17,842 Sell USD 20,300 17/07/2019 14 -
Buy GBP 9,100 Sell EUR 10,142 17/07/2019 13 -
Buy GBP 7,300 Sell EUR 8,136 17/07/2019 10 -
Buy EUR 1,572 Sell GBP 1,400 17/07/2019 10 -
Buy CHF 1,000 Sell EUR 893 17/07/2019 9 -
Buy GBP 5,200 Sell EUR 5,795 17/07/2019 7 -
Buy GBP 4,500 Sell EUR 5,015 17/07/2019 7 -
Buy EUR 1,904 Sell GBP 1,700 17/07/2019 7 -
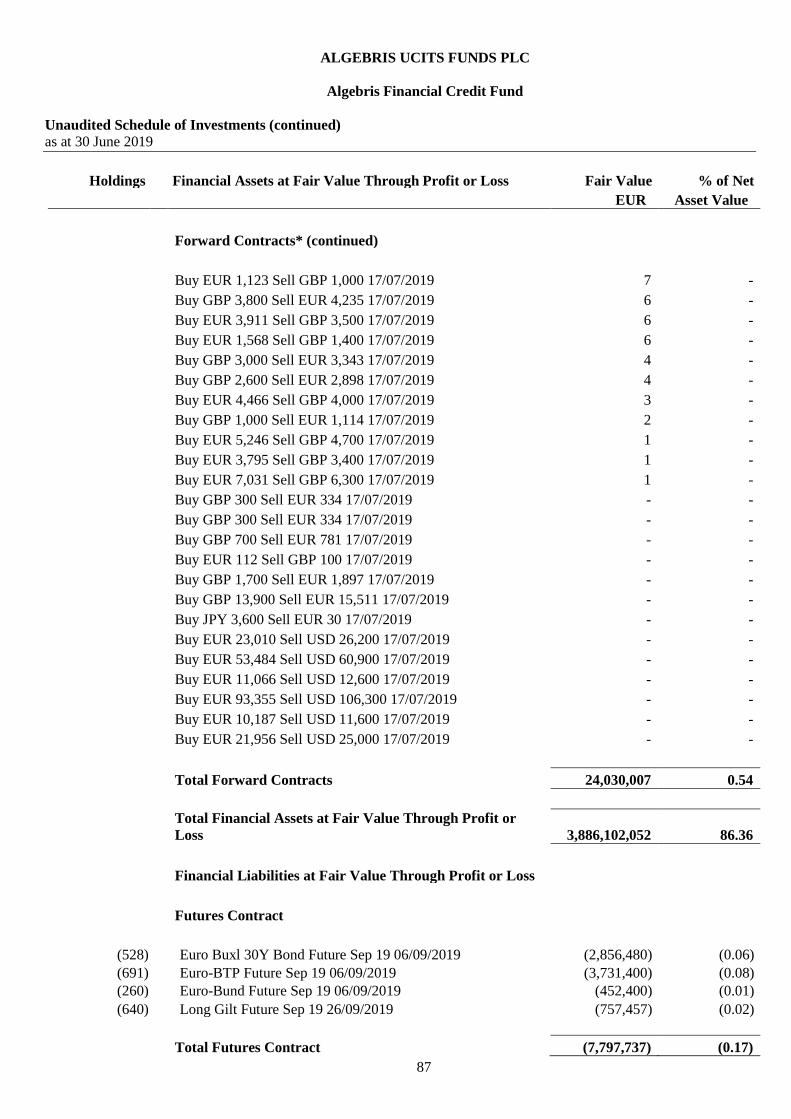
ALGEBRIS UCITS FUNDS PLC
Algebris Financial Credit Fund
Unaudited Schedule of Investments (continued)
as at 30 June 2019
87
Holdings Financial Assets at Fair Value Through Profit or Loss Fair Value % of Net
EUR Asset Value
Forward Contracts* (continued)
Buy EUR 1,123 Sell GBP 1,000 17/07/2019 7 -
Buy GBP 3,800 Sell EUR 4,235 17/07/2019 6 -
Buy EUR 3,911 Sell GBP 3,500 17/07/2019 6 -
Buy EUR 1,568 Sell GBP 1,400 17/07/2019 6 -
Buy GBP 3,000 Sell EUR 3,343 17/07/2019 4 -
Buy GBP 2,600 Sell EUR 2,898 17/07/2019 4 -
Buy EUR 4,466 Sell GBP 4,000 17/07/2019 3 -
Buy GBP 1,000 Sell EUR 1,114 17/07/2019 2 -
Buy EUR 5,246 Sell GBP 4,700 17/07/2019 1 -
Buy EUR 3,795 Sell GBP 3,400 17/07/2019 1 -
Buy EUR 7,031 Sell GBP 6,300 17/07/2019 1 -
Buy GBP 300 Sell EUR 334 17/07/2019 - -
Buy GBP 300 Sell EUR 334 17/07/2019 - -
Buy GBP 700 Sell EUR 781 17/07/2019 - -
Buy EUR 112 Sell GBP 100 17/07/2019 - -
Buy GBP 1,700 Sell EUR 1,897 17/07/2019 - -
Buy GBP 13,900 Sell EUR 15,511 17/07/2019 - -
Buy JPY 3,600 Sell EUR 30 17/07/2019 - -
Buy EUR 23,010 Sell USD 26,200 17/07/2019 - -
Buy EUR 53,484 Sell USD 60,900 17/07/2019 - -
Buy EUR 11,066 Sell USD 12,600 17/07/2019 - -
Buy EUR 93,355 Sell USD 106,300 17/07/2019 - -
Buy EUR 10,187 Sell USD 11,600 17/07/2019 - -
Buy EUR 21,956 Sell USD 25,000 17/07/2019 - -
Total Forward Contracts 24,030,007 0.54
Total Financial Assets at Fair Value Through Profit or
Loss 3,886,102,052 86.36
Financial Liabilities at Fair Value Through Profit or Loss
Futures Contract
(528) Euro Buxl 30Y Bond Future Sep 19 06/09/2019 (2,856,480) (0.06)
(691) Euro-BTP Future Sep 19 06/09/2019 (3,731,400) (0.08)
(260) Euro-Bund Future Sep 19 06/09/2019 (452,400) (0.01)
(640) Long Gilt Future Sep 19 26/09/2019 (757,457) (0.02)
Total Futures Contract (7,797,737) (0.17)

ALGEBRIS UCITS FUNDS PLC
Algebris Financial Credit Fund
Unaudited Schedule of Investments (continued)
as at 30 June 2019
88
Holdings Financial Liabilities at Fair Value Through Profit or Loss Fair Value % of Net
EUR Asset Value
Repurchase Agreements
3,150,000 Unicredit Perpetual (Repo Rate : (1.1%) 29/09/2049) (3,052,196) (0.07)
Total Repurchase Agreements (3,052,196) (0.07)
Forward Contracts*
Buy USD 227,186,355 Sell EUR 201,737,995 17/07/2019 (2,217,636) (0.05)
Buy USD 169,976,189 Sell EUR 150,936,246 17/07/2019 (1,659,190) (0.04)
Buy GBP 290,091,046 Sell EUR 324,867,931 17/07/2019 (1,158,505) (0.03)
Buy USD 85,367,200 Sell EUR 75,804,763 17/07/2019 (833,295) (0.02)
Buy USD 80,485,552 Sell EUR 71,469,934 17/07/2019 (785,644) (0.02)
Buy USD 77,338,244 Sell EUR 68,675,173 17/07/2019 (754,922) (0.02)
Buy USD 48,742,077 Sell EUR 43,282,216 17/07/2019 (475,786) (0.01)
Buy USD 34,512,764 Sell EUR 30,646,804 17/07/2019 (336,890) (0.01)
Buy USD 21,322,644 Sell EUR 18,934,180 17/07/2019 (208,137) -
Buy USD 12,000,000 Sell EUR 10,656,179 17/07/2019 (117,499) -
Buy USD 8,102,800 Sell EUR 7,195,162 17/07/2019 (79,094) -
Buy GBP 15,137,320 Sell EUR 16,952,022 17/07/2019 (60,452) -
Buy GBP 11,847,875 Sell EUR 13,268,230 17/07/2019 (47,316) -
Buy GBP 6,249,800 Sell EUR 7,019,845 17/07/2019 (45,762) -
Buy GBP 11,377,000 Sell EUR 12,740,905 17/07/2019 (45,435) -
Buy USD 3,193,700 Sell EUR 2,845,217 17/07/2019 (40,436) -
Buy USD 2,555,000 Sell EUR 2,276,210 17/07/2019 (32,349) -
Buy GBP 6,521,182 Sell EUR 7,302,959 17/07/2019 (26,043) -
Buy GBP 4,017,800 Sell EUR 4,499,465 17/07/2019 (16,045) -
Buy USD 1,148,900 Sell EUR 1,023,537 17/07/2019 (14,546) -
Buy GBP 2,059,200 Sell EUR 2,312,003 17/07/2019 (14,165) -
Buy USD 1,113,800 Sell EUR 992,267 17/07/2019 (14,102) -
Buy USD 999,600 Sell EUR 890,841 17/07/2019 (12,969) -
Buy GBP 2,500,900 Sell EUR 2,800,715 17/07/2019 (9,988) -
Buy USD 764,800 Sell EUR 681,348 17/07/2019 (9,683) -
Buy USD 657,800 Sell EUR 586,024 17/07/2019 (8,328) -
Buy USD 500,000 Sell EUR 445,016 17/07/2019 (5,904) -
Buy USD 463,400 Sell EUR 412,836 17/07/2019 (5,867) -
Buy GBP 1,450,000 Sell EUR 1,623,830 17/07/2019 (5,791) -
Buy USD 5,000,000 Sell EUR 4,396,692 17/07/2019 (5,575) -
Buy USD 648,600 Sell EUR 574,648 17/07/2019 (5,032) -
Buy EUR 4,504,328 Sell USD 5,134,600 17/07/2019 (4,997) -
Buy USD 500,000 Sell EUR 444,007 17/07/2019 (4,896) -

ALGEBRIS UCITS FUNDS PLC
Algebris Financial Credit Fund
Unaudited Schedule of Investments (continued)
as at 30 June 2019
89
Holdings Financial Liabilities at Fair Value Through Profit or Loss Fair Value % of Net
EUR Asset Value
Forward Contracts* (continued)
Buy USD 1,011,100 Sell EUR 892,647 17/07/2019 (4,676) -
Buy GBP 500,000 Sell EUR 562,456 17/07/2019 (4,512) -
Buy USD 295,300 Sell EUR 263,078 17/07/2019 (3,739) -
Buy USD 781,000 Sell EUR 689,504 17/07/2019 (3,612) -
Buy USD 500,000 Sell EUR 442,201 17/07/2019 (3,089) -
Buy USD 500,000 Sell EUR 442,201 17/07/2019 (3,089) -
Buy USD 250,600 Sell EUR 223,042 17/07/2019 (2,959) -
Buy USD 445,500 Sell EUR 394,096 17/07/2019 (2,847) -
Buy USD 260,200 Sell EUR 231,054 17/07/2019 (2,540) -
Buy USD 536,400 Sell EUR 473,560 17/07/2019 (2,481) -
Buy USD 200,000 Sell EUR 178,006 17/07/2019 (2,362) -
Buy USD 466,900 Sell EUR 412,202 17/07/2019 (2,159) -
Buy USD 175,000 Sell EUR 155,755 17/07/2019 (2,066) -
Buy USD 1,827,200 Sell EUR 1,606,727 17/07/2019 (2,037) -
Buy USD 145,000 Sell EUR 129,224 17/07/2019 (1,881) -
Buy USD 327,700 Sell EUR 289,309 17/07/2019 (1,515) -
Buy GBP 199,500 Sell EUR 224,081 17/07/2019 (1,461) -
Buy GBP 200,000 Sell EUR 224,607 17/07/2019 (1,429) -
Buy EUR 901,221 Sell USD 1,027,800 17/07/2019 (1,417) -
Buy USD 111,400 Sell EUR 99,245 17/07/2019 (1,410) -
Buy USD 101,300 Sell EUR 90,278 17/07/2019 (1,314) -
Buy USD 202,700 Sell EUR 179,268 17/07/2019 (1,252) -
Buy GBP 308,200 Sell EUR 345,148 17/07/2019 (1,231) -
Buy USD 172,000 Sell EUR 152,154 17/07/2019 (1,099) -
Buy USD 231,000 Sell EUR 203,938 17/07/2019 (1,068) -
Buy GBP 250,000 Sell EUR 280,027 17/07/2019 (1,055) -
Buy GBP 135,800 Sell EUR 152,532 17/07/2019 (994) -
Buy USD 101,300 Sell EUR 89,956 17/07/2019 (992) -
Buy USD 72,600 Sell EUR 64,616 17/07/2019 (857) -
Buy GBP 114,000 Sell EUR 128,046 17/07/2019 (835) -
Buy USD 82,000 Sell EUR 72,817 17/07/2019 (803) -
Buy GBP 110,800 Sell EUR 124,403 17/07/2019 (762) -
Buy USD 144,000 Sell EUR 127,130 17/07/2019 (666) -
Buy EUR 1,786,109 Sell CHF 1,982,800 17/07/2019 (657) -
Buy EUR 399,929 Sell USD 456,100 17/07/2019 (629) -
Buy GBP 79,100 Sell EUR 88,858 17/07/2019 (591) -
Buy GBP 63,000 Sell EUR 70,870 17/07/2019 (568) -
Buy GBP 77,400 Sell EUR 86,937 17/07/2019 (567) -
Buy USD 57,713 Sell EUR 51,248 17/07/2019 (563) -

ALGEBRIS UCITS FUNDS PLC
Algebris Financial Credit Fund
Unaudited Schedule of Investments (continued)
as at 30 June 2019
90
Holdings Financial Liabilities at Fair Value Through Profit or Loss Fair Value % of Net
EUR Asset Value
Forward Contracts* (continued)
Buy GBP 61,500 Sell EUR 69,182 17/07/2019 (555) -
Buy USD 40,000 Sell EUR 35,648 17/07/2019 (519) -
Buy GBP 72,200 Sell EUR 81,064 17/07/2019 (497) -
Buy GBP 71,500 Sell EUR 80,278 17/07/2019 (492) -
Buy USD 75,200 Sell EUR 66,523 17/07/2019 (481) -
Buy GBP 50,000 Sell EUR 56,246 17/07/2019 (451) -
Buy EUR 1,152,936 Sell CHF 1,279,900 17/07/2019 (424) -
Buy GBP 106,165 Sell EUR 118,892 17/07/2019 (424) -
Buy USD 35,000 Sell EUR 31,151 17/07/2019 (413) -
Buy USD 570,000 Sell EUR 500,974 17/07/2019 (387) -
Buy GBP 91,500 Sell EUR 102,490 17/07/2019 (386) -
Buy USD 49,500 Sell EUR 43,856 17/07/2019 (384) -
Buy GBP 49,300 Sell EUR 55,374 17/07/2019 (361) -
Buy USD 27,400 Sell EUR 24,419 17/07/2019 (355) -
Buy EUR 181,023 Sell USD 206,500 17/07/2019 (330) -
Buy USD 410,700 Sell EUR 360,947 17/07/2019 (261) -
Buy CHF 494,000 Sell EUR 445,417 17/07/2019 (257) -
Buy GBP 37,400 Sell EUR 41,992 17/07/2019 (257) -
Buy USD 402,200 Sell EUR 353,477 17/07/2019 (256) -
Buy GBP 28,200 Sell EUR 31,723 17/07/2019 (254) -
Buy USD 19,400 Sell EUR 17,289 17/07/2019 (252) -
Buy USD 40,000 Sell EUR 35,376 17/07/2019 (247) -
Buy USD 24,900 Sell EUR 22,112 17/07/2019 (244) -
Buy EUR 133,948 Sell USD 152,800 17/07/2019 (244) -
Buy USD 52,500 Sell EUR 46,350 17/07/2019 (243) -
Buy USD 215,000 Sell EUR 189,058 17/07/2019 (240) -
Buy GBP 32,100 Sell EUR 36,055 17/07/2019 (235) -
Buy USD 198,500 Sell EUR 174,549 17/07/2019 (221) -
Buy GBP 52,100 Sell EUR 58,358 17/07/2019 (220) -
Buy EUR 31,955 Sell CHF 35,700 17/07/2019 (216) -
Buy GBP 23,600 Sell EUR 26,548 17/07/2019 (213) -
Buy EUR 134,946 Sell USD 153,900 17/07/2019 (212) -
Buy GBP 25,800 Sell EUR 28,974 17/07/2019 (184) -
Buy SGD 74,500 Sell EUR 48,552 17/07/2019 (179) -
Buy GBP 24,200 Sell EUR 27,171 17/07/2019 (166) -
Buy GBP 25,300 Sell EUR 28,388 17/07/2019 (156) -
Buy USD 20,000 Sell EUR 17,720 17/07/2019 (155) -
Buy GBP 21,100 Sell EUR 23,696 17/07/2019 (151) -
Buy USD 600,000 Sell EUR 527,084 17/07/2019 (150) -

ALGEBRIS UCITS FUNDS PLC
Algebris Financial Credit Fund
Unaudited Schedule of Investments (continued)
as at 30 June 2019
91
Holdings Financial Liabilities at Fair Value Through Profit or Loss Fair Value % of Net
EUR Asset Value
Forward Contracts* (continued)
Buy GBP 19,100 Sell EUR 21,456 17/07/2019 (143) -
Buy USD 225,000 Sell EUR 197,743 17/07/2019 (143) -
Buy GBP 19,400 Sell EUR 21,790 17/07/2019 (142) -
Buy GBP 18,400 Sell EUR 20,670 17/07/2019 (138) -
Buy GBP 22,300 Sell EUR 25,022 17/07/2019 (137) -
Buy EUR 13,472 Sell CHF 15,100 17/07/2019 (135) -
Buy USD 200,000 Sell EUR 175,772 17/07/2019 (127) -
Buy GBP 16,700 Sell EUR 18,760 17/07/2019 (125) -
Buy USD 109,300 Sell EUR 96,112 17/07/2019 (122) -
Buy GBP 16,800 Sell EUR 18,863 17/07/2019 (116) -
Buy EUR 102,551 Sell USD 116,900 17/07/2019 (114) -
Buy USD 100,100 Sell EUR 88,022 17/07/2019 (112) -
Buy SGD 42,100 Sell EUR 27,437 17/07/2019 (101) -
Buy EUR 63,747 Sell USD 72,700 17/07/2019 (100) -
Buy CHF 58,300 Sell EUR 52,634 17/07/2019 (98) -
Buy EUR 61,730 Sell USD 70,400 17/07/2019 (97) -
Buy GBP 12,900 Sell EUR 14,491 17/07/2019 (96) -
Buy GBP 49,700 Sell EUR 55,556 17/07/2019 (96) -
Buy USD 376,100 Sell EUR 330,394 17/07/2019 (94) -
Buy EUR 50,844 Sell USD 58,000 17/07/2019 (93) -
Buy USD 140,200 Sell EUR 123,216 17/07/2019 (89) -
Buy GBP 14,100 Sell EUR 15,821 17/07/2019 (87) -
Buy EUR 29,653 Sell CHF 33,000 17/07/2019 (84) -
Buy EUR 43,744 Sell USD 49,900 17/07/2019 (80) -
Buy USD 297,800 Sell EUR 261,609 17/07/2019 (75) -
Buy EUR 11,009 Sell CHF 12,300 17/07/2019 (75) -
Buy EUR 44,894 Sell USD 51,200 17/07/2019 (71) -
Buy GBP 7,700 Sell EUR 8,662 17/07/2019 (69) -
Buy GBP 9,800 Sell EUR 11,003 17/07/2019 (67) -
Buy SGD 35,800 Sell EUR 23,311 17/07/2019 (66) -
Buy GBP 12,600 Sell EUR 14,115 17/07/2019 (55) -
Buy CHF 52,200 Sell EUR 47,093 17/07/2019 (54) -
Buy GBP 11,900 Sell EUR 13,329 17/07/2019 (50) -
Buy EUR 31,829 Sell USD 36,300 17/07/2019 (50) -
Buy USD 3,700 Sell EUR 3,296 17/07/2019 (47) -
Buy GBP 5,100 Sell EUR 5,737 17/07/2019 (46) -
Buy EUR 4,551 Sell CHF 5,100 17/07/2019 (45) -
Buy GBP 5,700 Sell EUR 6,403 17/07/2019 (43) -
Buy GBP 4,600 Sell EUR 5,175 17/07/2019 (42) -

ALGEBRIS UCITS FUNDS PLC
Algebris Financial Credit Fund
Unaudited Schedule of Investments (continued)
as at 30 June 2019
92
Holdings Financial Liabilities at Fair Value Through Profit or Loss Fair Value % of Net
EUR Asset Value
Forward Contracts* (continued)
Buy USD 6,400 Sell EUR 5,660 17/07/2019 (40) -
Buy GBP 20,000 Sell EUR 22,357 17/07/2019 (39) -
Buy EUR 25,078 Sell USD 28,600 17/07/2019 (39) -
Buy EUR 20,601 Sell USD 23,500 17/07/2019 (38) -
Buy SGD 20,600 Sell EUR 13,414 17/07/2019 (38) -
Buy USD 150,000 Sell EUR 131,771 17/07/2019 (38) -
Buy GBP 5,000 Sell EUR 5,615 17/07/2019 (36) -
Buy USD 50,000 Sell EUR 43,943 17/07/2019 (32) -
Buy GBP 4,100 Sell EUR 4,606 17/07/2019 (31) -
Buy GBP 3,900 Sell EUR 4,381 17/07/2019 (29) -
Buy JPY 591,500 Sell EUR 4,849 17/07/2019 (28) -
Buy GBP 6,300 Sell EUR 7,057 17/07/2019 (27) -
Buy USD 2,100 Sell EUR 1,872 17/07/2019 (27) -
Buy USD 100,100 Sell EUR 87,935 17/07/2019 (25) -
Buy EUR 9,015 Sell GBP 8,100 17/07/2019 (24) -
Buy USD 38,000 Sell EUR 33,397 17/07/2019 (24) -
Buy GBP 3,100 Sell EUR 3,482 17/07/2019 (23) -
Buy EUR 8,792 Sell GBP 7,900 17/07/2019 (23) -
Buy GBP 3,500 Sell EUR 3,927 17/07/2019 (22) -
Buy GBP 5,000 Sell EUR 5,601 17/07/2019 (22) -
Buy SGD 8,600 Sell EUR 5,605 17/07/2019 (21) -
Buy EUR 12,188 Sell USD 13,900 17/07/2019 (19) -
Buy USD 72,000 Sell EUR 63,250 17/07/2019 (18) -
Buy USD 68,300 Sell EUR 60,000 17/07/2019 (17) -
Buy EUR 11,048 Sell USD 12,600 17/07/2019 (17) -
Buy GBP 2,100 Sell EUR 2,359 17/07/2019 (16) -
Buy GBP 2,100 Sell EUR 2,358 17/07/2019 (15) -
Buy USD 23,700 Sell EUR 20,829 17/07/2019 (15) -
Buy GBP 2,100 Sell EUR 2,358 17/07/2019 (14) -
Buy GBP 1,600 Sell EUR 1,800 17/07/2019 (14) -
Buy EUR 97,069 Sell GBP 87,000 17/07/2019 (13) -
Buy USD 49,900 Sell EUR 43,836 17/07/2019 (13) -
Buy EUR 6,399 Sell USD 7,300 17/07/2019 (12) -
Buy GBP 1,400 Sell EUR 1,573 17/07/2019 (10) -
Buy USD 800 Sell EUR 713 17/07/2019 (10) -
Buy GBP 2,000 Sell EUR 2,241 17/07/2019 (9) -
Buy EUR 5,963 Sell USD 6,800 17/07/2019 (9) -
Buy SGD 4,400 Sell EUR 2,865 17/07/2019 (8) -
Buy EUR 7,201 Sell CHF 8,000 17/07/2019 (8) -
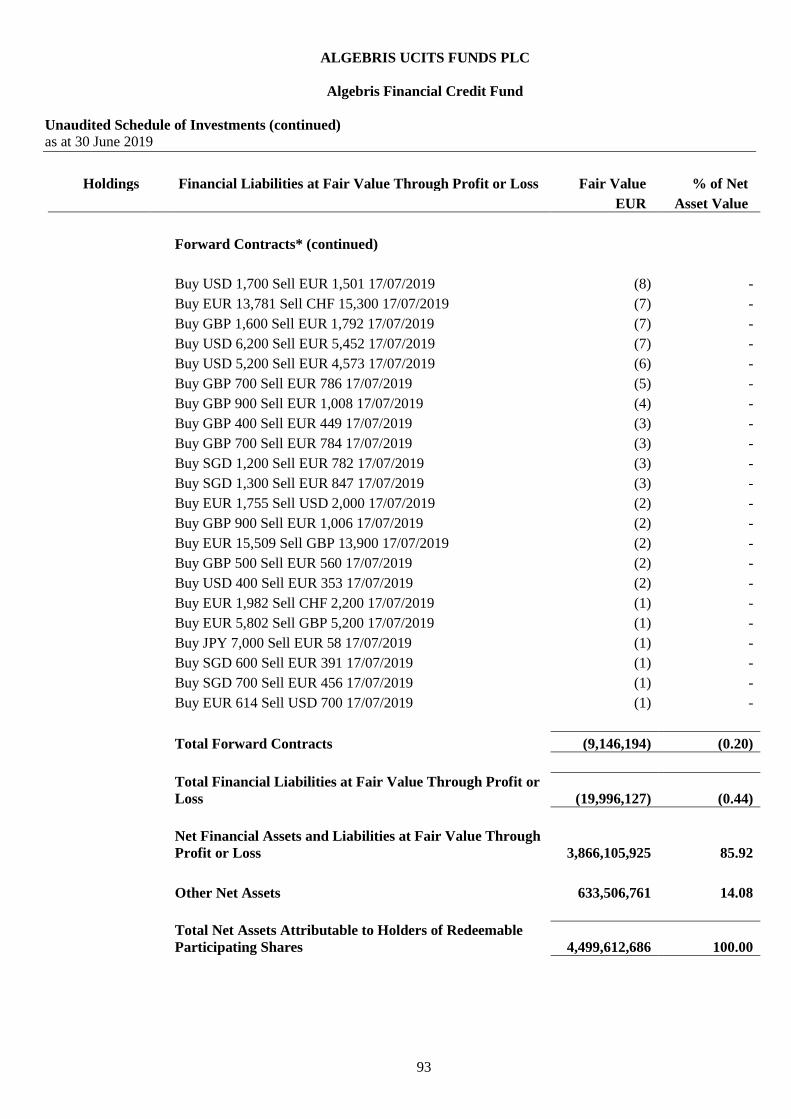
ALGEBRIS UCITS FUNDS PLC
Algebris Financial Credit Fund
Unaudited Schedule of Investments (continued)
as at 30 June 2019
93
Holdings Financial Liabilities at Fair Value Through Profit or Loss Fair Value % of Net
EUR Asset Value
Forward Contracts* (continued)
Buy USD 1,700 Sell EUR 1,501 17/07/2019 (8) -
Buy EUR 13,781 Sell CHF 15,300 17/07/2019 (7) -
Buy GBP 1,600 Sell EUR 1,792 17/07/2019 (7) -
Buy USD 6,200 Sell EUR 5,452 17/07/2019 (7) -
Buy USD 5,200 Sell EUR 4,573 17/07/2019 (6) -
Buy GBP 700 Sell EUR 786 17/07/2019 (5) -
Buy GBP 900 Sell EUR 1,008 17/07/2019 (4) -
Buy GBP 400 Sell EUR 449 17/07/2019 (3) -
Buy GBP 700 Sell EUR 784 17/07/2019 (3) -
Buy SGD 1,200 Sell EUR 782 17/07/2019 (3) -
Buy SGD 1,300 Sell EUR 847 17/07/2019 (3) -
Buy EUR 1,755 Sell USD 2,000 17/07/2019 (2) -
Buy GBP 900 Sell EUR 1,006 17/07/2019 (2) -
Buy EUR 15,509 Sell GBP 13,900 17/07/2019 (2) -
Buy GBP 500 Sell EUR 560 17/07/2019 (2) -
Buy USD 400 Sell EUR 353 17/07/2019 (2) -
Buy EUR 1,982 Sell CHF 2,200 17/07/2019 (1) -
Buy EUR 5,802 Sell GBP 5,200 17/07/2019 (1) -
Buy JPY 7,000 Sell EUR 58 17/07/2019 (1) -
Buy SGD 600 Sell EUR 391 17/07/2019 (1) -
Buy SGD 700 Sell EUR 456 17/07/2019 (1) -
Buy EUR 614 Sell USD 700 17/07/2019 (1) -
Total Forward Contracts (9,146,194) (0.20)
Total Financial Liabilities at Fair Value Through Profit or
Loss (19,996,127) (0.44)
Net Financial Assets and Liabilities at Fair Value Through
Profit or Loss 3,866,105,925 85.92
Other Net Assets 633,506,761 14.08
Total Net Assets Attributable to Holders of Redeemable
Participating Shares 4,499,612,686 100.00
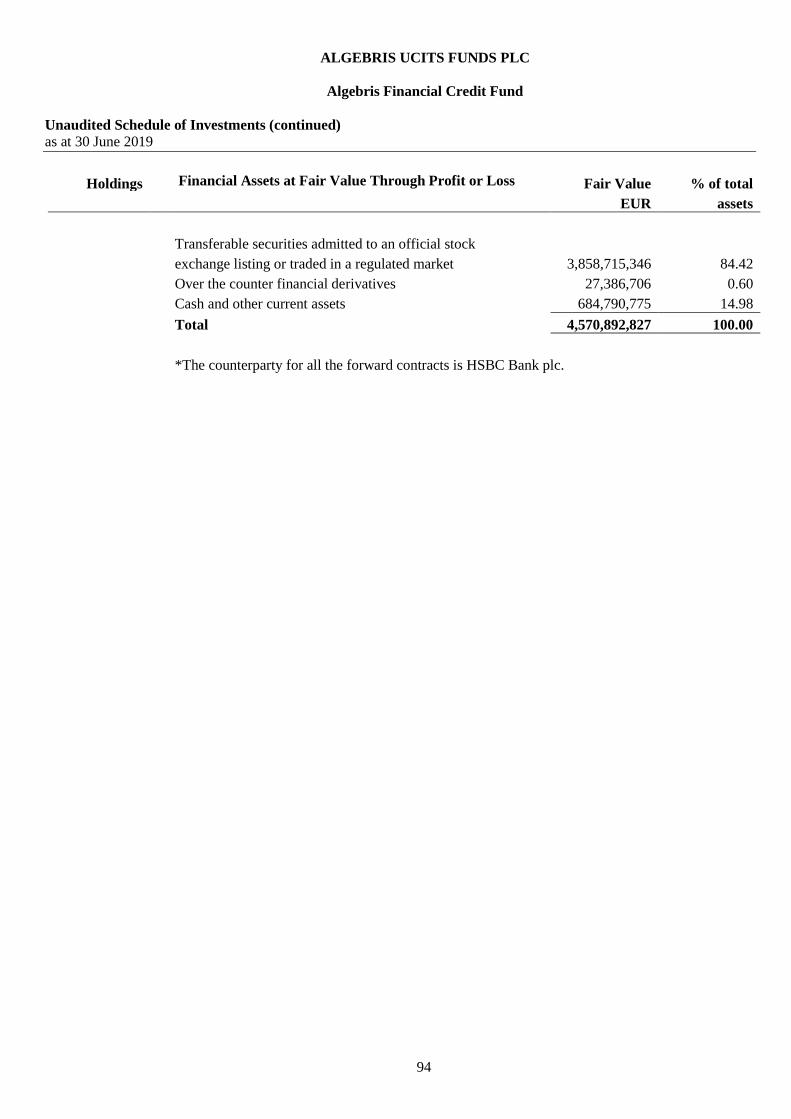
ALGEBRIS UCITS FUNDS PLC
Algebris Financial Credit Fund
Unaudited Schedule of Investments (continued)
as at 30 June 2019
94
Holdings Financial Assets at Fair Value Through Profit or Loss Fair Value % of total
EUR assets
Transferable securities admitted to an official stock
exchange listing or traded in a regulated market 3,858,715,346 84.42
Over the counter financial derivatives 27,386,706 0.60
Cash and other current assets 684,790,775 14.98
Total 4,570,892,827 100.00
*The counterparty for all the forward contracts is HSBC Bank plc.

ALGEBRIS UCITS FUNDS PLC
Algebris Financial Income Fund
Unaudited Schedule of Investments
as at 30 June 2019
95
Holdings Financial Assets at Fair Value Through Profit or Loss Fair Value % of Net
EUR Asset Value
Equity Securities
Belgium 7,063,782 1.44
122,550 KBC Group 7,063,782 1.44
Bermuda 4,903,008 1.00
129,464 Athene Holding Class A 4,903,008 1.00
Italy 16,821,992 3.43
131,369,754 Credito Valtellinese 7,422,391 1.51
804,170 Illimity Bank 7,141,030 1.46
368,011 Illimity Bank Rights 31/12/2099 643,283 0.13
367,111 NET Insurance 1,615,288 0.33
Japan 4,454,039 0.91
1,067,200 Mitsubishi UFJ Financial Group 4,454,039 0.91
Netherlands 18,857,417 3.85
471,100 ABN AMRO Group 8,863,746 1.81
980,156 ING Group 9,993,671 2.04
Switzerland 8,675,566 1.77
822,670 Credit Suisse Group 8,675,566 1.77
United States 107,624,142 21.96
250,537 AGNC Investment 3,706,273 0.76
799,151 Annaly Capital Management 6,417,105 1.31
331,128 Apollo Global Management LLC 9,989,173 2.04
259,040 AXA Equitable Holdings 4,761,597 0.97
240,750 Blackstone Group 9,405,554 1.92
542,501 Carlyle Group 10,787,993 2.20
134,285 Citigroup 8,270,869 1.69
259,409 Citizens Financial Group 8,067,460 1.65
114,936 Comerica 7,342,965 1.50
109,359 Fifth Third Bancorp 2,683,479 0.55
1,234 First Tennessee Bank (144A) (Preferred) Perpetual 813,984 0.16
300,812 Huntington Bancshares 3,656,308 0.74
377,500 Keycorp 5,893,250 1.20

ALGEBRIS UCITS FUNDS PLC
Algebris Financial Income Fund
Unaudited Schedule of Investments (continued)
as at 30 June 2019
96
Holdings Financial Assets at Fair Value Through Profit or Loss Fair Value % of Net
EUR Asset Value
Equity Securities (continued)
United States (continued)
26,911 Prudential Financial 2,390,511 0.49
253,675 Synovus Financial 7,808,817 1.59
215,500 Two Harbors Investment 2,401,394 0.49
158,852 Two Harbors Investment (Preferred) Perpetual 3,584,998 0.73
42,492 Two Harbors Investment (Preferred) Perpetual (NYSE) 1,015,772 0.21
207,280 Wells Fargo & Co 8,626,640 1.76
Total Equity Securities 168,399,946 34.36
Fixed Income Securities
Austria 4,483,830 0.91
2,800,000 Bawag Group 2,787,750 0.57
1,600,000 Erste Group Bank 1,696,080 0.34
Denmark 3,045,108 0.62
3,400,000 Danske Bank Perpetual 3,045,108 0.62
Finland 2,051,011 0.42
2,200,000 Nordea Bank Abp Perpetual 2,051,011 0.42
France 27,295,135 5.57
6,900,000 BNP Paribas VAR Perpetual 6,342,993 1.29
3,000,000 Credit Agricole 7.875% Perpetual 2,913,892 0.60
4,000,000 Credit Agricole VAR Perpetual 4,078,716 0.83
2,600,000 Societe Generale Perpetual 2,389,439 0.49
11,300,000 Societe Generale Perpetual (LUX) 9,818,428 2.00
1,800,000 Societe Generale VAR Perpetual 1,751,667 0.36
Germany 2,300,375 0.47
2,200,000 Aareal Bank 7.625% Perpetual 2,300,375 0.47
Italy 40,165,027 8.20
2,500,000 Banca Monte Dei Paschi 18/01/2028 1,531,700 0.31
2,004,000 Credito Valtellinese 4.7% 04/08/2021 2,012,597 0.41
1,450,000 Intesa Sanpaolo 5.71% 15/01/2026 1,288,090 0.26

ALGEBRIS UCITS FUNDS PLC
Algebris Financial Income Fund
Unaudited Schedule of Investments (continued)
as at 30 June 2019
97
Holdings Financial Assets at Fair Value Through Profit or Loss Fair Value % of Net
EUR Asset Value
Fixed Income Securities (continued)
Italy (continued)
5,200,000 Intesa Sanpaolo (144A) Perpetual 4,511,286 0.92
7,200,000 Intesa Sanpaolo Perpetual (AM0179896 Corporation) 8,126,280 1.66
2,100,000 Unicredit Perpetual (AL7554663 Corporation) 2,354,625 0.48
13,600,000 Unicredit Perpetual (AQ4052637 Corporation) 12,393,000 2.53
6,100,000 Unicredit Perpetual (AX6444902) 6,450,262 1.32
1,500,000 Unicredit SPA VAR Perpetual 1,497,187 0.31
Luxembourg 9,010,898 1.84
16,500,000 Mitsubishi Ufj Investor (Series PRX) 15/12/2050 9,010,898 1.84
Mexico 3,839,990 0.78
1,800,000 Bbva Bancomer Texas VAR 18/01/2033 1,512,879 0.31
2,500,000 Grupo Finance Invermexico Perpetual 2,327,111 0.47
Netherlands 16,411,021 3.35
14,200,000 ABN Amro Bank VAR Perpetual 14,661,500 2.99
800,000 ING Group (Series) Perpetual 742,213 0.15
1,100,000 ING Group Perpetual 1,007,308 0.21
Portugal 1,969,884 0.40
1,800,000 Banco Comerc Portugues Perpetual 1,969,884 0.40
Spain 47,468,726 9.69
3,400,000 Banco Bilbao Vizcaya ARG Perpetual (AX7516377) 3,581,764 0.73
4,000,000 Banco Bilbao Vizcaya REG Perpetual 3,317,238 0.68
1,600,000 Banco De Sabadell VAR Perpetual 1,569,000 0.32
3,800,000 Banco Popular Espanol VAR Perpetual - -
916,000 Banco Santander Perpetual 761,911 0.15
13,200,000 Banco Santander Perpetual (AR5470927 Corporation) 12,523,500 2.56
1,400,000 Banco Santander VAR Perpetual 1,529,493 0.31
5,600,000 Banco Santander VAR Perpetual (DSE) 5,710,320 1.17
3,000,000 Caixabank (Series) VAR Perpetual 3,247,500 0.66
16,200,000 Caixabank Perpetual 15,228,000 3.11
Switzerland 17,548,506 3.58
2,100,000 Credit Suisse Group VAR Perpetual 1,979,504 0.40
5,200,000 Credit Suisse Group VAR Perpetual (AU3887497 Corporation) 4,925,754 1.00

ALGEBRIS UCITS FUNDS PLC
Algebris Financial Income Fund
Unaudited Schedule of Investments (continued)
as at 30 June 2019
98
Holdings Financial Assets at Fair Value Through Profit or Loss Fair Value % of Net
EUR Asset Value
Fixed Income Securities (continued)
Switzerland (continued)
1,600,000 UBS Group Perpetual 1,545,301 0.32
9,650,000 UBS Group Perpetual (UV4180070) 9,097,947 1.86
United Kingdom 51,010,300 10.41
1,000,000 Bank of Scotland (Series B) Perpetual 1,367,420 0.28
1,200,000 Barclays Perpetual 1,082,327 0.22
600,000 Barclays Perpetual (AM6775317) 700,068 0.14
7,400,000 Barclays Perpetual (AO6220567) 8,045,470 1.64
1,200,000 Barclays Perpetual (AX7752402) 1,109,013 0.23
1,400,000 Barclays Perpetual (AZ0489668) 1,637,398 0.33
1,800,000 Barclays Perpetual (UV4299359) 2,135,373 0.44
1,600,000 HSBC Holdings Perpetual (AO1326237) 1,686,000 0.34
2,100,000 HSBC Holdings VAR Perpetual (AU6128063) 2,467,094 0.50
2,600,000 HSBC Holdings VAR Perpetual (DSE) 2,392,480 0.49
1,800,000 Lloyds Banking Group(144A) VAR Perpetual 1,675,069 0.34
9,200,000 Lloyds Banking Group(144A) VAR Perpetual (LSE) 8,473,022 1.73
5,260,000 Nationwide Building Society Perpetual 8,865,722 1.81
6,000,000 Royal Bank of Scotland Group Perpetual (BYRQWJ1) 5,710,633 1.17
1,400,000 Santander UK Group Holdings VAR Perpetual 1,639,352 0.34
1,700,000 Santander UK Group Perpetual 2,023,859 0.41
United States 22,358,497 4.56
2,900,000 American International Group (Series A-9) 01/04/2048 2,601,583 0.53
2,900,000 Citigroup 25/08/2036 2,005,489 0.41
5,000,000 Dresdner Funding Trust I 8.151% 30/06/2031 5,942,503 1.21
14,675,000 Voya Financial 23/01/2048 11,808,922 2.41
Total Fixed Income Securities 248,958,308 50.80
Options
1,954 CBOE SPX Volatility Index 25 Call 17/07/2019 34,371 0.01
1,565 CBOE SPX Volatility Index 30 Call 17/07/2019 15,141 -
132 DAX Index 11350 Put 20/09/2019 54,912 0.01
330
Dow Jones EURO STOXX 50 (Price) Index 3175 Put
16/08/2019 31,020 0.01
1,350
Dow Jones EURO STOXX 50 (Price) Index 3200 Put
19/07/2019 32,400 0.01

ALGEBRIS UCITS FUNDS PLC
Algebris Financial Income Fund
Unaudited Schedule of Investments (continued)
as at 30 June 2019
99
Holdings Financial Assets at Fair Value Through Profit or Loss Fair Value % of Net
EUR Asset Value
Options (continued)
630
Dow Jones EURO STOXX 50 (Price) Index 3350 Put
16/08/2019 180,810 0.04
21,700,000 GBP Put / CHF Call 1.15 19/09/2019 23,236 -
16,050,000 GBP Put / USD Call 1.165 19/12/2019 86,006 0.02
18 Nasdaq 100 Stock Index 6925 Put 16/08/2019 70,132 0.01
54 S&P 500 Index 2540 Put 20/09/2019 56,992 0.01
100 S&P 500 Index 2775 Put 19/07/2019 52,331 0.01
110 S&P 500 Index 2850 Put 31/07/2019 232,190 0.05
Total Options 869,541 0.18
Equity Warrants
71,595 NET Insurance 21/05/2023 47,969 0.01
Total Equity Warrants 47,969 0.01
Forward Contracts*
Buy EUR 222,512,342 Sell USD 250,581,295 17/07/2019 2,446,001 0.50
Buy EUR 28,476,376 Sell GBP 25,428,000 17/07/2019 101,549 0.02
Buy EUR 2,943,669 Sell USD 3,315,000 17/07/2019 32,359 0.01
Buy EUR 4,516,262 Sell JPY 550,889,000 17/07/2019 26,145 0.01
Buy SGD 8,522,700 Sell EUR 5,523,446 17/07/2019 10,409 -
Buy EUR 640,299 Sell USD 718,200 17/07/2019 9,559 -
Buy SGD 6,193,600 Sell EUR 4,013,988 17/07/2019 7,564 -
Buy CHF 723,962 Sell EUR 645,907 17/07/2019 6,479 -
Buy EUR 875,524 Sell GBP 781,800 17/07/2019 3,122 -
Buy CHF 319,800 Sell EUR 285,320 17/07/2019 2,862 -
Buy USD 1,776,100 Sell EUR 1,557,027 17/07/2019 2,785 -
Buy SGD 1,898,600 Sell EUR 1,230,457 17/07/2019 2,319 -
Buy EUR 385,628 Sell USD 436,800 17/07/2019 2,020 -
Buy EUR 325,336 Sell USD 368,500 17/07/2019 1,711 -
Buy CHF 131,946 Sell EUR 117,720 17/07/2019 1,181 -
Buy EUR 1,442,278 Sell USD 1,641,000 17/07/2019 1,113 -
Buy EUR 74,567 Sell USD 83,700 17/07/2019 1,060 -
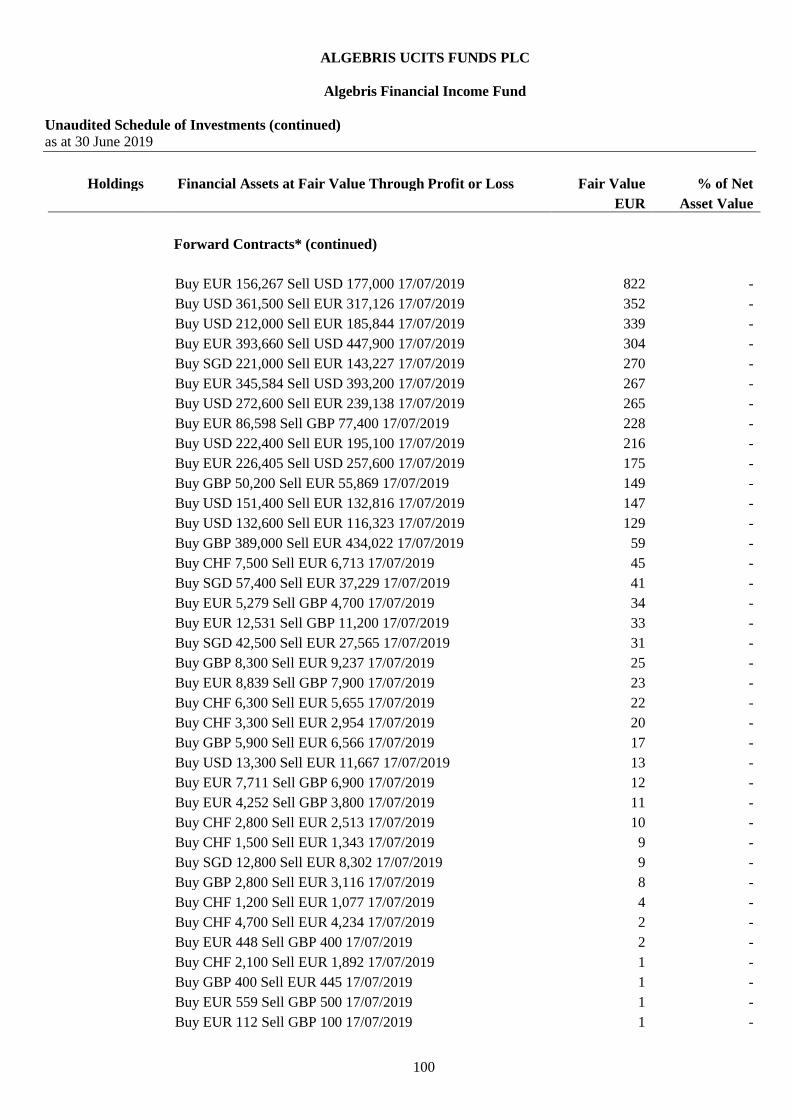
ALGEBRIS UCITS FUNDS PLC
Algebris Financial Income Fund
Unaudited Schedule of Investments (continued)
as at 30 June 2019
100
Holdings Financial Assets at Fair Value Through Profit or Loss Fair Value % of Net
EUR Asset Value
Forward Contracts* (continued)
Buy EUR 156,267 Sell USD 177,000 17/07/2019 822 -
Buy USD 361,500 Sell EUR 317,126 17/07/2019 352 -
Buy USD 212,000 Sell EUR 185,844 17/07/2019 339 -
Buy EUR 393,660 Sell USD 447,900 17/07/2019 304 -
Buy SGD 221,000 Sell EUR 143,227 17/07/2019 270 -
Buy EUR 345,584 Sell USD 393,200 17/07/2019 267 -
Buy USD 272,600 Sell EUR 239,138 17/07/2019 265 -
Buy EUR 86,598 Sell GBP 77,400 17/07/2019 228 -
Buy USD 222,400 Sell EUR 195,100 17/07/2019 216 -
Buy EUR 226,405 Sell USD 257,600 17/07/2019 175 -
Buy GBP 50,200 Sell EUR 55,869 17/07/2019 149 -
Buy USD 151,400 Sell EUR 132,816 17/07/2019 147 -
Buy USD 132,600 Sell EUR 116,323 17/07/2019 129 -
Buy GBP 389,000 Sell EUR 434,022 17/07/2019 59 -
Buy CHF 7,500 Sell EUR 6,713 17/07/2019 45 -
Buy SGD 57,400 Sell EUR 37,229 17/07/2019 41 -
Buy EUR 5,279 Sell GBP 4,700 17/07/2019 34 -
Buy EUR 12,531 Sell GBP 11,200 17/07/2019 33 -
Buy SGD 42,500 Sell EUR 27,565 17/07/2019 31 -
Buy GBP 8,300 Sell EUR 9,237 17/07/2019 25 -
Buy EUR 8,839 Sell GBP 7,900 17/07/2019 23 -
Buy CHF 6,300 Sell EUR 5,655 17/07/2019 22 -
Buy CHF 3,300 Sell EUR 2,954 17/07/2019 20 -
Buy GBP 5,900 Sell EUR 6,566 17/07/2019 17 -
Buy USD 13,300 Sell EUR 11,667 17/07/2019 13 -
Buy EUR 7,711 Sell GBP 6,900 17/07/2019 12 -
Buy EUR 4,252 Sell GBP 3,800 17/07/2019 11 -
Buy CHF 2,800 Sell EUR 2,513 17/07/2019 10 -
Buy CHF 1,500 Sell EUR 1,343 17/07/2019 9 -
Buy SGD 12,800 Sell EUR 8,302 17/07/2019 9 -
Buy GBP 2,800 Sell EUR 3,116 17/07/2019 8 -
Buy CHF 1,200 Sell EUR 1,077 17/07/2019 4 -
Buy CHF 4,700 Sell EUR 4,234 17/07/2019 2 -
Buy EUR 448 Sell GBP 400 17/07/2019 2 -
Buy CHF 2,100 Sell EUR 1,892 17/07/2019 1 -
Buy GBP 400 Sell EUR 445 17/07/2019 1 -
Buy EUR 559 Sell GBP 500 17/07/2019 1 -
Buy EUR 112 Sell GBP 100 17/07/2019 1 -
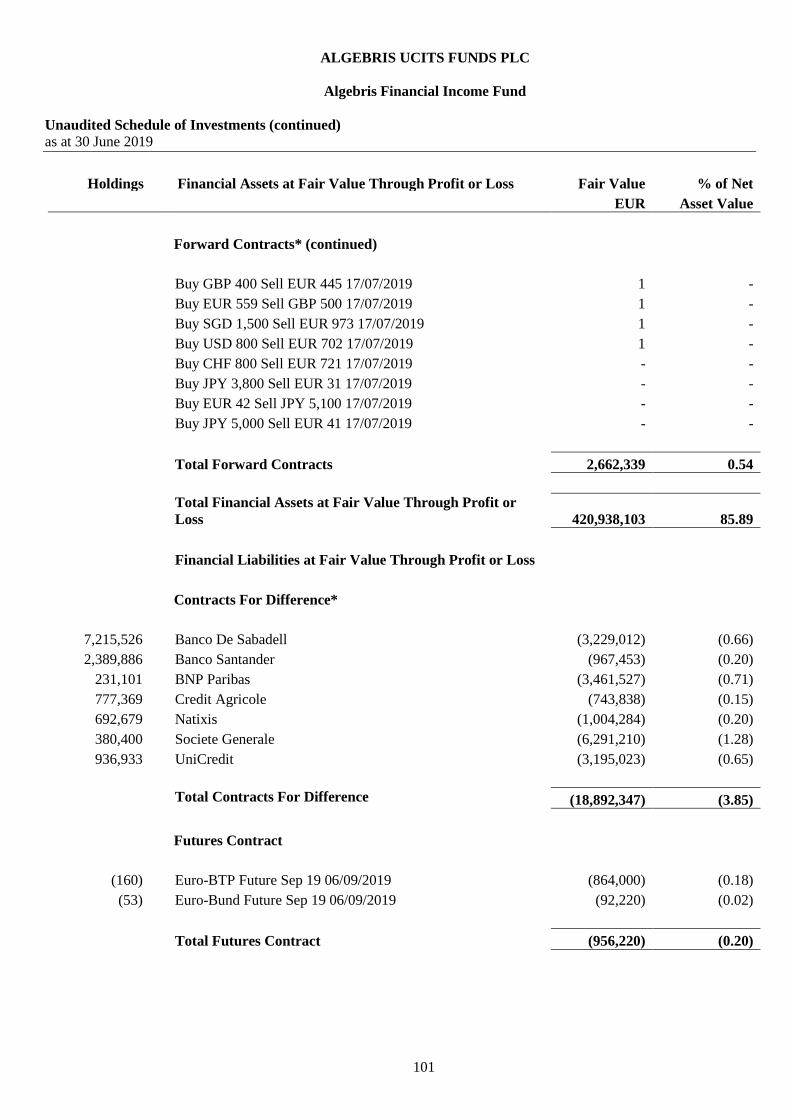
ALGEBRIS UCITS FUNDS PLC
Algebris Financial Income Fund
Unaudited Schedule of Investments (continued)
as at 30 June 2019
101
Holdings Financial Assets at Fair Value Through Profit or Loss Fair Value % of Net
EUR Asset Value
Forward Contracts* (continued)
Buy GBP 400 Sell EUR 445 17/07/2019 1 -
Buy EUR 559 Sell GBP 500 17/07/2019 1 -
Buy SGD 1,500 Sell EUR 973 17/07/2019 1 -
Buy USD 800 Sell EUR 702 17/07/2019 1 -
Buy CHF 800 Sell EUR 721 17/07/2019 - -
Buy JPY 3,800 Sell EUR 31 17/07/2019 - -
Buy EUR 42 Sell JPY 5,100 17/07/2019 - -
Buy JPY 5,000 Sell EUR 41 17/07/2019 - -
Total Forward Contracts 2,662,339 0.54
Total Financial Assets at Fair Value Through Profit or
Loss 420,938,103 85.89
Financial Liabilities at Fair Value Through Profit or Loss
Contracts For Difference*
7,215,526 Banco De Sabadell (3,229,012) (0.66)
2,389,886 Banco Santander (967,453) (0.20)
231,101 BNP Paribas (3,461,527) (0.71)
777,369 Credit Agricole (743,838) (0.15)
692,679 Natixis (1,004,284) (0.20)
380,400 Societe Generale (6,291,210) (1.28)
936,933 UniCredit (3,195,023) (0.65)
Total Contracts For Difference (18,892,347) (3.85)
Futures Contract
(160) Euro-BTP Future Sep 19 06/09/2019 (864,000) (0.18)
(53) Euro-Bund Future Sep 19 06/09/2019 (92,220) (0.02)
Total Futures Contract (956,220) (0.20)

ALGEBRIS UCITS FUNDS PLC
Algebris Financial Income Fund
Unaudited Schedule of Investments (continued)
as at 30 June 2019
102
Holdings Financial Liabilities at Fair Value Through Profit or Loss Fair Value % of Net
EUR Asset Value
Options
(710)
Dow Jones EURO STOXX 50 (Price) Index 3100 Put
19/07/2019 (7,810) -
Total Options (7,810) -
Forward Contracts*
Buy USD 43,060,800 Sell EUR 38,237,329 17/07/2019 (420,330) (0.10)
Buy USD 40,791,858 Sell EUR 36,222,544 17/07/2019 (398,182) (0.09)
Buy USD 35,216,679 Sell EUR 31,271,870 17/07/2019 (343,761) (0.07)
Buy USD 21,529,902 Sell EUR 19,118,222 17/07/2019 (210,160) (0.04)
Buy USD 17,106,600 Sell EUR 15,190,398 17/07/2019 (166,983) (0.03)
Buy EUR 6,153,390 Sell CHF 6,897,000 17/07/2019 (61,724) (0.01)
Buy GBP 7,431,468 Sell EUR 8,322,372 17/07/2019 (29,678) (0.01)
Buy USD 5,618,000 Sell EUR 4,959,838 17/07/2019 (25,980) (0.01)
Buy USD 1,905,782 Sell EUR 1,692,305 17/07/2019 (18,603) -
Buy SGD 3,729,000 Sell EUR 2,430,226 17/07/2019 (8,958) -
Buy USD 518,200 Sell EUR 461,656 17/07/2019 (6,561) -
Buy USD 443,700 Sell EUR 395,285 17/07/2019 (5,618) -
Buy GBP 1,248,698 Sell EUR 1,398,395 17/07/2019 (4,987) -
Buy EUR 2,343,481 Sell SGD 3,616,000 17/07/2019 (4,416) -
Buy USD 279,900 Sell EUR 249,359 17/07/2019 (3,544) -
Buy GBP 882,400 Sell EUR 988,184 17/07/2019 (3,524) -
Buy EUR 1,238,243 Sell CHF 1,378,000 17/07/2019 (3,518) -
Buy USD 265,200 Sell EUR 236,263 17/07/2019 (3,358) -
Buy EUR 1,557,027 Sell USD 1,776,100 17/07/2019 (2,785) -
Buy USD 215,900 Sell EUR 192,342 17/07/2019 (2,734) -
Buy USD 374,400 Sell EUR 330,538 17/07/2019 (1,731) -
Buy GBP 415,400 Sell EUR 465,199 17/07/2019 (1,659) -
Buy USD 353,500 Sell EUR 312,087 17/07/2019 (1,635) -
Buy USD 307,400 Sell EUR 271,387 17/07/2019 (1,422) -
Buy EUR 694,461 Sell USD 792,200 17/07/2019 (1,267) -
Buy EUR 1,067,531 Sell CHF 1,186,000 17/07/2019 (1,213) -
Buy USD 116,208 Sell EUR 103,191 17/07/2019 (1,134) -
Buy USD 188,600 Sell EUR 166,505 17/07/2019 (872) -
Buy USD 149,300 Sell EUR 131,809 17/07/2019 (690) -
Buy GBP 81,500 Sell EUR 91,542 17/07/2019 (597) -
Buy EUR 304,967 Sell USD 347,800 17/07/2019 (479) -
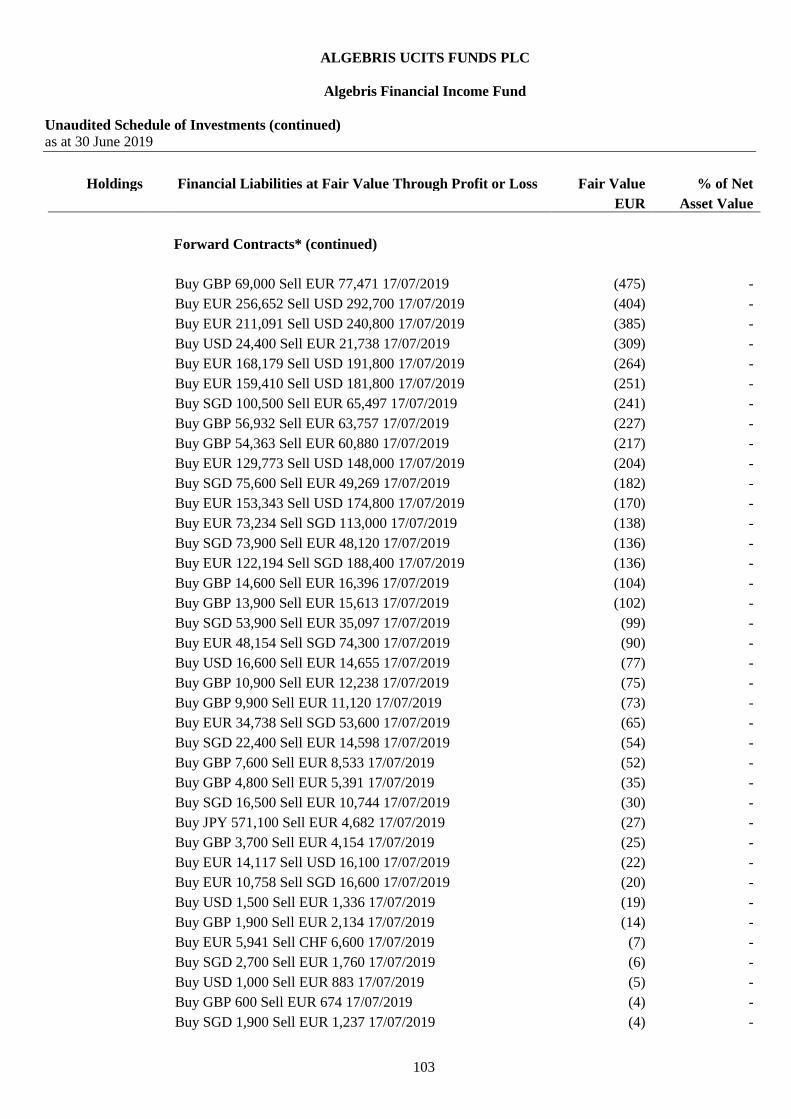
ALGEBRIS UCITS FUNDS PLC
Algebris Financial Income Fund
Unaudited Schedule of Investments (continued)
as at 30 June 2019
103
Holdings Financial Liabilities at Fair Value Through Profit or Loss Fair Value % of Net
EUR Asset Value
Forward Contracts* (continued)
Buy GBP 69,000 Sell EUR 77,471 17/07/2019 (475) -
Buy EUR 256,652 Sell USD 292,700 17/07/2019 (404) -
Buy EUR 211,091 Sell USD 240,800 17/07/2019 (385) -
Buy USD 24,400 Sell EUR 21,738 17/07/2019 (309) -
Buy EUR 168,179 Sell USD 191,800 17/07/2019 (264) -
Buy EUR 159,410 Sell USD 181,800 17/07/2019 (251) -
Buy SGD 100,500 Sell EUR 65,497 17/07/2019 (241) -
Buy GBP 56,932 Sell EUR 63,757 17/07/2019 (227) -
Buy GBP 54,363 Sell EUR 60,880 17/07/2019 (217) -
Buy EUR 129,773 Sell USD 148,000 17/07/2019 (204) -
Buy SGD 75,600 Sell EUR 49,269 17/07/2019 (182) -
Buy EUR 153,343 Sell USD 174,800 17/07/2019 (170) -
Buy EUR 73,234 Sell SGD 113,000 17/07/2019 (138) -
Buy SGD 73,900 Sell EUR 48,120 17/07/2019 (136) -
Buy EUR 122,194 Sell SGD 188,400 17/07/2019 (136) -
Buy GBP 14,600 Sell EUR 16,396 17/07/2019 (104) -
Buy GBP 13,900 Sell EUR 15,613 17/07/2019 (102) -
Buy SGD 53,900 Sell EUR 35,097 17/07/2019 (99) -
Buy EUR 48,154 Sell SGD 74,300 17/07/2019 (90) -
Buy USD 16,600 Sell EUR 14,655 17/07/2019 (77) -
Buy GBP 10,900 Sell EUR 12,238 17/07/2019 (75) -
Buy GBP 9,900 Sell EUR 11,120 17/07/2019 (73) -
Buy EUR 34,738 Sell SGD 53,600 17/07/2019 (65) -
Buy SGD 22,400 Sell EUR 14,598 17/07/2019 (54) -
Buy GBP 7,600 Sell EUR 8,533 17/07/2019 (52) -
Buy GBP 4,800 Sell EUR 5,391 17/07/2019 (35) -
Buy SGD 16,500 Sell EUR 10,744 17/07/2019 (30) -
Buy JPY 571,100 Sell EUR 4,682 17/07/2019 (27) -
Buy GBP 3,700 Sell EUR 4,154 17/07/2019 (25) -
Buy EUR 14,117 Sell USD 16,100 17/07/2019 (22) -
Buy EUR 10,758 Sell SGD 16,600 17/07/2019 (20) -
Buy USD 1,500 Sell EUR 1,336 17/07/2019 (19) -
Buy GBP 1,900 Sell EUR 2,134 17/07/2019 (14) -
Buy EUR 5,941 Sell CHF 6,600 17/07/2019 (7) -
Buy SGD 2,700 Sell EUR 1,760 17/07/2019 (6) -
Buy USD 1,000 Sell EUR 883 17/07/2019 (5) -
Buy GBP 600 Sell EUR 674 17/07/2019 (4) -
Buy SGD 1,900 Sell EUR 1,237 17/07/2019 (4) -

ALGEBRIS UCITS FUNDS PLC
Algebris Financial Income Fund
Unaudited Schedule of Investments (continued)
as at 30 June 2019
104
Holdings Financial Liabilities at Fair Value Through Profit or Loss Fair Value % of Net
EUR Asset Value
Forward Contracts* (continued)
Buy EUR 2,610 Sell CHF 2,900 17/07/2019 (3) -
Buy GBP 500 Sell EUR 561 17/07/2019 (3) -
Buy GBP 500 Sell EUR 561 17/07/2019 (3) -
Buy EUR 1,231 Sell SGD 1,900 17/07/2019 (2) -
Buy EUR 1,080 Sell CHF 1,200 17/07/2019 (1) -
Buy JPY 6,400 Sell EUR 53 17/07/2019 (1) -
Buy EUR 789 Sell USD 900 17/07/2019 (1) -
Total Forward Contracts (1,742,865) (0.36)
Total Financial Liabilities at Fair Value Through Profit or
Loss (21,599,242) (4.41)
Net Financial Assets and Liabilities at Fair Value Through
Profit or Loss 399,338,861 81.48
Other Net Assets 90,756,196 18.52
Total Net Assets Attributable to Holders of Redeemable
Participating Shares 490,095,057 100.00
% of total
assets
Transferable securities admitted to an official stock
exchange listing or traded in a regulated market 417,358,254 80.97
Over the counter financial derivatives 3,579,849 0.69
Cash and other current assets 94,541,335 18.34
Total 515,479,438 100.00
*The counterparty for all the contracts for differences and forward contracts is HSBC Bank plc.

ALGEBRIS UCITS FUNDS PLC
Algebris Allocation Fund
Unaudited Schedule of Investments
as at 30 June 2019
105
Holdings Financial Assets at Fair Value Through Profit or Loss Fair Value % of Net
EUR Asset Value
Investment Funds
Ireland 7,158,037 67.70
11,350 Algebris Financial Credit Fund Class M Accumulating 1,895,904 17.93
12,400 Algebris Financial Income Fund Class M Accumulating 1,774,068 16.78
7,700 Algebris Macro Credit Fund Class M Accumulating 857,857 8.11
7,950 Algebris Core Italy Fund Class M Accumulating 785,460 7.43
18,600 Algebris Quant Arbitrage Fund Class M Accumulating 1,844,748 17.45
Total Investment Funds 7,158,037 67.70
Fixed Income Securities
Spain 2,001,970 18.94
2,000,000 Spain Letras Del Tesoro 0% 13/09/2019 2,001,970 18.94
Total Fixed Income Securities 2,001,970 18.94
Options
525,000 GBP Put / CHF Call 1.15 19/09/2019 562 0.01
380,000 GBP Put / USD Call 1.165 19/12/2019 2,036 0.01
Total Options 2,598 0.02
Forward Contracts*
Buy CHF 55,800 Sell EUR 49,784 17/07/2019 500 -
Buy CHF 600 Sell EUR 539 17/07/2019 2 -
Total Forward Contracts 502 -
Total Financial Assets at Fair Value Through Profit or
Loss 9,163,107 86.66

ALGEBRIS UCITS FUNDS PLC
Algebris Allocation Fund
Unaudited Schedule of Investments (continued)
as at 30 June 2019
106
Holdings Financial Liabilities at Fair Value Through Profit or Loss Fair Value % of Net
EUR Asset Value
Forward Contracts*
Buy JPY 125,000 Sell EUR 1,025 17/07/2019 (6) -
Buy JPY 1,100 Sell EUR 09 17/07/2019 - -
Total Forward Contracts (6) -
Total Financial Liabilities at Fair Value Through Profit or
Loss (6) -
Net Financial Assets and Liabilities at Fair Value Through
Profit or Loss 9,163,101 86.66
Other Net Assets 1,410,389 13.34
Total Net Assets Attributable to Holders of Redeemable
Participating Shares 10,573,490 100.00
% of total
assets
Transferable securities admitted to an official stock
exchange listing or traded in a regulated market 2,001,970 18.79
Investment funds 7,158,037 67.17
Over the counter financial derivatives 3,100 0.03
Cash and other current assets 1,494,098 14.01
Total Assets 10,657,205 100.00
*The counterparty for all the forward contracts is HSBC Bank plc.

ALGEBRIS UCITS FUNDS PLC
Algebris Financial Equity Fund
Unaudited Schedule of Investments
as at 30 June 2019
107
Holdings Financial Assets at Fair Value Through Profit or Loss Fair Value % of Net
EUR Asset Value
Equity Securities
Austria 4,272,221 5.13
53,234 Erste Group Bank 1,737,558 2.09
122,863 Raiffeisen Bank International 2,534,663 3.04
Belgium 3,933,008 4.73
68,234 KBC Group 3,933,008 4.73
Bermuda 4,499,683 5.41
96,170 Athene Holding Class A 3,642,111 4.38
28,353 Lazard 857,572 1.03
Germany 2,461,579 2.96
122,234 Commerzbank 772,396 0.93
249,142 Deutsche Bank 1,689,183 2.03
Italy 6,222,073 7.48
47,190,745 Credito Valtellinese 2,666,277 3.21
368,603 Illimity Bank 3,273,195 3.93
161,671 Illimity Bank Rights 31/12/2099 282,601 0.34
Japan 887,509 1.07
67,001 Dai-ichi Life Holdings 887,509 1.07
Netherlands 4,713,158 5.67
250,500 ABN AMRO Group 4,713,158 5.67
Puerto Rico 1,263,072 1.52
26,477 Popular 1,263,072 1.52
Switzerland 3,464,215 4.16
328,498 Credit Suisse Group 3,464,215 4.16
United States 26,708,375 32.10
118,239 Apollo Global Management Class A 3,566,929 4.29
125,155 AXA Equitable Holdings 2,300,563 2.76
89,751 Blackstone Group 3,506,367 4.21
190,284 Carlyle Group 3,783,924 4.55
59,342 Citigroup 3,654,987 4.39

ALGEBRIS UCITS FUNDS PLC
Algebris Financial Equity Fund
Unaudited Schedule of Investments (continued)
as at 30 June 2019
108
Holdings Financial Assets at Fair Value Through Profit or Loss Fair Value % of Net
EUR Asset Value
Equity Securities (continued)
United States (continued)
46,509 Citizens Financial Group 1,446,401 1.74
27,391 Comerica 1,749,940 2.10
91,543 Keycorp 1,429,101 1.72
11,250 Prudential Financial 999,340 1.20
62,459 Synovus Financial 1,922,661 2.31
2,004 Victory Capital Holdings 30,280 0.04
47,657 Voya Financial 2,317,882 2.79
Total Equity Securities 58,424,893 70.23
Fixed Income Securities
Portugal 656,628 0.79
600,000 Banco Commercial Portuguese Perpetual 656,628 0.79
Spain 5,004,925 6.02
600,000 Banco Popular Espanol VAR Perpetual - -
5,000,000 Spain Letras Del Tesoro 0% 13/09/2019 5,004,925 6.02
Total Fixed Income Securities 5,661,553 6.81
Contracts For Difference*
(80,657) Hargreaves Lansdown 260,547 0.31
(61,329) MSAGHYDS 286,684 0.35
(97,400) Svenska Handelsbanken A Shares 102,412 0.12
351,249 UBI Banca - Unione di Banche Italiane 6,909 0.01
Total Contracts For Difference 656,552 0.79
Options
515 Berkshire Hathaway 200 Put 19/07/2019 19,024 0.02
800 Carlyle Group 22.5 Call 19/07/2019 45,734 0.06
333 CBOE SPX Volatility Index 25 Call 17/07/2019 5,858 0.01

ALGEBRIS UCITS FUNDS PLC
Algebris Financial Equity Fund
Unaudited Schedule of Investments (continued)
as at 30 June 2019
109
Holdings Financial Assets at Fair Value Through Profit or Loss Fair Value % of Net
EUR Asset Value
Options (continued)
270 CBOE SPX Volatility Index 30 Call 17/07/2019 2,612 -
640 Comerica 80 Call 19/07/2019 8,162 0.01
24 DAX Index 11350 Put 20/09/2019 9,984 0.01
125
Dow Jones EURO STOXX 50 (Price) Index 3125 Put
19/07/2019 1,750 -
60
Dow Jones EURO STOXX 50 (Price) Index 3175 Put
16/08/2019 5,640 0.01
234
Dow Jones EURO STOXX 50 (Price) Index 3200 Put
19/07/2019 5,616 0.01
200
Dow Jones EURO STOXX 50 (Price) Index 3275 Put
19/07/2019 9,600 0.01
105
Dow Jones EURO STOXX 50 (Price) Index 3350 Put
16/08/2019 30,135 0.04
610 E*Trade Financial 50 Call 16/08/2019 24,679 0.03
128 FactSet Research Systems 250 Put 16/08/2019 16,549 0.02
3,600,000 GBP Put / CHF Call 1.15 19/09/2019 3,855 -
2,675,000 GBP Put / USD Call 1.165 19/12/2019 14,334 0.02
640 iShares Edge MSCI ETF 58 Put 19/07/2019 11,258 0.01
375 Ishares U.S. Real Estate ETF 86 Put 19/07/2019 23,087 0.03
1,122 Keycorp 18 Call 19/07/2019 25,657 0.03
60 Market Axess Holdings 300 Put 19/07/2019 16,359 0.02
3 Nasdaq 100 Stock Index 6925 Put 16/08/2019 11,689 0.01
10 S&P 500 Index 2540 Put 20/09/2019 10,554 0.01
40 S&P 500 Index 2775 Put 19/07/2019 20,932 0.03
18 S&P 500 Index 2850 Put 31/07/2019 37,995 0.05
640 Toronto-Dominion Bank 74 Put 16/08/2019 32,675 0.04
625 US Bancorp 50 Put 19/07/2019 17,040 0.02
630 Voya Financial 60 Call 19/07/2019 2,770 -
1,480 Wells Fargo & 50 Call 16/08/2019 70,290 0.08
Total Options 483,838 0.58
Forward Contracts**
Buy EUR 34,807,222 Sell USD 39,198,000 17/07/2019 382,624 0.46
Buy CHF 2,924,698 Sell EUR 2,609,367 17/07/2019 26,174 0.04
Buy EUR 936,768 Sell JPY 114,266,000 17/07/2019 5,423 0.01
Buy CHF 245,692 Sell EUR 219,202 17/07/2019 2,199 -
Buy EUR 123,163 Sell USD 138,700 17/07/2019 1,354 -
Buy EUR 217,538 Sell USD 246,400 17/07/2019 1,144 -

ALGEBRIS UCITS FUNDS PLC
Algebris Financial Equity Fund
Unaudited Schedule of Investments (continued)
as at 30 June 2019
110
Holdings Financial Assets at Fair Value Through Profit or Loss Fair Value % of Net
EUR Asset Value
Forward Contracts** (continued)
Buy EUR 215,684 Sell USD 244,300 17/07/2019 1,134 -
Buy EUR 101,909 Sell GBP 91,000 17/07/2019 363 -
Buy USD 209,300 Sell EUR 183,608 17/07/2019 204 -
Buy GBP 64,000 Sell EUR 71,228 17/07/2019 189 -
Buy USD 190,300 Sell EUR 166,941 17/07/2019 185 -
Buy EUR 69,368 Sell GBP 62,000 17/07/2019 182 -
Buy EUR 31,342 Sell USD 35,500 17/07/2019 165 -
Buy AUD 34,000 Sell EUR 20,815 17/07/2019 156 -
Buy AUD 23,000 Sell EUR 14,036 17/07/2019 151 -
Buy AUD 21,000 Sell EUR 12,813 17/07/2019 140 -
Buy CHF 35,800 Sell EUR 32,136 17/07/2019 124 -
Buy GBP 41,600 Sell EUR 46,298 17/07/2019 123 -
Buy EUR 37,481 Sell GBP 33,500 17/07/2019 99 -
Buy EUR 35,472 Sell GBP 31,700 17/07/2019 98 -
Buy GBP 62,800 Sell EUR 69,990 17/07/2019 87 -
Buy EUR 22,398 Sell GBP 20,000 17/07/2019 80 -
Buy EUR 28,758 Sell GBP 25,700 17/07/2019 79 -
Buy GBP 24,400 Sell EUR 27,156 17/07/2019 72 -
Buy AUD 14,000 Sell EUR 8,566 17/07/2019 70 -
Buy AUD 11,000 Sell EUR 6,721 17/07/2019 64 -
Buy CHF 18,500 Sell EUR 16,624 17/07/2019 47 -
Buy EUR 54,619 Sell JPY 6,696,000 17/07/2019 42 -
Buy EUR 14,321 Sell GBP 12,800 17/07/2019 38 -
Buy CHF 103,000 Sell EUR 92,780 17/07/2019 37 -
Buy SEK 39,000 Sell EUR 3,664 17/07/2019 29 -
Buy USD 27,600 Sell EUR 24,212 17/07/2019 27 -
Buy EUR 2,920 Sell GBP 2,600 17/07/2019 19 -
Buy GBP 5,900 Sell EUR 6,566 17/07/2019 17 -
Buy EUR 2,358 Sell GBP 2,100 17/07/2019 14 -
Buy EUR 3,808 Sell GBP 3,400 17/07/2019 14 -
Buy EUR 2,384 Sell USD 2,700 17/07/2019 13 -
Buy CHF 30,700 Sell EUR 27,655 17/07/2019 10 -
Buy CHF 2,900 Sell EUR 2,603 17/07/2019 10 -
Buy CHF 1,500 Sell EUR 1,348 17/07/2019 4 -
Buy EUR 530 Sell USD 600 17/07/2019 3 -
Buy USD 2,100 Sell EUR 1,842 17/07/2019 2 -
Buy EUR 3,350 Sell GBP 3,000 17/07/2019 2 -
Buy EUR 224 Sell GBP 200 17/07/2019 1 -

ALGEBRIS UCITS FUNDS PLC
Algebris Financial Equity Fund
Unaudited Schedule of Investments (continued)
as at 30 June 2019
111
Holdings Financial Assets at Fair Value Through Profit or Loss Fair Value % of Net
EUR Asset Value
Forward Contracts** (continued)
Buy EUR 224 Sell GBP 200 17/07/2019 1 -
Buy GBP 200 Sell EUR 223 17/07/2019 1 -
Buy CHF 2,600 Sell EUR 2,342 17/07/2019 1 -
Buy EUR 61 Sell JPY 7,400 17/07/2019 1 -
Buy USD 121,000 Sell EUR 106,265 17/07/2019 - -
Buy USD 1,400 Sell EUR 1,230 17/07/2019 - -
Buy EUR 20,287 Sell USD 23,100 17/07/2019 - -
Buy USD 114,200 Sell EUR 100,293 17/07/2019 - -
Buy EUR 112 Sell GBP 100 17/07/2019 - -
Buy EUR 112 Sell GBP 100 17/07/2019 - -
Buy GBP 100 Sell EUR 111 17/07/2019 - -
Buy GBP 100 Sell EUR 112 17/07/2019 - -
Buy USD 300 Sell EUR 263 17/07/2019 - -
Buy USD 500 Sell EUR 439 17/07/2019 - -
Buy USD 17,500 Sell EUR 15,369 17/07/2019 - -
Buy JPY 3,500 Sell EUR 29 17/07/2019 - -
Buy EUR 65 Sell JPY 7,900 17/07/2019 - -
Buy JPY 5,600 Sell EUR 46 17/07/2019 - -
Buy JPY 6,700 Sell EUR 55 17/07/2019 - -
Total Forward Contracts 423,016 0.51
Total Financial Assets at Fair Value Through Profit or
Loss 65,649,852 78.92
Financial Liabilities at Fair Value Through Profit or Loss
Contracts For Difference*
2,065,300 Banco Bpm (455,698) (0.55)
2,193,984 Banco De Sabadell (191,772) (0.23)
743,408 Banco Santander (143,265) (0.17)
92,070 BNP Paribas (351,049) (0.42)
330,751 CaixaBank (693) -
(26,535) Commonwealth Bank of Australia (61,707) (0.07)
317,300 Credit Agricole (187,004) (0.23)
(7,626) FactSet Research Systems (272,240) (0.33)
(10,200) First Republic Bank (31,992) (0.04)
(412,740) HSBC Holdings (91,692) (0.11)
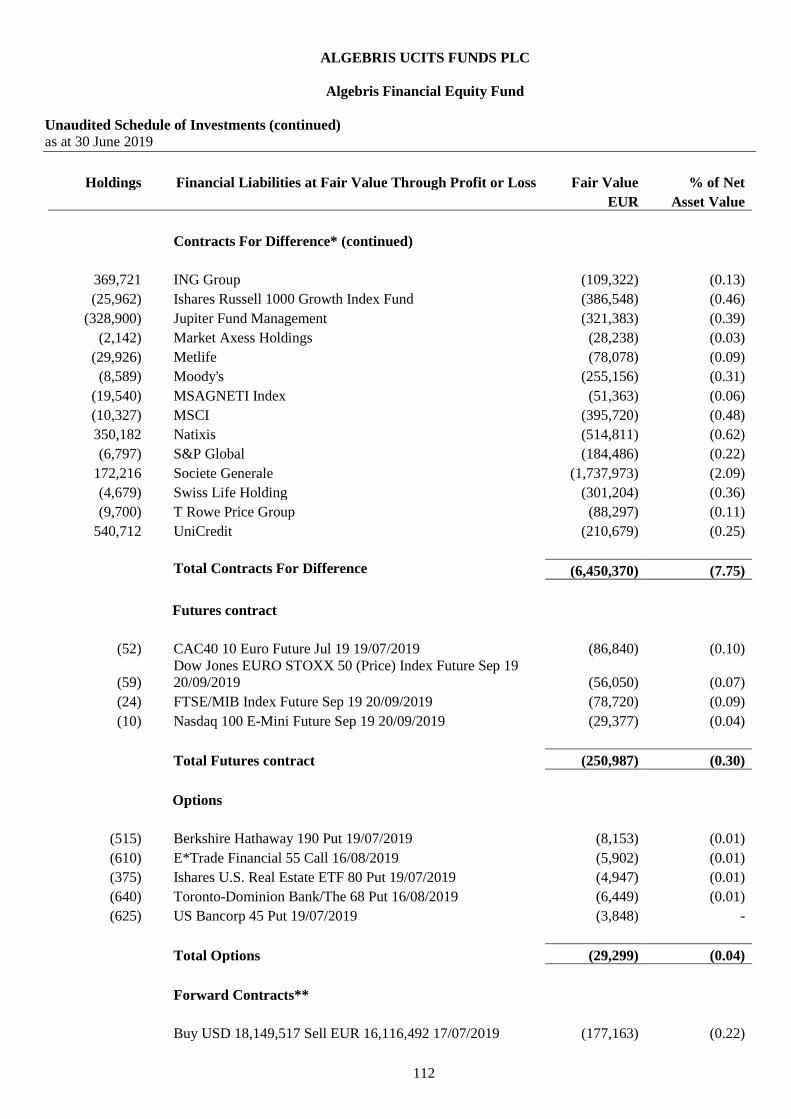
ALGEBRIS UCITS FUNDS PLC
Algebris Financial Equity Fund
Unaudited Schedule of Investments (continued)
as at 30 June 2019
112
Holdings Financial Liabilities at Fair Value Through Profit or Loss Fair Value % of Net
EUR Asset Value
Contracts For Difference* (continued)
369,721 ING Group (109,322) (0.13)
(25,962) Ishares Russell 1000 Growth Index Fund (386,548) (0.46)
(328,900) Jupiter Fund Management (321,383) (0.39)
(2,142) Market Axess Holdings (28,238) (0.03)
(29,926) Metlife (78,078) (0.09)
(8,589) Moody's (255,156) (0.31)
(19,540) MSAGNETI Index (51,363) (0.06)
(10,327) MSCI (395,720) (0.48)
350,182 Natixis (514,811) (0.62)
(6,797) S&P Global (184,486) (0.22)
172,216 Societe Generale (1,737,973) (2.09)
(4,679) Swiss Life Holding (301,204) (0.36)
(9,700) T Rowe Price Group (88,297) (0.11)
540,712 UniCredit (210,679) (0.25)
Total Contracts For Difference (6,450,370) (7.75)
Futures contract
(52) CAC40 10 Euro Future Jul 19 19/07/2019 (86,840) (0.10)
(59)
Dow Jones EURO STOXX 50 (Price) Index Future Sep 19
20/09/2019 (56,050) (0.07)
(24) FTSE/MIB Index Future Sep 19 20/09/2019 (78,720) (0.09)
(10) Nasdaq 100 E-Mini Future Sep 19 20/09/2019 (29,377) (0.04)
Total Futures contract (250,987) (0.30)
Options
(515) Berkshire Hathaway 190 Put 19/07/2019 (8,153) (0.01)
(610) E*Trade Financial 55 Call 16/08/2019 (5,902) (0.01)
(375) Ishares U.S. Real Estate ETF 80 Put 19/07/2019 (4,947) (0.01)
(640) Toronto-Dominion Bank/The 68 Put 16/08/2019 (6,449) (0.01)
(625) US Bancorp 45 Put 19/07/2019 (3,848) -
Total Options (29,299) (0.04)
Forward Contracts**
Buy USD 18,149,517 Sell EUR 16,116,492 17/07/2019 (177,163) (0.22)

ALGEBRIS UCITS FUNDS PLC
Algebris Financial Equity Fund
Unaudited Schedule of Investments (continued)
as at 30 June 2019
113
Holdings Financial Liabilities at Fair Value Through Profit or Loss Fair Value % of Net
EUR Asset Value
Forward Contracts** (continued)
Buy USD 18,026,000 Sell EUR 16,006,811 17/07/2019 (175,957) (0.22)
Buy EUR 3,124,427 Sell CHF 3,502,000 17/07/2019 (31,341) (0.04)
Buy USD 2,616,154 Sell EUR 2,323,105 17/07/2019 (25,537) (0.03)
Buy USD 1,503,000 Sell EUR 1,338,999 17/07/2019 (19,030) (0.02)
Buy USD 1,631,000 Sell EUR 1,448,303 17/07/2019 (15,921) (0.02)
Buy GBP 3,672,800 Sell EUR 4,113,105 17/07/2019 (14,668) (0.02)
Buy GBP 2,317,600 Sell EUR 2,595,440 17/07/2019 (9,256) (0.01)
Buy USD 768,000 Sell EUR 678,041 17/07/2019 (3,565) (0.01)
Buy GBP 559,248 Sell EUR 626,292 17/07/2019 (2,233) -
Buy USD 201,249 Sell EUR 178,706 17/07/2019 (1,964) -
Buy GBP 251,000 Sell EUR 281,882 17/07/2019 (1,794) -
Buy USD 245,800 Sell EUR 217,004 17/07/2019 (1,137) -
Buy USD 241,200 Sell EUR 212,943 17/07/2019 (1,115) -
Buy EUR 95,777 Sell SEK 1,021,000 17/07/2019 (922) -
Buy EUR 555,299 Sell USD 633,000 17/07/2019 (616) -
Buy EUR 385,636 Sell USD 439,800 17/07/2019 (606) -
Buy GBP 79,000 Sell EUR 88,734 17/07/2019 (578) -
Buy USD 42,771 Sell EUR 37,980 17/07/2019 (418) -
Buy USD 79,000 Sell EUR 69,745 17/07/2019 (365) -
Buy EUR 227,366 Sell USD 259,300 17/07/2019 (357) -
Buy EUR 225,174 Sell USD 256,800 17/07/2019 (354) -
Buy GBP 30,100 Sell EUR 33,795 17/07/2019 (207) -
Buy JPY 8,036,000 Sell EUR 65,703 17/07/2019 (204) -
Buy USD 35,700 Sell EUR 31,518 17/07/2019 (165) -
Buy GBP 21,600 Sell EUR 24,252 17/07/2019 (149) -
Buy GBP 73,000 Sell EUR 81,582 17/07/2019 (122) -
Buy GBP 26,500 Sell EUR 29,683 17/07/2019 (112) -
Buy EUR 10,374 Sell AUD 17,000 17/07/2019 (111) -
Buy GBP 24,900 Sell EUR 27,895 17/07/2019 (110) -
Buy GBP 22,000 Sell EUR 24,637 17/07/2019 (88) -
Buy GBP 11,000 Sell EUR 12,353 17/07/2019 (79) -
Buy GBP 13,818 Sell EUR 15,475 17/07/2019 (55) -
Buy EUR 5,628 Sell SEK 60,000 17/07/2019 (54) -
Buy EUR 32,619 Sell USD 37,200 17/07/2019 (51) -
Buy GBP 7,300 Sell EUR 8,196 17/07/2019 (50) -
Buy EUR 127,013 Sell CHF 141,000 17/07/2019 (47) -
Buy EUR 38,075 Sell CHF 42,300 17/07/2019 (43) -
Buy GBP 21,000 Sell EUR 23,474 17/07/2019 (41) -
Buy GBP 9,300 Sell EUR 10,406 17/07/2019 (29) -

ALGEBRIS UCITS FUNDS PLC
Algebris Financial Equity Fund
Unaudited Schedule of Investments (continued)
as at 30 June 2019
114
Holdings Financial Liabilities at Fair Value Through Profit or Loss Fair Value % of Net
EUR Asset Value
Forward Contracts** (continued)
Buy JPY 538,000 Sell EUR 4,411 17/07/2019 (27) -
Buy GBP 5,800 Sell EUR 6,495 17/07/2019 (23) -
Buy GBP 32,100 Sell EUR 35,841 17/07/2019 (21) -
Buy USD 72,600 Sell EUR 63,777 17/07/2019 (18) -
Buy GBP 3,000 Sell EUR 3,366 17/07/2019 (18) -
Buy EUR 36,388 Sell CHF 40,400 17/07/2019 (17) -
Buy USD 2,600 Sell EUR 2,295 17/07/2019 (12) -
Buy GBP 15,300 Sell EUR 17,083 17/07/2019 (10) -
Buy EUR 2,543 Sell USD 2,900 17/07/2019 (4) -
Buy EUR 3,150 Sell CHF 3,500 17/07/2019 (4) -
Buy GBP 3,800 Sell EUR 4,243 17/07/2019 (3) -
Buy USD 600 Sell EUR 530 17/07/2019 (3) -
Buy GBP 100 Sell EUR 112 17/07/2019 (1) -
Buy GBP 200 Sell EUR 225 17/07/2019 (1) -
Buy EUR 526 Sell USD 600 17/07/2019 (1) -
Buy EUR 3,062 Sell CHF 3,400 17/07/2019 (1) -
Buy USD 518,000 Sell EUR 454,921 17/07/2019 (1) -
Buy EUR 8,926 Sell GBP 8,000 17/07/2019 (1) -
Total Forward Contracts (486,780) (0.59)
Total Financial Liabilities at Fair Value Through Profit or
Loss (7,217,436) (8.68)
Net Financial Assets and Liabilities at Fair Value Through
Profit or Loss 58,432,416 70.24
Other Net Assets 24,758,122 29.76
Total Net Assets Attributable to Holders of Redeemable
Participating Shares 83,190,538 100.00

ALGEBRIS UCITS FUNDS PLC
Algebris Financial Equity Fund
Unaudited Schedule of Investments (continued)
as at 30 June 2019
115
Holdings Financial Liabilities at Fair Value Through Profit or Loss Fair Value % of total
EUR assets
Transferable securities admitted to an official stock
exchange listing or traded in a regulated market 64,086,446 68.51
Over the counter financial derivatives 1,563,406 1.67
Cash and other current assets 27,898,767 29.82
Total Assets 93,548,619 100.00
*The counterparties for all the contracts for differences are HSBC Bank plc and Morgan Stanley.
**The counterparty for all the forward contracts is HSBC Bank plc.

ALGEBRIS UCITS FUNDS PLC
Algebris Macro Credit Fund
Unaudited Schedule of Investments
as at 30 June 2019
116
Holdings Financial Assets at Fair Value Through Profit or Loss Fair Value % of Net
EUR Asset Value
Equity Securities
Italy 1,717,318 0.29
30,395,000 Credito Valtellinese 1,717,318 0.29
Total Equity Securities 1,717,318 0.29
Fixed Income Securities
Argentina 44,964,231 7.51
3,000,000 Agua Y Saneamientos 6.625% 01/02/2023 1,957,212 0.33
500,000 Provincia De Buenos Aire 5.375% 20/01/2023 383,250 0.06
10,350,000 Provincia De Buenos Aire 15/05/2035 6,417,893 1.07
13,348,206 Republic of Argentina (Series Dsc Eur) 7.82% 31/12/2033 10,968,888 1.83
1,376,104 Republic of Argentina (Series Dis Eur) 7.82% 31/12/2033 1,150,684 0.19
14,305,000 Republic of Argentina 5% 15/01/2027 10,511,314 1.76
13,400,000 Republic of Argentina 5.25% 15/01/2028 9,797,745 1.64
4,000,000 Republic of Argentina 6.25% 09/11/2047 2,911,480 0.49
1,000,000 Ypf Sociedad Anonima 8.5% 27/06/2029 865,765 0.14
Barbados 537,372 0.09
934,000 Government of Barbados 7.25% 15/12/2021 537,372 0.09
Bermuda 749,787 0.13
1,543,000 Digicel Group One 8.25% 30/12/2022 749,787 0.13
Brazil 7,525,903 1.26
3,000,000 Nota Do Tesouro Nacional (Series NTNF) 10% 01/01/2023 7,525,903 1.26
Cayman Islands 232,761 0.04
1,041,741 Odbrcht Offshre Drill Finance 7.72% 01/12/2026 231,529 0.04
151,439 Odebrecht Oil & Finance 0% Perpetual 1,232 -
Channel Island 956,985 0.16
1,000,000 Eagle Interest Glo/Ruyi 5.375% 01/05/2023 956,985 0.16
Ecuador 3,691,403 0.61
4,000,000 Republic of Ecuador 7.875% 23/01/2028 3,492,392 0.58
200,000 Republic of Ecuador 10.75% 31/01/2029 199,011 0.03

ALGEBRIS UCITS FUNDS PLC
Algebris Macro Credit Fund
Unaudited Schedule of Investments (continued)
as at 30 June 2019
117
Holdings Financial Assets at Fair Value Through Profit or Loss Fair Value % of Net
EUR Asset Value
Fixed Income Securities (continued)
Germany 7,217,466 1.20
1,460,000 Deutsche Bank London 8% 03/09/2019 214,671 0.04
1,500,000 Platin 1426 GMBH 5.375% 15/06/2023 1,517,985 0.25
3,000,000 Raffinerie Heide GMBH 6.375% 01/12/2022 2,421,255 0.40
3,000,000 Wittur International Holding GMBH 8.5% 15/02/2023 3,063,555 0.51
Indonesia 24,359,003 4.06
140,000,000,000 Indonesia Government (Series FR59) 7% 15/05/2027 8,568,088 1.43
145,000,000,000 Indonesia Government (Series FR65) 6.625% 15/05/2033 8,159,068 1.36
50,000,000,000 Indonesia Government (Series FR75) 7.5% 15/05/2038 3,015,124 0.50
70,000,000,000 Indonesia Government (Series FR78) 8.25% 15/05/2029 4,616,723 0.77
Italy 78,746,772 13.16
2,000,000 Banca Monte Dei Paschi VAR 18/01/2028 1,225,360 0.20
6,750,000 CMF 9% 15/06/2022 5,727,510 0.96
4,500,000 Cooperativa Muratori & C 6% 15/02/2023 218,475 0.04
6,500,000 Cooperativa Muratori & C 6.875% 01/08/2022 318,760 0.05
22,500,000 Intesa Sanpaola VAR Perpetual 23,185,575 3.87
12,500,000 Intesa Sanpaolo Perpetual (AM0179896 Corporation) 14,108,125 2.36
3,200,000 Unicredit Perpetual 2,727,217 0.46
15,000,000 Unicredit Perpetual (AQ4052637 Corporation) 13,668,750 2.28
17,600,000 Unicredit SPA VAR Perpetual 17,567,000 2.94
Jersey 1,676,660 0.28
2,000,000 Adient Global Holdings 3.5% 15/08/2024 1,676,660 0.28
Luxembourg 56,582,953 9.46
2,000,000 Aldesa Financial Services 7.25% 01/04/2021 1,103,680 0.18
5,000,000 Altice Finco (144A) 7.625% 15/02/2025 4,236,649 0.71
7,500,000 Altice Luxembourg 8% 15/05/2027 7,632,825 1.28
2,000,000 Altice Luxembourg 10.5% 15/05/2027 1,810,686 0.3
2,000,000 Cabot Financial Luxembourg 7.5% 01/10/2023 2,315,967 0.39
500,000 Codere Finance 2 Luxembourg (144A) 7.625% 01/11/2021 428,144 0.07
3,000,000 Codere Finance 2 Luxembourg 6.75% 01/11/2021 2,998,500 0.50
3,000,000 Codere Finance 2 Luxembourg 7.625% 01/11/2021 2,568,865 0.43
5,695,000 Crystal Almond Sarl 10% 01/11/2021 6,047,748 1.01
4,000,000 Garfunkelux Holdco 2 11% 01/11/2023 3,804,592 0.64
1,000,000 Garfunkelux Holdco 3 FRN 01/09/2023 847,620 0.14

ALGEBRIS UCITS FUNDS PLC
Algebris Macro Credit Fund
Unaudited Schedule of Investments (continued)
as at 30 June 2019
118
Holdings Financial Assets at Fair Value Through Profit or Loss Fair Value % of Net
EUR Asset Value
Fixed Income Securities (continued)
Luxembourg (continued)
2,000,000 Garfunkelux Holdco 3 7.5% 01/08/2022 1,838,130 0.31
3,000,000 Garfunkelux Holdco 3 8.5% 01/11/2022 3,036,975 0.51
32,800,000 Mitsubishi Ufj Investor (Series PRX) 15/12/2050 17,912,572 2.99
Marshall Islands 1,710,276 0.29
2,000,000 Navios Sa Logist/Financial (144A) 7.25% 01/05/2022 1,710,276 0.29
Mexico 33,974,688 5.67
130,000,000
Mex Bonos Desarr Fix Rights (Series M 20) 7.5%
03/06/2027 5,941,863 0.99
329,383,000 Petroleos Mexicanos (Series 14-2) 7.47% 12/11/2026 11,959,403 2.00
400,000,000 Petroleos Mexicanos 7.19% 12/09/2024 15,214,869 2.54
1,000,000 Unifin Financiera Sa De 7% 15/01/2025 858,553 0.14
Netherlands 13,076,940 2.19
3,000,000 Hema Bondco I 15/07/2022 2,700,585 0.45
800,000 Hema Bondco Ii Bv 8.5% 15/01/2023 546,784 0.09
2,500,000 Promontoria Holding FRN 15/08/2023 2,439,662 0.41
1,500,000 Promontoria Holding 6.75% 15/08/2023 1,447,072 0.24
3,500,000 Sigma Holdco 5.75% 15/05/2026 3,321,587 0.56
2,500,000 Summer Bidco Bv 9% 17/11/2025 2,621,250 0.44
Norway 601,964 0.10
675,000 Dno Asa 8.375% 29/05/2024 601,964 0.10
Portugal 10,410,272 1.74
4,400,000 Banco Comerc Portugues Perpetual 4,815,272 0.80
4,800,000 Caixa Geral De Depositos Perpetual 5,595,000 0.94
Russian Federation 28,043,375 4.69
650,000,000
Russia Government Bond - OFZ (Series 6027) 8.15%
03/02/2027 9,513,356 1.59
1,370,000,000
Russia Government Bond - OFZ (Series 6223) 6.5%
28/02/2024 18,530,019 3.10
South Africa 5,660,914 0.95
100,000,000 Republic of South Africa (Series 2048) 8.75% 28/02/2048 5,660,914 0.95
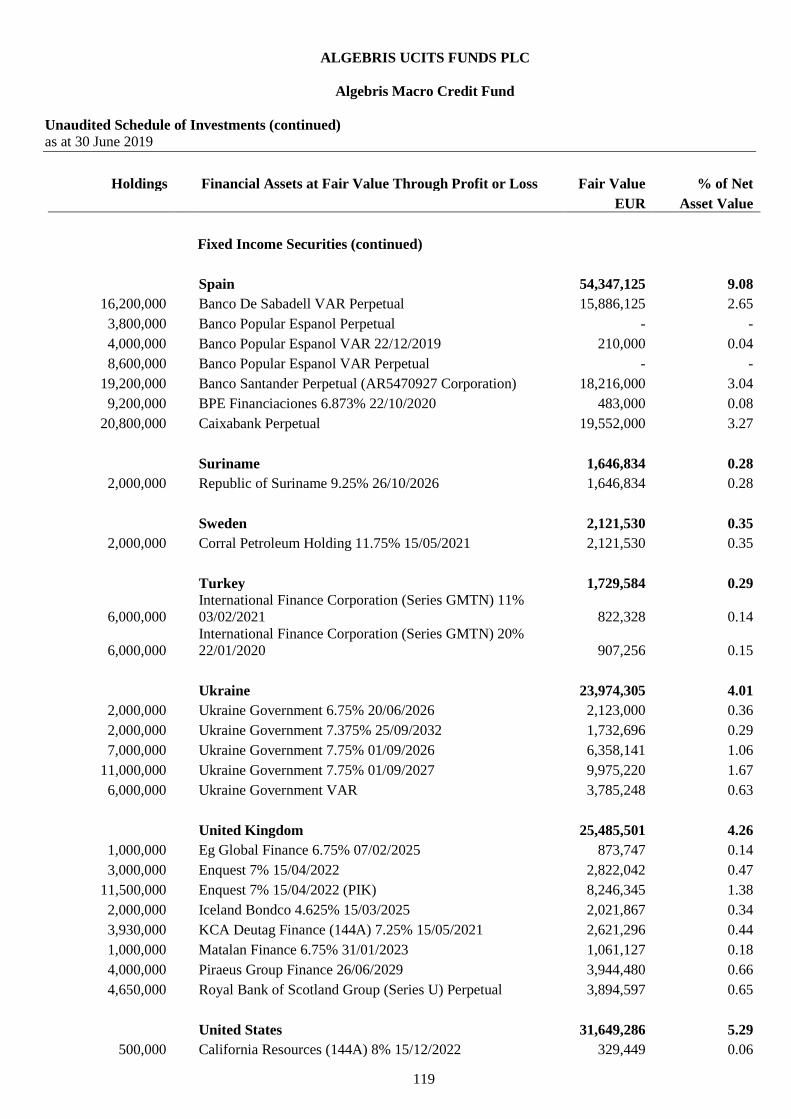
ALGEBRIS UCITS FUNDS PLC
Algebris Macro Credit Fund
Unaudited Schedule of Investments (continued)
as at 30 June 2019
119
Holdings Financial Assets at Fair Value Through Profit or Loss Fair Value % of Net
EUR Asset Value
Fixed Income Securities (continued)
Spain 54,347,125 9.08
16,200,000 Banco De Sabadell VAR Perpetual 15,886,125 2.65
3,800,000 Banco Popular Espanol Perpetual - -
4,000,000 Banco Popular Espanol VAR 22/12/2019 210,000 0.04
8,600,000 Banco Popular Espanol VAR Perpetual - -
19,200,000 Banco Santander Perpetual (AR5470927 Corporation) 18,216,000 3.04
9,200,000 BPE Financiaciones 6.873% 22/10/2020 483,000 0.08
20,800,000 Caixabank Perpetual 19,552,000 3.27
Suriname 1,646,834 0.28
2,000,000 Republic of Suriname 9.25% 26/10/2026 1,646,834 0.28
Sweden 2,121,530 0.35
2,000,000 Corral Petroleum Holding 11.75% 15/05/2021 2,121,530 0.35
Turkey 1,729,584 0.29
6,000,000
International Finance Corporation (Series GMTN) 11%
03/02/2021 822,328 0.14
6,000,000
International Finance Corporation (Series GMTN) 20%
22/01/2020 907,256 0.15
Ukraine 23,974,305 4.01
2,000,000 Ukraine Government 6.75% 20/06/2026 2,123,000 0.36
2,000,000 Ukraine Government 7.375% 25/09/2032 1,732,696 0.29
7,000,000 Ukraine Government 7.75% 01/09/2026 6,358,141 1.06
11,000,000 Ukraine Government 7.75% 01/09/2027 9,975,220 1.67
6,000,000 Ukraine Government VAR 3,785,248 0.63
United Kingdom 25,485,501 4.26
1,000,000 Eg Global Finance 6.75% 07/02/2025 873,747 0.14
3,000,000 Enquest 7% 15/04/2022 2,822,042 0.47
11,500,000 Enquest 7% 15/04/2022 (PIK) 8,246,345 1.38
2,000,000 Iceland Bondco 4.625% 15/03/2025 2,021,867 0.34
3,930,000 KCA Deutag Finance (144A) 7.25% 15/05/2021 2,621,296 0.44
1,000,000 Matalan Finance 6.75% 31/01/2023 1,061,127 0.18
4,000,000 Piraeus Group Finance 26/06/2029 3,944,480 0.66
4,650,000 Royal Bank of Scotland Group (Series U) Perpetual 3,894,597 0.65
United States 31,649,286 5.29
500,000 California Resources (144A) 8% 15/12/2022 329,449 0.06

ALGEBRIS UCITS FUNDS PLC
Algebris Macro Credit Fund
Unaudited Schedule of Investments (continued)
as at 30 June 2019
120
Holdings Financial Assets at Fair Value Through Profit or Loss Fair Value % of Net
EUR Asset Value
Fixed Income Securities (continued)
United States (continued)
3,000,000 California Resources 8% 15/12/2022 1,976,693 0.33
7,000,000 Chesapeake Energy (144A) Convertible 5.5% 15/09/2026 4,921,394 0.82
2,000,000
EP Energy/Everest Acquisition Finance (144A) 8%
29/11/2024 1,196,930 0.20
1,000,000 EP Energy/Everest Acquisition Finance 8% 29/11/2024 598,465 0.10
3,216,000 Sanchez Energy 6.125% 15/01/2023 130,501 0.02
985,000 Toys R US 7.375% 15/10/2018 15,161 -
25,000,000 US Treasury Note 2.25% 30/04/2024 22,480,693 3.76
Venezuela 1,388,786 0.23
3,170,000 Petroleos De Venezuela S 6% 16/05/2024 425,176 0.07
2,000,000 Petroleos De Venezuela S 6% 15/11/2026 321,020 0.05
2,000,000 Petroleos De Venezuela S 9% 17/11/2021 400,176 0.07
1,000,000 Petroleos De Venezuela S 12.75% 23/08/2022 242,414 0.04
Total Fixed Income Securities
463,062,676 77.38
Options
200,000,000
Algebris One Look Spread Option (10y USD - 2y USD)
0.5625% Put 08/04/2020 117,575 0.02
50,000,000 AUD Call / JPY Put 76 Knock Out Option 16/09/2019 68,918 0.01
158 DAX Index 11350 Put 20/09/2019 67,111 0.01
405
Dow Jones EURO STOXX 50 (Price) Index 3175 Put
16/08/2019 38,678 0.01
19,000,000 EUR Call / MXN Put 22.5 08/07/2019 11,059 -
30,000,000 EUR Call / RUB Put 75 Knock Out Option 05/07/2019 2,003 -
2,500,000 EUR Put / RUB Call 67 09/09/2019 Binary Option 18,473 -
2,500,000 EUR Put / RUB Call 67 Knock Out Option 09/09/2019 22,409 0.01
40,000,000 EUR Put / RUB Call 71 09/08/2019 118,043 0.02
20,000,000 EUR Put / RUB Call 71 09/09/2019 84,305 0.02
300 Euro-BTP Future Sep 19 137 Call 26/07/2019 99,000 0.02
29,500,000 GBP Put / CHF Call 1.15 19/09/2019 562 -
21,800,000 GBP Put / USD Call 1.165 19/12/2019 119,268 0.02
15,000,000 IDR Put / EUR Call 16480 Knock Out Option 04/07/2019 891 -
45,000,000
iTraxx Europe Crossover Index Series 31 Ver 1 5 Yr Credit
Default Swap Index 5% 20/06/2024 2.375% Call 21/08/2019 80,550 0.02
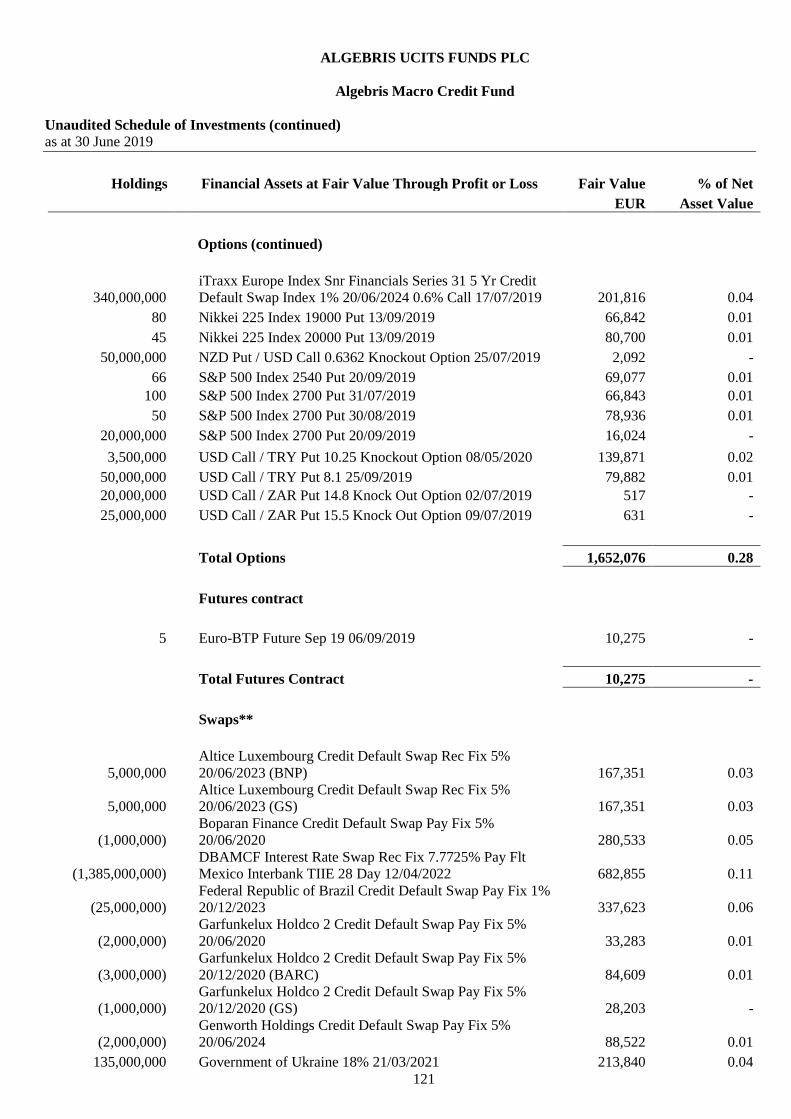
ALGEBRIS UCITS FUNDS PLC
Algebris Macro Credit Fund
Unaudited Schedule of Investments (continued)
as at 30 June 2019
121
Holdings Financial Assets at Fair Value Through Profit or Loss Fair Value % of Net
EUR Asset Value
Options (continued)
340,000,000
iTraxx Europe Index Snr Financials Series 31 5 Yr Credit
Default Swap Index 1% 20/06/2024 0.6% Call 17/07/2019 201,816 0.04
80 Nikkei 225 Index 19000 Put 13/09/2019 66,842 0.01
45 Nikkei 225 Index 20000 Put 13/09/2019 80,700 0.01
50,000,000 NZD Put / USD Call 0.6362 Knockout Option 25/07/2019 2,092 -
66 S&P 500 Index 2540 Put 20/09/2019 69,077 0.01
100 S&P 500 Index 2700 Put 31/07/2019 66,843 0.01
50 S&P 500 Index 2700 Put 30/08/2019 78,936 0.01
20,000,000 S&P 500 Index 2700 Put 20/09/2019 16,024 -
3,500,000 USD Call / TRY Put 10.25 Knockout Option 08/05/2020 139,871 0.02
50,000,000 USD Call / TRY Put 8.1 25/09/2019 79,882 0.01
20,000,000 USD Call / ZAR Put 14.8 Knock Out Option 02/07/2019 517 -
25,000,000 USD Call / ZAR Put 15.5 Knock Out Option 09/07/2019 631 -
Total Options 1,652,076 0.28
Futures contract
5 Euro-BTP Future Sep 19 06/09/2019 10,275 -
Total Futures Contract 10,275 -
Swaps**
5,000,000
Altice Luxembourg Credit Default Swap Rec Fix 5%
20/06/2023 (BNP) 167,351 0.03
5,000,000
Altice Luxembourg Credit Default Swap Rec Fix 5%
20/06/2023 (GS) 167,351 0.03
(1,000,000)
Boparan Finance Credit Default Swap Pay Fix 5%
20/06/2020 280,533 0.05
(1,385,000,000)
DBAMCF Interest Rate Swap Rec Fix 7.7725% Pay Flt
Mexico Interbank TIIE 28 Day 12/04/2022 682,855 0.11
(25,000,000)
Federal Republic of Brazil Credit Default Swap Pay Fix 1%
20/12/2023 337,623 0.06
(2,000,000)
Garfunkelux Holdco 2 Credit Default Swap Pay Fix 5%
20/06/2020 33,283 0.01
(3,000,000)
Garfunkelux Holdco 2 Credit Default Swap Pay Fix 5%
20/12/2020 (BARC) 84,609 0.01
(1,000,000)
Garfunkelux Holdco 2 Credit Default Swap Pay Fix 5%
20/12/2020 (GS) 28,203 -
(2,000,000)
Genworth Holdings Credit Default Swap Pay Fix 5%
20/06/2024 88,522 0.01
135,000,000 Government of Ukraine 18% 21/03/2021 213,840 0.04

ALGEBRIS UCITS FUNDS PLC
Algebris Macro Credit Fund
Unaudited Schedule of Investments (continued)
as at 30 June 2019
122
Holdings Financial Assets at Fair Value Through Profit or Loss Fair Value % of Net
EUR Asset Value
Swaps** (continued)
(6,000,000)
Groupe Auchan Credit Default Swap Pay Fix 1%
20/06/2024 339,401 0.06
10,000,000
Hellenic Republic Credit Default Swap Rec Fix 1%
20/06/2020 15,914 -
35,500,000
iTraxx Europe Crossover Index Series 28 Ver 1 3 Yr Credit
Default Swap Index 5% 20/12/2022 (BNP) 3,003,257 0.50
21,000,000
iTraxx Europe Crossover Index Series 28 Ver 1 3 Yr Credit
Default Swap Index 5% 20/12/2022 (ML) 1,776,574 0.30
33,500,000
iTraxx Europe Crossover Index Series 31 Ver 1 5 Yr Credit
Default Swap Index 5% 20/06/2024 (ML) 3,812,256 0.64
(3,000,000)
Lebanese Republic Credit Default Swap Pay Fix 1%
20/12/2023 710,226 0.12
(2,000,000) Metro Bank Bond Swap 26/06/2028 14,142 -
(1,000,000)
Pizzaexpress Financing 1 Credit Default Swap Pay Fix 5%
20/06/2020 (BNP) 218,745 0.04
(2,000,000)
Pizzaexpress Financing 1 Credit Default Swap Pay Fix 5%
20/06/2020 (GS) 437,490 0.07
(5,000,000)
Republic of Argentina Credit Default Swap Pay Fix 5%
20/06/2020 246,194 0.04
(30,000,000)
Republic of Argentina Credit Default Swap Pay Fix 5%
20/06/2023 3,864,024 0.65
(10,000,000)
Republic of Argentina Credit Default Swap Pay Fix 5%
20/06/2024 (BARC) 1,432,186 0.24
(10,000,000)
Republic of Argentina Credit Default Swap Pay Fix 5%
20/06/2024 (JPM) 1,432,186 0.24
(4,000,000) Tesla Credit Default Swap Pay Fix 1% 20/06/2023 476,211 0.08
(3,000,000)
Thomas Cook Group Credit Default Swap Pay Fix 5%
20/06/2023 1,876,494 0.31
(1,000,000)
Thomas Cook Group Credit Default Swap Pay Fix 5%
20/12/2019 427,572 0.07
319,678,000 Ukraine T-Bill (Series 364D) 0% Bond Swap 04/12/2019 545,043 0.09
Total Swaps 22,712,085 3.80
Forward Contracts*
Buy EUR 105,545,791 Sell USD 118,859,928 17/07/2019 1,160,228 0.19
Buy AUD 30,000,000 Sell JPY 2,248,080,000 19/08/2019 154,094 0.03
Buy AUD 25,000,000 Sell JPY 1,878,362,500 18/07/2019 109,546 0.02
Buy MXN 98,620,000 Sell USD 5,000,000 10/07/2019 106,776 0.02
Buy MXN 98,570,000 Sell USD 5,000,000 10/07/2019 104,494 0.02
Buy MXN 98,520,000 Sell USD 5,000,000 10/07/2019 102,212 0.02
Buy ZAR 40,000,000 Sell MXN 53,126,000 08/07/2019 68,552 0.01
Buy ARS 135,750,000 Sell USD 3,000,000 24/07/2019 65,931 0.01

ALGEBRIS UCITS FUNDS PLC
Algebris Macro Credit Fund
Unaudited Schedule of Investments (continued)
as at 30 June 2019
123
Holdings Financial Assets at Fair Value Through Profit or Loss Fair Value % of Net
EUR Asset Value
Forward Contracts* (continued)
Buy ZAR 30,000,000 Sell MXN 39,546,900 08/07/2019 65,002 0.01
Buy EUR 17,720,239 Sell GBP 15,823,300 17/07/2019 63,192 0.01
Buy ZAR 30,000,000 Sell MXN 39,693,900 08/07/2019 58,290 0.01
Buy AUD 10,000,000 Sell JPY 750,860,000 19/08/2019 39,141 0.01
Buy AUD 25,000,000 Sell JPY 1,888,175,000 18/07/2019 29,568 0.01
Buy AUD 9,000,000 Sell JPY 676,494,000 19/08/2019 29,360 -
Buy NZD 1,775,000 Sell EUR 1,027,811 17/07/2019 19,994 -
Buy ARS 89,100,000 Sell USD 2,000,000 24/07/2019 16,119 -
Buy USD 9,687,000 Sell EUR 8,491,856 17/07/2019 15,493 -
Buy EUR 842,431 Sell USD 948,700 17/07/2019 9,261 -
Buy AUD 3,325,000 Sell EUR 2,044,251 17/07/2019 6,628 -
Buy AUD 1,000,000 Sell JPY 75,165,000 19/08/2019 3,270 -
Buy CHF 304,000 Sell EUR 271,224 17/07/2019 2,721 -
Buy EUR 623,775 Sell GBP 557,000 17/07/2019 2,224 -
Buy EUR 231,392 Sell JPY 28,225,000 17/07/2019 1,340 -
Buy AUD 173,000 Sell EUR 105,557 17/07/2019 1,150 -
Buy EUR 1,412,395 Sell USD 1,607,000 17/07/2019 1,090 -
Buy AUD 158,000 Sell EUR 96,648 17/07/2019 807 -
Buy AUD 128,000 Sell EUR 78,205 17/07/2019 746 -
Buy USD 5,000,000 Sell MXN 96,270,000 10/07/2019 467 -
Buy CHF 47,200 Sell EUR 42,111 17/07/2019 422 -
Buy CHF 29,600 Sell EUR 26,409 17/07/2019 265 -
Buy EUR 18,470 Sell USD 20,800 17/07/2019 203 -
Buy EUR 20,986 Sell JPY 2,550,000 17/07/2019 201 -
Buy EUR 22,772 Sell JPY 2,775,000 17/07/2019 154 -
Buy CHF 5,700 Sell EUR 5,102 17/07/2019 35 -
Buy EUR 10,371 Sell USD 11,800 17/07/2019 8 -
Buy CHF 2,000 Sell EUR 1,795 17/07/2019 7 -
Buy CHF 900 Sell EUR 806 17/07/2019 6 -
Buy EUR 9,602 Sell GBP 8,600 17/07/2019 6 -
Buy GBP 3,000 Sell EUR 3,343 17/07/2019 4 -
Buy CHF 500 Sell EUR 448 17/07/2019 3 -
Buy CHF 2,900 Sell EUR 2,612 17/07/2019 1 -
Buy CHF 300 Sell EUR 269 17/07/2019 1 -
Buy EUR 1,675 Sell GBP 1,500 17/07/2019 1 -
Buy CHF 200 Sell EUR 180 17/07/2019 1 -
Buy EUR 782 Sell GBP 700 17/07/2019 1 -
Buy CHF 400 Sell EUR 360 17/07/2019 - -
Buy EUR 112 Sell GBP 100 17/07/2019 - -
Buy EUR 263 Sell USD 300 17/07/2019 - -

ALGEBRIS UCITS FUNDS PLC
Algebris Macro Credit Fund
Unaudited Schedule of Investments (continued)
as at 30 June 2019
124
Holdings Financial Assets at Fair Value Through Profit or Loss Fair Value % of Net
EUR Asset Value
Forward Contracts* (continued)
Buy EUR 558 Sell GBP 500 17/07/2019 - -
Buy JPY 2,900 Sell EUR 24 17/07/2019 - -
Buy JPY 4,700 Sell EUR 39 17/07/2019 - -
Buy EUR 29 Sell JPY 3,500 17/07/2019 - -
Buy EUR 16,598 Sell USD 18,900 17/07/2019 - -
Buy EUR 223 Sell GBP 200 17/07/2019 - -
Buy EUR 4,303 Sell USD 4,900 17/07/2019 - -
Buy GBP 100 Sell EUR 112 17/07/2019 - -
Buy EUR 14,930 Sell USD 17,000 17/07/2019 - -
Buy CHF 300 Sell EUR 270 17/07/2019 - -
Buy EUR 3,162 Sell USD 3,600 17/07/2019 - -
Buy EUR 51,640 Sell USD 58,800 17/07/2019 - -
Total Forward Contracts 2,239,015 0.37
Total Financial Assets at Fair Value Through Profit or Loss
491,393,445 82.12
Financial Liabilities at Fair Value Through Profit or Loss
Repurchase Agreements
800,000
Aldesa Financial Services 7.25% 01/04/2021 (Repo Rate:
(1.25%) @ 39.8815278) (319,052) (0.05)
3,200,000
CMA CGM 6.5% 15/07/2022 (Repo Rate: (1.3%) @
88.4288888) (2,688,238) (0.45)
500,000 CMF 9% 15/06/2022 (Repo Rate: (1.5%) @ 102.225) (485,569) (0.08)
1,000,000 CMF 9% 15/06/2022 (Repo Rate: (1.5%) @ 94.625) (898,937) (0.15)
500,000 CMF 9% 15/06/2022 (Repo Rate: (1.5%) @ 94.675) (449,706) (0.07)
1,000,000
Cooperativa Muratori & C 6.875% 01/08/2022 (Repo Rate:
(2.5%) @ 6.175) (61,750) (0.01)
2,000,000
Garfunkelux Holdco 3 7.5% 01/08/2022 (Repo Rate: (2.5%) @
96.7916663) (1,839,042) (0.31)
1,000,000
Garfunkelux Holdco 3 FRN 01/09/2023 (Repo Rate: (1.75%) @
87.1125) (827,569) (0.14)
2,000,000
Promontoria Holding FRN 15/08/2023 (Rate: (1.5%) @
94.1815486) (1,883,631) (0.31)
800,000
Raffinerie Heide GMBH 6.375% 01/12/2022 (Repo Rate: (1.75)
@ 69.5077) (556,062) (0.09)
2,200,000
Raffinerie Heide GMBH 6.375% 01/12/2022 (Repo Rate: (1.75)
@ 99.5430416) (2,080,450) (0.35)
2,800,000
Sigma Holdco 5.75% 15/05/2026 (Repo Rate: (1.25%) @
95.6855831) (2,545,237) (0.43)
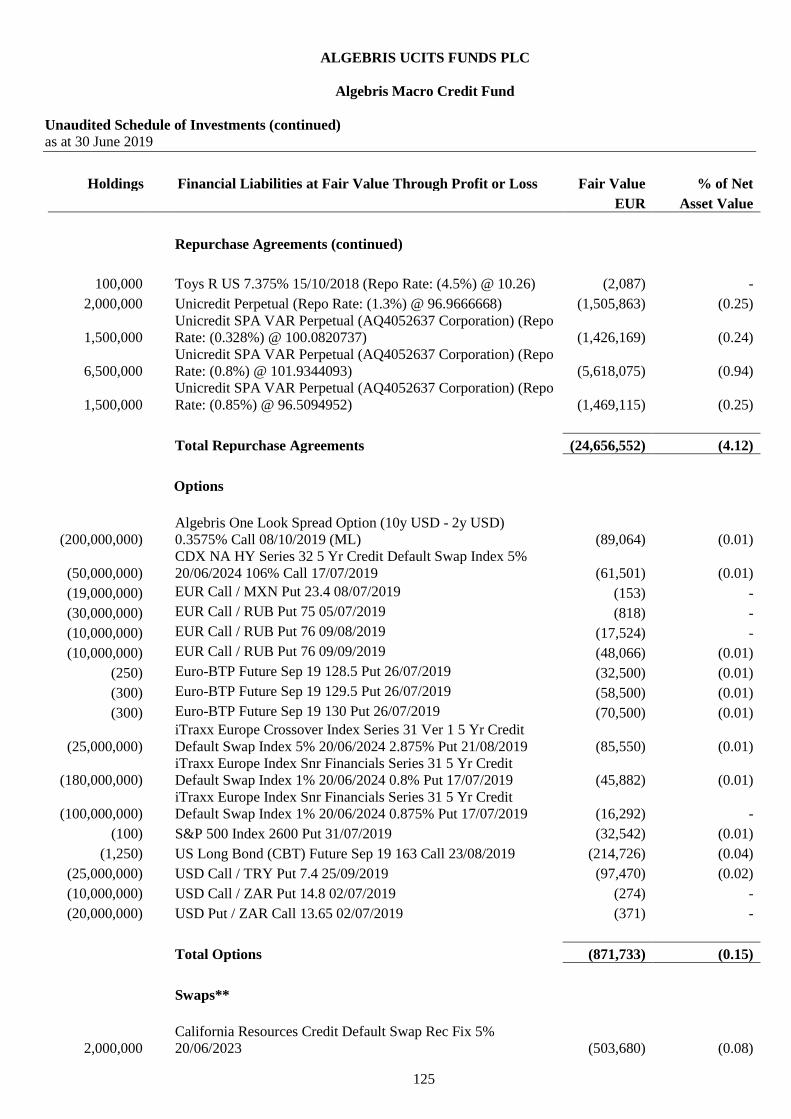
ALGEBRIS UCITS FUNDS PLC
Algebris Macro Credit Fund
Unaudited Schedule of Investments (continued)
as at 30 June 2019
125
Holdings Financial Liabilities at Fair Value Through Profit or Loss Fair Value % of Net
EUR Asset Value
Repurchase Agreements (continued)
100,000 Toys R US 7.375% 15/10/2018 (Repo Rate: (4.5%) @ 10.26) (2,087) -
2,000,000 Unicredit Perpetual (Repo Rate: (1.3%) @ 96.9666668) (1,505,863) (0.25)
1,500,000
Unicredit SPA VAR Perpetual (AQ4052637 Corporation) (Repo
Rate: (0.328%) @ 100.0820737) (1,426,169) (0.24)
6,500,000
Unicredit SPA VAR Perpetual (AQ4052637 Corporation) (Repo
Rate: (0.8%) @ 101.9344093) (5,618,075) (0.94)
1,500,000
Unicredit SPA VAR Perpetual (AQ4052637 Corporation) (Repo
Rate: (0.85%) @ 96.5094952) (1,469,115) (0.25)
Total Repurchase Agreements (24,656,552) (4.12)
Options
(200,000,000)
Algebris One Look Spread Option (10y USD - 2y USD)
0.3575% Call 08/10/2019 (ML) (89,064) (0.01)
(50,000,000)
CDX NA HY Series 32 5 Yr Credit Default Swap Index 5%
20/06/2024 106% Call 17/07/2019 (61,501) (0.01)
(19,000,000) EUR Call / MXN Put 23.4 08/07/2019 (153) -
(30,000,000) EUR Call / RUB Put 75 05/07/2019 (818) -
(10,000,000) EUR Call / RUB Put 76 09/08/2019 (17,524) -
(10,000,000) EUR Call / RUB Put 76 09/09/2019 (48,066) (0.01)
(250) Euro-BTP Future Sep 19 128.5 Put 26/07/2019 (32,500) (0.01)
(300) Euro-BTP Future Sep 19 129.5 Put 26/07/2019 (58,500) (0.01)
(300) Euro-BTP Future Sep 19 130 Put 26/07/2019 (70,500) (0.01)
(25,000,000)
iTraxx Europe Crossover Index Series 31 Ver 1 5 Yr Credit
Default Swap Index 5% 20/06/2024 2.875% Put 21/08/2019 (85,550) (0.01)
(180,000,000)
iTraxx Europe Index Snr Financials Series 31 5 Yr Credit
Default Swap Index 1% 20/06/2024 0.8% Put 17/07/2019 (45,882) (0.01)
(100,000,000)
iTraxx Europe Index Snr Financials Series 31 5 Yr Credit
Default Swap Index 1% 20/06/2024 0.875% Put 17/07/2019 (16,292) -
(100) S&P 500 Index 2600 Put 31/07/2019 (32,542) (0.01)
(1,250) US Long Bond (CBT) Future Sep 19 163 Call 23/08/2019 (214,726) (0.04)
(25,000,000) USD Call / TRY Put 7.4 25/09/2019 (97,470) (0.02)
(10,000,000) USD Call / ZAR Put 14.8 02/07/2019 (274) -
(20,000,000) USD Put / ZAR Call 13.65 02/07/2019 (371) -
Total Options (871,733) (0.15)
Swaps**
2,000,000
California Resources Credit Default Swap Rec Fix 5%
20/06/2023 (503,680) (0.08)

ALGEBRIS UCITS FUNDS PLC
Algebris Macro Credit Fund
Unaudited Schedule of Investments (continued)
as at 30 June 2019
126
Holdings Financial Liabilities at Fair Value Through Profit or Loss Fair Value % of Net
EUR Asset Value
Swaps** (continued)
5,000,000
CDX NA HY Series 25 5 Yr Credit Default Swap Index 5%
20/12/2020 (502,469) (0.08)
3,000,000
Chesapeake Energy Credit Default Swap Rec Fix 5%
20/06/2023 (200,995) (0.03)
1,000,000
Garfunkelux Holdco 2 Credit Default Swap Rec Fix 5%
20/06/2022 (JPM) (87,809) (0.01)
2,000,000
Garfunkelux Holdco 2 Credit Default Swap Rec Fix 5%
20/06/2022 (ML) (175,618) (0.03)
100,000,000 Government of Ukraine 16.75% 02/06/2021 (151,145) (0.03)
10,000,000
Hellenic Republic Credit Default Swap Rec Fix 1% 20/06/2021
(BARC) (38,147) (0.01)
15,000,000
Hellenic Republic Credit Default Swap Rec Fix 1% 20/06/2022
(GS) (293,796) (0.05)
2,000,000
Hellenic Republic Credit Default Swap Rec Fix 1% 20/06/2022
(JPM) (39,173) (0.01)
5,000,000
Hellenic Republic Credit Default Swap Rec Fix 1% 20/06/2023
(BNP) (205,533) (0.03)
10,000,000
Hellenic Republic Credit Default Swap Rec Fix 1% 20/06/2023
(CITI) (411,066) (0.07)
20,000,000
Hellenic Republic Credit Default Swap Rec Fix 1% 20/06/2023
(ML) (822,131) (0.14)
8,000,000
Hellenic Republic Credit Default Swap Rec Fix 1% 20/12/2022
(GS) (244,552) (0.04)
12,000,000
Hellenic Republic Credit Default Swap Rec Fix 1% 20/12/2022
(JPM) (366,828) (0.06)
7,000,000
Hellenic Republic Credit Default Swap Rec Fix 1% 20/12/2022
(ML) (213,983) (0.04)
4,000,000 Hema Bondco I Credit Default Swap Rec Fix 5% 20/06/2024 (359,688) (0.06)
(1,000,000) International Design Group FRN 15/11/2025 (32,318) (0.01)
(2,700,000) International Design Group 6.5% 15/11/2025 (179,246) (0.03)
(15,000,000)
iTraxx Europe Crossover Index Series 24 Ver 1 5 Yr Credit
Default Swap Index 5% 20/12/2020 (779,580) (0.13)
5,000,000
iTraxx Europe Crossover Index Series 24 Ver 1 5 Yr Credit
Default Swap Index 5% 20/12/2020 (ML) (1,520,147) (0.25)
5,000,000
iTraxx Europe Crossover Index Series 28 Ver 1 5 Yr Credit
Default Swap Index 5% 20/12/2022 (2,430,596) (0.41)
(3,000,000)
Jaguar Land Rover Automo Credit Default Swap Pay Fix 5%
20/12/2021 (JPM) (39,755) (0.01)
(2,000,000)
Jaguar Land Rover Automo Credit Default Swap Pay Fix 5%
20/12/2021 (MSI) (26,503) -
(1,000,000) Officine Maccaferri 5.75% 01/06/2021 (62,301) (0.01)
10,000,000
Pemex Project Funding Master Trust Credit Default Swap Rec
Fix 1% 20/12/2023 (JPM) (868,141) -0.15
10,000,000
Pemex Project Funding Master Trust Credit Default Swap Rec
Fix 1% 20/06/2024 (HSBC) (1,005,877) -0.17

ALGEBRIS UCITS FUNDS PLC
Algebris Macro Credit Fund
Unaudited Schedule of Investments (continued)
as at 30 June 2019
127
Holdings Financial Liabilities at Fair Value Through Profit or Loss Fair Value % of Net
EUR Asset Value
Swaps** (continued)
25,000,000
Turkey (Republic of) Credit Default Swap Rec Fix 1%
20/12/2021 (HSBC) (1,259,125) (0.21)
25,000,000
Turkey (Republic of) Credit Default Swap Rec Fix 1%
20/12/2021 (ML) (1,259,125) (0.21)
8,000,000
Ukraine Government Credit Default Swap Rec Fix 5%
20/12/2023 (18,678) -
3,000,000
Ukraine Government Credit Default Swap Rec Fix 5%
20/06/2024 (17,323) -
Total Swaps (14,115,328) (2.36)
Contracts For Difference***
(245,988) ML Custom Index 15/11/2019 (1,651,416) (0.28)
(217,033) MLALHYCS (1,105,207) (0.18)
Total Contracts For Difference (2,756,623) (0.46)
Futures Contract
(60) Nasdaq 100 E-Mini Future Sep 19 20/09/2019 (147,361) (0.03)
250 Short Euro-BTP Future Sep 19 06/09/2019 (16,150) -
Total Futures Contract (163,511) (0.03)
Forward Contracts*
Buy JPY 3,726,375,000 Sell AUD 50,000,000 18/07/2019 (466,464) (0.08)
Buy JPY 3,762,450,000 Sell AUD 50,000,000 19/08/2019 (129,293) (0.02)
Buy MXN 134,400,000 Sell ZAR 100,000,000 08/07/2019 (99,011) (0.02)
Buy USD 5,000,000 Sell MXN 97,287,500 10/07/2019 (45,967) (0.01)
Buy USD 5,000,000 Sell MXN 97,287,500 10/07/2019 (45,967) (0.01)
Buy USD 4,123,800 Sell EUR 3,661,871 17/07/2019 (40,254) (0.01)
Buy USD 3,823,400 Sell EUR 3,395,120 17/07/2019 (37,321) (0.01)
Buy USD 7,410,000 Sell EUR 6,542,035 17/07/2019 (34,400) -
Buy USD 3,774,000 Sell EUR 3,331,867 17/07/2019 (17,452) -
Buy EUR 1,361,485 Sell AUD 2,231,000 17/07/2019 (14,608) -
Buy EUR 512,609 Sell NZD 887,000 17/07/2019 (10,998) -
Buy USD 1,114,300 Sell EUR 989,481 17/07/2019 (10,877) -
Buy USD 795,000 Sell EUR 705,948 17/07/2019 (7,760) -
Buy EUR 3,131,213 Sell USD 3,571,000 17/07/2019 (4,923) -
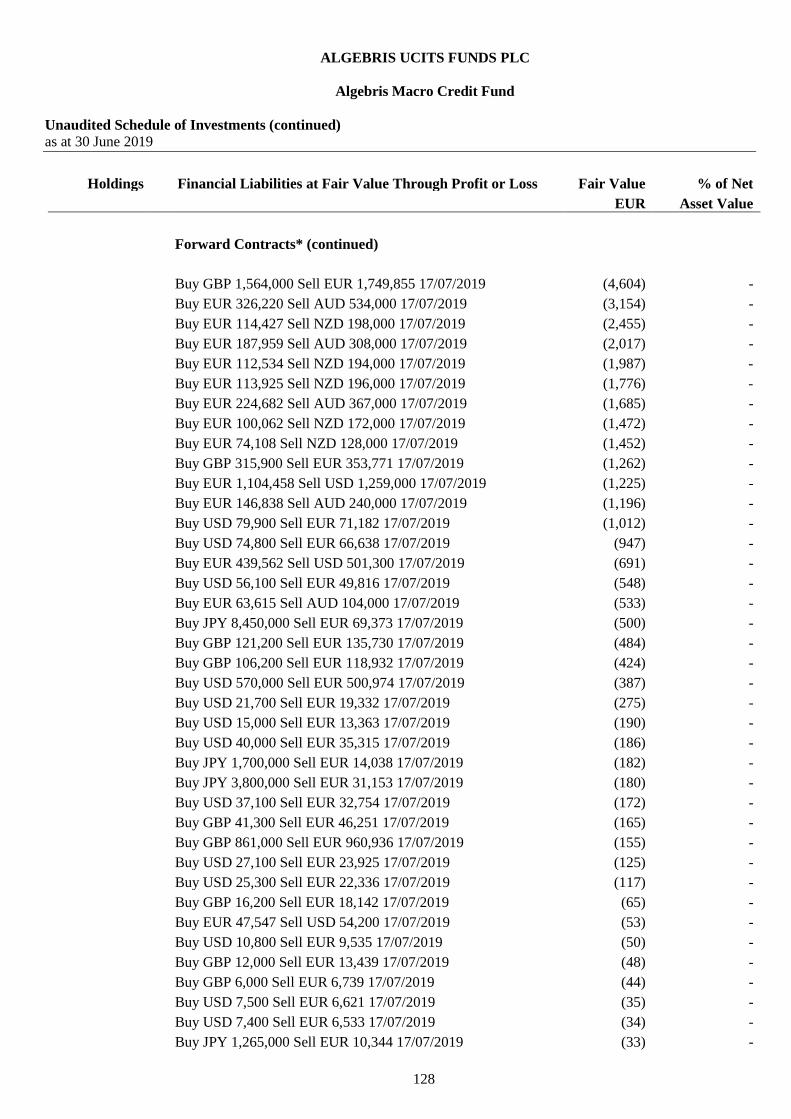
ALGEBRIS UCITS FUNDS PLC
Algebris Macro Credit Fund
Unaudited Schedule of Investments (continued)
as at 30 June 2019
128
Holdings Financial Liabilities at Fair Value Through Profit or Loss Fair Value % of Net
EUR Asset Value
Forward Contracts* (continued)
Buy GBP 1,564,000 Sell EUR 1,749,855 17/07/2019 (4,604) -
Buy EUR 326,220 Sell AUD 534,000 17/07/2019 (3,154) -
Buy EUR 114,427 Sell NZD 198,000 17/07/2019 (2,455) -
Buy EUR 187,959 Sell AUD 308,000 17/07/2019 (2,017) -
Buy EUR 112,534 Sell NZD 194,000 17/07/2019 (1,987) -
Buy EUR 113,925 Sell NZD 196,000 17/07/2019 (1,776) -
Buy EUR 224,682 Sell AUD 367,000 17/07/2019 (1,685) -
Buy EUR 100,062 Sell NZD 172,000 17/07/2019 (1,472) -
Buy EUR 74,108 Sell NZD 128,000 17/07/2019 (1,452) -
Buy GBP 315,900 Sell EUR 353,771 17/07/2019 (1,262) -
Buy EUR 1,104,458 Sell USD 1,259,000 17/07/2019 (1,225) -
Buy EUR 146,838 Sell AUD 240,000 17/07/2019 (1,196) -
Buy USD 79,900 Sell EUR 71,182 17/07/2019 (1,012) -
Buy USD 74,800 Sell EUR 66,638 17/07/2019 (947) -
Buy EUR 439,562 Sell USD 501,300 17/07/2019 (691) -
Buy USD 56,100 Sell EUR 49,816 17/07/2019 (548) -
Buy EUR 63,615 Sell AUD 104,000 17/07/2019 (533) -
Buy JPY 8,450,000 Sell EUR 69,373 17/07/2019 (500) -
Buy GBP 121,200 Sell EUR 135,730 17/07/2019 (484) -
Buy GBP 106,200 Sell EUR 118,932 17/07/2019 (424) -
Buy USD 570,000 Sell EUR 500,974 17/07/2019 (387) -
Buy USD 21,700 Sell EUR 19,332 17/07/2019 (275) -
Buy USD 15,000 Sell EUR 13,363 17/07/2019 (190) -
Buy USD 40,000 Sell EUR 35,315 17/07/2019 (186) -
Buy JPY 1,700,000 Sell EUR 14,038 17/07/2019 (182) -
Buy JPY 3,800,000 Sell EUR 31,153 17/07/2019 (180) -
Buy USD 37,100 Sell EUR 32,754 17/07/2019 (172) -
Buy GBP 41,300 Sell EUR 46,251 17/07/2019 (165) -
Buy GBP 861,000 Sell EUR 960,936 17/07/2019 (155) -
Buy USD 27,100 Sell EUR 23,925 17/07/2019 (125) -
Buy USD 25,300 Sell EUR 22,336 17/07/2019 (117) -
Buy GBP 16,200 Sell EUR 18,142 17/07/2019 (65) -
Buy EUR 47,547 Sell USD 54,200 17/07/2019 (53) -
Buy USD 10,800 Sell EUR 9,535 17/07/2019 (50) -
Buy GBP 12,000 Sell EUR 13,439 17/07/2019 (48) -
Buy GBP 6,000 Sell EUR 6,739 17/07/2019 (44) -
Buy USD 7,500 Sell EUR 6,621 17/07/2019 (35) -
Buy USD 7,400 Sell EUR 6,533 17/07/2019 (34) -
Buy JPY 1,265,000 Sell EUR 10,344 17/07/2019 (33) -
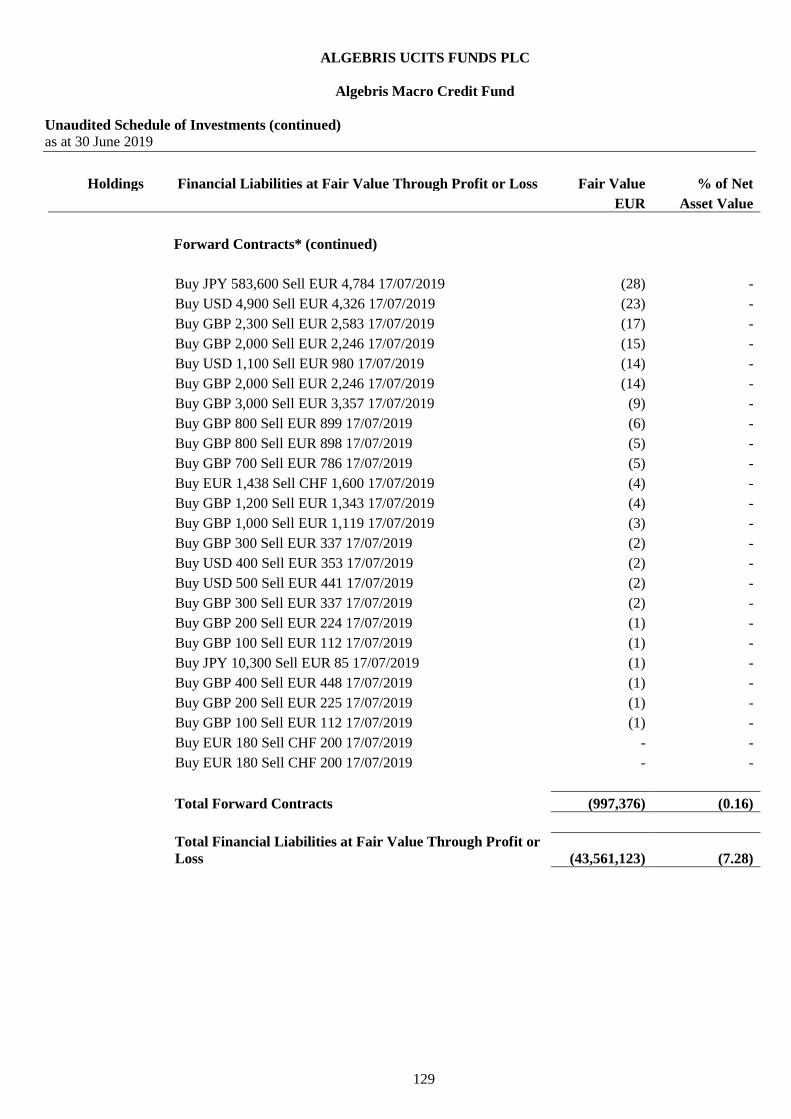
ALGEBRIS UCITS FUNDS PLC
Algebris Macro Credit Fund
Unaudited Schedule of Investments (continued)
as at 30 June 2019
129
Holdings Financial Liabilities at Fair Value Through Profit or Loss Fair Value % of Net
EUR Asset Value
Forward Contracts* (continued)
Buy JPY 583,600 Sell EUR 4,784 17/07/2019 (28) -
Buy USD 4,900 Sell EUR 4,326 17/07/2019 (23) -
Buy GBP 2,300 Sell EUR 2,583 17/07/2019 (17) -
Buy GBP 2,000 Sell EUR 2,246 17/07/2019 (15) -
Buy USD 1,100 Sell EUR 980 17/07/2019 (14) -
Buy GBP 2,000 Sell EUR 2,246 17/07/2019 (14) -
Buy GBP 3,000 Sell EUR 3,357 17/07/2019 (9) -
Buy GBP 800 Sell EUR 899 17/07/2019 (6) -
Buy GBP 800 Sell EUR 898 17/07/2019 (5) -
Buy GBP 700 Sell EUR 786 17/07/2019 (5) -
Buy EUR 1,438 Sell CHF 1,600 17/07/2019 (4) -
Buy GBP 1,200 Sell EUR 1,343 17/07/2019 (4) -
Buy GBP 1,000 Sell EUR 1,119 17/07/2019 (3) -
Buy GBP 300 Sell EUR 337 17/07/2019 (2) -
Buy USD 400 Sell EUR 353 17/07/2019 (2) -
Buy USD 500 Sell EUR 441 17/07/2019 (2) -
Buy GBP 300 Sell EUR 337 17/07/2019 (2) -
Buy GBP 200 Sell EUR 224 17/07/2019 (1) -
Buy GBP 100 Sell EUR 112 17/07/2019 (1) -
Buy JPY 10,300 Sell EUR 85 17/07/2019 (1) -
Buy GBP 400 Sell EUR 448 17/07/2019 (1) -
Buy GBP 200 Sell EUR 225 17/07/2019 (1) -
Buy GBP 100 Sell EUR 112 17/07/2019 (1) -
Buy EUR 180 Sell CHF 200 17/07/2019 - -
Buy EUR 180 Sell CHF 200 17/07/2019 - -
Total Forward Contracts (997,376) (0.16)
Total Financial Liabilities at Fair Value Through Profit or
Loss (43,561,123) (7.28)

ALGEBRIS UCITS FUNDS PLC
Algebris Macro Credit Fund
Unaudited Schedule of Investments (continued)
as at 30 June 2019
130
Holdings Financial Liabilities at Fair Value Through Profit or Loss Fair Value % of Net
EUR Asset Value
Net Financial Assets and Liabilities at Fair Value Through
Profit or Loss 447,832,322 74.84
Other Net Assets 150,558,241 25.16
Total Net Assets Attributable to Holders of Redeemable
Participating Shares 598,390,563 100.00
% of total
assets
Transferable securities admitted to an official stock
exchange listing or traded in a regulated market 464,779,994 71.37
Over the counter financial derivatives 26,613,451 4.09
Cash and other current assets 159,803,208 24.54
Total Assets 651,196,653 100.00
*The counterparty for all the forward contracts is HSBC Bank plc.
**The counterparties for all the swap contracts are Bank of America Merrill Lynch, Barclays
Capital London, BNP Paribas, Citibank, Goldman Sachs, HSBC Bank plc, JP Morgan Securities
and Morgan Stanley.
***The counterparty for all the contracts for differences is Bank of America Merrill Lynch.

ALGEBRIS UCITS FUNDS PLC
Algebris Core Italy Fund
Unaudited Schedule of Investments
as at 30 June 2019
131
Holdings Financial Assets at Fair Value Through Profit or Loss Fair Value % of Net
EUR Asset Value
Equity Securities
France 1,392,325 3.30
167,750 Electro Power Systems 1,392,325 3.30
Italy 25,796,683 61.19
419,000 A2A 639,394 1.52
7,000 Abitare In 313,600 0.74
36,400 Alkemy 404,040 0.96
237,000 Anima Holding 708,156 1.68
14,356 Antares Vision 154,700 0.37
63,880 Aquafil 529,565 1.26
36,509 Autogrill 336,430 0.80
42,450 Avio 616,374 1.46
457,005 Banca Sistema 542,922 1.29
111,250 Banco Bpm 199,138 0.47
633,500 Be 630,333 1.49
40,100 Brembo 406,213 0.96
32,900 CFT 126,665 0.30
39,900 Comer Industries 470,820 1.12
9,370,378 Credito Valtellinese 529,426 1.26
50,100 DBA Group 91,683 0.22
17,600 De Longhi 312,928 0.74
4,400 DiaSorin 449,240 1.06
20,000 Digital Value 272,000 0.64
40,000 DoValue 467,200 1.11
40,000 ELES Semiconductor Equipment 234,000 0.55
59,600 ERG 1,072,800 2.54
55,000 Esautomotion 161,150 0.38
100,000 Eurotech 485,500 1.15
85,500 Falck Renewables 315,666 0.75
115,324 Fiera Milano 428,429 1.02
34,900 Finlogic 198,930 0.47
21,800 Gabelli Value 211,460 0.50
63,426 Gamenet Group 502,968 1.19
149,300 Garofalo Health Care 646,469 1.53
30,000 Gibus 179,070 0.42
220,000 H-Farm 117,920 0.28
20,000 IDeaMI 194,000 0.46
79,771 Illimity Bank 708,366 1.68
34,808 Illimity Bank Rights 31/12/2099 60,844 0.14

ALGEBRIS UCITS FUNDS PLC
Algebris Core Italy Fund
Unaudited Schedule of Investments (continued)
as at 30 June 2019
132
Holdings Financial Assets at Fair Value Through Profit or Loss Fair Value % of Net
EUR Asset Value
Equity Securities (continued)
Italy (continued)
77,400 Infrastrutture Wireless Italiane 667,962 1.58
16,000 Interpump Group 432,960 1.03
87,500 Intred 448,000 1.06
253,941 Iren 580,509 1.38
57,000 Italian Exhibition Group 209,219 0.50
17,850 Italian Wine Brands 218,663 0.52
18,200 LU-VE 206,570 0.49
59,280 MailUp 221,707 0.53
149,000 Maire Tecnimont 424,352 1.01
30,000 Maps 109,200 0.26
20,000 Neosperience 236,000 0.56
94,736 NET Insurance 416,838 0.99
61,900 Nexi 560,876 1.33
13,900 Pharmanutra 289,120 0.68
180,199 Piquadro 432,478 1.03
50,000 Powersoft 225,000 0.53
86,917 RAI Way 457,183 1.08
250,000 Retelit 350,000 0.83
25,440 SAES Getters 521,520 1.24
148,091 Saipem 647,898 1.54
292,000 Saras 386,608 0.92
250,000 SEC 209,350 0.50
25,000 Sirio 217,500 0.52
17,100 Somec 386,460 0.92
47,300 Tamburi Investment Partners 265,353 0.63
40,000 Techedge 206,400 0.49
860,000 Telecom Italia/Milano 392,246 0.93
25,000 Thespac 240,000 0.57
45,491 Tinexta 598,662 1.42
230,000 Triboo 384,100 0.91
45,570 UniCredit 493,341 1.17
20,000 VEI 1 192,000 0.46
28,835 Vetrya 205,305 0.49
4,840 Wiit 244,904 0.58
Netherlands 1,198,635 2.84
10,000 Exor 616,000 1.46
47,500 Fiat Chrysler Automobiles 582,635 1.38
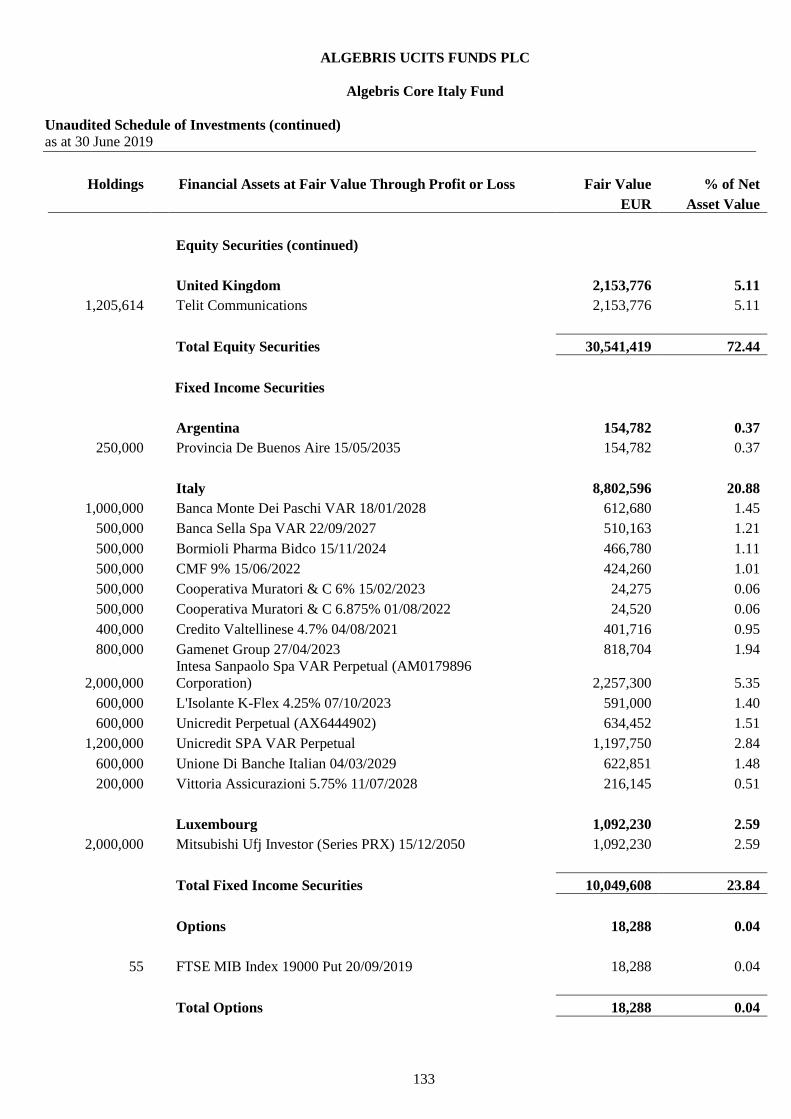
ALGEBRIS UCITS FUNDS PLC
Algebris Core Italy Fund
Unaudited Schedule of Investments (continued)
as at 30 June 2019
133
Holdings Financial Assets at Fair Value Through Profit or Loss Fair Value % of Net
EUR Asset Value
Equity Securities (continued)
United Kingdom 2,153,776 5.11
1,205,614 Telit Communications 2,153,776 5.11
Total Equity Securities 30,541,419 72.44
Fixed Income Securities
Argentina 154,782 0.37
250,000 Provincia De Buenos Aire 15/05/2035 154,782 0.37
Italy 8,802,596 20.88
1,000,000 Banca Monte Dei Paschi VAR 18/01/2028 612,680 1.45
500,000 Banca Sella Spa VAR 22/09/2027 510,163 1.21
500,000 Bormioli Pharma Bidco 15/11/2024 466,780 1.11
500,000 CMF 9% 15/06/2022 424,260 1.01
500,000 Cooperativa Muratori & C 6% 15/02/2023 24,275 0.06
500,000 Cooperativa Muratori & C 6.875% 01/08/2022 24,520 0.06
400,000 Credito Valtellinese 4.7% 04/08/2021 401,716 0.95
800,000 Gamenet Group 27/04/2023 818,704 1.94
2,000,000
Intesa Sanpaolo Spa VAR Perpetual (AM0179896
Corporation) 2,257,300 5.35
600,000 L'Isolante K-Flex 4.25% 07/10/2023 591,000 1.40
600,000 Unicredit Perpetual (AX6444902) 634,452 1.51
1,200,000 Unicredit SPA VAR Perpetual 1,197,750 2.84
600,000 Unione Di Banche Italian 04/03/2029 622,851 1.48
200,000 Vittoria Assicurazioni 5.75% 11/07/2028 216,145 0.51
Luxembourg 1,092,230 2.59
2,000,000 Mitsubishi Ufj Investor (Series PRX) 15/12/2050 1,092,230 2.59
Total Fixed Income Securities 10,049,608 23.84
Options 18,288 0.04
55 FTSE MIB Index 19000 Put 20/09/2019 18,288 0.04
Total Options 18,288 0.04

ALGEBRIS UCITS FUNDS PLC
Algebris Core Italy Fund
Unaudited Schedule of Investments (continued)
as at 30 June 2019
134
Holdings Financial Assets at Fair Value Through Profit or Loss Fair Value % of Net
EUR Asset Value
Equity Warrants
8,428 Antares Vision 19/04/2024 16,856 0.04
8,750 Askoll Eva 31/12/2021 3,935 0.01
3,420 CFT 28/06/2022 445 -
3,990 Comer Industries 17/07/2021 12,888 0.03
16,700 DBA Group 07/01/2021 1,668 -
20,000 ELES Semiconductor Equipment 31/07/2024 37,360 0.09
8,250 ELES Semiconductor Equipment 31/12/2099 27,056 0.07
3,000 Gabelli Value For Italy 19/04/2023 2,064 0.01
2,400 Guala Closures 21/12/2023 624 -
4,000 IDeaMI 11/12/2019 1,316 -
20,000 Illa 15/10/2020 1,172 -
5,000 Industrial Stars of Italy 3 30/06/2020 4,847 0.01
15,000 Maps 28/06/2024 30,900 0.07
18,410 NET Insurance 21/05/2023 12,335 0.03
25,000 Powersoft 15/10/2021 33,745 0.08
142,000 Sciuker Frames 31/05/2021 12,468 0.03
18,000 Sostravel.com 15/07/2021 5,380 0.01
5,000 Thespac 11/07/2023 2,122 0.01
6,000 VEI 1 27/02/2023 3,479 0.01
Total Equity Warrants 210,660 0.50
Forward Contracts*
Buy EUR 2,483,900 Sell GBP 2,218,000 17/07/2019 8,858 0.02
Total Forward Contracts 8,858 0.02
Total Financial Assets at Fair Value Through Profit or
Loss 40,828,833 96.84
Financial Liabilities at Fair Value Through Profit or Loss
Futures contract
(17) Euro-BTP Future Sep 19 06/09/2019 (91,800) (0.22)

ALGEBRIS UCITS FUNDS PLC
Algebris Core Italy Fund
Unaudited Schedule of Investments (continued)
as at 30 June 2019
135
Holdings Financial Liabilities at Fair Value Through Profit or Loss Fair Value % of Net
EUR Asset Value
Futures contract (continued)
(37) FTSE/MIB Index Future Sep 19 20/09/2019 (121,360) (0.29)
Total Futures contract (213,160) (0.51)
Forward Contracts*
Buy GBP 70,000 Sell EUR 78,625 17/07/2019 (513) -
Buy USD 1,100 Sell EUR 977 17/07/2019 (11) -
Buy JPY 125,000 Sell EUR 1,025 17/07/2019 (6) -
Total Forward Contracts (530) -
Total Financial Liabilities at Fair Value Through Profit or
Loss (213,690) (0.51)
Net Financial Assets and Liabilities at Fair Value Through
Profit or Loss 40,615,143 96.33
Other Net Assets 1,545,282 3.67
Total Net Assets Attributable to Holders of Redeemable
Participating Shares 42,160,425 100.00
% of total
assets
Transferable securities admitted to an official stock
exchange listing or traded in a regulated market 40,591,027 93.98
Over the counter financial derivatives 237,806 0.55
Cash and other current assets 2,360,569 5.47
Total Assets 43,189,402 100.00
*The counterparty for all the forward contracts is HSBC Bank plc.

ALGEBRIS UCITS FUNDS PLC
Algebris Quant Arbitrage Fund
Unaudited Schedule of Investments
as at 30 June 2019
136
Holdings Financial Assets at Fair Value Through Profit or Loss Fair Value % of Net
EUR Asset Value
Fixed Income Securities
Belgium 2,723,557 15.77
2,700,000 Belgium Kingdom (Series 67) 3% 28/09/2019 2,723,557 15.77
France 2,736,869 15.84
2,700,000 Government of France 3.75% 25/10/2019 2,736,869 15.84
Spain 7,758,335 44.92
5,000,000 Spain Letras Del Tesoro 0% 13/09/2019 5,004,925 28.98
2,750,000 Spain Letras Del Tesoro 0% 11/10/2019 2,753,410 15.94
Total Fixed Income Securities 13,218,761 76.53
Swaps**
223 Anthem 660 -
7,617 Aviva 592 -
7,057 Banco Bilbao Vizcaya Argentaria 41 -
579 Bayerische Motoren Werke 607 -
(1,760) CNP Assurances 81 -
412 Continental 731 0.01
1,837 Daimler 2,704 0.02
(3,273) Danone 839 0.01
8,250 Deutsche Lufthansa 1,833 0.01
(1,065) Dominion Energy 1,379 0.01
(13,274) Engie 584 -
342 Everest Re Group 847 0.01
(14,256) Fortum 1,839 0.01
715 Heineken 216 -
(707) Humana 338 -
(12,270) Iberdrola 1,683 0.01
45,136 Kingfisher 3,797 0.02
5,324 Koninklijke Ahold Delhaize 973 0.01
(138) L'Oreal 675 -
59,895 Marks & Spencer Group 1,152 0.01
(430) Moody's 238 -
(37,242) National Grid 1,576 0.01
188 Nestle 4 -
(1,813) Pernod Ricard 2,203 0.01
(2,653) PPL 945 0.01

ALGEBRIS UCITS FUNDS PLC
Algebris Quant Arbitrage Fund
Unaudited Schedule of Investments (continued)
as at 30 June 2019
137
Holdings Financial Assets at Fair Value Through Profit or Loss Fair Value % of Net
EUR Asset Value
Swaps** (continued)
1,047 Progressive 216 -
2,410 RWE 70 -
1,850 Sensata Technologies Holding 2,566 0.02
136 SSE 12 -
1,191 TE Connectivity 1,524 0.01
102,414 Tesco 2,387 0.01
(6,748) Total (MoR) 494 -
278 Travelers 77 -
1,959 Trimble 3,256 0.02
577 Verisk Analytics 612 -
4,240 Western Union 203 -
705 Xcel Energy 127 -
Total Swaps 38,081 0.22
Total Financial Assets at Fair Value Through Profit or
Loss 13,256,842 76.75
Financial Liabilities at Fair Value Through Profit or Loss
Swaps**
1,099 Acciona (665) -
(346) Adidas (3,415) (0.02)
(1,197) Agilent Technologies (3,883) (0.02)
(853) Alliant Energy (116) -
490 Beiersdorf (3) -
(842) BNP Paribas (649) -
1,331 Carlsberg B Shares (1,689) (0.01)
(4,190) Carrefour (1,281) (0.01)
2,747 Diageo (595) -
14,302 E.ON (1,119) (0.01)
18,939 Electricite de France (9,480) (0.05)
47,335 Energias de Portugal (387) -
1,699 Exelon (1,651) (0.01)
1,665 Ferguson (5) -
(300) FleetCor Technologies (753) -
(818) HCA Healthcare (2,705) (0.02)
737 Honeywell International (108) -
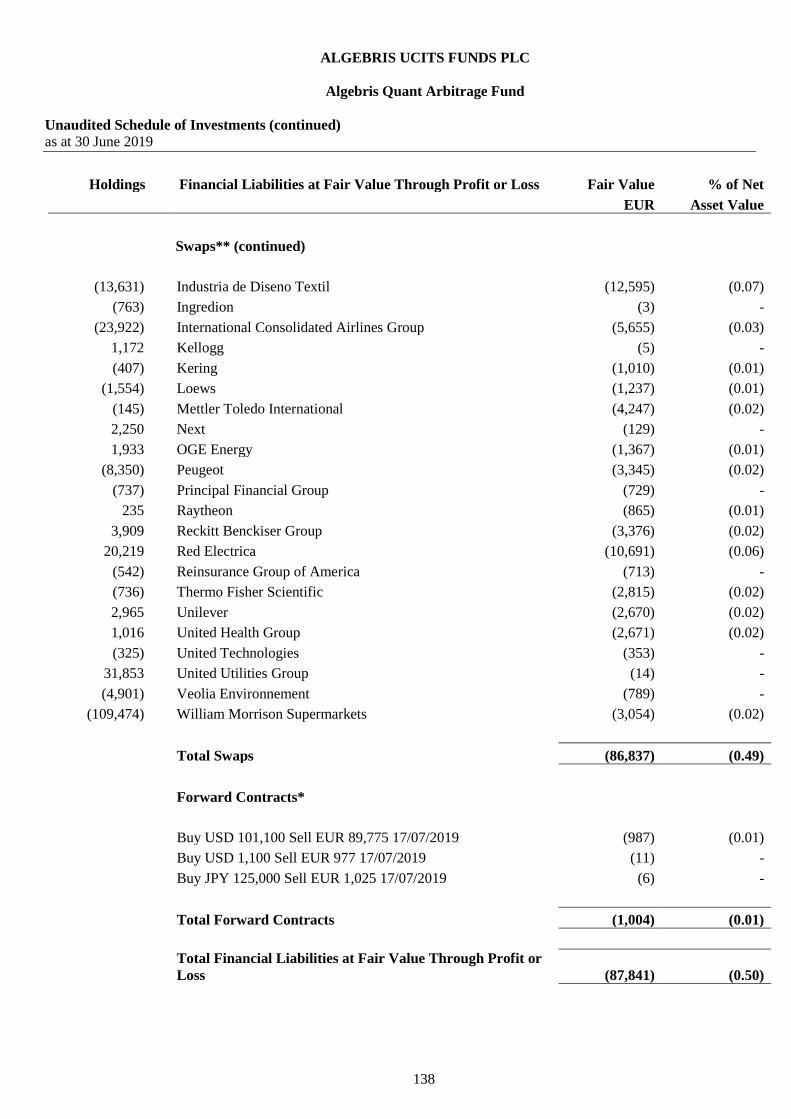
ALGEBRIS UCITS FUNDS PLC
Algebris Quant Arbitrage Fund
Unaudited Schedule of Investments (continued)
as at 30 June 2019
138
Holdings Financial Liabilities at Fair Value Through Profit or Loss Fair Value % of Net
EUR Asset Value
Swaps** (continued)
(13,631) Industria de Diseno Textil (12,595) (0.07)
(763) Ingredion (3) -
(23,922) International Consolidated Airlines Group (5,655) (0.03)
1,172 Kellogg (5) -
(407) Kering (1,010) (0.01)
(1,554) Loews (1,237) (0.01)
(145) Mettler Toledo International (4,247) (0.02)
2,250 Next (129) -
1,933 OGE Energy (1,367) (0.01)
(8,350) Peugeot (3,345) (0.02)
(737) Principal Financial Group (729) -
235 Raytheon (865) (0.01)
3,909 Reckitt Benckiser Group (3,376) (0.02)
20,219 Red Electrica (10,691) (0.06)
(542) Reinsurance Group of America (713) -
(736) Thermo Fisher Scientific (2,815) (0.02)
2,965 Unilever (2,670) (0.02)
1,016 United Health Group (2,671) (0.02)
(325) United Technologies (353) -
31,853 United Utilities Group (14) -
(4,901) Veolia Environnement (789) -
(109,474) William Morrison Supermarkets (3,054) (0.02)
Total Swaps (86,837) (0.49)
Forward Contracts*
Buy USD 101,100 Sell EUR 89,775 17/07/2019 (987) (0.01)
Buy USD 1,100 Sell EUR 977 17/07/2019 (11) -
Buy JPY 125,000 Sell EUR 1,025 17/07/2019 (6) -
Total Forward Contracts (1,004) (0.01)
Total Financial Liabilities at Fair Value Through Profit or
Loss (87,841) (0.50)

ALGEBRIS UCITS FUNDS PLC
Algebris Quant Arbitrage Fund
Unaudited Schedule of Investments (continued)
as at 30 June 2019
139
Holdings Financial Assets at Fair Value Through Profit or Loss Fair Value % of Net
EUR Asset Value
Net Financial Assets and Liabilities at Fair Value Through
Profit or Loss 13,169,001 76.25
Other Net Assets 4,102,899 23.75
Total Net Assets Attributable to Holders of Redeemable
Participating Shares 17,271,900 100.00
% of total
assets
Transferable securities admitted to an official stock
exchange listing or traded in a regulated market 13,218,761 75.76
Over the counter financial derivatives 38,081 0.22
Cash and other current assets 4,190,316 24.02
Total Assets 17,447,158 100.00
*The counterparty for all the forward contracts is HSBC Bank plc.
**The counterparty for all the swap contracts is Morgan Stanley.

ALGEBRIS UCITS FUNDS PLC
Algebris Financial Credit Fund
Unaudited Schedule of Significant Changes in Investments Largest purchases and sales as at 30 June 2019
140
Cost Proceeds
EUR EUR
Banco Bilbao Vizcaya ARG Perpetual (AX7516377) 60,712,685 -
Banco Bilbao Vizcaya ARG VAR Perpetual - 13,560,488
Banco Bilbao Vizcaya VAR Perpetual - 52,627,095
Banco De Sabadell 5.625% 06/05/2026 - 12,710,257
Banco Santander 11/09/2049 - 45,733,208
Banco Santander Perpetual (AR5470927 Corporation) 15,630,507 -
Bank of America (Series FF) Perpetual - 106,155,585
Barclays 07/02/2028 4,913,521 -
Barclays 20/06/2030 25,617,161 -
Barclays Perpetual - 13,666,259
Barclays Perpetual (AX7752402) 25,671,354 11,645,242
Barclays Perpetual (AZ0489668) 29,397,220 -
Barclays Perpetual (QZ3177313) - 34,007,575
BNP Paribas Perpetual (AT9682341) - 43,429,694
BNP Paribas Perpetual (AX7277939) 52,924,054 -
BNP Paribas Perpetual (EG5801956) 15,304,653 -
Caixabank (Series) VAR Perpetual - 14,132,086
Credit Agricole VAR Perpetual (EXNP) - 12,684,433
Credit Agricole VAR Perpetual (JV6342804) - 11,132,221
Credit Suisse Group VAR Perpetual - 20,501,659
Danske Bank Perpetual 5,276,244 -
Deutsche Bank 24/05/2028 - 16,654,665
HSBC Holdings Perpetual - 15,035,862
HSBC Holdings Perpetual (AO1326237) - 16,089,627
HSBC Holdings VAR Perpetual (DSE) - 31,749,720
ING Group Perpetual - 11,205,870
ING Group 6.5% Perpetual - 14,687,451
ING Group VAR Perpetual 7,920,587 -
Intesa Sanpaolo 4.375% 12/01/2048 - 15,943,545
Intesa Sanpaolo Perpetual - 32,885,814
Intesa Sanpaolo Perpetual (AM0179896 Corporation) - 26,800,283
Itau Unibanco Holdings Perpetual (AR7224637 Corporation) - 35,996,756
Lloyds Banking Group Perpetual (AU7888566) - 14,030,128
Lloyds Banking Group Perpetual (AZ1283516) 10,895,079 11,152,507
Nordea Bank Abp Perpetual 34,532,881 -
Royal Bank of Scotland Group Perpetual - 37,644,778
Royal Bank of Scotland Group VAR Perpetual - 64,445,932
Royal Bank of Scotland Group (Series U) Perpetual 14,724,653 -
Santander UK Group Perpetual - 12,253,226
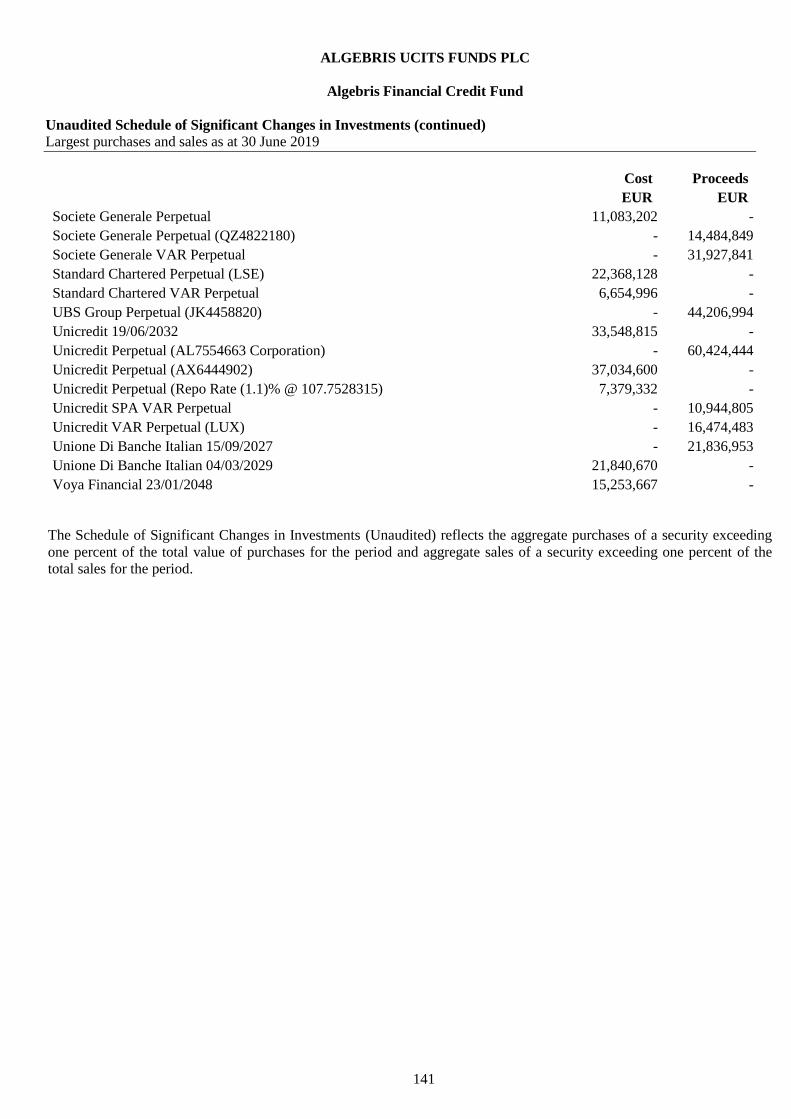
ALGEBRIS UCITS FUNDS PLC
Algebris Financial Credit Fund
Unaudited Schedule of Significant Changes in Investments (continued) Largest purchases and sales as at 30 June 2019
141
Cost Proceeds
EUR EUR
Societe Generale Perpetual 11,083,202 -
Societe Generale Perpetual (QZ4822180) - 14,484,849
Societe Generale VAR Perpetual - 31,927,841
Standard Chartered Perpetual (LSE) 22,368,128 -
Standard Chartered VAR Perpetual 6,654,996 -
UBS Group Perpetual (JK4458820) - 44,206,994
Unicredit 19/06/2032 33,548,815 -
Unicredit Perpetual (AL7554663 Corporation) - 60,424,444
Unicredit Perpetual (AX6444902) 37,034,600 -
Unicredit Perpetual (Repo Rate (1.1)% @ 107.7528315) 7,379,332 -
Unicredit SPA VAR Perpetual - 10,944,805
Unicredit VAR Perpetual (LUX) - 16,474,483
Unione Di Banche Italian 15/09/2027 - 21,836,953
Unione Di Banche Italian 04/03/2029 21,840,670 -
Voya Financial 23/01/2048 15,253,667 -
The Schedule of Significant Changes in Investments (Unaudited) reflects the aggregate purchases of a security exceeding
one percent of the total value of purchases for the period and aggregate sales of a security exceeding one percent of the
total sales for the period.

ALGEBRIS UCITS FUNDS PLC
Algebris Financial Income Fund
Unaudited Schedule of Significant Changes in Investments Largest purchases and sales as at 30 June 2019
142
Cost Proceeds
EUR EUR
ABN AMRO Group 4,134,492 -
AGNC Investment 3,847,825 -
Allianz SE Reg - 5,518,558
American International Group (Series A-9) 01/04/2048 1,709,189 -
Annaly Capital Management 7,023,071 -
Apollo Global Management LLC 1,949,081 -
Athene Holding 4,846,933 -
AXA Equitable Holdings 4,796,043 -
Banco Bilbao Vizcaya ARG Perpetual - 3,307,196
Banco Bilbao Vizcaya ARG Perpetual (AX7516377) 3,396,761 -
Banco Bilbao Vizcaya ARG VAR Perpetual - 3,418,740
Banco Comerc Portugues Perpetual 1,800,000 -
Bank of America 2,415,570 7,008,404
Bank of America (Series FF) Perpetual - 7,063,514
Bank of China H Shares - 5,178,623
Barclays Perpetual (AX7752402) 1,489,464 -
Barclays Perpetual (AZ0489668) 1,576,863 -
Blackstone Group 6,640,814 -
Blackstone Group LP - 12,630,132
BNP Paribas Perpetual (AT9682341) - 4,833,472
BNP Paribas Perpetual (AX7277939) 6,086,266 -
Carlyle Group - 2,769,710
China Construction Bank H Shares - 5,278,343
Citigroup 25/08/2036 3,741,752 -
Citizens Financial Group 4,992,473 2,414,335
Comerica - 3,750,574
Credit Suisse Group 3,665,296 5,010,438
Credito Valtellinese 1,821,607 -
DBS Group Holdings 3,674,788 3,752,535
Dresdner Funding Trust I 8.151% 30/06/2031 5,427,399 -
E*Trade Financial - 3,762,711
Erste Group Bank Perpetual (AX5200388) 1,600,000 -
Fifth Third Bancorp 6,555,090 4,287,330
First Horizon National - 3,883,389
HSBC Holdings VAR Perpetual (DSE) - 2,952,701
Huntington Bancshares - 6,153,024
Illimity Bank 7,776,311 -
ING Group 5,203,901 5,377,542
Intesa Sanpaolo 4.375% 12/01/2048 3,297,289 10,054,488
Invesco - 7,708,345

ALGEBRIS UCITS FUNDS PLC
Algebris Financial Income Fund
Unaudited Schedule of Significant Changes in Investments (continued) Largest purchases and sales as at 30 June 2019
143
Cost Proceeds
EUR EUR
Itau Unibanco Holdings Perpetual (AR7224637 Corporation) - 2,593,056
KBC Group 10,099,283 2,828,678
Keycorp 3,659,357 3,236,650
Legg Mason - 6,335,569
Lincoln National - 5,406,268
Lloyds Banking Group (144A) VAR Perpetual (LSE) 3,421,464 -
M&T Bank - 3,959,309
Nordea Bank Abp Perpetual 1,938,070 -
PacWest Bancorp - 5,657,177
Prudential Financial - 9,383,097
Regions Financial - 3,691,021
Resona Holdings - 4,647,519
Royal Bank Scotland Group Perpetual - 3,810,307
Sberbank of Russia - 6,398,608
Spaxs - 6,854,085
Suntrust Banks (Series H) Perpetual - 6,949,428
Two Harbors Investment 2,513,510 -
UBS Group - 9,786,574
Unicredit Perpetual (AX6444902) 6,108,975 -
Voya Financial 23/01/2048 7,455,862 -
Wells Fargo & Co 1,521,136 2,706,749
The Schedule of Significant Changes in Investments (Unaudited) reflects the aggregate purchases of a security
exceeding one percent of the total value of purchases for the period and aggregate sales of a security exceeding one
percent of the total sales for the period.

ALGEBRIS UCITS FUNDS PLC
Algebris Allocation Fund
Unaudited Schedule of Significant Changes in Investments Largest purchases and sales as at 30 June 2019
144
Cost Proceeds
EUR EUR
Algebris Core Italy Fund Class M Accumulating 996,731 -
Algebris Financial Credit Fund Class M Accumulating 2,420,714 622,955
Algebris Financial Income Fund Class M Accumulating 2,421,465 701,009
Algebris Macro Credit Fund Class M Accumulating 990,125 -
Algebris Quant Arbitrage Fund Class M Accumulating 2,017,560 -
Athene Holding - 311,187
Belgium Kingdom 0.5% 22/10/2024 3,090,604 3,090,010
Blackstone Group - 438,807
DB X-Trackers II Eonia Total Return Index ETF 1,112,927 1,111,189
Government of France 0% 25/03/2024 3,719,721 3,717,353
iShares EUR Government Bond 1-3 years UCITS ETF 1,238,282 1,236,542
KBC Group - 261,209
Lyxor Euro Overnight Return UCITS ETF 1,242,849 1,241,060
Prudential Financial - 438,916
Spain Letras Del Tesoro 0% 15/02/2019 - 1,000,000
Spain Letras Del Tesoro 0% 10/05/2019 - 2,250,000
Spain Letras Del Tesoro 0% 14/06/2019 1,502,192 1,500,433
Spain Letras Del Tesoro 0% 13/09/2019 2,002,916 -
Spaxs - 323,703
US Treasury Note 2.5% 31/05/2020 - 453,631
The Schedule of Significant Changes in Investments (Unaudited) reflects the aggregate purchases of a security exceeding
one percent of the total value of purchases for the period and aggregate sales of a security exceeding one percent of the
total sales for the period.

ALGEBRIS UCITS FUNDS PLC
Algebris Financial Equity Fund
Unaudited Schedule of Significant Changes in Investments Largest purchases and sales as at 30 June 2019
145
Cost Proceeds
EUR EUR
ABN AMRO Group 5,876,225 -
Affiliated Managers Group 1,065,933 1,085,347
Ameris Bancorp 1,039,346 1,111,032
Apollo Global Management LLC 1,648,313 1,198,232
Athene Holding - 1,995,379
AXA Equitable Holdings 1,119,644 1,432,687
Banca Generali 1,503,983 1,632,327
Banca Mediolanum 1,489,717 1,660,795
Bank of China H Shares - 1,527,273
BankUnited 2,040,005 1,912,273
Blackstone Group 2,926,855 -
Blackstone Group LP 2,133,451 6,417,424
BrightSphere Investment Group - 2,769,899
Carlyle Group 1,440,048 1,344,278
China Construction Bank Corporation H Shares - 1,491,785
Citigroup 1,396,643 1,417,269
Citizens Financial Group 2,669,108 2,135,803
Comerica 755,377 2,253,822
Commerzbank 1,843,893 -
Credit Suisse Group 2,599,256 3,496,753
Dai-ichi Life Holdings 863,322 -
DBS Group Holdings - 1,280,620
Deutsche Bank 1,700,466 -
Erste Group Bank 1,699,461 -
Fifth Third Bancorp 1,912,709 2,027,868
First Horizon National Corporation 1,775,519 1,880,647
Huntington Bancshares - 1,294,754
Illimity Bank 3,692,043 -
Invesco - 1,077,484
KBC Group 5,070,990 4,830,544
Keycorp 2,511,650 2,712,791
Lazard Class A - 954,346
Legg Mason - 2,102,627
Mitsubishi UFJ Financial Group - 2,206,400
Morgan Stanley 1,503,305 2,156,156
Och - Ziff Capital Management Group A Shares - 1,701,144
Och - Ziff Capital Management Group Class A Shares 1,701,144 1,207,520
Ping An Insurance (Group) Company of China H Shares - 1,233,971
Popular 1,248,917 -
Prudential Financial - 4,497,809

ALGEBRIS UCITS FUNDS PLC
Algebris Financial Equity Fund
Unaudited Schedule of Significant Changes in Investments (continued) Largest purchases and sales as at 30 June 2019
146
Cost Proceeds
EUR EUR
Raiffeisen Bank International 2,523,231 -
Regions Financial Corporation 1,663,797 3,082,450
Resona Holdings - 1,404,154
Spain Letras Del Tesoro 0% 13/09/2019 5,007,599 -
Spaxs - 3,692,043
State Street Corporation 1,558,879 1,483,901
Sterling Bancorp - 1,574,217
Synchrony Financial - 1,818,274
Synovus Financial - 1,525,737
T&D Holdings 870,043 -
Tradeweb Markets Class A 737,862 958,013
UBS Group - 4,028,465
Victory Capital Holdings - 1,693,719
Wells Fargo & Co - 2,704,346
The Schedule of Significant Changes in Investments (Unaudited) reflects the aggregate purchases of a security
exceeding one percent of the total value of purchases for the period and aggregate sales of a security exceeding one
percent of the total sales for the period.

ALGEBRIS UCITS FUNDS PLC
Algebris Macro Credit Fund
Unaudited Schedule of Significant Changes in Investments Largest purchases and sales as at 30 June 2019
147
Cost Proceeds
EUR EUR
Abanca Bancaria VAR Perpetual - 10,202,249
ABN Amro Bank VAR Perpetual - 7,028,250
Altice Luxembourg 7.25% 15/05/2022 - 7,810,185
Altice Luxembourg 8% 15/05/2027 7,500,000 -
Arab Republic of Egypt 4.75% 16/04/2026 - 6,168,281
Banco Bilbao Vizcaya Perpetual - 16,797,955
Banco Comerc Portugues Perpetual 4,565,014 -
Banco De Sabadell Perpetual (AN4046750) - 20,926,503
Banco Santander VAR Perpetual (DSE) - 19,321,683
Barclays Perpetual - 9,684,879
Buoni Poliennali Del Tesoro 0.95% 01/03/2023 - 14,631,058
Caixabank Perpetual - 20,977,507
Credit Suisse Group VAR Perpetual - 6,344,771
Credito Valtellinese 4.7% 04/08/2021 - 9,946,777
Crystal Almond Sarl 10% 01/11/2021 - 6,349,361
Douglas GMBH 6.25% 15/07/2022 (Repo Rate: (2%) @ 88.9895835) 6,902,211 -
Enquest 7% 15/04/2022 (PIK) 8,029,920 -
Hellenic Republic 3.45% 02/04/2024 4,965,700 -
Hellenic Republic 3.875% 12/03/2029 4,989,800 -
Hema Bondco I 15/07/2022 4,624,583 -
Ibercaja Banco Perpetual - 11,298,277
Indonesia Government (Series FR59) 7% 15/05/2027 8,624,011 -
Indonesia Government (Series FR65) 6.625% 15/05/2033 8,256,004 -
Indonesia Government (Series FR75) 7.5% 15/05/2038 7,309,065 -
Indonesia Government (Series FR78) 8.25% 15/05/2029 4,730,531 -
Intesa Sanpaolo VAR Perpetual - 13,308,341
Mex Bonos Desarr Fix Rights (Series M 20) 7.5% 03/06/2027 23,719,382 17,989,357
Nota Do Tesouro Nacional (Series NTNF) 10% 01/01/2023 7,897,410 -
Petroleos Mexicanos 2.75% 21/04/2027 4,497,808 -
Petroleos Mexicanos 3.625% 24/11/2025 6,343,010 6,465,801
Petroleos Mexicanos 3.75% 16/04/2026 5,000,548 -
Petroleos Mexicanos 7.19% 12/09/2024 21,221,278 -
Petroleos Mexicanos 7.47% 12/11/2026 11,905,503 -
Piraeus Group Finance 26/06/2029 7,000,000 -
Republic of Ecuador 7.95% 20/06/2024 - 11,473,205
Republic of South Africa (Series 2048) 8.75% 28/02/2048 5,837,083 -
Royal Bank Scotland Group (Series U) Perpetual 5,524,432 -
Russia Government Bond - OFZ (Series 6027) 8.15% 03/02/2027 9,263,192 -
Russia Government Bond - OFZ (Series 6212) 7.05% 19/01/2028 5,426,197 -
Russia Government Bond - OFZ (Series 6223) 6.5% 28/02/2024 27,793,704 9,585,835

ALGEBRIS UCITS FUNDS PLC
Algebris Macro Credit Fund
Unaudited Schedule of Significant Changes in Investments (continued) Largest purchases and sales as at 30 June 2019
148
Cost Proceeds
EUR EUR
Russia Government Bond - OFZ (Series 6225) 7.25% 10/05/2034 8,535,859 8,914,134
Turkey Government Bond 10.5% 15/01/2020 7,160,510 6,525,172
Ukraine Government 7.375% 25/09/2032 11,951,494 10,997,348
Ukraine Government 7.75% 01/09/2023 6,102,976 6,349,700
Ukraine Government 7.75% 01/09/2026 5,786,196 -
Ukraine Government 7.75% 01/09/2027 9,131,160 -
Ukraine Government VAR 5,070,148 -
Unicredit 02/04/2034 5,324,577 -
Unicredit SPA VAR Perpetual (AQ4052637 Corporation) (Repo Rate: (0.8%) @
101.9344093) 20,335,915 15,786,032
US Treasury Note 2.25% 30/04/2024 22,592,363 -
US Treasury Note 2.5% 31/05/2020 - 42,646,098
US Treasury Note 2.75% 30/11/2020 - 33,178,755
The Schedule of Significant Changes in Investments (Unaudited) reflects the aggregate purchases of a security
exceeding one percent of the total value of purchases for the period and aggregate sales of a security exceeding one
percent of the total sales for the period.
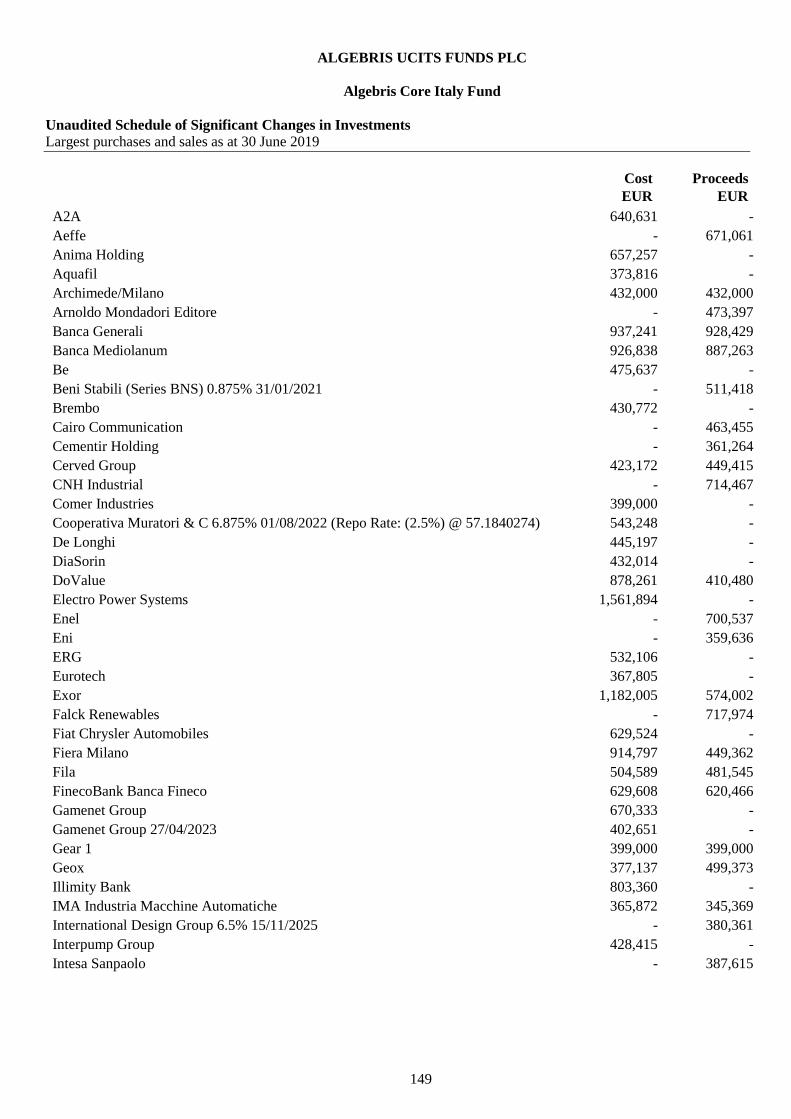
ALGEBRIS UCITS FUNDS PLC
Algebris Core Italy Fund
Unaudited Schedule of Significant Changes in Investments Largest purchases and sales as at 30 June 2019
149
Cost Proceeds
EUR EUR
A2A 640,631 -
Aeffe - 671,061
Anima Holding 657,257 -
Aquafil 373,816 -
Archimede/Milano 432,000 432,000
Arnoldo Mondadori Editore - 473,397
Banca Generali 937,241 928,429
Banca Mediolanum 926,838 887,263
Be 475,637 -
Beni Stabili (Series BNS) 0.875% 31/01/2021 - 511,418
Brembo 430,772 -
Cairo Communication - 463,455
Cementir Holding - 361,264
Cerved Group 423,172 449,415
CNH Industrial - 714,467
Comer Industries 399,000 -
Cooperativa Muratori & C 6.875% 01/08/2022 (Repo Rate: (2.5%) @ 57.1840274) 543,248 -
De Longhi 445,197 -
DiaSorin 432,014 -
DoValue 878,261 410,480
Electro Power Systems 1,561,894 -
Enel - 700,537
Eni - 359,636
ERG 532,106 -
Eurotech 367,805 -
Exor 1,182,005 574,002
Falck Renewables - 717,974
Fiat Chrysler Automobiles 629,524 -
Fiera Milano 914,797 449,362
Fila 504,589 481,545
FinecoBank Banca Fineco 629,608 620,466
Gamenet Group 670,333 -
Gamenet Group 27/04/2023 402,651 -
Gear 1 399,000 399,000
Geox 377,137 499,373
Illimity Bank 803,360 -
IMA Industria Macchine Automatiche 365,872 345,369
International Design Group 6.5% 15/11/2025 - 380,361
Interpump Group 428,415 -
Intesa Sanpaolo - 387,615

ALGEBRIS UCITS FUNDS PLC
Algebris Core Italy Fund
Unaudited Schedule of Significant Changes in Investments (continued) Largest purchases and sales as at 30 June 2019
150
Cost Proceeds
EUR EUR
Intesa Sanpaolo Perpetual (AM0179896 Corporation) - 439,691
Iren 548,286 -
Maire Tecnimont 424,623 -
Mediaset 640,883 580,859
Mediobanca - 613,183
NET Insurance 444,579 432,023
Nexi 557,100 -
Officine Maccaferri 5.75% 01/06/2021 - 712,635
Piaggio & C 373,421 426,788
Playtech 4.25% 07/03/2026 400,000 418,269
RAI Way 652,249 -
Recordati 370,675 414,279
Saipem 959,043 669,839
Saras 439,520 -
Servizi Italia - 407,645
Soc Cattolica Assicurazi 14/12/2047 - 591,234
Spain Letras Del Tesoro 0% 15/02/2019 - 1,000,507
Spain Letras Del Tesoro 0% 14/06/2019 3,003,912 3,001,597
Spaxs - 803,360
Telecom Italia/Milano 427,327 -
Telit Communications 2,248,689 -
Tenaris 798,250 809,494
Tod's - 361,501
Triboo 443,914 -
Unicredit Perpetual 604,000 -
Unione Di Banche Italian 15/09/2027 - 497,758
Unione Di Banche Italian 04/03/2029 600,000 -
Unipolsai Assicurazioni 3.875% 01/03/2028 - 486,872
US Treasury Note 2.75% 30/04/2023 - 882,134
Vittoria Assicurazioni 5.75% 11/07/2028 - 1,124,623
Wind Tre 3.125% 20/01/2025 - 450,852
Wind Tre FRN 20/01/2024 - 540,665
The Schedule of Significant Changes in Investments (Unaudited) reflects the aggregate purchases of a security
exceeding one percent of the total value of purchases for the period and aggregate sales of a security exceeding one
percent of the total sales for the period.

ALGEBRIS UCITS FUNDS PLC
Algebris Quant Arbitrage Fund
Unaudited Schedule of Significant Changes in Investments Largest purchases and sales as at 30 June 2019
151
Cost Proceeds
EUR EUR
Belgium Kingdom (Series 67) 3% 28/09/2019 2,788,962 -
Belgium Kingdom 0.5% 22/10/2024 2,762,223 2,809,551
Government of France 0% 25/03/2024 2,703,510 2,738,961
Government of France 3.75% 25/10/2019 2,810,119 -
Spain Letras Del Tesoro 0% 14/06/2019 2,753,792 2,750,000
Spain Letras Del Tesoro 0% 13/09/2019 5,005,406 -
Spain Letras Del Tesoro 0% 10/11/2019 2,753,850 -
US Treasury Note 2.5% 31/05/2020 - 8,389,924
The Schedule of Significant Changes in Investments (Unaudited) reflects the aggregate purchases of a security
exceeding one percent of the total value of purchases for the period and aggregate sales of a security exceeding one
percent of the total sales for the period.

Other Additional Disclosures (Unaudited)
152
Algebris UCITS Funds Plc (the “Company”) is an investment company with variable capital incorporated with limited
liability in Ireland and established as an umbrella fund with segregated liability between sub-funds pursuant to the
Companies Act 2014 and the Central Bank (Supervision and Enforcement Act 2013 (Section 48(1)) (Undertakings for
Collective Investment in Transferable Securities) Regulations 2015 (the “Central Bank UCITS Regulations”).
IMPORTANT NOTICE TO INVESTORS IN GERMANY
The information agent in Germany is ACOLIN Europe GmbH, with registered office at Reichenaustrasse 11a-c, D-
78467 Konstanz, Germany.
The basic documents of the Company and the sub-funds, such as the prospectus (in English) and the key investor
information documents (in German), may be obtained free of charge at the registered office of the German information
agent.
For the Algebris Core Italy Fund, no notification for marketing has been submitted and consequently this sub-fund
must not be marketed in Germany.
IMPORTANT NOTICE TO INVESTORS IN SWITZERLAND
1) The state of the origin of the fund is Ireland.
2) The representative is ACOLIN Fund Services AG, Leutschenbachstrasse 50, CH-8050 Zurich.
3) The paying agent is Bank Vontobel Ltd., Gotthardstrasse 43, CH-8022 Zurich.
4) The prospectus, the Key Investor Information Documents, the fund regulation, the list of purchases and sales as well
as the annual and semi-annual reports may be obtained free of charge from the representative.
5) In respect of the units distributed in and from Switzerland, the place of performance and jurisdiction is at the
registered office of the representative.
6) The total expense ratio (TER) was calculated based on the version currently applicable of the “Guidelines on the
calculation and disclosure of the Total Expense Ratio (TER) of collective investment schemes” of the Swiss Funds &
Asset Management Association (SFAMA).
For the period from 01.01.2019 to 30.06.2019:
Sub-Fund Share class TER
Algebris Financial Credit Fund CHF Class I 0.76%
CHF Class R 1.35%
CHF Class Rd 1.33%
CHF Class Z 0.90%
EUR Class I 0.80%
EUR Class Id 0.80%
EUR Class R 1.41%
EUR Class Rd 1.38%
EUR Class W 1.61%
EUR Class Wd 1.61%
EUR Class XXLd 0.61%
EUR Class Z 0.90%
GBP Class I 1.02%
GBP Class Id 0.98%
GBP Class R 1.65%
GBP Class Rd 1.55%
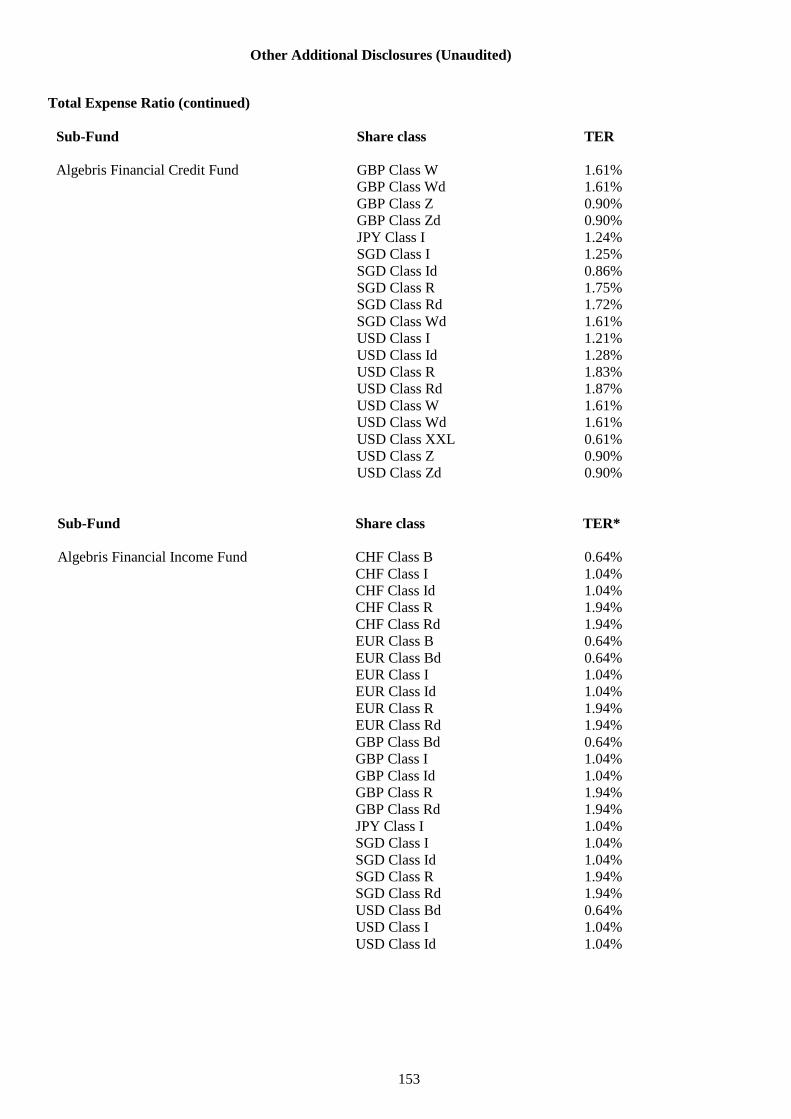
Other Additional Disclosures (Unaudited)
153
Total Expense Ratio (continued)
Sub-Fund Share class TER
Algebris Financial Credit Fund GBP Class W 1.61%
GBP Class Wd 1.61%
GBP Class Z 0.90%
GBP Class Zd 0.90%
JPY Class I 1.24%
SGD Class I 1.25%
SGD Class Id 0.86%
SGD Class R 1.75%
SGD Class Rd 1.72%
SGD Class Wd 1.61%
USD Class I 1.21%
USD Class Id 1.28%
USD Class R 1.83%
USD Class Rd 1.87%
USD Class W 1.61%
USD Class Wd 1.61%
USD Class XXL 0.61%
USD Class Z 0.90%
USD Class Zd 0.90%
Sub-Fund Share class TER*
Algebris Financial Income Fund CHF Class B 0.64%
CHF Class I 1.04%
CHF Class Id 1.04%
CHF Class R 1.94%
CHF Class Rd 1.94%
EUR Class B 0.64%
EUR Class Bd 0.64%
EUR Class I 1.04%
EUR Class Id 1.04%
EUR Class R 1.94%
EUR Class Rd 1.94%
GBP Class Bd 0.64%
GBP Class I 1.04%
GBP Class Id 1.04%
GBP Class R 1.94%
GBP Class Rd 1.94%
JPY Class I 1.04%
SGD Class I 1.04%
SGD Class Id 1.04%
SGD Class R 1.94%
SGD Class Rd 1.94%
USD Class Bd 0.64%
USD Class I 1.04%
USD Class Id 1.04%

Other Additional Disclosures (Unaudited)
154
Total Expense Ratio (continued)
Sub-Fund Share class TER*
Algebris Financial Income Fund USD Class R 1.94%
USD Class Rd 1.94%
Sub-Fund Share class TER
Algebris Allocation Fund CHF Class R 2.10%
EUR Class B 1.19%
EUR Class I 1.30%
EUR Class R 2.10%
GBP Class B 1.00%
JPY Class B 1.32%
USD Class R 2.10%
Sub-Fund Share class TER
Algebris Financial Equity Fund CHF Class B 1.33%
CHF Class R 2.33%
EUR Class B 1.33%
EUR Class Bm 1.33%
EUR Class I 1.58%
EUR Class R 2.33%
EUR Class Rm 2.33%
GBP Class B 1.33%
GBP Class I 1.58%
JPY Class B 1.33%
USD Class B 1.33%
USD Class Bm 1.33%
USD Class I 1.58%
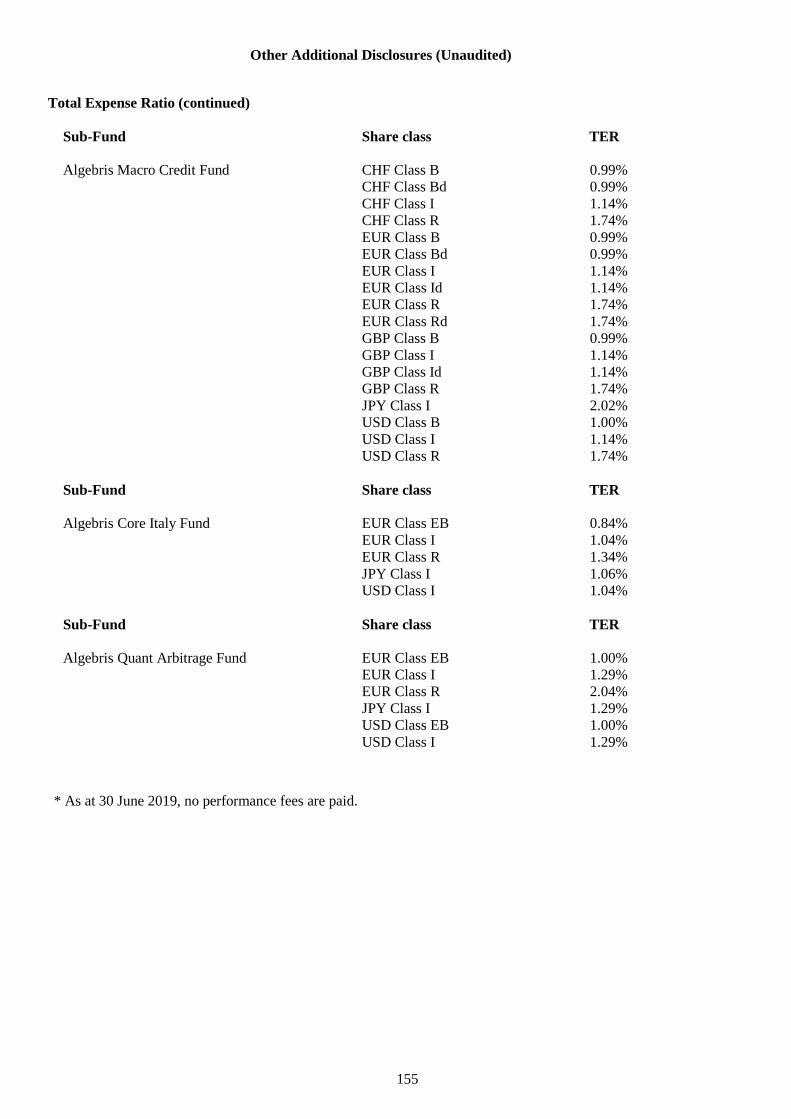
Other Additional Disclosures (Unaudited)
155
Total Expense Ratio (continued)
* As at 30 June 2019, no performance fees are paid.
Sub-Fund Share class TER
Algebris Macro Credit Fund CHF Class B 0.99%
CHF Class Bd 0.99%
CHF Class I 1.14%
CHF Class R 1.74%
EUR Class B 0.99%
EUR Class Bd 0.99%
EUR Class I 1.14%
EUR Class Id 1.14%
EUR Class R 1.74%
EUR Class Rd 1.74%
GBP Class B 0.99%
GBP Class I 1.14%
GBP Class Id 1.14%
GBP Class R 1.74%
JPY Class I 2.02%
USD Class B 1.00%
USD Class I 1.14%
USD Class R 1.74%
Sub-Fund Share class TER
Algebris Core Italy Fund EUR Class EB 0.84%
EUR Class I 1.04%
EUR Class R 1.34%
JPY Class I 1.06%
USD Class I 1.04%
Sub-Fund Share class TER
Algebris Quant Arbitrage Fund EUR Class EB 1.00%
EUR Class I 1.29%
EUR Class R 2.04%
JPY Class I 1.29%
USD Class EB 1.00%
USD Class I 1.29%

Other Additional Disclosures (Unaudited)
156
Securities Financing Transaction
A Securities Financing Transaction (“SFT”) is defined per Article 3(11) of the Securities Financing Transaction
Regulation (“SFTR”) as;
a repurchase transaction or a reverse repurchase transaction;
a securities or commodities lending and securities or commodities borrowing;
a buy-sell back transaction or sell-buy back transaction;
a margin lending transaction.
As at 30 June 2019, the Sub-Funds engaged in two types of SFT’s: Total Return Swaps and Repurchase Agreements.
Algebris Financial Credit Fund
The amount of securities and commodities on loan as a proportion of total lendable assets (excluding cash and cash
equivalents) was 0% as at 30 June 2019.
Global data
Absolute amount
EUR % of Net assets
Repurchase Agreements 3,052,196 0.07%
Total 3,052,196 0.07%
Concentration data
The following table reflects the counter parties across all Repurchase Agreements as at 30 June 2019, is as follows:
Counterparty
Repurchase Agreements
EUR
JP Morgan Securities Plc 3,052,196
Total
3,052,196
Aggregate Transaction Data
Type of
SFT
Maturity tenor
(SFTs)
Market
Value
(EUR)
MTM
(EUR)
Country of
counterparty
establishment (not
collateral)
Settlement
and
clearing Quality Currency JP Morgan
Securities Plc
Repurchase
Agreement Open 3,052,196 - United Kingdom Bilateral NR EUR
JP Morgan
Securities Plc Collateral Open 288,308 - United Kingdom Bilateral - EUR
The Company does not segregate cash collateral received and as such there is no segregation of any reinvestment return
on cash collateral for the period to 30 June 2019.
The Company has no custody accounts in existence specifically for the safekeeping of collateral received.
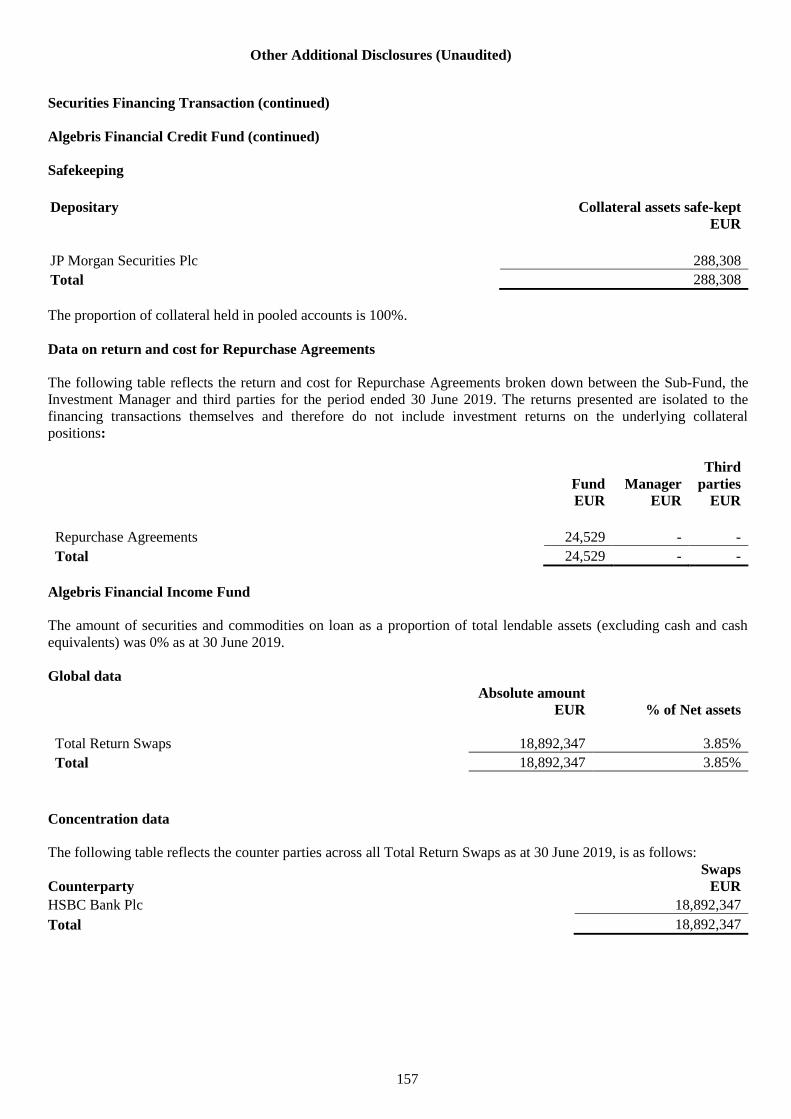
Other Additional Disclosures (Unaudited)
157
Securities Financing Transaction (continued)
Algebris Financial Credit Fund (continued)
Safekeeping
Depositary Collateral assets safe-kept
EUR
JP Morgan Securities Plc 288,308
Total 288,308
The proportion of collateral held in pooled accounts is 100%.
Data on return and cost for Repurchase Agreements
The following table reflects the return and cost for Repurchase Agreements broken down between the Sub-Fund, the
Investment Manager and third parties for the period ended 30 June 2019. The returns presented are isolated to the
financing transactions themselves and therefore do not include investment returns on the underlying collateral
positions:
Fund Manager
Third
parties
EUR EUR EUR
Repurchase Agreements 24,529 - -
Total 24,529 - -
Algebris Financial Income Fund
The amount of securities and commodities on loan as a proportion of total lendable assets (excluding cash and cash
equivalents) was 0% as at 30 June 2019.
Global data
Absolute amount
EUR % of Net assets
Total Return Swaps 18,892,347 3.85%
Total 18,892,347 3.85%
Concentration data
The following table reflects the counter parties across all Total Return Swaps as at 30 June 2019, is as follows:
Counterparty
Swaps
EUR
HSBC Bank Plc 18,892,347
Total
18,892,347

Other Additional Disclosures (Unaudited)
158
Securities Financing Transaction (continued)
Algebris Financial Income Fund (continued)
Aggregate Transaction Data
Type of SFT
Maturity tenor
(SFTs/Total
Return Swaps)
Market
Value
(EUR) MTM (EUR)
Country of
counterparty
establishment
(not collateral)
Settlement and
clearing
HSBC Bank Plc
Total Return
Swap Above one year - - United Kingdom Bilateral
HSBC Bank Plc Total Return
Swap
Three months to one
year - 18,892,347 United Kingdom Bilateral
HSBC Bank Plc Total Return
Swap One month to three
months - - United Kingdom Bilateral
HSBC Bank Plc Total Return
Swap One week to one
month - - United Kingdom Bilateral
The Company does not segregate cash collateral received and as such there is no segregation of any reinvestment
return on cash collateral for the period to 30 June 2019.
The Company has no custody accounts in existence specifically for the safekeeping of collateral received.
Safekeeping
Depositary Collateral assets safe-kept
EUR
HSBC Bank Plc 12,562,932
Total 12,562,932
The proportion of collateral held in segregated accounts is 100%.
Data on return and cost for Swap
The following table reflects the return and cost for Swaps broken down between the Sub-Fund, the Investment
Manager and third parties for the period ended 30 June 2019. The returns presented are isolated to the financing
transactions themselves and therefore do not include investment returns on the underlying collateral positions:
Fund Manager
Third
parties
EUR EUR EUR
Total Return Swaps (395) - -
Total (395) - -

Other Additional Disclosures (Unaudited)
159
Securities Financing Transaction (continued)
Algebris Financial Equity Fund
The amount of securities and commodities on loan as a proportion of total lendable assets (excluding cash and cash
equivalents) was 0% as at 30 June 2019.
Global data
Absolute amount
EUR % of Net assets
Total Return Swaps 6,863,243 8.25%
Total 6,863,243 8.25%
Concentration data
The following table reflects the counter parties across all Total Return Swaps contracts as at 30 June 2019, is as follows:
Counterparty
Swaps
EUR
HSBC Bank Plc 6,768,879
Morgan Stanley & Co International Plc 94,363
Total 6,863,242
Aggregate Transaction Data
Type of SFT
Maturity tenor
(SFTs/Total
Return Swaps)
Market
Value
(EUR)
MTM
(EUR)
Country of
counterparty
establishment
(not collateral)
Settlement
and
clearing Morgan Stanley & Co
International Plc Total Return Swap Above one year - 51,283 United Kingdom Bilateral
Morgan Stanley & Co
International Plc Total Return Swap
Three months to
one year - 43,080 United Kingdom Bilateral
Morgan Stanley & Co
International Plc Total Return Swap
One month to
three months - - United Kingdom Bilateral
Morgan Stanley & Co
International Plc Total Return Swap
One week to one
month - - United Kingdom Bilateral
HSBC Bank Plc Total Return Swap Above one year - - United Kingdom Bilateral
HSBC Bank Plc Total Return Swap
Three months to
one year - 6,768,879 United Kingdom Bilateral
HSBC Bank Plc Total Return Swap
One month to
three months - - United Kingdom Bilateral
HSBC Bank Plc Total Return Swap
One week to one
month - - United Kingdom Bilateral

Other Additional Disclosures (Unaudited)
160
Securities Financing Transaction (continued)
Algebris Financial Equity Fund (continued)
Aggregate Transaction Data (continued)
The Company does not segregate cash collateral received and as such there is no segregation of any reinvestment
return on cash collateral for the period to 30 June 2019.
The Company has no custody accounts in existence specifically for the safekeeping of collateral received.
Safekeeping
Depositary Collateral assets safe-kept
EUR
HSBC Bank Plc 8,468,608
Morgan Stanley & Co International Plc 1,050,978
Total 9,519,586
The proportion of collateral held in pooled accounts is 11%. The proportion of collateral held in segregated accounts is
89%.
Data on return and cost for Swap
The following table reflects the return and cost for Swaps broken down between the Sub-Fund, the Investment
Manager and third parties for the period ended 30 June 2019. The returns presented are isolated to the financing
transactions themselves and therefore do not include investment returns on the underlying collateral positions:
Fund Manager
Third
parties
EUR EUR EUR
Total Return Swaps (49,731) - -
Total (49,731) - -
Algebris Macro Credit Fund
The amount of securities and commodities on loan as a proportion of total lendable assets (excluding cash and cash
equivalents) was 0% as at 30 June 2019.
Global data
Absolute amount
EUR % of Net assets
Repurchase Agreement 24,656,552 4.12%
Total Return Swaps 695,376 0.11%
Total 25,351,928 4.23%

Other Additional Disclosures (Unaudited)
161
Securities Financing Transaction (continued)
Algebris Macro Credit Fund (continued)
Concentration data
The following table reflects the counter parties across all Repurchase Agreements contracts as at 30 June 2019, is as
follows:
Counterparty
Swaps
EUR
JP Morgan Securities Plc 312,455
Merrill Lynch International 227,428
Goldman Sachs International 117,387
BNP Paribas S.A. 38,106
Total
695,376
Counterparty
Repurchase Agreements
EUR
JP Morgan Securities Plc 24,656,552
Total
24,656,552
Aggregate Transaction Data
Type of SFT
Maturity
tenor
(SFTs/Total
Return
Swaps)
Market
Value
(EUR)
MTM
(EUR)
Country of
counterparty
establishment
(not collateral)
Settlement
and
clearing Quality Currency JP Morgan
Securities Plc
Repurchase
Agreement Open 1,507,950 - United Kingdom Bilateral NR USD
JP Morgan
Securities Plc
Repurchase
Agreement Open 8,832,413 - United Kingdom Bilateral NR EUR
JP Morgan
Securities Plc
Repurchase
Agreement Open 14,316,189 - United Kingdom Bilateral HY EUR
JP Morgan
Securities Plc
Cash
Collateral Open 3,157,391 - United Kingdom Bilateral - EUR
JP Morgan
Securities Plc
Total Return
Swap
Three months
to one year - 236,597 United Kingdom Bilateral - EUR
JP Morgan
Securities Plc
Total Return
Swap
Three months
to one year - 75,858 United Kingdom Bilateral - GBP
Merrill Lynch
International
Total Return
Swap
Above one
year - 227,199 United Kingdom Bilateral - UAH
Merrill Lynch
International
Total Return
Swap
Three months
to one year - 229 United Kingdom Bilateral - USD
Goldman
Sachs
International
Total Return
Swap
Three months
to one year - 117,387 United Kingdom Bilateral - UAH
BNP Paribas
S.A.
Total Return
Swap
Above one
year - 38,106 United Kingdom Bilateral - EUR
The Company does not segregate cash collateral received and as such there is no segregation of any reinvestment
return on cash collateral for the period to 30 June 2019.
The Company has no custody accounts in existence specifically for the safekeeping of collateral received.

Other Additional Disclosures (Unaudited)
162
Securities Financing Transaction (continued)
Algebris Macro Credit Fund (continued)
Safekeeping
Depositary Collateral assets safe-kept
EUR
JP Morgan Securities Plc 3,359,551
Goldman Sachs International 2,241,236
Merrill Lynch International 2,012,065
BNP Paribas S.A. -
Total 7,612,852
The proportion of collateral held in pooled accounts is 100%.
Data on return and cost for Swap and Repurchase Agreements
The following table reflects the return and cost for Swaps broken down between the Sub-Fund, the Investment
Manager and third parties for the period ended 30 June 2019. The returns presented are isolated to the financing
transactions themselves and therefore do not include investment returns on the underlying collateral positions:
Fund Manager
Third
parties
EUR EUR EUR
Repurchase Agreements 5,220 - -
Total return Swaps 142,555 - -
Total 147,775 - -
Algebris Quant Arbitrage Fund
The amount of securities and commodities on loan as a proportion of total lendable assets (excluding cash and cash
equivalents) was 0% as at 30 June 2019.
Global data
Absolute amount
EUR % of Net assets
Total Return Swaps 125,189 0.72%
Total 125,189 0.72%
Concentration data
The following table reflects the counter parties across all Total Return Swap contracts as at 30 June 2019, is as follows:
Counterparty
Repurchase Agreements
EUR
Morgan Stanley & Co International Plc 125,189
Total
125,189

Other Additional Disclosures (Unaudited)
163
Securities Financing Transaction (continued)
Algebris Quant Arbitrage Fund (continued)
Aggregate Transaction Data
Type of SFT
Maturity tenor
(SFTs/Total
Return Swaps)
Market
Value (EUR)
MTM
(EUR)
Country of
counterparty
establishment
(not collateral)
Settlement
and clearing Morgan Stanley &
Co International Plc
Total Return
Swap Above one year - 125,189 United Kingdom Bilateral
Morgan Stanley &
Co International Plc
Total Return
Swap
Three months to one
year - - United Kingdom Bilateral
Morgan Stanley &
Co International Plc
Total Return
Swap
One month to three
months - - United Kingdom Bilateral
Morgan Stanley &
Co International Plc
Total Return
Swap
One week to one
month - - United Kingdom Bilateral
Safekeeping
Depositary Collateral assets safe-kept
EUR
Morgan Stanley & Co International Plc 966,082
Total 966,082
The proportion of collateral held in pooled accounts is 100%.
Data on return and cost for Swap and Repurchase Agreements
The following table reflects the return and cost for Swaps broken down between the Sub-Fund, the Investment Manager
and third parties for the period ended 30 June 2019. The returns presented are isolated to the financing transactions
themselves and therefore do not include investment returns on the underlying collateral positions:
Fund Manager Third parties
EUR EUR EUR
Total return Swaps (12,160) - -
Total (12,160) - -
Algebris Allocation Fund
The Algebris Allocation Fund has not engaged in any SFT’s for the period ended 30 June 2019.
Algebris Core Italy Fund
The Algebris Core Italy Fund has not engaged in any SFT’s for the period ended 30 June 2019.