Guam final presentation
18
Transcript of Guam final presentation


LocationGuam is the westernmost territory of the United States located at about 3,700 miles west of Hawaii, 1,500 miles southeast of Japan, 1,500 miles
east of the Philippines and 3,100 miles northwest of Australia.

Overview of Guam
Population is 160,000
Percent of population in rural areas – 6%
Percent of population in urban areas – 94%
Language: English
Roman Catholic
85%
Other15%
Religion
37.1%
26.3%
11.3%
6.9%
6.3%
2.3%9.8%
Ethnicities
Chamorros
Filipinos
Other Pacific Islanders
Caucasian
Asian
Other
Mixed

Political SystemPart of U.S. Government
President: Barack Obama
Governor: Eddie Calvo
Follows all U.S. Federal Laws including:
Wage Requirements
Health/Safety Requirements
Environmental Regulations
Immigration
Banking
Laws & Regulations
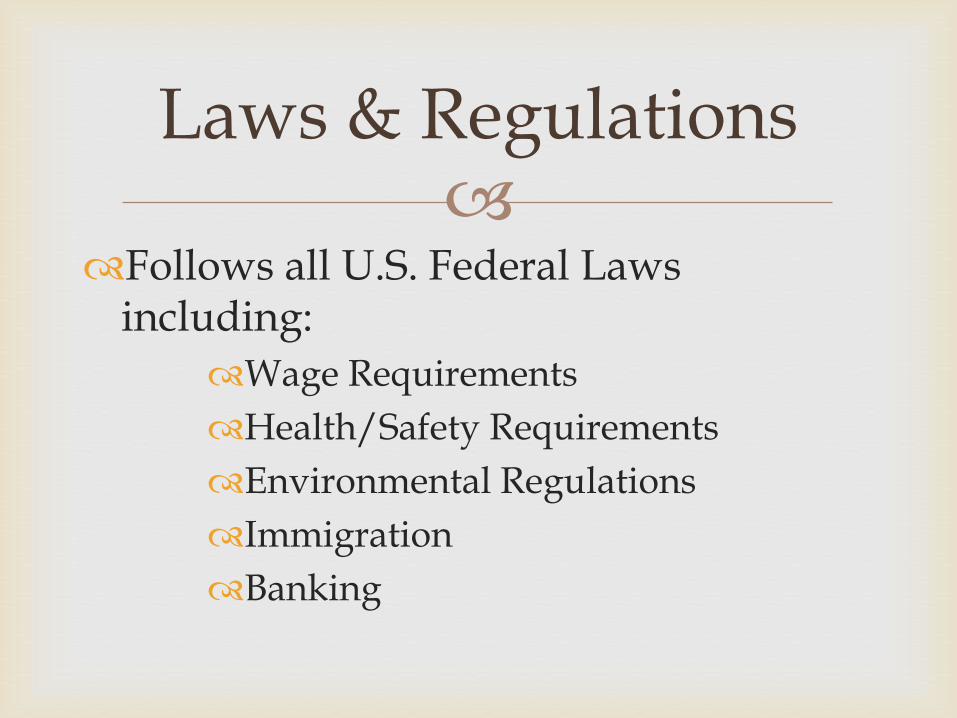
Has open visa policy for Russians, would like an open visa policy for China.
Cannot vote in U.S. Presidential Election, but is counted in primaries
Does not pay Federal Taxes. Sets own tax rates and duties.
No Sales Tax, extra school taxes, etc.
Differences
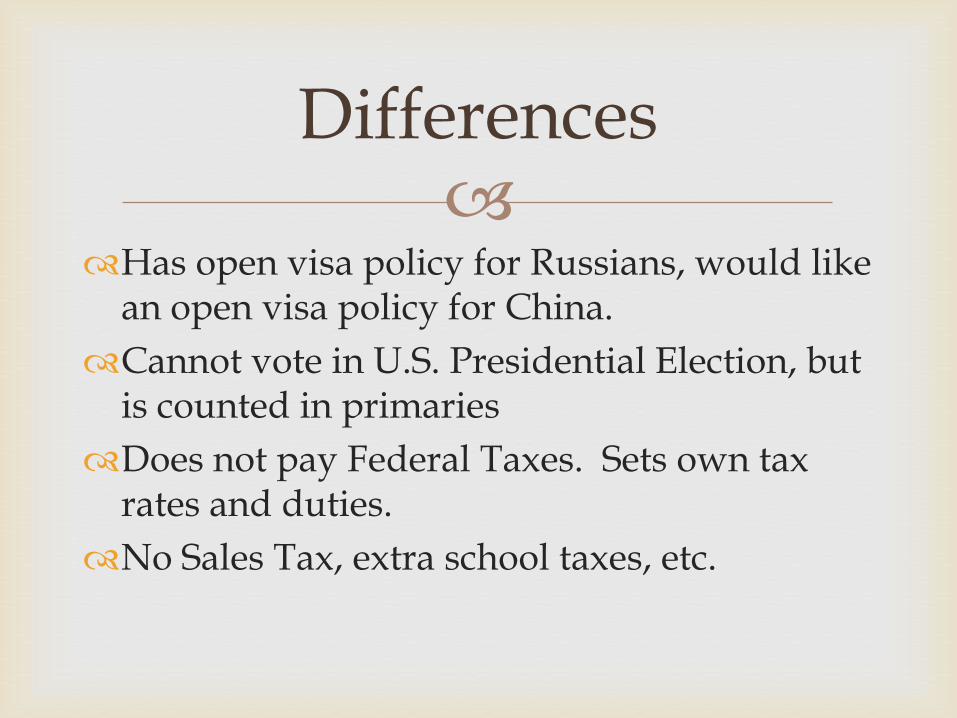
Guam Exports-Goods
20%
5%
20%
8%7%0%
24%
16%
Exports Jan - March 2013 Food & Non-alchoholic Beverages $2,389,791
Alcoholic Beverages $592,136
Transportation & Parts $2,348,938
Home Appliance, Equipment & Others $875,062
Plastics, Leather & Papers $823,347
Mens and Womens Apparel $40,947
Construction Materials $2,764,344
Other Exports $1,878,212

Exports by Guam by CountryJan-March 2013
19.81%
17.96%
15.49%9.30%
9.30%
5.42%
4.19%
3.66%
14.88%
Japan $2,320,640
Federated States of Micronesia $2,103,476
Germany $1,814,348
Republic of Korea $1,089,293
Hong Kong $1,088,995
Philippines $634,300
Singapore $490,997
Taiwan $428,445
Other countries $1,742,455

Guam Imports - Goods
Food & Non-alcoholic
Beverages ($12,674,161)
22.79%
Alcoholic Beverages
($705,201) 1.27%
Transporation & Parts ($9,956,986)
17.91%
Home Appliance, Equip
ment & Others ($5,185,834) 9.33%
Mens and Womens Apparel ($4,716,014) 8.48%
Plastics, Leather, and Paper
($10,610,863) 19.08%
Construction Materials
($1,608,387) 2.89%
Other Imports ($10,150,658)
18.25%Imports October 2012
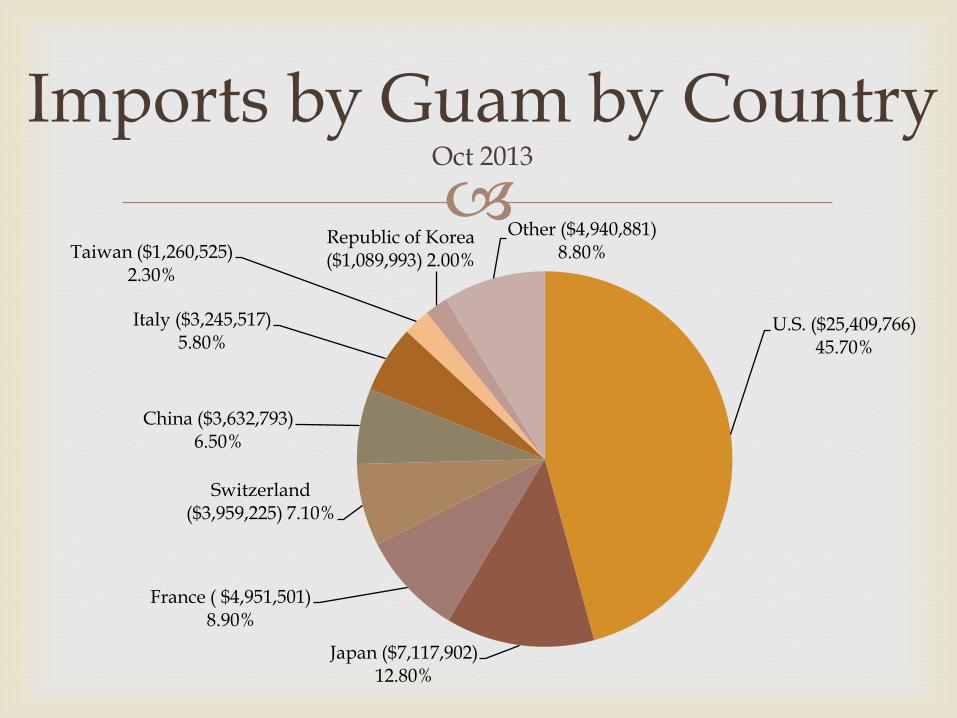
Imports by Guam by CountryOct 2013
U.S. ($25,409,766) 45.70%
Japan ($7,117,902) 12.80%
France ( $4,951,501) 8.90%
Switzerland ($3,959,225) 7.10%
China ($3,632,793) 6.50%
Italy ($3,245,517) 5.80%
Taiwan ($1,260,525) 2.30%
Republic of Korea ($1,089,993) 2.00%
Other ($4,940,881) 8.80%

Tourism – 1.2% growth in 2010, high potential for more
Military – Expecting $139 million in U.S. Government spending and an additional 8,000 Marines by 2016
Local Economy – mostly small businesses
Major Industries

With help of U.S. Government to assist in preparation of increase in population:
Better electrical generation
More potable water production
Wastewater improvements
Future Infrastructure Improvements

Increase in population with new military deployments
Increase in tourists
Rise in Consumer Spending and Imports for Businesses in Guam


Attractions of Owning a Retail Store in Guam
No sales tax
US Dollar is main currency
Transportation of goods is simple
Duty Free is attraction to consumers
Wider market than just U.S. tourists

InvestGuam.com
Guam-OnLine.com
Bsp.Guam.gov
Resources for Starting a Business in Guam

The End.