1 Back Billing Presentation Guam Legislature Thursday, June 10 th, 2010.
42
1 Back Billing Back Billing Presentation Presentation Guam Legislature Guam Legislature Thursday, June 10 Thursday, June 10 th th , , 2010 2010
-
Upload
bertha-copeland -
Category
Documents
-
view
227 -
download
0
Transcript of 1 Back Billing Presentation Guam Legislature Thursday, June 10 th, 2010.

1
Back Billing PresentationBack Billing Presentation
Guam LegislatureGuam Legislature
Thursday, June 10Thursday, June 10thth, 2010, 2010
2
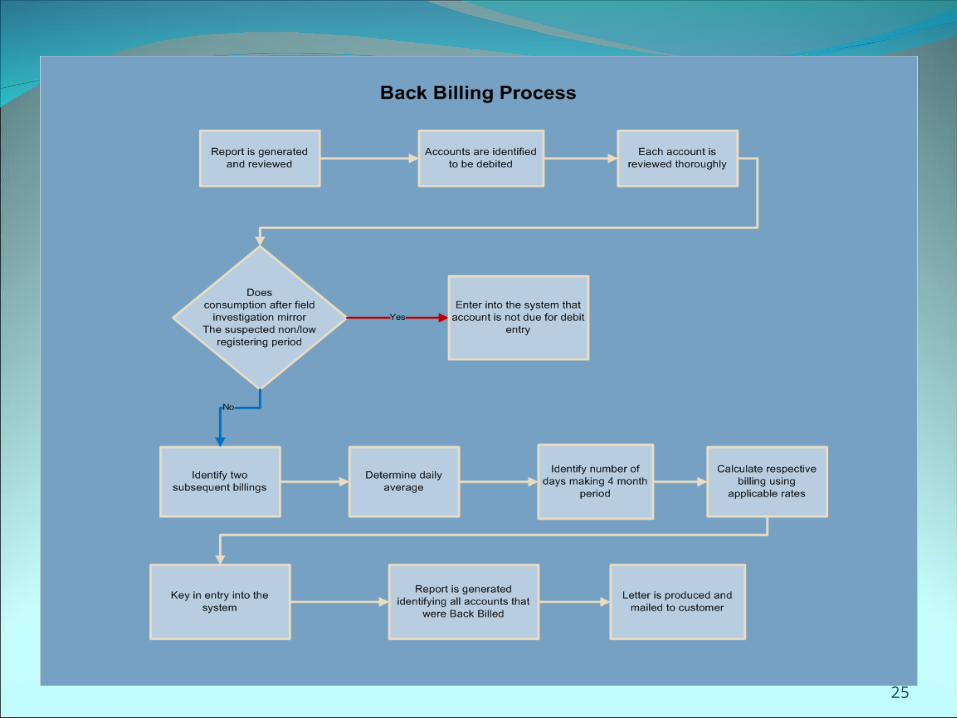
Presentation SummaryExisting Public Law re: back billingHow did we get here? A chronologyHow does GWA back bill?What are we doing to improve the process?Other things we think you should know.Amending the current law?How else can we improve existing law or
processes?What is fair?Conclusions.
3
Summary of ConclusionsThe current back bill law is fair and is being
implemented properly. GWA has a good process for implementing the
law’s intent.Thousands of people still received water
without paying for all of it. GWA is only trying to recover some payment for this “free water” via the current back billing law.
After initial problems, the meter improvement program has begun to bear fruit.
Any changes to the back bill laws should be considered carefully. Protecting the few at the expense of the many is unfair to all.
4
Existing law re: back billing
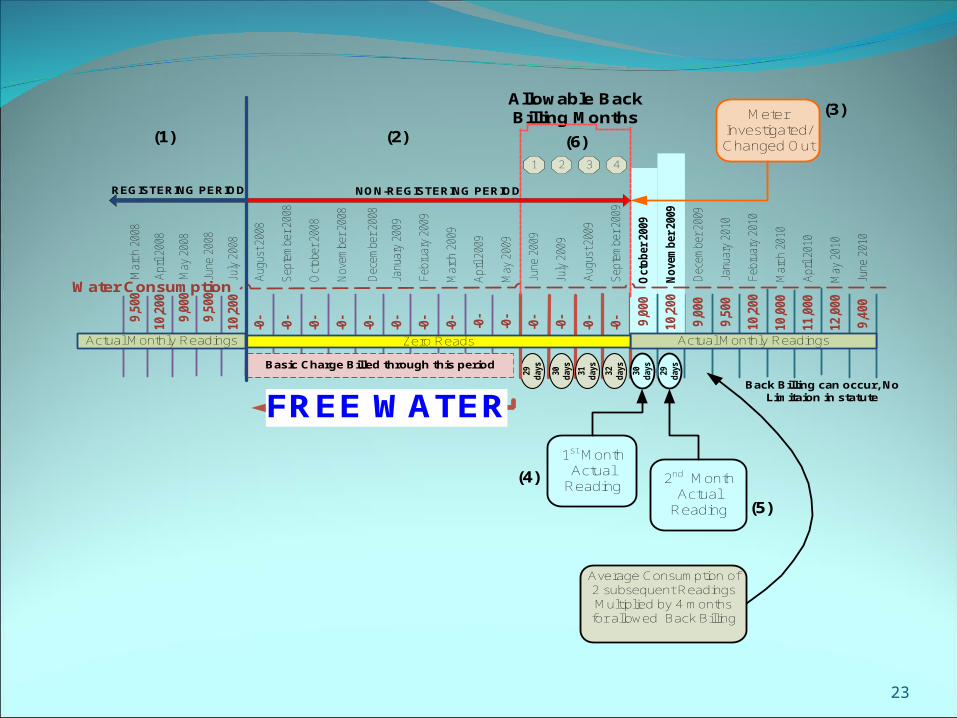
In 1993, PL 22-53 allowed GPA and GWA to back bill customers when a meter fails to read accurately. After the meter is fixed, GWA may back bill up to a max of four months, based on a two month daily average of actual usage after the meter was fixed.
The law has no specific time limit on how soon a corrected bill must be issued.
Current Guam law already allows customers to appeal contested back billing first to GWA, then to the PUC.
Back billing laws are common in most communities in recognition that consumers still received services for which they should pay once a fair adjustment for back billing is created.
These laws also recognize that other ratepayers who have correct billing should not also pay for the water used by their neighbors just because their neighbor’s meter failed to measure true consumption.

5
How did we get here?
In Dec 2002, USEPA sued GWA and Gov Guam for violating federal clean water laws, threatening to place GWA under possible receivership if problems were not solved.
In January 2003, the elected CCU assumes control over GWA.
June 2003: GWA and USEPA completed negotiation of a Stipulated Order (SO) to bring GWA into compliance with federal clean water/safe drinking water laws.
Section 14 of the SO required GWA to replace all of its 40,000 Sensus meters.
6
Selecting the Replacement Meters
In 2003 GWA solicited bids from contractors to supply new water meters with automated meter reading (AMR) equipment.
In December of 2003, the following bids were received:Kusakabe Guam, Inc. (Neptune Brand Meter)Kusakabe Guam, Inc. (Metron Farnier Brand
Meter)ITI-Power Savers (AMCO Brand Meter)Badger Meter, Inc. (Badger Brand Meter)
7
Chronology continued.. In June of 2005, GWA contracted with Kusakabe
Guam, Inc., for $11.8 million to provide and install Metron-Farnier meters throughout the system.
Metron-Farnier meters are used throughout the world.
In 2005, at GWA’s request, the meters were also equipped with a “backflow preventer,” that is designed to prevent contaminated water from flowing back into the public drinking water supply. The backflow prevention devices were inserted into the outlet end of the meter body.
8
Continue chronology..GWA purchased single jet water meters with radio
transponders. The meters are considered ideal for conditions on Guam and the transponders allow for easier “drive by” reading of meters.
In 2007 GWA terminated its contract with Kusakabe after it installed approximately 26,000 meters. The contract was ended because of repeated problems with meter installations.
In July of 2008 GWA contracted directly with Metron-Farnier to provide meters and transponders under the same terms and conditions that governed the meter purchase contract with Kusakabe.
GWA took over the installation of the new meters.To date, 28,520 meters have been installed.
9
Creation of Meter Task Force • In late 2008, GWA became concerned when an
alarming number of meters began to produce “low or no reads”. Revenues correspondingly began to drop.
• In early 2009, GM CUS, John Benavente created a Meter Task Force (MTF) to investigate and determine why our meters were failing to read accurately.
• Fifty GWA employees worked on the MTF, reflecting a cross-section of expertise including:
• Operations, accounting, customer service, data, internal audit, revenue protection, and procurement.
10
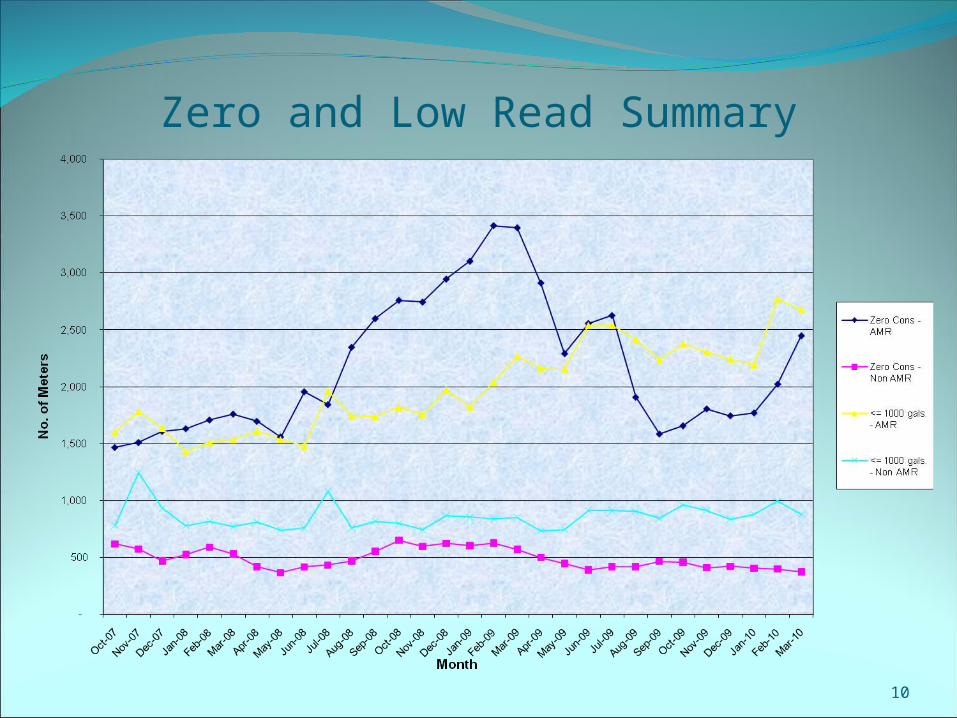
Zero and Low Read Summary
11
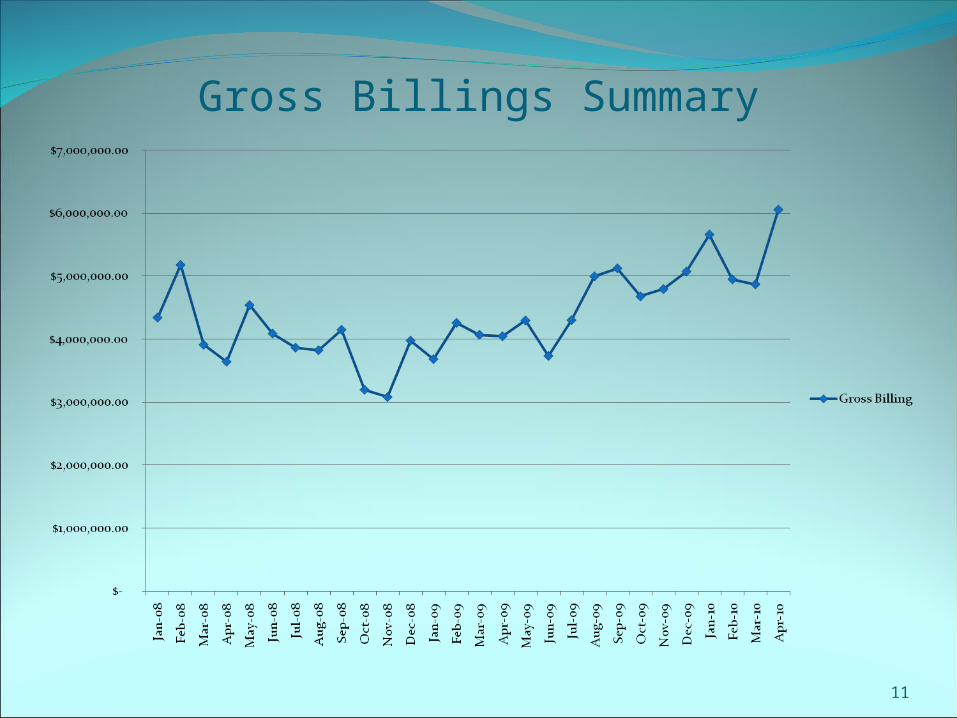
Gross Billings Summary
12
The Meter Task Force (MTF) Effort:
Since January 2009, the MTF investigated some 15,700 meters for possible non-registering or low registering meter conditions.
GWA investigated 75 to 100 questionable meters a day.
GWA produced 17,850 work orders from Jan 2009 to May 2010.
Of the 17,850 work orders 11,950 had zero reads and 5,900 had low reads.

13
Meter Task Force findings: 7,850 Meters were found to have
backflow preventer problems. 6,630 Meters required change outs. 1,660 Meters were functioning properly. 730 Meters were determined to be
serving vacant locations, bypass, fire line, or sprinkler meters.
986 Meters were clogged and required removal of debris.
14
Independent review of Meter ProblemIn the Fall of 2009, GWA hired the nationally recognized engineering firm of RW Beck to assist GWA with conducting a root-cause analysis and to provide GWA with recommendations on how to best move the meter program forward.
RW Beck’s Major Findings:
• The most common problem was the accumulation of debris.• Old iron pipes were rusting and putting debris into the
meter.• Some meters suffered from stripped gears.• Some meters showed a buildup of “film” around the interior
of the meter.• Some meters had broken shafts.• Older Sensus meters are also under-registering.

15
RW Beck Major Findings:The Metron-Farnier meters are “a reasonable
choice for Guam.” Other utilities they surveyed reported “they
were happy with the products, and reiterated that single jet designs are best for resisting jamming and for water with grit or debris”
“…the conclusion is that a single jet meter is the right choice for Guam’s water system and Metron’s product is proven to work in other locations.”
16
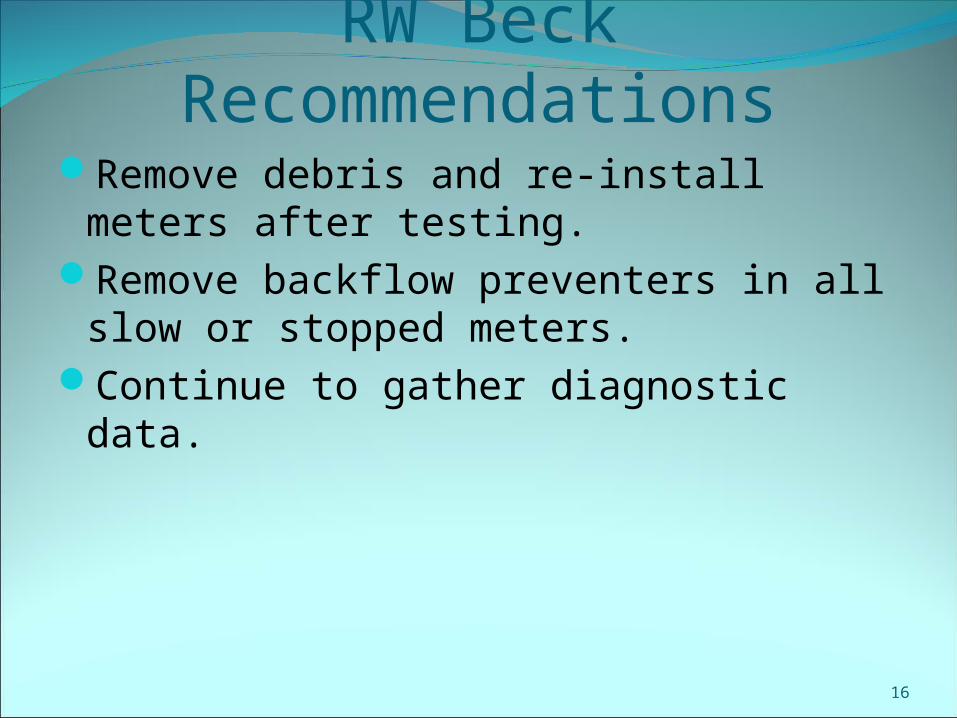
RW Beck RecommendationsRemove debris and re-install meters
after testing. Remove backflow preventers in all slow
or stopped meters. Continue to gather diagnostic data.

17
What results have occurred since the beginning of the MTF:
After many months of aggressively replacing zero read and low read meters, revenues have begun to recover.
Since April 2009 GWA has sent out 1900 back bills to both residential and commercial customers totaling $1.5 million.
4,375 accounts remain to be back billed totaling $1.65 million.
Total back billing is $3.19 million for 6,275 customers.
18
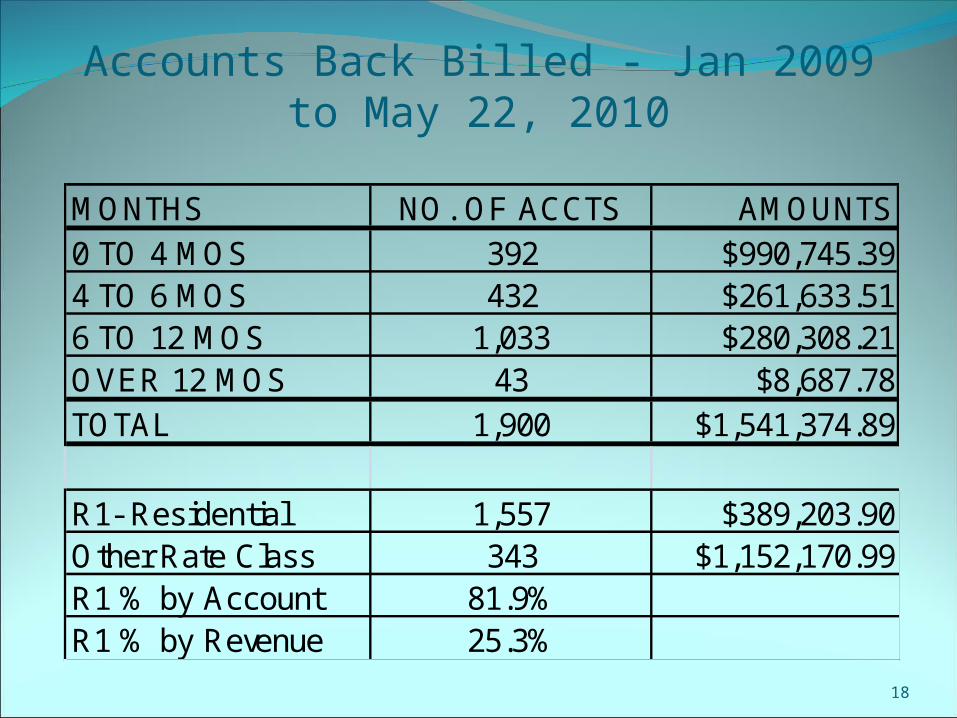
Accounts Back Billed - Jan 2009 to May 22, 2010
MONTHS NO. OF ACCTS AMOUNTS0 TO 4 MOS 392 $990,745.394 TO 6 MOS 432 $261,633.516 TO 12 MOS 1,033 $280,308.21OVER 12 MOS 43 $8,687.78TOTAL 1,900 $1,541,374.89
R1- Residential 1,557 $389,203.90Other Rate Class 343 $1,152,170.99R1 % by Account 81.9%R1 % by Revenue 25.3%
19
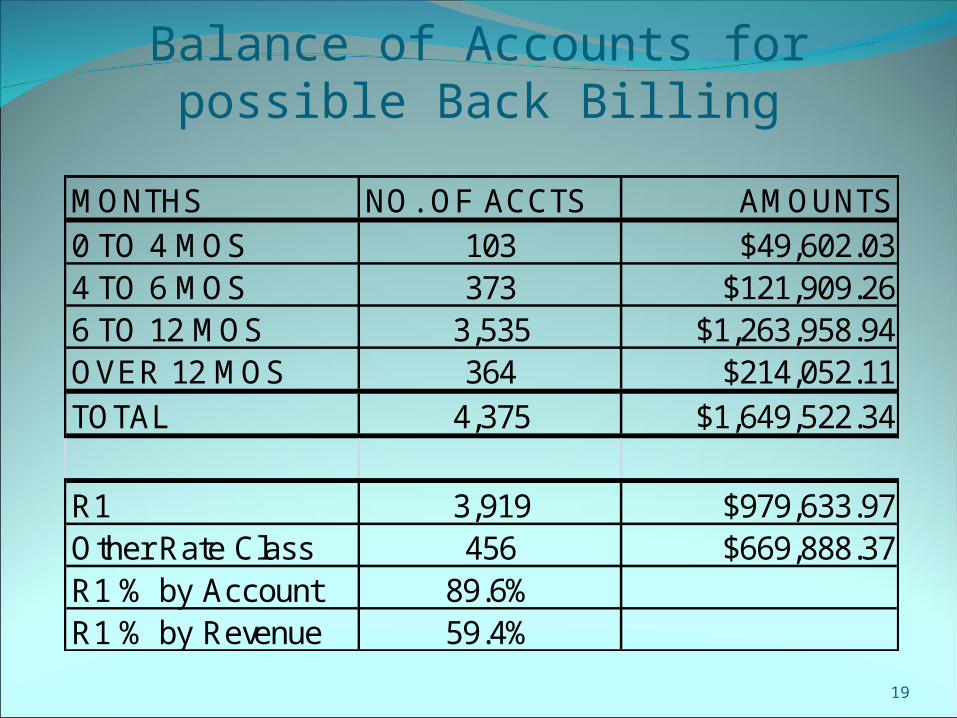
Balance of Accounts for possible Back Billing
MONTHS NO. OF ACCTS AMOUNTS0 TO 4 MOS 103 $49,602.034 TO 6 MOS 373 $121,909.266 TO 12 MOS 3,535 $1,263,958.94OVER 12 MOS 364 $214,052.11TOTAL 4,375 $1,649,522.34
R1 3,919 $979,633.97Other Rate Class 456 $669,888.37R1 % by Account 89.6%R1 % by Revenue 59.4%
20
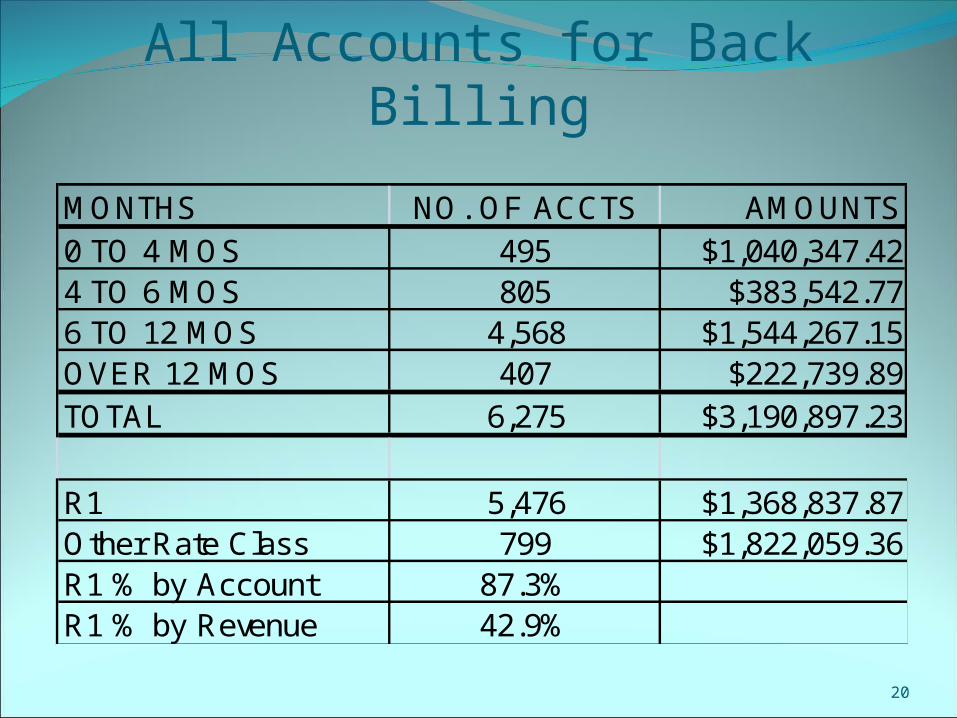
All Accounts for Back Billing
MONTHS NO. OF ACCTS AMOUNTS0 TO 4 MOS 495 $1,040,347.424 TO 6 MOS 805 $383,542.776 TO 12 MOS 4,568 $1,544,267.15OVER 12 MOS 407 $222,739.89TOTAL 6,275 $3,190,897.23
R1 5,476 $1,368,837.87Other Rate Class 799 $1,822,059.36R1 % by Account 87.3%R1 % by Revenue 42.9%
21
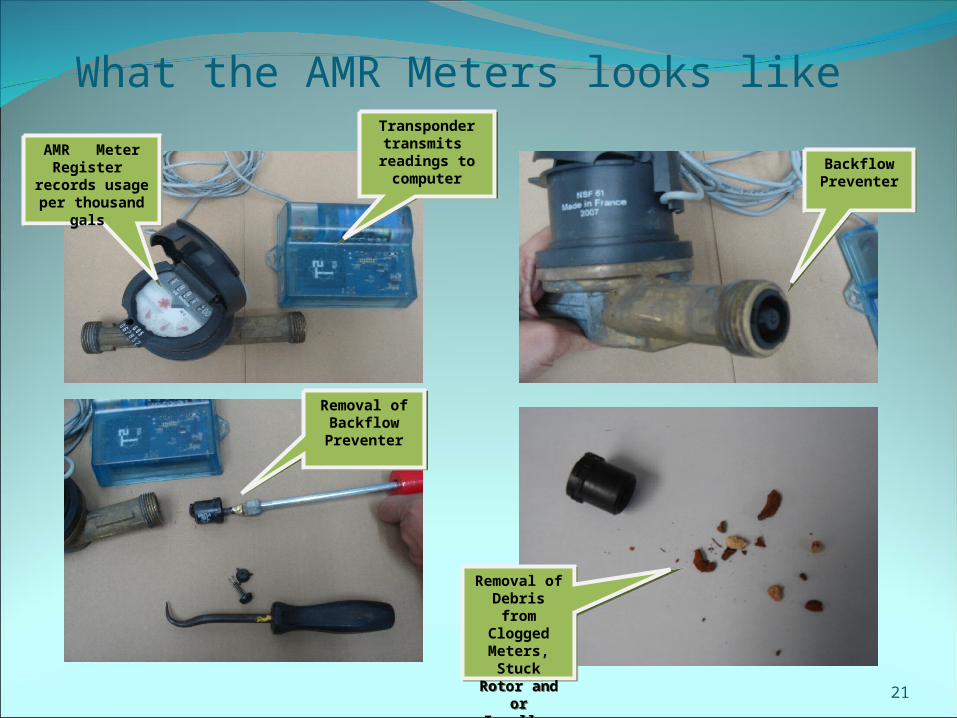
What the AMR Meters looks like Transponder
transmits readings to computer
Transponder transmits readings
to computerAMR Meter
Register records usage per
thousand gals
AMR Meter Register records
usage per thousand gals
Backflow PreventerBackflow Preventer
Removal of Backflow Preventer
Removal of Backflow Preventer
Removal of Debris from
Clogged Meters, Stuck Rotor and or
Impeller
Removal of Debris from
Clogged Meters, Stuck Rotor and or
Impeller
22
23
May
200
9
June
200
9
July
200
9
Aug
ust 2
009
Sep
tem
ber 2
009
Oct
ober
200
9
Nov
embe
r 20
09
Dec
embe
r 200
9
Janu
ary
2010
Febr
uary
201
0
Mar
ch 2
010
Apr
il 20
09
Apr
il 20
10
May
201
0
FREE WATER
June
201
0
Allowable Back Billing Months
29 days 32 days31 days30 days
Back Billing can occur, No Limitaion in statute
-0-
-0-
-0-
10,0
00
11,0
00
12,0
00
9,40
0
Water Consumption
1 2 3 4
29 days30 days
-0-
-0-
-0- 9,00
0
10,2
00
9,00
0
9,50
0
10,2
00
Actual Monthly Readings
-0-
-0-
-0-
-0-
-0-
-0-
-0-
-0-
NON-REGISTERING PERIOD
Mar
ch 2
009
Febr
uary
200
9
Janu
ary
2009
Dec
embe
r 200
8
Nov
embe
r 200
8
Oct
ober
200
8
Sep
tem
ber 2
008
Aug
ust 2
008
Basic Charge Billed through this period
1st Month Actual
Reading2nd Month
ActualReading
Average Consumption of 2 subsequent Readings Multiplied by 4 months
for allowed Back Billing
Zero Reads
Meter Investigated/Changed Out
10,2
00
10,2
00
9,50
0
9,50
0
9,00
0
July
200
8
June
200
8
May
200
8
Apr
il 20
08
Mar
ch 2
008
REGISTERING PERIOD
Actual Monthly Readings
(1) (2)
(3)
(4)
(5)
(6)
24
25

26
Case Study: Commercial Customer Amount Billed 6 Months BEFORE Meter Malfunctioned
BILL DATE SERVICE PERIOD BILLED# OF DAYS
BASIC WATER CHARGE
BASIC SEWER CHARGES
WATER USAGE (in gals)
WATER USAGE (@
5.15 p/kgals)
SEWER USAGE (in
gals @ 80% of water usage)
SEWER USAGE (@ 9.58 p/k
gals)
GPA NAVY
SRCHRG (@
8.03%)
SUPPTL ANITY
SRCHRG (@ 3.49%)
TOTAL AMT BILLED
07/13/08 06/03/08 THRU 07/02/08 29 $ 10.15 N/A - COMMERCIAL 12700 $ 65.41 10160 $ 97.33 $ 13.88 $ 6.03 $ 192.80
08/07/08 07/02/08 THRU 08/02/08 32 $ 10.15 N/A - COMMERCIAL 24600 $ 126.69 19680 $ 188.53 $ 26.13 $ 11.36 $ 362.86
09/08/08 08/02/08 THRU 09/03/08 33 $ 10.15 N/A - COMMERCIAL 10000 $ 51.50 8000 $ 76.64 $ 11.10 $ 4.83 $ 154.22
10/07/08 09/03/08 THRU 10/02/08 30 $ 10.15 N/A - COMMERCIAL 8800 $ 45.32 7040 $ 67.44 $ 9.87 $ 4.29 $ 137.07
11/06/08 10/02/08 THRU 11/05/08 35 $ 10.15 N/A - COMMERCIAL 15300 $ 78.80 12240 $ 117.26 $ 16.56 $ 7.20 $ 229.96
12/10/08 11/05/08 THRU 12/02/08 28 $ 10.15 N/A - COMMERCIAL 17500 $ 90.13 14000 $ 134.12 $ 18.82 $ 8.18 $ 261.40
TOTAL (6 MONTH PERIOD): 187 $ 60.90 88900 $ 457.84 71120 $ 681.33 $ 96.37 $ 41.88 $ 1,338.31
AVERAGE AMOUNTS: 31
$ 10.15 14817 $ 76.31 11853 $ 113.55 $ 16.06 $ 6.98 $ 223.05
Amount billed DURING meter malfunction condition - METER FAILED FOR 4 CONSECUTIVE MONTHS
BILL DATE SERVICE PERIOD BILLED# OF DAYS
BASIC WATER CHARGE
BASIC SEWER CHARGES
WATER USAGE (in gals)
WATER USAGE (@
5.15 p/kgals)
SEWER USAGE (in
gals @ 80% of water usage)
SEWER USAGE (@ 9.58 p/k
gals)
GPA NAVY
SRCHRG (@
8.03%)
SUPPTL ANITY
SRCHRG (@ 3.49%)
TOTAL AMT BILLED
01/12/09 12/02/08 THRU 01/05/09 35 $ 10.15 N/A - COMMERCIAL 0 $ - 0 $ - $ 0.82 $ 0.35 $ 11.32
02/09/09 01/05/09 THRU 02/03/09 30 $ 10.15 N/A - COMMERCIAL 0 $ - 0 $ - $ 0.82 $ 0.35 $ 11.32
03/09/09 02/03/09 THRU 03/03/09 29 $ 10.15 N/A - COMMERCIAL 0 $ - 0 $ - $ 0.82 $ 0.35 $ 11.32
04/07/09 03/03/09 THRU 04/02/09 31 $ 10.82 N/A - COMMERCIAL 0 $ - 0 $ - $ 0.87 $ 0.38 $ 12.07
TOTAL (4 MONTH PERIOD): 125 $ 41.27 0 $ - 0 $ - $ 3.31 $ 1.44 $ 46.02
AVERAGE AMOUNTS: 31 $ 10.32 0 $ - 0 $ - $ 0.83 $ 0.36 $ 11.51
Date of meter change out is
04/29/09
27
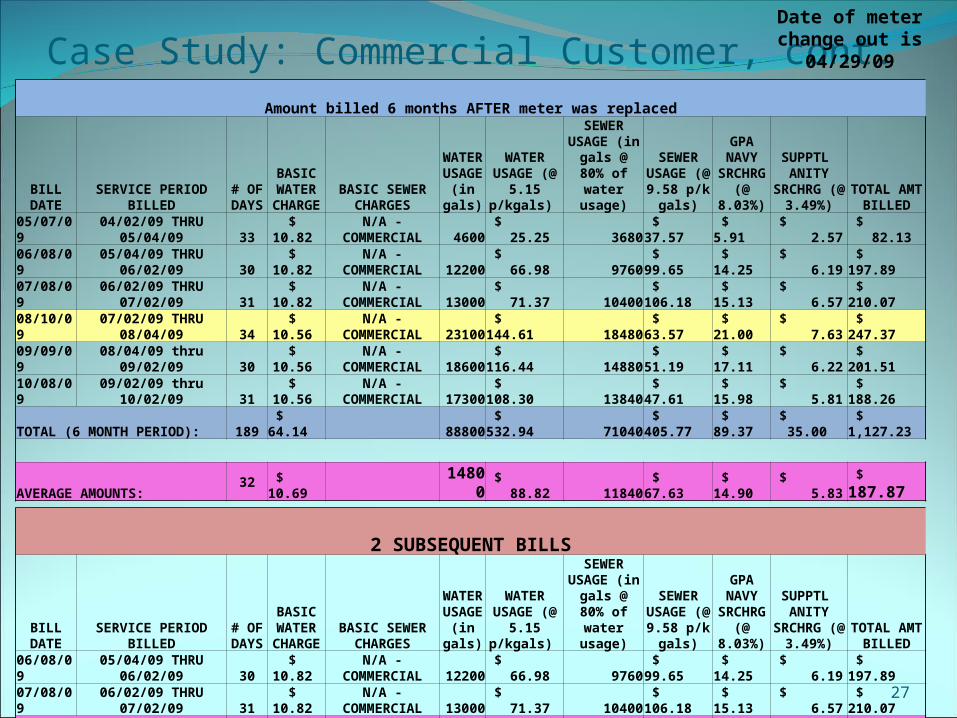
Amount billed 6 months AFTER meter was replaced
BILL DATE SERVICE PERIOD BILLED# OF DAYS
BASIC WATER CHARGE
BASIC SEWER CHARGES
WATER USAGE (in gals)
WATER USAGE (@
5.15 p/kgals)
SEWER USAGE (in
gals @ 80% of water usage)
SEWER USAGE (@ 9.58 p/k
gals)
GPA NAVY
SRCHRG (@ 8.03%)
SUPPTL ANITY
SRCHRG (@ 3.49%)
TOTAL AMT BILLED
05/07/09 04/02/09 THRU 05/04/09 33 $ 10.82 N/A - COMMERCIAL 4600 $ 25.25 3680 $ 37.57 $ 5.91 $ 2.57 $ 82.13
06/08/09 05/04/09 THRU 06/02/09 30 $ 10.82 N/A - COMMERCIAL 12200 $ 66.98 9760 $ 99.65 $ 14.25 $ 6.19 $ 197.89
07/08/09 06/02/09 THRU 07/02/09 31 $ 10.82 N/A - COMMERCIAL 13000 $ 71.37 10400 $ 106.18 $ 15.13 $ 6.57 $ 210.07
08/10/09 07/02/09 THRU 08/04/09 34 $ 10.56 N/A - COMMERCIAL 23100 $ 144.61 18480 $ 63.57 $ 21.00 $ 7.63 $ 247.37
09/09/09 08/04/09 thru 09/02/09 30 $ 10.56 N/A - COMMERCIAL 18600 $ 116.44 14880 $ 51.19 $ 17.11 $ 6.22 $ 201.51
10/08/09 09/02/09 thru 10/02/09 31 $ 10.56 N/A - COMMERCIAL 17300 $ 108.30 13840 $ 47.61 $ 15.98 $ 5.81 $ 188.26
TOTAL (6 MONTH PERIOD): 189 $ 64.14 88800 $ 532.94 71040 $ 405.77 $ 89.37 $ 35.00 $ 1,127.23
AVERAGE AMOUNTS: 32 $ 10.69 14800 $ 88.82 11840 $ 67.63 $ 14.90 $ 5.83 $ 187.87
2 SUBSEQUENT BILLS
BILL DATE SERVICE PERIOD BILLED# OF DAYS
BASIC WATER CHARGE
BASIC SEWER CHARGES
WATER USAGE (in gals)
WATER USAGE (@
5.15 p/kgals)
SEWER USAGE (in
gals @ 80% of water usage)
SEWER USAGE (@ 9.58 p/k
gals)
GPA NAVY
SRCHRG (@ 8.03%)
SUPPTL ANITY
SRCHRG (@ 3.49%)
TOTAL AMT BILLED
06/08/09 05/04/09 THRU 06/02/09 30 $ 10.82 N/A - COMMERCIAL 12200 $ 66.98 9760 $ 99.65 $ 14.25 $ 6.19 $ 197.89
07/08/09 06/02/09 THRU 07/02/09 31 $ 10.82 N/A - COMMERCIAL 13000 $ 71.37 10400 $ 106.18 $ 15.13 $ 6.57 $ 210.07
TOTAL (2 MONTH PERIOD): 61 $ 21.64 25200 $ 138.35 20160 $ 205.83 $ 29.38 $ 12.77 $ 407.96
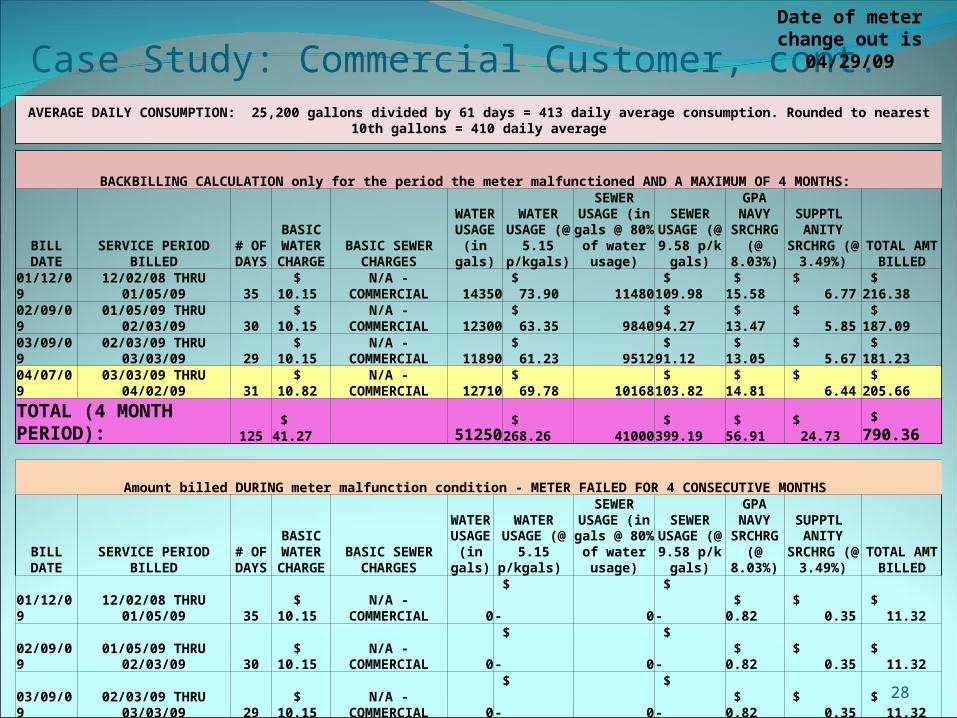
AVERAGE DAILY CONSUMPTION: 25,200 gallons divided by 61 days = 413 daily average consumption. Rounded to nearest 10th gallons = 410 daily average
Case Study: Commercial Customer, cont.Date of meter change out is
04/29/09
28
Case Study: Commercial Customer, cont. Date of meter change out is
04/29/09
AVERAGE DAILY CONSUMPTION: 25,200 gallons divided by 61 days = 413 daily average consumption. Rounded to nearest 10th gallons = 410 daily average
BACKBILLING CALCULATION only for the period the meter malfunctioned AND A MAXIMUM OF 4 MONTHS:
BILL DATE SERVICE PERIOD BILLED# OF DAYS
BASIC WATER CHARGE
BASIC SEWER CHARGES
WATER USAGE (in gals)
WATER USAGE (@
5.15 p/kgals)
SEWER USAGE (in gals @ 80%
of water usage)
SEWER USAGE (@ 9.58 p/k
gals)
GPA NAVY SRCHRG
(@ 8.03%)
SUPPTL ANITY
SRCHRG (@ 3.49%)
TOTAL AMT BILLED
01/12/09 12/02/08 THRU 01/05/09 35 $ 10.15 N/A - COMMERCIAL 14350 $ 73.90 11480 $ 109.98 $ 15.58 $ 6.77 $ 216.38
02/09/09 01/05/09 THRU 02/03/09 30 $ 10.15 N/A - COMMERCIAL 12300 $ 63.35 9840 $ 94.27 $ 13.47 $ 5.85 $ 187.09
03/09/09 02/03/09 THRU 03/03/09 29 $ 10.15 N/A - COMMERCIAL 11890 $ 61.23 9512 $ 91.12 $ 13.05 $ 5.67 $ 181.23
04/07/09 03/03/09 THRU 04/02/09 31 $ 10.82 N/A - COMMERCIAL 12710 $ 69.78 10168 $ 103.82 $ 14.81 $ 6.44 $ 205.66
TOTAL (4 MONTH PERIOD): 125 $ 41.27 51250 $ 268.26 41000 $ 399.19 $ 56.91 $ 24.73 $ 790.36
Amount billed DURING meter malfunction condition - METER FAILED FOR 4 CONSECUTIVE MONTHS
BILL DATE SERVICE PERIOD BILLED# OF DAYS
BASIC WATER CHARGE
BASIC SEWER CHARGES
WATER USAGE (in gals)
WATER USAGE (@
5.15 p/kgals)
SEWER USAGE (in gals @ 80%
of water usage)
SEWER USAGE (@ 9.58 p/k
gals)
GPA NAVY SRCHRG
(@ 8.03%)
SUPPTL ANITY
SRCHRG (@ 3.49%)
TOTAL AMT BILLED
01/12/09 12/02/08 THRU 01/05/09 35 $ 10.15 N/A - COMMERCIAL 0 $ - 0 $ - $ 0.82 $ 0.35 $ 11.32
02/09/09 01/05/09 THRU 02/03/09 30 $ 10.15 N/A - COMMERCIAL 0 $ - 0 $ - $ 0.82 $ 0.35 $ 11.32
03/09/09 02/03/09 THRU 03/03/09 29 $ 10.15 N/A - COMMERCIAL 0 $ - 0 $ - $ 0.82 $ 0.35 $ 11.32
04/07/09 03/03/09 THRU 04/02/09 31 $ 10.82 N/A - COMMERCIAL 0 $ - 0 $ - $ 0.87 $ 0.38 $ 12.07
TOTAL (4 MONTH PERIOD): 125 $ 41.27 0 $ - 0 $ - $ 3.31 $ 1.44 $ 46.02
AMOUNT OF BACKBILLING: $ - 51,250 $ 268.26 41,000 $ 399.19 $ 53.60 $ 23.29 $ 744.33
29
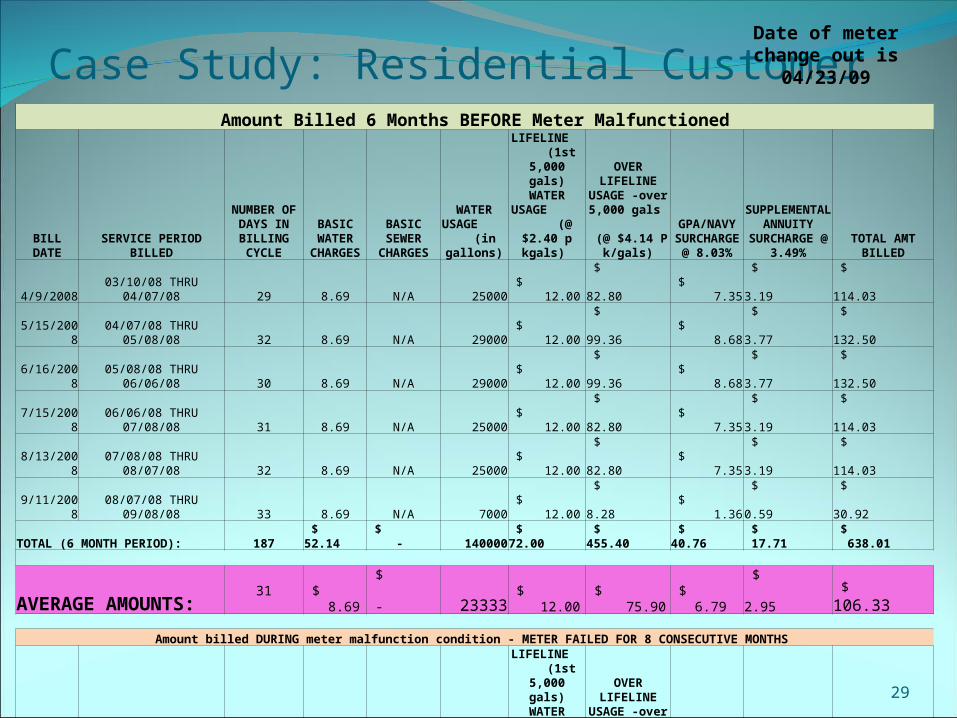
Case Study: Residential Customer Amount Billed 6 Months BEFORE Meter Malfunctioned
BILL DATE SERVICE PERIOD BILLED
NUMBER OF DAYS IN
BILLING CYCLE
BASIC WATER
CHARGESBASIC SEWER
CHARGES
WATER USAGE (in gallons)
LIFELINE (1st 5,000 gals) WATER USAGE (@ $2.40
p kgals)
OVER LIFELINE USAGE -over
5,000 gals (@ $4.14 P
k/gals)
GPA/NAVY SURCHARGE
@ 8.03%
SUPPLEMENTAL ANNUITY
SURCHARGE @ 3.49% TOTAL AMT BILLED
4/9/2008 03/10/08 THRU 04/07/08 29 8.69 N/A 25000 $ 12.00 $ 82.80 $ 7.35 $ 3.19 $ 114.03 5/15/2008 04/07/08 THRU 05/08/08 32 8.69 N/A 29000 $ 12.00 $ 99.36 $ 8.68 $ 3.77 $ 132.50 6/16/2008 05/08/08 THRU 06/06/08 30 8.69 N/A 29000 $ 12.00 $ 99.36 $ 8.68 $ 3.77 $ 132.50 7/15/2008 06/06/08 THRU 07/08/08 31 8.69 N/A 25000 $ 12.00 $ 82.80 $ 7.35 $ 3.19 $ 114.03 8/13/2008 07/08/08 THRU 08/07/08 32 8.69 N/A 25000 $ 12.00 $ 82.80 $ 7.35 $ 3.19 $ 114.03 9/11/2008 08/07/08 THRU 09/08/08 33 8.69 N/A 7000 $ 12.00 $ 8.28 $ 1.36 $ 0.59 $ 30.92
TOTAL (6 MONTH PERIOD): 187 $ 52.14 $ - 140000 $ 72.00 $ 455.40 $ 40.76 $ 17.71 $ 638.01
AVERAGE AMOUNTS: 31 $ 8.69 $ - 23333 $ 12.00 $ 75.90 $ 6.79 $ 2.95 $ 106.33
Amount billed DURING meter malfunction condition - METER FAILED FOR 8 CONSECUTIVE MONTHS
BILL DATE SERVICE PERIOD BILLED
NUMBER OF DAYS IN
BILLING CYCLE
BASIC WATER
CHARGESBASIC SEWER
CHARGES
WATER USAGE (in gallons)
LIFELINE (1st 5,000 gals) WATER USAGE (@ $2.40
p kgals)
OVER LIFELINE USAGE -over
5,000 gals (@ $4.14 P
k/gals)
GPA/NAVY SURCHARGE
@ 8.03%
SUPPLEMENTAL ANNUITY
SURCHARGE @ 3.49% TOTAL AMT BILLED
10/14/2008 09/08/08 THRU 10/08/08 31 8.69 N/A 0 $ - 0 $ 0.70 $ 0.30 $ 9.69
11/17/2008 10/08/08 THRU 11/10/08 34 8.69 N/A 0 $ - 0 $ 0.70 $ 0.30 $ 9.69
12/11/2008 11/10/08 THRU 12/09/08 30 8.69 N/A 0 $ - 0 $ 0.70 $ 0.30 $ 9.69
1/14/2009 12/09/09 THRU 01/09/09 32 8.69 N/A 2000 $ 4.80 0 $ 0.70 $ 0.30 $ 14.49 2/12/2009 01/09/09 THRU 02/09/09 32 8.69 N/A 1000 $ 2.40 0 $ 0.70 $ 0.30 $ 12.09
3/12/2009 02/09/09 THRU 03/09/09 29 8.69 N/A 0 $ - 0 $ 0.70 $ 0.30 $ 9.69
4/13/2009 03/09/09 THRU 04/08/09 31 9.26 N/A 0 $ - 0 $ 0.74 $ 0.32 $ 10.33 5/13/2009 04/08/09 THRU 05/07/09 14 9.26 N/A 200 $ 0.48 0 $ 0.74 $ 0.32 $ 10.81
TOTAL (9 MONTH PERIOD): 233 $ 70.66 $ - 3,200 $ 7.68 $ - $ 5.67 $ 2.47 $ 86.48
AVERAGE AMOUNTS: 26 $ 7.85 $ - 356 $ 0.85 0 $ 0.63 $ 0.27 $ 9.61
Date of meter change out is
04/23/09
30
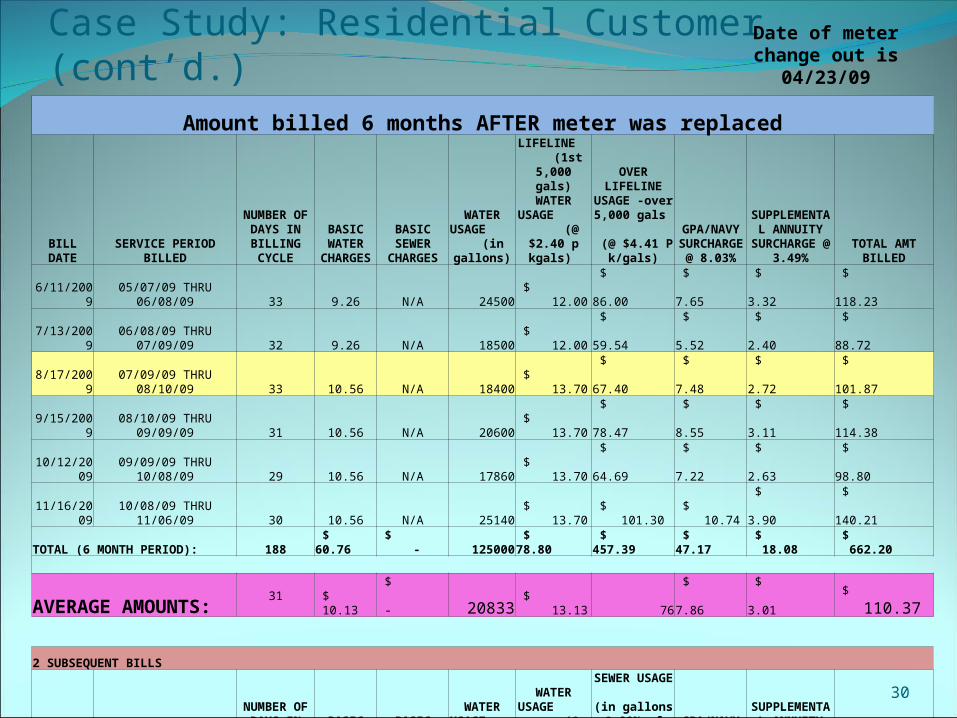
Case Study: Residential Customer (cont’d.)Amount billed 6 months AFTER meter was replaced
BILL DATE SERVICE PERIOD BILLED
NUMBER OF DAYS IN
BILLING CYCLE
BASIC WATER
CHARGESBASIC SEWER
CHARGES
WATER USAGE (in gallons)
LIFELINE (1st 5,000 gals) WATER USAGE (@ $2.40
p kgals)
OVER LIFELINE USAGE -over
5,000 gals (@ $4.41 P
k/gals)
GPA/NAVY SURCHARGE
@ 8.03%
SUPPLEMENTAL ANNUITY
SURCHARGE @ 3.49% TOTAL AMT BILLED
6/11/2009 05/07/09 THRU 06/08/09 33 9.26 N/A 24500 $ 12.00 $ 86.00 $ 7.65
$ 3.32
$ 118.23
7/13/2009 06/08/09 THRU 07/09/09 32 9.26 N/A 18500 $ 12.00 $ 59.54 $ 5.52
$ 2.40
$ 88.72
8/17/2009 07/09/09 THRU 08/10/09 33 10.56 N/A 18400 $ 13.70 $ 67.40 $ 7.48
$ 2.72
$ 101.87
9/15/2009 08/10/09 THRU 09/09/09 31 10.56 N/A 20600 $ 13.70 $ 78.47 $ 8.55
$ 3.11
$ 114.38
10/12/2009 09/09/09 THRU 10/08/09 29 10.56 N/A 17860 $ 13.70 $ 64.69 $ 7.22
$ 2.63
$ 98.80
11/16/2009 10/08/09 THRU 11/06/09 30 10.56 N/A 25140 $ 13.70 $ 101.30 $ 10.74 $ 3.90
$ 140.21
TOTAL (6 MONTH PERIOD): 188 $ 60.76 $ - 125000 $ 78.80 $ 457.39 $ 47.17 $ 18.08 $ 662.20
AVERAGE AMOUNTS: 31 $ 10.13 $ - 20833 $ 13.13 76 $ 7.86 $ 3.01 $ 110.37
2 SUBSEQUENT BILLS
BILL DATE SERVICE PERIOD BILLED
NUMBER OF DAYS IN
BILLING CYCLE
BASIC WATER
CHARGESBASIC SEWER
CHARGES
WATER USAGE (in gallons)
WATER USAGE (@ 5.49 p
kgals )
SEWER USAGE (in gallons @
80% of water usage)
GPA/NAVY SURCHARGE
@ 8.03%
SUPPLEMENTAL ANNUITY
SURCHARGE @ 3.49% TOTAL AMT BILLED
6/11/2009 05/07/09 THRU 06/08/09 33 9.26 N/A 24500 $ 12.00 $ 86.00 $ 7.65
$ 3.32
$ 118.23
7/13/2009 06/08/09 THRU 07/09/09 32 9.26 N/A 18500 $ 12.00 $ 59.54 $ 5.52
$ 2.40
$ 88.72
TOTAL (2 MONTH PERIOD): 65 $ 18.52 43000 $ 24.00 $ 145.53 $ 13.17 $ 5.73 $ 206.95
AVERAGE DAILY CONSUMPTION: 43,000 gals divided by 65 days = 662 average daily consumption. Rounded to nearest 10 gals = 660 AVERAGE DAILY CONSUMPTION
Date of meter change out is
04/23/09
31
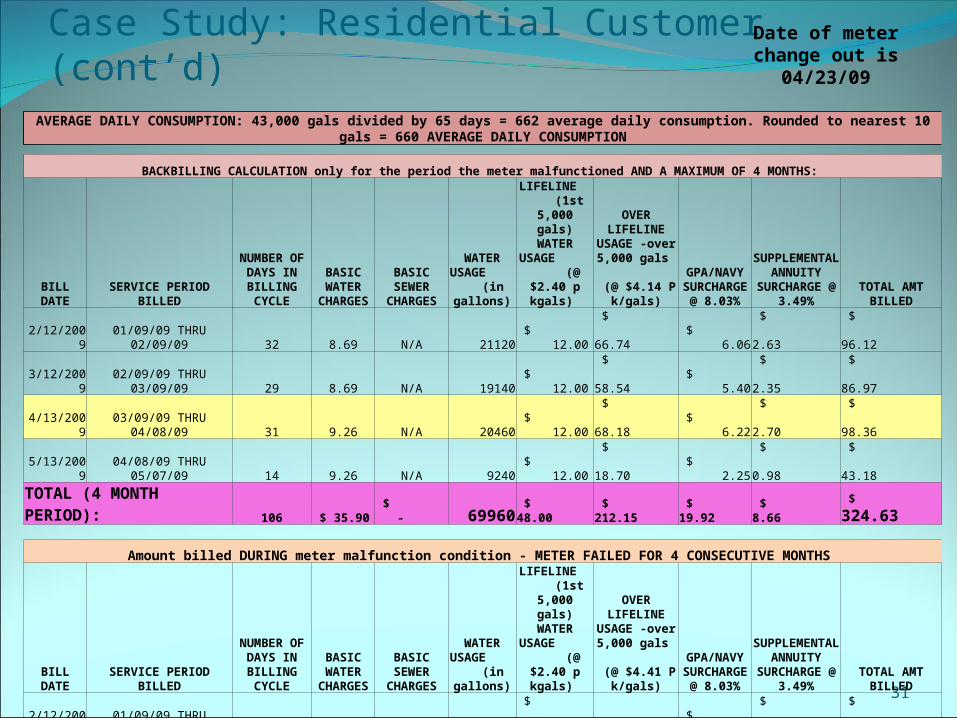
Case Study: Residential Customer (cont’d)AVERAGE DAILY CONSUMPTION: 43,000 gals divided by 65 days = 662 average daily consumption. Rounded to nearest 10 gals = 660 AVERAGE DAILY CONSUMPTION
BACKBILLING CALCULATION only for the period the meter malfunctioned AND A MAXIMUM OF 4 MONTHS:
BILL DATE SERVICE PERIOD BILLED
NUMBER OF DAYS IN
BILLING CYCLE
BASIC WATER
CHARGESBASIC SEWER
CHARGES
WATER USAGE (in gallons)
LIFELINE (1st 5,000 gals) WATER USAGE (@ $2.40
p kgals)
OVER LIFELINE USAGE -over
5,000 gals (@ $4.14 P
k/gals)
GPA/NAVY SURCHARGE
@ 8.03%
SUPPLEMENTAL ANNUITY
SURCHARGE @ 3.49% TOTAL AMT BILLED
2/12/2009 01/09/09 THRU 02/09/09 32 8.69 N/A 21120 $ 12.00 $ 66.74 $ 6.06 $ 2.63 $ 96.12
3/12/2009 02/09/09 THRU 03/09/09 29 8.69 N/A 19140 $ 12.00 $ 58.54 $ 5.40 $ 2.35 $ 86.97
4/13/2009 03/09/09 THRU 04/08/09 31 9.26 N/A 20460 $ 12.00 $ 68.18 $ 6.22 $ 2.70 $ 98.36
5/13/2009 04/08/09 THRU 05/07/09 14 9.26 N/A 9240 $ 12.00 $ 18.70 $ 2.25 $ 0.98 $ 43.18
TOTAL (4 MONTH PERIOD): 106 $ 35.90 $ - 69960 $ 48.00 $ 212.15 $ 19.92 $ 8.66 $ 324.63
Amount billed DURING meter malfunction condition - METER FAILED FOR 4 CONSECUTIVE MONTHS
BILL DATE SERVICE PERIOD BILLED
NUMBER OF DAYS IN
BILLING CYCLE
BASIC WATER
CHARGESBASIC SEWER
CHARGES
WATER USAGE (in gallons)
LIFELINE (1st 5,000 gals) WATER USAGE (@ $2.40
p kgals)
OVER LIFELINE USAGE -over
5,000 gals (@ $4.41 P
k/gals)
GPA/NAVY SURCHARGE
@ 8.03%
SUPPLEMENTAL ANNUITY
SURCHARGE @ 3.49% TOTAL AMT BILLED
2/12/2009 01/09/09 THRU 02/09/09 32 8.69 N/A 1000 $ 2.40 0 $ 0.70 $ 0.30 $ 12.09
3/12/2009 02/09/09 THRU 03/09/09 29 8.69 N/A 0 $ - 0 $ 0.70 $ 0.30 $ 9.69
4/13/2009 03/09/09 THRU 04/08/09 31 9.26 N/A 0 $ - 0 $ 0.74 $ 0.32 $ 10.33
5/13/2009 04/08/09 THRU 05/07/09 14 9.26 N/A 200 $ 0.48 0 $ 0.74 $ 0.32 $ 10.81 TOTAL (4 MONTH PERIOD): 106 $ 35.90 1200 $ 2.88 $ - $ 2.88 $ 1.25 $ 42.92
AMOUNT OF DEBIT ADJUSTMENT $ - 68,760 $ 45.12 $ 212.15 $ 17.04 $ 7.40 $ 281.71
Date of meter change out is
04/23/09
32
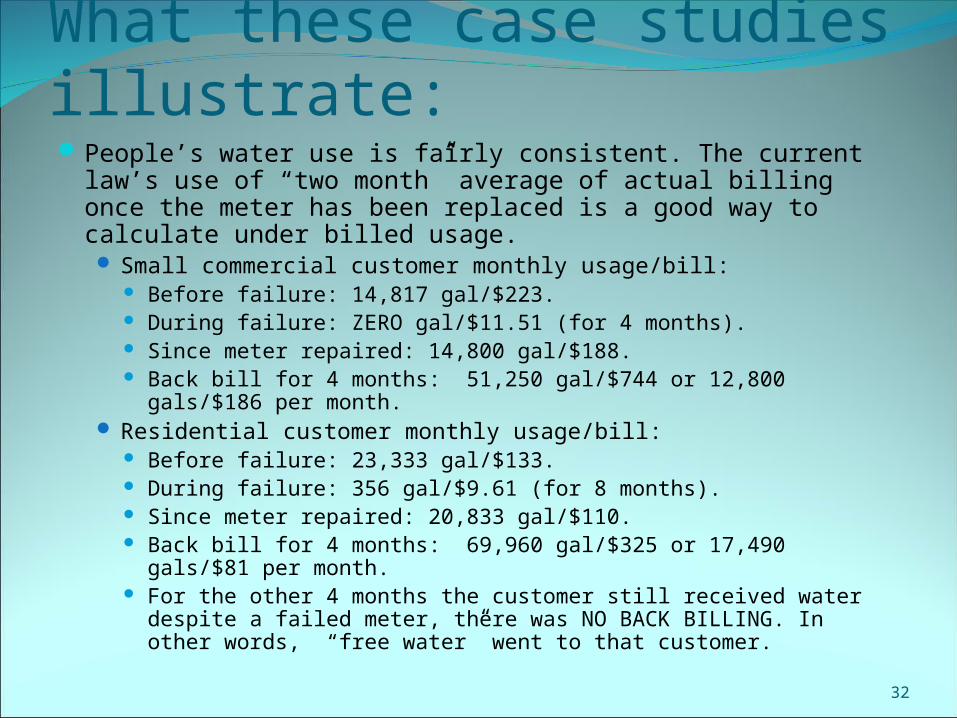
What these case studies illustrate:People’s water use is fairly consistent. The current law’s use
of “two month” average of actual billing once the meter has been replaced is a good way to calculate under billed usage. Small commercial customer monthly usage/bill:
Before failure: 14,817 gal/$223. During failure: ZERO gal/$11.51 (for 4 months). Since meter repaired: 14,800 gal/$188. Back bill for 4 months: 51,250 gal/$744 or 12,800 gals/$186 per
month. Residential customer monthly usage/bill:
Before failure: 23,333 gal/$133. During failure: 356 gal/$9.61 (for 8 months). Since meter repaired: 20,833 gal/$110. Back bill for 4 months: 69,960 gal/$325 or 17,490 gals/$81 per
month. For the other 4 months the customer still received water despite
a failed meter, there was NO BACK BILLING. In other words, “free water” went to that customer.
33
Why did it take so long to get the corrected back-billing out?
The sheer number of failing meters was significant.
The process to implement back billing as per the law is very involved and is not simple.
AS400 billing system has limitations: We cannot bill a route AND
simultaneously make back billing adjustments. Every night we must stop back billing in order for the AS 400 to be used to generate the current billing for customers.
34
What have we done to speed up back billing?:
We have added 3 more people from the accounting department to assist customer service staff on weekends and after evening hours when much of the work is being done.
We are planning to upgrade our technology from the old AS 400 to allow for multiple user access at all times.
We’ve added 5 personnel to help the meter task force speed up meter investigations.
35
Despite challenges, the new meter program provides benefits
Provide our customers with historical consumption, including an hourly account of the consumption recorded since the meter was installed.
Alerts GWA of possible leaks so we can notify our customers. GWA sends out almost 10,000 notices a year
to customers to help them identify possible leaks so they can repair them and save water.

36
Meter program benefits, cont.
GWA can identify meters with backflow issues that can potentially compromise the water quality in our system.
Billing data can now be easily transferred from a laptop used in the field to a spreadsheet or power point for analysis and more timely billing.
37
Other things we think you should know:
GWA is only back billing customers whose meters failed in late 2008 going forward. GWA is not going back to prior years.
Not one of our 1900 back billed customers has been disconnected. All customers were sent written
notice of back billing and provided with a multi-month payment plan.
38
More things we think you should know:GWA revenues are recovering due to improved meter
billing. FY 2010 revenues are $43million (thru May) up 27% compared to FY 09.
Guam’s back billing law is far more strict than many other places:California: 3 years Wisconsin, Hamilton (Canada): 2 years
Other allowed back billing:Income taxes: 3 yearsGMH
Suing the meter vendor for a part that GWA asked them to provide after the original bid specs were met will likely fail.
Guam law protects all public servants from being sued personally for decisions they make.
Guam law already provides for an appeals process to the PUC.
39
What you need to know cont. :The amount of water use that is being back
billed amounts to more than half a month’s water for all the people of Guam.
What is not collected from back billing from the 6,500 consumers who actually received water services only means that the other 33,500 customers pay for water they did not use.
Only a handful of customers report under billing to GWA. Yet, thousands of consumers knowingly received all the water they needed but chose not to report that their bills were unusually low.
40
How can we improve further?GWA will implement an “early notice”
program advising customers at the time their meter is suspected of under-recording instead of waiting until the back bill is sent out later.
Provide for a reasonable time limit for GWA/GPA to get the revised back bill out to customers.
Offer a “good citizen” discount on back billing to those customers who report under billing to GWA before they are back billed.
41
Summary of PresentationGWA is implementing the back billing laws properly.
The current law does a good job in trying to balance the need to bill accurately for water while recognizing that meters (and humans) can occasionally have failures. These unintended failures should not completely free some consumers from paying for water they actually received, forcing other ratepayers to pay for water they did not receive.
Implementing the back billing law is not a simple process and takes some time to do it right.
GWA employees are acting in good faith.The meter improvement program is showing progress
in accounting for the water people use.

42
“Investing In Better Water, Better Lives”
www.guamwaterworks.org