
GstShark profiling: a real-life example · Tegra X1 Embedded system created by NVIDIA 6x1080p30...
68
GstShark profiling: a real-life example Michael Grüner - [email protected] David Soto - [email protected]
Transcript of GstShark profiling: a real-life example · Tegra X1 Embedded system created by NVIDIA 6x1080p30...

Introduction
● Michael Grüner○ Technical Lead at RidgeRun○ Digital signal processing and GStreamer to solve challenges involving
Audio, Video and embedded systems
● David Soto○ Engineering Manager at RidgeRun○ Lead team to find GStreamer solutions○ Convert customers ideas to create real products
2

RidgeRun - where do we work?
● +12 years developing products based on Embedded Linux and GStreamer - 100% require multimedia
● Embedded systems and limited resources - optimal solutions
● Looking for powerful embedded platforms with coprocessors (GPUs, DSPs and FPGAs) + GStreamer
● Provides Infrastructure
3

Location
US Company - R&D Lab in Costa Rica
4
Overview
● The need behind the tool● Problem to solve● Solution: GstShark● GstShark - A Real Life Example● Future work● Code● Questions
5

Motivation (1)
● No standard way to tune GStreamer pipeline - iterative but without tools to obtain performance data
○ Element to print CPU load - where to place it?○ Patch elements to add prints - hackish○ Not maintainable
● GStreamer tracing subsystem now provides the hooks
6

Motivation (2)
7
Deterministic data measurement - win-win for both to find bottlenecks

Problem
Is there an easy way to get profiling measurements from the pipeline to identify bottlenecks and to get a more stable and optimized design?
8

Solution: GstShark
● Take pipeline profiling data and used it on a single, standard tool called GstShark
○ Make better decisions
Demonstrated today on NVIDIA Tegra X1
9

Tegra X1
● Embedded system created by NVIDIA● 6x1080p30 MIPI CSI Cameras or single up to 4K@60fps● Hardware encoders/decoders for H264, H265 and VP8● Maxwell GPU with 256 cuda cores - RidgeRun using with
GStreamer
10

GstShark - What is it?
● Profiling and benchmarking tool for GStreamer pipelines.● Front-end for GStreamer's tracing subsystem.
11

GstShark - GStreamer's tracing subsystem
● API added on release 1.7.1 around 2015 (thanks Stefan) ● Install callbacks on predefined "hooks" - strategic
pieces of code, i.e buffer push● low-level measurements translated to “tracers”
○ Processing time○ Latency○ Bitrate, etc
● Run time linked● Activated by environment variables
12
GstShark
● Open Source project developed by RidgeRun● Adds a set of tracers for high level measurements● Tracers chosen by customers (room for more!)
13
GstShark - New GStreamer Tracers
● Bitrate● Framerate● CPU usage● Queue level● Schedule time● Inter-latency● Processing time● Graphic
14

GstShark - Bitrate Tracer
● Bits per second that pass through every pad in the pipeline
● Validate encoders configuration (compression)
15
Great way to verify adaptive bitrate streaming is working as expected
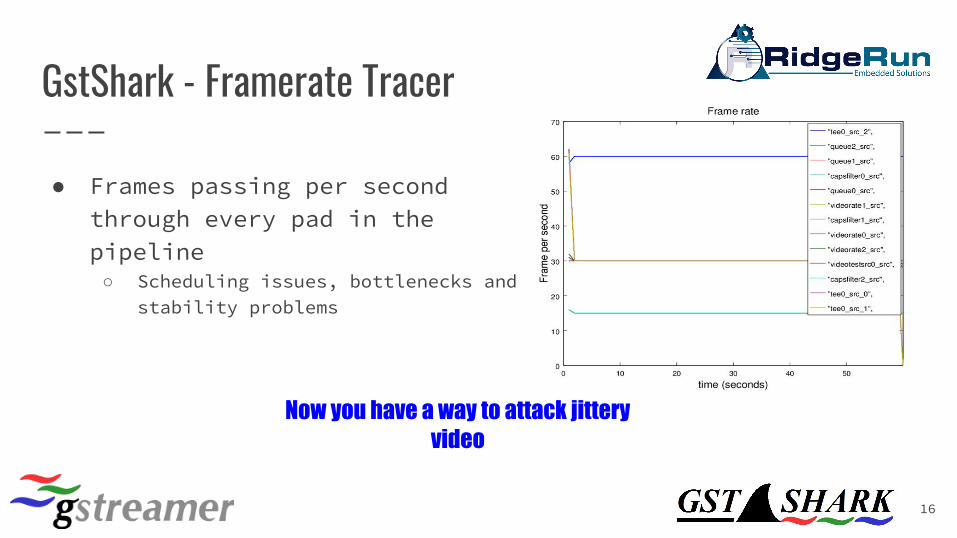
GstShark - Framerate Tracer
● Frames passing per second through every pad in the pipeline
○ Scheduling issues, bottlenecks and stability problems
16
Now you have a way to attack jittery video
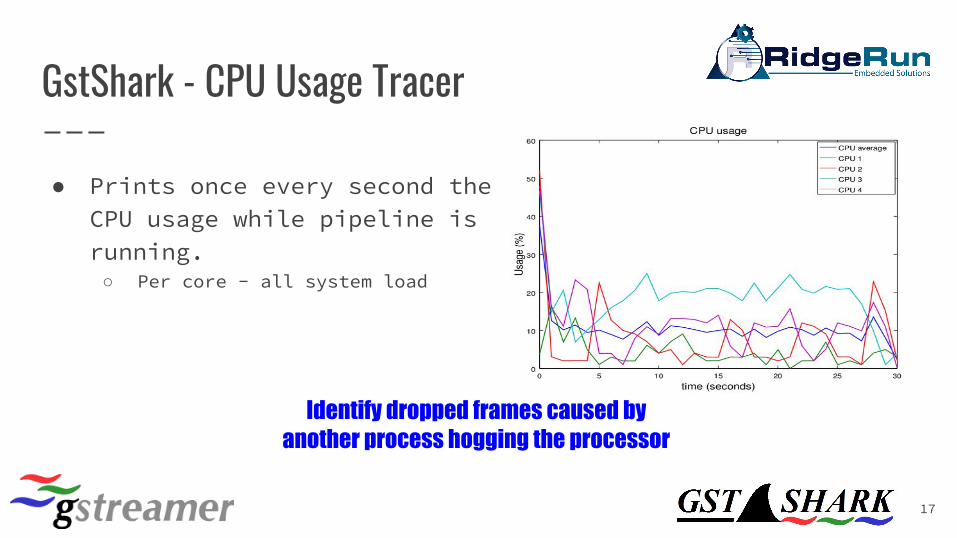
GstShark - CPU Usage Tracer
● Prints once every second the CPU usage while pipeline is running.
○ Per core - all system load
17
Identify dropped frames caused by another process hogging the processor

GstShark - Queue Level Tracer
● Amount of data currently held by pipeline queues
○ number of buffers, bytes or even time○ Should be constant - not increasing
(bottleneck)
18
Latency tuning is finding unnecessary buffer queueing
GstShark - Schedule Time Tracer
● Time between two consecutive buffers in a pad
○ 30fps live pipeline, should be 33ms○ It is different to processing time○ Think on queues: 33ms schedule time
but higher processing time.
19
Identify buffer drops and pipeline hogs
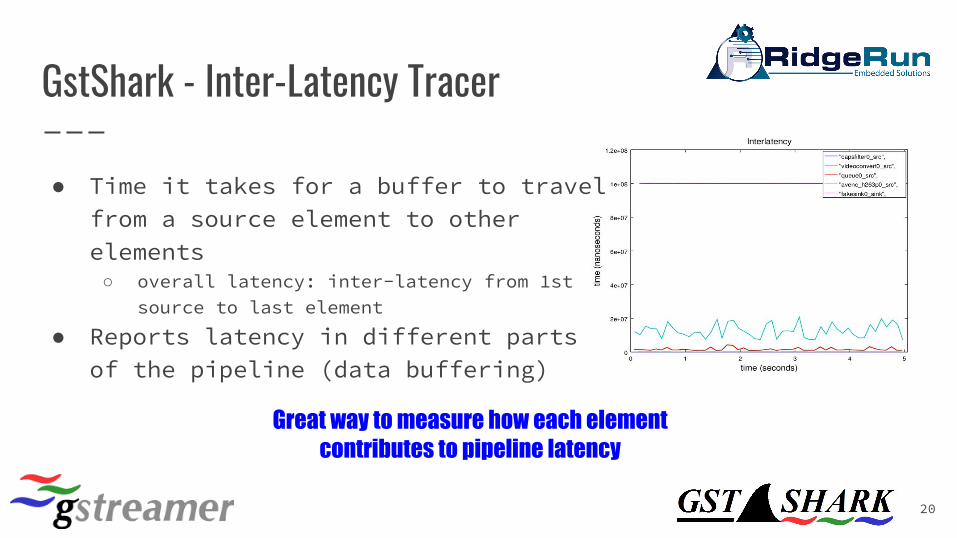
GstShark - Inter-Latency Tracer
● Time it takes for a buffer to travel from a source element to other elements
○ overall latency: inter-latency from 1st source to last element
● Reports latency in different parts of the pipeline (data buffering)
20
Great way to measure how each element contributes to pipeline latency

GstShark - Processing Time Tracer
● Time an element takes to process a single buffer
○ Tricky with tee or demux○ Valid only for single input/output
elements
21
Identify elements needing tuning or hardware acceleration

GstShark - Graphic Tracer
● Pop-up a window with the pipeline graph○ Shortcut for "dump dot file" utility○ Opens a window instead of file creation
22
GstShark - Tracer outputs
● GStreamer's debug - most intuitive way○ Activate desired tracers○ Enable GST_TRACER debug category - separated by semicolon
● CTF (Common Trace Format) file○ Directory with date and time with the traces of the latest session○ Can be read by Eclipse or babeltrace for more analysis
● GNU/Octave scripts to plot the data (provided)
23

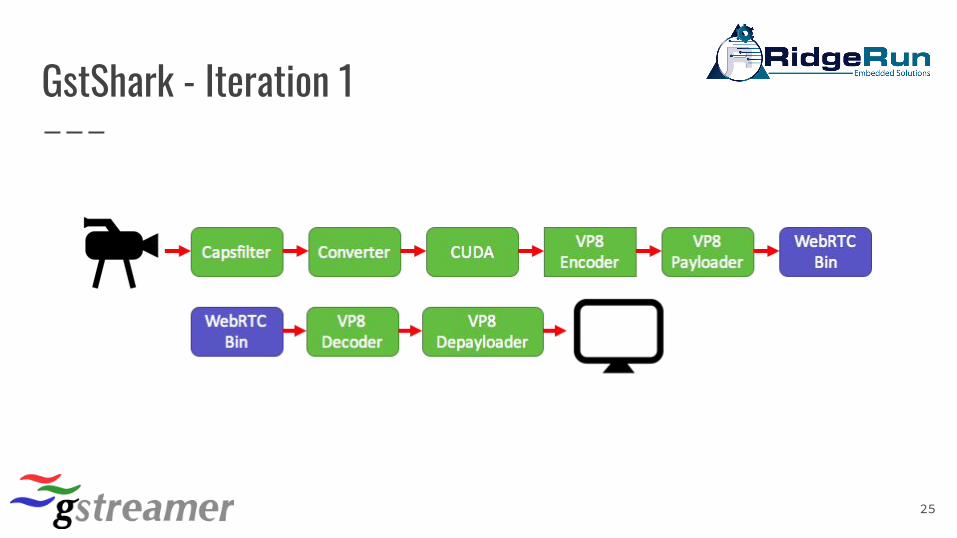
GstShark - A Real Life example
● WebRTC Streaming Pipeline○ VP8 Encoder○ Full HD (1080P)○ 30 FPS○ < 200ms latency
24
GstShark - Iteration 1
25
GstShark - Iteration 1
26
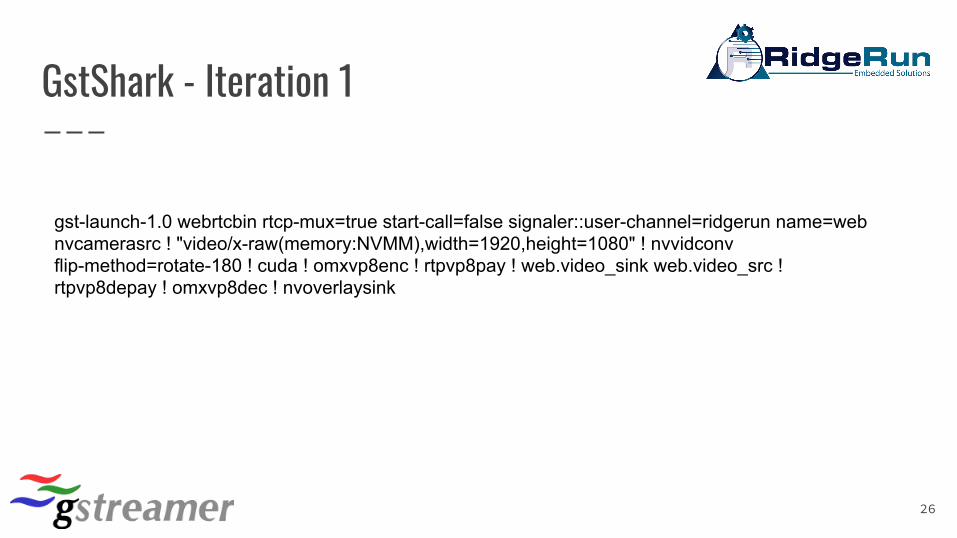
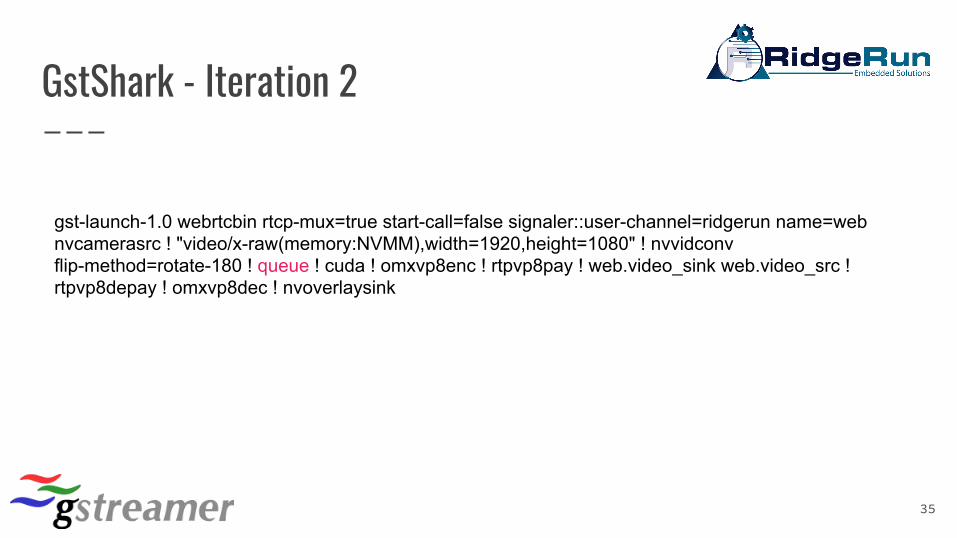
gst-launch-1.0 webrtcbin rtcp-mux=true start-call=false signaler::user-channel=ridgerun name=web nvcamerasrc ! "video/x-raw(memory:NVMM),width=1920,height=1080" ! nvvidconv flip-method=rotate-180 ! cuda ! omxvp8enc ! rtpvp8pay ! web.video_sink web.video_src ! rtpvp8depay ! omxvp8dec ! nvoverlaysink

GstShark - Iteration 1
7.224
- 5.833
---------
1.391
27

GstShark - Iteration 1
● VP8 Encoder ✓● Full HD ✓● 30 FPS ✕● 200 ms latency ✕
28

GstShark - Iteration 1
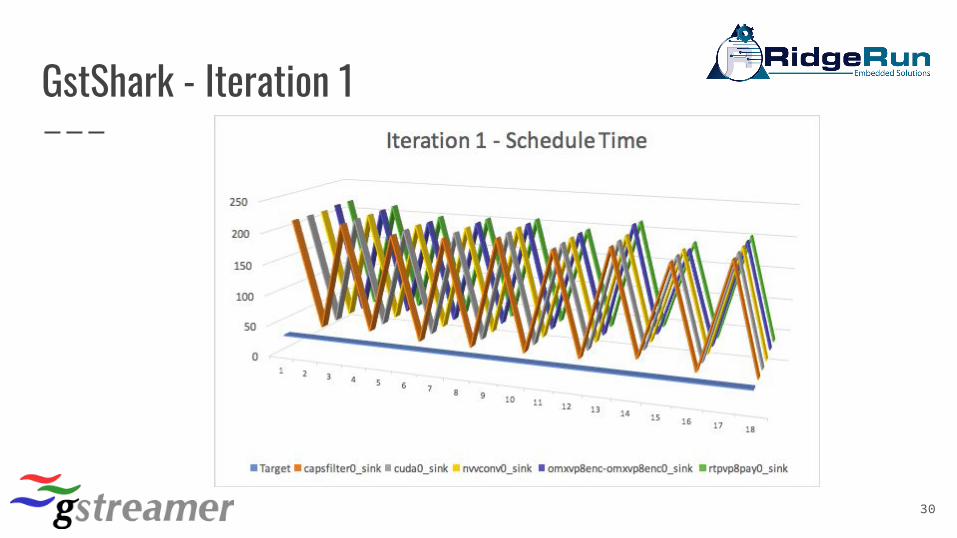
29
GstShark - Iteration 1
30

GstShark - Iteration 1
31

GstShark - Iteration 1
32
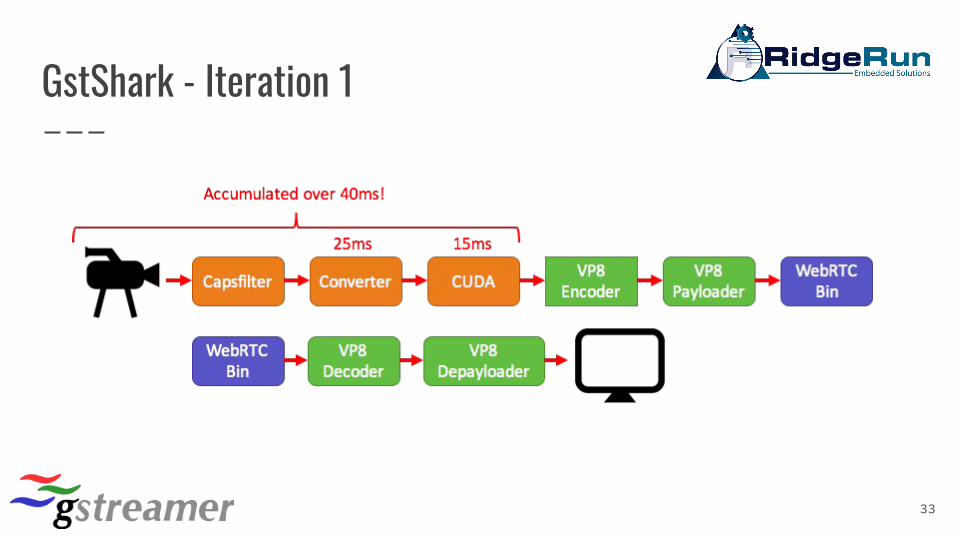
GstShark - Iteration 1
33

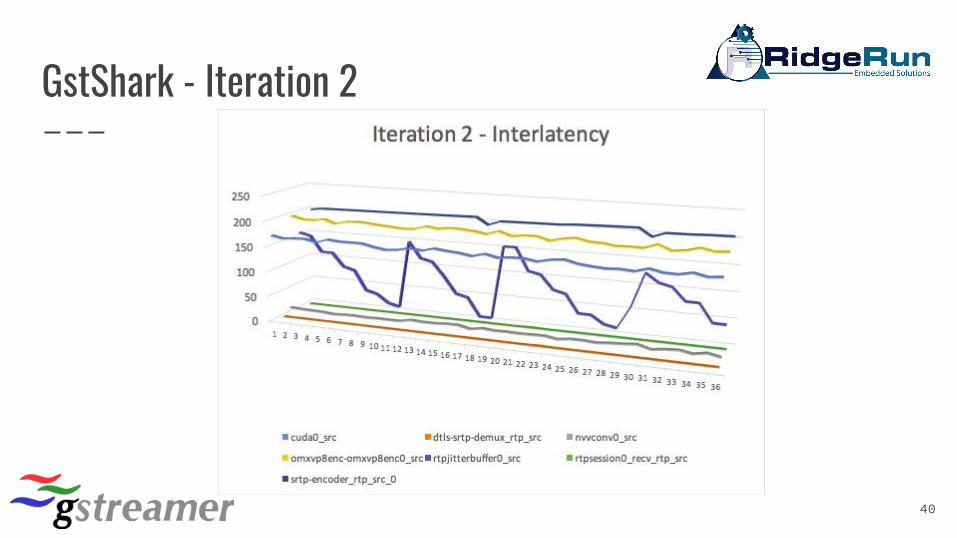
GstShark - Iteration 2
34
GstShark - Iteration 2
35
gst-launch-1.0 webrtcbin rtcp-mux=true start-call=false signaler::user-channel=ridgerun name=web nvcamerasrc ! "video/x-raw(memory:NVMM),width=1920,height=1080" ! nvvidconv flip-method=rotate-180 ! queue ! cuda ! omxvp8enc ! rtpvp8pay ! web.video_sink web.video_src ! rtpvp8depay ! omxvp8dec ! nvoverlaysink
GstShark - Iteration 2
36
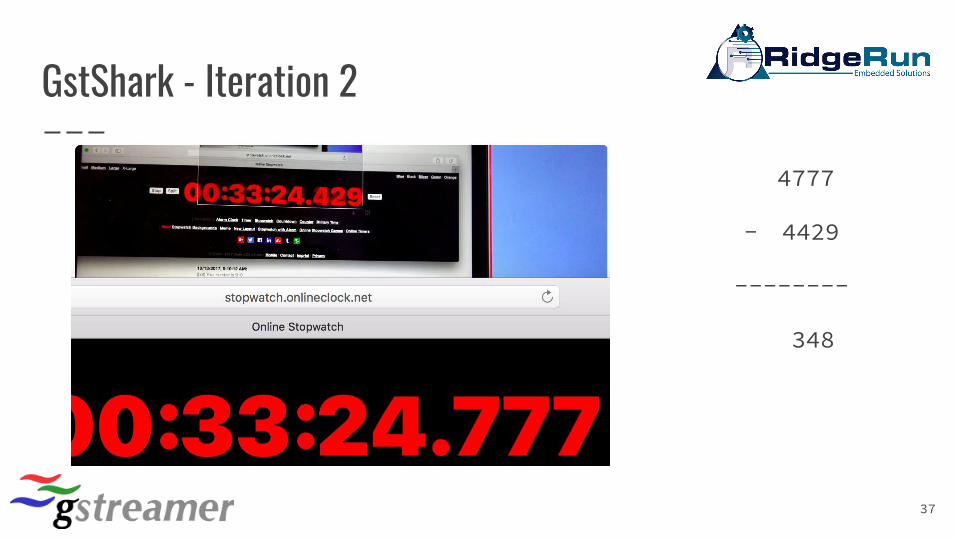
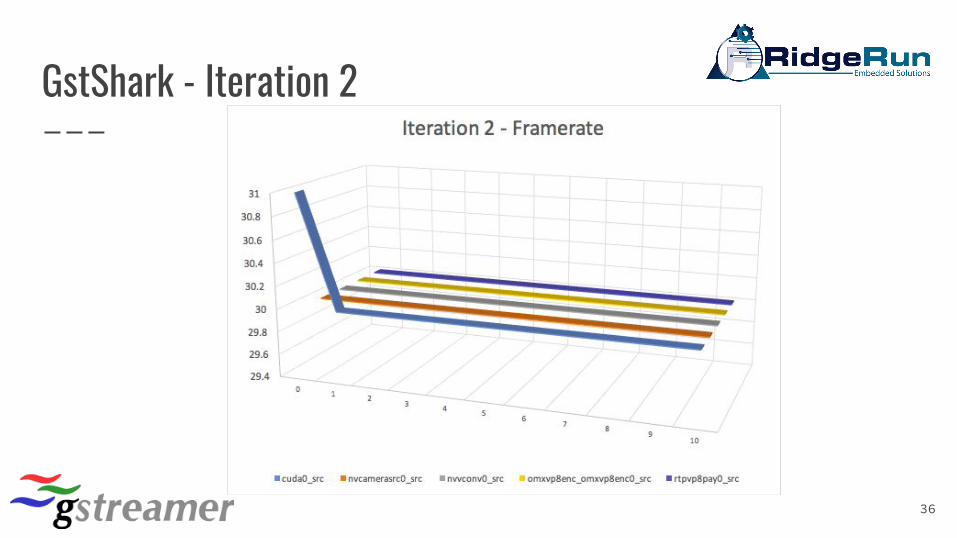
GstShark - Iteration 2
4777
- 4429
--------
348
37
GstShark - Iteration 2
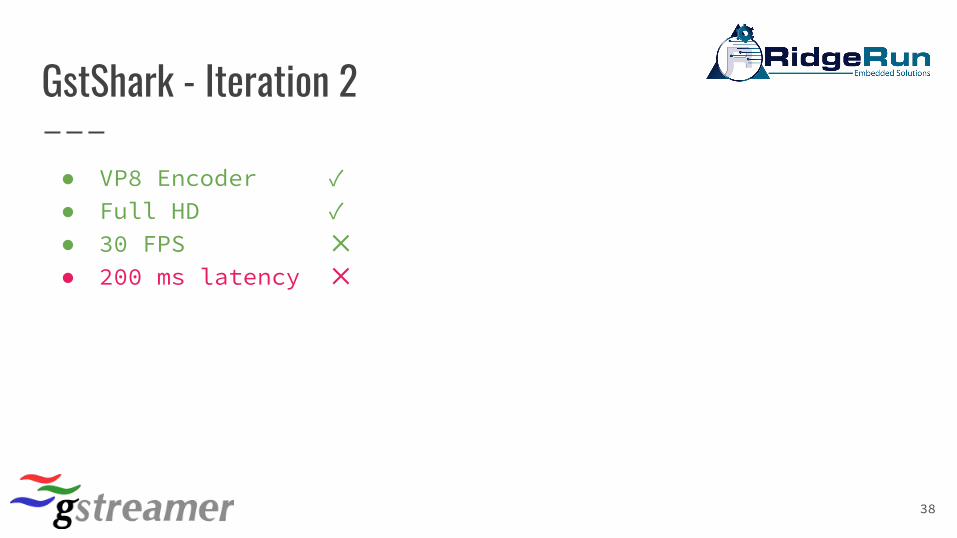
● VP8 Encoder ✓● Full HD ✓● 30 FPS ✕● 200 ms latency ✕
38

GstShark - Iteration 2
39
GstShark - Iteration 2
40

GstShark - Iteration 2
41
The gap accounts forthe element latency
Overall pipe latency

GstShark - Iteration 2
42
...

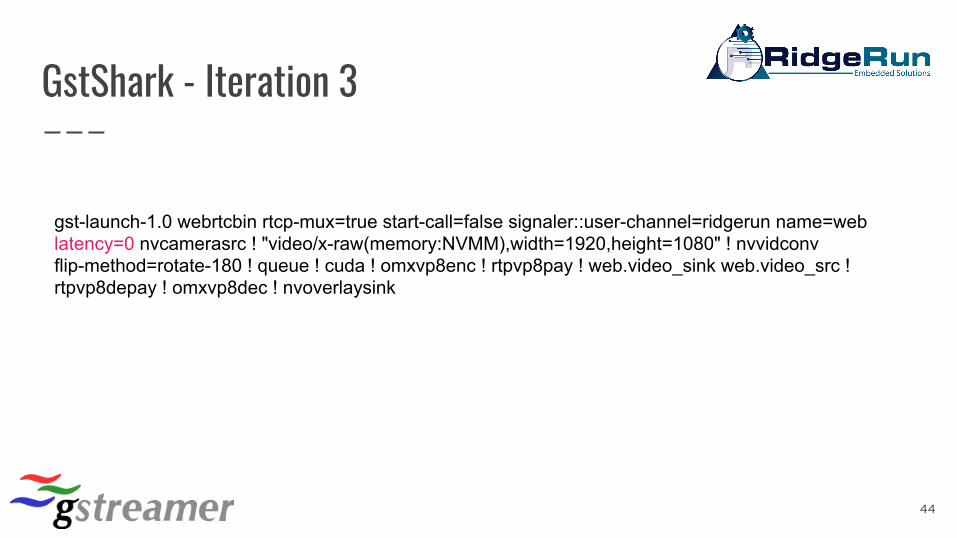
GstShark - Iteration 3
43
GstShark - Iteration 3
44
gst-launch-1.0 webrtcbin rtcp-mux=true start-call=false signaler::user-channel=ridgerun name=web latency=0 nvcamerasrc ! "video/x-raw(memory:NVMM),width=1920,height=1080" ! nvvidconv flip-method=rotate-180 ! queue ! cuda ! omxvp8enc ! rtpvp8pay ! web.video_sink web.video_src ! rtpvp8depay ! omxvp8dec ! nvoverlaysink

GstShark - Iteration 3
45
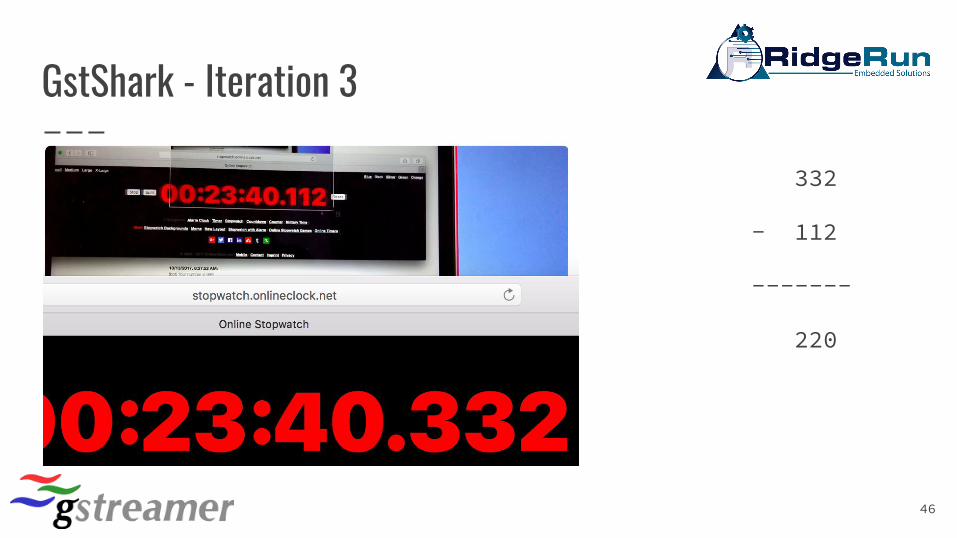
GstShark - Iteration 3
332
- 112
-------
220
46

GstShark - Iteration 3
● VP8 Encoder ✓● Full HD ✓● 30 FPS ✓● 200 ms latency ✕
47
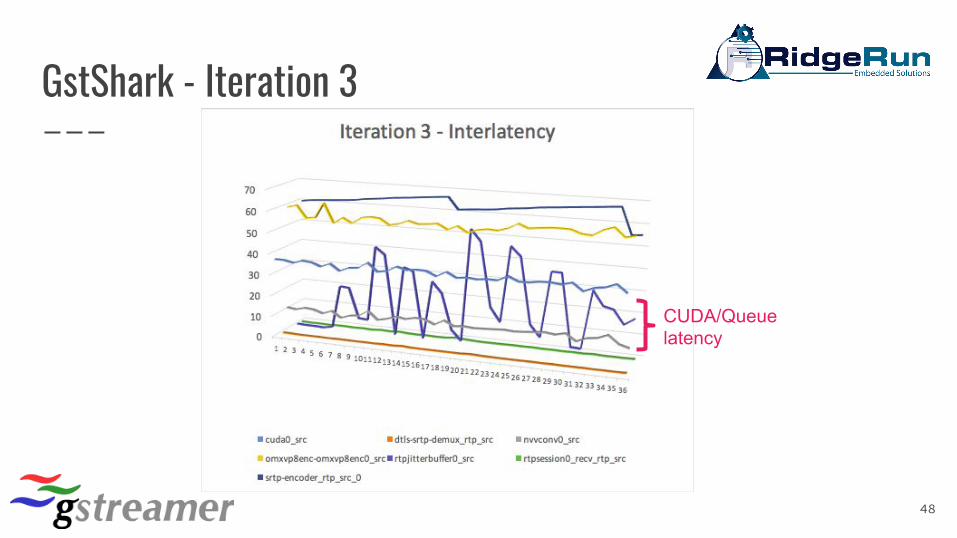
GstShark - Iteration 3
48
CUDA/Queuelatency

GstShark - Iteration 3
49

GstShark - Iteration 3
50
Suspicious spike

GstShark - Iteration 3
51

GstShark - Iteration 3
52
Suspicious spike?

GstShark - Iteration 3
53

GstShark - Iteration 3
54
Buffers are queued during startup

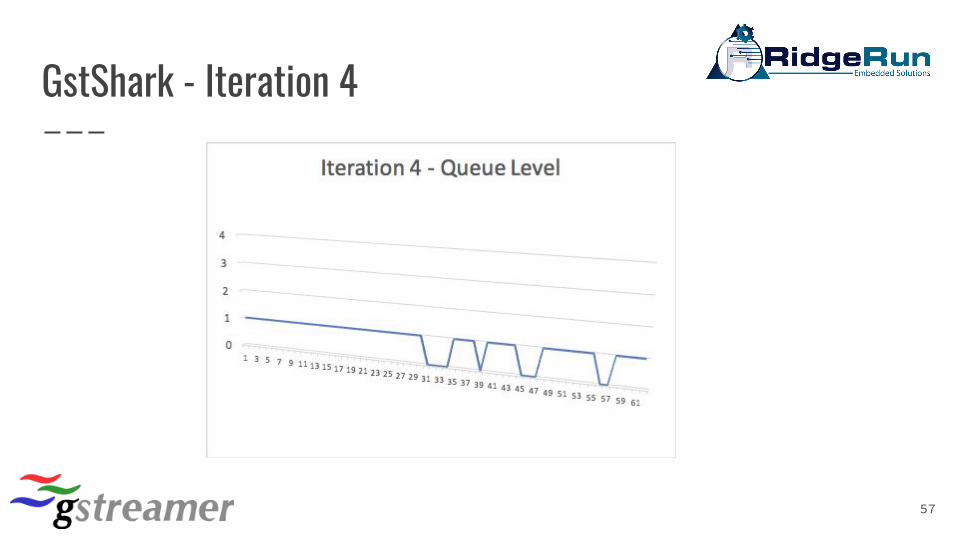
GstShark - Iteration 4
55
GstShark - Iteration 4
56
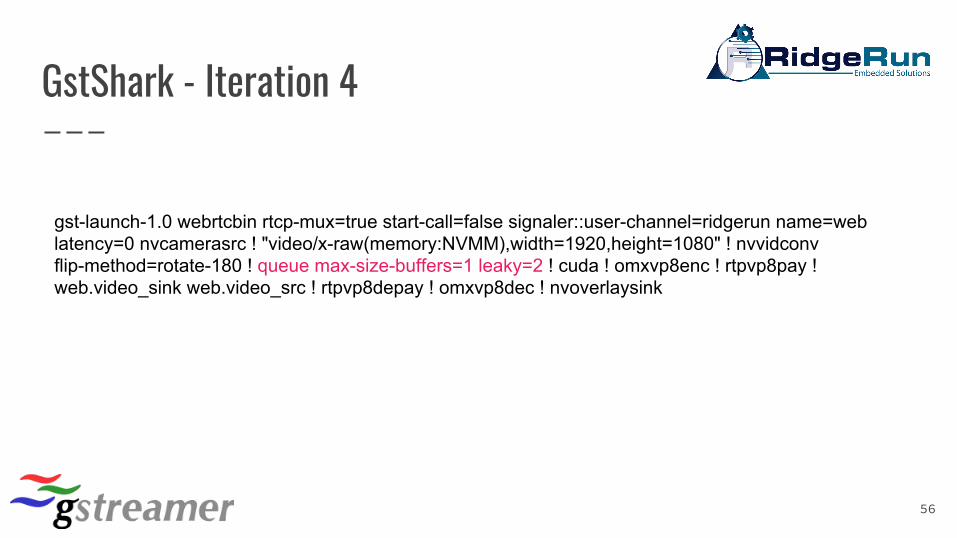
gst-launch-1.0 webrtcbin rtcp-mux=true start-call=false signaler::user-channel=ridgerun name=web latency=0 nvcamerasrc ! "video/x-raw(memory:NVMM),width=1920,height=1080" ! nvvidconv flip-method=rotate-180 ! queue max-size-buffers=1 leaky=2 ! cuda ! omxvp8enc ! rtpvp8pay ! web.video_sink web.video_src ! rtpvp8depay ! omxvp8dec ! nvoverlaysink
GstShark - Iteration 4
57
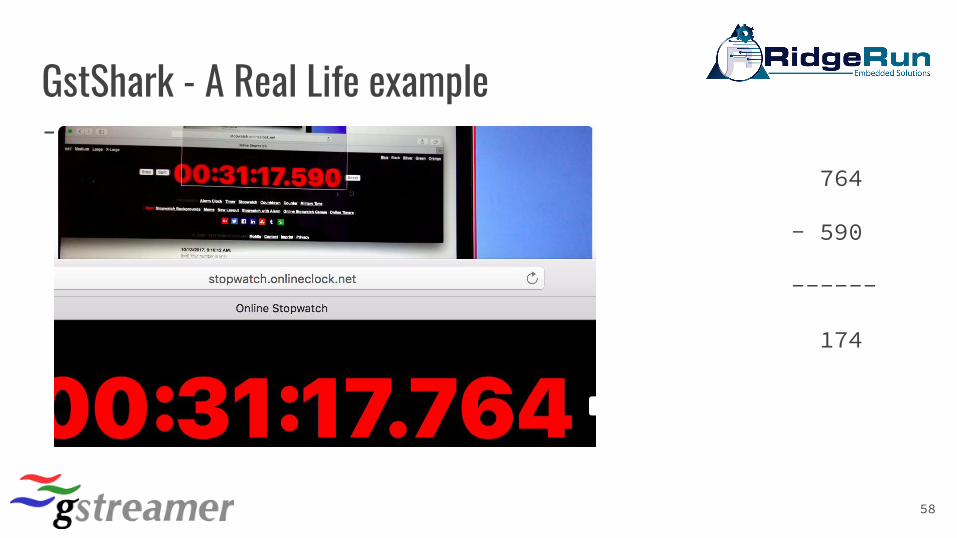
GstShark - A Real Life example
764
- 590
------
174
58
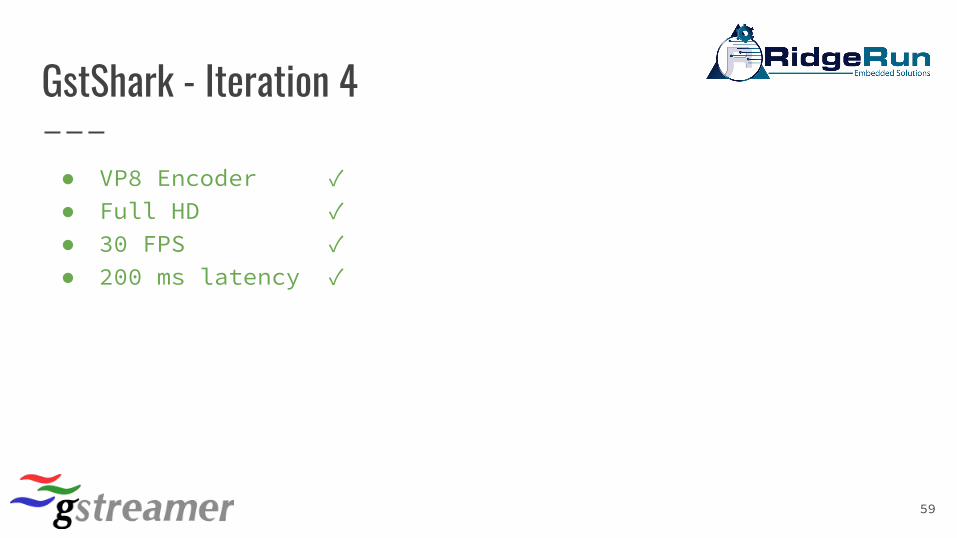
GstShark - Iteration 4
● VP8 Encoder ✓● Full HD ✓● 30 FPS ✓● 200 ms latency ✓
59

GstShark - Iteration 4
60

GstShark - Iteration 4
61
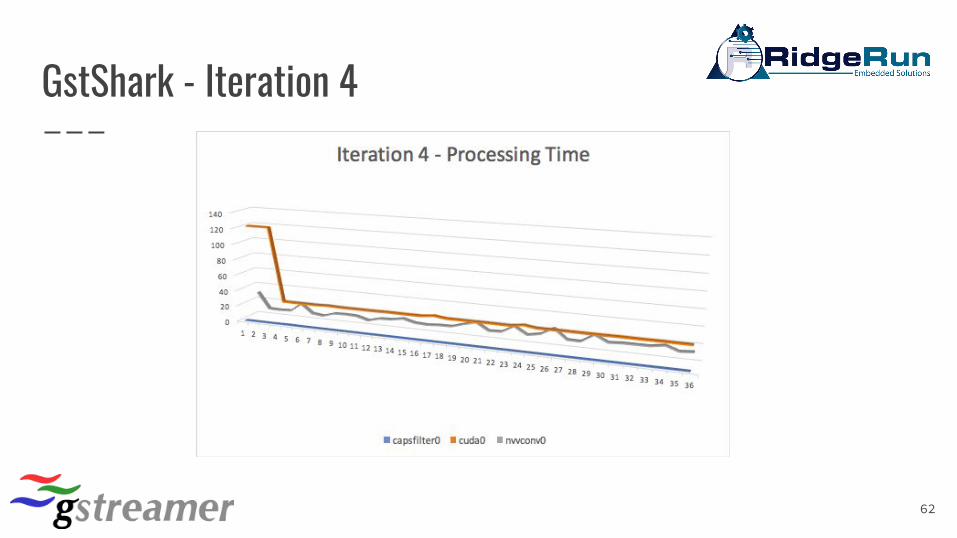
GstShark - Iteration 4
62

GstShark - Iteration 4
63

GstShark - Future development (1)
● HW specific tracers:○ NVIDIA (GPU), Xilinx (FPGA), TI (DSP) and NXP (i.MX6 mem bus
utilization) profiling tools usage from tracers○ Single time reference for debug data and buffers○ Homogeneous interface
● CPU Tracer improvements○ Print usage of pipeline only○ Usage per thread?
64

GstShark - Future development (2)
● Pass parameters to the tracers currently enabled○ Supported on GStreamer but not GstShark○ Do not print info for every pad but ability to select - reduce
overhead
● Graphical front-end○ Filter data ○ Overlap plot to find tendencies ○ Mark outliers ○ Real time plot
65
Code location and documentation
● GstShark is open source:
https://github.com/RidgeRun/gst-shark
https://developer.ridgerun.com/wiki/index.php?title=GstShark
66

68
Thank you!