GSIGeSI SMARTer 2020 th R l f ICT i D i i2020: the Role of ...
10
G SI SMART 2020 th Rl f ICT i Dii GeSI SMART er 2020: the Role of ICT in Driving a Sustainable Future GreenTouch Workshop Brussels, June 26, 2013
Transcript of GSIGeSI SMARTer 2020 th R l f ICT i D i i2020: the Role of ...

G SI SMART 2020 th R l f ICT i D i iGeSI SMARTer 2020: the Role of ICT in Driving a Sustainable Future
GreenTouch WorkshopBrussels, June 26, 2013

GeSI SMARTERer 2020 report re-evaluates ICT’s potential to enable a low-carbon economy
SMARTer 2020 follows up the SMART 2020 study, which first evaluated ICT’spotential to enable a low-carbon economy in 2020
T dToday
In 2008
SMART2020 SMARTer 2020
The potential for information technology to reduce global carbon emissions has been under-estimated until now
9 1 GtCO e 16 5%9.1 GtCO2e 16.5%
Total abatement potential of ICT-enabled solutions in 2020
% of global GHG emissionsin 2020

9.1 gigatons of GHG emissions amounts to USD1.9 trillion in gross energy and fuel savings
1Savings of 21.6 billion barrels of oil1
x 1,000,000
Equivalent to GDP of the Russian economy2q y
1. Number of barrels of oil with equivalent emissions assuming Barrel of oil emits 0.43 metric tons of CO2 2. At today's crude oil price, value of the oil that would be saved ($87.99 per barrel of crude oil as of Nov 6, 2012)
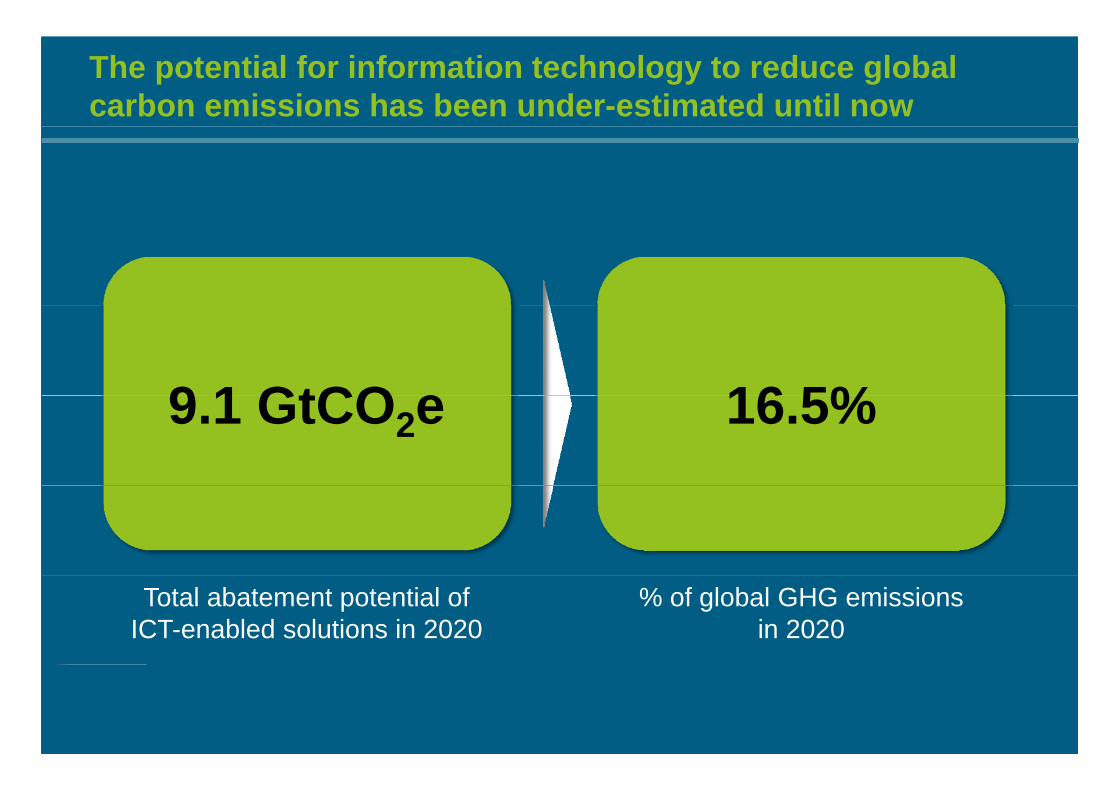
ICT emissions growth expected to slow down from 6% to ~4%ICT emissions 2.3% of global emissions by 2020
Global ICT emissions (GtCO e)Global ICT emissions (GtCO2e)
2.0
1.51.27
Data centers+6.1%
+3.8%CAGR
2002-2011CAGR
2011-2020
8.6% 7.1%1.0
0 5
0.91
0.53
Voice and Data Networks
4.7% 4.6%
0.5
0.0
End-user devices 6.1% 2.3%
202020112002
% global GHGemissions 1.3% 1.9% 2.3%
1. Data for 2010 2. Previous study used an incorrect number for the wireless network emissions (50 vs. 24kWh/yr) and therefore ended up with higher total emissionsSource: Gartner; Forrester ; U.S. Census Bureau; IEA; Greentouch; CEET; CDP; Ovum; GSMA; CERN; Cisco; CEET; SMART 2020: Enabling the low carbon economy in the information age; academic publications; industry experts; academic experts; manufacturer websites; GeSI Smart2020 Refresh team members; BCG analysis
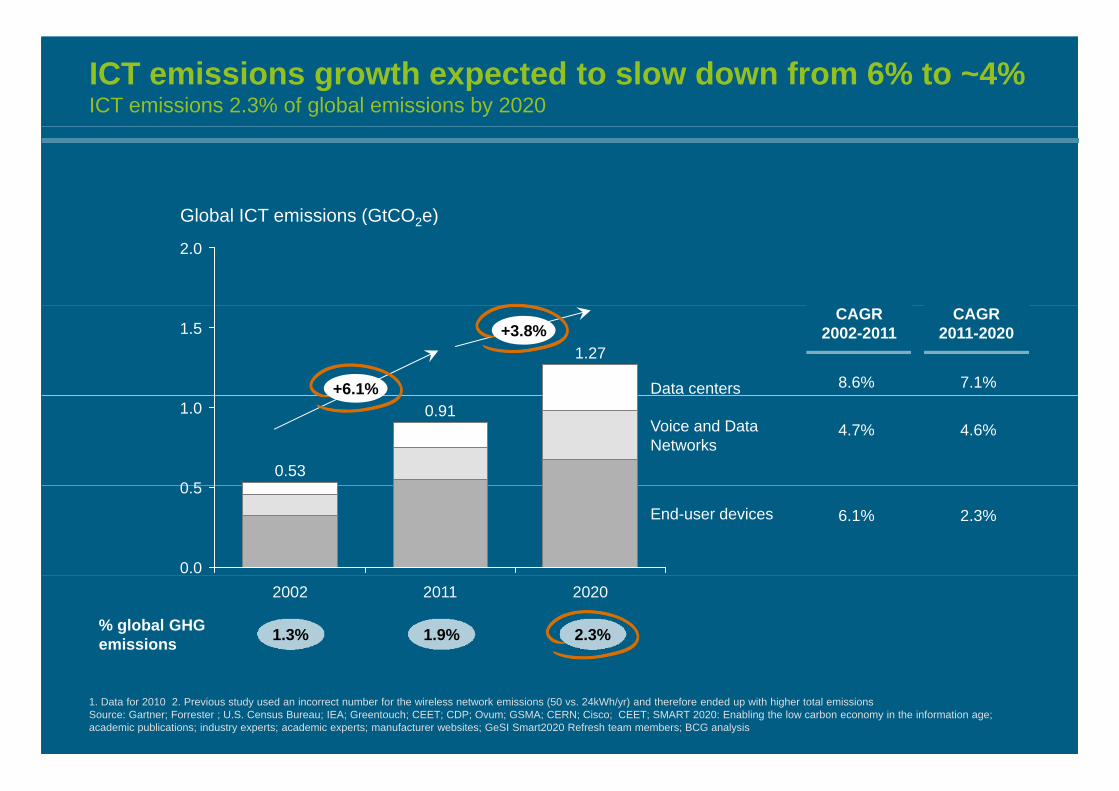
The abatement potential of ICT is seven times the size of the ICT sector’s own carbon footprint
Key changes
Increase in potential due to:
SMART2020 study SMARTer 2020
Increase in potential due to:• Availability of new abatement
solutions• Updates to previous estimations
due to recent trends and
7.8GtCO2e
Abatement potential in 2020
9.1GtCO2e
technological innovations• Increase in total global GHG
emissions5.5x 7.2x
Lower estimate due to:• Emergence of smart devices which
have lower footprint than PCsICT industry's emissions in 1.4 1.3 have lower footprint than PCs
• More precise estimates of wireless networks emissions available
• Global economic slowdown also a factor
emissions in 2020
1.4GtCO2e
2.6% of global emissions1
1.3GtCO2e
2.3% of global emissions1
1. On a base of 55 Gt CO2e GHG emissions (IEA)

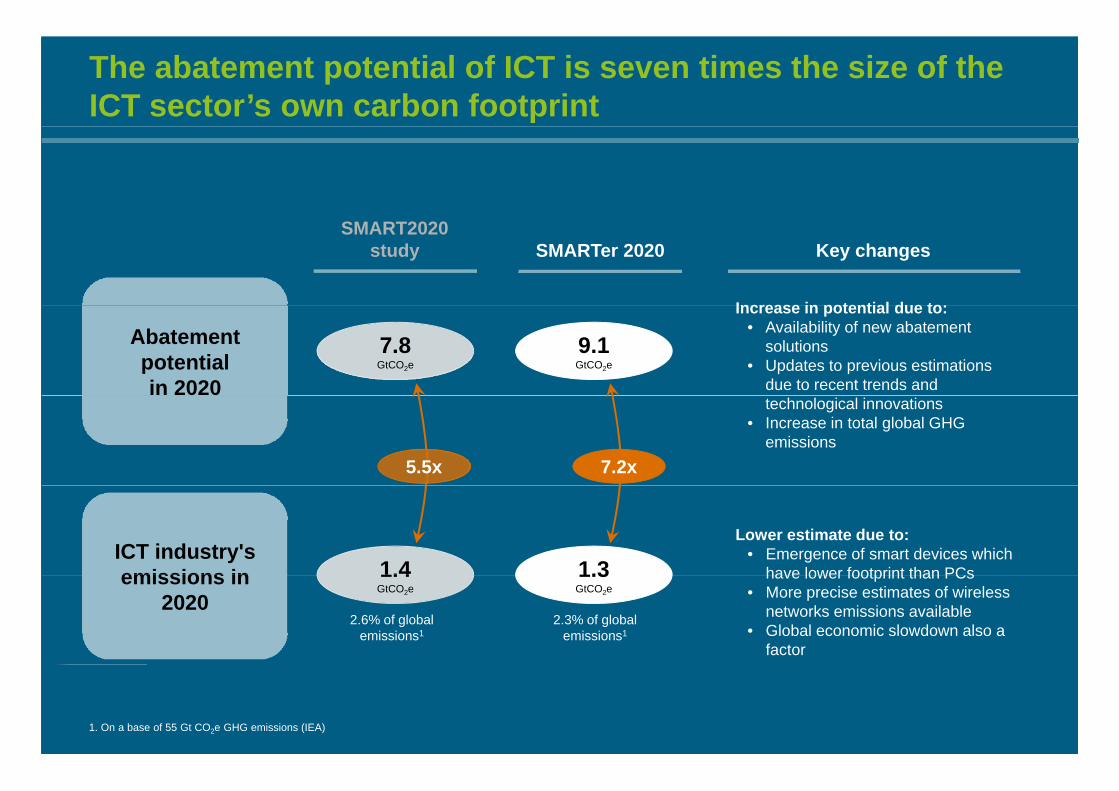
SMARTer 2020 study identifies GHG abatement potential from ICT-enabled solutions across six sectors
1.910
9.1
Abatement potential (GtCO2e)
Agriculture &Land-Use
2.0
6
80.7
Buildings
Land Use
6
1.3
1.64
Manufacturing
Power
2 1.6
Power
Service &Consumer
Building Manufact-uring
TotalPower0
Service & Consumer
Agriculture Transport-ation
Transportation

35 ICT-enabled abatement solutions identified in the studyAbatement potential modeled individually for each sublever
Sources of emissions by economic end-use sectors1
Transportation Service and consumer
Agriculture andland useManufacturing BuildingsPower
01010101001000 Digitalization and
dematerialization
Video-conferencing
Telecommuting
E-commerce
E-paper
Online media
e le
vers
Data collection & communication
I t ti f
Demand management
Time-of-day pricing
I t ti f EV
Eco-driving
Real-time traffic alerts
Apps for intermodal
Asset sharing
Smart water
Disaster management
Livestock management
Soil monitoring /Weather forecasting
I t ti f
Smart water
Cha
nge
System integration
Power-load
Integration of renewables
Virtual power plant
Integration of off-grid storage
Optimization of truck
Integration of EVs, bio-fuelsIntelligent traffic management
Fleet management &telematics
Optimization of Minimization of Smart farming Building design
Integration of renewables
Building management system
Process, activity and functional optimization
balancing
Power grid optimization
proute planning
Optimization oflogistics network
pvariable speed motors
Automation ofindustrial processes
packagingReduction ininventory
g g g
Voltage optimization
Total abatement in GtCO2e 2 0 1 9 1 2 0 7 1 6 1 6Total abatement in GtCO2e 2.0 1.9 1.2 0.7 1.6 1.6
1. Based on 2008 data – EDGAR= calculated abatement potential by sub-lever

Policies at the national level have the most significant potential to drive sub-lever adoption
Individual behaviors, attitudes, and habits
Barriers to be addressed at national level
Economics: High costs of smart gird and
Energy Transportation Manufacturing Service and consumer
Agriculture and land use Buildings
Infrastructure: Strong public transit must be
M&E: Difficult to quantify savings
Behavior: Need to ensure private
d ti
Financing: High upfront costs,
Financing: High upfront CAPEX costsnational level
Deployment: Technology require full deployment to
grenewable technologies
Behavior and habits: Must change strong
transit must be in place to serve as a viable option
Slow adoption: Often little motivation for action because of low
g
Education: Few consumers realize or understand full
adoption without policy
Economics:Need for stronger b i
especially for small farmers
Landlord-tenant: Need to better align incentives and simplifying
CAPEX costs
E t bli h b k t Develop financial aid C t "C t fE f i IP li i
deployment to be effective
change strong habits
because of low energy prices
understand full benefits
business case p y gbuilding code
Global policies
Establish carbon marketto monetize emissions
pprograms for developing
countries
Create "Center of Excellence"
Ensure fair IP licensing of abatement technology
Set and enforce global cascading targetsfor GHG emission reduction
Recognize ICT solutions as part of a global strategy to reduce emissions
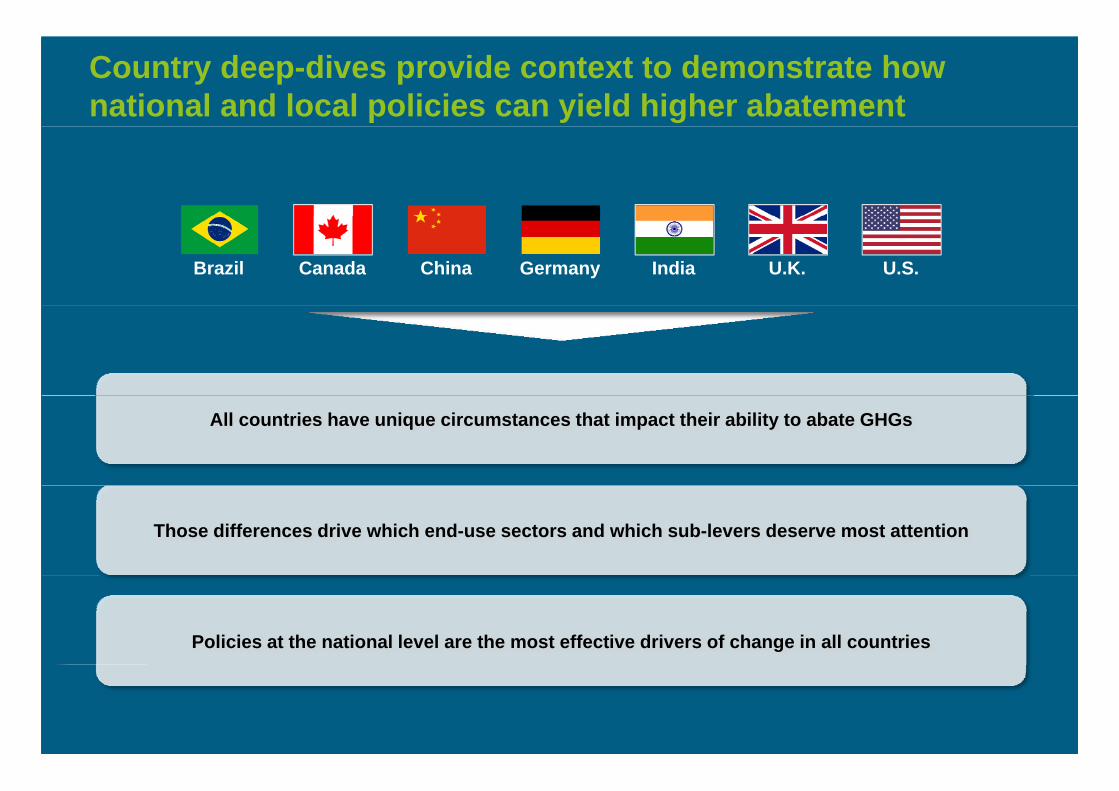
Country deep-dives provide context to demonstrate how national and local policies can yield higher abatement
Brazil Canada U.K.China U.S.Germany India
All countries have unique circumstances that impact their ability to abate GHGs
Those differences drive which end-use sectors and which sub-levers deserve most attention
Policies at the national level are the most effective drivers of change in all countries