Growing in China in a sustainable way - Kone in China in a sustainable way . ... 171K RMB; middle...
31
KONE CMD 2013 Growing in China in a sustainable way William B. Johnson, Executive Vice President, Greater China 24 September 2013
-
Upload
nguyendiep -
Category
Documents
-
view
214 -
download
0
Transcript of Growing in China in a sustainable way - Kone in China in a sustainable way . ... 171K RMB; middle...
KONE CMD 2013
Growing in China in a sustainable way William B. Johnson, Executive Vice President, Greater China 24 September 2013
KONE in China today
KONE China going forward
Agenda
Recent market developments
Market dynamics and longer-term development
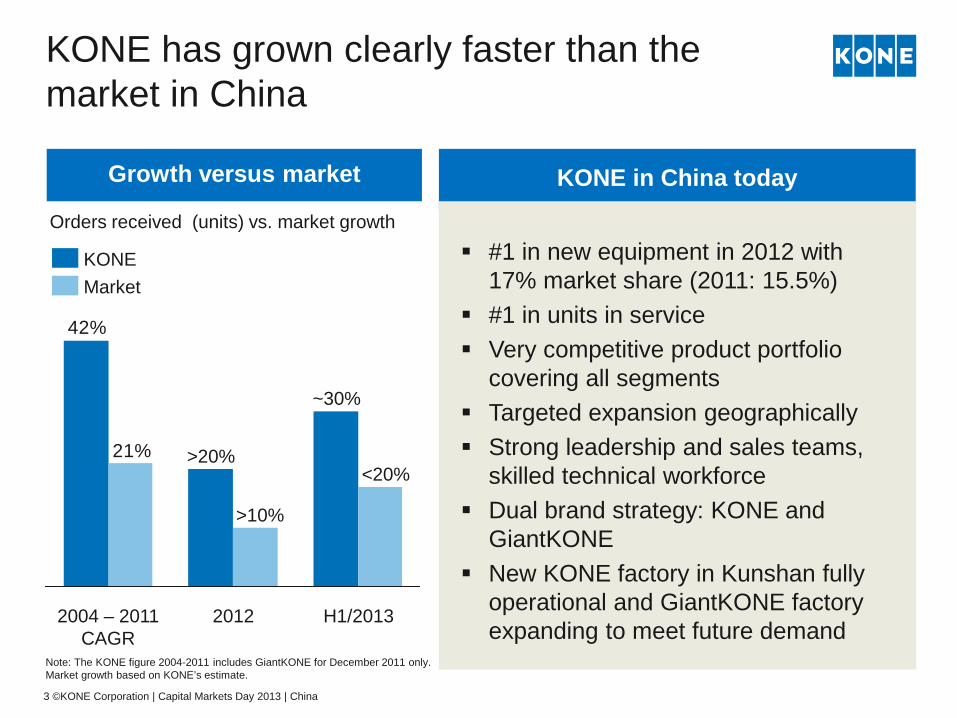
KONE has grown clearly faster than the market in China
Note: The KONE figure 2004-2011 includes GiantKONE for December 2011 only. Market growth based on KONE’s estimate.
Orders received (units) vs. market growth
42%
21%
H1/2013
<20%
~30%
2012
>10%
>20%
2004 – 2011 CAGR
Growth versus market KONE in China today
KONE Market
3 ©KONE Corporation | Capital Markets Day 2013 | China
#1 in new equipment in 2012 with 17% market share (2011: 15.5%)
#1 in units in service Very competitive product portfolio
covering all segments Targeted expansion geographically Strong leadership and sales teams,
skilled technical workforce Dual brand strategy: KONE and
GiantKONE New KONE factory in Kunshan fully
operational and GiantKONE factory expanding to meet future demand
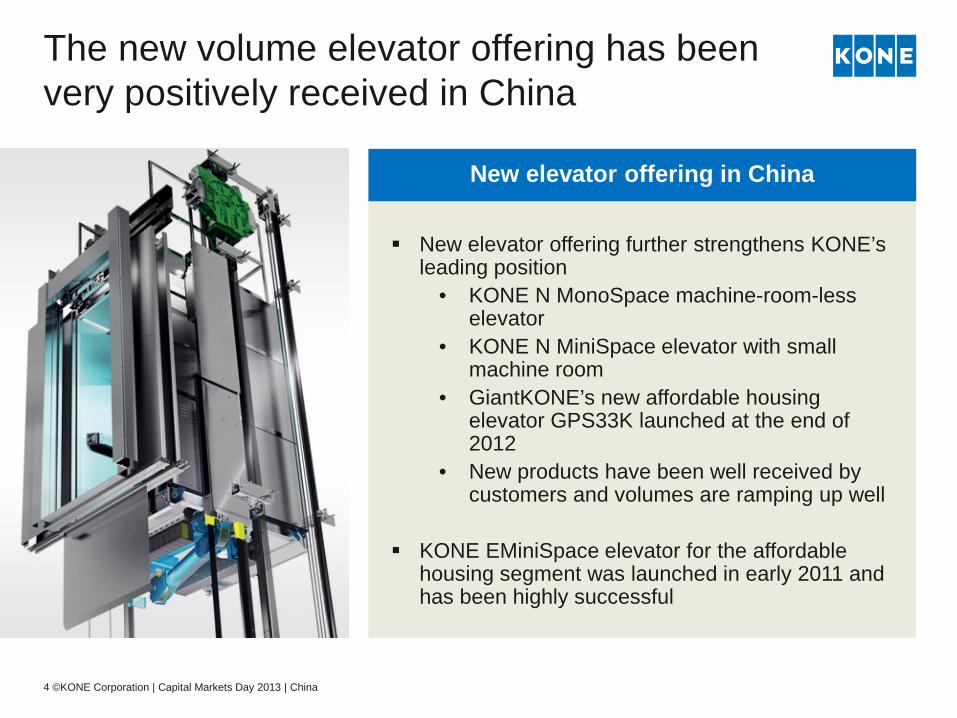
The new volume elevator offering has been very positively received in China
New elevator offering further strengthens KONE’s
leading position • KONE N MonoSpace machine-room-less
elevator • KONE N MiniSpace elevator with small
machine room • GiantKONE’s new affordable housing
elevator GPS33K launched at the end of 2012
• New products have been well received by customers and volumes are ramping up well
KONE EMiniSpace elevator for the affordable
housing segment was launched in early 2011 and has been highly successful
New elevator offering in China
4 ©KONE Corporation | Capital Markets Day 2013 | China
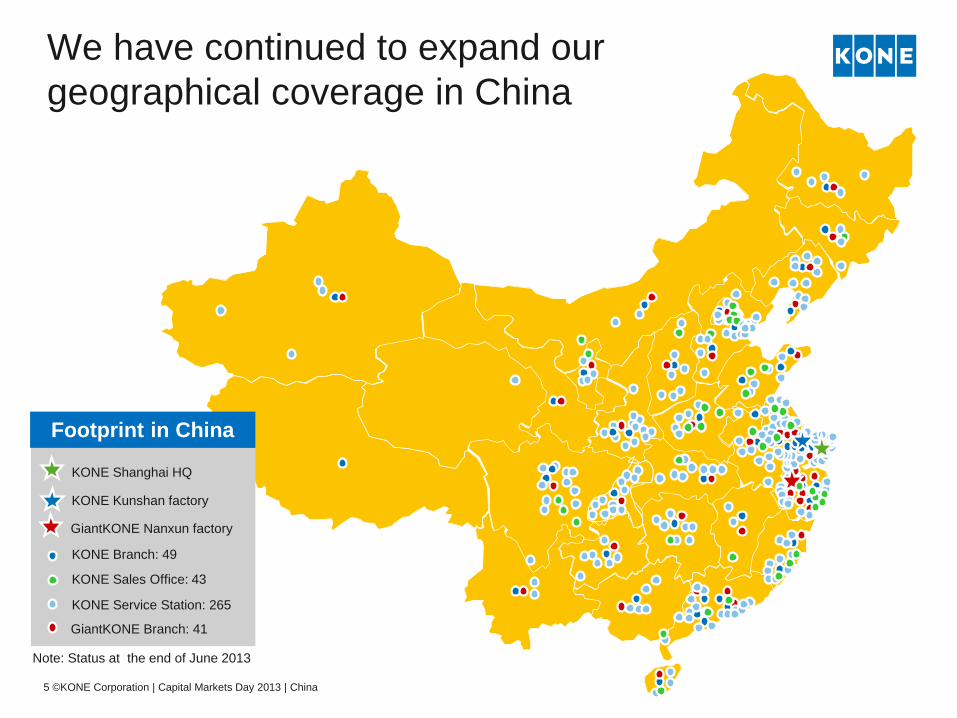
We have continued to expand our geographical coverage in China
Note: Status at the end of June 2013
KONE Service Station: 265
GiantKONE Branch: 41
KONE Branch: 49
GiantKONE Nanxun factory
KONE Kunshan factory
KONE Shanghai HQ
KONE Sales Office: 43
Footprint in China
5 ©KONE Corporation | Capital Markets Day 2013 | China
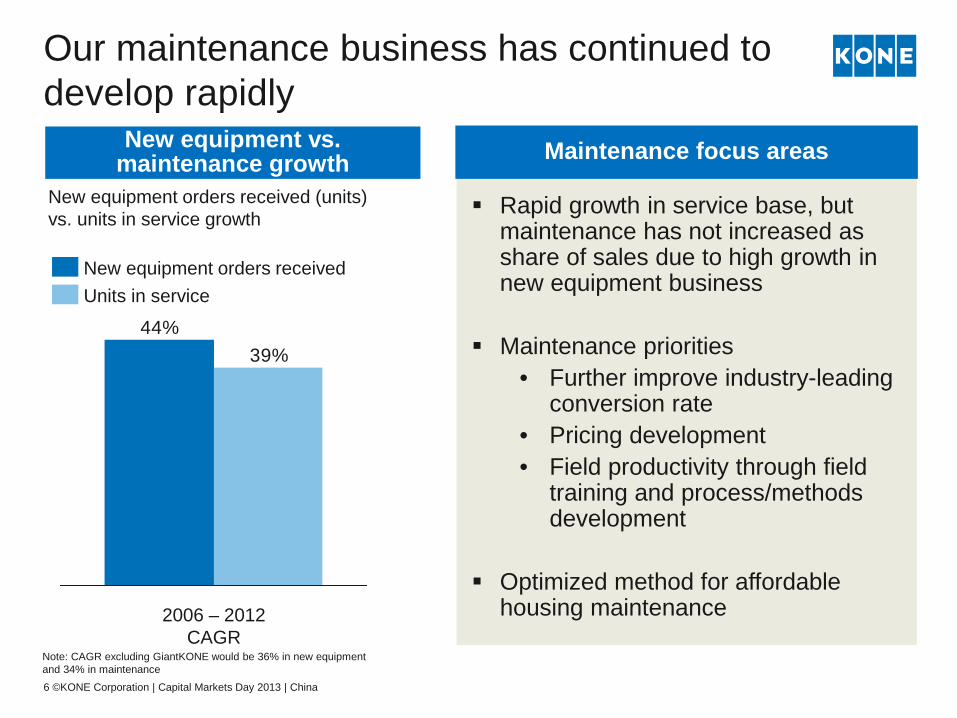
Our maintenance business has continued to develop rapidly
6 ©KONE Corporation | Capital Markets Day 2013 | China
44%39%
2006 – 2012 CAGR
Units in service New equipment orders received
New equipment orders received (units) vs. units in service growth
New equipment vs. maintenance growth
Rapid growth in service base, but maintenance has not increased as share of sales due to high growth in new equipment business
Maintenance priorities • Further improve industry-leading
conversion rate • Pricing development • Field productivity through field
training and process/methods development
Optimized method for affordable
housing maintenance
Maintenance focus areas
Note: CAGR excluding GiantKONE would be 36% in new equipment and 34% in maintenance
KONE in China today
KONE China going forward
Recent market developments
Market dynamics and longer-term development
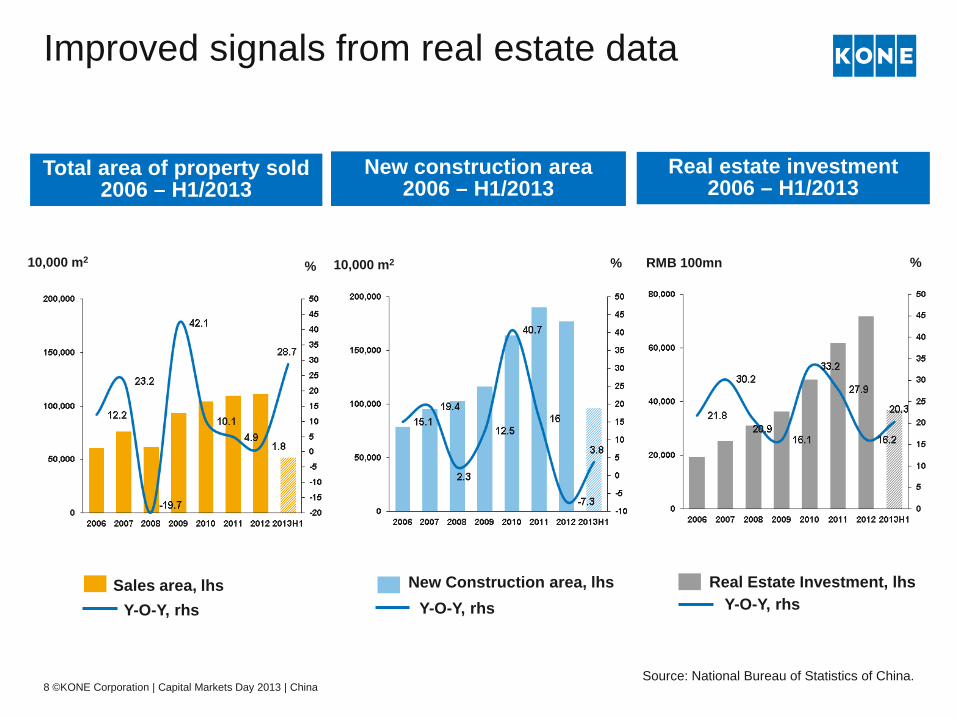
Improved signals from real estate data
Y-O-Y, rhs New Construction area, lhs
10,000 m2
Y-O-Y, rhs Real Estate Investment, lhs
RMB 100mn % %
New construction area 2006 – H1/2013
Real estate investment 2006 – H1/2013
Source: National Bureau of Statistics of China. 8 ©KONE Corporation | Capital Markets Day 2013 | China
Total area of property sold 2006 – H1/2013
Y-O-Y, rhs Sales area, lhs
10,000 m2 %
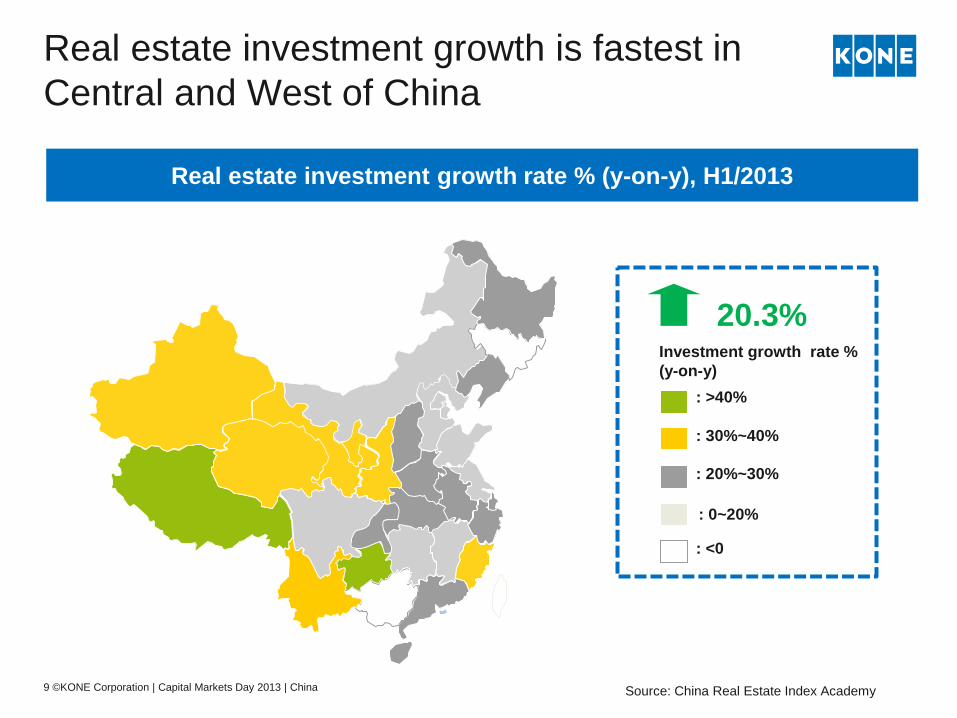
Real estate investment growth is fastest in Central and West of China
: >40%
: 30%~40%
: 20%~30%
: 0~20%
Investment growth rate % (y-on-y)
: <0
20.3%
Real estate investment growth rate % (y-on-y), H1/2013
Source: China Real Estate Index Academy 9 ©KONE Corporation | Capital Markets Day 2013 | China
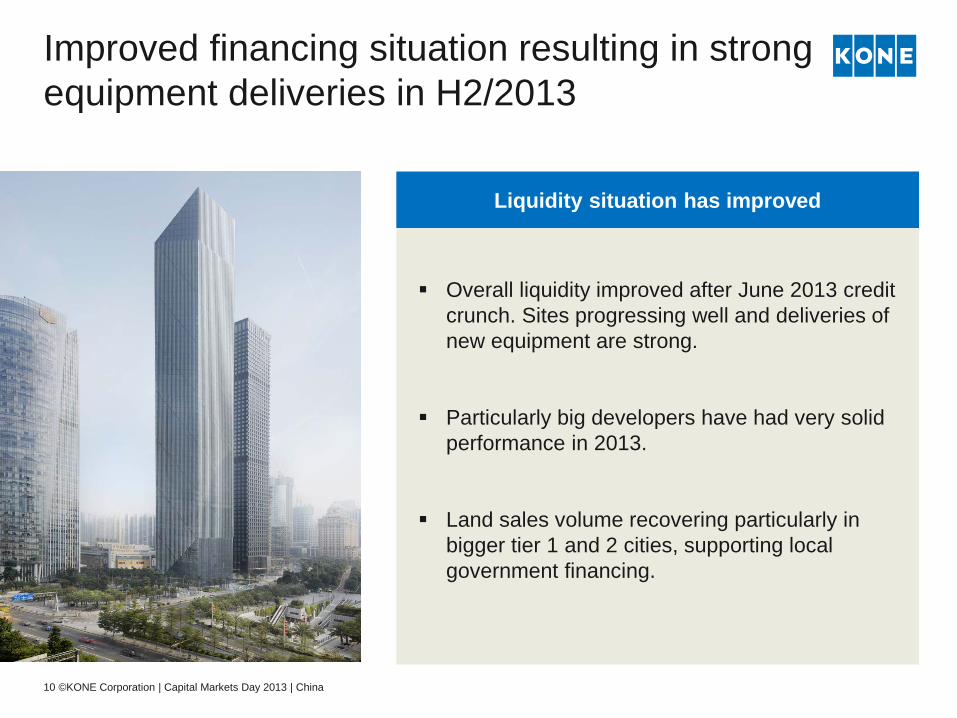
Overall liquidity improved after June 2013 credit crunch. Sites progressing well and deliveries of new equipment are strong.
Particularly big developers have had very solid performance in 2013.
Land sales volume recovering particularly in bigger tier 1 and 2 cities, supporting local government financing.
Improved financing situation resulting in strong equipment deliveries in H2/2013
10 ©KONE Corporation | Capital Markets Day 2013 | China
Liquidity situation has improved
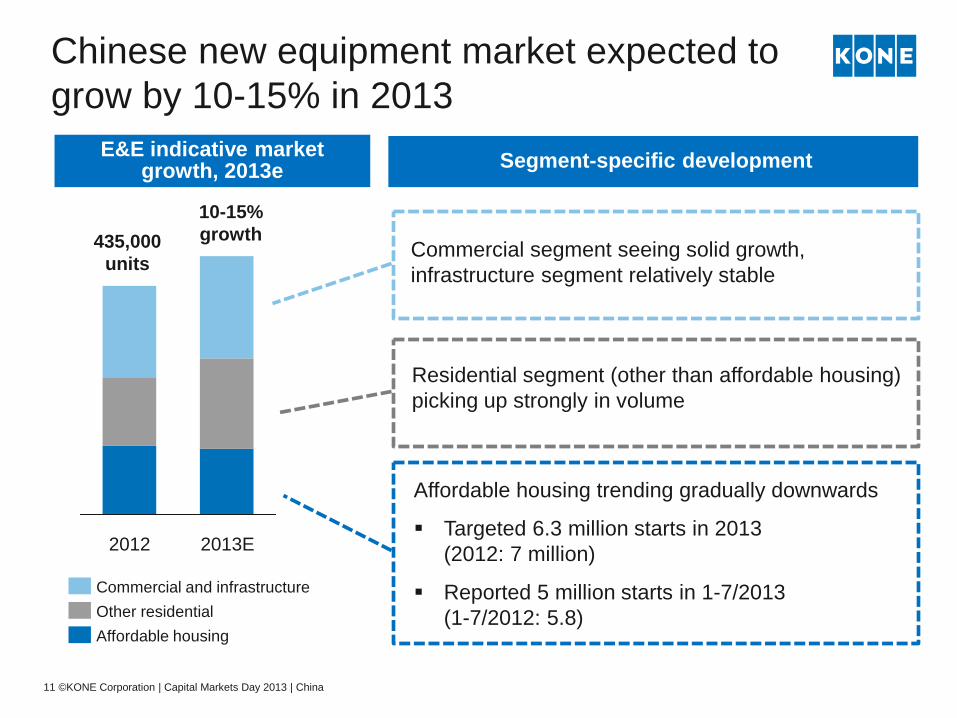
Chinese new equipment market expected to grow by 10-15% in 2013
2013E 2012
435,000 units
10-15% growth
Affordable housing Other residential Commercial and infrastructure
11 ©KONE Corporation | Capital Markets Day 2013 | China
E&E indicative market growth, 2013e
Affordable housing trending gradually downwards
Targeted 6.3 million starts in 2013 (2012: 7 million)
Reported 5 million starts in 1-7/2013 (1-7/2012: 5.8)
Residential segment (other than affordable housing) picking up strongly in volume
Segment-specific development
Commercial segment seeing solid growth, infrastructure segment relatively stable
KONE in China today
KONE China going forward
Recent market developments
Market dynamics and longer-term development
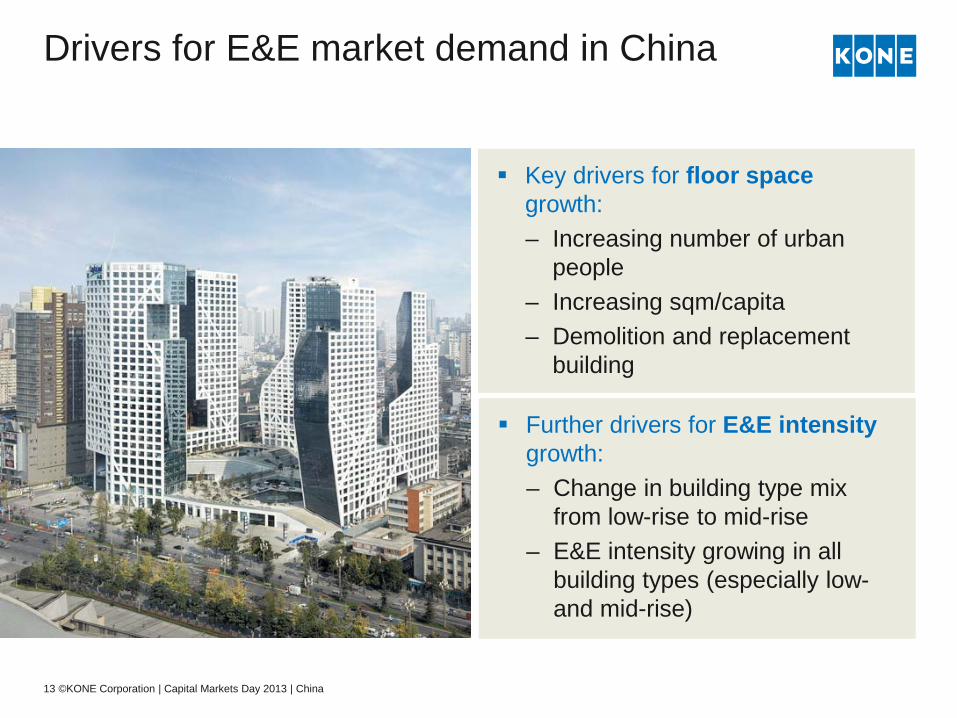
Drivers for E&E market demand in China
Key drivers for floor space growth: – Increasing number of urban
people – Increasing sqm/capita – Demolition and replacement
building
Further drivers for E&E intensity growth: – Change in building type mix
from low-rise to mid-rise – E&E intensity growing in all
building types (especially low- and mid-rise)
13 ©KONE Corporation | Capital Markets Day 2013 | China
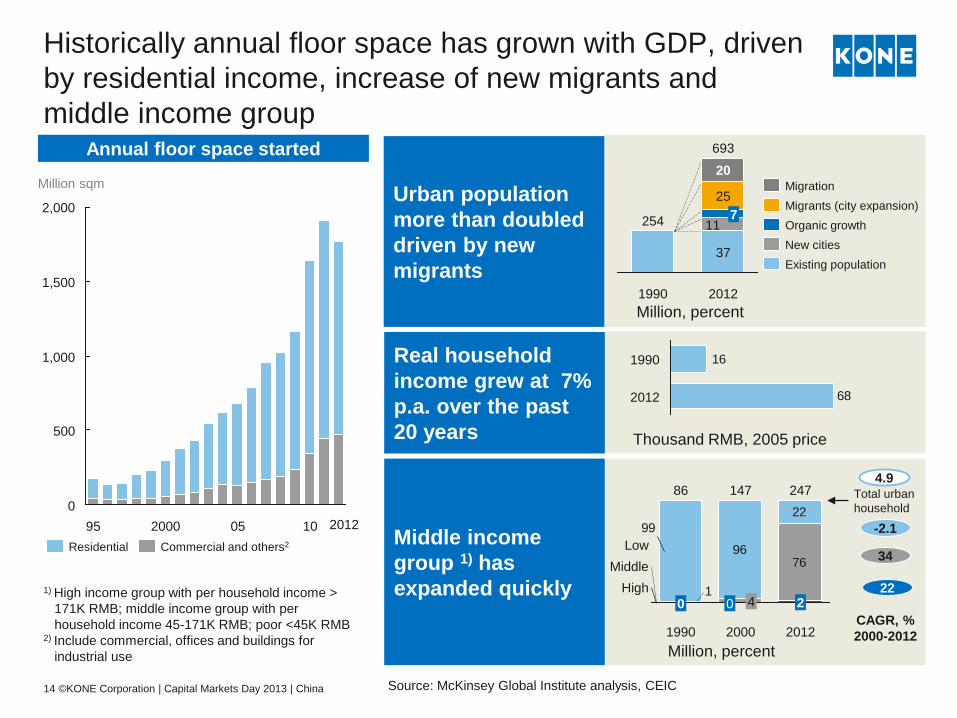
Source: McKinsey Global Institute analysis, CEIC
1) High income group with per household income > 171K RMB; middle income group with per household income 45-171K RMB; poor <45K RMB
2) Include commercial, offices and buildings for industrial use
Million sqm
34
CAGR, % 2000-2012
-2.1
4.9
Million, percent
Million, percent 2012
693
37
11 7
25
20
1990
254
Existing population New cities Organic growth Migrants (city expansion) Migration
7696
22
1
99
Total urban household
High Middle
Low
2000
247
2
147
0 4
2012
86
0
1990
68
161990
2012
1,000
500
0
2,000
1,500
95 2000 05 10 Commercial and others2 Residential
Historically annual floor space has grown with GDP, driven by residential income, increase of new migrants and middle income group
14 ©KONE Corporation | Capital Markets Day 2013 | China
Thousand RMB, 2005 price
Real household income grew at 7% p.a. over the past 20 years
Middle income group 1) has expanded quickly
Urban population more than doubled driven by new migrants
22
2012
Annual floor space started
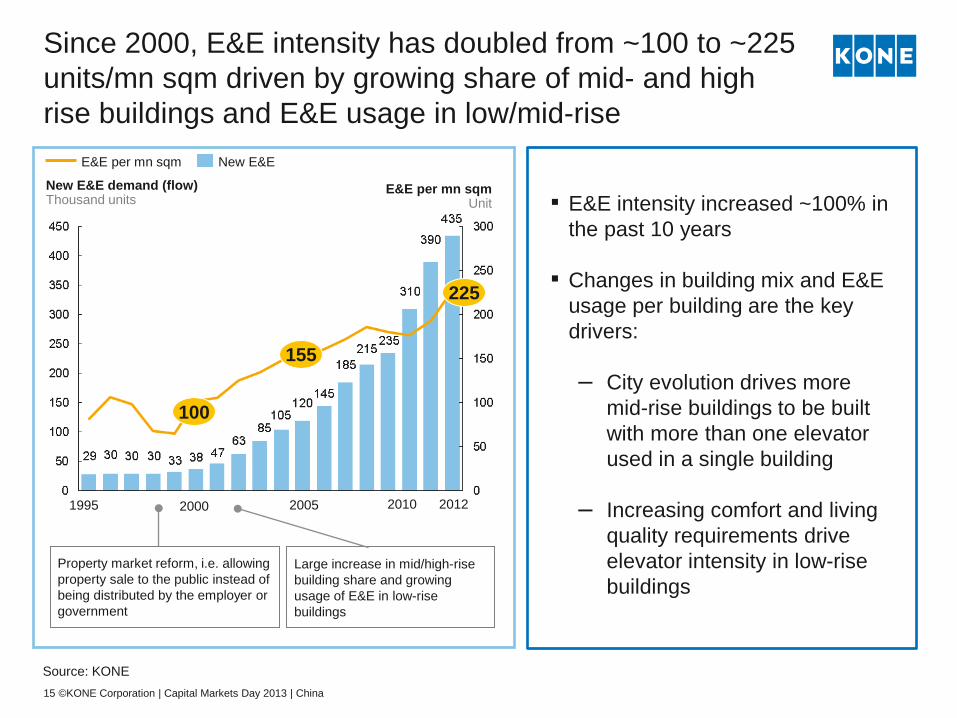
Since 2000, E&E intensity has doubled from ~100 to ~225 units/mn sqm driven by growing share of mid- and high rise buildings and E&E usage in low/mid-rise
Source: KONE 15 ©KONE Corporation | Capital Markets Day 2013 | China
1995 2005 2000
E&E per mn sqm Unit
New E&E demand (flow) Thousand units
E&E per mn sqm New E&E
Property market reform, i.e. allowing property sale to the public instead of being distributed by the employer or government
Large increase in mid/high-rise building share and growing usage of E&E in low-rise buildings
2010 2012
100
155
225
▪ E&E intensity increased ~100% in
the past 10 years ▪ Changes in building mix and E&E
usage per building are the key drivers:
‒ City evolution drives more
mid-rise buildings to be built with more than one elevator used in a single building
‒ Increasing comfort and living quality requirements drive elevator intensity in low-rise buildings
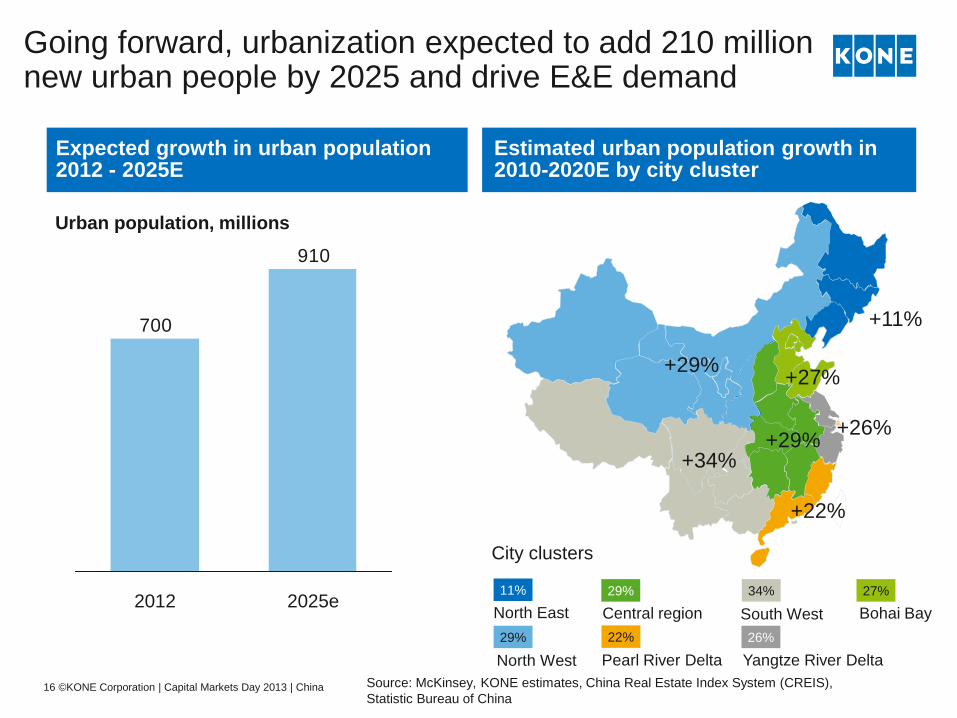
Going forward, urbanization expected to add 210 million new urban people by 2025 and drive E&E demand
11% 29%
22% 29%
Pearl River Delta
City clusters
16 ©KONE Corporation | Capital Markets Day 2013 | China
Expected growth in urban population 2012 - 2025E
Estimated urban population growth in 2010-2020E by city cluster
Source: McKinsey, KONE estimates, China Real Estate Index System (CREIS), Statistic Bureau of China
26%
34% 27%
South West North East
North West
Central region
Yangtze River Delta
Bohai Bay
+11%
+29% +34%
+27% +29%
+22%
+26%
910
700
2012 2025e
Urban population, millions
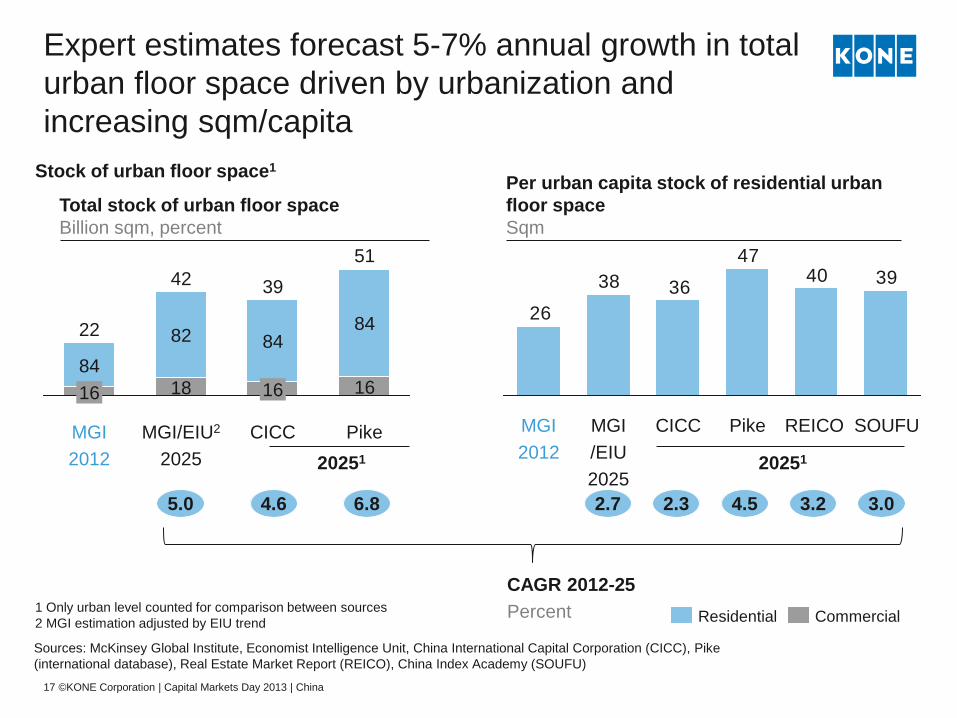
Expert estimates forecast 5-7% annual growth in total urban floor space driven by urbanization and increasing sqm/capita
2.7 4.5 3.0
CAGR 2012-25 Percent
Total stock of urban floor space Billion sqm, percent
2.3 3.2 5.0 6.8 4.6
20251 20251
Per urban capita stock of residential urban floor space Sqm
Stock of urban floor space1
Sources: McKinsey Global Institute, Economist Intelligence Unit, China International Capital Corporation (CICC), Pike (international database), Real Estate Market Report (REICO), China Index Academy (SOUFU)
1 Only urban level counted for comparison between sources 2 MGI estimation adjusted by EIU trend Commercial Residential
394047
3638
26
REICO SOUFU Pike CICC MGI /EIU 2025
MGI 2012
39
16
MGI/EIU2
2025
18
Pike
84 22 82
16
CICC
51 42
MGI 2012
84
16 84
17 ©KONE Corporation | Capital Markets Day 2013 | China
0
5
10
15
20
25
30
35
40
45
50
55
60
65
70
75
80
10,000 5,000 0 60,000 55,000 50,000 45,000 40,000 35,000 30,000 25,000 20,000 15,000
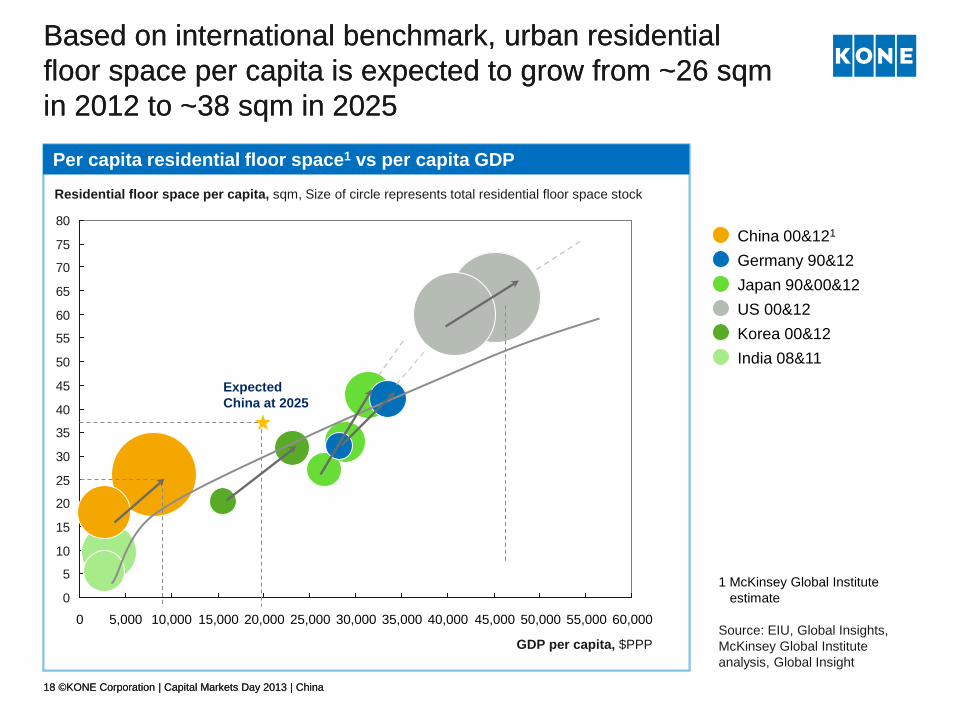
Residential floor space per capita, sqm, Size of circle represents total residential floor space stock
GDP per capita, $PPP
India 08&11 Korea 00&12 US 00&12 Japan 90&00&12 Germany 90&12 China 00&121
Expected China at 2025
US 2012
Per capita residential floor space1 vs per capita GDP
18 ©KONE Corporation | Capital Markets Day 2013 | China
Based on international benchmark, urban residential floor space per capita is expected to grow from ~26 sqm in 2012 to ~38 sqm in 2025
0
5
10
15
20
25
30
35
40
45
50
55
60
65
70
75
80
60,000 55,000 50,000 45,000 40,000 35,000 30,000 25,000 20,000 15,000 10,000 5,000 0
Residential floor space per capita, sqm, Size of circle represents total residential floor space stock
GDP per capita, $PPP
Expected China at 2025
Per capita residential floor space1 vs per capita GDP
18 ©KONE Corporation | Capital Markets Day 2013 | China
Based on international benchmark, urban residential floor space per capita is expected to grow from ~26 sqm in 2012 to ~38 sqm in 2025
1 McKinsey Global Institute estimate
Source: EIU, Global Insights, McKinsey Global Institute analysis, Global Insight
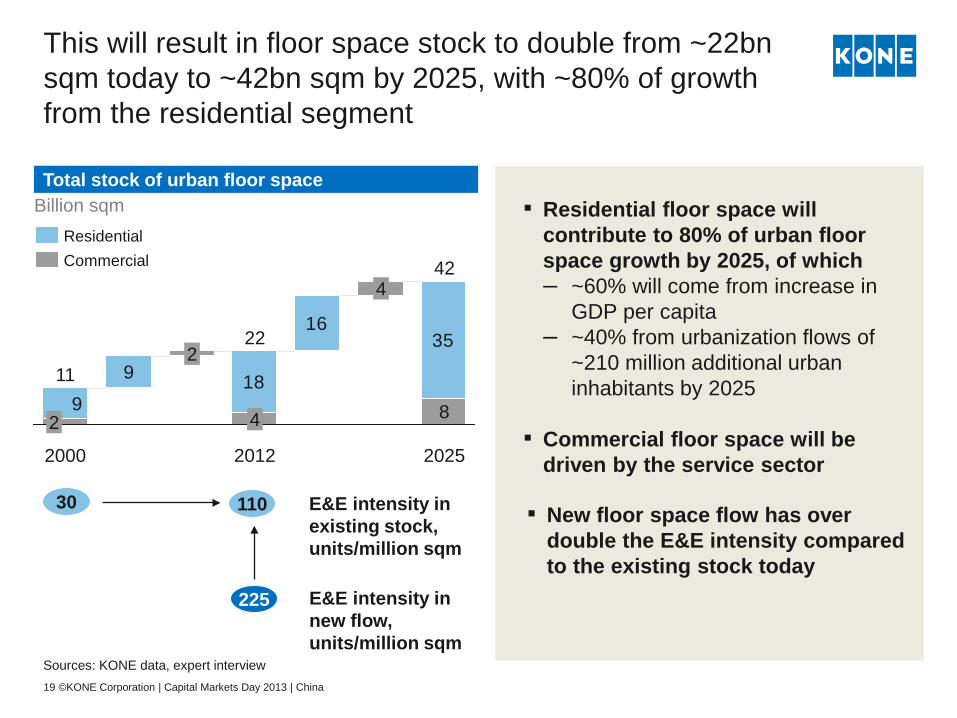
This will result in floor space stock to double from ~22bn sqm today to ~42bn sqm by 2025, with ~80% of growth from the residential segment
Sources: KONE data, expert interview
Billion sqm
8
16
9
35
189
42 4
22
4
2 11
2
Commercial Residential
▪ Residential floor space will contribute to 80% of urban floor space growth by 2025, of which – ~60% will come from increase in
GDP per capita – ~40% from urbanization flows of
~210 million additional urban inhabitants by 2025
▪ Commercial floor space will be
driven by the service sector
19 ©KONE Corporation | Capital Markets Day 2013 | China
2025 2012 2000
30 110
225
E&E intensity in existing stock, units/million sqm
E&E intensity in new flow, units/million sqm
▪ New floor space flow has over double the E&E intensity compared to the existing stock today
Total stock of urban floor space
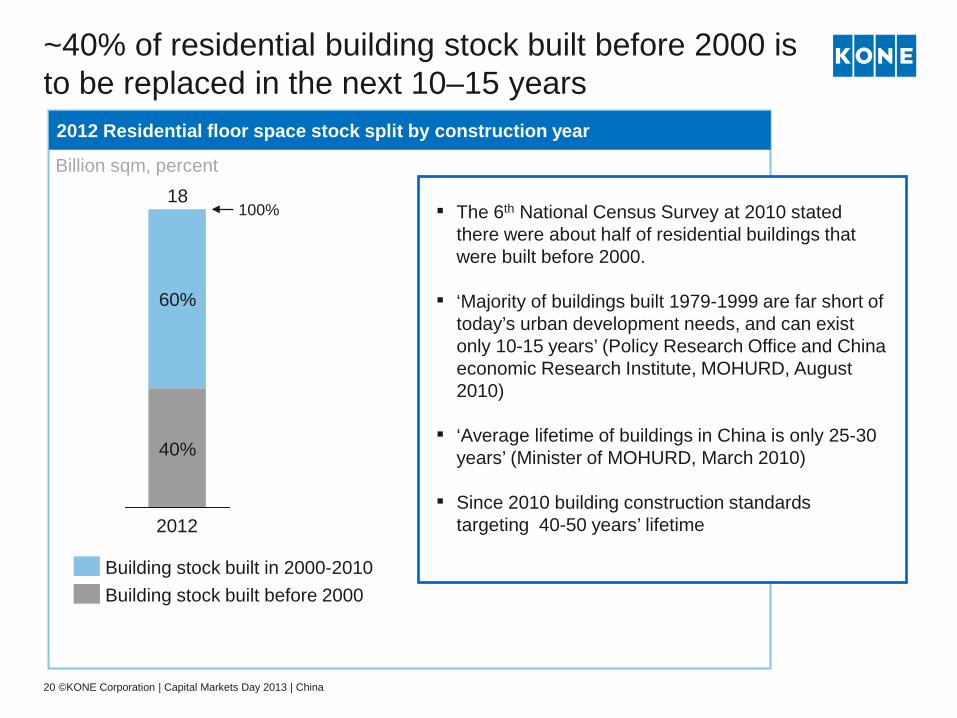
~40% of residential building stock built before 2000 is to be replaced in the next 10–15 years
34
2012 61
2012 Residential floor space stock split by construction year
Billion sqm, percent
▪ The 6th National Census Survey at 2010 stated there were about half of residential buildings that were built before 2000.
▪ ‘Majority of buildings built 1979-1999 are far short of
today’s urban development needs, and can exist only 10-15 years’ (Policy Research Office and China economic Research Institute, MOHURD, August 2010)
▪ ‘Average lifetime of buildings in China is only 25-30
years’ (Minister of MOHURD, March 2010)
▪ Since 2010 building construction standards targeting 40-50 years’ lifetime
20 ©KONE Corporation | Capital Markets Day 2013 | China
100% 18
40%
60%
Building stock built before 2000 Building stock built in 2000-2010
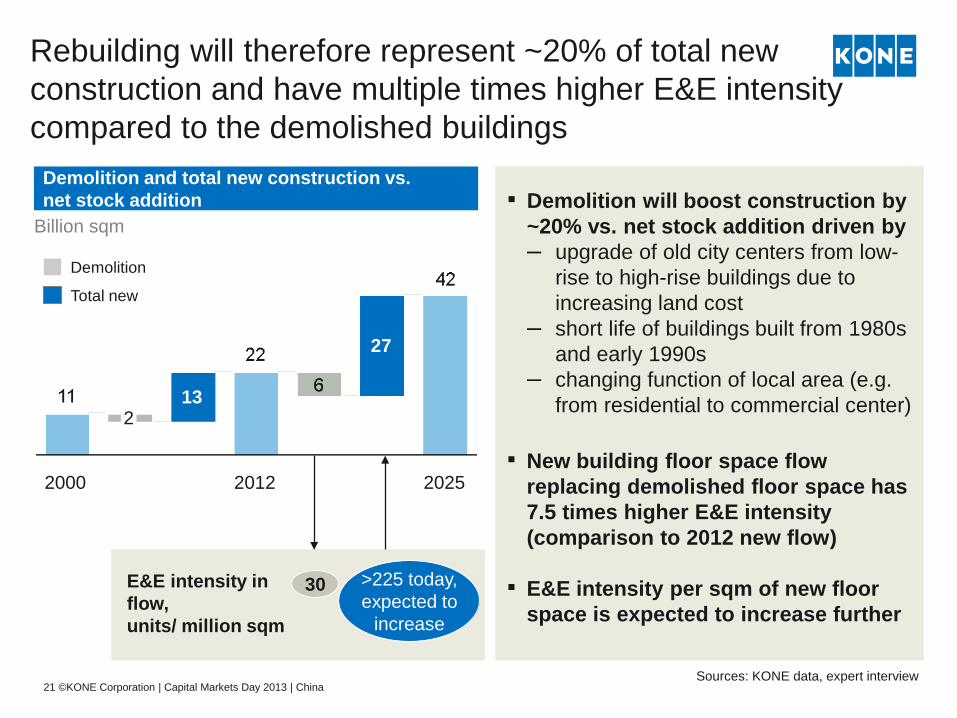
Rebuilding will therefore represent ~20% of total new construction and have multiple times higher E&E intensity compared to the demolished buildings
Sources: KONE data, expert interview
2025
27
2012
13 2
2000
Demolition
Total new
▪ Demolition will boost construction by ~20% vs. net stock addition driven by – upgrade of old city centers from low-
rise to high-rise buildings due to increasing land cost
– short life of buildings built from 1980s and early 1990s
– changing function of local area (e.g. from residential to commercial center)
21 ©KONE Corporation | Capital Markets Day 2013 | China
Billion sqm
E&E intensity in flow, units/ million sqm
30
▪ New building floor space flow replacing demolished floor space has 7.5 times higher E&E intensity (comparison to 2012 new flow)
▪ E&E intensity per sqm of new floor space is expected to increase further
>225 today, expected to
increase
Demolition and total new construction vs. net stock addition
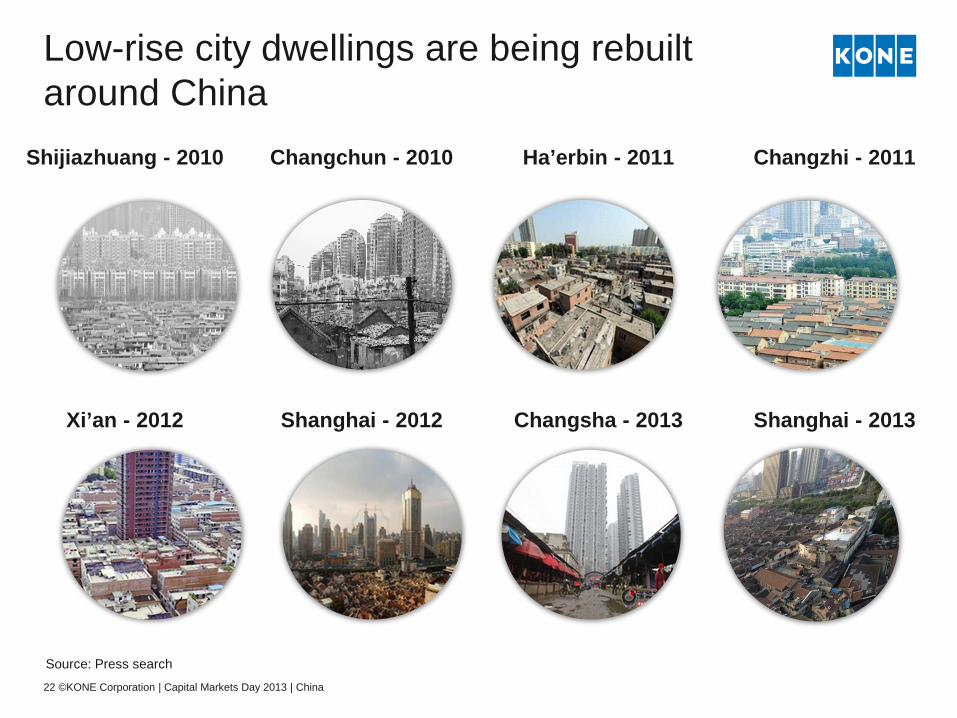
Low-rise city dwellings are being rebuilt around China
Source: Press search
Shanghai - 2012 Xi’an - 2012 Changsha - 2013 Shanghai - 2013
Ha’erbin - 2011 Changzhi - 2011 Shijiazhuang - 2010 Changchun - 2010
22 ©KONE Corporation | Capital Markets Day 2013 | China
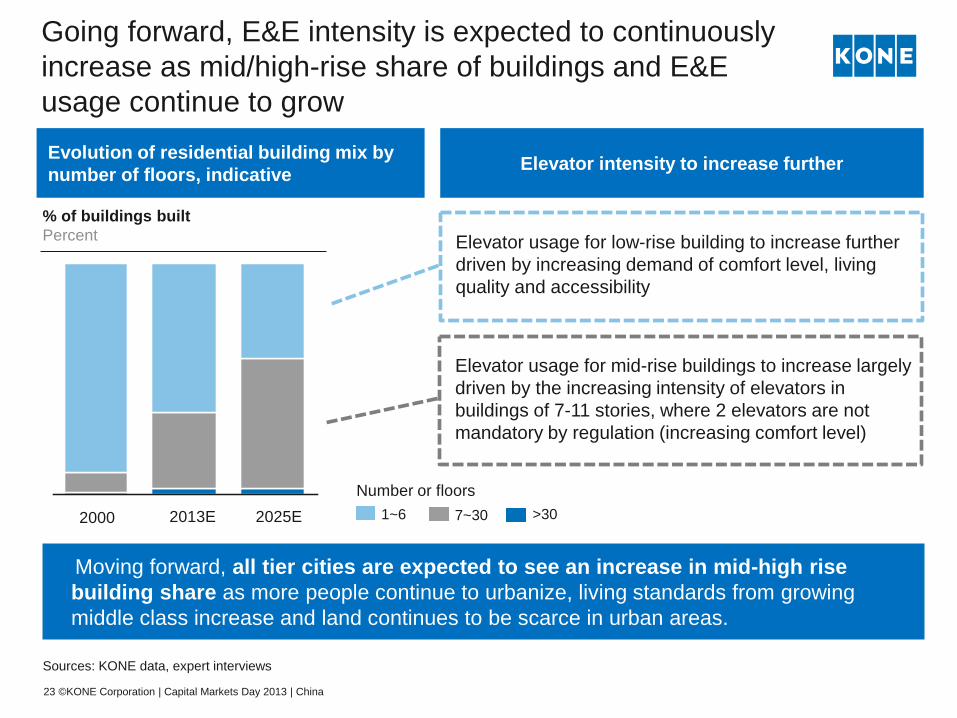
Going forward, E&E intensity is expected to continuously increase as mid/high-rise share of buildings and E&E usage continue to grow
Moving forward, all tier cities are expected to see an increase in mid-high rise building share as more people continue to urbanize, living standards from growing middle class increase and land continues to be scarce in urban areas.
Sources: KONE data, expert interviews
2025E 2013E 2000
% of buildings built Percent
1~6 7~30 >30
Evolution of residential building mix by number of floors, indicative
23 ©KONE Corporation | Capital Markets Day 2013 | China
Elevator usage for low-rise building to increase further driven by increasing demand of comfort level, living quality and accessibility
Elevator usage for mid-rise buildings to increase largely driven by the increasing intensity of elevators in buildings of 7-11 stories, where 2 elevators are not mandatory by regulation (increasing comfort level)
Elevator intensity to increase further
Number or floors
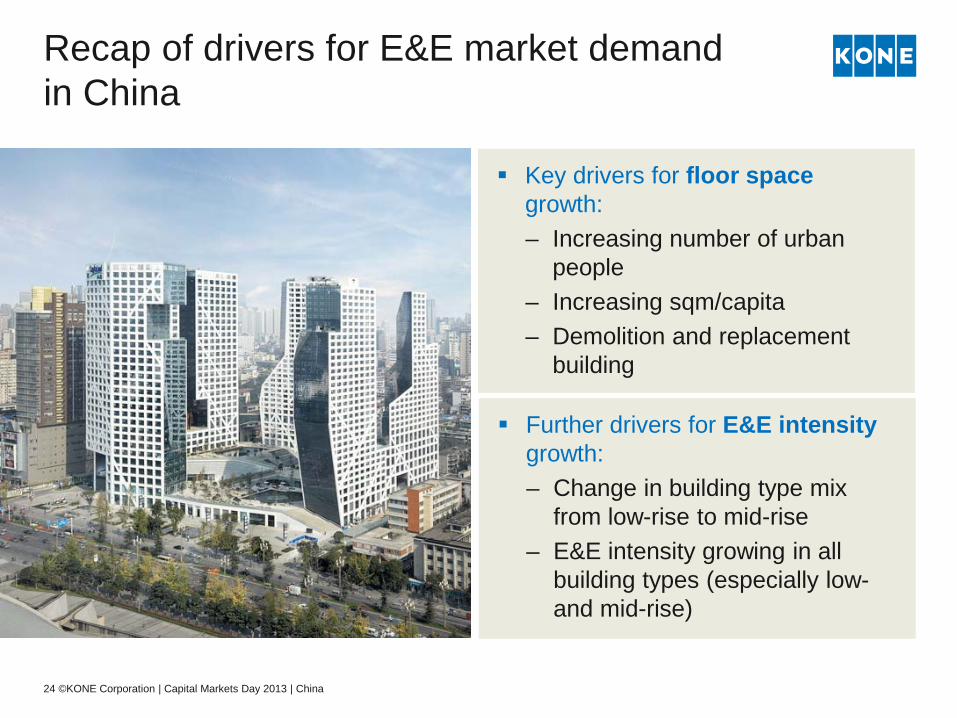
Recap of drivers for E&E market demand in China
Key drivers for floor space growth: – Increasing number of urban
people – Increasing sqm/capita – Demolition and replacement
building
Further drivers for E&E intensity growth: – Change in building type mix
from low-rise to mid-rise – E&E intensity growing in all
building types (especially low- and mid-rise)
24 ©KONE Corporation | Capital Markets Day 2013 | China
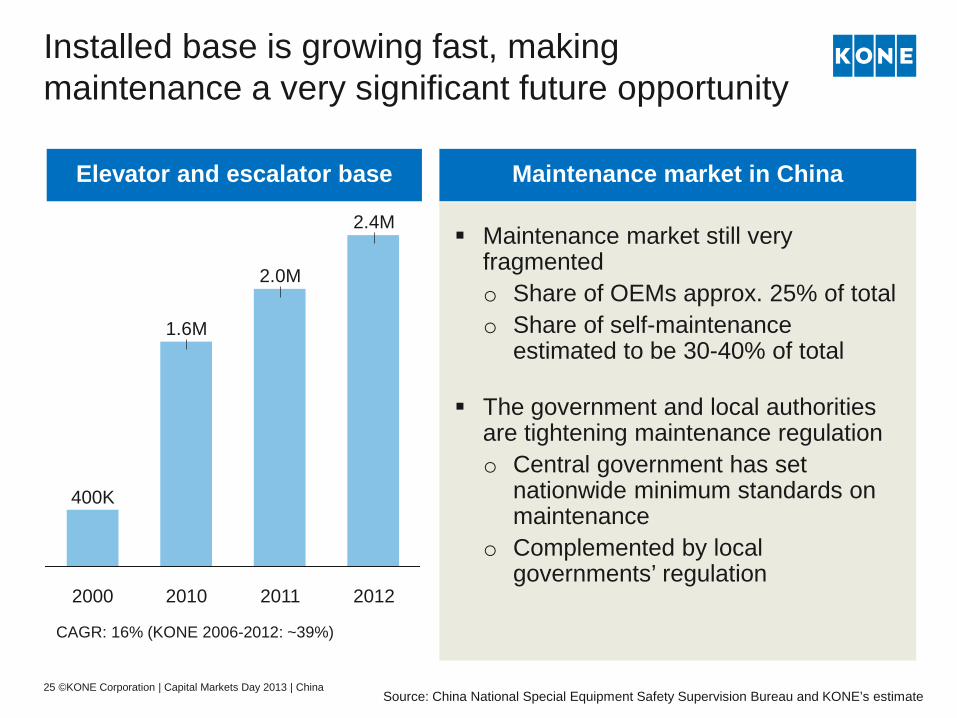
Installed base is growing fast, making maintenance a very significant future opportunity
2.4M
2012 2011
2.0M
2010
1.6M
2000
400K
Source: China National Special Equipment Safety Supervision Bureau and KONE’s estimate
Elevator and escalator base
Maintenance market still very fragmented o Share of OEMs approx. 25% of total o Share of self-maintenance
estimated to be 30-40% of total
The government and local authorities are tightening maintenance regulation o Central government has set
nationwide minimum standards on maintenance
o Complemented by local governments’ regulation
Maintenance market in China
25 ©KONE Corporation | Capital Markets Day 2013 | China
CAGR: 16% (KONE 2006-2012: ~39%)
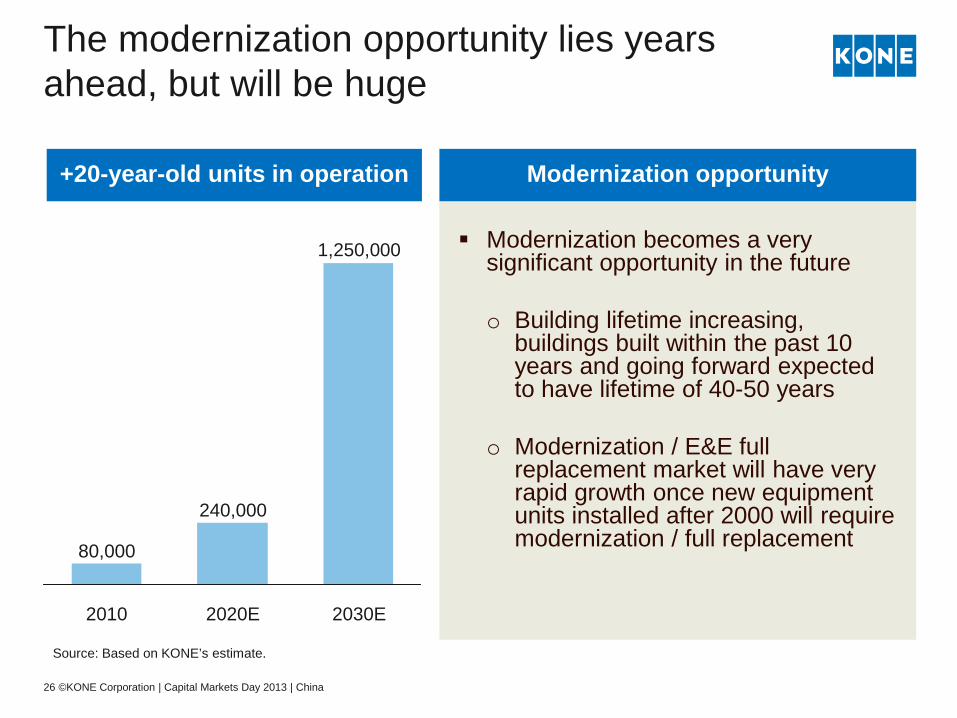
The modernization opportunity lies years ahead, but will be huge
2030E
1,250,000
2020E
240,000
2010
80,000
Source: Based on KONE’s estimate.
+20-year-old units in operation Modernization becomes a very
significant opportunity in the future o Building lifetime increasing,
buildings built within the past 10 years and going forward expected to have lifetime of 40-50 years
o Modernization / E&E full
replacement market will have very rapid growth once new equipment units installed after 2000 will require modernization / full replacement
Modernization opportunity
26 ©KONE Corporation | Capital Markets Day 2013 | China
KONE in China today
KONE China going forward
Recent market developments
Market dynamics and longer-term development
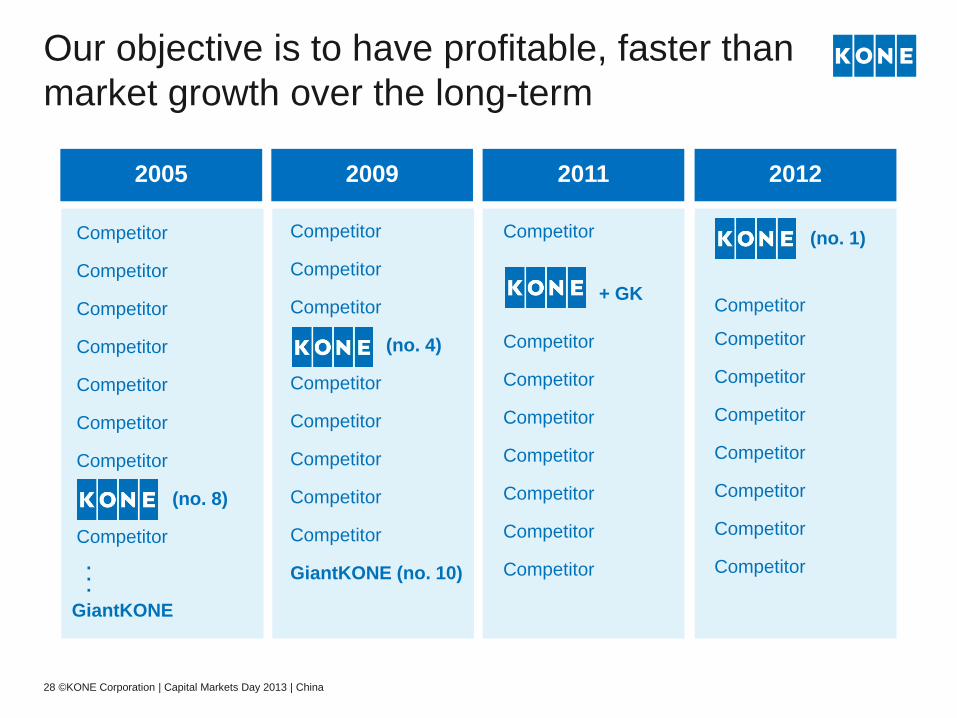
Our objective is to have profitable, faster than market growth over the long-term
2005
Competitor
Competitor
Competitor
Competitor
Competitor
Competitor
Competitor
(no. 8)
Competitor
Competitor
Competitor
Competitor
(no. 4)
Competitor
Competitor
Competitor
Competitor
Competitor
GiantKONE (no. 10)
Competitor
+ GK
Competitor
Competitor
Competitor
Competitor
Competitor
Competitor
Competitor
2009 2011
GiantKONE
. . .
(no. 1)
Competitor
Competitor
Competitor
Competitor
Competitor
Competitor
Competitor
Competitor
2012
28 ©KONE Corporation | Capital Markets Day 2013 | China
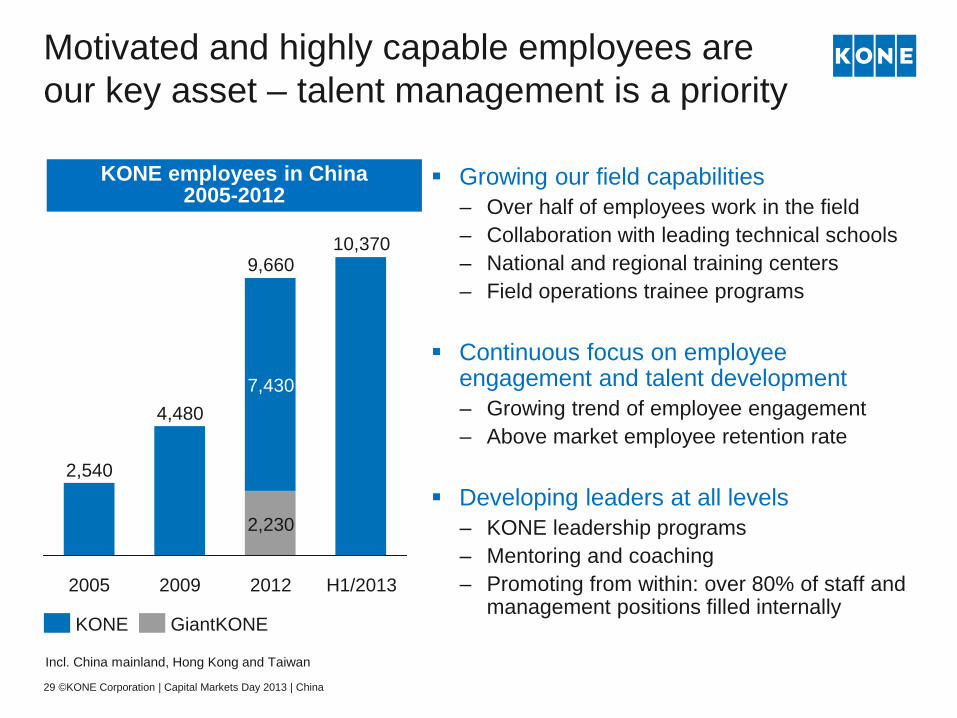
Motivated and highly capable employees are our key asset – talent management is a priority
2,230
Growing our field capabilities – Over half of employees work in the field – Collaboration with leading technical schools – National and regional training centers – Field operations trainee programs
Continuous focus on employee
engagement and talent development – Growing trend of employee engagement – Above market employee retention rate
Developing leaders at all levels – KONE leadership programs – Mentoring and coaching – Promoting from within: over 80% of staff and
management positions filled internally
29 ©KONE Corporation | Capital Markets Day 2013 | China
2005 2009 2012
2,540
4,480
2,230
7,430
9,660
H1/2013
10,370
KONE GiantKONE
Incl. China mainland, Hong Kong and Taiwan
KONE employees in China 2005-2012
Growing in China in a sustainable way
Continue to grow faster than the market Continue to improve profitability Build market-leading service business
KONE objectives in China
Offering performance and competitiveness Pricing excellence Productivity development in operations Active talent management
Key focus areas
30 ©KONE Corporation | Capital Markets Day 2013 | China