GROUPE RENAULT Q3 2017 CONFERENCE · investor relations –q3 2017 presentation october 24th 2017...
21
PROPERTY OF GROUPE RENAULT 1 INVESTOR RELATIONS – Q3 2017 PRESENTATION OCTOBER 24TH 2017 GROUPE RENAULT Q3 2017 CONFERENCE
Transcript of GROUPE RENAULT Q3 2017 CONFERENCE · investor relations –q3 2017 presentation october 24th 2017...
PROPERTY OF GROUPE RENAULT 1INVESTOR RELATIONS – Q3 2017 PRESENTATION OCTOBER 24TH 2017
GROUPE RENAULT
Q3 2017 CONFERENCE

PROPERTY OF GROUPE RENAULT 2INVESTOR RELATIONS – Q3 2017 PRESENTATION OCTOBER 24TH 2017
DISCLAIMER
Information contained within this document may contain forward looking statements. Although the Company considers that such
information and statements are based on reasonable assumptions taken on the date of this report, due to their nature, they can
be risky and uncertain (as described in the Renault documentation registered within the French financial markets regulation
authorities) and can lead to a difference between the exact figures and those given or deduced from said information and
statements.
Renault does not undertake to provide updates or revisions, should any new statements and information be available, should any
new specific events occur or for any other reason. Renault makes no representation, declaration or warranty as regards the
accuracy, sufficiency, adequacy, effectiveness and genuineness of any statements and information contained in this report.
Further information on Renault can be found on Renault’s web site (www.group.renault.com), in the section Finance / Regulated
Information.
PROPERTY OF GROUPE RENAULT 3INVESTOR RELATIONS – Q3 2017 PRESENTATION OCTOBER 24TH 2017
01 Q3 2017 COMMERCIAL RESULTS UPDATETHIERRY KOSKASEVP, SALES & MARKETING
02 Q3 2017 REVENUES & OUTLOOKCLOTILDE DELBOSEVP & CFO
03 QUESTIONS & ANSWERS
AGENDA
PROPERTY OF GROUPE RENAULT 4INVESTOR RELATIONS – Q3 2017 PRESENTATION OCTOBER 24TH 2017
KEY TAKE-AWAYS
ON-GOING RECOVERY IN KEY EMERGING MARKETS
AVTOVAZ RECOVERY WELL ON-TRACK
STRONG GROWTH IN SALES TO PARTNERS
RISK: FOREX VOLATILITY
OPPORTUNITY: VOLUME
FULL-YEAR GUIDANCE CONFIRMED

PROPERTY OF GROUPE RENAULT 5INVESTOR RELATIONS – Q3 2017 PRESENTATION OCTOBER 24TH 2017
Q3 2017 COMMERCIAL RESULTS UPDATE
01

PROPERTY OF GROUPE RENAULT 6INVESTOR RELATIONS – Q3 2017 PRESENTATION OCTOBER 24TH 2017
* PC+LCV including USA & Canada
TIV EVOLUTION Q3 2017 VS Q3 2016
RUSSIA +17.7%
TURKEY +14.4%
ALGERIA -29.6%
MOROCCO +18.6%
IRAN +18.5%
INDIA +13.7%
BRAZIL +14.6%
ARGENTINA +18.5%
COLOMBIA -2.6%
WORLD*
TIV +3.4%
EURASIA
TIV +15.5%
AFRICA-ME-INDIA
TIV +4.2%
AMERICAS
TIV +7.1%
ASIA-PACIFIC
TIV +4.7 %
EUROPE
TIV +1.4%
FRANCE +6.7%
GERMANY +0.6%
UK -8.1%
SPAIN +7.3%
ITALY +6.1%
CHINA +4.2%
SOUTH KOREA +12.9%
PROPERTY OF GROUPE RENAULT 7INVESTOR RELATIONS – Q3 2017 PRESENTATION OCTOBER 24TH 2017
792
379
130 14997
37
866
397
129185
11045
0
100
200
300
400
500
600
700
800
900
2016 2017 2016 2017 2016 2017 2016 2017 2016 2017 2016 2017
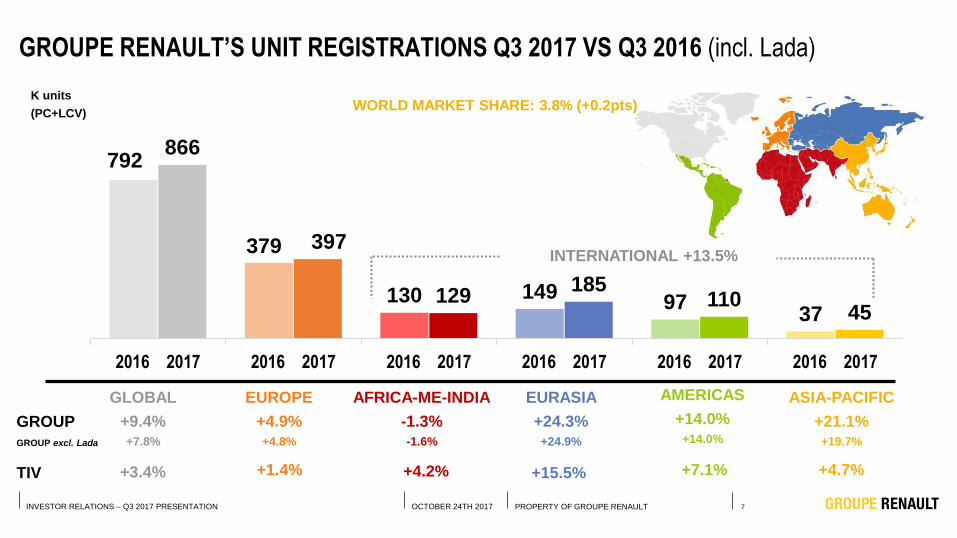
GROUPE RENAULT’S UNIT REGISTRATIONS Q3 2017 VS Q3 2016 (incl. Lada)
K units
(PC+LCV)WORLD MARKET SHARE: 3.8% (+0.2pts)
INTERNATIONAL +13.5%
GLOBAL
+9.4%
+7.8%
EUROPE
+4.9%
+4.8%
AMERICAS
+14.0%
+14.0%
ASIA-PACIFIC
+21.1%
+19.7%
AFRICA-ME-INDIA
-1.3%
-1.6%
EURASIA
+24.3%
+24.9%
+3.4% TIV +1.4% +15.5% +4.2% +7.1% +4.7%
GROUP
GROUP excl. Lada

PROPERTY OF GROUPE RENAULT 8INVESTOR RELATIONS – Q3 2017 PRESENTATION OCTOBER 24TH 2017
36% 42%48%
55% 52%48%
REGIONAL SALES BREAKDOWN
WEIGHT OF INTERNATIONAL SALES INCREASING
TOP 10 MARKETS BY VOLUME Q3 (in K units)
01
02
03
04
05
06
07
08
09
10
Volume
Q3 2017
Market
share
vs.
Q3 2016
FRANCE 130,895 25.3% -0.1 pts
RUSSIA 115,860 28.2% +1.2 pts
GERMANY 51,811 5.8% +0.6 pts
BRAZIL 49,326 8.5% +0.7 pts
TURKEY 42,626 18.8% +3.5 pts
IRAN 42,184 10.5% +0.8 pts
ITALY 41,381 9.5% +0.7 pts
SPAIN 40,776 13.1% -0.0 pts
ARGENTINA 34,179 14.3% -1.4 pts
INDIA 29,420 2.9% -1.3 pts
PC+LCV
59% 65% 61% 56% 51% 52% 54%
41% 35% 39% 44% 49% 48% 46%
Q3 2011 Q3 2012 Q3 2013 Q3 2014 Q3 2015 Q3 2016 Q3 2017
International Europe

PROPERTY OF GROUPE RENAULT 9INVESTOR RELATIONS – Q3 2017 PRESENTATION OCTOBER 24TH 2017
SCENIC KWIDKAPTUR / CAPTUR
3rd in segment 2nd in segment
FOCUS ON NEW MODELS (YTD SEPTEMBER PERFORMANCE)
1st in segment
3rd in segment
4th in segment
6th in segment
5th in segment
36% segment share on Sept
KOLEOS
10,337 orders since launch
ZOE
…AND ZOE REMAINS THE BEST SELLING EV IN EUROPE
PROPERTY OF GROUPE RENAULT 10INVESTOR RELATIONS – Q3 2017 PRESENTATION OCTOBER 24TH 2017
Q3 2017 REVENUES & OUTLOOK
02
PROPERTY OF GROUPE RENAULT 11INVESTOR RELATIONS – Q3 2017 PRESENTATION OCTOBER 24TH 2017
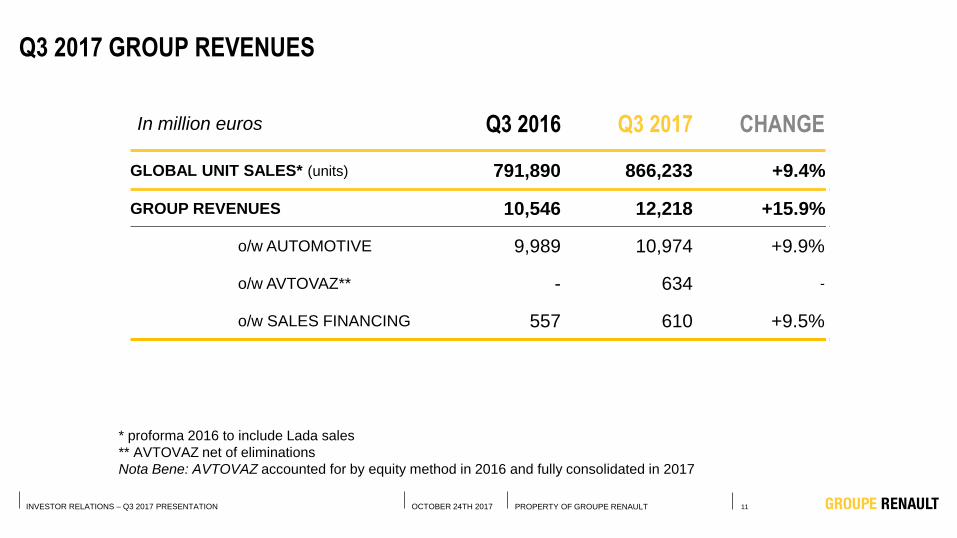
Q3 2017 GROUP REVENUES
In million euros Q3 2016 Q3 2017 CHANGE
GLOBAL UNIT SALES* (units) 791,890 866,233 +9.4%
GROUP REVENUES 10,546 12,218 +15.9%
o/w AUTOMOTIVE 9,989 10,974 +9.9%
o/w AVTOVAZ** - 634 -
o/w SALES FINANCING 557 610 +9.5%
* proforma 2016 to include Lada sales
** AVTOVAZ net of eliminations
Nota Bene: AVTOVAZ accounted for by equity method in 2016 and fully consolidated in 2017
PROPERTY OF GROUPE RENAULT 12INVESTOR RELATIONS – Q3 2017 PRESENTATION OCTOBER 24TH 2017
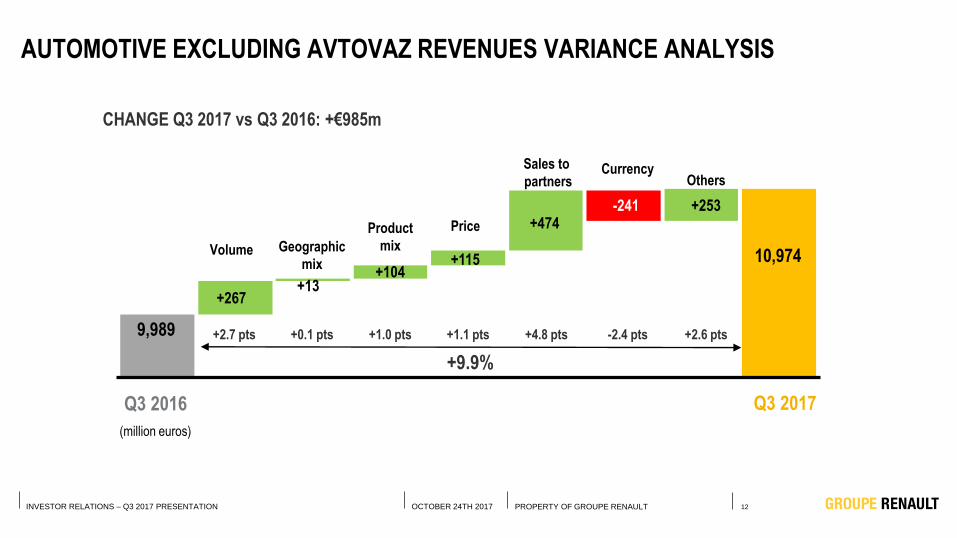
Currency
Volume Geographic
mix
Sales to
partners Others
+9.9%
+2.7 pts +0.1 pts +1.0 pts +1.1 pts -2.4 pts +2.6 pts
Price
+4.8 pts
CHANGE Q3 2017 vs Q3 2016: +€985m
Q3 2016 Q3 2017
(million euros)
Product
mix10,974
9,989
+267
+474
+115+104
+13
+253
-1,036
AUTOMOTIVE EXCLUDING AVTOVAZ REVENUES VARIANCE ANALYSIS
-241
PROPERTY OF GROUPE RENAULT 13INVESTOR RELATIONS – Q3 2017 PRESENTATION OCTOBER 24TH 2017
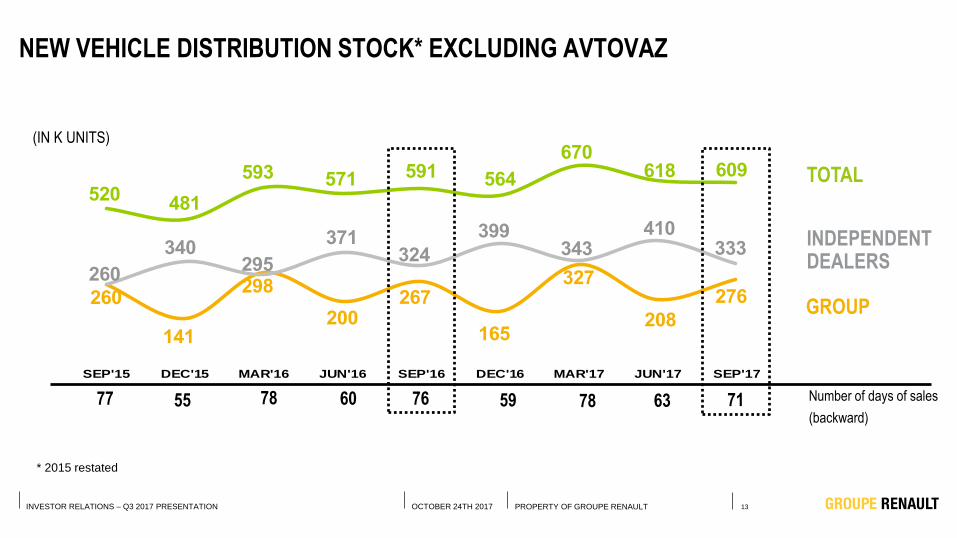
520481
593 571 591 564
670618 609
260
141
298
200267
165
327
208
276260
340295
371324
399343
410333
SEP'15 DEC'15 MAR'16 JUN'16 SEP'16 DEC'16 MAR'17 JUN'17 SEP'17
GROUP
INDEPENDENTDEALERS
TOTAL
Number of days of sales
(backward)
7877 55 60
(IN K UNITS)
76
* 2015 restated
59 78 63
NEW VEHICLE DISTRIBUTION STOCK* EXCLUDING AVTOVAZ
71

PROPERTY OF GROUPE RENAULT 14INVESTOR RELATIONS – Q3 2017 PRESENTATION OCTOBER 24TH 2017
RCI BANQUE PERFORMANCE
Q3 2016 Q3 2017 CHANGE
REVENUES (€m) 557 610 +9.5%
AVERAGE PERFORMING ASSETS (€m) 33,940 40,132 +18.2%
NEW CONTRACTS (units) 381,487 435,066 +14.0%
NEW FINANCINGS (€m) 4,373 5,022 +14.8%

PROPERTY OF GROUPE RENAULT 15INVESTOR RELATIONS – Q3 2017 PRESENTATION OCTOBER 24TH 2017
OUTLOOK 2017
In 2017, the global market should see growth of 2% to 3% (versus +1.5% to +2.5%
previously). The European market is expected to grow around 3% (versus +2% previously).
The French market is expected to expand by around 4% (versus +2% previously).
Outside Europe, the Russian market could grow around 10% (versus more than 5%
previously), and the Brazilian market up to 8% (versus by 5% previously). The growth
momentum is expected to continue in China (around 5%) and India (more than 8%).
INCLUDING AVTOVAZ, THE GROUP CONFIRMS ITS FULL YEAR 2017 GUIDANCE:
Increase Group revenues, beyond the impact of AVTOVAZ (at constant exchange rates)*
Increase Group operating profit in euros*
Generate a positive Automotive operational free cash flow
* compared with 2016 Groupe Renault published results

PROPERTY OF GROUPE RENAULT 16INVESTOR RELATIONS – Q3 2017 PRESENTATION OCTOBER 24TH 2017
QUESTIONS & ANSWERS
03

PROPERTY OF GROUPE RENAULT 17INVESTOR RELATIONS – Q3 2017 PRESENTATION OCTOBER 24TH 2017
APPENDIX
04
PROPERTY OF GROUPE RENAULT 18INVESTOR RELATIONS – Q3 2017 PRESENTATION OCTOBER 24TH 2017
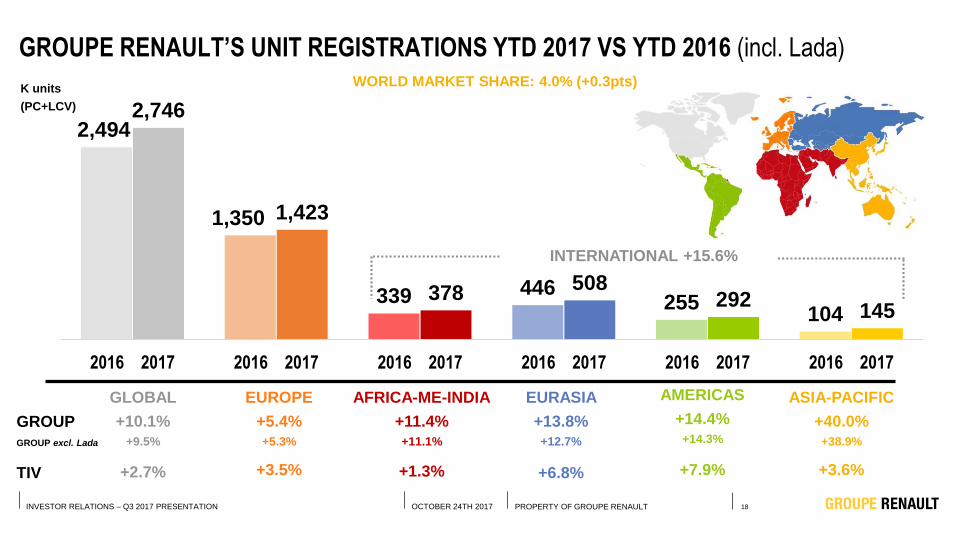
2,494
1,350
339 446255
104
2,746
1,423
378508
292145
2016 2017 2016 2017 2016 2017 2016 2017 2016 2017 2016 2017
GROUPE RENAULT’S UNIT REGISTRATIONS YTD 2017 VS YTD 2016 (incl. Lada)
K units
(PC+LCV)
WORLD MARKET SHARE: 4.0% (+0.3pts)
INTERNATIONAL +15.6%
GLOBAL
+10.1%
+9.5%
EUROPE
+5.4%
+5.3%
AMERICAS
+14.4%
+14.3%
ASIA-PACIFIC
+40.0%
+38.9%
AFRICA-ME-INDIA
+11.4%
+11.1%
EURASIA
+13.8%
+12.7%
+2.7% TIV +3.5% +6.8% +1.3% +7.9% +3.6%
GROUP
GROUP excl. Lada
PROPERTY OF GROUPE RENAULT 19INVESTOR RELATIONS – Q3 2017 PRESENTATION OCTOBER 24TH 2017
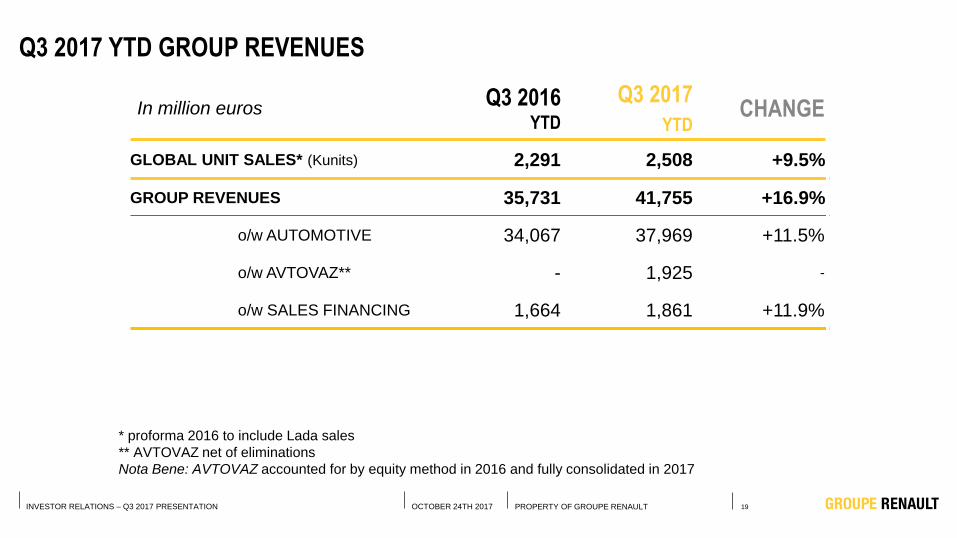
Q3 2017 YTD GROUP REVENUES
In million eurosQ3 2016
YTD
Q3 2017
YTDCHANGE
GLOBAL UNIT SALES* (Kunits) 2,291 2,508 +9.5%
GROUP REVENUES 35,731 41,755 +16.9%
o/w AUTOMOTIVE 34,067 37,969 +11.5%
o/w AVTOVAZ** - 1,925 -
o/w SALES FINANCING 1,664 1,861 +11.9%
* proforma 2016 to include Lada sales
** AVTOVAZ net of eliminations
Nota Bene: AVTOVAZ accounted for by equity method in 2016 and fully consolidated in 2017

PROPERTY OF GROUPE RENAULT 20INVESTOR RELATIONS – Q3 2017 PRESENTATION OCTOBER 24TH 2017
Currency
Volume
Geographic
mix
Sales to
partners
Others
+11.5%
+3.9 pts -0.0 pts +0.7 pts +2.0 pts -0.1 pts +1.8 pts
Price
+3.2pts
CHANGE Q3 YTD 2017 vs Q3 YTD 2016: +€3,902m
Q3 2016
YTD
Q3 2017
YTD
(million euros)
Product
mix37,969
34,067
+1,313
+1,082
+664
+244-3
+649
AUTOMOTIVE EXCLUDING AVTOVAZ REVENUES VARIANCE ANALYSIS
-47

PROPERTY OF GROUPE RENAULT 21INVESTOR RELATIONS – Q3 2017 PRESENTATION OCTOBER 24TH 2017
RCI BANQUE PERFORMANCE YTD
Q3 2016YTD
Q3 2017
YTDCHANGE
REVENUES (€m) 1,664 1,861 +11.8%
AVERAGE PERFORMING ASSETS (€m) 32,590 39,091 +19.9%
NEW CONTRACTS (units) 1,151,792 1,317,692 +14.4%
NEW FINANCINGS (€m) 15,374 15,374 +16.1%