Group Five Online Report 2015 - g5.co.za · GROUP FIVE Online section of the integrated annual...
50
78 GROUP FIVE Online section of the integrated annual report 2015 PEOPLE DELIVERY ON F2015 FOCUS AREAS: In the group’s F2014 integrated annual report, we outlined a number of focus areas. The table outlines how we delivered against these: F2015 FOCUS AREAS DELIVERY Develop a central resource centre to assist with the effective management of industrial action, including a library of standardised documents for use through the group. i A group industrial relations leadership structure was launched during the second quarter. This is a group of the most experienced industrial relations practitioners in the business under the leadership of the group IR specialist. This team is deployed to potential conflict areas when required. i We also created a resource centre on the group’s intranet where all required documents can be sourced, which prevents duplicated effort. Standardise and reinforce best practice consultation on sites. i We launched a proactive communications alert process between site and head office on all sites, which allows for early detection and rapid escalation of IR issues as they arise. This has allowed us to intervene in a number of instances before tensions escalated into industrial action. Revise contracts in line with requirements to the amended Labour Relations Act (LRA). i All employment contracts have been amended to comply with the new LRA and best practice mitigation of perceived risk areas. Proactively engage with various unions and other employee-related governing bodies. i The IR team and executive HR leadership proactively engage in all the employer forums represented at the major bargaining councils. This participation includes representation on all of the major negotiation forums. LABOUR PRACTICES AND DECENT WORK ASPECT 1: Employment 01 ASPECT 4: Training and education 04 ASPECT 3: Health and safety 03 ASPECT 2: Labour/management relations 02 ASPECT 5: Diversity and equal opportunity 05
Transcript of Group Five Online Report 2015 - g5.co.za · GROUP FIVE Online section of the integrated annual...

78
GR
OU
P F
IVE
Onl
ine
sect
ion
of t
he in
tegr
ated
ann
ual r
epor
t 20
15
PEOPLE
DELIVERY ON F2015 FOCUS AREAS:
In the group’s F2014 integrated annual report, we outlined a number of focus areas. The table
outlines how we delivered against these:
F2015 FOCUS AREAS DELIVERY
Develop a central resource centre
to assist with the effective
management of industrial action,
including a library of standardised
documents for use through the
group.
A group industrial relations leadership structure was launched during the second quarter. This is a group of the most experienced industrial relations practitioners in the business under the leadership of the group IR specialist. This team is deployed to potential conflict areas when required.
We also created a resource centre on the group’s intranet where all required documents can be sourced, which prevents duplicated effort.
Standardise and reinforce best
practice consultation on sites.
We launched a proactive communications alert process between site and head office on all sites, which allows for early detection and rapid escalation of IR issues as they arise. This has allowed us to intervene in a number of instances before tensions escalated into industrial action.
Revise contracts in line with
requirements to the amended
Labour Relations Act (LRA).
All employment contracts have been amended to comply with the new LRA and best practice mitigation of perceived risk areas.
Proactively engage with various
unions and other employee-related
governing bodies.
The IR team and executive HR leadership proactively engage in all the employer forums represented at the major bargaining councils. This participation includes representation on all of the major negotiation forums.
LABOUR PRACTICES AND DECENT WORK
ASPECT 1:Employment01 ASPECT 4:
Training and education
04
ASPECT 3:Health and safety03
ASPECT 2:Labour/management relations
02 ASPECT 5:Diversity and equal opportunity
05

79
F2015 FOCUS AREAS DELIVERY
Recruit additional top talent to
improve the depth and diversity of
our teams and to ensure that we
can take advantage of growth
opportunities.
We recruited a specialist transformation director and five key operational directors to ensure we have both the capacity and experience to improve our diversity
Roll out our central talent
management and manpower
planning function to ensure a more
co-ordinated approach to
succession planning.
A specialist team that co-ordinates talent management, workforce planning and recruitment was created to increase the standardisation of talent management and succession planning processes
Supervisor and management
training will be intensified to
enforce on-site adherence to group
practices and procedures.
The group launched a number of major interventions to refresh our standard group practices and procedures. This includes in-depth training of employee and industrial relations processes, our contract lifecycle and our new code of conduct
INTRODUCTION
Group Five is cognisant of the fact that the quality of its
employees is both the single largest risk and the most effective
risk mitigation with respect to the successful delivery of its
strategy. We are committed to the creation of a working
environment and value proposition which is competitive and
attractive to our employees and prospective employees to enable
us to attract and retain the talent required to ensure the
successful delivery of contracts and our sustainability.
The group’s employee value proposition consists of:
QUALITY PEOPLE MANAGEMENT AND PEOPLE MANAGEMENT SYSTEMS
CONTINUOUS DEVELOPMENT THROUGH OUR TRAINING PROGRAMMES
COMPETITIVE REMUNERATION
CAREER DEVELOPMENT OPPORTUNITIES
TALENT MANAGEMENT
A VALUES-BASED ORGANISATION

GR
OU
P F
IVE
Onl
ine
sect
ion
of t
he in
tegr
ated
ann
ual r
epor
t 20
15
80
(R’000) 2015 2014
AGGREGATE FINANCIAL INFORMATION continuedSTATEMENT OF CASH FLOW FOR THE YEAR ENDED 30 JUNE
Group’s proportionate share of cash flows
Cash flow from operating activities (1 666) 502
Steel supply (4 051) 391Property development 2 385 111
Cash flow from investing activities (2 648) 12 272
Steel supply 361 3 256Property development (3 009) 9 016
Cash flow from financing activities 1 154 (8 149)
Steel supply 688 1 367Property development 466 (9 516)
Net (decrease)/increase in cash and cash equivalents (3 160) 4 625
Steel supply (3 002) 5 014Property development (158) (389)
There are no additional contingent liabilities that the group is aware of that require disclosure which have not been disclosed in note 23.
ANNEXURE 5 – INVESTMENT IN JOINT VENTURES
continued

81
BENEFITS TO PERMANENT EMPLOYEES continued
LONG SERVICE LEAVE
After five years Additional three days per annum
After ten years Additional two days per annum and once-off five days’ leave
FLEXI-TIME
Core hours 09:00 to 15:00 Integrated central office
CRÉCHE FACILITY
Up to Grade R Integrated central office
GYM FACILITY
Fully equipped with instructors Integrated central office
CANTEEN FACILITY
Providing full catering function Integrated central office
TOLL SUBSIDY
R450 per month Integrated central office
TRAVEL ALLOWANCE
Based on AA rates and individual requirement
All qualifying employees
The benefits apply to all monthly-paid employees (mostly employees in Paterson grade C1 and more senior and those not covered by a collective bargaining arrangement).
The latest amendments to the Labour Relations Act make it necessary for both contract and permanent employees earning below the defined income threshold of R205 433.30 per annum, who are not covered by a collective agreement and who are working in South Africa, to enjoy equal benefits after three months of employment.
However, all employees below this threshold are covered by one of the multiple collective bargaining arrangements applicable across the group. Whilst their benefits may, therefore, differ from the table above they are consistent within their ranks.
82
GR
OU
P F
IVE
Onl
ine
sect
ion
of t
he in
tegr
ated
ann
ual r
epor
t 20
15PEOPLE / LABOUR PRACTICES AND DECENT WORKcontinued
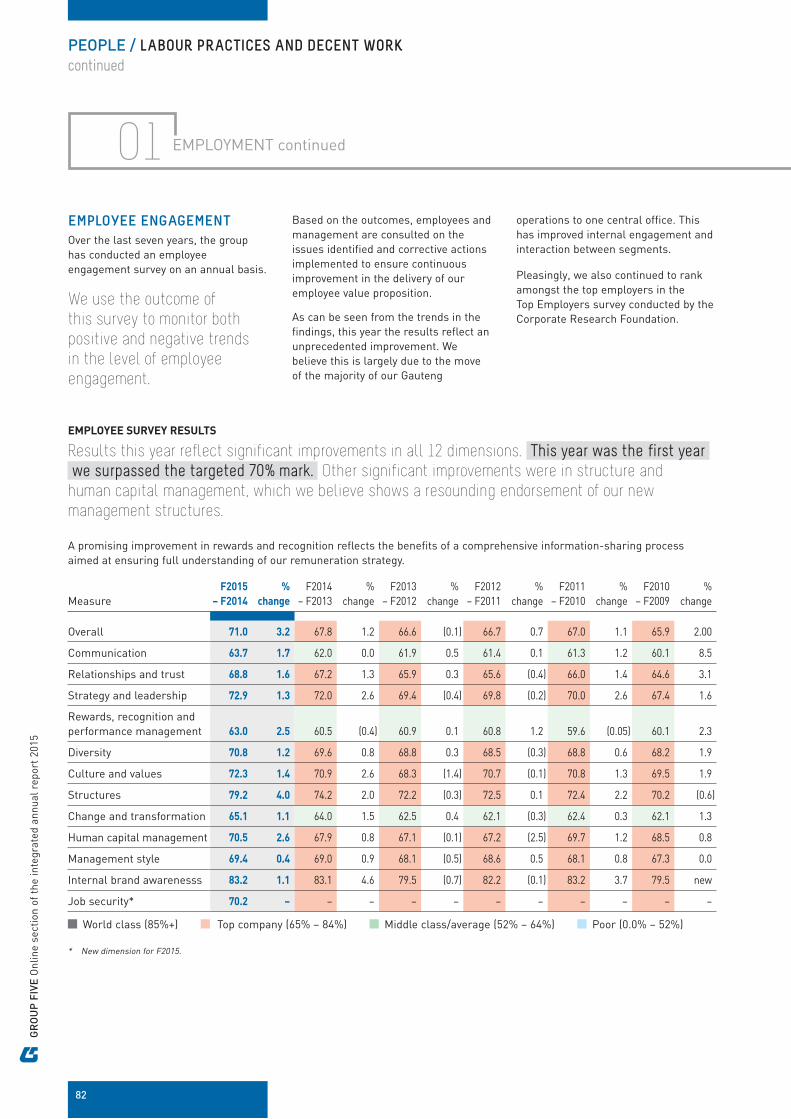
EMPLOYEE ENGAGEMENTOver the last seven years, the group has conducted an employee engagement survey on an annual basis.
We use the outcome of
this survey to monitor both
positive and negative trends
in the level of employee
engagement.
EMPLOYEE SURVEY RESULTS
Results this year reflect significant improvements in all 12 dimensions. This year was the first year we surpassed the targeted 70% mark. Other significant improvements were in structure and
human capital management, which we believe shows a resounding endorsement of our new
management structures.
A promising improvement in rewards and recognition reflects the benefits of a comprehensive information-sharing process aimed at ensuring full understanding of our remuneration strategy.
MeasureF2015
– F2014
%
change
F2014– F2013
%change
F2013– F2012
%change
F2012– F2011
%change
F2011– F2010
%change
F2010– F2009
%change
Overall 71.0 3.2 67.8 1.2 66.6 (0.1) 66.7 0.7 67.0 1.1 65.9 2.00
Communication 63.7 1.7 62.0 0.0 61.9 0.5 61.4 0.1 61.3 1.2 60.1 8.5
Relationships and trust 68.8 1.6 67.2 1.3 65.9 0.3 65.6 (0.4) 66.0 1.4 64.6 3.1
Strategy and leadership 72.9 1.3 72.0 2.6 69.4 (0.4) 69.8 (0.2) 70.0 2.6 67.4 1.6
Rewards, recognition andperformance management 63.0 2.5 60.5 (0.4) 60.9 0.1 60.8 1.2 59.6 (0.05) 60.1 2.3
Diversity 70.8 1.2 69.6 0.8 68.8 0.3 68.5 (0.3) 68.8 0.6 68.2 1.9
Culture and values 72.3 1.4 70.9 2.6 68.3 (1.4) 70.7 (0.1) 70.8 1.3 69.5 1.9
Structures 79.2 4.0 74.2 2.0 72.2 (0.3) 72.5 0.1 72.4 2.2 70.2 (0.6)
Change and transformation 65.1 1.1 64.0 1.5 62.5 0.4 62.1 (0.3) 62.4 0.3 62.1 1.3
Human capital management 70.5 2.6 67.9 0.8 67.1 (0.1) 67.2 (2.5) 69.7 1.2 68.5 0.8
Management style 69.4 0.4 69.0 0.9 68.1 (0.5) 68.6 0.5 68.1 0.8 67.3 0.0
Internal brand awarenesss 83.2 1.1 83.1 4.6 79.5 (0.7) 82.2 (0.1) 83.2 3.7 79.5 new
Job security* 70.2 – – – – – – – – – – –
World class (85%+) Top company (65% – 84%) Middle class/average (52% – 64%) Poor (0.0% – 52%)
* New dimension for F2015.
01 EMPLOYMENT continued
operations to one central office. This has improved internal engagement and interaction between segments.
Pleasingly, we also continued to rank amongst the top employers in the Top Employers survey conducted by the Corporate Research Foundation.
Based on the outcomes, employees and management are consulted on the issues identified and corrective actions implemented to ensure continuous improvement in the delivery of our employee value proposition.
As can be seen from the trends in the findings, this year the results reflect an unprecedented improvement. We believe this is largely due to the move of the majority of our Gauteng

83
DISCIPLINARY AND GRIEVANCE POLICY/PROCEDURESThe group has focused on providing comprehensive training in terms of both our code of conduct and our grievance and disciplinary codes to ensure that all line managers are well equipped to handle matters.
The company’s disciplinary policy and procedure provides clear guidance on how managers are expected to deal with cases of misconduct and unsatisfactory performance. The disciplinary code provides directives on how offences warrant progressive
discipline and where more serious penalties such as dismissals are indicated.
The group’s grievance policy allows an employee to raise and express any dissatisfaction with management’s conduct or treatment and also allows for conflict resolution between employees at the same level. If the grievance remains unresolved after the first engagement, the employee may escalate the grievance to senior management for a final ruling on the matter. Once management has ruled on a grievance, the employee has the right to refer disputes to the CCMA for final resolution.
FORMAL PERFORMANCE MANAGEMENT SESSIONSManagers are required to provide their employees with formal appraisals of their performance at least once a year. Employees also participate in the development of a personalised training and development plan on an annual basis.
Although this year’s overall percentage completed increased to what has been the norm in previous years, more work is required to ensure consistency. Following training through our Group Five Academy on how to conduct more effective performance reviews, training needs and career path discussions are being more directly addressed at performance reviews.
2015 2014 2013 2012 2011 2010 2009 2008
% 82.0 78.2 83.0 82.0 74.5 67.0 52.9 45.7
CURRENT EXECUTIVE AND SENIOR MANAGEMENT APPOINTMENT SPLITAs part of our employee value proposition, the group aspires to provide career and personal development opportunities to all our employees. A key measure of our success is the number of senior management appointments made from within the ranks of our employees. The table below reflects how many of our current senior managers (Paterson grade D upper and more senior) were promoted into their current positions compared to those who were appointed into positions from outside the group.
91 out of 109 (83%) of the current senior management positions are held by employees
promoted from within the group.
Category
Female Male
TotalBlack White Total Black White Total
F2015 F2014 F2015 F2014 F2015 F2014 F2015 F2014 F2015 F2014 F2015 F2014 F2015 F2014
External appointment 3 3 0 2 3 5 7 8 8 8 15 21 18 21Internal appointment 1 1 8 7 9 8 14 14 68 63 82 72 91 85
Total 4 4 8 9 12 13 21 22 76 71 97 93 109 106

84
GR
OU
P F
IVE
Onl
ine
sect
ion
of t
he in
tegr
ated
ann
ual r
epor
t 20
15PEOPLE / LABOUR PRACTICES AND DECENT WORKcontinued
01 EMPLOYMENT continued
BREAKDOWN BY GEOGRAPHY AND GENDER (PERMANENT AND CONTRACT-SPECIFIC EMPLOYEES)The table below indicates the split of our workforce between permanent employees and those employed on a contract-specific or limited duration basis in South Africa and over-border.
Of the 24% of our workforce outside of South Africa, 92% of these employees are employed on a contract-specific basis. This is consistent with our policy of utilising and developing local labour and reducing our dependence on expensive expatriate labour in all but specialised positions. In South Africa, the component of temporary employees is 58%, again consistent with our policy to provide permanent work where possible, but to retain contract-specific employment when warranted for operational requirements.
Male Female Total
Location F2015 % F2014 % F2015 % F2014 % F2015 % F2014 %
International 1 968 19 3 084 24 431 22 370 19 2 399 20 3 418 24
Contract-specific 1 139 58 2 831 93 355 82 318 86 1 494 62 3 149 92
Permanent employees 829 42 217 7 76 18 52 14 905 38 269 8
Local 8 238 81 9 442 76 1 541 78 1 625 81 9 779 80 11 067 76
Contract specific 4 866 59 5 655 60 718 47 803 49 5 584 57 6 458 58
Permanent employees 3 372 41 3 787 40 823 53 822 51 4 195 43 4 609 42
Total 10 206 100 12 490 100 1 972 100 1 995 100 12 178 100 14 485 100
VACANCY ANALYSISWhilst still high at 2.2%, the year-on-year reduction in vacancies was due to our improved internal recruitment service and the slowdown in certain significant areas within the group.
% F2015 F2014 F2013 F2012 F2011 F2010 F2009 F2008 F2007
Vacancy analysis 2.2 5.1 8.0 <1 <1 2.0 10.0 12.2 11.7

85
Notwithstanding the
increased volatility, the
actual number of work
stoppages and work
interruptions declined
again this year. This was
mainly due to proactive
and direct intervention by
the group in potentially
volatile labour situations
and the increased use of
community liaison
officers. This improved
our capacity to anticipate
issues and resolve them
before they escalate.
ASPECT 2:LABOUR/MANAGEMENT RELATIONS 02
INTRODUCTION
The group’s employee
relations strategy is regulated
and supported by best
practice policies and
procedures, underpinned by
legislation in the territories
where we operate.
From an organisational perspective, the employee relations function is led by the group executive director of human resources (HR). He is supported at a corporate level by the HR director: operations and services and the group industrial relations specialist who is a qualified labour attorney.
To ensure the consistent application of both policy and best practice, during the year we created a group industrial relations leadership structure. This is a central team comprising a number of senior employees representing the central office and senior representatives
from within the business. This body serves as a sounding board for policy and practice development and a pool from which resources are drawn to deal with employee relations issues when they arise.
Labour action in the group’s home market of South Africa continued, with man days lost staying constant at 24 209 in F2015 (F2014: 24 441). The largest contributor to the days lost in the period (39%) was the strike called by NUMSA in support of the wage dispute that arose at the Mechanical and Engineering Industry Bargaining Council (MEIBC).
The trend of unprotected strikes continued, with 63% of the man days lost attributable to unprotected industrial action. This trend was particularly prevalent on the group’s Dedisa Peaking Power Plant in the Eastern Cape. This contract alone accounted for 29% of the group’s total man days lost and 46% of the man days lost due to unprotected industrial action.
The group is represented on all major industry negotiating forums.
LEVEL OF UNIONISATION OF THE TOTAL WORKFORCE (BOTH LOCAL AND INTERNATIONAL (F2009 – F2015))The table below shows that whilst there has been a steady increase in the number of unionised employees since 2012, this trend seems to have stabilised at 17% of our South African workforce. In real terms union membership this year decreased to 2 115 members compared to last year’s 2 494 members. This reduction can largely be attributed to the large-scale retrenchments in our Civil Engineering segment.
Level of unionisation of the total workforce (both local and international (F2009 – F2015))
F2015 F2014 F2013 F2012 F2011 F2010 F2009
Total employee headcount (all employees) 12 178 14 485 13 659 10 846 11 997 12 497 14 050
Number of unionised employees 2115 2 494 2 120 2 039 2 285 2 416 1 752
Union membership as % of total workforce 17 17 15 18 19 19 12

86
GR
OU
P F
IVE
Onl
ine
sect
ion
of t
he in
tegr
ated
ann
ual r
epor
t 20
15PEOPLE / LABOUR PRACTICES AND DECENT WORKcontinued
PEOPLE / LABOUR PRACTICES AND DECENT WORKcontinued
02 LABOUR/MANAGEMENT RELATIONS continued
This year saw a 33% reduction in the number of CCMA referrals from 108 to 73 . This reduction can be largely
attributed to the rigorous retraining of our managers in the
required processes and procedures and the consistent
adherence to the legislated notice periods.
CCMA CASES We are, however, disappointed by the reduction in the number of cases won at arbitration from 98% to 88%. This decrease compared to last year appears to be based on inconsistent judgements made as a result of uncertainty around amendments promulgated to the Labour Relations Act (Act 66 of 1995), which was effective in January 2015.
F2015 F2014 F2013 F2012 F2011 F2010 F2009 F2008 F2007
Referrals(number of cases) 73 108 53 68 95 108 38 48 38
PROPORTIONAL UNION REPRESENTATION AS A PERCENTAGE OF THE SOUTH AFRICAN WORKFORCEThe overall level of unionisation dropped during the year in both real and percentage terms, primarily as a result of the erosion of the membership in BCAWU, NUM and NUMSA. The only union that made substantial gains was AMCU with an increased membership from 1% to 2% of the national workforce, but more significantly from less than 1% to about 8% of the KwaZulu-Natal workforce.
% split AMCU BCAWU BWAWUSA GIWUSA NUM NUMSA SACWU SATAWU Total
2015 1.96 1.46 0.29 1.20 9.46 2.22 0.42 2.58 19.59
2014 0.07 2.42 0.29 1.34 11.33 3.01 0.34 2.36 21.16
2013 0.09 1.66 0.48 1.80 11.86 0.36 0.40 2.80 19.45
AMCU – Allied Mining and Construction UnionBCAWU – Building Contractors and Allied Union WorkersBWAWUSA – Building, Wood and Allied Workers Union of South AfricaGIWUSA – General Industries Workers Union of South Africa
NUM – National Union of MineworkersNUMSA – National Union of MetalworkersSACWU – SA Chemical Workers UnionSATAWU – South African Transport and Allied Workers Union

87
INCIDENCE AND IMPACT OF STRIKES
The table below reflects the incidence and impact of strikes in man days lost across the group’s clusters. As can be seen, 26 out of the 29 strikes were unprotected, which means it happened without employees and/or unions following CCMA dispute referral processes.
Incidence and impact of strikes in man days lost across the group’s clusters
Business clusterNumber
of strikes UnionProcedural
strikesTotal
man days lost
ENGINEERING & CONSTRUCTION 27 15 726Building 1 N/A 0 44Housing 2 N/A 0 890Civil Engineering 9 NUM 1 3 432Oil & Gas 1 NUMSA 0 800Projects 14 NUMSA/AMCU 0 10 560
MANUFACTURING 2 8 484BRI 1 NUMSA 1 2 212G5 Pipe 1 NUMSA 1 6 272
Grand total 29 3 24 210
NOTICE PERIODS REGARDING OPERATIONAL CHANGESThe group has an early engagement policy to maintain employee morale and industrial harmony during site demobilisation and operational reorganisation. This is outlined below.
LIMITED DURATION CONTRACT EMPLOYEES (LDCs)
As our tendered contract-based workflow often makes it difficult to predict the precise number of employees required, the group makes extensive use of flexible LDCs. These employees are treated in the same manner as our permanent employees whilst they are in our employ. They are regularly informed of the duration and continuity of their employment to allow their planning in terms of contract completion times.
Limited duration
contracts specify
anticipated contractual
termination date.
01
Employees are
informed of programme
changes as a result
of delays and/or
acceleration at weekly
site/toolbox meetings.
02
Employees are given
notice in compliance
with the Basic Conditions
of Employment Act
based on the completion
date of the contract.
03

88
GR
OU
P F
IVE
Onl
ine
sect
ion
of t
he in
tegr
ated
ann
ual r
epor
t 20
15
LABOUR/MANAGEMENT RELATIONS continued
PEOPLE / LABOUR PRACTICES AND DECENT WORKcontinued
02
PERMANENT EMPLOYEESNON-UNIONISED EMPLOYEES
Employees are kept informed of organisational challenges through regular briefings, with a minimum of one month’s notice given to allow employee input and consultation.
Consultations in accordance with the Labour Relations Act (LRA) Section 189 and/or 189A take place over a prescribed minimum period of one and two months respectively. The purpose of these consultations is to attempt to avoid job losses and/or reach consensus on issues such as severance payment and timing of exit.
Employees are paid in lieu of their contractual notice in accordance to the Basic Conditions of Employment Act (BCEA).
UNIONISED EMPLOYEES
Collective bargaining agreements specify the processes to be followed in the instance of contemplated job losses due to operational requirements. The group forms part of agreements with the Steel and Engineering Industries Federation of South Africa (SEIFSA), the South African Forum of Civil Engineering Contractors (SAFCEC), the Bargaining Council of the Civil Engineering Industry, the Construction Industry Bargaining Council (CIBC), the Gauteng Building Voluntary Bargaining Forum (GBVBF) and various regional bargaining councils.
Where the group operates outside the jurisdiction of a collective agreement or bargaining council, we enter into recognition and procedural agreements with organised labour to establish which processes should be followed.
interventions to our practitioners to ensure a consistent and predictable approach.
With the help of the group IR leadership structure we will further develop standardised policy and procedure documentation for use across the group. A key focus will remain compliance with the unfolding requirements of the revised labour law dispensation in the markets where we operate.
We will continue to proactively engage with various unions and other employee-related governing bodies to ensure we can anticipate both trends and risks facing the group, while ensuring input into both debate and policy formation.
FOCUS GOING FORWARD
The key focus going forward will be to further improve management and employee relationships and communication on our sites. In addition, in light of the increase in the incidence and number of unprotected strikes, we have decided to ensure that all employees understand that we will not tolerate unprotected strikes. This policy will entail the refusal to negotiate with employees whilst they are engaged in unprotected industrial action and the issuing of ultimatums with the potential for dismissal of striking workers should they not return to work in a reasonable time.
To support a quality employee relations offering, we will continue recruiting top talent and developing and providing a series of training

89
HEALTH
This section covers both occupational and employee health issues.
DELIVERY ON F2015 FOCUS AREAS:In the group’s F2014 integrated annual report, we outlined a number of focus areas. Below we outline how we delivered against these:
F2015 FOCUS AREAS DELIVERY
Continued improvement of the
implementation and management of
health and safety in each segment.
The promotion of our integrated employee wellness programme resulted in a decrease in unfit and temporary fit cases. A central clinic was established to perform medicals for all relevant employees based in Gauteng. If successful, this will be expanded to other provinces to ensure a high standard across all contracts
With the newly promulgated
construction regulations released
during the year, the group needs to
continue focusing on the successful
management of risk-based
medicals.
A programme of compiling individual work risk exposure profiles was rolled out. The management of Group Five’s health programme by a specialist external provider has ensured a high standard of quality, cost savings and legal compliance
Basic health risk assessments per
site to further govern focus per
contract.
Current risk assessments were refocused on relevant site-specific requirements rather than generic testing. This ensured more efficient management of personal work risk exposure profiles
INTRODUCTION
Group Five continues to work with an external industry leader in
occupational health services to provide comprehensive and
cost-effective healthcare solutions as part of the group’s
objective of zero harm.
During the year, a new database was created where data collected from medical surveillance can be captured for analysis and reporting to ensure standardisation and group efficiencies.
Group Five strives to obtain a return on investment for medical surveillance compliance and management of employees of concern. Following continued focus on
improvements, we have experienced shorter return to work
times for employees of concern* and a decrease in the impact
of chronic illnesses on productivity.
* Employees of concern are employees with medical conditions that increase the risk of injury or illness when exposed to health and safety risks on site.
ASPECT 3:HEALTH AND SAFETY 03

90
GR
OU
P F
IVE
Onl
ine
sect
ion
of t
he in
tegr
ated
ann
ual r
epor
t 20
15PEOPLE / LABOUR PRACTICES AND DECENT WORKcontinued
03 HEALTH AND SAFETY continued
MEDICAL SURVEILLANCEGroup Five’s medical surveillance programme is managed through site-based clinics and an accredited service provider network.
To ensure a uniform standard
across different segments,
a new central clinic was
established in Gauteng.
It will have the ability to perform up to 100 medicals per day when it becomes fully operational by the end of calendar 2015. The clinic is
run by the group’s external
health service provider.
To support the group’s expansion across Africa, our health service provider offers a network of leading services through
their own national and international footprint. This offers Group Five access to services even in remote areas. This structure allows fast and effective management of chronic conditions and rehabilitation and specialist referrals for employees of concern.
MEDICAL EXAMINATIONSThe information on the next few pages outline the number of employee medicals conducted during the year, with the main issues identified.
Hypertension continues to be the key issue for the group. To address this, all newly diagnosed cases are counselled on the condition, referred for management to their own medical practitioner or provincial clinic and a follow-up medical evaluation booked within ten days. The employee is only declared fit to work once the feedback report is received.
MEDICAL EXAMINATIONS
Pre-employment
medicalsPeriodicalmedicals
Exitmedicals
Travelmedicals
F2014/2015 2 685 2 886 2 091 60F2013/2014 4 809 2 980 1 605 75F2012/2013 2 765 1 748 973 90F2011/2012 1 839 3 964 2 521 231F2010/2011 2 976 1 789 762 147

91
ENGINEERING &
CONSTRUCTIONMANUFACTURING
INVESTMENTS &
CONCESSIONS
02
01 03
Medicals completed
Number of
medicals
Pre-employment medicals 2 305
Periodic medicals 2 778
Exit medicals 2 028
Travel medicals 58
Main concerns
Uncontrolled hypertension/possible noise-induced hearing loss
Medicals completed
Number of
medicals
Pre-employment medicals 76
Periodic medicals 566
Exit medicals 27
Travel medicals –
Main concerns
Uncontrolled hypertension/diabetes
Medicals completed
Number of
medicals
Pre-employment medicals 23
Periodic medicals 413
Exit medicals 39
Travel medicals 1
Main concerns
Uncontrolled hypertension

92
GR
OU
P F
IVE
Onl
ine
sect
ion
of t
he in
tegr
ated
ann
ual r
epor
t 20
15PEOPLE / LABOUR PRACTICES AND DECENT WORKcontinued
CLINICAL AND LIFESTYLE RISKS Mounting scientific evidence links employee wellness to their company’s productivity. It is also estimated that approximately half of corporate healthcare spend is due to lifestyle risk factors. The workplace provides a unique setting to promote a holistic and supportive approach to health.
Lifestyle risk factors lead to
clinical risk factors which
strongly influence the
likelihood of developing
chronic diseases. This will
remain a focus area for the
group, as approximately 60%
of deaths in the world today
can be attributed to chronic
diseases.
LIFESTYLE RISKS OF EMPLOYEES
The table below summarises each of the four lifestyle risk factors assessed during the group’s Wellness Days, as well as the percentage of the workforce that is at risk in each of these four categories. A risk indicator (red, orange or green) provides a sense of the severity of each risk for employees.
LIFESTYLE RISK
Riskindicator
%at risk Definition
Smoking status 21 Employees who smoke
Alcohol consumption 7 Employees who consume 3+ drinks per day
Nutritional intake 83 Employees who have <5 vegetable and fruit servings per day
Physical activity 60 Employees who exercise for <150 minutes per week
“Lifestyle score” for the group
LIFESTYLE SCORE
Riskindicator Definition
1.7 Employees who smoke
03
The research outlined in this online section of the integrated annual report was gathered during the group’s Wellness Days held between June and November 2014.
PARTICIPATION DEMOGRAPHICS
473 employees attended the Wellness Days, with the average age being 40. Wellness day attendance is voluntary and takes place at the central office. The attendance this year was 2% higher than last year’s attendance, which was already a high base.
The breakdown by age and gender of these attendees is shown below:
30 – 39 40 – 49 50+
40 20 81 92 60 60 55 45
Age distribution (years)
Males Females
Number of attendees
‹30
HEALTH AND SAFETY continued

93
Clinical risks of our employees
LIFESTYLE RISK
Riskindicator
%at risk Definition
Body mass index (BMI) 68 Employees with a non-normal BMI
Waist circumference 32 Employees with a non-normal waist circumference
Blood pressure 25 Hypertensive employees
Cholesterol 40 Employees with a level >= 5.0 mmol/l
Glucose 6 Employees with a level >= 7.8 mmol/l
Chronic disease 26 Employees with at least one chronic disease
Body mass index
“Clinical score” for the group
CLINICAL SCORE
Riskindicator Definition
1.7 Average number of clinical risk factors per employee
OVERALL RISKS OF OUR EMPLOYEES – DISTRIBUTION OF RISK FACTORS (% OF EMPLOYEES)
These four lifestyle risks and six clinical risks are combined to provide a distribution of the number of risk factors across our employee base.
41% of employees who attended the Wellness Days have three or four risk factors, whilst 19% have
more than five risk factors.
4 13
Distribution of risk factors (% of attendees)
Number of risk factors
0
22 23 18 9 5 31
2
1 2 3 4 5 6 7 8 9 10
0

94
GR
OU
P F
IVE
Onl
ine
sect
ion
of t
he in
tegr
ated
ann
ual r
epor
t 20
15PEOPLE / LABOUR PRACTICES AND DECENT WORKcontinued
03
The average number of risk factors per employee (lifestyle and clinical risk factors combined) gives an overall risk score:
OVERALL SCORE
Riskindicator Definition
1.7 Average number of combined risk factors per employee
The overall group score is lower than the industry average of 3.2 health risks per employee.
ACTIONS
To further educate our
employees on making healthy
lifestyle choices, we created a
group integrated wellness
committee that disseminates
important health and wellness
messages through information
campaigns down to site level
across all our operations in
South Africa and the rest of
Africa. The committee
comprises management and
health and wellness experts.
Further monitoring of employees across the group will continue. Group Five endeavours to empower our employees to make healthy lifestyle choices by providing the benefits of regular wellness days, gym facilities and access to on-site clinic services where possible.
The company also contracted the services of an employee wellbeing company to provide support with financial, relationship, psychological and physical wellness of employees and their dependants. Induction sessions were rolled out across all segments between January 2015 and May 2015. This focused on creating awareness of services available and resulted in the following engagements:
HEALTH AND SAFETY continued
POINT OF CONTACT
Number of
employees % of cases
% of total
employees
Telephone 63 2.99 0.67
E-mail 23 1.09 0.25
E-support 1 0.05 0.01
SMS 6 0.29 0.06
Training 16 969 80.57 18.15
Meetings 5 0.24 0.05
Website 22 1.05 0.24
Wellness days 289 13.73 3.09
Overall engagement refers to all the points of contact with beneficiaries of the Group Five employee assistance programme. Engagement levels are an indication of heightened awareness of the services, with 22.5% contact with employees. This is particularly pleasing after only four months since inception.
HEALTH TRAININGThe health and safety teams work with the group’s internal university, the Group Five Academy, to offer specialist training programmes. The Academy partners with all disciplines in the group to identify training requirements. A specific requirement for health and safety training was recently identified. In conjunction with the SHE management team, improvements were made to ensure a focused training programme, as well as one training provider to deliver effective health and safety training throughout the group. In the last year, 2 361 employees attended training.
MALARIA MANAGEMENTThere was a significant reduction in reported malaria cases since last year, mainly due to last year’s base being particularly high due to increased operations in West Africa and the DRC. These areas are extremely remote and experience very high rainfall with scattered communities that have over the years become semi-immune to malaria infection. Our expatriate employees coming from protected environments are very susceptible to malaria infection.
Number of malaria cases
F2015 F2014 F2013 F2012 F2011 F2010 F2009
Number of malaria cases 139 253 176 128 32 50 125

95
We continue to implement site vector control and to educate employees on preventative measures.
Preventative measures include:
Camp and recreational areas are treated, which includes spraying that is effective for three months
Employees are issued with mosquito repellents Malaria prophylaxis tablets are provided to employees A policy that enforces only long trousers and long sleeve shirts on sites to
protect against both malaria and skin cancer
HIV AND AIDS AWARENESS & TRAINING Group Five adopted a holistic health and wellness model in F2013. The company has a policy on HIV/Aids which encourages ongoing training, awareness, counselling and testing. The policy also covers the important aspect of confidentiality of testing outcomes for all employees. No employee is unfairly discriminated against based on their HIV status. Treatment of those infected is facilitated either through medical aid or government health systems.
The group implemented a 24-hour toll-free line available for professional counselling to employees and members of their families. HIV positive employees are supported to stay healthy and to lead productive lifestyles. Those who test negative are encouraged to maintain their negative status.
The group’s HIV/Aids awareness campaign, “Know your Status” continues to be driven through our more than 100 workplace peer educators (WPEs). These educators have been trained to counsel and facilitate the professional testing of employees within their respective segments and construction sites.
HIV/AIDS TESTING
The HIV and Aids awareness, counselling and testing (ACT) offering was included as an employee benefit under the group’s human resources benefits in F2012. 3 255 employees were counselled in F2015, and 2 613 were tested. The significant drop in numbers of employees trained and tested can be attributed to the winding down and closure of some of our mega-contract sites, as well as the downsizing of some of our segments during the course of the reporting year. However, it is pleasing to note that the prevalence rate is showing a decline compared to previous years. The table below summarises our training, testing and prevalence statistics:
FOCUS GOING FORWARD
The focus in the coming year will be on increasing the number of employees who attend the new, central Gauteng clinic to improve the standard of medical surveillance and manage temporary disability cases to ensure early return to work.
The new database will ensure the more efficient identification of health risk trends per contract and will allow the team to implement corrective action plans.
During the coming year, we will further refine our testing of health risks by making them more relevant to each site or area to prevent cost wastage from generic testing.
Number ofemployees trained
(awareness provided)
Number ofemployees counselled
and testedPrevalence
rate
F2009/F2010 6 426 6 156 18.0%
F2010/F2011 4 492 4 184 16.5%
F2011/F2012 6 281 6 089 17.3%
F2012/F2013 9 919 8 905 15.0%
F2013/F2014 4 808 4 142 17.7%
F2014/F2015 3 255 2 613 14.0%

96
GR
OU
P F
IVE
Onl
ine
sect
ion
of t
he in
tegr
ated
ann
ual r
epor
t 20
15PEOPLE / LABOUR PRACTICES AND DECENT WORKcontinued
03
SAFETY
DELIVERY ON F2015 FOCUS AREAS:In the group’s F2014 integrated annual report, we outlined a number of focus areas. Below we outline how we delivered against these:
F2015 FOCUS AREAS DELIVERY
Make safety performance a more
onerous metric of management’s
variable pay.
Safety performance is now included in the short term incentive calculation for all executives and managers
Drive executive accountability
through investigation and corrective
action by management teams and
not only safety teams.
Executive management are involved in all serious incident investigations (single and multiple fatalities) and are responsible for presenting the full investigation report to the board. Safety continues to be a key performance indicator for executives and senior management
Registration of safety practitioners. Registration and competence evaluation is well on track
Restructure the safety
organisational structure to ensure
fully trained and competent
individuals are deployed to sites.
An improved safety structure is now in place and career paths were developed for all SHE professionals
INTRODUCTION
The focus on implementing the group’s zero harm campaign
resulted in a very pleasing decrease in our lost-time injury
frequency rate (LTIFR) from 0.17 to 0.15. This, combined with no
fatalities, is an outstanding achievement and very pleasing to
the management team.
The improvement was achieved due to a focus on conducting internal audits to identify the causes of injuries and implementing corrective actions, as well as generating mitigating strategies and risk rankings for high and extreme risks.
HEALTH AND SAFETY continued
0.17 to 0.15
LTIFR IMPROVED FROM
FATALITIESzero

97
SAFETY – GROUP CUMULATIVE SAFETY STATISTICS
Clusters/segments
Cumulative from July 2014 to June 2015 – F2015
Manhours
First-aid
cases FAFR**
Non-lost-time
injurycases NLTIFR
Lost-time
injurycases
Occu-pational
diseasesreported
Fatalinjuries
CurrentLTIFR#
Environ-mental
incidentsreported
Siteinspectionsconducted
Near misses
ENGINEERING & CONSTRUCTION
Building & Housing – Building 10 129 594 159 3.14 31 0.61 11 – – 0.22 – 60 2 879Building & Housing – Housing 4 500 212 59 2.62 8 0.36 – – – 0.00 – 44 223Building & Housing – Coastal 12 271 548 180 2.93 49 0.80 6 – – 0.10 – 55 1 395Civil Engineering 18 728 555 203 2.16 41 0.44 7 – – 0.07 – 24 430Projects 7 662 966 83 2.17 25 0.65 2 162 – 0.05 20 47 1 315Energy – Power 1 245 349 11 1.77 2 0.32 – – – 0.00 – 20 70Energy – Oil & Gas 6 030 345 85 2.82 16 0.53 3 – – 0.10 2 261 163Energy – Nuclear 96 662 1 2.07 1 2.07 – – – 0.00 – 28 2
Cluster total 60 665 231 781 2.57 173 0.57 29 162 – 0.10 22 539 6 477
INVESTMENTS & CONCESSIONS
Transport (Intertoll) 1 466 864 1 0.14 6 0.82 11 – – 1.50 1 78 14Real estate (Group Five Properties) 10 560 – 0.00 – 0.00 – – – 0.00 – 112 –
Cluster total 1 477 424 1 0.14 6 0.81 11 – – 1.49 1 190 14
MANUFACTURING
Everite 2 296 960 15 1.31 8 0.70 4 – – 0.35 6 19 2Pipe 437 838 9 4.11 8 3.65 2 – – 0.91 – – –BRI 335 056 8 4.78 3 1.79 4 – – 2.39 2 10 7
Cluster total 3 069 854 32 2.08 19 1.24 10 – – 0.65 8 29 9
CORPORATE OFFICE
762 300 3 0.79 – 0.00 1 – – 0.26 – 280 299
GROUP TOTAL
65 974 809 817 2.48 198 0.60 51 162 – 0.15 31 1 038 6 799
Abbreviations:
FAFR First-aid frequency rateLTIFR Lost-time injury frequency rateOcc dis Occupational diseases
Site insp Site inspectionsNLTIFR Non-lost-time frequency rateEnv inc Environmental incidents
** Number of first-aid cases for cluster x 200 000/total hours for the cluster.
# Formula = total number of lost-time injury cases for cluster x 200 000/total hours for the cluster.

98
GR
OU
P F
IVE
Onl
ine
sect
ion
of t
he in
tegr
ated
ann
ual r
epor
t 20
15PEOPLE / LABOUR PRACTICES AND DECENT WORKcontinued
03
Lost-time injury frequency rate (LTIFR) refers to the rate of occurrence of incidents that resulted in an employee’s inability to work the next full work day. In Group Five the figure is calculated per 200 000 hours worked. First aid and near misses are managed on site and corrective actions are taken to prevent any lost-time injuries.
LTIFR – EMPLOYEES AND SUB-CONTRACTORS (ROLLING 12 MONTHS)
We are pleased with the improvement seen in both our operations and those of sub-contractors.
This occurred after constant focus on safety awareness over the last few years and grouping
both employees and sub-contractors under one central safety function to ensure consistent
implementation of safety measures.
Safety, health and environment (SHE) measures are also linked to management’s key performance indicators to ensure strict measurement. We also implemented ad hoc site visits from senior management to work closely with sites to address improvements before incidents occur.
% F2015 F2014 F2013 F2012 F2011 F2010 F2009 F2008 F2007
LTIFR (permanent employees)^ 0.23 0.23 0.21 0.20 0.36 0.33 0.39 0.50 0.64
LTIFR (sub-contractors) 0.09 0.13 0.33 0.63 1.03 0.98 1.02 1.39 1.53
Combined# 0.15 0.17 0.27 0.21 0.54 0.43 0.55 0.92 1.34
^ Employees in South Africa and the rest of Africa.# Total number of lost-time injury cases for the group x 200 000/total hours for the group.
HEALTH AND SAFETY continued

99
Contract safety performance
DATES AND SEGMENTS LTI-free hours
JULY
Building & Housing: Building 736 027 Building & Housing: Housing 4 238 624 Building & Housing: Coastal 14 028 753 Civil Engineering 19 696 053 Plant & Formwork 694 210 Projects 17 522 269 Intertoll Africa 102 650 Everite 204 380 Pipe 15 039 Barnes Reinforcing Industries 68 860
AUGUST
Building & Housing: Building 1 539 288 Building & Housing: Housing 4 093 835 Building & Housing: Coastal 15 014 657 Civil Engineering 17 834 855 Plant & Formwork 759 335 Projects 18 034 825 Intertoll Africa 106 600 Everite 405 320 Pipe 43 715 Barnes Reinforcing Industries 102 960
SEPTEMBER
Building & Housing: Building 1 141 538 Building & Housing: Housing 4 435 196 Building & Housing: Coastal 15 466 393 Civil Engineering 20 029 790 Plant & Formwork 823 483 Projects 18 034 825 Intertoll Africa 109 379 Everite 152 607 Pipe 97 417 Barnes Reinforcing Industries 137 280
DATES AND SEGMENTS LTI-free hours
OCTOBER
Building & Housing: Building 7 676 877 Building & Housing: Housing 5 297 487 Building & Housing: Coastal 17 349 408 Civil Engineering 21 867 624 Plant & Formwork 456 894 Projects 16 563 313 Intertoll Africa 108 296 Everite 171 153 Pipe 152 463 Barnes Reinforcing Industries 30 864
NOVEMBER
Building & Housing: Building 5 340 862 Building & Housing: Housing 5 267 336 Building & Housing: Coastal 17 210 554 Civil Engineering 22 293 135 Plant & Formwork 487 337 Projects 17 132 144 Intertoll Africa 92 488 Everite 362 553 Pipe 212 098 Barnes Reinforcing Industries 30 800
DECEMBER
Building & Housing: Building 6 480 168 Building & Housing: Housing 5 635 123 Building & Housing: Coastal 16 468 377 Civil Engineering 22 627 222 Plant & Formwork 506 704 Projects 17 256 751 Intertoll Africa 101 391 Everite 553 733 Pipe 243 048 Barnes Reinforcing Industries 63 800

100
GR
OU
P F
IVE
Onl
ine
sect
ion
of t
he in
tegr
ated
ann
ual r
epor
t 20
15PEOPLE / LABOUR PRACTICES AND DECENT WORKcontinued
03
DATES AND SEGMENTS LTI-free hours
JANUARY
Building & Housing: Building 5 711 248 Building & Housing: Housing 5 794 405 Building & Housing: Coastal 17 428 645 Civil Engineering 24 738 612 Plant & Formwork 555 135 Projects 17 963 430 Intertoll Africa 94 065 Everite 738 533 Pipe 254 071 Barnes Reinforcing Industries 96 580
FEBRUARY
Building & Housing: Building 8 883 036 Building & Housing: Housing 4 899 853 Building & Housing: Coastal 19 582 054 Civil Engineering 24 460 440 Plant & Formwork 606 115 Projects 17 495 261 Intertoll Africa 104 483 Everite 140 525 Pipe 303 923 Barnes Reinforcing Industries 128 040
MARCH
Building & Housing: Building 7 134 687 Building & Housing: Housing 3 755 278 Building & Housing: Coastal 19 758 433 Civil Engineering 23 345 804 Plant & Formwork 665 205 Projects 18 227 380 Intertoll Africa 103 425 Everite 324 885 Pipe 337 662 Barnes Reinforcing Industries 159 060
HEALTH AND SAFETY continued
DATES AND SEGMENTS LTI-free hours
?APRIL
Building & Housing: Building 10 379 752 Building & Housing: Housing 3 993 956 Building & Housing: Coastal 17 615 502 Civil Engineering 23 345 804 Plant & Formwork 713 736 Projects 19 020 555 Intertoll Africa 108 059 Everite 513 205 Pipe 366 255 Barnes Reinforcing Industries 181 940
?MAY
Building & Housing: Building 6 240 967 Building & Housing: Housing 4 507 425 Building & Housing: Coastal 17 184 196 Civil Engineering 23 833 912 Plant & Formwork 775 176 Projects 19 789 593 Everite 701 965 Pipe 392 015 Barnes Reinforcing Industries 29 536
?JUNE
Building & Housing: Building 6 126 969 Building & Housing: Housing 5 214 112 Building & Housing: Coastal 17 968 385 Civil Engineering 23 344 159 Plant & Formwork 837 099 Projects 20 549 002 Everite 889 845 Pipe 419 937 Barnes Reinforcing Industries 61 216

101
Safety awards received
DATES AND SEGMENTS CONTRACTS AWARD
JULY
BUILDING & HOUSING:
HOUSINGEtwatwa Reached 1 000 000 hours LTI-free man hours.
AUGUST
BUILDING & HOUSING:
COASTAL
New Multi-Product Pipeline (NMPP) Terminal Construction TM1
7 000 000 LTI-free man hours.
SEPTEMBER
BUILDING & HOUSING:
BUILDING
90 Rivonia Second place in the 2014 National Master Builders South Africa National Safety Competition for contracts between R300 million to R500 million.
Novartis A rating of 93.4% (Top Ten) in the 2014 Regional Master Builders Association South Africa National Safety Competition for contracts between R75 million to R150 million.
Multichoice head office Second place in the 2014 Regional Master Builders Association South Africa Safety Competition for contracts of R500 million and more.
OCTOBER
BUILDING & HOUSING:
COASTAL
Department of Public Works Head Office
Second place in the KwaZulu-Natal MBA Regional Health and Safety Competition for contracts between R150 million to R300 million.
Lower Thukela Bulk Water Supply
First place for Civil Engineering in the KwaZulu-Natal MBA Regional Health and Safety Competition.
New Multi-Product Pipeline (NMPP) Terminal Construction TM1
Third place for Civil Engineering in the KwaZulu-Natal MBA Regional Health and Safety Competition.
NOVEMBER
CIVIL ENGINEERING PS65 – Sasol Secunda Global group Linde awarded Civil Engineering the Take Two Award for completing the 18-month contract without any LTIs or medical cases.
BUILDING & HOUSING:
HOUSING
Dingleton Resettlement Project
Reached 1 000 000 LTI-free man hours.

102
GR
OU
P F
IVE
Onl
ine
sect
ion
of t
he in
tegr
ated
ann
ual r
epor
t 20
15
DATES AND SEGMENTS CONTRACTS AWARD
DECEMBER
BUILDING & HOUSING:
COASTAL
New Multi-Product Pipeline (NMPP) Terminal Construction TM1
8 000 000 LTI-free man hours.
JANUARY
BUILDING & HOUSING:
BUILDING
Mpumalanga High Court Reached 1 000 000 LTI-free man hours.
FEBRUARY
BUILDING & HOUSING:
BUILDING
Multichoice site Reached 1 000 000 LTI-free man hours.
Venecia Underground Project Reached 800 000 LTI-free man hours.
?APRIL
BUILDING & HOUSING:
COASTAL
New Multi-Product Pipeline (NMPP) Terminal Construction TM1
9 000 000 LTI-free man hours.
?JUNE
BUILDING & HOUSING:
COASTAL
New Multi-Product Pipeline (NMPP) Terminal Construction TM1
9 616 090 LTI-free man hours.
03 HEALTH AND SAFETY continued
PEOPLE / LABOUR PRACTICES AND DECENT WORKcontinued

103
OHSAS 18001:2007 CERTIFICATION – OCCUPATIONAL HEALTH AND SAFETY MANAGEMENT STANDARDAll segments within the group continue to hold certification against the OHSAS 18001:2007 management standard. No major non-conformances were raised during the re-certification process this year.
WORKFORCE REPRESENTED IN HEALTH AND SAFETY COMMITTEESIn compliance with the Occupational Health and Safety Act, No 85 of 1993, management and employees continue to demonstrate their commitment towards the health and safety of employees, visitors and contractors by continuously improving the current health and safety workplace at site, segment, cluster and corporate level. This is achieved through various committees, including the health and safety committee. The members of this committee are equally represented by group, employee and trade union members.
SIGNIFICANT RISKS
Key safety risks across the group include:
WORKING AT HEIGHTS
ROAD SAFETY AND MOTOR VEHICLE ACCIDENTS, SPECIFICALLY LIGHT DUTY VEHICLES
WORKING IN CONFINED SPACES
OPERATING SURFACE MOBILE AND LIFTING EQUIPMENT
EQUIPMENT SAFEGUARDING, SUCH AS TO PREVENT MOVING PARTS STRIKING SOMEONE
ISOLATION OF ELECTRICAL EQUIPMENT
To address these risks, the group continues to implement improvements. These include:
Continual monitoring and measurement of compliance against national and international legislative and group standards
Stop for Safety campaigns on a regular basis Safety-specific campaigns Visible leadership engagements Various inspections on site to evaluate the quality of service delivered Contractor safety, health and environmental plan reviews Daily toolbox talks Communication audits to ensure that risk assessments and assigned tasks
are understood prior to the execution of tasks
With newly promulgated construction regulations being released, we intensified our focus on the successful education of all affected parties throughout the business. These changes will benefit the whole industry, as the registration of safety professionals will be more stringent. The group welcomes these changes and has already started conducting workshops to ensure that the registration of our SHE professionals (agents, officers and management) meet statutory requirements.
FOCUS GOING FORWARD
The focus going forward to ensure improvements in safety, health and environmental management include:
Incident management to eliminate reoccurrence of incidents by identifying the root causes
Implement behaviour-based safety and fatal risk control protocols and leading risk indicators
Improve communication on lessons learnt Increase site visibility by focusing on continued involvement and proactive
management engagement on site Continued improvement of sub-contracting companies The reporting of near-miss incidents to be automated

104
GR
OU
P F
IVE
Onl
ine
sect
ion
of t
he in
tegr
ated
ann
ual r
epor
t 20
15PEOPLE / LABOUR PRACTICES AND DECENT WORKcontinued
04 ASPECT 4:TRAINING AND EDUCATION
TRAINING AND EDUCATION
DELIVERY ON F2015 FOCUS AREAS:In the group’s F2014 integrated annual report, we outlined a number of focus areas. Below we outline how we delivered against these:
F2015 FOCUS AREAS DELIVERY
To ensure depth of technical skill,
leadership and a consistent
approach in the group.
We revised the Academy training structure and model to support the requirement for stronger technical skills within the group
Focus on business-critical training
programmes:
Safety
Technical skills
Growing competence from junior
through to senior levels across
core disciplines
The Academy developed and implemented the following technical in-house schools:
Engineering school Quantity surveying school Foreman development school Contract lifecycle school
INTRODUCTION
The group’s in-house corporate university, The Group Five Academy, was established in
August 2006.
It offers an integrated approach to human capital development and provides learning and development opportunities to all employees in the group.
The focus areas of the Academy are:
Embedding the group’s values
and culture through learning
interventions
Providing learning that is
forward-thinking
Learning initiatives that directly
support the group’s strategy and
that are customised to meet
business segment needs
The Academy model has four focus areas:
TALENT PIPELINE (WITH A FOCUS ON YOUNG PROFESSIONALS)01ORGANISATIONAL DEVELOPMENT02LEADERSHIP DEVELOPMENT03TECHNICAL CAPABILITY THROUGH THE CONSTRUCTION SKILLS TRAINING ACADEMY (CSTA) 04

105
OVERALL EXPENDITURE PER CATEGORY OF SPEND
During the year, the overall training expenditure decreased by 13.5%, mainly due to a stronger focus
on keeping costs low in the economic downturn by increasingly using internal training providers.
Although the spend decreased due to more internally-driven training programmes, the overall
number of employees on training interventions increased.
As outlined on pages 16 to 19 in the printed section of the integrated annual report, there were significant changes in the senior management levels in the organisation during the year. A key focus area was, therefore, on formal leadership and management development programmes at those levels. Furthermore, to increase our talent pipeline through our bursary scheme, the spend in student management increased.
Expenditure per category of spend
Categories – R million F2015 F2014 F2013 F2012 F2011 F2010 F2009 F2008
Skills development 8,9* 13,2* 8,2* 6,6* 6,9* 3,9 3,6 3,7Technical and professional competence development 9,1 10,4 9,6 7,5 11,7 8,9 8,5 10,5Leadership and management development 8,1 6,9 5,3 3,9 3,5 2,6 4,2 2,2Student management(bursaries) 8,4 7,2 5,1 4,6 6,6 6,0 9,3 6,8Training support costs 5,7 7,4 8,9 9,7 9,2 10,1 12,2 n/a
Total 40,2 45,1 37,1 32,3 37,9 31,5 37,8 23,2
* These numbers include overheads for our Construction Skills Training Academies. This was not done prior to F2011 as the Development Bank of Southern Africa provided part funding.

106
GR
OU
P F
IVE
Onl
ine
sect
ion
of t
he in
tegr
ated
ann
ual r
epor
t 20
15PEOPLE / LABOUR PRACTICES AND DECENT WORKcontinued
04
SPEND PER OCCUPATIONAL CATEGORYThere was a key focus on management training programmes this year to further bridge the gap from middle to senior management levels. We also focused on development programmes for our skilled, semi-skilled and unskilled categories due to a continued focus on improving technical skills.
Categories
F2015 F2014 F2013 F2012
Number
of
training
initiatives
Annual
spend
R’000
Numberof
traininginitiatives
AnnualspendR’000
Numberof
traininginitiatives
AnnualspendR’000
Numberof
traininginitiatives
AnnualspendR’000
Top management 33 70 22 22 11 20 5 0.6Senior management 120 48 86 267 53 510 58 146Professional and mid-management 1 856 3 949 1 704 4 635 640 2 472 431 698Skilled 5 370 9 735 6 505 8 604 4 414 8 215 5 651 7 799Semi-skilled 4 088 3 796 4 176 2 800 3 296 3 030 4 719 2 145Unskilled 1 666 1 239 1 614 857 711 779 1 246 733
Total 13 133 18 837 14 107 17 285 9 125 15 026 12 110 11 521
AVERAGE ANNUAL HOURS OF TRAINING PER EMPLOYEE BY EMPLOYEE CATEGORYThe slight drop in average annual hours of training interventions at senior level is mainly due to the type of training interventions attended. Although we had more interventions at senior and middle management, these were mainly conducted internally over shorter periods. At the skilled, semi-skilled and unskilled employee levels the focus was on the development of on-the-job skills at site level.
Categories
F2015
Average
hours
F2015
Average
hours
Female
F2015
Average
hours
Male
F2014Average
hours
F2014Average
hoursFemale
F2014Average
hoursMale
F2013Average
hours
F2012Average
hours
Top management 10 8 11 9 8 9 9 8
Senior management 8 8 8 11 10 11 14 10
Professional and mid-management 13 9 16 18 22 16 37 20
Skilled 36 42 30 30 31 30 36 49
Semi-skilled 32 34 30 40 34 42 51 45
Unskilled 19 22 17 18 15 18 38 22
TRAINING AND EDUCATION continued

107
We employ a large percentage of workers on limited duration contracts to meet deadlines.
In most instances these employees are trained prior to employment through our People at the Gate (PAG) programme, as well as on-the-job training.
With the nature of our business involving start to finish construction contracts, we are unable to take these unskilled/semi-skilled employees who completed the PAG programme to other contracts, as we have to provide the same opportunities to local communities within the vicinities of the new contracts. However, our training provided in each community area leaves permanent skills behind. We trained 118 people on various People at the Gate programmes during the year under review.
Over and above our PAG programme we also offer learnerships to unemployed people. The skills acquired from our learnership programmes are transferable to other contracts. Therefore, 70% of those who have completed various learnership programmes have managed to secure site positions after completion of their training.
SKILLS DEVELOPMENTSPEND ON LEARNERSHIPS AND APPRENTICESHIPS
The Academy closely aligns with the business segments to provide a pool of well-trained individuals at the right time and in the right location.
In light of the current volatile labour conditions around sites, skills development within the
communities surrounding our construction contracts was a particular focus area during the year.
This resulted in 130 community members being trained and employed on sites.
The increase in spend and number of learners on learnerships and apprenticeships reflects the commitment to develop people in line with the technical requirements in the construction sector.
Our business administration learnership that started during the previous financial year was completed and all 11 disabled individuals are currently employed at our various segments.
F2015 F2014 F2013 F2012 F2011 F2010 F2009
Annual spend on learnerships and apprenticeships – R million 7,2 5,1 3,6 4,0 4,6 3,9 3,6
Total number of learners on learnership and apprenticeship programmes and AET* 186 174 90 144 201 214 231
Number of unemployed learners registered on learnership and apprenticeship programmes 130 120 66 99 128 163 149
Number of employed learners registered on learnership and apprenticeship programmes and AET 45 54 24 45 73 51 82
Number of disabled unemployed learners registered on learnership programmes 11 11 – – 18 18 n/a
* AET was formerly known as ABET.

108
GR
OU
P F
IVE
Onl
ine
sect
ion
of t
he in
tegr
ated
ann
ual r
epor
t 20
15PEOPLE / LABOUR PRACTICES AND DECENT WORKcontinued
04
LEARNERSHIP AND APPRENTICESHIP SCOPE AND DEMOGRAPHICS
Although our learnerships include both employees and community members, during the year under review we targeted lower levels within our site-based employees to support demanding site requirements for effective execution. The requirement for increased numeracy and literacy skills for our unskilled and semi-skilled labour in our Intertoll and Manufacturing businesses placed a renewed focus on our adult education programmes. There was a pleasing increase in women attending these programmes.
LearnershipsNQFlevel
Black White
Employed Unemployed TotalMale Female Male Female
Business Admin (various segments) 3 7 4 – – – 11 11Warehouse and Stock Management 3 14 – – – 14 – 14Building and Civil Engineering (Coastal) 3 7 4 – – – 11 11Fitter (Oil & Gas) 2 9 5 – – – 14 14Welding (Projects) 2 11 9 – – – 20 20Community House Builder (Civil Engineering) 2 7 5 – – – 12 12Bricklaying (Coastal – CT) 2 10 0 – – 10 – 10
AETNQFlevel
Black White
Employed Unemployed TotalMale Female Male Female
AET – Everite Various levels 9 – – – 9 – 9AET – Intertoll Communication level 2 4 1 – – 5 – 5AET – Intertoll Communication various
levels 6 1 – – 7 – 7
84 29 – – 45 68 113
Apprenticeships
Black White
Employed Unemployed TotalMale Female Male Female
Welding (Projects) – Unemployed 3 – – – – 3 3Boilermaking (Apprenticeship – Projects) – Unemployed 6 1 1 – – 8 8Fitter (Apprenticeship – Projects) – Unemployed 1 – – – – 1 1Rigger (Apprenticeship – Projects) – Unemployed 5 – – – – 5 5Boilermaking (Apprenticeship – Projects) – Unemployed 6 1 1 – – 8 8Electrician (Apprenticeship – Projects) – Unemployed 2 – – – – 2 2Earthmoving Mechanics (Apprenticeship – Plant & Equipment) – Unemployed 13 1 1 – – 15 15Welding (Apprenticeship – Oil & Gas) – Unemployed 5 5 – – – 10 10Electrician (Apprenticeship – Everite) – Unemployed 2 – – – – 2 2Fitter and Turner (Apprenticeship – Everite) – Unemployed 2 – – – – 2 2Fitter (Apprenticeship – Everite) – Unemployed 2 – – – – 2 2Instrument Mechanics (Apprenticeship – Everite) – Unemployed 3 1 – – – 4 4
Total 50 9 3 – – 62 62
TRAINING AND EDUCATION continued

109
CONSTRUCTION SKILLS TRAINING ACADEMY
The demand for skills programmes to be delivered on site by our trainers, as well as the
portfolio of programmes on offer, increased significantly. To address this, during the year we
focused on further educating employees on health and safety, with working at heights the most
addressed intervention.
An increasing number of construction skills programmes are also now being delivered over-border. This is mainly focused on site-based employees due to the group’s increasing number of major contracts in Africa.
Black White Total Total
F2015 F2014 F2013 F2012 F2015 F2014 F2013 F2012 F2015 F2014 F2013 F2012 F2015
Skillsprogrammes
M F M F M F M F M F M F M F M F M F M F M F M F
Employedlearners 3 732 195 3 067 200 846 73 218 4 – – 215 2 88 3 39 2 3 732 195 3 282 202 934 76 257 6 3 927
Unemployedlearners 23 25 632 92 407 117 23 20 – – – – – – – – 23 25 632 92 407 117 23 20 48
Over-border employed learners 1 005 3 – – – – – – – – – – – – – – 1 005 3 – – – – – – 1 008
Sub-contractors – – 53 4 – – 2 2 – – – – – – – – – – 53 4 – – 10 2 –
Bursarystudents – – 20 7 9 1 7 7 – – 4 1 1 – 13 2 – – 24 8 10 1 23 9 –
Externalentities – – – – 72 2 2 2 – – – – 1 – – – – – – – 73 2 12 2 –
Total 4 760 223 3 772 303 1 334 193 252 35 – – 219 3 90 3 52 4 4 760 223 3 991 306 1 424 196 304 39 4 983
M = MaleF = Female
TECHNICAL AND PROFESSIONAL COMPETENCE DEVELOPMENTThe use of internal rather than external providers for our short technical competence building workshops decreased the overall spend on programmes aimed at growing technical and professional competence. The number of students on our project management programme increased due to a focus on ensuring sustainable project management skills within the organisation. Registration with the various professional bodies was a priority this year, with an additional focus on the registration of safety professionals. The employees on professional development programmes, therefore, increased.
F2015 F2014 F2013 F2012 F2011 F2010 F2009 F2008
Total annual spend – R million 9,1 10,4 9,6 7,5 11,7 8,9 8,5 10,5
Number of students on Programmefor Project Management 49 38 22 28 48 44 56 22
Number of students on ProfessionalRegistration Development programmes 222 71 75 122 89 52 37 n/a
Short technical workshop attendance 8 645 10 267 6 275 10 211 16 365 9 314 8 776 4 047

110
GR
OU
P F
IVE
Onl
ine
sect
ion
of t
he in
tegr
ated
ann
ual r
epor
t 20
15PEOPLE / LABOUR PRACTICES AND DECENT WORKcontinued
04
DEMOGRAPHICS OF TECHNICAL AND PROFESSIONAL COMPETENCE DEVELOPMENT LEARNERS
The Programme in Project Management is still our flagship technical development programme, with an increasing number of our employees attending this programme. This programme’s focus is on developing project management skills across the group to ensure a unified Group Five way of dealing with our increasing number of contracts locally and over-border.
A year-long customised in-house development programme was developed for our engineers which focuses on core competencies and skills required to fulfil the group’s engineering functions and responsibilities. There are currently 105 people on the course.
Skills programmes (F2015)
BlackBlack
Total
WhiteWhite
Total Total M F M F
Programme in Project Management 21 8 29 19 1 20 49
Professional RegistrationDevelopment programme 94 25 119 98 5 103 222
Short technical workshops 4 875 1 555 6 430 1 531 684 2 215 8 645
M = MaleF = Female
LEADERSHIP AND MANAGEMENT DEVELOPMENTAlthough the spend and number of employees on leadership and management development programmes increased, the supervisory and competence building workshop numbers declined as the group’s focus shifted towards the development of our technical skills pipeline in our critical and scarce skills sets, especially in the engineering and commercial fields.
F2015 F2014 F2013 F2012 F2011 F2010 F2009 F2008
Total annual spend – R million 8,1 6,9 5,3 3,9 3,5 2,6 4,2 2,2
Number of students on Programmein Management Development 28 8 21 22 20 23 25 17
Number of studentson supervisory programmes 81 102 115 96 97 150 99 n/a
Number of competencebuilding workshops 57 193 133 82 62 50 87 44
STUDENT MANAGEMENTSPEND ON BURSARIES
Bursary students from both universities and universities of technology provide a pipeline of core
competencies into the group. The group is committed to supporting this stream of young talent and
increased both the spend and numbers of the bursary scheme. Students have also been allocated
senior mentors within the group to ensure integration and full understanding of Group Five’s
business environment.
Career development plans have been developed and is in the process of being implemented across all our businesses.
F2015 F2014 F2013 F2012 F2011 F2010 F2009 F2008
Annual bursary expenditure – R million 8,4 7,2 5,1 4,6 6,6 6,0 9,3 6,8
Number of bursary students 136 111 76 115 183 171 258 178
TRAINING AND EDUCATION continued

111
DEMOGRAPHICS OF BURSARY STUDENTS
Against continued challenges to recruit young people who want to work in the construction sector, especially female candidates, we are pleased with an increase in both categories.
The overall number of students increased by 18% in the last year, with 24% growth in the number of
black students and 48% growth in female bursary students.
This was achieved due to an active bursary recruitment drive involving senior level engagement at various university career fairs. Increased marketing activities are planned for the next recruitment cycle to continue driving improvements in this area.
Black White Total Total
F2015 F2014 F2015 F2014 F2015 F2014 F2015 F2014
M F M F M F M F M F M F
Demographics of bursarystudents 66 46 63 22 20 4 22 4 86 50 85 26 136 111
M = MaleF = Female
FOCUS GOING FORWARD
In the coming year, the focus will continue to be on the core and critical skills sets, such as engineering, quantity surveying and commercial skills.
The following focus areas will be addressed to ensure alignment between the Academy and our group strategy:
A strong focus on mentorship to build technical experts in our various disciplines. This will be achieved by using retirees to run mentorship sessions with our engineers, quantity surveyors, estimators and planners
To improve the effectiveness of teams on multi-disciplinary contracts, the Academy will be focusing on collaborative team interventions, with a strong coaching focus for the duration of the contracts
In support of the group’s strategy to expand into Africa, the Academy and our regional offices in Ghana and Mozambique will be expanding our learning and development function to support skills development in these regions
OVER-BORDER TRAINING
In line with Group Five’s
expansion strategy in the rest
of Africa, we are increasingly
focused on providing training
in a number of over-border
countries. The largest training
demand is in the areas of
safety, construction skills and
competence building.
Our focus for the next year is to further expand our training capability with the assistance of our African offices in Mozambique and Ghana.
Over-border training
Country F2015 F2014
DRC 717 721
Mozambique 138 70
Liberia 516 188
Total 1 371 979

112
GR
OU
P F
IVE
Onl
ine
sect
ion
of t
he in
tegr
ated
ann
ual r
epor
t 20
15PEOPLE / LABOUR PRACTICES AND DECENT WORKcontinued

113
DELIVERY ON F2015 FOCUS AREAS:In the group’s F2014 integrated annual report, we outlined a number of focus areas. Below we outline how we delivered against these:
F2015 FOCUS AREAS DELIVERY
Achieving greater levels of diversity,
particularly in our senior levels
through commissioned head
hunting.
Representation at executive level increased from 11% to 25%, from 25% to 28% at senior management level and from 28% to 31% at middle management level
Whilst in the past we made substantial gains at the lower levels, this year marked pleasing improvement at the higher levels. This is mainly due to a CEO-driven intervention. We hope to maintain this momentum going forward through specific initiatives such as the incentivisation of management achievements in this area.
African, Indian and Coloured junior management representation improved from to 76% to 78%,
middle management from 29% to 30%, senior management from 25% to 28% and executive
management from 11% to 25%.
MANAGEMENT The growth in the number of African, Indian and Coloured employees during the year is indicative of the efforts being made to increase the proportional representation from designated groups. However, more work needs to be done to ensure that when appointments are made at a management level in the segments, focus is placed on recruiting black candidates in general and black female candidates in particular.
In line with this, we established a dedicated talent management centre of excellence to assess, review and advise on the implementation of a talent pipeline supporting the continual equity demands of the group. This process includes a comprehensive talent nomination process followed by psychometric testing, individual coaching and detailed career path planning for the identified candidates.
Total South African workforce
F2015
Total South African workforceF2014
Variance(%)
IndustrytargetsWhite AIC* Total
AIC* %
of total White AIC* TotalAIC* %of total
AIC* %of total
Executive (Paterson F-band)Executives and board 6 2 8 25.00 8 1 9 11.11 13.89 40
Senior management(Paterson E-band) segmentdirectors and group directors 23 9 32 28.13 23 7 30 23.33 4.80 60
Middle management(Paterson D-band) segment directors and department heads and skilled professionals 326 140 466 30.04 330 135 465 29.03 1.01 75
* African, Indian and Coloured.
ASPECT 5:DIVERSITY AND EQUAL OPPORTUNITY 05

114
GR
OU
P F
IVE
Onl
ine
sect
ion
of t
he in
tegr
ated
ann
ual r
epor
t 20
15PEOPLE / LABOUR PRACTICES AND DECENT WORKcontinued
05
EMPLOYMENT EQUITY Whilst we are pleased with the transformation of our senior management levels, this will remain a key focus area in the new year. It is important to consider that it does take a long time to grow an experienced senior team that can effectively operate at top management levels. As the industry has not had many years of experienced black senior construction teams, fully transforming senior levels in the industry will take some time.
DEMOGRAPHIC DISTRIBUTION AND COMPOSITION OF THE SOUTH AFRICAN WORKFORCE – TOTAL SOUTH AFRICAN WORKFORCE
The table below reflects the demographic distribution of our employees
Total South African workforce
F2015
Total South African workforceF2014
Variance(%)
White AIC* Total
AIC* %
of total White AIC* TotalAIC* %of total
AIC* %of total
Executive (Paterson F-band)Executives and board 6 2 8 25.00 8 1 9 11.11 13.89
Senior management(Paterson E-band) segment directorsand group directors 23 9 32 28.13 23 7 30 23.33 4.80
Middle management(Paterson D-band) segment directors and department heads and skilled professionals 326 140 466 30.04 330 135 465 29.03 1.01
Junior management/skilled(Paterson C-band) 698 2 495 3 193 78.14 741 2 465 3 206 76.89 1.25
Semi-skilled (Paterson B-band) 61 3 352 3 413 98.21 89 4 281 4 510 97.96 0.25
Unskilled (Paterson A-band) 6 2 660 2 666 99.78 3 2 991 2 994 99.90 (0.12)
Total 1 120 8 658 9 778 88.55 1 187 9 880 11 067 89.15 (0.72)
* African, Indian and Coloured.
Demographic distribution
F2015 F2014 F2013 F2012% % % %
White 11 11 17 12African 76 80 73 76Coloured 9 5 5 8Indian 4 4 5 4
Total 100 100 100 100
Gender distribution
F2015 F2014 F2013 F2012% % % %
Female 16 12 16 18Male 84 88 84 82
DIVERSITY AND EQUAL OPPORTUNITY continued

115
AGE AND GENDER DEMOGRAPHICS
With the exception of the
executive committee, the management team is evenly split between the age categories 31 to 50 and 51 to 65, which indicates that our recruitment processes have been effective. The
challenge remains to establish
the depth required in our
succession planning to result
in the required demographic
transformation.
Group Five is recognised as one of the transformed companies amongst the JSE-listed construction companies, with a Level 2 rating in terms of the Construction Charter. However, against this strong profile, the gender demographics of the company are still
lagging, with women comprising only 16% of the entire workforce. Although this is an industry trend, we are committed to drive an improvement. In F2012, we launched the Basadi programme, a special initiative focusing on women empowerment, which is intended to highlight and address systemic barriers (policy, structural and cultural) that impede the attraction and retention of women.
In F2012, the Group Five CEO signed the United Nations Global Compact on Women Empowerment Principles, committing to the development and empowerment of women. To date, more than 100 women in the group have been offered development as part of this programme. Women-owned companies within the construction sector are also supported financially as part of the company’s supply chain development.
The group has also been the main sponsor of the University of Johannesburg’s (UJ) Women in Engineering and Built Environment
(WIEBE) programme since 2010. The aim of the WIEBE programme is to attract and develop female students in the engineering and built environment fields and to strengthen the pipeline of women into the construction and engineering sectors. There has been an average increase of between 5% to 8% in female student enrolment in the engineering and built environment disciplines at UJ since the launch of the partnership.
This year, Group Five signed a memorandum of understanding with Future of the African Daughter (FOTAD), a non-profit development project established for girls between the ages of 12 years to 19 years from previously disadvantaged areas in South Africa. The aim of the programme is to facilitate their exposure to the workplace, leadership training, career development and mentorship. Group Five has committed to a three-year sponsorship of 14 girls on the FOTAD programme.
EXECUTIVE COMMITTEE
AGE DIVERSITY
Age
Male Female All
Able Disabled Total Able Disabled Total Total
Age 31 – 50 67% – 67% 11% – 11% 78%
Age 51 – 65 22% – 22% – – – 22%
Total 89% – 89% 11% – 11% 100%
MANAGING DIRECTORS AGE DIVERSITY
Age
Male Female All
Able Disabled Total Able Disabled Total Total
Age 31 – 50 45% – 45% 9% – 9% 54%
Age 51 – 65 46% – 46% – – – 46%
Total 91% – 91% 9% – 9% 100%

116
GR
OU
P F
IVE
Onl
ine
sect
ion
of t
he in
tegr
ated
ann
ual r
epor
t 20
15PEOPLE / LABOUR PRACTICES AND DECENT WORKcontinued
05
SEGMENT DIRECTORSGENDER DIVERSITY
Age
Male Female All
Able Disabled Total Able Disabled Total Total
Age 31 – 50 59% – 59% 12% – 12% 71%
Age 51 – 65 27% – 27% 1% – 1% 28%
Age >65 1% – 1% – – – 1%
Total 87% – 87% 13% – 13% 100%
ALL EMPLOYEES GENDER DIVERSITY
Age
Male Female All
Able Disabled Total Able Disabled Total Total
Age 18 – 31 15.0% 0.0% 15.0% 5.3% 0.1% 5.4% 20.4%
Age 31 – 50 42.2% 0.1% 42.3% 11.5% 0.1% 11.6% 53.9%
Age 51 – 65 22.9% 0.1% 23.0% 2.6% 0.0% 2.6% 25.6%
Age >65 0.1% 0.0% 0.1% 0.0% 0.0% 0.0% 0.1%
Total 80.2% 0.2% 80.4% 19.4% 0.2% 19.6% 100.0%
FOCUS GOING FORWARD
We will focus on achieving greater levels of diversity, particularly in our senior levels through commissioned head hunting. To this end, we have launched a process of identifying black talent in the industry with a view to introducing these candidates into the group at various levels to enhance the prospects of these employees achieving senior management appointments in the short to medium term.
In addition, we started an excellerated development programme for our top talent aimed at ensuring these candidates are prepared to take up opportunities as may arise.
DIVERSITY AND EQUAL OPPORTUNITY continued
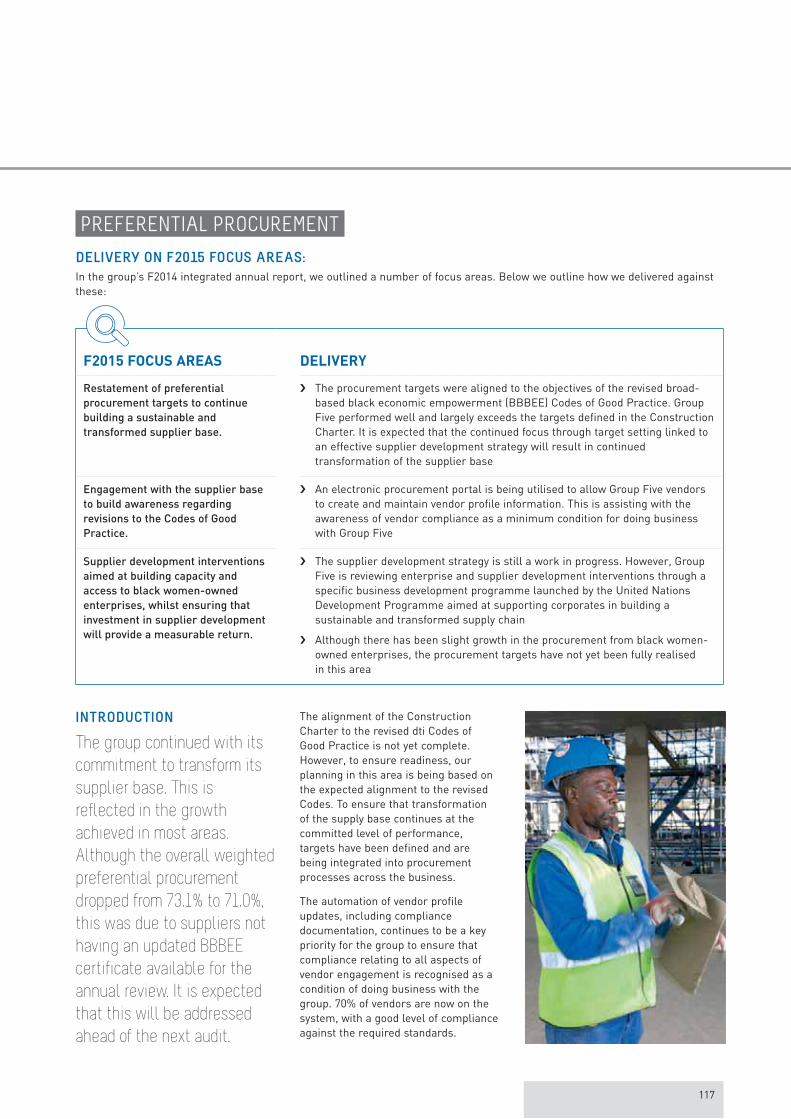
117
PREFERENTIAL PROCUREMENT
DELIVERY ON F2015 FOCUS AREAS:In the group’s F2014 integrated annual report, we outlined a number of focus areas. Below we outline how we delivered against these:
F2015 FOCUS AREAS DELIVERY
Restatement of preferential
procurement targets to continue
building a sustainable and
transformed supplier base.
The procurement targets were aligned to the objectives of the revised broad-based black economic empowerment (BBBEE) Codes of Good Practice. Group Five performed well and largely exceeds the targets defined in the Construction Charter. It is expected that the continued focus through target setting linked to an effective supplier development strategy will result in continued transformation of the supplier base
Engagement with the supplier base
to build awareness regarding
revisions to the Codes of Good
Practice.
An electronic procurement portal is being utilised to allow Group Five vendors to create and maintain vendor profile information. This is assisting with the awareness of vendor compliance as a minimum condition for doing business with Group Five
Supplier development interventions
aimed at building capacity and
access to black women-owned
enterprises, whilst ensuring that
investment in supplier development
will provide a measurable return.
The supplier development strategy is still a work in progress. However, Group Five is reviewing enterprise and supplier development interventions through a specific business development programme launched by the United Nations Development Programme aimed at supporting corporates in building a sustainable and transformed supply chain
Although there has been slight growth in the procurement from black women-owned enterprises, the procurement targets have not yet been fully realised in this area
INTRODUCTION
The group continued with its
commitment to transform its
supplier base. This is
reflected in the growth
achieved in most areas.
Although the overall weighted
preferential procurement
dropped from 73.1% to 71.0%,
this was due to suppliers not
having an updated BBBEE
certificate available for the
annual review. It is expected
that this will be addressed
ahead of the next audit.
The alignment of the Construction Charter to the revised dti Codes of Good Practice is not yet complete. However, to ensure readiness, our planning in this area is being based on the expected alignment to the revised Codes. To ensure that transformation of the supply base continues at the committed level of performance, targets have been defined and are being integrated into procurement processes across the business.
The automation of vendor profile updates, including compliance documentation, continues to be a key priority for the group to ensure that compliance relating to all aspects of vendor engagement is recognised as a condition of doing business with the group. 70% of vendors are now on the system, with a good level of compliance against the required standards.

118
GR
OU
P F
IVE
Onl
ine
sect
ion
of t
he in
tegr
ated
ann
ual r
epor
t 20
15PEOPLE / LABOUR PRACTICES AND DECENT WORKcontinued
05
PREFERENTIAL PROCUREMENT SCORECARD
Measurement principle Points
Target per
Construction
Charter
F2015
target
ActualF20151
ActualF20142
ActualF20133
ActualF20124
ActualF20115
ActualF20106
ActualF20097
Preferential spend with all suppliers 12 70% 71.0% 73.1% 70.1% 62.2% 52.8% 49.1% 45.1%
Preferential spend with qualifyingsmall and emerging micro-enterprises 3 15% 24.3% 23.3% 20.1% 28.1% 22.0% 11.4% 6.3%
Preferential spend with enterprisesthat are more than 50% black-owned 3 12% 21.1% 18.2% 17.7% 20.9% 19.1% 9.2% 7.9%
Preferential spend with enterprisesthat are more than 30% blackwomen-owned 2 8% 5.6% 4.4% 9.5% 8.6% 3.1% 1.9% 0.1%
Weighted score –* 19.4 19.1 20.0 20.0 19.0 18.4 15.68
1 Unaudited.2 As audited by BEE Verification Agency cc for the year ended 30 June 2014 (Group Five).3 As audited by BEE Verification Agency cc for the year ended 30 June 2013 (Group Five).4 As audited by BEE Verification Agency cc for the year ended 30 June 2012 (Group Five).5 As audited by BEE Verification Agency cc for the year ended 30 June 2011 (Group Five).6 As audited by BEE Verification Agency cc for the year ended 30 June 2010 (Group Five).7 As audited by BEE Verification Agency cc for the year ended 30 June 2009 (Group Five)7 As audited by BEE Verification Agency cc for the year ended 30 June 2009 (Group Five Construction (Proprietary) Limited).* A weighted score is not done for targets.
over the period of review and existing strategies to be reinforced over the next two-year period will include:
Review of the group procurement spend profile to establish high level strategies centred on leveraging savings, reducing risk, optimising procurement processes and transforming the supply base
Specific procurement strategies to focus on capability, capacity, cost and empowerment to ensure that sustainability and transformation are the ultimate outcomes of the group procurement strategy
Commodity strategies to eliminate inefficiencies and leverage economies of scale have already yielded good results. The team will identify the key areas of procurement for the next period to continue its improvement path aimed both at unlocking cost savings and transforming the supply chain
Re-statement of preferential procurement targets in line with the new commitments defined in the revised Codes of Good Practice to continue building a sustainable and transformed supplier base
Engagement with the supplier base to build awareness regarding revisions to the Codes of Good Practice
Supplier development interventions aimed at building capacity and access to black women-owned enterprises, whilst ensuring that investment in supplier development will provide a measurable return
FOCUS GOING FORWARD
The continued growth in procurement from small and black-owned enterprises shows a clear commitment from the Group Five team to continue to transform its supply base. This also positions the group to pursue the deliverables of the revised Codes of Good Practice without significant changes to its exiting procurement strategies. Although procurement from black women-owned enterprises has not met the targets defined in the construction charter, a 27% increase was achieved. Our focus on women in construction will continue to support the growth objective in this area of procurement.
The key aspects of the supply chain strategy have yielded good results
DIVERSITY AND EQUAL OPPORTUNITY continued

119
ENTERPRISE DEVELOPMENT
INTRODUCTION
The group’s enterprise development strategy is to partner with majority black-owned companies
that have the capacity to develop into strategic business partners, whilst achieving the objectives
set out in the Construction Sector Scorecard. To this end, we place significant emphasis on
facilitating the development and growth of these organisations, as measured by the Construction
Industry Development Board (CIDB).
The group recently appointed a group transformation director to increase the focus on its transformation initiatives and place particular attention on the enterprise development programme in line with the requirements of the revised BBBEE Codes.
This year we met the full enterprise development requirement in terms of the Construction Sector Scorecard for the sixth year in a row.
ENTERPRISE DEVELOPMENT PARTNERSThe table below reflects the development of our partners from the time they were incorporated into our programme.
Since inception of the group’s enterprise development programme in 2008, six of our partners improved their Construction Industry Development Board (CIDB) registration during the period and four reached the targeted CIDB level 8.
Enterprise development partnersBlack
ownershipWomen
ownershipDate
joinedCIDB levelon joining
CurrentCIDB level
BBBEEcontributor
level
BL Williams (Pty) Limited 95% 48% 2008 6 GB – PE 7 GB – PE 3
ENZA Construction (Pty) Limited 93% 10% 2009 7 GB 8 GB & 8 CE 2
Enzani Technologies (Pty) Limited 80% 54% 2009 5 EP – PE 7 EP PE 1 ME – PE
1
Inkanyeli Projects (Pty) Limited 100% 19% 2009 4 GB – PE 7 GB PE 2
Pan African Development (Pty) Limited 100% 40% 2009 6 GB – PE 7 GB PE 7 CE PE
2
Siyakhula Engineering (CC) 100% – 2009 1 EB – EP 1 EB – EP 3
UMSO Construction (Pty) Limited 89% – 2008 6 CE – PE 8 CE – PE,6 GB PE
2
ENM CC 100% – 2010 6 GB 8 GB 3
Uvuko Civils (Pty) Limited 100% 100% 2013 7 GB, 5 CE 8 GB PE,7 CE PE
3
Tsima Construction (Pty) Limited 91% 21% 2015 7 GB, 8 CE 7 GB, 8 CE 3
Bongi-M Construction (Pty) Limited 100% 100% 2015 6 GB, 6 PE 6 GB, 6 PE 2
CE – Civil engineeringEP – Electrical engineering works (infrastructure)GB – General building works ME – Mechanical engineering works PE – Potential emerging

120
GR
OU
P F
IVE
Onl
ine
sect
ion
of t
he in
tegr
ated
ann
ual r
epor
t 20
15PEOPLE / LABOUR PRACTICES AND DECENT WORKcontinued
05
EMPOWERED JOINT VENTURESThe table below outlines the significant joint venture projects entered into with emerging and empowered organisations during the year.
PA
RT
NE
R (
P)/
DE
VE
LO
PM
EN
T
EN
TIT
Y (
DE
)
NA
ME
OF
PA
RT
NE
R/
DE
VE
LO
PM
EN
T E
NT
ITY
CO
NT
RA
CT
/
DE
VE
LO
PM
EN
T
EF
FE
CT
IVE
PA
RT
NE
R
% H
OL
DIN
G I
N V
EN
TU
RE
TO
TA
L V
AL
UE
OF
CO
NT
RA
CT
(10
0%
) R
’00
0
CO
MM
EN
CE
ME
NT
DA
TE
OF
CO
NT
RA
CT
ENGINEERING & CONSTRUCTION
DE Bhekimbeko Business
Enterprise CC
Group Five GJ Crookes Joint Venture
established to construct the GJ Crookes
Hospital phases 2, 3 and 4
(New casualty, trauma and admissions
departments) – Eastern Cape
60% 122 055 June 2011
P Pandev African Development
(Pty) Limited
DE Umsimbiti Civils
(Pty) Limited
Construction of Main Road P577
in Kwadebeka – KwaZulu-Natal
15% 176 314 Oct 2011
DE Bhekimbeko Business
Enterprise CC Construction of the Pomeroy
Community Health Centre
– KwaZulu-Natal
40% 146 302 Mar 2012
P Pandev African Development
(Pty) Limited
DE Bhekimbeko Business
Enterprise CC Repairing and renovations to Durban
Central police station – KwaZulu-Natal
50% 186 158 Mar 2012
P Pandev African Development
(Pty) Limited
P Pandev African Development
(Pty) Limited
Construction of the right of way to the
Umngeni Viaduct, including all stations
and structures
40% 301 225 Mar 2014
P ENZA Construction
(Pty) Limited
Bus Rapid Transport and Integrated
Rapid Transport contracts (phase 2)
– Gauteng
30% 48 477 Oct 2011
P ENZA Construction
(Pty) Limited
Bus Rapid Transport and Integrated
Rapid Transport prototype – Hatfield
30% 82 582 Jul 2012
P ENM CC Building of Bophelong Psychiatric
Hospital – North West
30% 435 000 Nov 2012
P Trencon Construction
(Pty) Limited Construction of Tshwane House
– Gauteng
36,25% 1 143 454 Mar 2015
P Imbani Construction
(Pty) Limited
DE Group Five Bongekile
Joint Venture
Construction of Lonmin apartment
blocks in Marikana (phase 1)
– North West
30% 10 918 Mar 2015
DIVERSITY AND EQUAL OPPORTUNITY continued

121
PA
RT
NE
R (
P)/
DE
VE
LO
PM
EN
T
EN
TIT
Y (
DE
)
NA
ME
OF
PA
RT
NE
R/
DE
VE
LO
PM
EN
T E
NT
ITY
CO
NT
RA
CT
/
DE
VE
LO
PM
EN
T
EF
FE
CT
IVE
PA
RT
NE
R
% H
OL
DIN
G I
N V
EN
TU
RE
TO
TA
L V
AL
UE
OF
CO
NT
RA
CT
(10
0%
) R
’00
0
CO
MM
EN
CE
ME
NT
DA
TE
OF
CO
NT
RA
CT
INVESTMENTS & CONCESSIONS
DE Kuvula Trade 12
(Pty) Limited
Investment in The Beacon
(Eastern Cape)
13% 120 000 Jan 2008
DE Group Five Montagu
Developments
(Pty) Limited
Investment in Decor on Zambezi –
Gauteng
13% 85 000 Jan 2008
DE RFC Developments
(Pty) Limited
Investment in The Core – Gauteng 13% 196 000 Jan 2008
FOCUS GOING FORWARD
The group will maintain its current enterprise development programme and engage new strategic partners in line with the requirement of the revised Construction Sector Codes when they come into effect after October 2015. The current relationships that have matured to higher CIDB levels will be exited to create opportunities for new partners who are aligned to the group’s strategic objectives. Our enterprise development programme will remain focused on skills transfer to developing contractors in the construction industry to assist them to become independent and sustainable.
During the coming year, we will formalise the mentoring process through more regular and focused interactions, as well as strengthening auditing processes around the development of each entity. Our programme will also place special emphasis on black women-owned small construction businesses.

122
GR
OU
P F
IVE
Onl
ine
sect
ion
of t
he in
tegr
ated
ann
ual r
epor
t 20
15PEOPLE / LABOUR PRACTICES AND DECENT WORKcontinued
05
SOCIETY
APPROACH TO COMMUNITIESAs a large group, we believe it is important to act responsibly and contribute in a positive way to the communities, regions and countries where we operate. To ensure we understand the requirements of communities around our operations, we engage proactively with the community before implementing contracts. This is done in consultation with government departments, local authorities and community stakeholder groups.
Through construction, which
is the core business of the
company, and appropriate
community development
programmes, Group Five does not only build infrastructure, but also contributes to the building of better lives in communities.
On contracts close to local communities, the employment of local community members should be at least 60% of the total workforce. On each of our contracts, a portion of revenue is
set aside during the implementation phase towards the upliftment of local communities in the form of SED and enterprise development. During the year, this represented R1,3 million and focused on construction skills development and community infrastructure development projects. These ranged from skills training on sites through our “People at the Gate” construction skills programme, to construction of classrooms and installation of water tanks, to the donation of furniture and equipment, including materials for local communities when contracts get completed.
COMMUNITY INFRASTRUCTURE
INVESTMENTS
Group Five develops infrastructure. An important part of the group’s socio-economic development is seeking opportunities to partner with governments to assist in either rehabilitating or constructing infrastructure in communities during the lifecycle of a contract. This infrastructure is typically in the form of schools or clinics that either get renovated or new ones built, surfacing of village roads and building of sporting facilities and installation of water facilities for easy access to water.
LOCAL RECRUITMENT, CAPACITY BUILDING AND SKILLS DEVELOPMENT
We source local labour from communities close to our construction sites. The sourcing process has to be carefully managed, as our limited duration employment requirements on sites do not often match the expectations and skills levels of local people. To address this, we engage with elected counsellors and the Department of Labour or equivalent bodies through our community liaison officers. These officers are trained to deal with the community in a transparent way to align all interest groups and to fully support the carefully crafted processes and procedures to ensure fair recruitment. Our community liaison officers receive regular training to ensure engagement is at the level required to offset the tensions often seen in communities.
Successful engagement with local communities, as well as our trained community liaison officers and their effective relationships with community leaders, have assisted us to manage relationships on our construction contracts during the year.
A community liaison officer (CLO) is appointed on each of our key contracts to facilitate interactions with community leaders, local government officials and to facilitate efficient local recruitment. Below are some of the examples of areas where we have been successful in managing stakeholder relationships:
Beneficiaries Community/SED milestones
The Nelson Mandela Children’s Hospital Trust
Recruitment of local sub-contractors and employees on the contract and almost 50 local youth trained on the People at the Gate programme and employed on the contract
Devland Soweto Campus Construction of the foundation for the campus building and skills transfer to foremen on the contract by experienced Group Five employees
Mohau Care Centre Donation and construction of a classroom
Kalagadi – local school and community Water tanks for a school and the local community were donated and installed, a learnership programme implemented and the People at the Gate programme run in the community
DIVERSITY AND EQUAL OPPORTUNITY continued

123
Training of local people is an important part of our development strategy to ensure longer term skills transfer for when our contracts end.
Another crucial part of our community programmes is supporting local businesses through procurement of a wide range of services and products. These range from catering to cleaning services.
In terms of skills development, the group’s People at the Gate training initiative was started in F2005 and focuses on the training of local people around our sites. This programme has resulted in more than 5 000 community members from around our sites being trained since inception. Of these, 90% were employed on our sites. Most of the people who successfully complete training secure their first formal jobs on our contracts.
In addition to the community skills and local business sourcing programmes directly supported by the group, many of our employees make valuable contributions to local communities through donations of clothing, food, time and expertise. For example, through the Group Five annual blanket challenge, our employees donate blankets to needy communities in winter. In F2015, over 2 000 blankets were donated by employees.
A number of key group community interventions were implemented this year. Two of these include:
Continued sponsorship of mobile science laboratories for under-privileged
schools in Bushbuckridge – a project that has been running for five years
We have entered into a three-year partnership with Future of the African
Daughter (FOTAD), a non-profit organisation promoting leadership
development, as well as mathematics and science for high school girls from
disadvantaged communities. Group Five sponsors 15 learners under this
initiative until they complete matric
SOCIO-ECONOMIC DEVELOPMENTGroup Five’s socio-economic development has three key focus areas:
Construction-related skills, mathematics, science, environmental science and technology education
Education and skills development
01
Promoting sustainable job creation and entrepreneurial projects, particularly within marginalised and unemployed groups, such as women and the youth
Economic empowerment
02
Support grants (financial and in kind) to impoverished communities, such as orphanages, non-profit organisations that work with community programmes, HIV/Aids awareness programmes, and other cause-related initiatives
Social development
03

124
GR
OU
P F
IVE
Onl
ine
sect
ion
of t
he in
tegr
ated
ann
ual r
epor
t 20
15PEOPLE / LABOUR PRACTICES AND DECENT WORKcontinued
05
OVERALL PERFORMANCEThis year, we have again met our objective of realigning traditional social grants towards more sustainable initiatives that focus on skills development and economic empowerment. This was achieved despite very tough operational challenges and poor financial performance due to loss-making contracts in our Engineering & Construction cluster. Our spend, therefore, decreased to R2,6 million compared to R6 million last year. This represents 0.9% of our net profit after tax.
We also adapted the split of our spend to focus more on education and training, as economic empowerment unfortunately requires significant funding which could not be met in the tough financial climate.
Focus areaF2015
Rand spend
Actual
%
F2015
Target %
F2014 Rand spend
Education and skills development 2 251 951 88 55 3 170 768Economic empowerment 179 528 5 35 2 256 123Social development 125 820 7 10 670 739
2 557 299 – – 6 097 630
EDUCATION AND SKILLS DEVELOPMENTEducation and skills development are the primary focus areas of the group’s socio-economic programme. As outlined above, the majority of spend was focused in this area.
Focus areaF2015
target Achievement
F2014target Achievement
F2013target Achievement
Development 55% 88% 55% 52% 55% 62%
ECONOMIC EMPOWERMENTAs outlined above, the spend was focused on education and skills development, with the spend in economic empowerment declining from last year.
Focus areaF2015
target Achievement
F2014target Achievement
F2013target Achievement
Economic 35% 5% 35% 37% 35% 34%
SOCIAL DEVELOPMENTIn line with our strategy, social grants were allocated a smaller budget as we believe that events or donations do not transform people’s lives in the long term.
Focus areaF2015
target Achievement
F2014target Achievement
F2013target Achievement
Social 10% 7% 10% 11% 10% 4%
DIVERSITY AND EQUAL OPPORTUNITY continued

125

126
GR
OU
P F
IVE
Onl
ine
sect
ion
of t
he in
tegr
ated
ann
ual r
epor
t 20
15PEOPLE / LABOUR PRACTICES AND DECENT WORKcontinued
05 DIVERSITY AND EQUAL OPPORTUNITY continued
CLUSTER/SEGMENT SED SPEND A majority of our business segments were able to identify and implement various programmes in communities close to our contracts in line with our group SED strategy. The integrated group office continued to drive group initiatives. Below is the breakdown of this year’s performance per cluster and segment.
Clusters/segments
R’000
SED spend
F2015
R’000SED spend
F2014
ENGINEERING & CONSTRUCTION
Building & Housing – Building 433 –Building & Housing – Housing 140 155Building & Housing – Coastal 139 424Civil Engineering 23 56Civil Engineering – Plant and Equipment 54 58Projects 257 2 266Energy: Power – 9Energy: Oil & Gas 40 303Energy: Nuclear – 10
Cluster total 1 086 3 281
MANUFACTURING
Everite 164 517Pipe – –BRI 32 27
Cluster total 196 544
CORPORATE OFFICE
1 017 2 166
GROUP TOTAL SED SPEND FOR THE YEAR
2 554* 6 098
* Group total SED spend for the year of R2 525 000 adjusted for joint ventures equally accounted and joint arrangements wholly consolidated.
INVESTMENTS & CONCESSIONS
Infrastructure Development Services 20 –Transport (Intertoll) 235 67Real estate (Group Five Properties) – 40
Cluster total 255 107

127
OVER-BORDER SOCIO-ECONOMIC DEVELOPMENT
Description Country
Amount of spend
R’000
Renovation of school: books and stationery for learners DRC 50Furniture for a school in Kadoma Zimbabwe 88
Total 138
FOCUS GOING FORWARD
The group continues to expand its presence in the rest of Africa. Our SED efforts on the continent will, therefore, continue to be increased in support of the group’s African growth strategy, whilst at the same time sustaining momentum in our home country of South Africa. Effectively structured SED interventions are critical to the sustainability of our business and that of our communities.
Going forward, we aim to continue focusing on the development of communities in the catchment areas of our operations. We will also integrate our SED initiatives towards a more cohesive strategy, with greater emphasis on communication of our initiatives as a way to improve engagement with our key stakeholders.