Group 1 Final Presentation
53
Boeing Company Valuation Hannah Goldberg, Sean Ryan, Jake Varsano, Andrew Ruvkun, Ted Poatsy Tuck Bridge Program, Summer 2016
-
Upload
ted-poatsy -
Category
Documents
-
view
43 -
download
0
Transcript of Group 1 Final Presentation

Boeing Company ValuationHannah Goldberg, Sean Ryan, Jake Varsano, Andrew Ruvkun, Ted Poatsy
Tuck Bridge Program, Summer 2016

Why Boeing is currently overvalued
Aerospace industry poised for growth
Inability to meet market needs
Valuation
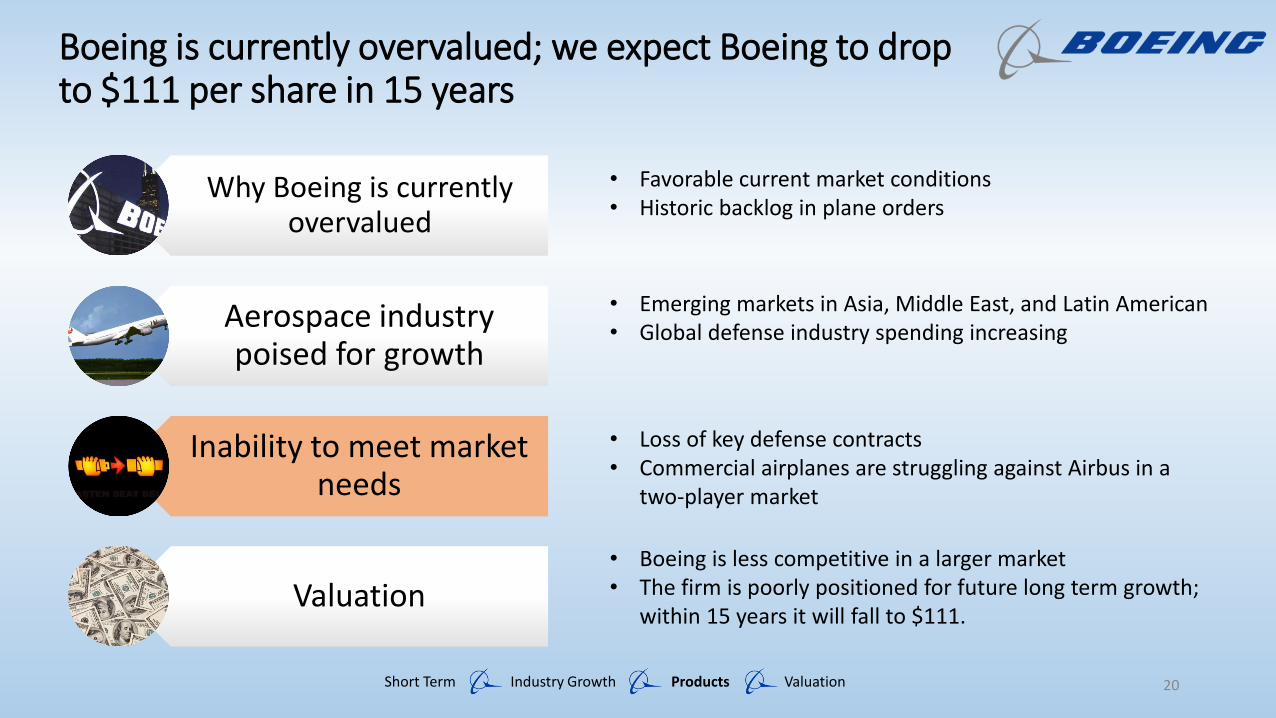
Boeing is currently overvalued; we expect Boeing to dropto $111 per share in 15 years
Short Term Industry Growth Products Valuation
• Favorable current market conditions• Historic backlog in plane orders
• Emerging markets in Asia, Middle East, and Latin American• Global defense industry spending increasing
• Loss of key defense contracts • Commercial airplanes are struggling against Airbus in a
two-player market
• Boeing is less competitive in a larger market• The firm is poorly positioned for future long term growth;
within 15 years it will fall to $111.
1

Why Boeing is currently overvalued
Aerospace industry poised for growth
Inability to meet market needs
Valuation
Boeing is currently overvalued; we expect Boeing to dropto $111 per share in 15 years
Short Term Industry Growth Products Valuation
• Favorable current market conditions• Historic backlog in plane orders
• Emerging markets in Asia, Middle East, and Latin American• Global defense industry spending increasing
• Loss of key defense contracts • Commercial airplanes are struggling against Airbus in a
two-player market
• Boeing is less competitive in a larger market• The firm is poorly positioned for future long term growth;
within 15 years it will fall to $111.
2
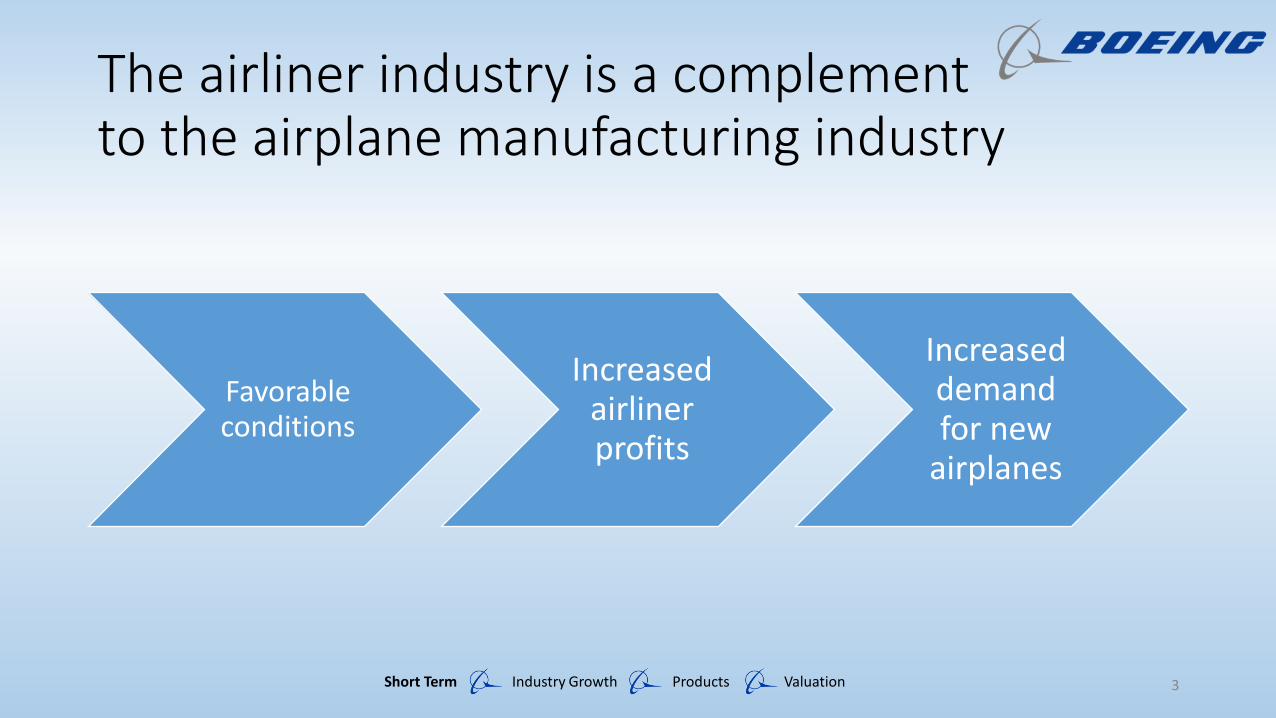
The airliner industry is a complementto the airplane manufacturing industry
Short Term Industry Growth Products Valuation
Favorable conditions
Increased airliner profits
Increased demand for new
airplanes
3

Overall airline industry growth driven by three factors
Short Term Industry Growth Products Valuation
Favorable Conditions
More demand for
air travel
Low Oil Costs
Low Interest
Rates
4

Overall airline industry growth driven by three factors
Short Term Industry Growth Products Valuation
Favorable Conditions
More demand for
air travel
Low Oil Costs
Low Interest
Rates
5

Airline passenger volume has increased due to globalization and recovery of global economy
Short Term Industry Growth Products Valuation
700
720
740
760
780
800
820
840
860
880
900
2009 2010 2011 2012 2013 2014 2015
Pas
sen
gers
(M
illio
ns)
Airline Passengers
Source: Boeing Company Data
6

Asia
North America
Latin America
Middle East
Africa
Current market outlook predicts worldwide passenger growth
AfricaLatin
AmericaMiddle
East EuropeNorth
America Asia
Asia 7.1% 7.2% 7.2% 5.1% 4.4% 6.2%
NorthAmerica
6.2% 4.9% 6.1% 3.0% 2.4%
Europe 4.7% 5.0% 5.4% 3.3%
Middle East
7.3% - 5.0%
Latin America
8.1% 6.6%
Africa 6.7%Source: Boeing Current Market Outlook 2015 - 2034
Traffic Route Growth Rates
Short Term Industry Growth Products Valuation 7

Overall airline industry growth driven by three factors
Short Term Industry Growth Products Valuation
Favorable Conditions
More demand for
air travel
Low Crude Oil Prices
Low Interest
Rates
8
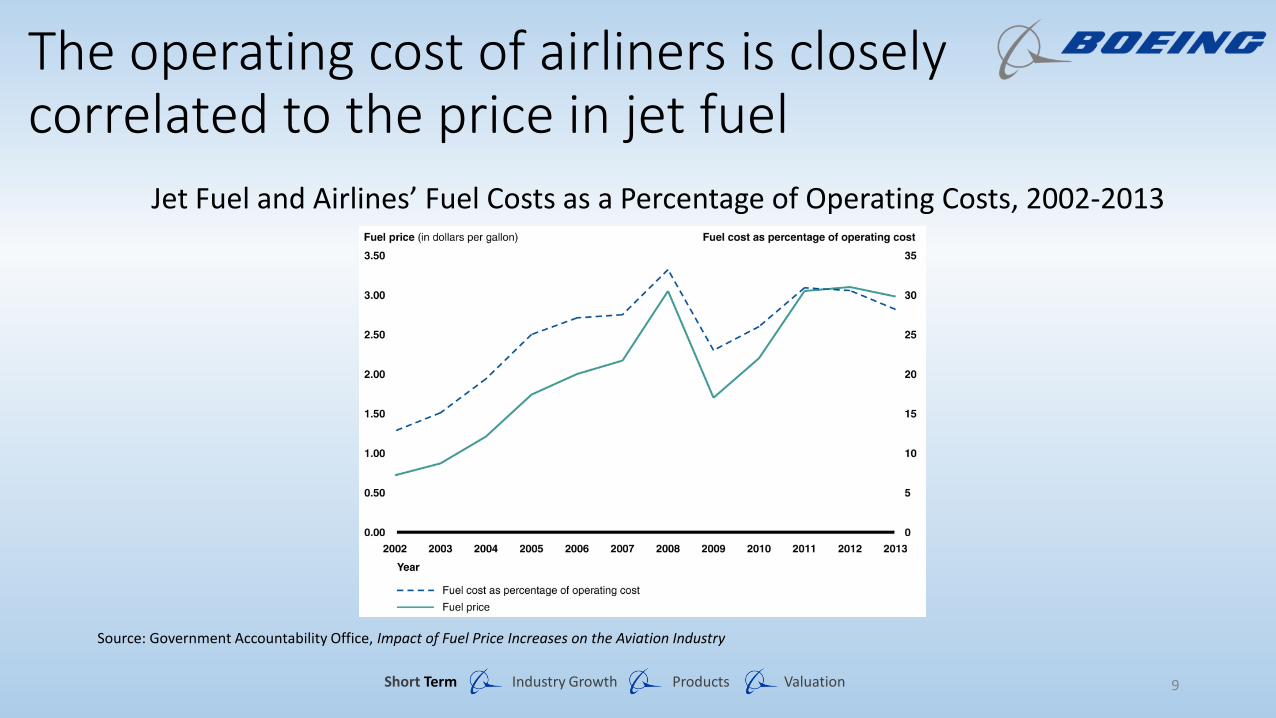
The operating cost of airliners is closely correlated to the price in jet fuel
Short Term Industry Growth Products Valuation
Source: Government Accountability Office, Impact of Fuel Price Increases on the Aviation Industry
Jet Fuel and Airlines’ Fuel Costs as a Percentage of Operating Costs, 2002-2013
9

Fall In Crude Oil has produced large profits for the airline industry
Short Term Industry Growth Products Valuation
Source: WTI
$-
$20
$40
$60
$80
$100
$120
2011 2012 2013 2014 2015 2016
Pri
ce
Crude Oil Price by QuartersHuge Profits Margins for Airliners
10

Overall airline industry growth driven by three factors
Short Term Industry Growth Products Valuation
Favorable Conditions
More demand for
air travel
Low Oil Costs
Low Interest
Rates
11
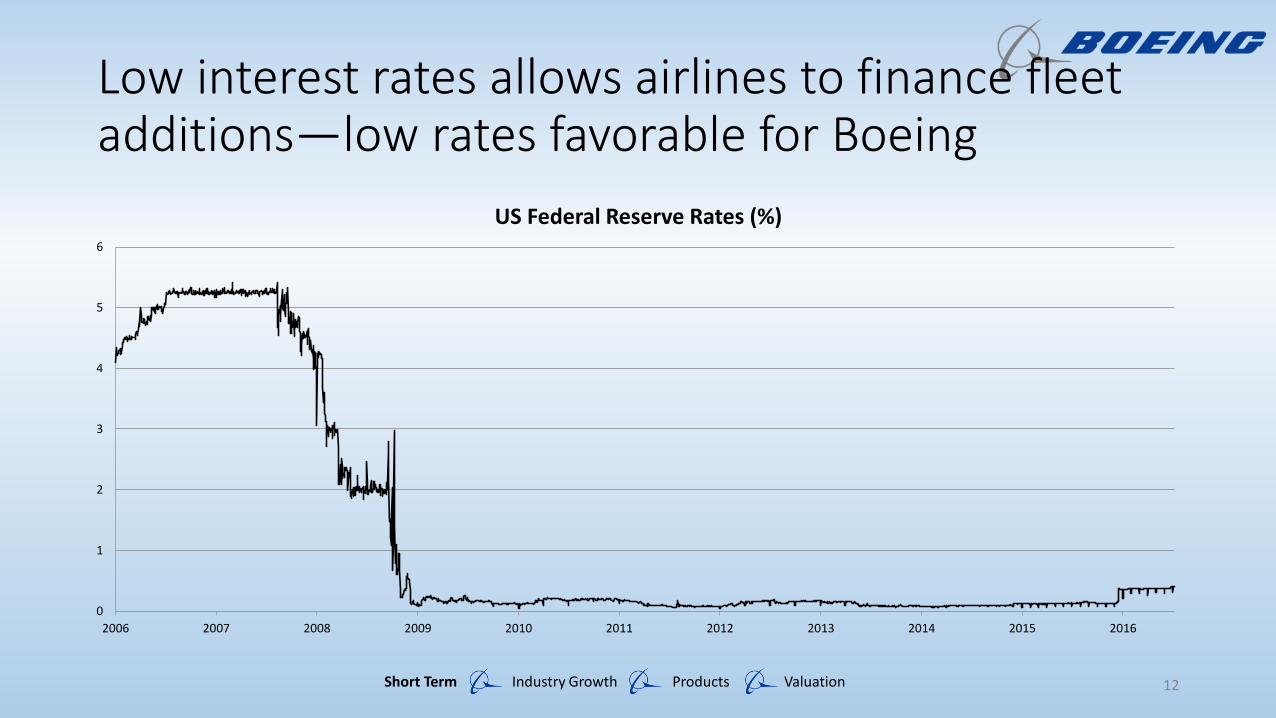
Low interest rates allows airlines to finance fleet additions—low rates favorable for Boeing
Short Term Industry Growth Products Valuation
0
1
2
3
4
5
6
2006 2007 2008 2009 2010 2011 2012 2013 2014 2015 2016
US Federal Reserve Rates (%)
12

Massive backlog in plane orders secures near term outlook
• Currently 5762 total planes in the backlog
• Factoring a high 20% cancellation rate, order sheets still full until 2022
Short Term Industry Growth Products Valuation 13

Why Boeing is currently overvalued
Aerospace industry poised for growth
Inability to meet market needs
Valuation
Boeing is currently overvalued; we expect Boeing to dropto $111 per share in 15 years
Short Term Industry Growth Products Valuation
• Favorable current market conditions• Historic backlog in plane orders
• Emerging markets in Asia, Middle East, and Latin American• Global defense industry spending increasing
• Loss of key defense contracts • Commercial airplanes are struggling against Airbus in a
two-player market
• Boeing is less competitive in a larger market• The firm is poorly positioned for future long term growth;
within 15 years it will fall to $111.
14

Boeing is a leader in the commercial and defense aerospace industries
Commercial• 2015 Revenue: $66 billion
• 762 new orders
• Current backlog at 5,800 airplanes
• Program Models: 737, 747, 767, 777, 777X, 787
• Most popular model: 737 at 10,105 total orders
Defense• 2015 Revenue: $ 30.4 billion
• 186 aircraft orders
• 15,787 weapons system orders
• Program Models: F/A-18, F-17, CH-47 Chinook, AH-64 Apache, C-17 Globemaster III
• Most popular model: CH-47 Chinook at 41 deliveries
Short Term Industry Growth Products Valuation 15
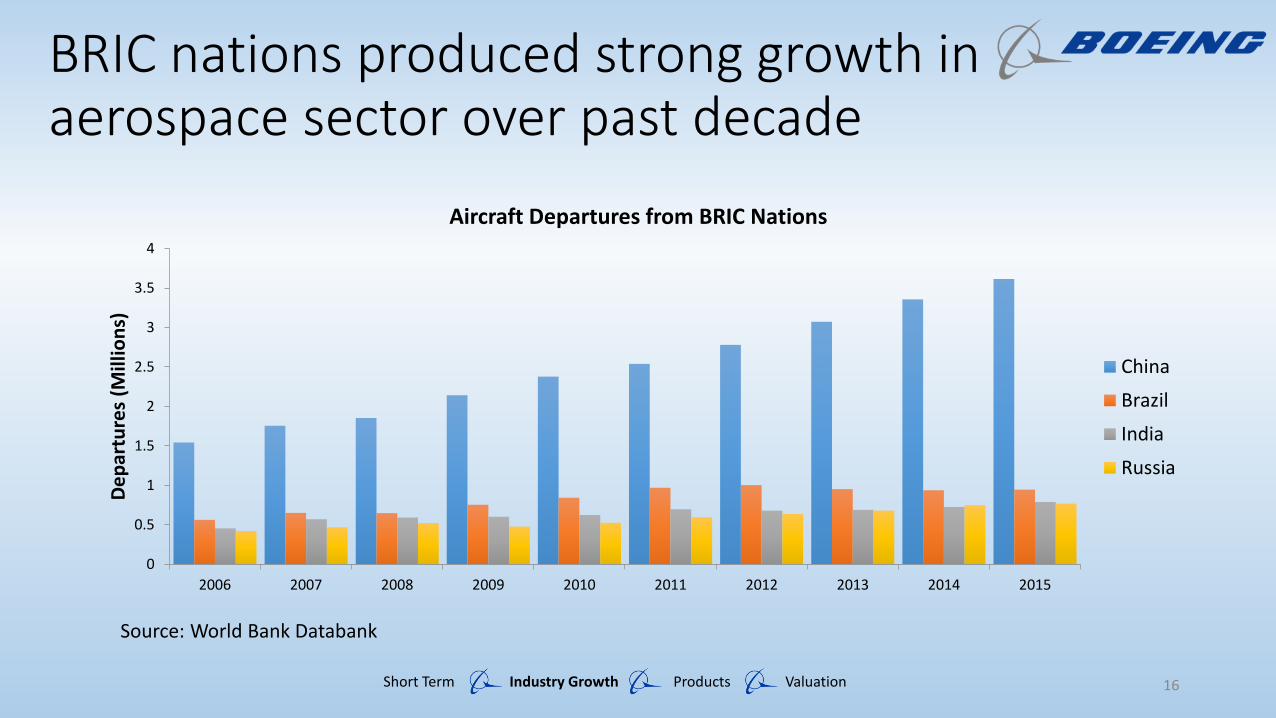
BRIC nations produced strong growth in aerospace sector over past decade
Short Term Industry Growth Products Valuation
Source: World Bank Databank
0
0.5
1
1.5
2
2.5
3
3.5
4
2006 2007 2008 2009 2010 2011 2012 2013 2014 2015
De
par
ture
s (M
illio
ns)
Aircraft Departures from BRIC Nations
China
Brazil
India
Russia
16

Global defense industry spending expected to grow
Short Term Industry Growth Products Valuation
220
230
240
250
260
270
280
290
300
2011 2012 2013 2014 2015 2016F 2017F 2018F 2019F 2020F
Rev
en
ue
(B
illio
ns)
Source: Deloitte, 2016 Global Aerospace and Defense Sector Outlook: Poised For a Rebound
Global Military Aerospace Manufacturing Revenue
17

United States defense spending is relatively stagnant
Short Term Industry Growth Products Valuation
400
450
500
550
600
650
700
750
2006 2007 2008 2009 2010 2011 2012 2013 2014 2015 2016 2017 2018 2019
Spe
nd
ing
($ b
illio
n)
US Defense Budget
18
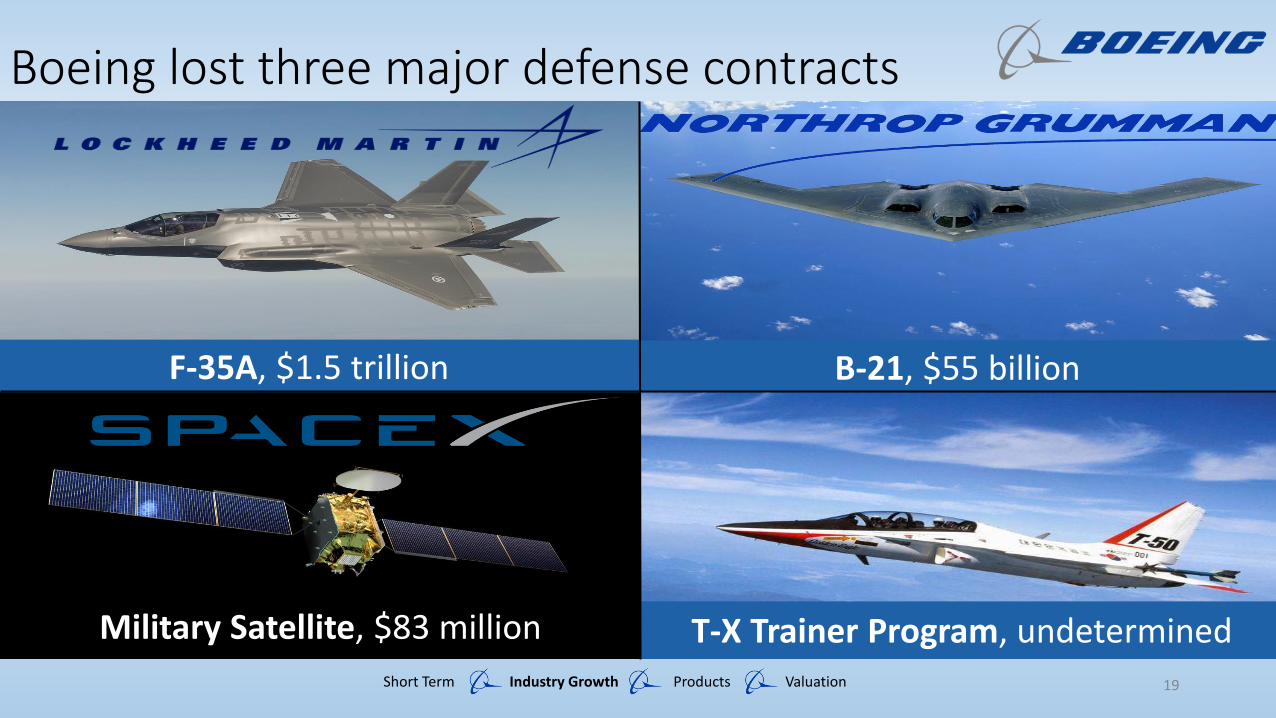
Boeing lost three major defense contracts
B-21, $55 billion
Short Term Industry Growth Products Valuation
Military Satellite, $83 million
F-35A, $1.5 trillion
T-X Trainer Program, undetermined
19
Why Boeing is currently overvalued
Aerospace industry poised for growth
Inability to meet market needs
Valuation
Boeing is currently overvalued; we expect Boeing to dropto $111 per share in 15 years
Short Term Industry Growth Products Valuation
• Favorable current market conditions• Historic backlog in plane orders
• Emerging markets in Asia, Middle East, and Latin American• Global defense industry spending increasing
• Loss of key defense contracts • Commercial airplanes are struggling against Airbus in a
two-player market
• Boeing is less competitive in a larger market• The firm is poorly positioned for future long term growth;
within 15 years it will fall to $111.
20

69% 14% 10% 8%TotalRevenue
(M)
Revenue per Segment (2015)
Commercial Aerospace
Boeing Capital(not visible <0.5%)
$66,048 $13,482 $7,751 $9,155
Source: Boeing SEC 10-K 2015 Annual Report
Defense Aerospace*
Commercial Aerospace earns 69% of Boeing’s total revenues
* Defense revenues are broken down into segments: BMA, GS&S, N&SS
Short Term Industry Growth Products Valuation

Boeing’s commercial revenue outpaces defense
Short Term Industry Growth Products Valuation 22
0
20
40
60
80
100
120
140
2006 2007 2008 2009 2010 2011 2012 2013 2014 2015
Boeing Revenue Breakdown ($ Billion)
Defense Revenue Total Revenue

Airliners evaluate planes based on capacity, efficiency, and range
Capacity
Efficiency
RangeShort Term Industry Growth Products Valuation 23

Airbus meets airliners’ needs better than Boeing does
Narrow Body Wide Body
737 MAX 8 A320 neo 777-200 A350-800
Capacity(Passengers)
162 165 314 325
Efficiency(mpg/passenger)
103 105 86 98
Range(n mi)
3515 3500 5240 8100
Release Year 2017 2016 1998 2014
Short Term Industry Growth Products Valuation 24
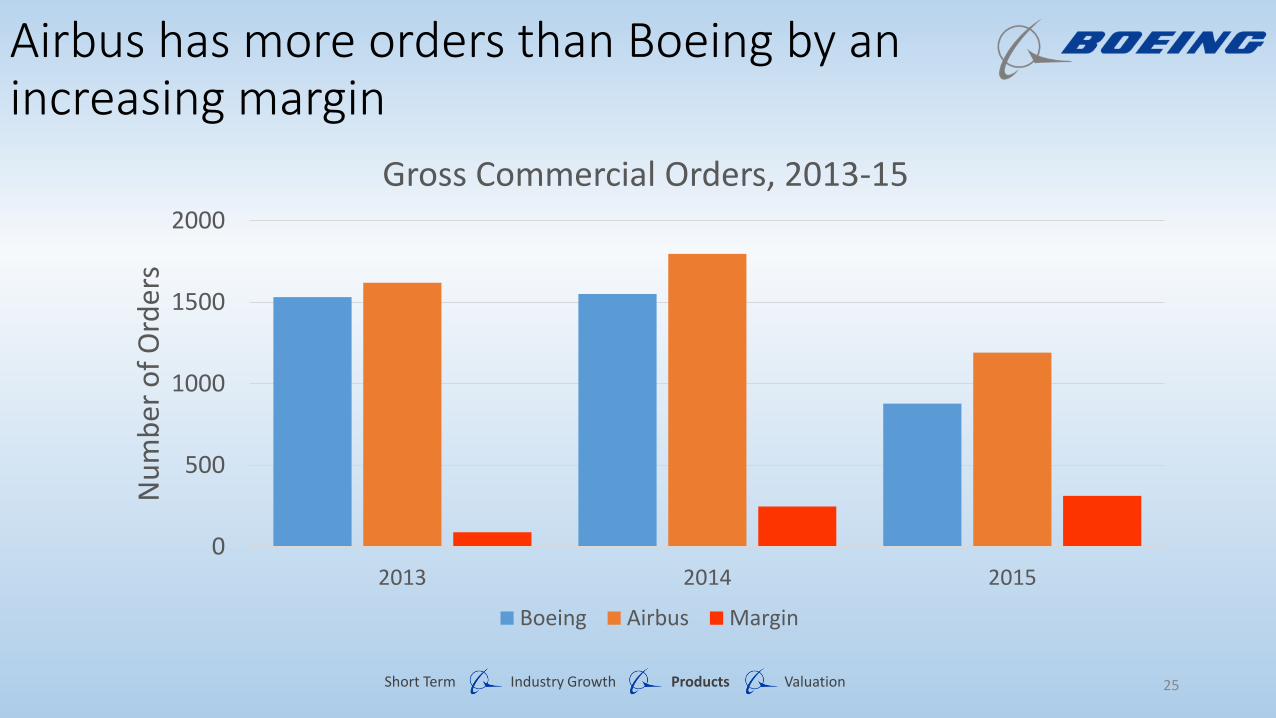
0
500
1000
1500
2000
2013 2014 2015
Nu
mb
er o
f O
rder
sGross Commercial Orders, 2013-15
Boeing Airbus Margin
Airbus has more orders than Boeing by an increasing margin
Short Term Industry Growth Products Valuation 25
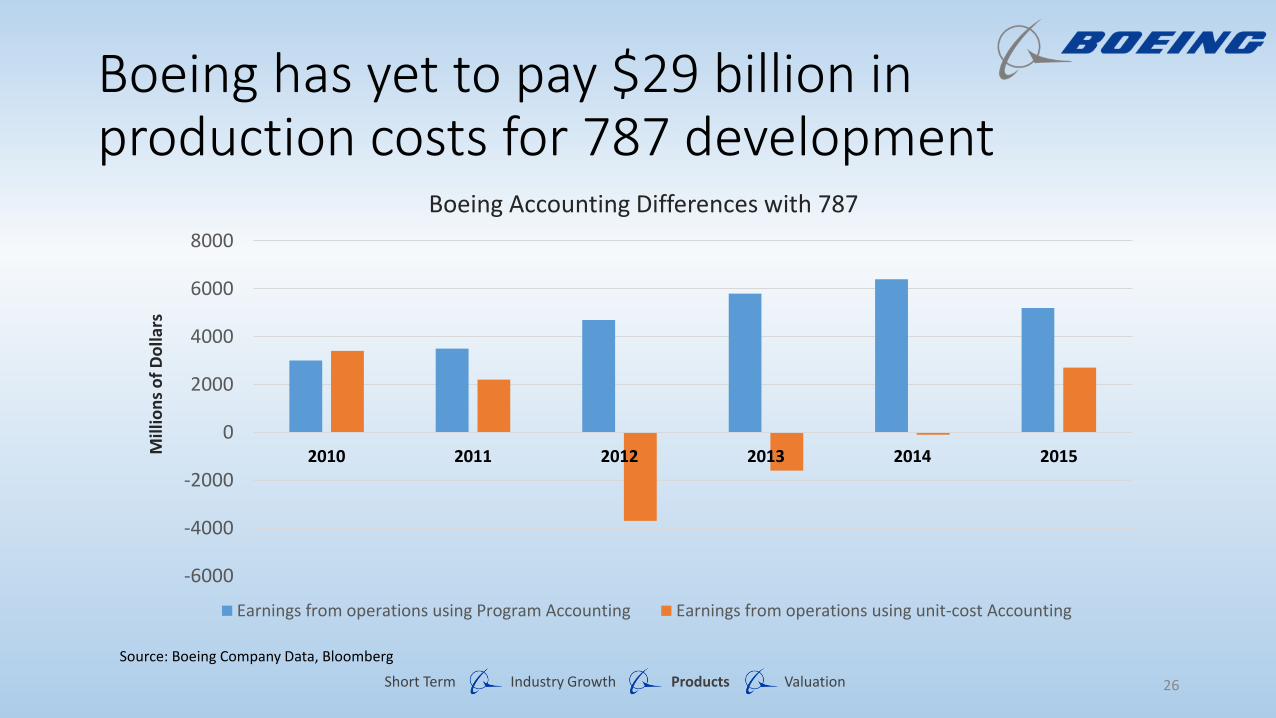
Boeing has yet to pay $29 billion in production costs for 787 development
Short Term Industry Growth Products Valuation
-6000
-4000
-2000
0
2000
4000
6000
8000
2010 2011 2012 2013 2014 2015Mill
ion
s o
f D
olla
rs
Boeing Accounting Differences with 787
Earnings from operations using Program Accounting Earnings from operations using unit-cost Accounting
Source: Boeing Company Data, Bloomberg
26

Why Boeing is currently overvalued
Aerospace industry poised for growth
Inability to meet market needs
Valuation
Boeing is currently overvalued; we expect Boeing to dropto $111 per share in 15 years
Short Term Industry Growth Products Valuation
• Favorable current market conditions• Historic backlog in plane orders
• Emerging markets in Asia, Middle East, and Latin American• Global defense industry spending increasing
• Loss of key defense contracts • Commercial airplanes are struggling against Airbus in a
two-player market
• Boeing is less competitive in a larger market• The firm is poorly positioned for future long term growth;
within 15 years it will fall to $111.
27
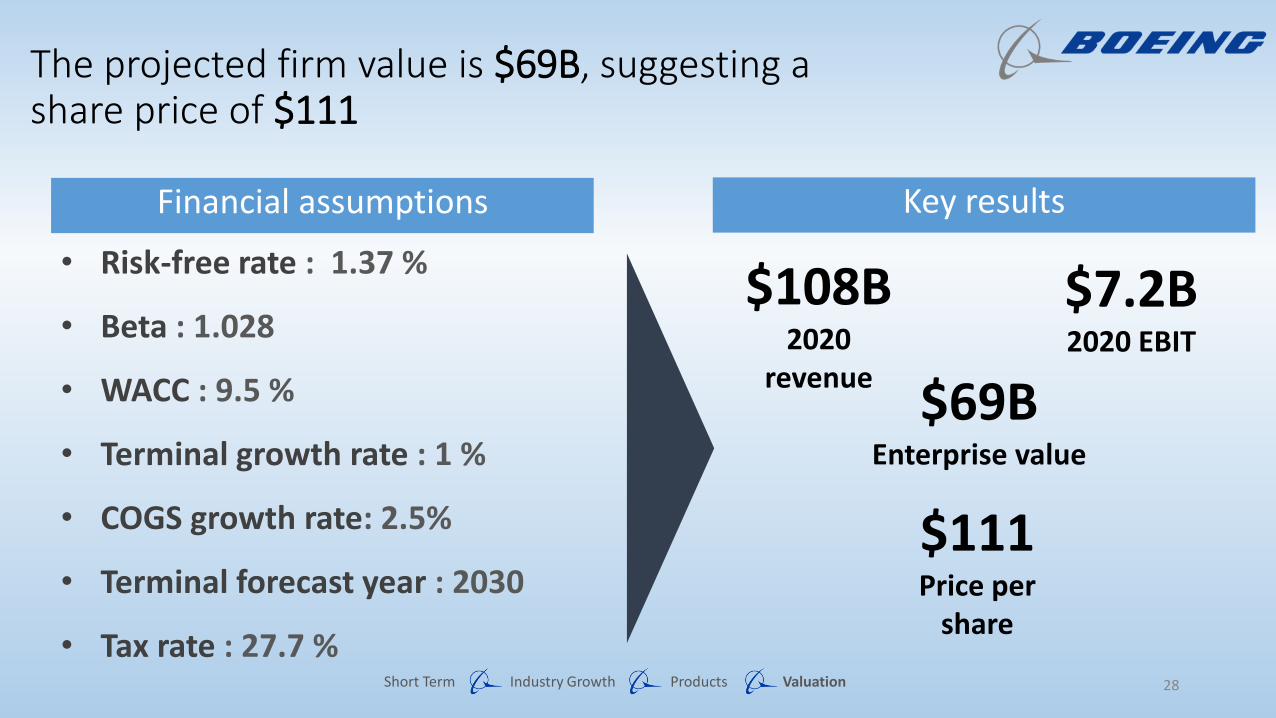
• Risk-free rate : 1.37 %
• Beta : 1.028
• WACC : 9.5 %
• Terminal growth rate : 1 %
• COGS growth rate: 2.5%
• Terminal forecast year : 2030
• Tax rate : 27.7 %
The projected firm value is $69B, suggesting a share price of $111
Financial assumptions Key results
$108B2020
revenue
$7.2B2020 EBIT
$69BEnterprise value
$111Price per
share
Short Term Industry Growth Products Valuation 28

Year 2015 2016 2017 2018 2019 2020 Terminal Value
Total Revenue 96,114 98,517 100,980 103,504 106,062 108,744
Cost of Goods Sold 82,088 84,140 86,243 88,398 90,608 92,873
EBIT 8,668 8,930 9,200 9,476 9,760 10,053
After-tax Income 6,267 6,456 6,651 6,851 7,057 7,268
(+) Depr. & Amort 1,833 1,851 1,870 1,889 1,907 1,927
(-) ∆ NWC 388 391 394 396 398
(-) CAPX 2,458 2,530 2,593 2,658 2,724
Free Cash Flows 4,980 4,673 4,386 4,116 3,863 46,788
Enterprise Value: $69 WACC: 9.5% Current Share Price: $127.17Estimated Share Price: $111
(Millions)
Less competitive products will decrease Boeing’s share price to $111 despite a growing industry
27Short Term Industry Growth Products Valuation

Sensitivity Analysis
0.00% 0.25% 0.50% 0.75% 1.00% 1.25% 1.50% 1.75% 2.00%
8.00% $ 122 $ 125 $ 128 $ 131 $ 134 $ 138 $ 142 $ 146 $ 150
8.25% $ 119 $ 121 $ 124 $ 127 $ 130 $ 133 $ 136 $ 140 $ 144
8.50% $ 115 $ 117 $ 120 $ 123 $ 125 $ 128 $ 132 $ 135 $ 139
8.75% $ 112 $ 114 $ 116 $ 119 $ 121 $ 124 $ 127 $ 130 $ 134
9.00% $ 109 $ 111 $ 113 $ 115 $ 118 $ 120 $ 123 $ 126 $ 129
9.25% $ 106 $ 108 $ 110 $ 112 $ 114 $ 117 $ 119 $ 122 $ 125
9.50% $ 103 $ 105 $ 107 $ 109 $ 111 $ 113 $ 115 $ 118 $ 121
9.75% $ 101 $ 102 $ 104 $ 106 $ 108 $ 110 $ 112 $ 114 $ 117
10.00% $ 98 $ 100 $ 101 $ 103 $ 105 $ 107 $ 109 $ 111 $ 113
10.25% $ 96 $ 97 $ 99 $ 100 $ 102 $ 104 $ 106 $ 108 $ 110
10.50% $ 93 $ 95 $ 96 $ 98 $ 99 $ 101 $ 103 $ 105 $ 107
10.75% $ 91 $ 93 $ 94 $ 95 $ 97 $ 98 $ 100 $ 102 $ 104
11.00% $ 89 $ 90 $ 92 $ 93 $ 94 $ 96 $ 98 $ 99 $ 101
Short Term Industry Growth Products Valuation 30
Terminal Growth Rate
WACC

Why Boeing is currently overvalued
Aerospace industry poised for growth
Inability to meet market needs
Valuation
Boeing is currently overvalued; we expect Boeing to dropto $111 per share in 15 years
Short Term Industry Growth Products Valuation
• Favorable current market conditions• Historic backlog in plane orders
• Emerging markets in Asia, Middle East, and Latin American• Global defense industry spending increasing
• Loss of key defense contracts • Commercial airplanes are struggling against Airbus in a
two-player market
• Boeing is less competitive in a larger market• The firm is poorly positioned for future long term growth;
within 15 years it will fall to $111.
31

Index of the Appendix
Short Term Industry Growth Products Valuation 32
Brexit36 Brexit’s impact on Boeing (USD/GBP)37 S&P 1500 (Airlines) vs. NYSE BA
Traffic Growth34 Global traffic increase by market35 South Asian market leads in traffic growth45- China Air Traffic50- Comm. Air LT Growth
Exchange Rates and Commodity Prices41 Monthly Exchange Rates 2011-201642 Price of Aluminum43 Titanium Historic Costs44 Indexed Costs of All Raw Materials
Financial Data39- Historical Stock Price51- Expanded FCF52- Beta and WACC
Market Competition46- Wide Body Market47- Narrow Body Market48- Single Aisle Market
Fleet Growth33 Growth, replacement, retained
Misc.38- Average Ticket Price40- Boeing Backlog49- Comm. Air Deliveries

Older airplanes replaced with more efficient,newer generation models as airlines refinance
Short Term Industry Growth Products Valuation
Air
pla
nes
Source: Boeing Current Market Outlook

Short Term Industry Growth Products Valuation
Global traffic increase by market
Source: Boeing Current Market Outlook

South Asian market leads in traffic growth
Short Term Industry Growth Products Valuation
Source: Boring Current Market Outlook

Short Term Industry Growth Products Valuation
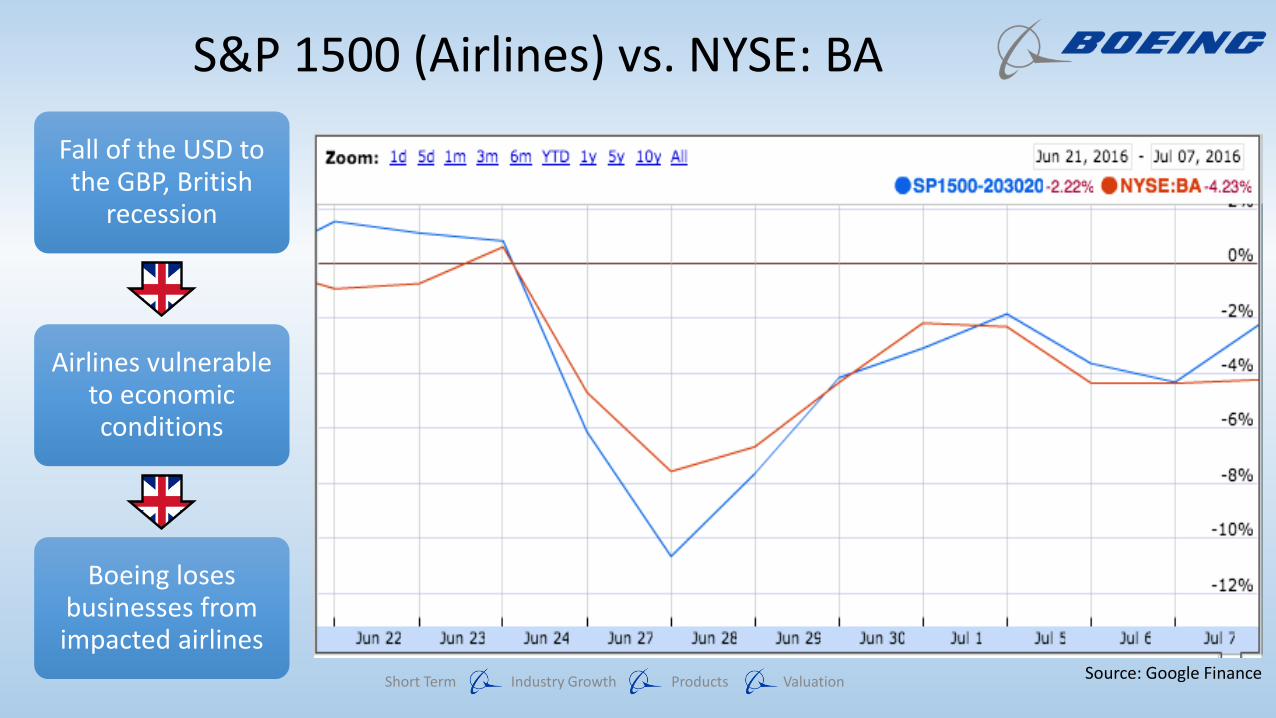
Brexit’s impact on Boeing
Fall of the USD to the GBP, British
recession
Airlines vulnerable to economic conditions
Boeing loses businesses from impacted airlines
June 23, 2016 Brexit
Source: XE.com
Short Term Industry Growth Products Valuation
Fall of the USD to the GBP, British
recession
Airlines vulnerable to economic conditions
Boeing loses businesses from impacted airlines
S&P 1500 (Airlines) vs. NYSE: BA
Source: Google Finance

Average Plane Ticket Price
Short Term Industry Growth Products Valuation 38
500
550
600
650
700
750
800
850
2009 2010 2011 2012 2013 2014* 2015*
Pri
ce in
U.S
. D
olla
rs
Year
Average Global Airfare Price

Historical Stock Price, 1980-present
Short Term Industry Growth Products Valuation 39

Boeing backlog
• Firms pay 1% of the order total when they place an order• Costs increase as delivery date nears
0 500 1000 1500 2000 2500 3000 3500
737- 800A
777F
737-700
767-300F
737-900ER
787-9
777-300ER
787-10
777X
787-8
737-800
737 MAX
Backlog Breakdown By Model
Series1
Short Term Industry Growth Products Valuation 40
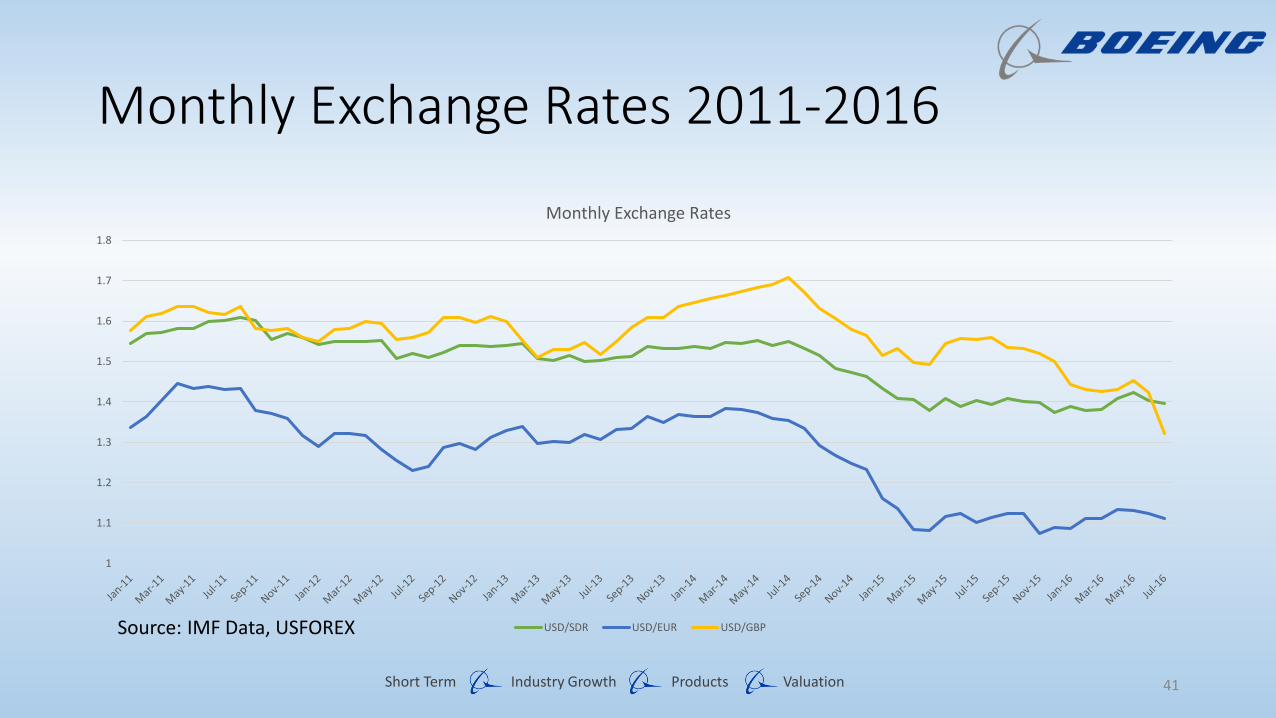
Monthly Exchange Rates 2011-2016
Short Term Industry Growth Products Valuation
1
1.1
1.2
1.3
1.4
1.5
1.6
1.7
1.8
Monthly Exchange Rates
USD/SDR USD/EUR USD/GBPSource: IMF Data, USFOREX
41
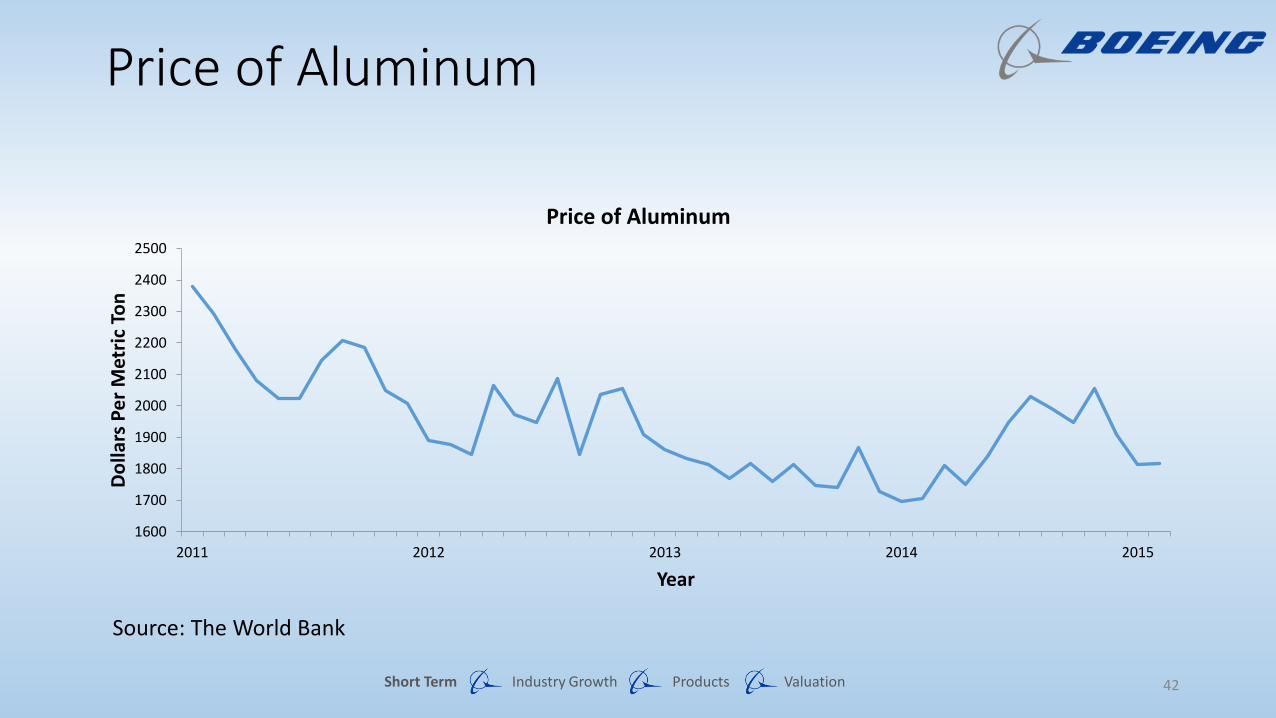
Price of Aluminum
Short Term Industry Growth Products Valuation
Source: The World Bank
1600
1700
1800
1900
2000
2100
2200
2300
2400
2500
2011 2012 2013 2014 2015
Do
llars
Pe
r M
etri
c To
n
Year
Price of Aluminum
42
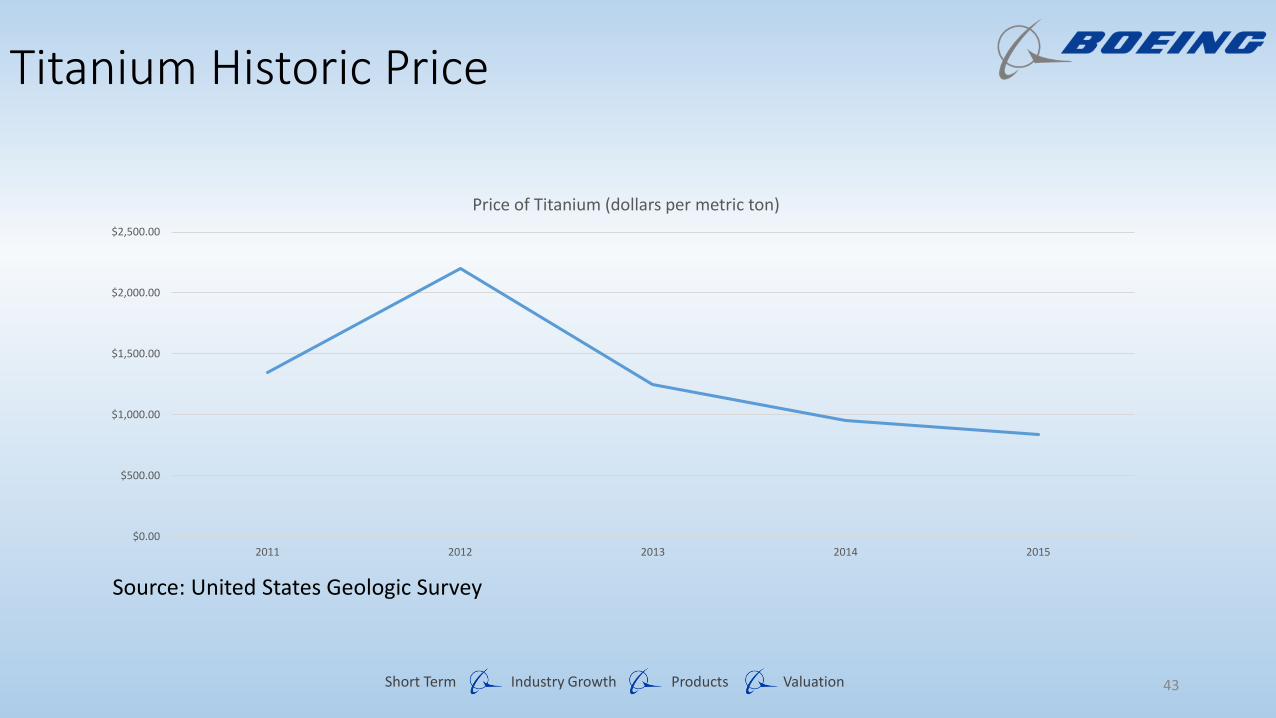
Titanium Historic Price
Short Term Industry Growth Products Valuation
Source: United States Geologic Survey
$0.00
$500.00
$1,000.00
$1,500.00
$2,000.00
$2,500.00
2011 2012 2013 2014 2015
Price of Titanium (dollars per metric ton)
43
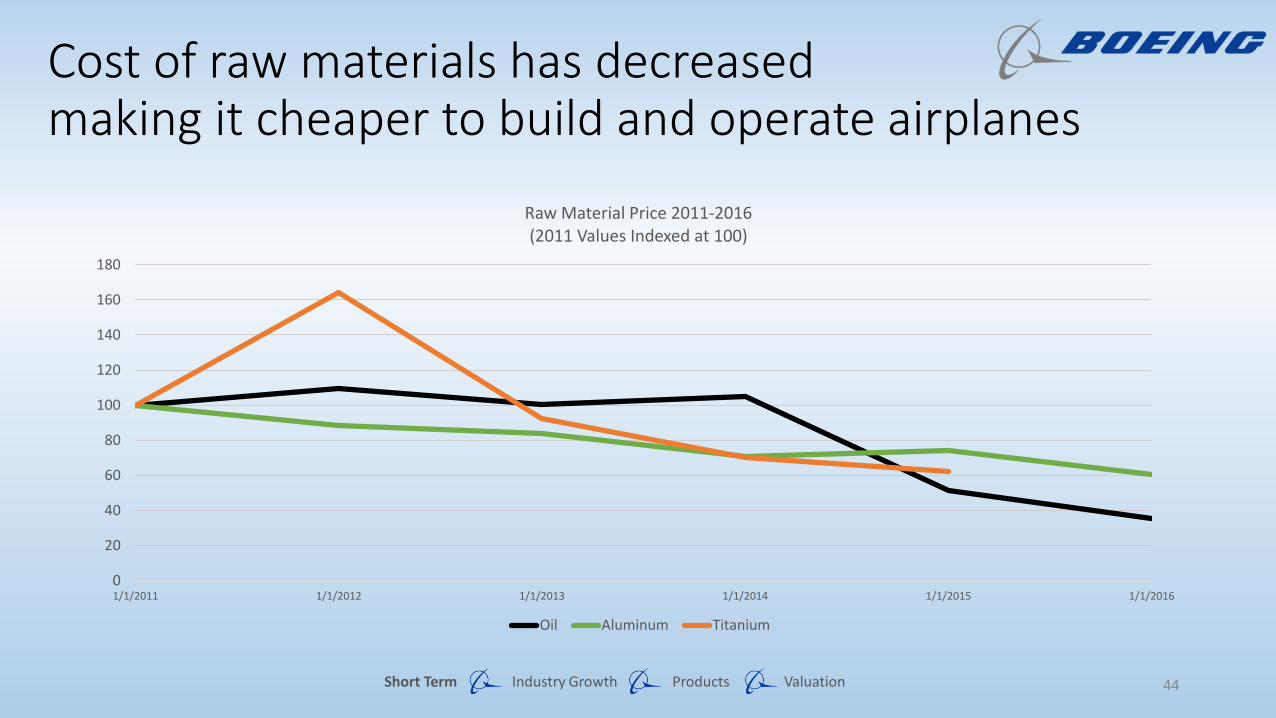
Cost of raw materials has decreased making it cheaper to build and operate airplanes
Short Term Industry Growth Products Valuation
0
20
40
60
80
100
120
140
160
180
1/1/2011 1/1/2012 1/1/2013 1/1/2014 1/1/2015 1/1/2016
Raw Material Price 2011-2016 (2011 Values Indexed at 100)
Oil Aluminum Titanium
44
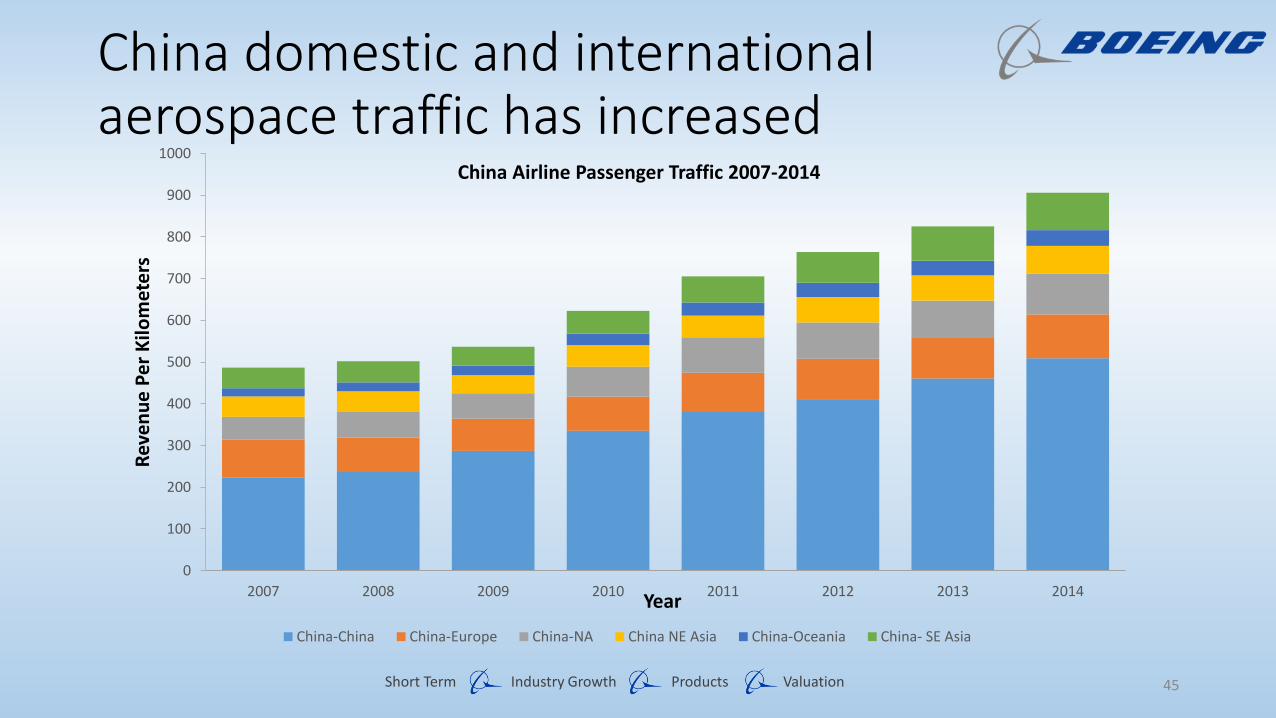
China domestic and international aerospace traffic has increased
Short Term Industry Growth Products Valuation
0
100
200
300
400
500
600
700
800
900
1000
2007 2008 2009 2010 2011 2012 2013 2014
Rev
en
ue
Pe
r K
ilom
ete
rs
Year
China Airline Passenger Traffic 2007-2014
China-China China-Europe China-NA China NE Asia China-Oceania China- SE Asia
45

Wide-body passenger airplanes products in production or use
Short Term Industry Growth Products Valuation
Large Medium Small
Boeing 747-8 Boeing 777, 777X Boeing 767, 787-8, -9
Airbus A380 Boeing 787-10 Airbus A330-200, -300, -800, -900
Airbus A350-1000 Airbus A350-800, -900
Illyushin IL-96
Source: Boeing, Current Market Outlook 2014- 2034
46

Boeing’s narrow-body models dominate its backlogs
Short Term Industry Growth Products Valuation
76.85%
12.79%
8.61%
1.37%
0.38%
0% 10% 20% 30% 40% 50% 60% 70% 80% 90%
737 Family
787 Family
777 Family
767 Family
747 Family
Backlog Breakdown by Product Line
Source: Boeing Company Data
47

Single Aisle Passenger Airplanes Products in Production or Use
Single Aisle Regional Jets
Boeing 737-600, -700, -800, -900ER
AVIC ARJ-900 Antonov An-148, -158 AVIC ARJ-700
Boeing 737-MAX7, MAX8, MAX9 Bombardier CRJ-1000 Bombardier CS100, CS300
Bombardier CRJ
Airbus A318, A319, A320, A321 Embraer 190, 195 Comac C919
Embraer 170, 175 Mitsubishi MRJ
Airbus A319neo, A320neo, A321neo
Tupolev TU-204, TU-214 Sukhoi Superjet 100
Source: Boeing, Current Market Outlook 2014- 2034
Short Term Industry Growth Products Valuation 48

Commercial aerospace deliveries will increase
Short Term Industry Growth Products Valuation
800
900
1,000
1,100
1,200
1,300
1,400
1,500
1,600
2011 2012 2013 2014 2015 2016F 2017F 2018F 2019F 2020F
Nu
mb
er
of
Air
craf
ts
Year
Commercial Aerospace Deliveries
Source: Deloitte, 2016 Global Aerospace and Defense Sector Outlook: Poised For a Rebound
49

Commercial airline industry is forecasted tosee consistent growth in the next 15 years
Short Term Industry Growth Products Valuation
0
100
200
300
400
Commercial Industry Growth, 2015-33 ($ Billions)
United States Asia Consolidated Total
50
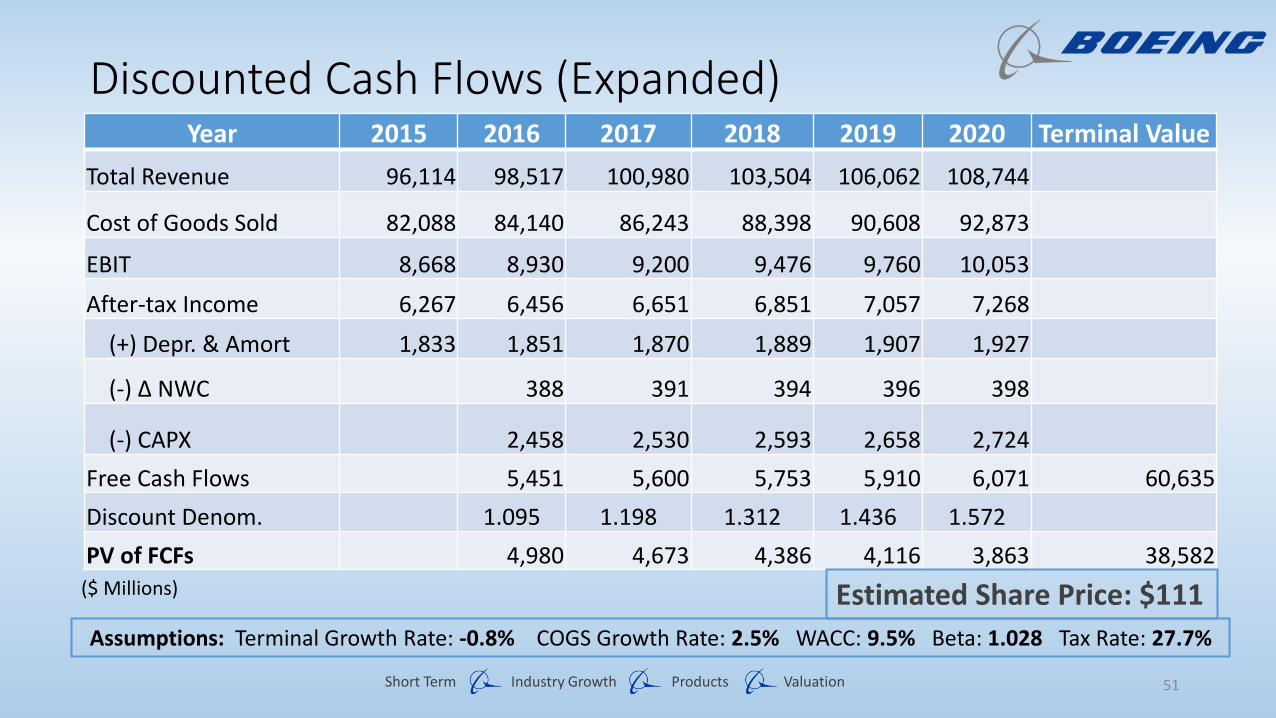
Discounted Cash Flows (Expanded)Year 2015 2016 2017 2018 2019 2020 Terminal Value
Total Revenue 96,114 98,517 100,980 103,504 106,062 108,744
Cost of Goods Sold 82,088 84,140 86,243 88,398 90,608 92,873
EBIT 8,668 8,930 9,200 9,476 9,760 10,053
After-tax Income 6,267 6,456 6,651 6,851 7,057 7,268
(+) Depr. & Amort 1,833 1,851 1,870 1,889 1,907 1,927
(-) ∆ NWC 388 391 394 396 398
(-) CAPX 2,458 2,530 2,593 2,658 2,724
Free Cash Flows 5,451 5,600 5,753 5,910 6,071 60,635
Discount Denom. 1.095 1.198 1.312 1.436 1.572
PV of FCFs 4,980 4,673 4,386 4,116 3,863 38,582
Assumptions: Terminal Growth Rate: -0.8% COGS Growth Rate: 2.5% WACC: 9.5% Beta: 1.028 Tax Rate: 27.7%
($ Millions) Estimated Share Price: $111
Short Term Industry Growth Products Valuation 51
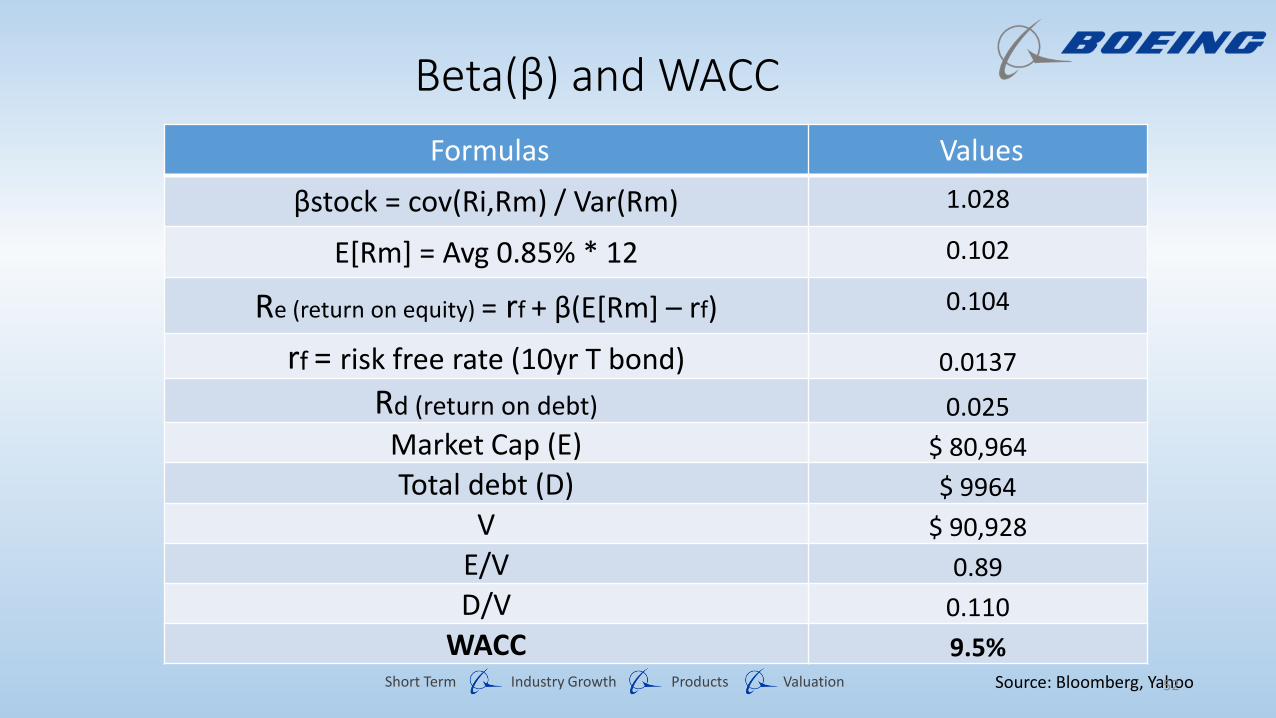
Beta(β) and WACC
Formulas Values
βstock = cov(Ri,Rm) / Var(Rm) 1.028
E[Rm] = Avg 0.85% * 12 0.102
Re (return on equity) = rf + β(E[Rm] – rf) 0.104
rf = risk free rate (10yr T bond) 0.0137
Rd (return on debt) 0.025
Market Cap (E) $ 80,964
Total debt (D) $ 9964
V $ 90,928
E/V 0.89
D/V 0.110
WACC 9.5%Source: Bloomberg, YahooShort Term Industry Growth Products Valuation 52