
Groundwater Impact Assessment Report
26
Groundwater Impact Assessment Report Oromia IAIP and RTC Report Produced by: WSP in collaboration with Engineer Tequam Water Resources Development and Environment Consultancy (ETWRDEC) DATE: APRIL 2018
Transcript of Groundwater Impact Assessment Report
Groundwater Impact Assessment
Report
Oromia IAIP and RTC
Report Produced by:
WSP in collaboration with Engineer Tequam Water Resources Development and
Environment Consultancy (ETWRDEC)
DATE: APRIL 2018
Hydrology Impact Assessment Report Amhara IAIP & RTC April 2018
Contents
1 INTRODUCTION .................................................. 1
2 AIMS AND OBJECTIVES ................................. 1
3 METHODOLOGY ................................................. 1
3.1 Desktop Assessment .................................................. 1
3.2 Site Assessment and Hydrocensus ...................... 1
3.3 Water Borehole Drilling and Testing Programme ...................................................................... 2
3.4 Water Quality Monitoring Programme .............. 2
3.5 Detailed Risk Assessment ........................................ 3
4 BASELINE ENVIRONMENT .......................... 4
4.1 Geology .............................................................................. 4
4.2 Hydrogeology .................................................................5
5 IMPACT ASSESSMENT ................................. 10
6 CONCLUSIONS AND RECOMMENDATIONS ...................................12
Oromia Groundwater Impact Assessment April 2018 Page 1
1 INTRODUCTION The purpose of this Chapter is to describe the receiving environment in terms of groundwater within the Project site and surrounding area, to identify any potential impacts to the hydrogeological environment as a result of the Project and to recommend associated mitigation measures. The study was carried out by conducting a detailed site investigation of the IAIP and RTC sites and carrying out a hydrocensus in their vicinities in order to identify and classify all groundwater sources.
2 AIMS AND OBJECTIVES The main aims of the groundwater investigation are as follows:
— To identify all groundwater users within and surrounding the Oromia IAIP and RTC sites;
— To describe the baseline hydrogeological environment prior to development;
— To identify any potential risks to the hydrogeological environment associated with the development of the IAIP and RTC sites; and
— To propose mitigation measures associated with the identified risks.
3 METHODOLOGY
3.1 DESKTOP ASSESSMENT A detailed desktop assessment was undertaken for the Oromia IAIP and RTC sites prior to site work commencing. All available data, including topography data, climate data, hydrogeological classification maps, drilling and pump testing reports and design plans, was reviewed. This data allowed for the establishment of general hydrogeological conditions on site, and was used as the basis for the planning of the site investigation.
3.2 SITE ASSESSMENT AND HYDROCENSUS Site visits were conducted from the 17th to the 18th of August 2017 at the Oromia IAIP and RTC sites. During the site visits, a detailed hydrocensus was carried out across the areas in order to identify all groundwater users and/or groundwater abstraction points. A total of four points were identified at the IAIP site. No groundwater points were identified at the RTC site. The following steps were taken and data gathered at each identified point:
— Location of the point was recorded using a hand held GPS;
— The depth to groundwater was measured and recorded using an electronic dip meter;
— Information was gathered from the water source owner or the water users regarding water use, abstraction volumes, water reliability and availability between wet season and dry season and water quality; and
— Water samples were collected in laboratory approved containers in accordance with internationally accepted best practice guidelines and were submitted to a suitably accredited laboratory for chemical analysis.
Oromia Groundwater Impact Assessment April 2018 Page 2
3.3 WATER BOREHOLE DRILLING AND TESTING PROGRAMME
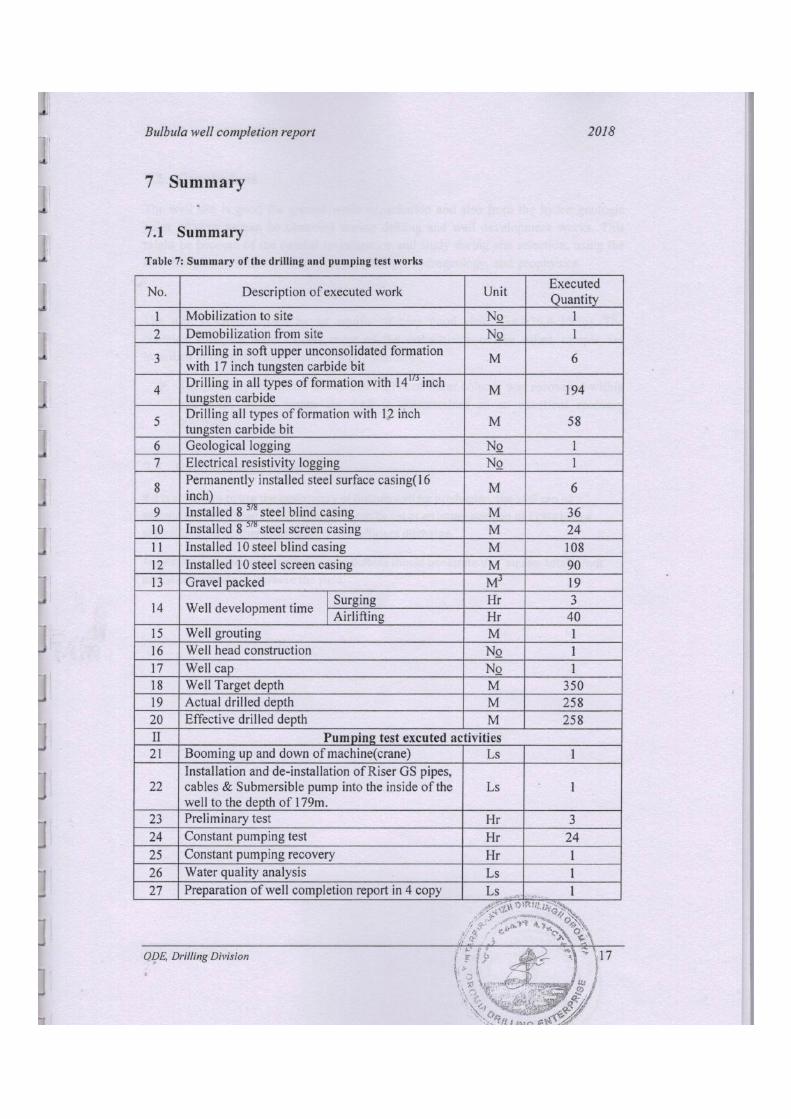
The IPDC undertook a drilling programme at the beginning of 2018 as a potential means of water supply for the Bulbula IAIP site. Drilling was undertaken by Oromia Drilling Enterprise. The borehole was drilled to a depth of 258m, with a final cased diameter of 203mm using conventional down the hole hammer percussion drilling methods. Hydrogeological logging was carried out on the borehole during the drilling process, collecting data on geological material drilled, weathering profiles, water strikes, penetration rates etc.
Upon completion of the drilling, a pump test was conducted on the borehole in order to determine the hydraulic parameters of the aquifer units intersected and the safe abstraction yield for the borehole. Pump testing consisted of the following components:
— A 3 hour calibration test conducted at maximum pump discharge. The purpose of this test is to calculate the most suitable discharge rate for the constant discharge test;
— A constant discharge test, conducted at a discharge rate of 26.6 l/s over a 24 hour period; and
— A recover test, where the water level recovery was measured to 97% of its original (pre pumping) level.
A water quality sample was collected at the end of the constant discharge test and submitted to Oromia Water Works Design and Supervision Enterprise laboratory for chemical analysis.
3.4 WATER QUALITY MONITORING PROGRAMME The water quality monitoring programme was developed in accordance with the IFC World Bank Group Guidelines (IFC, 2007) which states the following:
— A water quality monitoring program with adequate resources and management oversight should be developed and implemented to meet the objective(s) of the monitoring program. The water quality monitoring program should consider the following elements:
— Monitoring parameters: The parameters selected for monitoring should be indicative of the pollutants of concern from the process, and should include parameters that are regulated under compliance requirements;
— Monitoring type and frequency: Wastewater monitoring should take into consideration the discharge characteristics from the process over time. Monitoring of discharges from processes with batch manufacturing or seasonal process variations should take into consideration of time-dependent variations in discharges and, therefore, is more complex than monitoring of continuous discharges. Effluents from highly variable processes may need to be sampled more frequently or through composite methods. Grab samples or, if automated equipment permits, composite samples may offer more insight on average concentrations of pollutants over a 24-hour period. Composite samplers may not be appropriate where analytes of concern are short-lived (e.g., quickly degraded or volatile).
— Monitoring locations: The monitoring location should be selected with the objective of providing representative monitoring data. Effluent sampling stations may be located at the final discharge, as well as at strategic upstream points prior to merging of different discharges. Process discharges should not be diluted prior or after treatment with the objective of meeting the discharge or ambient water quality standards.
— Data quality: Monitoring programs should apply internationally approved methods for sample collection, preservation and analysis. Sampling should be conducted by or under the supervision of trained individuals. Analysis should be conducted by entities permitted or certified for this purpose. Sampling and Analysis Quality Assurance/Quality Control (QA/QC) plans should be prepared and, implemented. QA/QC documentation should be included in monitoring reports.
Oromia Groundwater Impact Assessment April 2018 Page 3
3.5 DETAILED RISK ASSESSMENT The main issues and potential impacts associated with the proposed project were determined at a desktop level, based on existing information, as well as from site investigations and specialist input. The following methodology was used:
— Identify potential sensitive environments and receptors that may be impacted on by the proposed project.
— Identify the types of impacts that are most likely to occur (including cumulative impacts);
— Determine the nature and extent of the potential impacts during the various development phases including, construction, operation and decommissioning; and
— Summarise the potential impacts that will be considered further in the EIA Phase through detailed specialist studies.
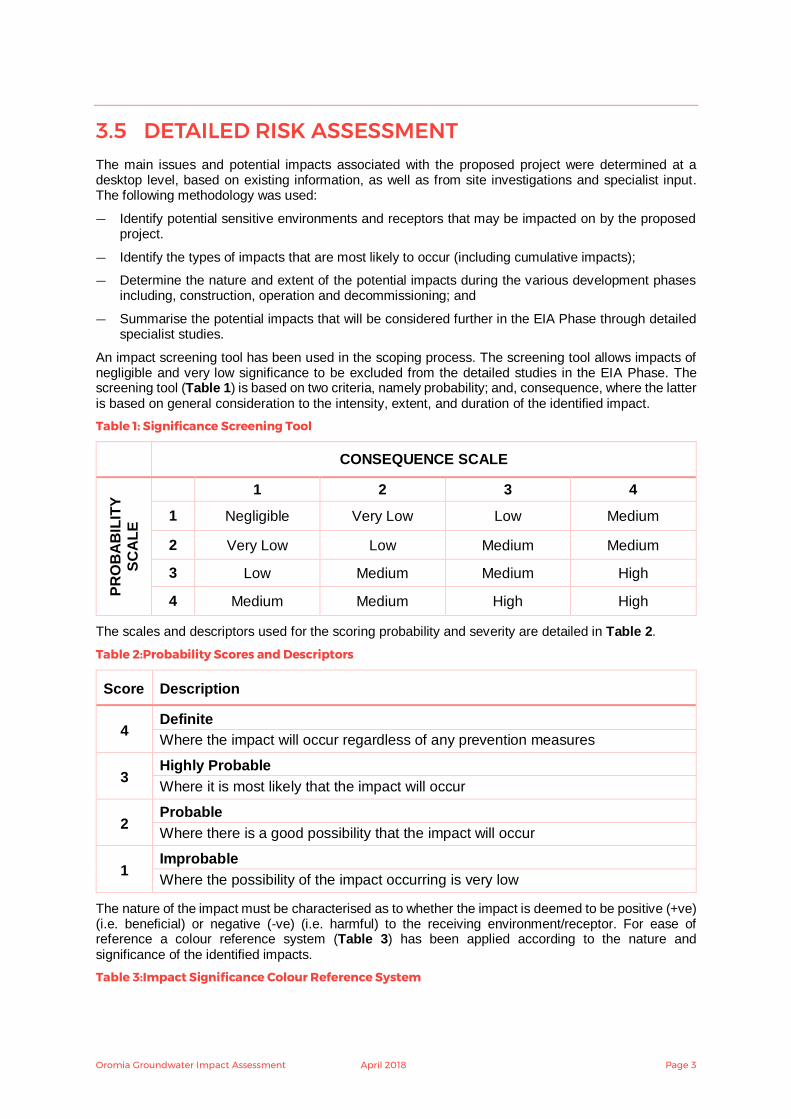
An impact screening tool has been used in the scoping process. The screening tool allows impacts of negligible and very low significance to be excluded from the detailed studies in the EIA Phase. The screening tool (Table 1) is based on two criteria, namely probability; and, consequence, where the latter is based on general consideration to the intensity, extent, and duration of the identified impact.
Table 1: Significance Screening Tool
CONSEQUENCE SCALE
PR
OB
AB
ILIT
Y
SC
AL
E
1 2 3 4
1 Negligible Very Low Low Medium
2 Very Low Low Medium Medium
3 Low Medium Medium High
4 Medium Medium High High
The scales and descriptors used for the scoring probability and severity are detailed in Table 2.
Table 2: Probability Scores and Descriptors
Score Description
4 Definite
Where the impact will occur regardless of any prevention measures
3 Highly Probable
Where it is most likely that the impact will occur
2 Probable
Where there is a good possibility that the impact will occur
1 Improbable
Where the possibility of the impact occurring is very low
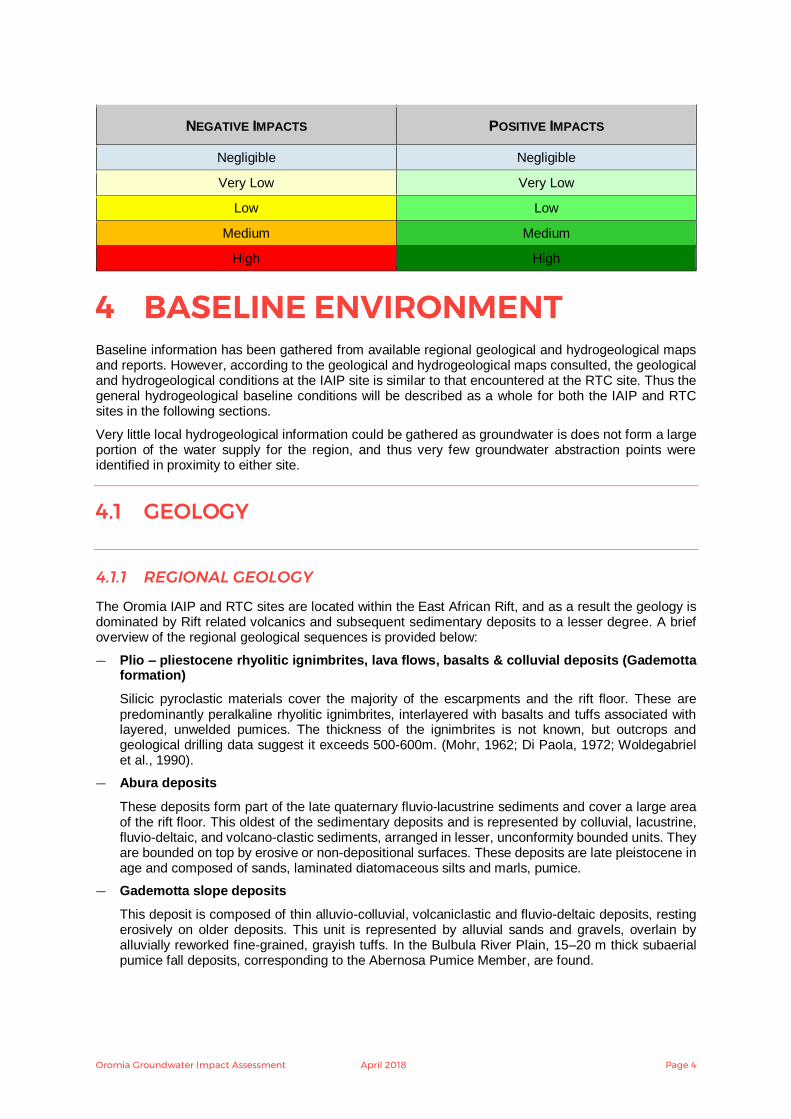
The nature of the impact must be characterised as to whether the impact is deemed to be positive (+ve) (i.e. beneficial) or negative (-ve) (i.e. harmful) to the receiving environment/receptor. For ease of reference a colour reference system (Table 3) has been applied according to the nature and significance of the identified impacts.
Table 3: Impact Significance Colour Reference System
Oromia Groundwater Impact Assessment April 2018 Page 4
NEGATIVE IMPACTS POSITIVE IMPACTS
Negligible Negligible
Very Low Very Low
Low Low
Medium Medium
High High
4 BASELINE ENVIRONMENT Baseline information has been gathered from available regional geological and hydrogeological maps and reports. However, according to the geological and hydrogeological maps consulted, the geological and hydrogeological conditions at the IAIP site is similar to that encountered at the RTC site. Thus the general hydrogeological baseline conditions will be described as a whole for both the IAIP and RTC sites in the following sections.
Very little local hydrogeological information could be gathered as groundwater is does not form a large portion of the water supply for the region, and thus very few groundwater abstraction points were identified in proximity to either site.
4.1 GEOLOGY
4.1.1 REGIONAL GEOLOGY
The Oromia IAIP and RTC sites are located within the East African Rift, and as a result the geology is dominated by Rift related volcanics and subsequent sedimentary deposits to a lesser degree. A brief overview of the regional geological sequences is provided below:
— Plio – pliestocene rhyolitic ignimbrites, lava flows, basalts & colluvial deposits (Gademotta formation)
Silicic pyroclastic materials cover the majority of the escarpments and the rift floor. These are predominantly peralkaline rhyolitic ignimbrites, interlayered with basalts and tuffs associated with layered, unwelded pumices. The thickness of the ignimbrites is not known, but outcrops and geological drilling data suggest it exceeds 500-600m. (Mohr, 1962; Di Paola, 1972; Woldegabriel et al., 1990).
— Abura deposits
These deposits form part of the late quaternary fluvio-lacustrine sediments and cover a large area of the rift floor. This oldest of the sedimentary deposits and is represented by colluvial, lacustrine, fluvio-deltaic, and volcano-clastic sediments, arranged in lesser, unconformity bounded units. They are bounded on top by erosive or non-depositional surfaces. These deposits are late pleistocene in age and composed of sands, laminated diatomaceous silts and marls, pumice.
— Gademotta slope deposits
This deposit is composed of thin alluvio-colluvial, volcaniclastic and fluvio-deltaic deposits, resting erosively on older deposits. This unit is represented by alluvial sands and gravels, overlain by alluvially reworked fine-grained, grayish tuffs. In the Bulbula River Plain, 15–20 m thick subaerial pumice fall deposits, corresponding to the Abernosa Pumice Member, are found.
Oromia Groundwater Impact Assessment April 2018 Page 5
— Adami Tulu deposits
The deposit is made up of lacustrine, fluvio-deltaic, colluvial, and volcaniclastic sediments, with intervening buried soils. They are dominantly represented by alluvial and colluvial sands and silts, bearing a well-developed Luvisol. Lacustrine deposits are represented by massive diatomites.
— Shore deposits
This deposit is represented by alluvial–colluvial sediments, filling paleo valleys incised in the deposits of underlying units. The fills are characterized by basal alluvial gravelly sands, topped by fine-grained alluvial colluvium. In the west Shala, the deposit is represented by alluvial gravelly sands, overlain by low angle cross stratified sands. Sands of the recessional stranded beach are visible close to the present Lake Shala shore.
Structurally, the study area has been confined to a north-northeast trending structure formed by a line of hundreds of young faults and volcanic centers along the rift floor close to the eastern escarpment, and arranged in en e´chelon fashion. This volcano-tectonic axis, named the Wonji Fault Belt (WFB), is considered to be the current axis of crustal extension (Meyer et al., 1975; Morton et al., 1979; WoldeGabriel et al., 1990).
Caldera-topped shield volcanoes occur at each WFB offset: the Alutu Caldera between the Gadamsa–East Ziway and Ziway–Shala segments, the O’a Caldera (presently occupied by Lake Shala) between the Ziway–Shala and Shala–Corbetti segments, and the Corbetti Caldera at the south end of the Shala–Corbetti segment.
4.1.2 LOCAL GEOLOGY
The geological logging of the borehole drilled on the Site identified rift valley related volcanic rocks, characterised by scoriaceous basalt, scoria and ignimbrite, overlain by a thick layer of ash, pumice and pyroclastics. The volcanic bedrock is highly fractured, which accounts for the main water bearing features targeted in the drilling programme.
4.2 HYDROGEOLOGY
4.2.1 AQUIFER CHARACTERISTICS
The hydrogeology of the area is largely governed by the geometry of the rift, the variability and lateral discontinuity of the volcanic rocks and the disruption of lithologies by faults, resulting in vertical structuring and spatial heterogeneity across the region. The aquifers are largely the product of volcanic eruptions which occurred in the area at different times and different locations throughout the regions geological history.
Very little information could be gathered regarding the local hydrogeological conditions at the IAIP and RTC sites during the 2017 on site investigation, as groundwater use is very limited throughout the region and boreholes and wells are scarce. It has been reported by local hydrogeologists that the reason for the lack of groundwater development as a water source is due to the high fluoride content naturally contained in the groundwater system as a result of the Rift Valley hydro-geochemistry.
Information on one deep borehole drilled approximately 10km north east of the IAIP site (Ziway borehole) was obtained through discussions with local NGOs. Hydraulic parameters and water quality for this borehole is discussed further in the following sections.
Subsequently, the IPDC drilled a borehole at the Bulbula IAIP site in early 2018. The data gathered from this borehole indicate that groundwater flow in the region is predominantly in fractures within the host rock, which produce preferential groundwater flow paths. These preferential flow paths have relatively high groundwater exploitation potential, based on the results of the pump testing programme (see Section 4.2.2 below). The static groundwater level in the borehole was 38.7 meters below ground level (mbgl).
Oromia Groundwater Impact Assessment April 2018 Page 6
4.2.2 HYDRAULIC PARAMETERS
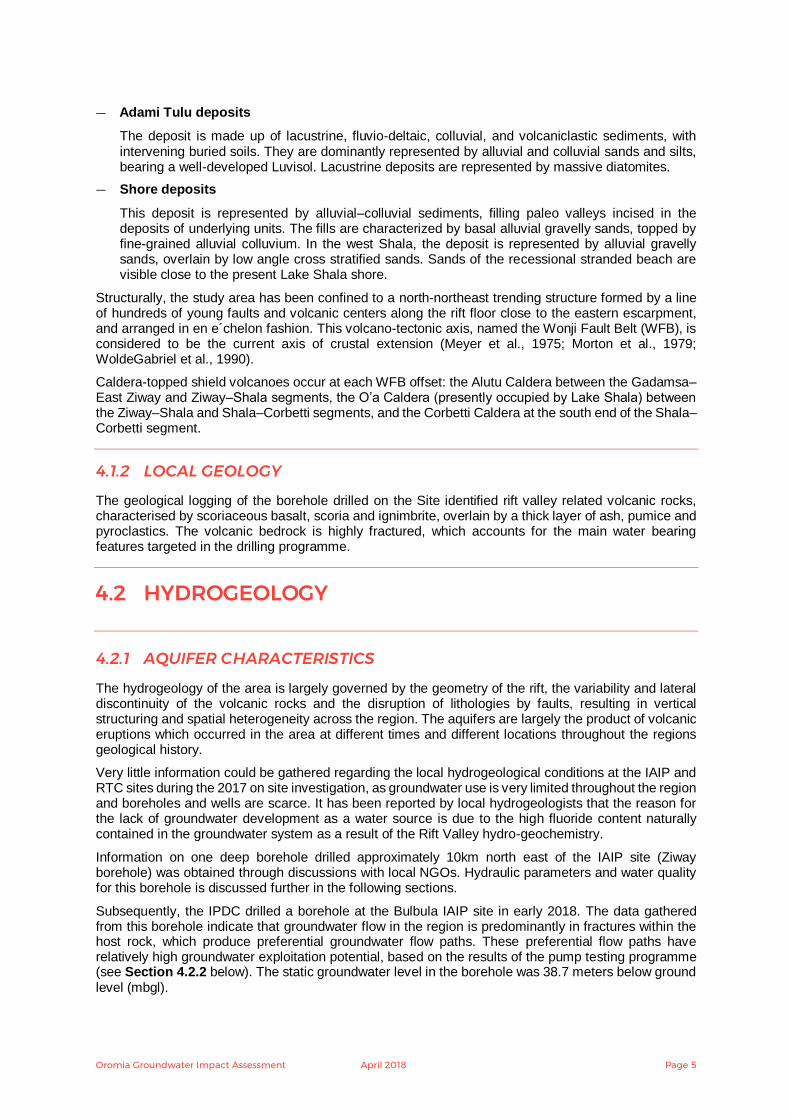
The hydraulic parameters of an aquifer describe the ease with groundwater (and thus potential contaminants contained within the groundwater) move through the subsurface and is used to predict the rate of groundwater movement. The higher the hydraulic conductivity and/or transmissivity, the faster groundwater will move through an aquifer. The hydraulic parameters are obtained by conducting aquifer tests on borehole drilled into the relevant aquifer units.
A summary of the aquifer testing results for the Ziway Borehole and the UNOPS drilled borehole on the Bulbula IAIP Site were obtained from the respective pump testing programmes. The Ziway Borehole details are provided for regional reference purposes only, as it is located a considerable distance from the Site. The borehole drilled on site provides more site specific hydraulic parameters. The results obtained are summarised in Table 4.
Table 4: Summary of Calculated Aquifer Parameters
BOREHOLE ID
STATIC WATER LEVEL
LEVEL (M)
DISCHARGE (L/S)
DRAW DOWN(M)
SPECIFIC CAPACITY
(L/S/M)
TRANSMISSIVITY CALCULATED
(M2/S)
TRANSMISSIVITY ESTIMATED FROM
PUMPING TEST (M/S)
Ziway
Borehole 76.6 4.4 1.52 2.90 3.50E-03 5.40E-03
UNOPS
Drilled
Borehole
38.7 26.6 3.12 8.52 6.29E-03 7.72E-01
4.2.3 HYDROCENSUS
During the August 2017 site investigation, a detailed hydrocensus was carried out across the IAIP and RTC site areas. The following hydrocensus resulted in the following findings:
— Groundwater use within the region is extremely limited as a result of the naturally high fluoride content contained in the groundwater as a result of the Rift Valley hydro-geochemistry;
— Local community members typically rely on municipally supplied treated surface water as their main water source;
— Three hand dug wells were identified around the IAIP site. Two of these had been filled in and were not in use. The third (OMAGW01) was located in a local tavern within Bulbula Town and was used for non-domestic purposes only (predominantly washing of vehicles and equipment);
— One deep borehole was identified in a maize field approximately 350m north of the IAIP Site. This borehole was reportedly historically used for crop irrigation. However, the borehole had been sealed with a concrete slab and was no longer in use, reportedly due to power supply issues making the use of the borehole unfeasible; and
— No groundwater abstraction points were identified in or around the RTC Site.
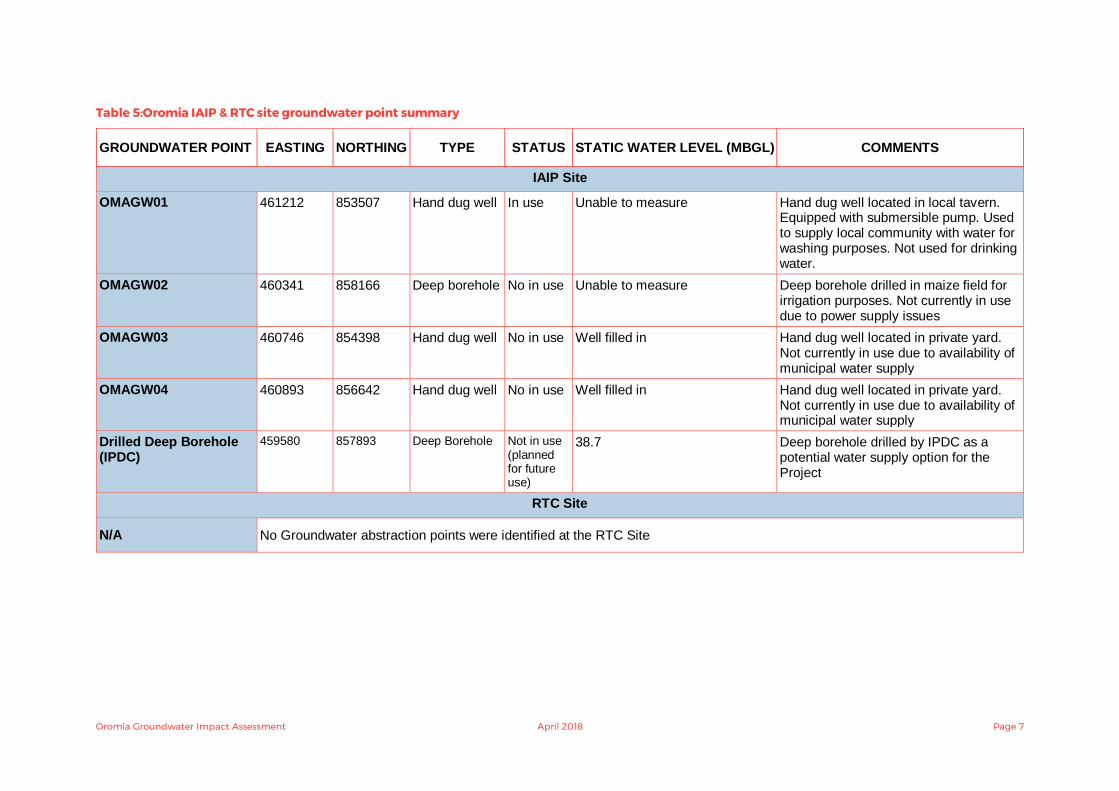
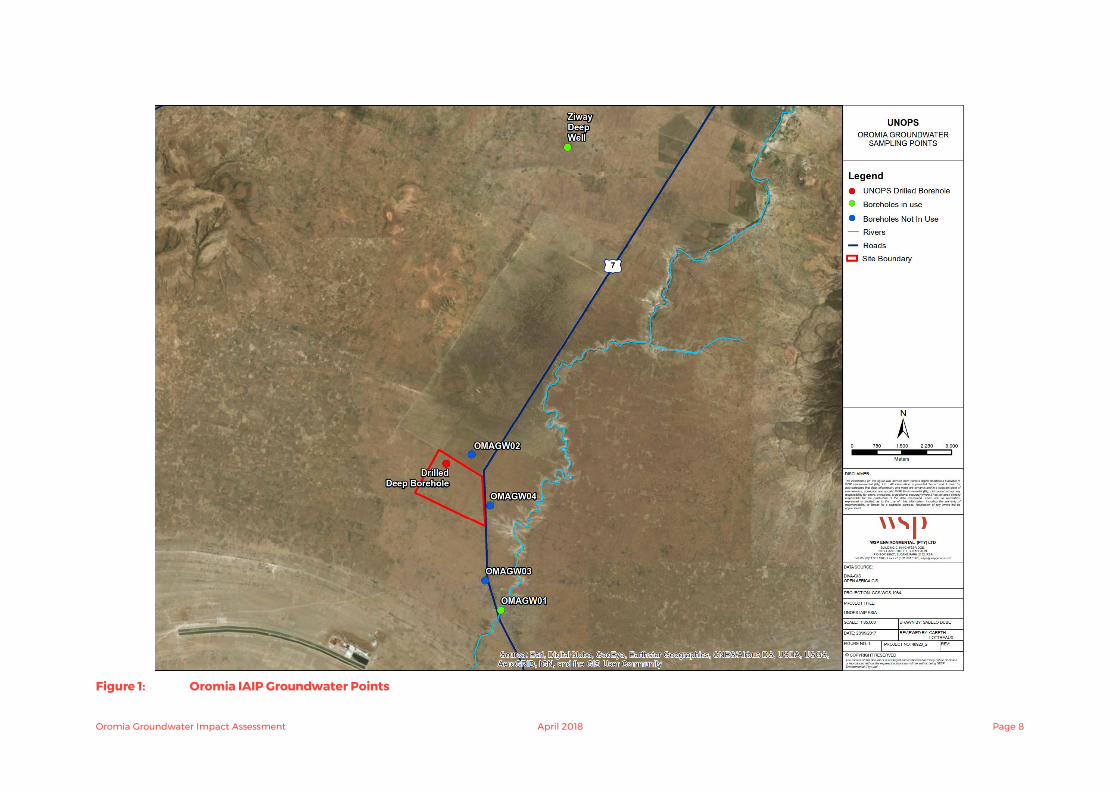
A total four groundwater points were identified at the IAIP Site .A summary of all of the groundwater points identified is provided in Table 5, and their locations are shown in Figure 1 (IAIP Site). The data gathered during the drilling of the borehole on the IAIP Site in 2018 have been included in the summary in order to provide site specific data, despite the borehole being drilled subsequent to the onsite hydrocensus.
Oromia Groundwater Impact Assessment April 2018 Page 7
Table 5:Oromia IAIP & RTC site groundwater point summary
GROUNDWATER POINT EASTING NORTHING TYPE STATUS STATIC WATER LEVEL (MBGL) COMMENTS
IAIP Site
OMAGW01 461212 853507 Hand dug well In use Unable to measure Hand dug well located in local tavern. Equipped with submersible pump. Used to supply local community with water for washing purposes. Not used for drinking water.
OMAGW02 460341 858166 Deep borehole No in use Unable to measure Deep borehole drilled in maize field for irrigation purposes. Not currently in use due to power supply issues
OMAGW03 460746 854398 Hand dug well No in use Well filled in Hand dug well located in private yard. Not currently in use due to availability of municipal water supply
OMAGW04 460893 856642 Hand dug well No in use Well filled in Hand dug well located in private yard. Not currently in use due to availability of municipal water supply
Drilled Deep Borehole (IPDC)
459580 857893 Deep Borehole Not in use (planned for future use)
38.7 Deep borehole drilled by IPDC as a potential water supply option for the Project
RTC Site
N/A No Groundwater abstraction points were identified at the RTC Site
Oromia Groundwater Impact Assessment April 2018 Page 8
Figure 1: Oromia IAIP Groundwater Points
Oromia Groundwater Impact Assessment April 2018 Page 9
4.2.4 GROUNDWATER POTENTIAL CONTAMINANTS
As previously stated, the groundwater in the region contains naturally high fluoride concentrations, which render the groundwater unsuitable for use as a source of drinking water. Furthermore, the presence of septic tanks, sewage systems and unlined pit latrines poses a microbiological contamination source to the groundwater system.
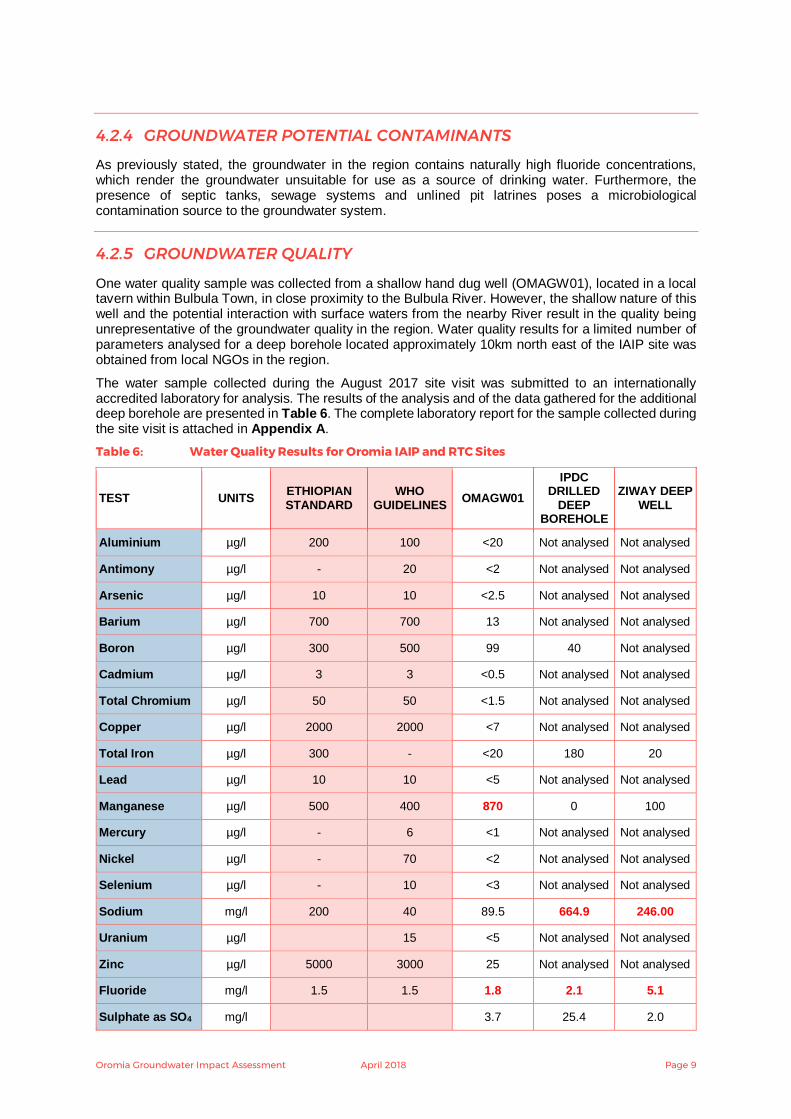
4.2.5 GROUNDWATER QUALITY
One water quality sample was collected from a shallow hand dug well (OMAGW01), located in a local tavern within Bulbula Town, in close proximity to the Bulbula River. However, the shallow nature of this well and the potential interaction with surface waters from the nearby River result in the quality being unrepresentative of the groundwater quality in the region. Water quality results for a limited number of parameters analysed for a deep borehole located approximately 10km north east of the IAIP site was obtained from local NGOs in the region.
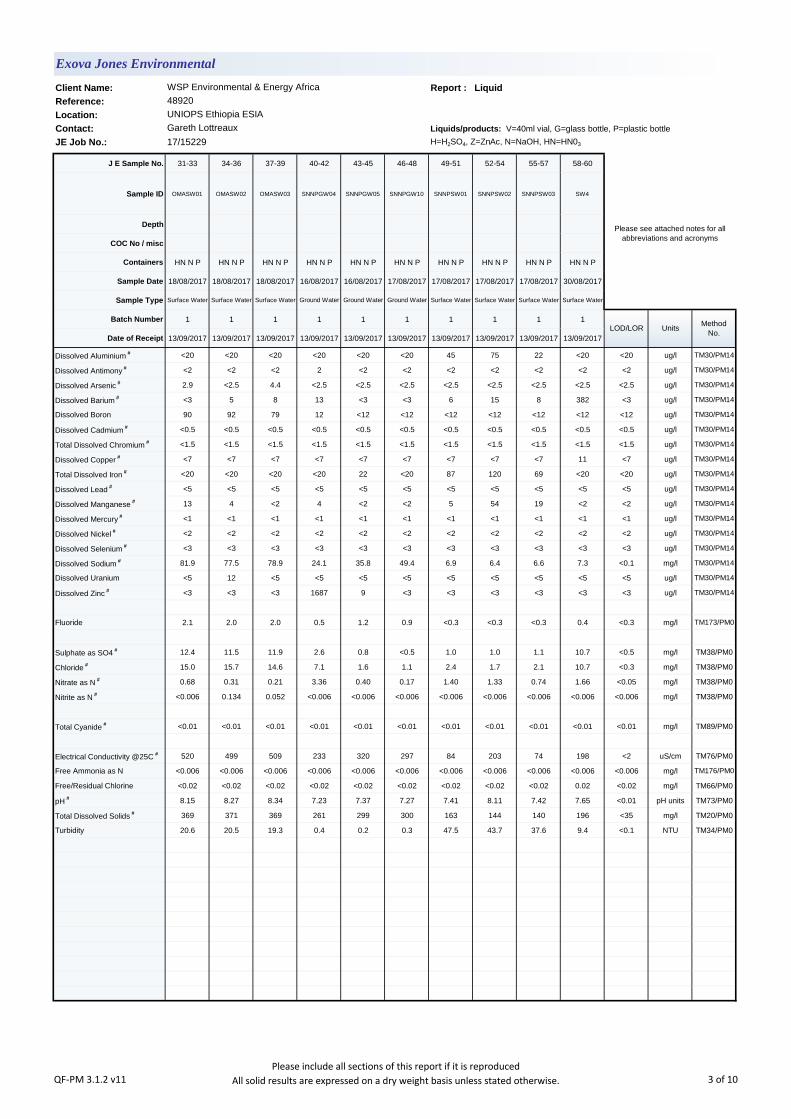
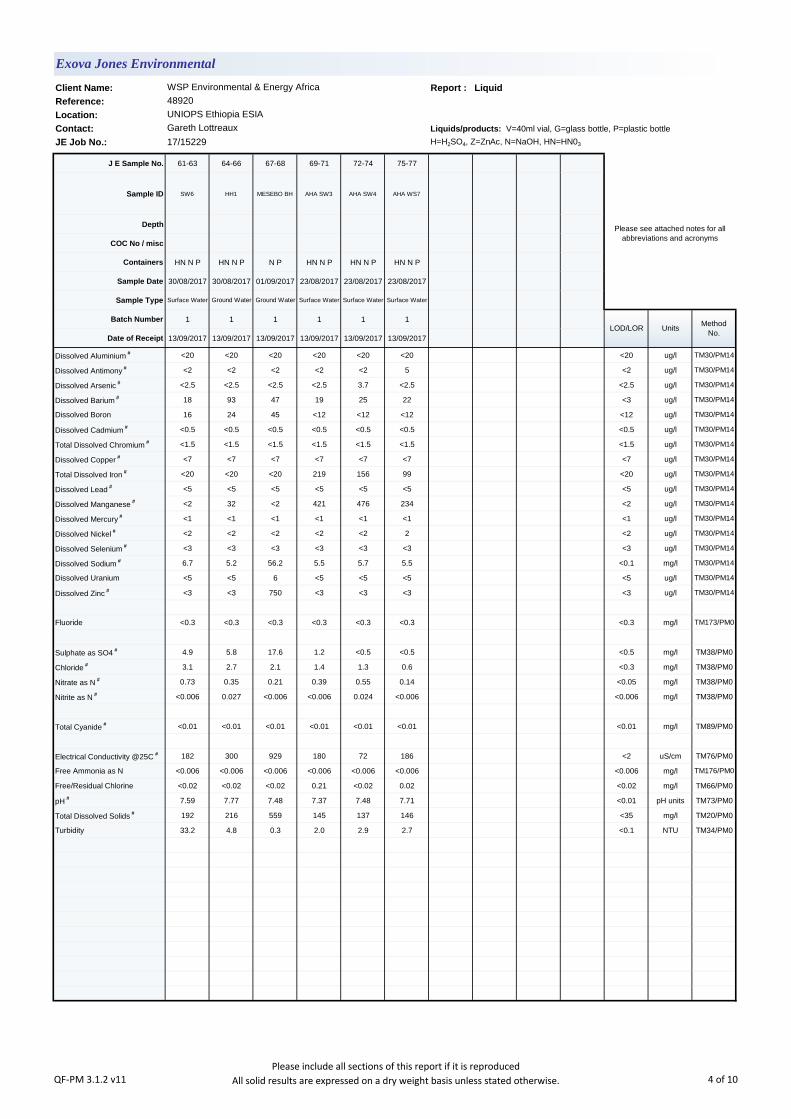
The water sample collected during the August 2017 site visit was submitted to an internationally accredited laboratory for analysis. The results of the analysis and of the data gathered for the additional deep borehole are presented in Table 6. The complete laboratory report for the sample collected during the site visit is attached in Appendix A.
Table 6: Water Quality Results for Oromia IAIP and RTC Sites
TEST UNITS ETHIOPIAN STANDARD
WHO GUIDELINES
OMAGW01
IPDC DRILLED
DEEP BOREHOLE
ZIWAY DEEP WELL
Aluminium µg/l 200 100 <20 Not analysed Not analysed
Antimony µg/l - 20 <2 Not analysed Not analysed
Arsenic µg/l 10 10 <2.5 Not analysed Not analysed
Barium µg/l 700 700 13 Not analysed Not analysed
Boron µg/l 300 500 99 40 Not analysed
Cadmium µg/l 3 3 <0.5 Not analysed Not analysed
Total Chromium µg/l 50 50 <1.5 Not analysed Not analysed
Copper µg/l 2000 2000 <7 Not analysed Not analysed
Total Iron µg/l 300 - <20 180 20
Lead µg/l 10 10 <5 Not analysed Not analysed
Manganese µg/l 500 400 870 0 100
Mercury µg/l - 6 <1 Not analysed Not analysed
Nickel µg/l - 70 <2 Not analysed Not analysed
Selenium µg/l - 10 <3 Not analysed Not analysed
Sodium mg/l 200 40 89.5 664.9 246.00
Uranium µg/l 15 <5 Not analysed Not analysed
Zinc µg/l 5000 3000 25 Not analysed Not analysed
Fluoride mg/l 1.5 1.5 1.8 2.1 5.1
Sulphate as SO4 mg/l 3.7 25.4 2.0
Oromia Groundwater Impact Assessment April 2018 Page 10
TEST UNITS ETHIOPIAN STANDARD
WHO GUIDELINES
OMAGW01
IPDC DRILLED
DEEP BOREHOLE
ZIWAY DEEP WELL
Chloride mg/l 250 - 17.6 181.9 21.16
Nitrate as N mg/l 50 50 0.47 0.32 0.37
Nitrite as N mg/l 3 3 1.064 0.04 Not analysed
Total Cyanide mg/l 70 70 <0.01 Not analysed Not analysed
Electrical Conductivity
µS/cm - 622 1906 Not analysed
Free Ammonia as N
mg/l 1.5 1.5 <0.006 0 0.15
Free/Residual Chlorine
mg/l 0.5 5 <0.02 Not analysed Not analysed
pH pH units 6.5 - 8.5 6.5 - 8.5 7.58 8.8 8.46
Total Dissolved Solids
mg/l 1000 600 475 953 Not analysed
Turbidity NTU - 5 0.7 Not analysed Not analysed
The results of the sample collected from the hand dug well in Bulbula Town (OMAGW01) is not expected to be representative of the groundwater environment in the area, and should thus not be considered with regards to the local groundwater conditions.
The water quality results obtained for the deep well drilled by the IPDC within the northern portion of the IAIP site confirm the high levels of fluoride and sodium, which are above the WHO and Ethiopian Guidelines and Standards for drinking water quality, as noted from the Ziway deep well located to the north of the site. The elevated fluoride and sodium levels in the groundwater are likely to be a result of rift valley geology interacting with the groundwater on a regional scale and thus reflects the natural baseline of levels of these elements, rather than an anthropogenic contamination source. As a result groundwater in the area is unfit for human consumption without treatment.
4.2.6 GROUNDWATER MONITORING PROGRAMME
A groundwater monitoring programme should be initiated once the IAIP and RTC sites become operational. As there are currently a limited number of accessible groundwater abstraction points in the areas surrounding both sites, additional monitoring borehole may be required. This should be assessed once the proposed water supply programme for the IAIP and RTC sites has been finalised, as the location of the water supply boreholes will be the main driving factor behind the design of the monitoring programme. The programme should ensure that monitoring wells are positioned both up gradient and down gradient of the operations, and be positioned to provide adequate information on water quality between the site and potential down gradient receptors. Monitoring boreholes should take preferential groundwater flow paths into consideration. Groundwater monitoring should be carried out on a quarterly basis.
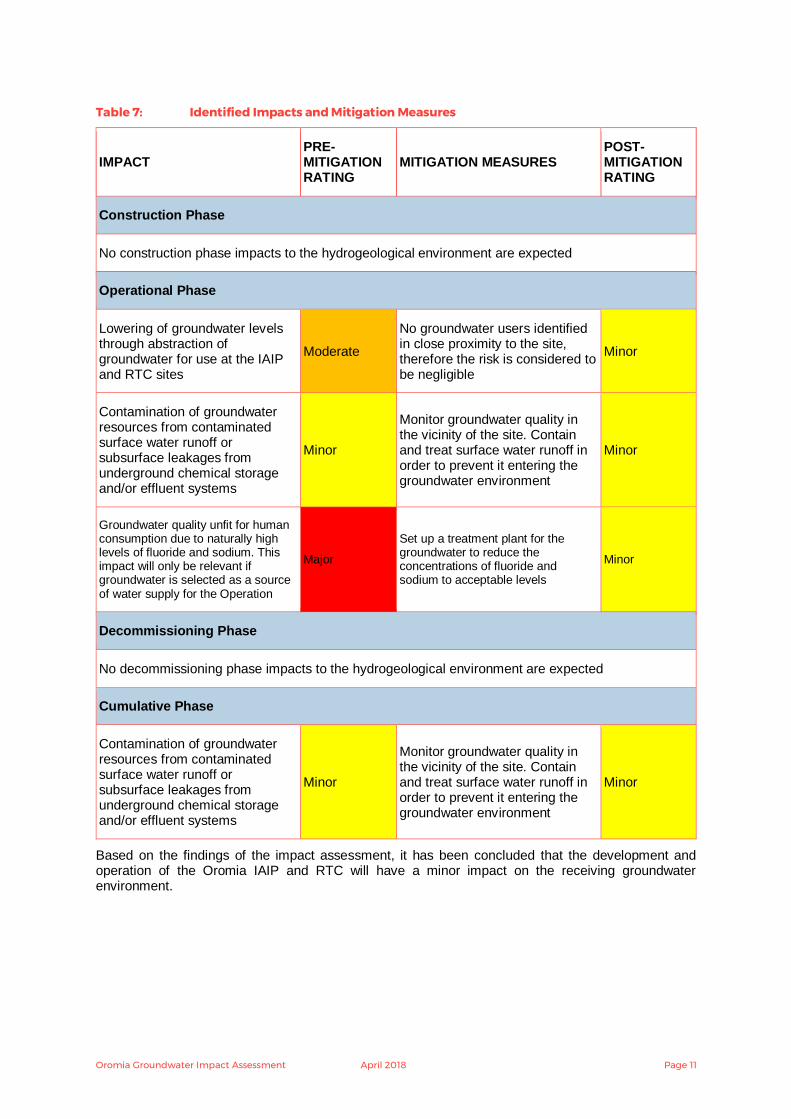
5 IMPACT ASSESSMENT The main issues and potential impacts on groundwater associated with the proposed project were determined based on existing information, as well as from site investigations and specialist input. Table 7 is a summary of the identified risks associated with the Oromia IAIP and RTC sites and the proposed mitigation measures.
Oromia Groundwater Impact Assessment April 2018 Page 11
Table 7: Identified Impacts and Mitigation Measures
IMPACT PRE-MITIGATION RATING
MITIGATION MEASURES POST-MITIGATION RATING
Construction Phase
No construction phase impacts to the hydrogeological environment are expected
Operational Phase
Lowering of groundwater levels through abstraction of groundwater for use at the IAIP and RTC sites
Moderate
No groundwater users identified in close proximity to the site, therefore the risk is considered to be negligible
Minor
Contamination of groundwater resources from contaminated surface water runoff or subsurface leakages from underground chemical storage and/or effluent systems
Minor
Monitor groundwater quality in the vicinity of the site. Contain and treat surface water runoff in order to prevent it entering the groundwater environment
Minor
Groundwater quality unfit for human consumption due to naturally high levels of fluoride and sodium. This impact will only be relevant if groundwater is selected as a source of water supply for the Operation
Major
Set up a treatment plant for the groundwater to reduce the concentrations of fluoride and sodium to acceptable levels
Minor
Decommissioning Phase
No decommissioning phase impacts to the hydrogeological environment are expected
Cumulative Phase
Contamination of groundwater resources from contaminated surface water runoff or subsurface leakages from underground chemical storage and/or effluent systems
Minor
Monitor groundwater quality in the vicinity of the site. Contain and treat surface water runoff in order to prevent it entering the groundwater environment
Minor
Based on the findings of the impact assessment, it has been concluded that the development and operation of the Oromia IAIP and RTC will have a minor impact on the receiving groundwater environment.
Oromia Groundwater Impact Assessment April 2018 Page 12
6 CONCLUSIONS AND RECOMMENDATIONS
The following conclusions regarding the hydrogeological setting of the Oromia IAIP and RTC Sites were made:
— Groundwater use in the region is very limited due to the naturally high fluoride concentrations making it an unsuitable source of potable water without significant treatment;
— Only one active groundwater abstraction point was identified in the area surrounding the IAIP site. However, this was located approximately 2.5km from the site, and is unlikely to be impacted by operations;
— Based on the natural groundwater quality, it is unlikely that any significant groundwater use will be developed in the area surrounding the IAIP and RTC sites;
— The naturally high fluoride and sodium concentrations in the groundwater make it unfit for human consumption. If groundwater is selected as a source of water supply for the operation, water treatment will be required in order to bring the concentrations down to acceptable levels prior to it being used; and
— The Oromia IAIP and RTC sites pose a low risk to the groundwater environment.
Based on these conclusions, the following recommendations are made:
— A groundwater monitoring programme should be initiated once the IAIP and RTC sites become operational in order to identify any potential impacts to groundwater quality and quantity in the area. Monitoring boreholes should be placed both up gradient and down gradient of the operations, and take preferential groundwater flow paths into consideration. Groundwater monitoring should be conducted on a quarterly basis.

APPENDIX A
Unit D2/5
9 Quantum Road
Firgrove Business Park
Somerset West
WSP Environmental & Energy Africa
Attention :
Date :
Your reference :
Our reference :
Location :
Date samples received :
Status :
Issue :
Twenty six samples were received for analysis on 13th September, 2017 of which twenty six were scheduled for analysis. Please find attached our
Test Report which should be read with notes at the end of the report and should include all sections if reproduced. Interpretations and opinions are
outside the scope of any accreditation, and all results relate only to samples supplied.
All analysis is carried out on as received samples and reported on a dry weight basis unless stated otherwise. Results are not surrogate corrected.
Analysis was undertaken at either Exova Jones Environmental (UK), which is ISO 17025 accredited under UKAS (4225) or Exova Jones
Environmental (SA) which is ISO 17025 accredited under SANAS (T0729) or a subcontract laboratory where specified.
NOTE: Under International Laboratory Accreditation Cooperation (ILAC), ISO 17025 (UKAS) accreditation is recognised as equivalent to SANAS
(South Africa) accreditation.
Simon Gomery BSc
Project Manager
48920
UNIOPS Ethiopia ESIA
13th September, 2017
Final report
Compiled By:
Test Report 17/15229 Batch 1
Gareth Lottreaux
25th September, 2017
1
Exova Jones Environmental South Africa
7130
South Africa
WSP House
Bryanston Place
199 Bryanston Drive
Bryanston 2191
Johannesburg
South Africa
QF-PM 3.1.1 v16Please include all sections of this report if it is reproduced
All solid results are expressed on a dry weight basis unless stated otherwise. 1 of 10
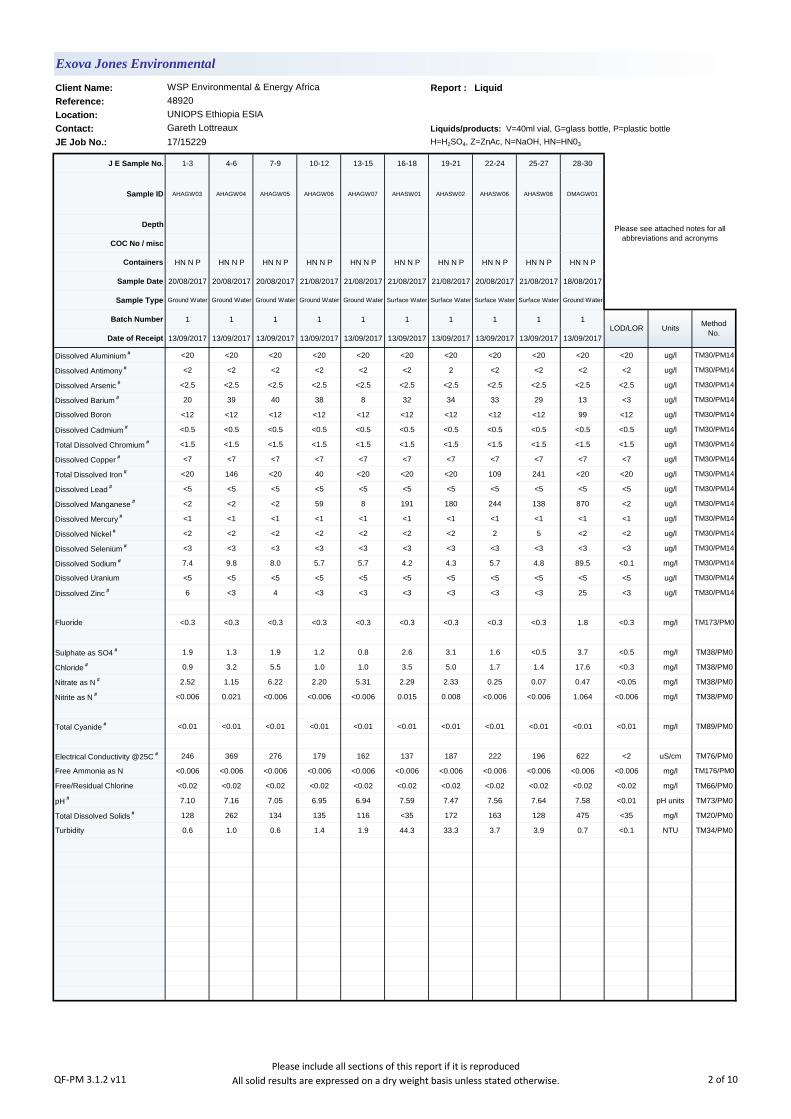
Client Name: Report : Liquid
Reference:
Location:
Contact: Liquids/products: V=40ml vial, G=glass bottle, P=plastic bottle
JE Job No.: 17/15229 H=H2SO4, Z=ZnAc, N=NaOH, HN=HN03
J E Sample No. 1-3 4-6 7-9 10-12 13-15 16-18 19-21 22-24 25-27 28-30
Sample ID AHAGW03 AHAGW04 AHAGW05 AHAGW06 AHAGW07 AHASW01 AHASW02 AHASW06 AHASW08 OMAGW01
Depth
COC No / misc
Containers HN N P HN N P HN N P HN N P HN N P HN N P HN N P HN N P HN N P HN N P
Sample Date 20/08/2017 20/08/2017 20/08/2017 21/08/2017 21/08/2017 21/08/2017 21/08/2017 20/08/2017 21/08/2017 18/08/2017
Sample Type Ground Water Ground Water Ground Water Ground Water Ground Water Surface Water Surface Water Surface Water Surface Water Ground Water
Batch Number 1 1 1 1 1 1 1 1 1 1
Date of Receipt 13/09/2017 13/09/2017 13/09/2017 13/09/2017 13/09/2017 13/09/2017 13/09/2017 13/09/2017 13/09/2017 13/09/2017
Dissolved Aluminium # <20 <20 <20 <20 <20 <20 <20 <20 <20 <20 <20 ug/l TM30/PM14
Dissolved Antimony # <2 <2 <2 <2 <2 <2 2 <2 <2 <2 <2 ug/l TM30/PM14
Dissolved Arsenic # <2.5 <2.5 <2.5 <2.5 <2.5 <2.5 <2.5 <2.5 <2.5 <2.5 <2.5 ug/l TM30/PM14
Dissolved Barium # 20 39 40 38 8 32 34 33 29 13 <3 ug/l TM30/PM14
Dissolved Boron <12 <12 <12 <12 <12 <12 <12 <12 <12 99 <12 ug/l TM30/PM14
Dissolved Cadmium # <0.5 <0.5 <0.5 <0.5 <0.5 <0.5 <0.5 <0.5 <0.5 <0.5 <0.5 ug/l TM30/PM14
Total Dissolved Chromium # <1.5 <1.5 <1.5 <1.5 <1.5 <1.5 <1.5 <1.5 <1.5 <1.5 <1.5 ug/l TM30/PM14
Dissolved Copper # <7 <7 <7 <7 <7 <7 <7 <7 <7 <7 <7 ug/l TM30/PM14
Total Dissolved Iron # <20 146 <20 40 <20 <20 <20 109 241 <20 <20 ug/l TM30/PM14
Dissolved Lead # <5 <5 <5 <5 <5 <5 <5 <5 <5 <5 <5 ug/l TM30/PM14
Dissolved Manganese # <2 <2 <2 59 8 191 180 244 138 870 <2 ug/l TM30/PM14
Dissolved Mercury # <1 <1 <1 <1 <1 <1 <1 <1 <1 <1 <1 ug/l TM30/PM14
Dissolved Nickel # <2 <2 <2 <2 <2 <2 <2 2 5 <2 <2 ug/l TM30/PM14
Dissolved Selenium # <3 <3 <3 <3 <3 <3 <3 <3 <3 <3 <3 ug/l TM30/PM14
Dissolved Sodium # 7.4 9.8 8.0 5.7 5.7 4.2 4.3 5.7 4.8 89.5 <0.1 mg/l TM30/PM14
Dissolved Uranium <5 <5 <5 <5 <5 <5 <5 <5 <5 <5 <5 ug/l TM30/PM14
Dissolved Zinc # 6 <3 4 <3 <3 <3 <3 <3 <3 25 <3 ug/l TM30/PM14
Fluoride <0.3 <0.3 <0.3 <0.3 <0.3 <0.3 <0.3 <0.3 <0.3 1.8 <0.3 mg/l TM173/PM0
Sulphate as SO4 # 1.9 1.3 1.9 1.2 0.8 2.6 3.1 1.6 <0.5 3.7 <0.5 mg/l TM38/PM0
Chloride # 0.9 3.2 5.5 1.0 1.0 3.5 5.0 1.7 1.4 17.6 <0.3 mg/l TM38/PM0
Nitrate as N # 2.52 1.15 6.22 2.20 5.31 2.29 2.33 0.25 0.07 0.47 <0.05 mg/l TM38/PM0
Nitrite as N # <0.006 0.021 <0.006 <0.006 <0.006 0.015 0.008 <0.006 <0.006 1.064 <0.006 mg/l TM38/PM0
Total Cyanide # <0.01 <0.01 <0.01 <0.01 <0.01 <0.01 <0.01 <0.01 <0.01 <0.01 <0.01 mg/l TM89/PM0
Electrical Conductivity @25C # 246 369 276 179 162 137 187 222 196 622 <2 uS/cm TM76/PM0
Free Ammonia as N <0.006 <0.006 <0.006 <0.006 <0.006 <0.006 <0.006 <0.006 <0.006 <0.006 <0.006 mg/l TM176/PM0
Free/Residual Chlorine <0.02 <0.02 <0.02 <0.02 <0.02 <0.02 <0.02 <0.02 <0.02 <0.02 <0.02 mg/l TM66/PM0
pH # 7.10 7.16 7.05 6.95 6.94 7.59 7.47 7.56 7.64 7.58 <0.01 pH units TM73/PM0
Total Dissolved Solids # 128 262 134 135 116 <35 172 163 128 475 <35 mg/l TM20/PM0
Turbidity 0.6 1.0 0.6 1.4 1.9 44.3 33.3 3.7 3.9 0.7 <0.1 NTU TM34/PM0
UNIOPS Ethiopia ESIA
Gareth Lottreaux
Please see attached notes for all
abbreviations and acronyms
LOD/LOR UnitsMethod
No.
Exova Jones Environmental
WSP Environmental & Energy Africa
48920
QF-PM 3.1.2 v11Please include all sections of this report if it is reproduced
All solid results are expressed on a dry weight basis unless stated otherwise. 2 of 10
Client Name: Report : Liquid
Reference:
Location:
Contact: Liquids/products: V=40ml vial, G=glass bottle, P=plastic bottle
JE Job No.: 17/15229 H=H2SO4, Z=ZnAc, N=NaOH, HN=HN03
J E Sample No. 31-33 34-36 37-39 40-42 43-45 46-48 49-51 52-54 55-57 58-60
Sample ID OMASW01 OMASW02 OMASW03 SNNPGW04 SNNPGW05 SNNPGW10 SNNPSW01 SNNPSW02 SNNPSW03 SW4
Depth
COC No / misc
Containers HN N P HN N P HN N P HN N P HN N P HN N P HN N P HN N P HN N P HN N P
Sample Date 18/08/2017 18/08/2017 18/08/2017 16/08/2017 16/08/2017 17/08/2017 17/08/2017 17/08/2017 17/08/2017 30/08/2017
Sample Type Surface Water Surface Water Surface Water Ground Water Ground Water Ground Water Surface Water Surface Water Surface Water Surface Water
Batch Number 1 1 1 1 1 1 1 1 1 1
Date of Receipt 13/09/2017 13/09/2017 13/09/2017 13/09/2017 13/09/2017 13/09/2017 13/09/2017 13/09/2017 13/09/2017 13/09/2017
Dissolved Aluminium # <20 <20 <20 <20 <20 <20 45 75 22 <20 <20 ug/l TM30/PM14
Dissolved Antimony # <2 <2 <2 2 <2 <2 <2 <2 <2 <2 <2 ug/l TM30/PM14
Dissolved Arsenic # 2.9 <2.5 4.4 <2.5 <2.5 <2.5 <2.5 <2.5 <2.5 <2.5 <2.5 ug/l TM30/PM14
Dissolved Barium # <3 5 8 13 <3 <3 6 15 8 382 <3 ug/l TM30/PM14
Dissolved Boron 90 92 79 12 <12 <12 <12 <12 <12 <12 <12 ug/l TM30/PM14
Dissolved Cadmium # <0.5 <0.5 <0.5 <0.5 <0.5 <0.5 <0.5 <0.5 <0.5 <0.5 <0.5 ug/l TM30/PM14
Total Dissolved Chromium # <1.5 <1.5 <1.5 <1.5 <1.5 <1.5 <1.5 <1.5 <1.5 <1.5 <1.5 ug/l TM30/PM14
Dissolved Copper # <7 <7 <7 <7 <7 <7 <7 <7 <7 11 <7 ug/l TM30/PM14
Total Dissolved Iron # <20 <20 <20 <20 22 <20 87 120 69 <20 <20 ug/l TM30/PM14
Dissolved Lead # <5 <5 <5 <5 <5 <5 <5 <5 <5 <5 <5 ug/l TM30/PM14
Dissolved Manganese # 13 4 <2 4 <2 <2 5 54 19 <2 <2 ug/l TM30/PM14
Dissolved Mercury # <1 <1 <1 <1 <1 <1 <1 <1 <1 <1 <1 ug/l TM30/PM14
Dissolved Nickel # <2 <2 <2 <2 <2 <2 <2 <2 <2 <2 <2 ug/l TM30/PM14
Dissolved Selenium # <3 <3 <3 <3 <3 <3 <3 <3 <3 <3 <3 ug/l TM30/PM14
Dissolved Sodium # 81.9 77.5 78.9 24.1 35.8 49.4 6.9 6.4 6.6 7.3 <0.1 mg/l TM30/PM14
Dissolved Uranium <5 12 <5 <5 <5 <5 <5 <5 <5 <5 <5 ug/l TM30/PM14
Dissolved Zinc # <3 <3 <3 1687 9 <3 <3 <3 <3 <3 <3 ug/l TM30/PM14
Fluoride 2.1 2.0 2.0 0.5 1.2 0.9 <0.3 <0.3 <0.3 0.4 <0.3 mg/l TM173/PM0
Sulphate as SO4 # 12.4 11.5 11.9 2.6 0.8 <0.5 1.0 1.0 1.1 10.7 <0.5 mg/l TM38/PM0
Chloride # 15.0 15.7 14.6 7.1 1.6 1.1 2.4 1.7 2.1 10.7 <0.3 mg/l TM38/PM0
Nitrate as N # 0.68 0.31 0.21 3.36 0.40 0.17 1.40 1.33 0.74 1.66 <0.05 mg/l TM38/PM0
Nitrite as N # <0.006 0.134 0.052 <0.006 <0.006 <0.006 <0.006 <0.006 <0.006 <0.006 <0.006 mg/l TM38/PM0
Total Cyanide # <0.01 <0.01 <0.01 <0.01 <0.01 <0.01 <0.01 <0.01 <0.01 <0.01 <0.01 mg/l TM89/PM0
Electrical Conductivity @25C # 520 499 509 233 320 297 84 203 74 198 <2 uS/cm TM76/PM0
Free Ammonia as N <0.006 <0.006 <0.006 <0.006 <0.006 <0.006 <0.006 <0.006 <0.006 <0.006 <0.006 mg/l TM176/PM0
Free/Residual Chlorine <0.02 <0.02 <0.02 <0.02 <0.02 <0.02 <0.02 <0.02 <0.02 0.02 <0.02 mg/l TM66/PM0
pH # 8.15 8.27 8.34 7.23 7.37 7.27 7.41 8.11 7.42 7.65 <0.01 pH units TM73/PM0
Total Dissolved Solids # 369 371 369 261 299 300 163 144 140 196 <35 mg/l TM20/PM0
Turbidity 20.6 20.5 19.3 0.4 0.2 0.3 47.5 43.7 37.6 9.4 <0.1 NTU TM34/PM0
LOD/LOR UnitsMethod
No.
Exova Jones Environmental
WSP Environmental & Energy Africa
48920
UNIOPS Ethiopia ESIA
Gareth Lottreaux
Please see attached notes for all
abbreviations and acronyms
QF-PM 3.1.2 v11Please include all sections of this report if it is reproduced
All solid results are expressed on a dry weight basis unless stated otherwise. 3 of 10
Client Name: Report : Liquid
Reference:
Location:
Contact: Liquids/products: V=40ml vial, G=glass bottle, P=plastic bottle
JE Job No.: 17/15229 H=H2SO4, Z=ZnAc, N=NaOH, HN=HN03
J E Sample No. 61-63 64-66 67-68 69-71 72-74 75-77
Sample ID SW6 HH1 MESEBO BH AHA SW3 AHA SW4 AHA WS7
Depth
COC No / misc
Containers HN N P HN N P N P HN N P HN N P HN N P
Sample Date 30/08/2017 30/08/2017 01/09/2017 23/08/2017 23/08/2017 23/08/2017
Sample Type Surface Water Ground Water Ground Water Surface Water Surface Water Surface Water
Batch Number 1 1 1 1 1 1
Date of Receipt 13/09/2017 13/09/2017 13/09/2017 13/09/2017 13/09/2017 13/09/2017
Dissolved Aluminium # <20 <20 <20 <20 <20 <20 <20 ug/l TM30/PM14
Dissolved Antimony # <2 <2 <2 <2 <2 5 <2 ug/l TM30/PM14
Dissolved Arsenic # <2.5 <2.5 <2.5 <2.5 3.7 <2.5 <2.5 ug/l TM30/PM14
Dissolved Barium # 18 93 47 19 25 22 <3 ug/l TM30/PM14
Dissolved Boron 16 24 45 <12 <12 <12 <12 ug/l TM30/PM14
Dissolved Cadmium # <0.5 <0.5 <0.5 <0.5 <0.5 <0.5 <0.5 ug/l TM30/PM14
Total Dissolved Chromium # <1.5 <1.5 <1.5 <1.5 <1.5 <1.5 <1.5 ug/l TM30/PM14
Dissolved Copper # <7 <7 <7 <7 <7 <7 <7 ug/l TM30/PM14
Total Dissolved Iron # <20 <20 <20 219 156 99 <20 ug/l TM30/PM14
Dissolved Lead # <5 <5 <5 <5 <5 <5 <5 ug/l TM30/PM14
Dissolved Manganese # <2 32 <2 421 476 234 <2 ug/l TM30/PM14
Dissolved Mercury # <1 <1 <1 <1 <1 <1 <1 ug/l TM30/PM14
Dissolved Nickel # <2 <2 <2 <2 <2 2 <2 ug/l TM30/PM14
Dissolved Selenium # <3 <3 <3 <3 <3 <3 <3 ug/l TM30/PM14
Dissolved Sodium # 6.7 5.2 56.2 5.5 5.7 5.5 <0.1 mg/l TM30/PM14
Dissolved Uranium <5 <5 6 <5 <5 <5 <5 ug/l TM30/PM14
Dissolved Zinc # <3 <3 750 <3 <3 <3 <3 ug/l TM30/PM14
Fluoride <0.3 <0.3 <0.3 <0.3 <0.3 <0.3 <0.3 mg/l TM173/PM0
Sulphate as SO4 # 4.9 5.8 17.6 1.2 <0.5 <0.5 <0.5 mg/l TM38/PM0
Chloride # 3.1 2.7 2.1 1.4 1.3 0.6 <0.3 mg/l TM38/PM0
Nitrate as N # 0.73 0.35 0.21 0.39 0.55 0.14 <0.05 mg/l TM38/PM0
Nitrite as N # <0.006 0.027 <0.006 <0.006 0.024 <0.006 <0.006 mg/l TM38/PM0
Total Cyanide # <0.01 <0.01 <0.01 <0.01 <0.01 <0.01 <0.01 mg/l TM89/PM0
Electrical Conductivity @25C # 182 300 929 180 72 186 <2 uS/cm TM76/PM0
Free Ammonia as N <0.006 <0.006 <0.006 <0.006 <0.006 <0.006 <0.006 mg/l TM176/PM0
Free/Residual Chlorine <0.02 <0.02 <0.02 0.21 <0.02 0.02 <0.02 mg/l TM66/PM0
pH # 7.59 7.77 7.48 7.37 7.48 7.71 <0.01 pH units TM73/PM0
Total Dissolved Solids # 192 216 559 145 137 146 <35 mg/l TM20/PM0
Turbidity 33.2 4.8 0.3 2.0 2.9 2.7 <0.1 NTU TM34/PM0
UNIOPS Ethiopia ESIA
Gareth Lottreaux
Please see attached notes for all
abbreviations and acronyms
LOD/LOR UnitsMethod
No.
Exova Jones Environmental
WSP Environmental & Energy Africa
48920
QF-PM 3.1.2 v11Please include all sections of this report if it is reproduced
All solid results are expressed on a dry weight basis unless stated otherwise. 4 of 10
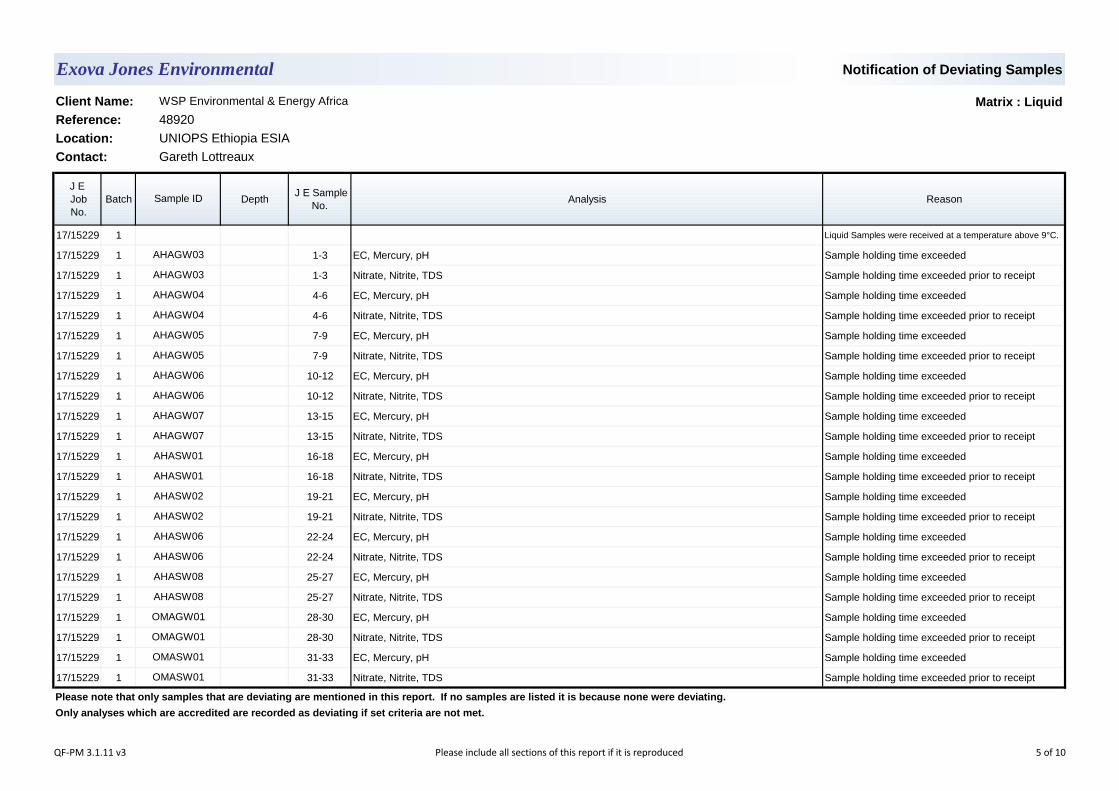
Notification of Deviating Samples
Matrix : Liquid
J E
Job
No.
Batch Depth J E Sample
No.Analysis Reason
17/15229 1 Liquid Samples were received at a temperature above 9°C.
17/15229 1 1-3 EC, Mercury, pH Sample holding time exceeded
17/15229 1 1-3 Nitrate, Nitrite, TDS Sample holding time exceeded prior to receipt
17/15229 1 4-6 EC, Mercury, pH Sample holding time exceeded
17/15229 1 4-6 Nitrate, Nitrite, TDS Sample holding time exceeded prior to receipt
17/15229 1 7-9 EC, Mercury, pH Sample holding time exceeded
17/15229 1 7-9 Nitrate, Nitrite, TDS Sample holding time exceeded prior to receipt
17/15229 1 10-12 EC, Mercury, pH Sample holding time exceeded
17/15229 1 10-12 Nitrate, Nitrite, TDS Sample holding time exceeded prior to receipt
17/15229 1 13-15 EC, Mercury, pH Sample holding time exceeded
17/15229 1 13-15 Nitrate, Nitrite, TDS Sample holding time exceeded prior to receipt
17/15229 1 16-18 EC, Mercury, pH Sample holding time exceeded
17/15229 1 16-18 Nitrate, Nitrite, TDS Sample holding time exceeded prior to receipt
17/15229 1 19-21 EC, Mercury, pH Sample holding time exceeded
17/15229 1 19-21 Nitrate, Nitrite, TDS Sample holding time exceeded prior to receipt
17/15229 1 22-24 EC, Mercury, pH Sample holding time exceeded
17/15229 1 22-24 Nitrate, Nitrite, TDS Sample holding time exceeded prior to receipt
17/15229 1 25-27 EC, Mercury, pH Sample holding time exceeded
17/15229 1 25-27 Nitrate, Nitrite, TDS Sample holding time exceeded prior to receipt
17/15229 1 28-30 EC, Mercury, pH Sample holding time exceeded
17/15229 1 28-30 Nitrate, Nitrite, TDS Sample holding time exceeded prior to receipt
17/15229 1 31-33 EC, Mercury, pH Sample holding time exceeded
17/15229 1 31-33 Nitrate, Nitrite, TDS Sample holding time exceeded prior to receipt
Please note that only samples that are deviating are mentioned in this report. If no samples are listed it is because none were deviating.
Only analyses which are accredited are recorded as deviating if set criteria are not met.
OMAGW01
OMAGW01
OMASW01
OMASW01
AHASW02
AHASW02
AHASW06
AHASW06
AHASW08
AHASW08
AHAGW06
AHAGW06
AHAGW07
AHAGW07
AHASW01
AHASW01
AHAGW03
AHAGW03
AHAGW04
AHAGW04
AHAGW05
AHAGW05
Location: UNIOPS Ethiopia ESIA
Contact: Gareth Lottreaux
Sample ID
Exova Jones Environmental
Client Name: WSP Environmental & Energy Africa
Reference: 48920
QF-PM 3.1.11 v3 Please include all sections of this report if it is reproduced 5 of 10
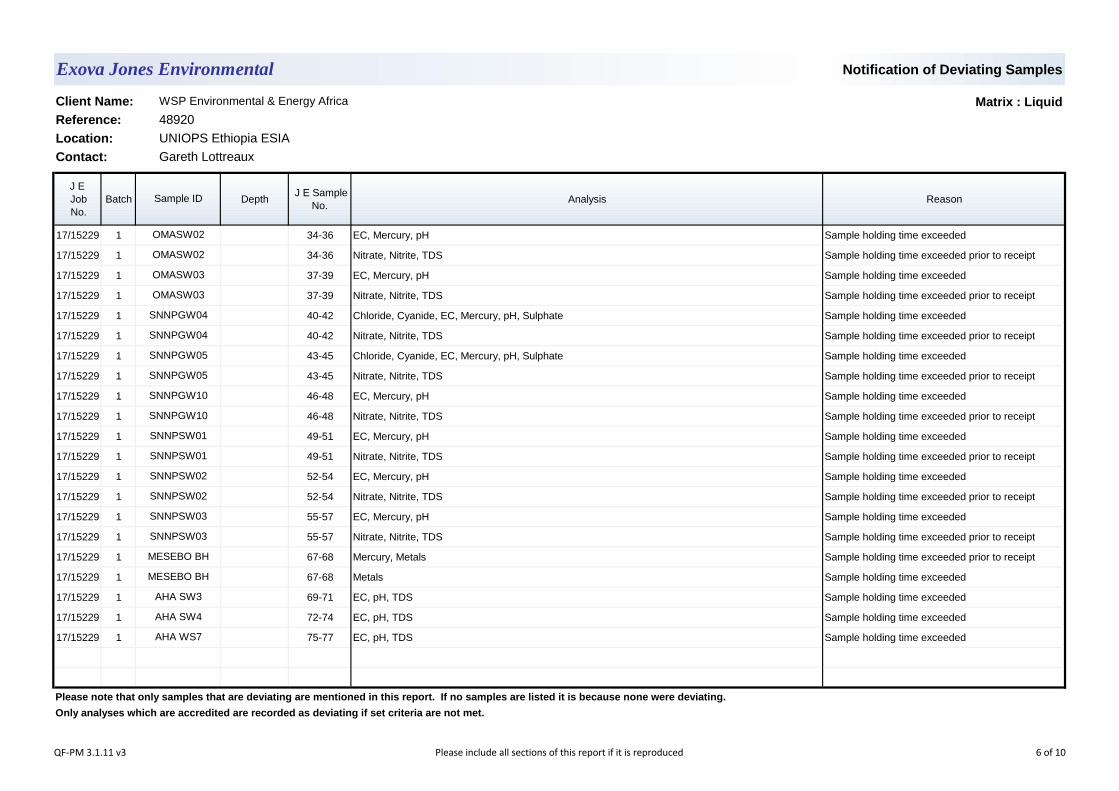
Notification of Deviating Samples
Matrix : Liquid
J E
Job
No.
Batch Depth J E Sample
No.Analysis Reason
17/15229 1 34-36 EC, Mercury, pH Sample holding time exceeded
17/15229 1 34-36 Nitrate, Nitrite, TDS Sample holding time exceeded prior to receipt
17/15229 1 37-39 EC, Mercury, pH Sample holding time exceeded
17/15229 1 37-39 Nitrate, Nitrite, TDS Sample holding time exceeded prior to receipt
17/15229 1 40-42 Chloride, Cyanide, EC, Mercury, pH, Sulphate Sample holding time exceeded
17/15229 1 40-42 Nitrate, Nitrite, TDS Sample holding time exceeded prior to receipt
17/15229 1 43-45 Chloride, Cyanide, EC, Mercury, pH, Sulphate Sample holding time exceeded
17/15229 1 43-45 Nitrate, Nitrite, TDS Sample holding time exceeded prior to receipt
17/15229 1 46-48 EC, Mercury, pH Sample holding time exceeded
17/15229 1 46-48 Nitrate, Nitrite, TDS Sample holding time exceeded prior to receipt
17/15229 1 49-51 EC, Mercury, pH Sample holding time exceeded
17/15229 1 49-51 Nitrate, Nitrite, TDS Sample holding time exceeded prior to receipt
17/15229 1 52-54 EC, Mercury, pH Sample holding time exceeded
17/15229 1 52-54 Nitrate, Nitrite, TDS Sample holding time exceeded prior to receipt
17/15229 1 55-57 EC, Mercury, pH Sample holding time exceeded
17/15229 1 55-57 Nitrate, Nitrite, TDS Sample holding time exceeded prior to receipt
17/15229 1 67-68 Mercury, Metals Sample holding time exceeded prior to receipt
17/15229 1 67-68 Metals Sample holding time exceeded
17/15229 1 69-71 EC, pH, TDS Sample holding time exceeded
17/15229 1 72-74 EC, pH, TDS Sample holding time exceeded
17/15229 1 75-77 EC, pH, TDS Sample holding time exceeded
Please note that only samples that are deviating are mentioned in this report. If no samples are listed it is because none were deviating.
Only analyses which are accredited are recorded as deviating if set criteria are not met.
MESEBO BH
AHA SW3
AHA SW4
AHA WS7
SNNPSW01
SNNPSW02
SNNPSW02
SNNPSW03
SNNPSW03
MESEBO BH
SNNPGW04
SNNPGW05
SNNPGW05
SNNPGW10
SNNPGW10
SNNPSW01
Sample ID
OMASW02
OMASW02
OMASW03
OMASW03
SNNPGW04
Reference: 48920
Location: UNIOPS Ethiopia ESIA
Contact: Gareth Lottreaux
Exova Jones Environmental
Client Name: WSP Environmental & Energy Africa
QF-PM 3.1.11 v3 Please include all sections of this report if it is reproduced 6 of 10
JE Job No.:
SOILS
DEVIATING SAMPLES
SURROGATES
DILUTIONS
BLANKS
NOTE
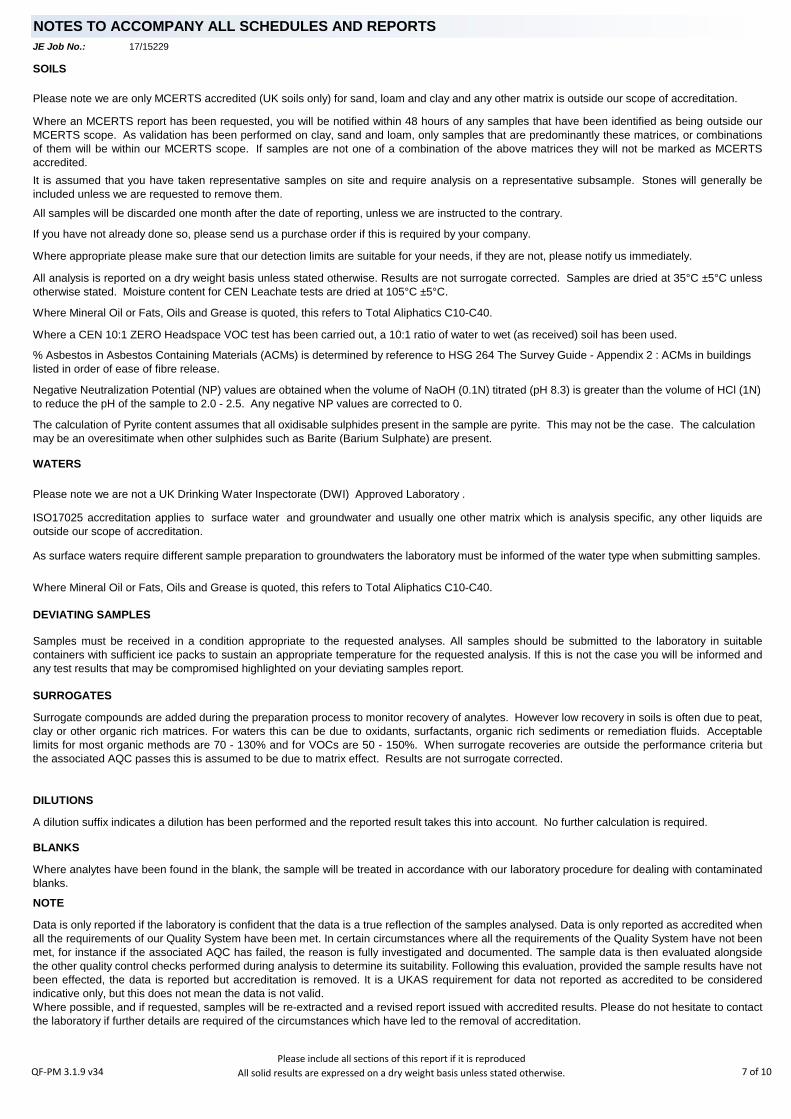
NOTES TO ACCOMPANY ALL SCHEDULES AND REPORTS
Please note we are only MCERTS accredited (UK soils only) for sand, loam and clay and any other matrix is outside our scope of accreditation.
Where Mineral Oil or Fats, Oils and Grease is quoted, this refers to Total Aliphatics C10-C40.
17/15229
WATERS
It is assumed that you have taken representative samples on site and require analysis on a representative subsample. Stones will generally be
included unless we are requested to remove them.
All analysis is reported on a dry weight basis unless stated otherwise. Results are not surrogate corrected. Samples are dried at 35°C ±5°C unless
otherwise stated. Moisture content for CEN Leachate tests are dried at 105°C ±5°C.
Surrogate compounds are added during the preparation process to monitor recovery of analytes. However low recovery in soils is often due to peat,
clay or other organic rich matrices. For waters this can be due to oxidants, surfactants, organic rich sediments or remediation fluids. Acceptable
limits for most organic methods are 70 - 130% and for VOCs are 50 - 150%. When surrogate recoveries are outside the performance criteria but
the associated AQC passes this is assumed to be due to matrix effect. Results are not surrogate corrected.
A dilution suffix indicates a dilution has been performed and the reported result takes this into account. No further calculation is required.
Where Mineral Oil or Fats, Oils and Grease is quoted, this refers to Total Aliphatics C10-C40.
Please note we are not a UK Drinking Water Inspectorate (DWI) Approved Laboratory .
If you have not already done so, please send us a purchase order if this is required by your company.
The calculation of Pyrite content assumes that all oxidisable sulphides present in the sample are pyrite. This may not be the case. The calculation
may be an overesitimate when other sulphides such as Barite (Barium Sulphate) are present.
Where analytes have been found in the blank, the sample will be treated in accordance with our laboratory procedure for dealing with contaminated
blanks.
ISO17025 accreditation applies to surface water and groundwater and usually one other matrix which is analysis specific, any other liquids are
outside our scope of accreditation.
As surface waters require different sample preparation to groundwaters the laboratory must be informed of the water type when submitting samples.
Where appropriate please make sure that our detection limits are suitable for your needs, if they are not, please notify us immediately.
Data is only reported if the laboratory is confident that the data is a true reflection of the samples analysed. Data is only reported as accredited when
all the requirements of our Quality System have been met. In certain circumstances where all the requirements of the Quality System have not been
met, for instance if the associated AQC has failed, the reason is fully investigated and documented. The sample data is then evaluated alongside
the other quality control checks performed during analysis to determine its suitability. Following this evaluation, provided the sample results have not
been effected, the data is reported but accreditation is removed. It is a UKAS requirement for data not reported as accredited to be considered
indicative only, but this does not mean the data is not valid.
Where possible, and if requested, samples will be re-extracted and a revised report issued with accredited results. Please do not hesitate to contact
the laboratory if further details are required of the circumstances which have led to the removal of accreditation.
Samples must be received in a condition appropriate to the requested analyses. All samples should be submitted to the laboratory in suitable
containers with sufficient ice packs to sustain an appropriate temperature for the requested analysis. If this is not the case you will be informed and
any test results that may be compromised highlighted on your deviating samples report.
Where an MCERTS report has been requested, you will be notified within 48 hours of any samples that have been identified as being outside our
MCERTS scope. As validation has been performed on clay, sand and loam, only samples that are predominantly these matrices, or combinations
of them will be within our MCERTS scope. If samples are not one of a combination of the above matrices they will not be marked as MCERTS
accredited.
Negative Neutralization Potential (NP) values are obtained when the volume of NaOH (0.1N) titrated (pH 8.3) is greater than the volume of HCl (1N)
to reduce the pH of the sample to 2.0 - 2.5. Any negative NP values are corrected to 0.
Where a CEN 10:1 ZERO Headspace VOC test has been carried out, a 10:1 ratio of water to wet (as received) soil has been used.
All samples will be discarded one month after the date of reporting, unless we are instructed to the contrary.
% Asbestos in Asbestos Containing Materials (ACMs) is determined by reference to HSG 264 The Survey Guide - Appendix 2 : ACMs in buildings
listed in order of ease of fibre release.
QF-PM 3.1.9 v34Please include all sections of this report if it is reproduced
All solid results are expressed on a dry weight basis unless stated otherwise. 7 of 10
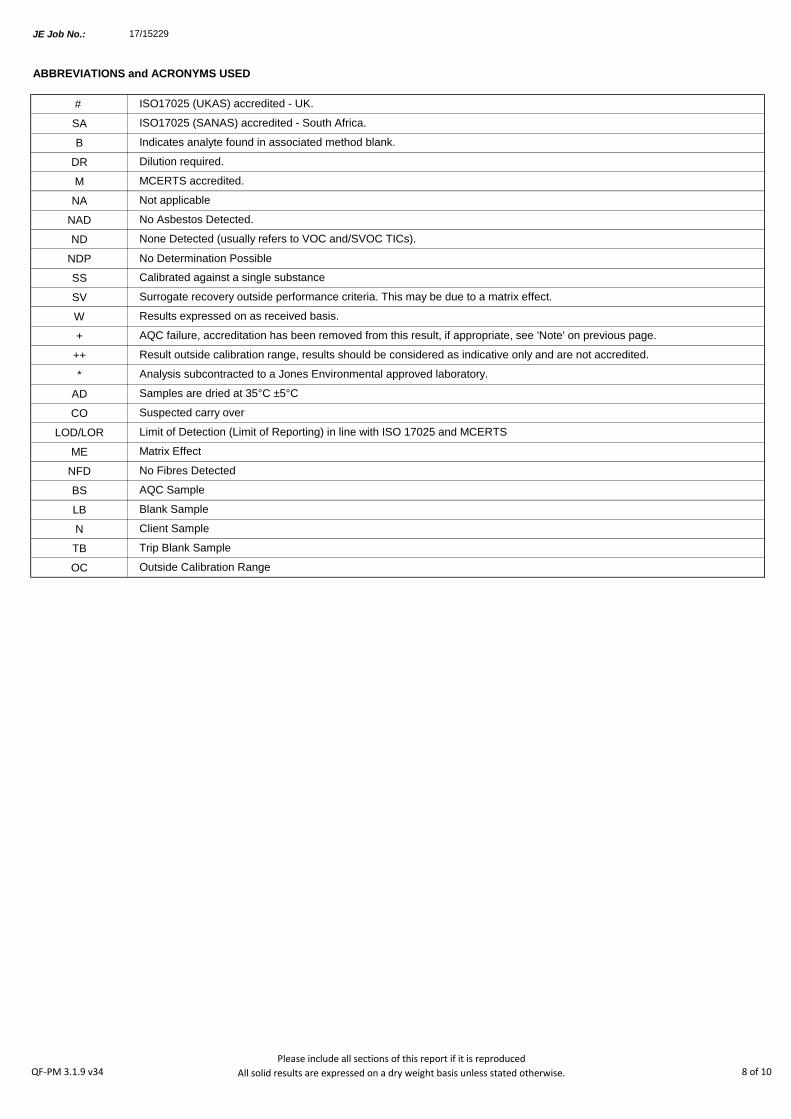
JE Job No.:
#
SA
B
DR
M
NA
NAD
ND
NDP
SS
SV
W
+
++
*
AD
CO
LOD/LOR
ME
NFD
BS
LB
N
TB
OC
17/15229
ABBREVIATIONS and ACRONYMS USED
ISO17025 (UKAS) accredited - UK.
Trip Blank Sample
AQC Sample
Suspected carry over
Limit of Detection (Limit of Reporting) in line with ISO 17025 and MCERTS
Not applicable
No Asbestos Detected.
Dilution required.
ISO17025 (SANAS) accredited - South Africa.
Outside Calibration Range
No Fibres Detected
Result outside calibration range, results should be considered as indicative only and are not accredited.
Results expressed on as received basis.
Surrogate recovery outside performance criteria. This may be due to a matrix effect.
MCERTS accredited.
Matrix Effect
Blank Sample
Client Sample
No Determination Possible
Indicates analyte found in associated method blank.
None Detected (usually refers to VOC and/SVOC TICs).
Samples are dried at 35°C ±5°C
Analysis subcontracted to a Jones Environmental approved laboratory.
AQC failure, accreditation has been removed from this result, if appropriate, see 'Note' on previous page.
Calibrated against a single substance
QF-PM 3.1.9 v34Please include all sections of this report if it is reproduced
All solid results are expressed on a dry weight basis unless stated otherwise. 8 of 10
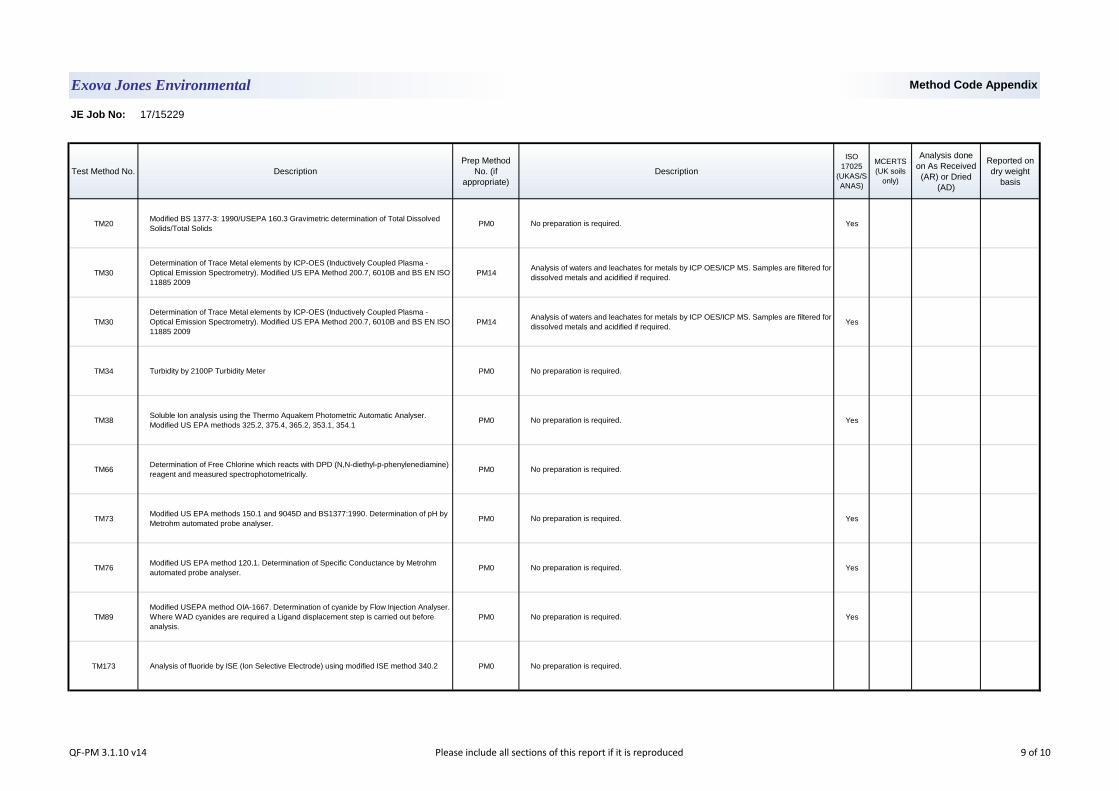
JE Job No: 17/15229
Test Method No. Description
Prep Method
No. (if
appropriate)
Description
ISO
17025
(UKAS/S
ANAS)
MCERTS
(UK soils
only)
Analysis done
on As Received
(AR) or Dried
(AD)
Reported on
dry weight
basis
TM20Modified BS 1377-3: 1990/USEPA 160.3 Gravimetric determination of Total Dissolved
Solids/Total SolidsPM0 No preparation is required. Yes
TM30
Determination of Trace Metal elements by ICP-OES (Inductively Coupled Plasma -
Optical Emission Spectrometry). Modified US EPA Method 200.7, 6010B and BS EN ISO
11885 2009
PM14Analysis of waters and leachates for metals by ICP OES/ICP MS. Samples are filtered for
dissolved metals and acidified if required.
TM30
Determination of Trace Metal elements by ICP-OES (Inductively Coupled Plasma -
Optical Emission Spectrometry). Modified US EPA Method 200.7, 6010B and BS EN ISO
11885 2009
PM14Analysis of waters and leachates for metals by ICP OES/ICP MS. Samples are filtered for
dissolved metals and acidified if required.Yes
TM34 Turbidity by 2100P Turbidity Meter PM0 No preparation is required.
TM38Soluble Ion analysis using the Thermo Aquakem Photometric Automatic Analyser.
Modified US EPA methods 325.2, 375.4, 365.2, 353.1, 354.1PM0 No preparation is required. Yes
TM66Determination of Free Chlorine which reacts with DPD (N,N-diethyl-p-phenylenediamine)
reagent and measured spectrophotometrically.PM0 No preparation is required.
TM73Modified US EPA methods 150.1 and 9045D and BS1377:1990. Determination of pH by
Metrohm automated probe analyser.PM0 No preparation is required. Yes
TM76Modified US EPA method 120.1. Determination of Specific Conductance by Metrohm
automated probe analyser.PM0 No preparation is required. Yes
TM89
Modified USEPA method OIA-1667. Determination of cyanide by Flow Injection Analyser.
Where WAD cyanides are required a Ligand displacement step is carried out before
analysis.
PM0 No preparation is required. Yes
TM173 Analysis of fluoride by ISE (Ion Selective Electrode) using modified ISE method 340.2 PM0 No preparation is required.
Exova Jones Environmental Method Code Appendix
QF-PM 3.1.10 v14 Please include all sections of this report if it is reproduced 9 of 10
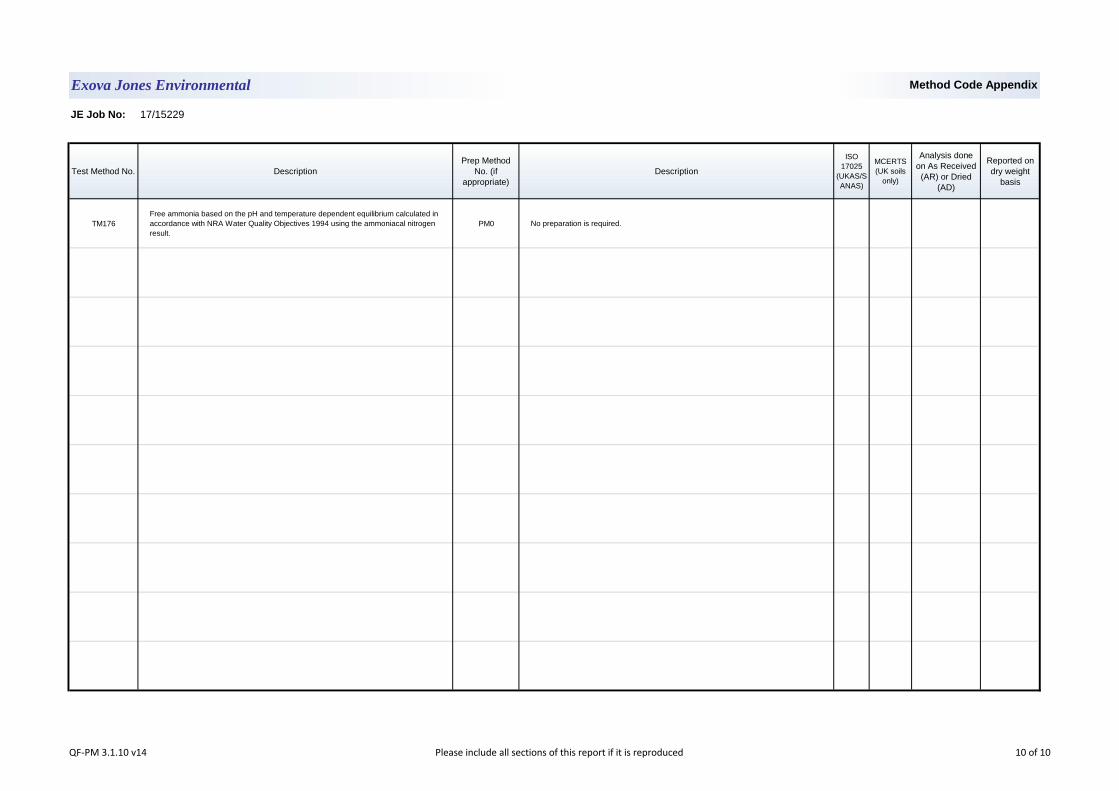
JE Job No: 17/15229
Test Method No. Description
Prep Method
No. (if
appropriate)
Description
ISO
17025
(UKAS/S
ANAS)
MCERTS
(UK soils
only)
Analysis done
on As Received
(AR) or Dried
(AD)
Reported on
dry weight
basis
TM176
Free ammonia based on the pH and temperature dependent equilibrium calculated in
accordance with NRA Water Quality Objectives 1994 using the ammoniacal nitrogen
result.
PM0 No preparation is required.
Exova Jones Environmental Method Code Appendix
QF-PM 3.1.10 v14 Please include all sections of this report if it is reproduced 10 of 10


![Groundwater Risk Assessment Model (GRAM): Groundwater …...Groundwater Risk Assessment Model (GRAM): Groundwater ... [15–19]. Such an approach requires modeling of pollutant transport](https://static.fdocuments.us/doc/165x107/5f0d13147e708231d4388d71/groundwater-risk-assessment-model-gram-groundwater-groundwater-risk-assessment.jpg)

