Ground Water Year Book of Kerala (2011-12)cgwb.gov.in/Regions/GW-year-Books/GWYB-2014-15/GWYB 14-15...
145
भारत सरकार GOVERNMENT OF INDIA जल संसाधन, नदी विकास और गंगा संरण मंालय MINISTRY OF WATER RESOURCES RIVER DEVELOPMENT AND GANGA REJUVENATION CENTRAL GROUND WATER BOARD के रल के िावषिक भ ू जल ररपॉि GROUND WATER YEAR BOOK OF KERALA (2014-2015) के रल े KERALA REGION तििनं िपुरम THIRUVANANTHAPURAM OCTOBER 2015 GROUND WATER YEAR BOOK OF KERALA (2014 -15)
Transcript of Ground Water Year Book of Kerala (2011-12)cgwb.gov.in/Regions/GW-year-Books/GWYB-2014-15/GWYB 14-15...

भारत सरकार GOVERNMENT OF INDIA
जल संसाधन, नदी विकास और गंगा संरक्षण मंत्रालय MINISTRY OF WATER RESOURCES RIVER DEVELOPMENT
AND GANGA REJUVENATION CENTRAL GROUND WATER BOARD
केरल के िावषिक भूजल ररपॉर्ि
GROUND WATER YEAR BOOK OF KERALA (2014-2015)
केरल क्षेत्र
KERALA REGION तिरुिनिंपरुम
THIRUVANANTHAPURAM
OCTOBER 2015
GROUND WATER YEAR BOOK OF KERALA (2014 -15)

Table of Contents Foreword I INTRODUCTION ................................................................................................................................... 2 II HYDROGEOLOGY ............................................................................................................................... 5
Physiography .................................................................................................................. 5
Geology ........................................................................................................................... 5
Occurrence of Groundwater ............................................................................................ 6 III RAINFALL DISTRIBUTION IN KERALA DURING 2014 - 15 ....................................................... 7
Introduction ..................................................................................................................... 7
Annual rainfall distribution ............................................................................................. 7
Monthly rainfall distribution ........................................................................................... 7
Normal rainfall vs. actual rainfall ................................................................................... 7
Hot weather period .......................................................................................................... 7
South-west monsoon period ............................................................................................ 8
North-east monsoon period ............................................................................................. 8
Winter period .................................................................................................................. 8
Seasonal rainfall contribution to the total rainfall of the year 2014-15 .......................... 8
Comparison of 2014-15 rainfall with previous year rainfall .......................................... 9 IV DEPTH TO WATER LEVEL SCENARIO DURING 2014 - 15 ...................................................... 19
Depth to water level during April 2014 ........................................................................ 19
Depth to water level during August 2014 ..................................................................... 20
Depth to water level during November 2014 ................................................................ 20
Depth to water level during January 2015 .................................................................... 21 V. WATER LEVEL FLUCTUATION IN KERALA DURING 2014-2015 ........................................... 30
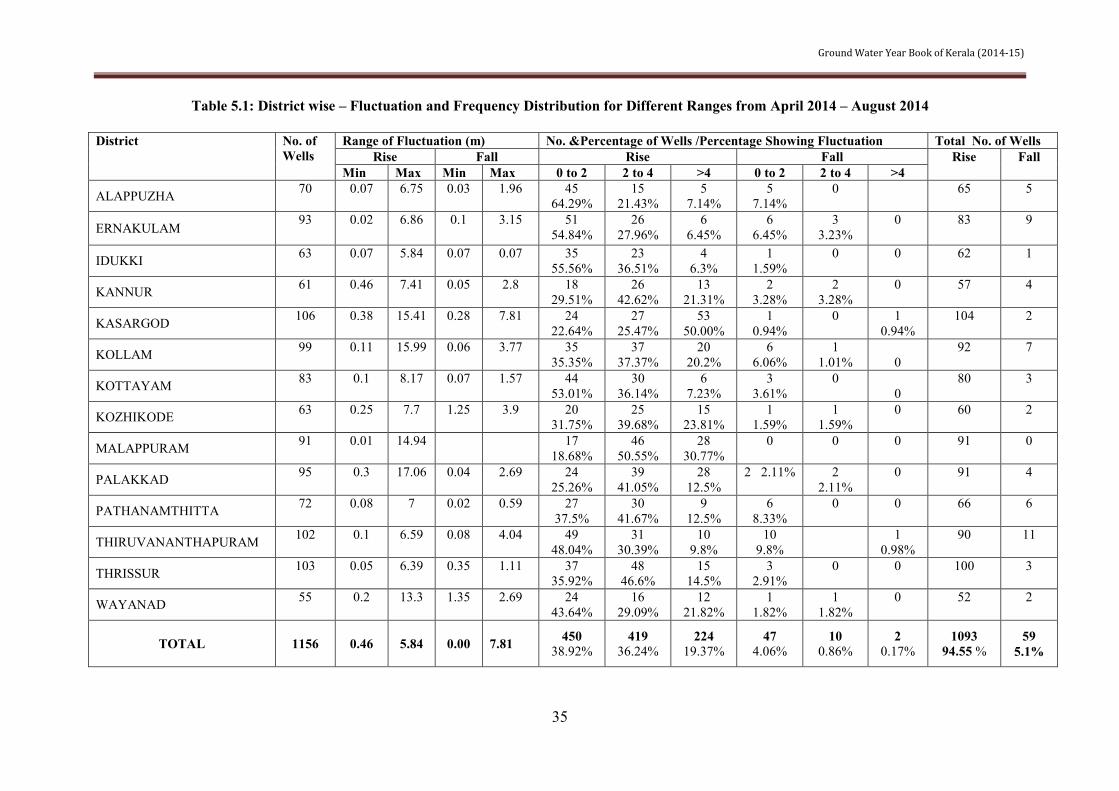
Fluctuation between April 2014 and August 2014 ....................................................... 30
Fluctuation between April 2014 and November 2014 .................................................. 30

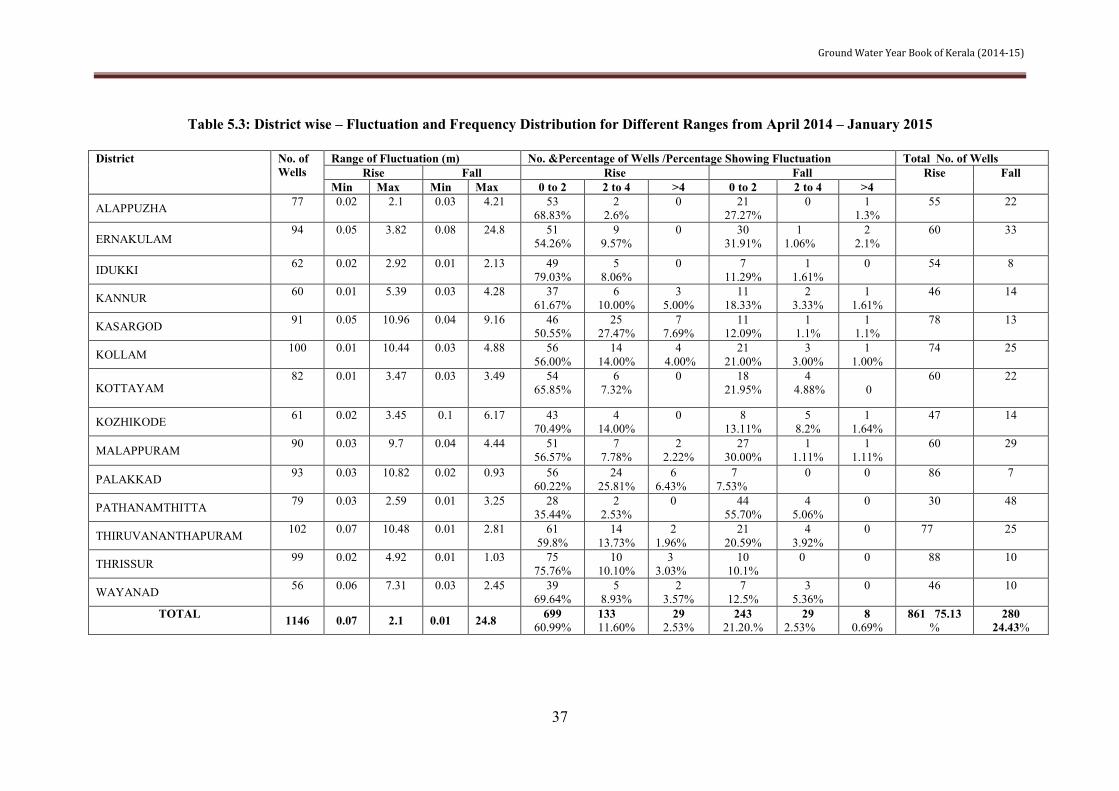
Fluctuation between April 2014 and January 2015 ...................................................... 31 VI. COMPARISON OF 2014-15 WATER LEVELS WITH THE DECADAL MEAN (2004-2013) .. 38
Fluctuation between Mean April (2004-2013) and April 2014 .................................... 38
Fluctuation between Mean August (2004-2013) and August 2014 .............................. 38
Fluctuation between Mean November (2004-2013) and November 2014 ................... 38
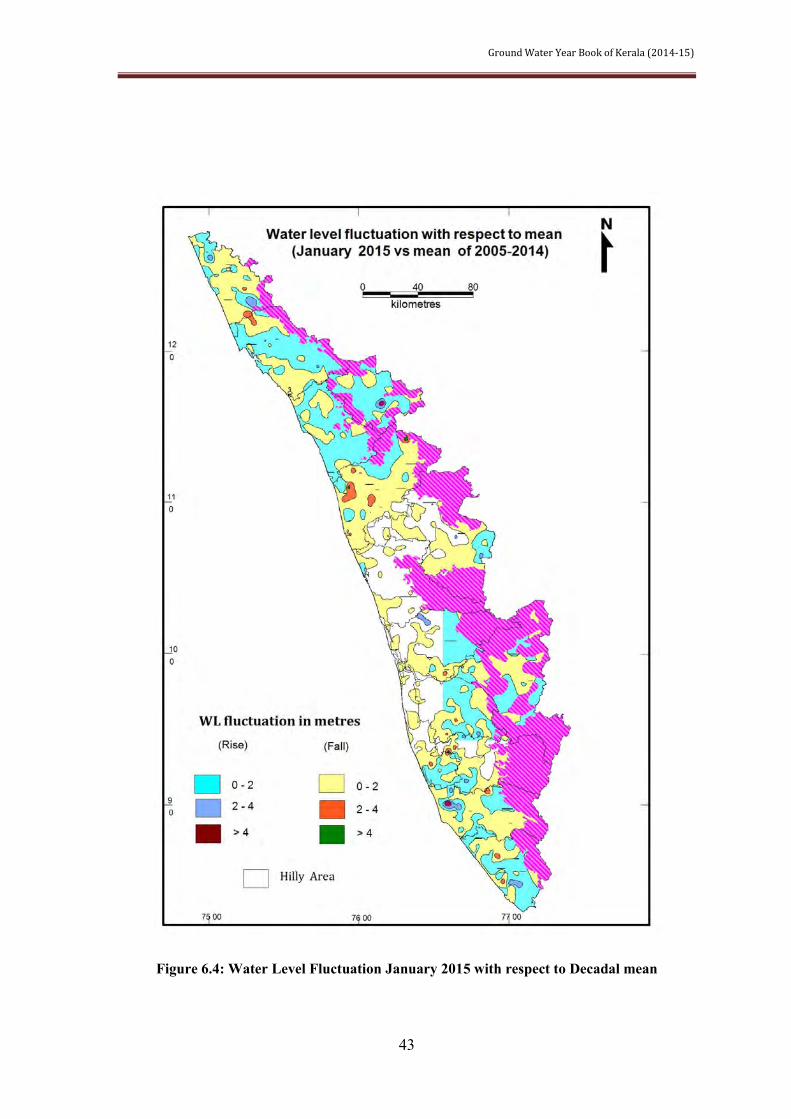
Fluctuation between Mean January (2005-2014) and January 2015 ............................ 39 VII LONG TERM GROUND WATER LEVEL TREND .................................................................... 48 VIII. BEHAVIOUR OF PIEZOMETRIC HEADS IN DEEP AQUIFERS OF CONFINED/SEMICONFINED NATURE DURING THE YEAR 2014-2015 ...................................... 53
Sedimentary area: ......................................................................................................... 53
Crystalline area: ............................................................................................................ 53 IX. HYDROCHEMISTRY ........................................................................................................................ 56 X SUM UP ................................................................................................................................................... 62
LIST OF TABLES Table 1.1: District wise breakup of Ground Water Monitoring Wells in Kerala State as on 31-03-2015 ............ 3 Table 2.1: Geological Succession of Kerala ........................................................................................................ 5 Table 3.1: Monthly Rainfall Distribution (mm) during 2013-2014 ..................... Error! Bookmark not defined. Table 3.2:Seasonal Rainfall, Normal Rainfall and the percentage Departure in 2013-2014 in Kerala State...... 11 Table 3.3: Seasonal Rainfall Distribution and their Percentage Contribution to Annual Rainfall (2013-2014) . 12 Table 3.4: Comparison of 2013-2014 Seasonal Rainfall with the Seasonal Rainfall of 2012-2013 ................... 13 Table 4.1: District wise Well Frequency for Different ranges of depth to water level for April 2014 ............... 26 Table 4.2 : District Wise Well Frequency For Different Ranges Of Depth To Water Level For August 2014 .. 27 Table 4.3: District Wise Well Frequency For Different Ranges Of Depth To Water Level For November 201428 Table 4.4: District Wise Well Frequency For Different Ranges Of Depth To Water Level For January 2015 .. 29 Table 5.1: District wise – Fluctuation and Frequency Distribution for Different Ranges from April 2014 – August 2014 ....................................................................................................................................................... 35 Table 5.2: District wise – Fluctuation and Frequency Distribution for Different Ranges from April 2014 – November 2014 .................................................................................................................................................. 36 Table 5.3: District wise – Fluctuation and Frequency Distribution for Different Ranges from April 2014 – January 2015....................................................................................................................................................... 37

Table 6.1: District wise Well Frequency for Different Ranges of Water Level Fluctuation (April 2014 – Decadal mean (April 2004-2013) ....................................................................................................................... 44 Table 6.2: District wise Well Frequency for Different Ranges of Water Level Fluctuation (August 2014-Decadal mean (August 2004-2013) .................................................................................................................... 45 Table 6.3: District wise Well Frequency for Different Ranges of Water Level Fluctuation (November 2014 – Decadal mean (November 2004-2013) ............................................................................................................... 46 Table 6. 4: District wise Well Frequency for Different Ranges of Water Level Fluctuation (January 2015 – Decadal mean (January 2005-2014) ................................................................................................................... 47 Table 9.1: Frequency Distribution of Electrical Conductivity (Microsiemens/cm at 250C) ............................. 56 in the National Hydrograph MonitoringWells in Kerala State during April 2012- Statewise .......................... 56 Table 9.2: Frequency Distribution of Electrical Conductivity (Microsiemens/cm at 250C) in National Hydrograph Monitoring Wells during April 2012- Districtwise ....................................................................... 56 Table 9.3: National Hydrograph Monitoring Wells noted for localized pollution.............................................. 60
LIST OF FIGURES Figure 1.1: Location of Ground Water Monitoring Wells in Kerala .................................................................... 4 Figure 3.1(a): Kerala State Rainfall Pattern(April & May2014) Figure 3.1(b): Kerala State Rainfall Pattern (June & September 2014) 14 Figure 3.1(c): Kerala State Rainfall Pattern(Oct & Dec 2013) ........................................................................... 15 Fig. 3.2 Seasonal rainfall contribution to annual rainfall in percentage (2014-15) ............................................ 16 Fig.3.3 Seasonal rainfall Departure from its Normal during the period 2014-15 ............................................... 17 Figure 4.1: Depth to water level in Kerala State during April 2014 ................................................................... 22 Figure 4.2: Depth to water level in Kerala State during August 2014 ................................................................ 23 Figure 4.3: Depth to water level in Kerala State during November 2014........................................................... 24 Figure 4.4: Depth to water level in Kerala State during January2015 ................................................................ 25 Figure 5.1: Water Level Fluctuation between April 2014 and August 2014 ...................................................... 32 Figure 5.2: Water Level Fluctuation between April 2014 and November 2014 ................................................. 33 Figure 5.3: Water Level Fluctuation between January and 2015April 2014 ...................................................... 34 Figure 6.1: Water Level Fluctuation April 2014 with respect to Decadal mean ................................................ 40 Figure 6.2: Water Level Fluctuation August 2014 with respect to Decadal mean ............................................. 41 Figure 6.3: Water Level Fluctuation November 2014 with respect to Decadal mean ........................................ 42 Figure 6.4: Water Level Fluctuation January 2015 with respect to Decadal mean ............................................ 43 Figure 7.1: Pre-monsoon water level trend for the period 2005-2014 ................................................................ 49 Figure 7.2: Post -monsoon water level trend for the period 2005-2014 ............................................................. 50
Figure 7.3: Hydrograph of GWMWs tapping phreatic aquifer in laterites at Kommeri, Kannur ....................... 51 Figure 7.4: Hydrograph of GWMW tapping phreatic aquifer in laterites at Madavur, Thiruvananthapuram District ................................................................................................................................................................ 51 Figure 7.5: Hydrograph of GWMW tapping phreatic aquifer in laterites at Kottiyur, Kannur District ............. 51 Figure 7.6: Hydrograph of GWMW tapping phreatic aquifer in laterites at Ayur, Kollam District ................... 52 Figure 7.7: Hydrograph of GWMW tapping phreatic aquifer in weathered crystallines at Palghat, Palakkad District ................................................................................................................................................................ 52 Figure 7.8: Hydrograph of GWMW tapping phreatic aquifer in laterites at Mannanthala, Thiruvananthapuram District ................................................................................................................................................................ 52 Figure 8.1 Hydrograph of Piezometer tapping Warkalai aquifer at Karthikapally(N), Alappuzha District ....... 54 Figure 8.2 Hydrograph of Piezometer tapping Quilon aquifer at Karthikapally(S), Alappuzha District ........... 54 Figure 8.3 Hydrograph of Piezometer tapping fractured aquifers at Vadakkancherry, Palakkad District .......... 54 Figure. 8.4: Hydrograph of Piezometer tapping fractured aquifers at Koduvayur, Palakkad District ................ 55 Figure 9.1: Locations showing Electrical Conductivity more than 1000 µS/cm(April 2012) ............................ 58 Figure 9.1: Locations showing Nitrate more than 45mg/l(April 2012) .............................................................. 59
ANNEXURES I Water level data of Groundwater Monitoring Wells in Kerala State during the year 2014-15……………65
II Chemical analysis data of water samples from Groundwater Monitoring Wells in Kerala (April & November
2010)…104
FOREWORD Ground water is an important source of water for meeting the drinking, agricultural and industrial needs in India. Over the last few decades, the use of ground water in the country has increased manifold, exerting pressure on the limited resources available and threatening their long-term sustainability in many places. Kerala, though blessed with copious rainfall and abundant surface water resources, depends heavily on the limited ground water resources to meet its drinking and domestic water requirements, especially in the rural habitations. In the recent past, scarcity of drinking water resources during summer months is being faced by several habitations in the State with increasing regularity. Kerala State has limited ground water development prospects owing to the largely undulating topography and predominance of crystalline rocks devoid of any primary porosity. Increasing demand of fresh water resources due to change in life styles, agricultural practices and urbanisation has resulted in increasing stress on the ground water regime in several areas of the State. Contamination of ground water resources from natural and anthropogenic sources is also emerging as a major threat to the sustainability of ground water resources in many areas. Anticipated impact of impending climate change and sea level rise also has the potential to change the ground water regime in the State. Scientific management of ground water resources of the State has become imperative to ensure prevention of further ground water depletion and contamination and to ensure its long-term sustainability. To build a realistic ground water management strategy, assessment of ground water availability and its quality is a pre-requisite. With this in view, Central Ground water Board has established a network of Ground Water Monitoring Wells (GWMW) tapping different aquifers in the State. Presently, there are 1638 GWMW in Kerala State, out of which 1369 are dug wells tapping phreatic aquifers and 269 are bore wells /tube wells tapping deeper semi-confined/confined aquifers, which are monitored four times a year. The document “Ground Water Year Book Kerala (2014-15)” is a compilation of water level and water quality data collected from these wells during 2014-15. The behaviour of water level during the four monitoring periods and their fluctuations – both seasonal and long term, have been analysed and included in this report. Besides this, behaviour of piezometric heads of deeper aquifers in hard rock as wells as in sedimentary aquifers have also been discussed. The chapter on Hydrochemistry brings out the ground water quality of water samples collected from the wells tapping the phreatic aquifer. The efforts of the Officers of CGWB, Kerala Region, Thiruvananthapuram in collecting the data and the meticulous work done by the team of officers comprising N. Vinayachandran, Scientist D, Rani V. R., Scientist-C, Smt. V. N. Sreelatha, Sc- C, and Smt. Bindu J. Viju, Scientist- B in compiling this document deserve appreciation. I hope this compilation will be of use to planners, policy makers and stakeholders in the field of ground water in Kerala. Thiruvananthapuram (Dr. Nandakumaran P) October 2015 Regional Director

Ground Water Year Book of Kerala (2013-14)
2
I INTRODUCTION
The awareness among the public about the importance of the groundwater has increased
during the recent years. The need for groundwater being felt by all sectors because of the
shortage of surface water sources to mitigate the growing needs of the society. Recently the
problems of decline in water table, contamination of groundwater, seawater intrusion etc are
being reported at many places. The shortage of rainfall in recent years and the increased
utilisation of ground water caused concern among the public that water may become scarce
commodity in future. In order to assess the real situation of groundwater conditions, it is very
essential to monitor the groundwater level and water quality over time and space. Central
Ground Water Board is monitoring water level and quality through a network of Ground
Water Monitoring Wells distributed throughout the State. The monitoring started from the
year 1969 for nine monitoring wells and the numbers of monitoring wells were increased
during the subsequent years and became 224 by the year 1979 and the number became 460 by
the year 1988. Presently the total number of Ground Water Monitoring Wells (GWMWs)
through out the Kerala State is 1638. Water level is being monitored four times a year during
January, April, August and November months and water quality is being monitored from the
water samples collected from GWMWs during April.
Kerala State is a narrow stretch of land covering 38863 sq.km area bordering the
Lakshadweep Sea on the western side and Tamil Nadu and Karnataka States on the eastern
side. The length of the State from north to south is 560 km and the average width is 70 km.
with a maximum of 125 km. It lies between North latitudes 08018’ and 12048’ and East
longitudes 74052’ and 77022’.
The total number of GWMWs as on 31.3.2015 is 1638. Out of these, 1369 are dug wells
tapping phreatic aquifers and 269 are borewells /tubewells tapping deeper aquifers of
confined / semi-confined nature. These GWMWs are spread over all the physiographic
divisions of the State. About 62% of the GWMWs fall in the midland region, 18% in coastal
plains, 15% in highlands and 5% in Plateau region. Among the GWMWs tapping phreatic
aquifer, 65% are tapping laterite, 17% tapping weathered and fractured crystallines, 15%
tapping coastal alluvium and 3% tapping riverine alluvium. The data of these GWMWs
were analysed to understand the depth to water level scenario in the State, annual fluctuation
in the water levels due to the monsoon recharge, long term trend in water levels and the
nature of the quality of ground water and the salient features are brought out in this report.

Ground Water Year Book of Kerala (2013-14)
3
Maps of depth to water level, water level fluctuation with respect to April and decadal mean
are prepared using the data of GWMWs tapping phreatic aquifer. Some hydrographs
representing phreatic, semi-confined and confined aquifers in sedimentary and hard rock
aquifers are also incorporated in this report.
The district wise break-up of GWMWs are given in the Table 1.1 and locations are shown in
Figure 1.1. The water level data collected during the year 2014 - 15 of GWMWs (dug wells)
are given in Annexure-I. The hydro-chemical data of water samples collected during April
and November 2010 are given in Annexure- II.
Table 1.1: District wise breakup of Ground Water Monitoring Wells in Kerala State as on 31-03-2015
Sl.
Name of district
No. of GWMW as on 31-03--2015 Density
No. Dug Wells Piezometers Total km2/
GWMW
1 Thiruvananthapuram 116 22 138 16
2 Kollam 109 20 129 19
3 Pathanamthitta 80 14 94 28
4 Alappuzha 81 22 103 14
5 Kottayam 99 8 107 21
6 Idukki 69 8 77 58
7 Ernakulam 115 18 133 22
8 Thrissur 120 21 141 22
9 Palakkad 112 44 156 29
10 Malappuram 115 22 137 26
11 Kozhikode 79 20 99 24
12 Wayanad 75 9 84 25
13 Kannur 95 16 111 27
14 Kasaragod 104 25 129 15
Total 1369 269 1638 24

Ground Water Year Book of Kerala (2013-14)
4
Figure 1.1: Location of Ground Water Monitoring Wells in Kerala
Ground Water Year Book of Kerala (2013-14)
5
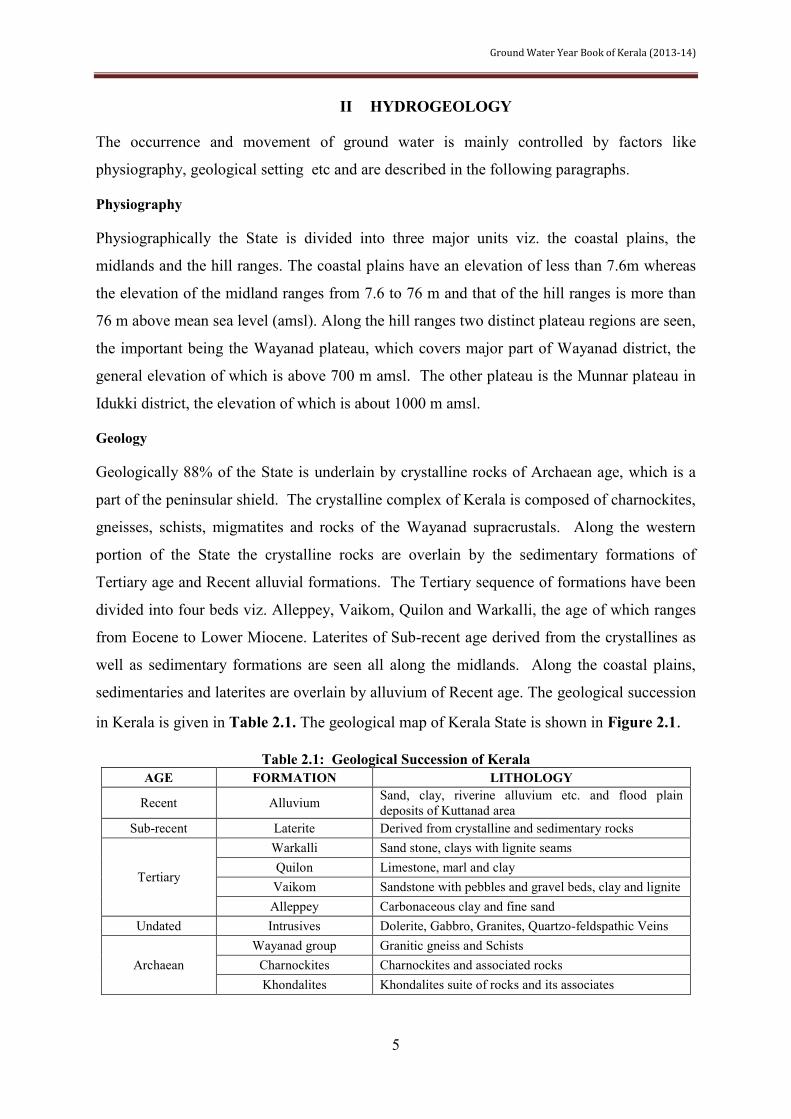
II HYDROGEOLOGY
The occurrence and movement of ground water is mainly controlled by factors like
physiography, geological setting etc and are described in the following paragraphs.
Physiography
Physiographically the State is divided into three major units viz. the coastal plains, the
midlands and the hill ranges. The coastal plains have an elevation of less than 7.6m whereas
the elevation of the midland ranges from 7.6 to 76 m and that of the hill ranges is more than
76 m above mean sea level (amsl). Along the hill ranges two distinct plateau regions are seen,
the important being the Wayanad plateau, which covers major part of Wayanad district, the
general elevation of which is above 700 m amsl. The other plateau is the Munnar plateau in
Idukki district, the elevation of which is about 1000 m amsl.
Geology
Geologically 88% of the State is underlain by crystalline rocks of Archaean age, which is a
part of the peninsular shield. The crystalline complex of Kerala is composed of charnockites,
gneisses, schists, migmatites and rocks of the Wayanad supracrustals. Along the western
portion of the State the crystalline rocks are overlain by the sedimentary formations of
Tertiary age and Recent alluvial formations. The Tertiary sequence of formations have been
divided into four beds viz. Alleppey, Vaikom, Quilon and Warkalli, the age of which ranges
from Eocene to Lower Miocene. Laterites of Sub-recent age derived from the crystallines as
well as sedimentary formations are seen all along the midlands. Along the coastal plains,
sedimentaries and laterites are overlain by alluvium of Recent age. The geological succession
in Kerala is given in Table 2.1. The geological map of Kerala State is shown in Figure 2.1.
Table 2.1: Geological Succession of Kerala AGE FORMATION LITHOLOGY
Recent Alluvium Sand, clay, riverine alluvium etc. and flood plain deposits of Kuttanad area
Sub-recent Laterite Derived from crystalline and sedimentary rocks
Tertiary
Warkalli Sand stone, clays with lignite seams Quilon Limestone, marl and clay Vaikom Sandstone with pebbles and gravel beds, clay and lignite Alleppey Carbonaceous clay and fine sand
Undated Intrusives Dolerite, Gabbro, Granites, Quartzo-feldspathic Veins
Archaean Wayanad group Granitic gneiss and Schists
Charnockites Charnockites and associated rocks Khondalites Khondalites suite of rocks and its associates

Ground Water Year Book of Kerala (2013-14)
6
Occurrence of Groundwater
Groundwater occurs under phreatic, semi-confined and confined conditions in the above
formations. The weathered crystallines, laterites and alluvial formations form the major
phreatic aquifers, whereas the deep fractures in the crystallines and the granular zones in the
Tertiary sedimentary formations form the semi-confined and confined aquifers.
Thick zones of weathered crystallines are seen along midland region. The depth to water
level in the weathered crystallines in the midland area ranges from 3 to 16 mbgl. The
midland area sustains medium capacity dug wells for irrigation. Along the hill ranges, the
crystalline rocks are covered by thin weathered zone. Mostly dug wells that can cater to
domestic needs are feasible along topographic lows. Bore wells tapping deeper fractured
aquifer are feasible along potential fractures in the midland and hill ranges. Potential fractures
are seen down to 240 mbgl and the most productive zone lies between 60 and 175 mbgl and
the discharge of bore wells range between 36,000 and 1,25,000 lph.
Of the four Tertiary beds, the two beds viz. the Vaikom and Warkalli form potential aquifers.
The oldest Alleppey beds contain brackish water as inferred from electrical logs, whereas the
Quilon beds are poor aquifers. The Vaikom aquifer is seen all along the coast between
Quilon and Ponnani and the historical piezometric surface ranges from 1 to 18 m above msl.
The aquifer is extensively developed between Quilon and Kayamkulam. The aquifer
contains fresh water south of Karuvatta in Alleppey district and also in isolated pockets in
Ernakulam district. The annual flow in the aquifer is computed as 43 MCM, of which 10
MCM is brackish. The Warkalli aquifer is seen south of Cochin. The historical piezometric
head in the aquifer varies from 2.6 m above msl to 10 m below msl. The aquifer is largely
developed in and around Alleppey. The annual flow in the aquifers is computed as 63 MCM
and the draft is around 22 MCM.
Laterites are the most widely distributed lithological unit in the State and the thickness of the
formation varies from a few meters to about 30m. The depth to water level in the formation
ranges from less than a meter to 25 mbgl. Laterite forms potential aquifers along valleys and
can sustain medium duty irrigation wells with the yields in the range of 0.5 - 6 m3 per day.
The alluvium forms potential aquifer along the coastal plains and ground water occurs under
phreatic and semi-confined conditions in this aquifer. The thickness of this formation varies
from few meters to above 100 m and the depth to water level ranges from less than a meter to
6 mbgl. Filter point wells are feasible wherever the saturated thickness exceeds 5 m.

Ground Water Year Book of Kerala (2013-14)
7
III RAINFALL DISTRIBUTION IN KERALA DURING 2014 - 15
Introduction
Rainfall is the major source of ground water recharge and the rainfall pattern plays an
important role on the water levels in the phreatic aquifers and also to the deeper aquifers.
The rainfall data received from India Meteorological Department, Trivandrum for the period
of April 2014 to March 2015 is analysed and discussed in this report.
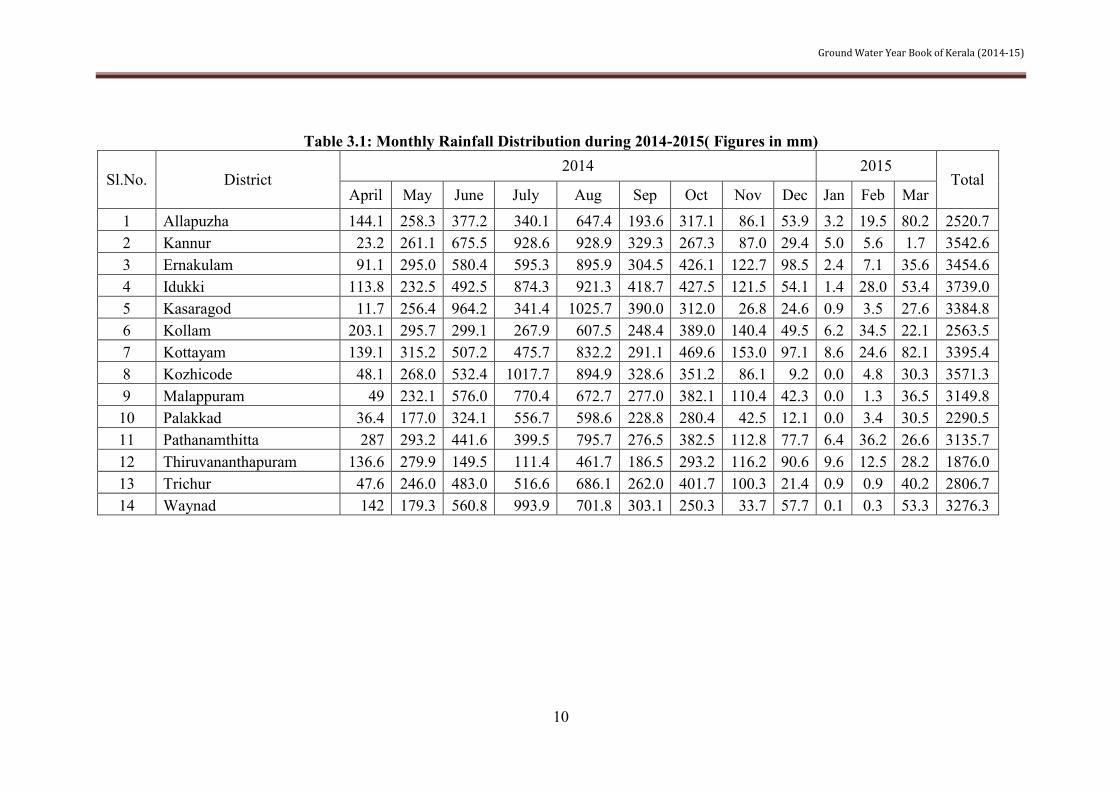
Annual rainfall distribution
The total rainfall ranged from 1876 to 3769 mm during the period from April 2014 to March
2015. The maximum rainfall was recorded in Idukki district and the minimum in Trivandrum
district.
During the southwest monsoon season, Trivandrum district recorded 871 mm and Kasargod
district recorded 3007 mm, which are the lowest and highest rainfall respectively. During the
northeast monsoon season, Kasargod district recorded the lowest rainfall of 338 mm and
kottayam district recorded the highest rainfall of 639 mm.
Monthly rainfall distribution
The monthly rainfall data for all the fourteen districts are given in Table 3.1. Almost all the
districts recorded sufficient rainfall during the month of June to September due to the
influence of south-west monsoon season.
Normal rainfall vs. actual rainfall
The rainfall during different seasons has been compared with the normal rainfall of the
seasons to find out the variation of the rainfall and is discussed in details in the following
paragraphs. As per the IMD norms districts were recorded with normal, deficient and scanty
types of rainfall during this period.
Hot weather period
The seasonal and their percentage departure from normal rainfall are given in Table 3.2.
During the months of April-May 2014, the departure of pre-monsoon rainfall varied from -
20 to 25% in different districts. The maximum departure on negative side was observed in
Thrissur district and deviation of - 20% from the normal in the southern part of Kerala.
Excess rainfall was received in Wayanad, Trivandrum, Pathanamthitta and Kollam districts

Ground Water Year Book of Kerala (2013-14)
8
and remaining all the districts were received normal rainfall. There is no scanty rainfall
observed during this period. The details are presented in Figure 3.1(a) and table. 3.2
South-west monsoon period
During the southwest monsoon season from June to September 2014, the departure of rainfall
varied from – 11% to 19% in different districts. There is no scanty and deficient rainfall
recordrd during this season. The details are given in Figure 3.1(b) and table.3.2.
North-east monsoon period
During the northeast monsoon season from October to December 2014, the departure of
rainfall varied from – 30% to 16 % in different districts. The maximum departure in the
deficient type of rainfall from the normal is recorded in Alapuzha district. There are four
districts were received deficient type of rainfall during this season. Normal rainfall is
recorded in ten districts. The details are presented in Figure 3.1(c) and table.3.2.
Winter period
During the months of January to March 2015, the departure of rainfall varied from -45 to
173%. Four districts were recorded maximum from the deficient rainfall in the negative side.
Record time six districts have recorded with excess rainfall .No scanty rainfall was recorded
during the winter season. Four districts were received normal rainfall. The details are
presented in Figure 3.1(d) and table.3.2.
Seasonal rainfall contribution to the total rainfall of the year 2014-15
The seasonal rainfall contributions to the total rainfall in percentages are worked out and are
given in Table 3.3 and shown in Figure 3.2. The pattern shows that the southwest monsoon
season’s contribution is increasing from south to north and whereas during the northeast
monsoon season the rainfall is increasing from north to south. The other two seasons do not
follow any pattern as such.
The rainfall during April and May contributes 7.92 to 22.20 %, south-west monsoon season
from June to September 48.46 to 80.80 %, north-east monsoon season from October to
December 8.67 to 21.82 % and January to March 0.3 to 4.1 % in different districts.

Ground Water Year Book of Kerala (2013-14)
9
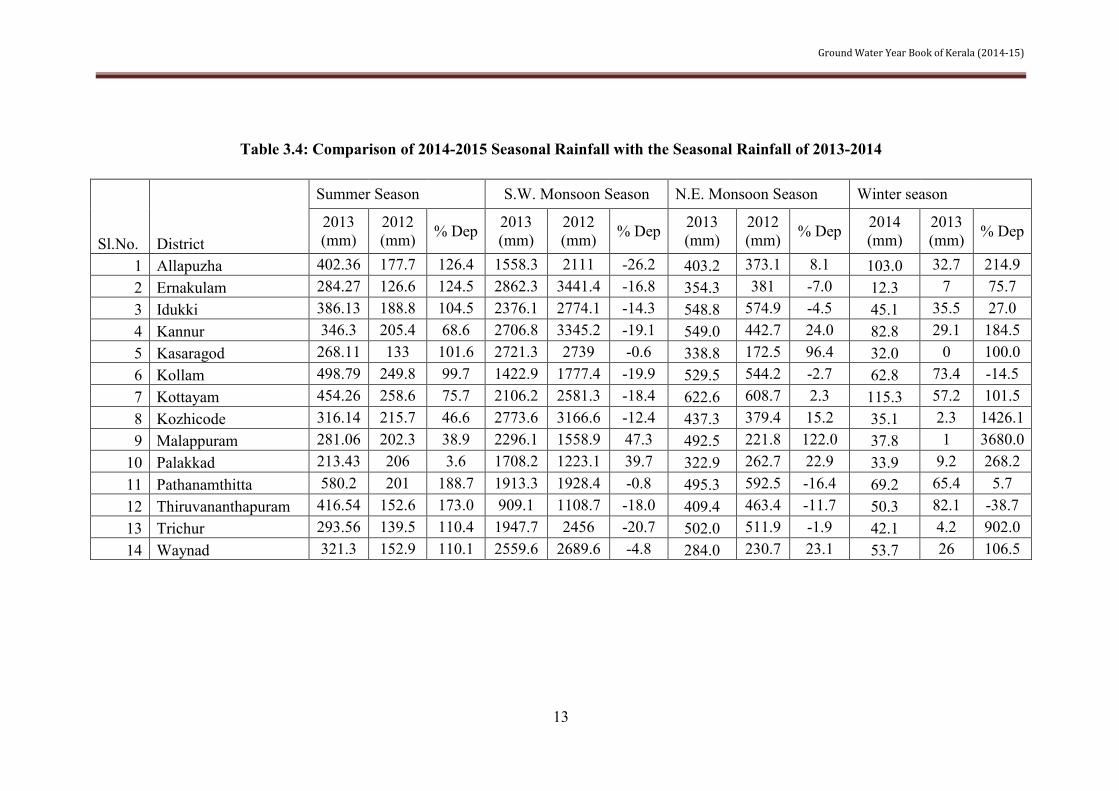
Comparison of 2014-15 rainfall with previous year rainfall
The rainfall in the various seasons of 2014-15 has been compared with the previous year
rainfall for the better assessment of the change in the ground water regime. The details are
given in the following paragraphs.
Summer season
The rainfall of April and May 2014 has been compared with the summer rainfall of 2013 and
the departure is given in Table 3.4 and Figure 3.3. The departure varied from 188.7 to 3.6 %
at different districts. The maximum departure is for Pathanamthitta district and the minimum
observed at Palakkad district.
Southwest monsoon season
The rainfall during June to September of 2014 has been compared with the 2013 June to
September rainfall and the departure is given in Table 3.4 and Figure 3.3. The departure
varied from -0.6 to 47.3 %. All the twelve districts were received less rainfall and remaining
two districts were received excess rainfall in comparison with the previous year. The average
rainfall during the season is 2133 mm which is 70% of the year.
Northeast monsoon season
The rainfall during October to December 2014 has been compared with the 2013 October to
December rand the departure is given in Table 3.4 and Figure 3.3. The departure varied from
– 16.4 to 122 %. Eight districts viz., Alapuzha, Kannur, Kasargod Kottayam, Kozhikode,
Pathanamthitta, Malapuram, and Palakkad were recorded excess rainfall, remaining six
districts were received less rainfall in comparison with previous year.
Winter season
The rainfall during January to March of 2015 has been compared with the rainfall of
January to March 2014 and the departure is given in Table 3.4 and Figure 3.3. The departure
varied from 3680 to -38.7 %. During the winter season, only two district were received
normal rainfall and eleven district were received excess rainfall and only Trivandrum districts
were received deficient rain fall in comparison with the previous year.
Ground Water Year Book of Kerala (2014-15)
10
Table 3.1: Monthly Rainfall Distribution during 2014-2015( Figures in mm)
Sl.No. District 2014 2015
Total April May June July Aug Sep Oct Nov Dec Jan Feb Mar
1 Allapuzha 144.1 258.3 377.2 340.1 647.4 193.6 317.1 86.1 53.9 3.2 19.5 80.2 2520.7 2 Kannur 23.2 261.1 675.5 928.6 928.9 329.3 267.3 87.0 29.4 5.0 5.6 1.7 3542.6 3 Ernakulam 91.1 295.0 580.4 595.3 895.9 304.5 426.1 122.7 98.5 2.4 7.1 35.6 3454.6 4 Idukki 113.8 232.5 492.5 874.3 921.3 418.7 427.5 121.5 54.1 1.4 28.0 53.4 3739.0 5 Kasaragod 11.7 256.4 964.2 341.4 1025.7 390.0 312.0 26.8 24.6 0.9 3.5 27.6 3384.8 6 Kollam 203.1 295.7 299.1 267.9 607.5 248.4 389.0 140.4 49.5 6.2 34.5 22.1 2563.5 7 Kottayam 139.1 315.2 507.2 475.7 832.2 291.1 469.6 153.0 97.1 8.6 24.6 82.1 3395.4 8 Kozhicode 48.1 268.0 532.4 1017.7 894.9 328.6 351.2 86.1 9.2 0.0 4.8 30.3 3571.3 9 Malappuram 49 232.1 576.0 770.4 672.7 277.0 382.1 110.4 42.3 0.0 1.3 36.5 3149.8 10 Palakkad 36.4 177.0 324.1 556.7 598.6 228.8 280.4 42.5 12.1 0.0 3.4 30.5 2290.5 11 Pathanamthitta 287 293.2 441.6 399.5 795.7 276.5 382.5 112.8 77.7 6.4 36.2 26.6 3135.7 12 Thiruvananthapuram 136.6 279.9 149.5 111.4 461.7 186.5 293.2 116.2 90.6 9.6 12.5 28.2 1876.0 13 Trichur 47.6 246.0 483.0 516.6 686.1 262.0 401.7 100.3 21.4 0.9 0.9 40.2 2806.7 14 Waynad 142 179.3 560.8 993.9 701.8 303.1 250.3 33.7 57.7 0.1 0.3 53.3 3276.3

Ground Water Year Book of Kerala (2014-15)
11
Table 3.2:Seasonal Rainfall, Normal Rainfall and the percentage Departure in 2014-2015 in Kerala State
Sl.No. District
Summer Season S.W. Monsoon Season N.E. Monsoon Season Winter season 2014 2014 2014 2015
April +
May Normal % Dep June to
September Normal % Dep October
to December
Normal % Dep January
to March
Normal % Dep
1 Allapuzha 402.4 432.7 -7 1558.3 1745.9 -11 403.2 572.1 -30 103.0 90.5 14 2 Ernakulam 284.3 292.9 -3 2862.3 2669 7 354.3 345.1 3 12.3 12.1 2 3 Idukki 386.1 412.4 -6 2376.1 2065 15 548.8 489.3 12 45.1 63.2 -29 4 Kannur 346.3 383 -10 2706.8 2276.2 19 549.0 564.2 -3 82.8 79.1 5 5 Kasaragod 268.1 264.5 1 2721.3 3007.5 -10 338.8 337.9 0 32.0 11.7 173 6 Kollam 498.8 407 23 1422.9 1332.3 7 529.5 638.6 -17 62.8 113.8 -45 7 Kottayam 454.3 417.9 9 2106.2 1897.3 11 622.6 535.1 16 115.3 80.2 44 8 Kozhicode 316.1 337.5 -6 2773.6 2603.1 7 437.3 422.2 4 35.1 21.3 65 9 Malappuram 281.1 308.1 -9 2296.1 2060.4 11 492.5 448.3 10 37.8 18.3 107 10 Palakkad 213.4 257.4 -17 1708.2 1572.7 9 322.9 428 -25 33.9 31.9 6 11 Pathanamthitta 580.2 479.6 21 1913.3 1715.7 12 495.3 624.2 -21 69.2 138.9 -50 12 Thiruvananthapuram 416.5 333.3 25 909.1 871.3 4 409.4 522.7 -22 50.3 75.9 -34 13 Trichur 293.6 368.3 -20 1947.7 2197.5 -11 502.0 469.4 7 42.1 27.9 51 14 Waynad 321.3 257.9 25 2559.6 2632.1 -3 284.0 332.5 -15 53.7 30.6 75

Ground Water Year Book of Kerala (2014-15)
12
Table 3.3: Seasonal Rainfall Distribution and their Percentage Contribution to Annual Rainfall (2014-2015)
Sl.No. District April + May June to September October to December January to March Annual
rainfall 2014 2014 2014 2015 Rainfall % Rainfall % Rainfall % Rainfall % mm
1 Allapuzha 402.4 15.96 1558.3 61.82 403.2 15.99 103.0 4.1 2520.7 2 Ernakulam 284.3 8.02 2862.3 80.80 354.3 10.00 12.3 0.3 3542.6 3 Idukki 386.1 11.18 2376.1 68.78 548.8 15.89 45.1 1.3 3454.6 4 Kannur 346.3 9.26 2706.8 72.39 549.0 14.68 82.8 2.2 3739.0 5 Kasaragod 268.1 7.92 2721.3 80.40 338.8 10.01 32.0 0.9 3384.8 6 Kollam 498.8 19.46 1422.9 55.51 529.5 20.65 62.8 2.4 2563.5 7 Kottayam 454.3 13.38 2106.2 62.03 622.6 18.34 115.3 3.4 3395.4 8 Kozhicode 316.1 8.85 2773.6 77.66 437.3 12.24 35.1 1.0 3571.3 9 Malappuram 281.1 8.92 2296.1 72.90 492.5 15.63 37.8 1.2 3149.8
10 Palakkad 213.4 9.32 1708.2 74.58 322.9 14.10 33.9 1.5 2290.5 11 Pathanamthitta 580.2 18.50 1913.3 61.02 495.3 15.80 69.2 2.2 3135.7 12 Thiruvananthapuram 416.5 22.20 909.1 48.46 409.4 21.82 50.3 2.7 1876.0 13 Trichur 293.6 10.46 1947.7 69.39 502.0 17.89 42.1 1.5 2806.7 14 Waynad 321.3 9.81 2559.6 78.13 284.0 8.67 53.7 1.6 3276.3
Ground Water Year Book of Kerala (2014-15)
13
Table 3.4: Comparison of 2014-2015 Seasonal Rainfall with the Seasonal Rainfall of 2013-2014
Sl.No. District
Summer Season S.W. Monsoon Season N.E. Monsoon Season Winter season
2013 (mm)
2012 (mm) % Dep 2013
(mm) 2012 (mm) % Dep 2013
(mm) 2012 (mm) % Dep 2014
(mm) 2013 (mm) % Dep
1 Allapuzha 402.36 177.7 126.4 1558.3 2111 -26.2 403.2 373.1 8.1 103.0 32.7 214.9 2 Ernakulam 284.27 126.6 124.5 2862.3 3441.4 -16.8 354.3 381 -7.0 12.3 7 75.7 3 Idukki 386.13 188.8 104.5 2376.1 2774.1 -14.3 548.8 574.9 -4.5 45.1 35.5 27.0 4 Kannur 346.3 205.4 68.6 2706.8 3345.2 -19.1 549.0 442.7 24.0 82.8 29.1 184.5 5 Kasaragod 268.11 133 101.6 2721.3 2739 -0.6 338.8 172.5 96.4 32.0 0 100.0 6 Kollam 498.79 249.8 99.7 1422.9 1777.4 -19.9 529.5 544.2 -2.7 62.8 73.4 -14.5 7 Kottayam 454.26 258.6 75.7 2106.2 2581.3 -18.4 622.6 608.7 2.3 115.3 57.2 101.5 8 Kozhicode 316.14 215.7 46.6 2773.6 3166.6 -12.4 437.3 379.4 15.2 35.1 2.3 1426.1 9 Malappuram 281.06 202.3 38.9 2296.1 1558.9 47.3 492.5 221.8 122.0 37.8 1 3680.0
10 Palakkad 213.43 206 3.6 1708.2 1223.1 39.7 322.9 262.7 22.9 33.9 9.2 268.2 11 Pathanamthitta 580.2 201 188.7 1913.3 1928.4 -0.8 495.3 592.5 -16.4 69.2 65.4 5.7 12 Thiruvananthapuram 416.54 152.6 173.0 909.1 1108.7 -18.0 409.4 463.4 -11.7 50.3 82.1 -38.7 13 Trichur 293.56 139.5 110.4 1947.7 2456 -20.7 502.0 511.9 -1.9 42.1 4.2 902.0 14 Waynad 321.3 152.9 110.1 2559.6 2689.6 -4.8 284.0 230.7 23.1 53.7 26 106.5

Ground Water Year Book of Kerala (2014-15)
14
Figure 3.1(a): Kerala State Rainfall Pattern(April & May2014) Figure 3.1(b): Kerala State Rainfall Pattern (June & September 2014)

Ground Water Year Book of Kerala (2014-15)
15
Figure 3.1(c): Kerala State Rainfall Pattern(Oct & Dec 2013) Figure 3.1(d) Kerala State Rainfall Pattern(Jan & March 2013)

Ground Water Year Book of Kerala (2014-15)
16
Fig. 3.2 Seasonal rainfall contribution to annual rainfall in percentage (2014-15)
0% 20% 40% 60% 80% 100%
AllapuzhaKannur
ErnakulamIdukki
KasaragodKollam
KottayamKozhicode
MalappuramPalakkad
PathanamthittaThiruvanantha…
TrichurWaynad
April to May June to September October to December January to March

Ground Water Year Book of Kerala (2014-15)
17
Fig.3.3 Seasonal rainfall Departure from its Normal during the period 2014-15
-25-20-15-10-505
1015202530
1 2 3 4 5 6 7 8 9 10 11 12 13 14
Dep
art
ure
in
%
IMD Stations (1-14)
Summer season ( April & May-2014)
-15
-10
-5
0
5
10
15
20
25
1 2 3 4 5 6 7 8 9 10 11 12 13 14Dep
art
ure
in
%
IMD Stations (1-14)
SW Monsoon ( June to Sep-2014)
-40
-30
-20
-10
0
10
20
1 2 3 4 5 6 7 8 9 10 11 12 13 14
De
part
ure
in %
IMD Stations (1-14)
NE Monsoon( Oct to Dec-2014)
-100
-50
0
50
100
150
200
1 2 3 4 5 6 7 8 9 10 11 12 13 14
De
part
ure
in %
IMD Stations (1-14)
Winter Season (Jan to March -2015)
1. Alapuzha 2.Ernakulam 3. Idukki 4. Kannur 5. Kasaragod 6. Kollam 7. Kottayam 8. Kozhikode 9. Malapuram 10 Palakkad 11. Pathanamthitta 12.
Thiruvananthapuram 13. Thrichur 14. Wayanad

Ground Water Year Book of Kerala (2014-15)
18
Fig.3.4 Comparison of Seasonal rainfalls of year (2014-15) with previous year (2013-14) rainfall
0.0
20.0
40.0
60.0
80.0
100.0
120.0
140.0
160.0
180.0
200.0
1 2 3 4 5 6 7 8 9 10 11 12 13 14
De
pa
rtu
re in
%
IMD Stations (1-14)
Summer Season (April to May)-2014
-500.0
0.0
500.0
1000.0
1500.0
2000.0
2500.0
3000.0
3500.0
4000.0
1 2 3 4 5 6 7 8 9 10 11 12 13 14
De
pa
rtu
re in
%
IMD Stations (1-14)
Winter Season ( Jan to March) -2015
-40.0-20.0
0.020.040.060.080.0
100.0120.0140.0
1 2 3 4 5 6 7 8 9 10 11 12 13 14
De
pa
rtu
re in
%
IMD Stations (1-14)
NE Monsoon (Oct to Dec) -2014
-500.0
0.0
500.0
1000.0
1500.0
2000.0
2500.0
3000.0
3500.0
4000.0
1 2 3 4 5 6 7 8 9 10 11 12 13 14
De
pa
rtu
re in
%
IMD Stations (1-14)
Winter Season ( Jan to March) -2015
. Alapuzha 2.Ernakulam 3. Idukki 4. Kannur 5. Kasaragod 6. Kollam 7. Kottayam 8. Kozhikode 9. Malapuram 10 Palakkad
11. Pathanamthitta 12. Thiruvananthapuram 13. Thrichur 14. Wayanad

Ground Water Year Book of Kerala (2014-15)
19
IV DEPTH TO WATER LEVEL SCENARIO DURING 2014 - 15
The depth to water level was monitored from 1638 monitoring wells distributed throughout the
State during the months of April, August, November and January. The water level measured
during the month of April is taken as pre-monsoon water level and the data of August and
November are taken as post-monsoon water level depending on the rainfall distribution. The
water level data of GWMWs during 2014-15 is compiled in Annexure I.
The depth to water level mostly depends on the hydrogeological conditions of the area as well as
topography, rainfall pattern etc. In coastal plains the depth to water level is generally restricted to
6 mbgl. In midland areas, where the undulating topography is seen, the depth to water level
generally varies from near ground level to 25 mbgl. The variation is mostly due to topographical
variations, thickness of lateritic overburden etc. In areas where laterites are underlain by
sedimentary aquifers of Tertiary age, the water level goes very deep, even to the extent of 55
mbgl. In highlands the depth to water level is in the range of few cm to 10 mbgl depending on
the topography and thickness of overburden (weathered zone).
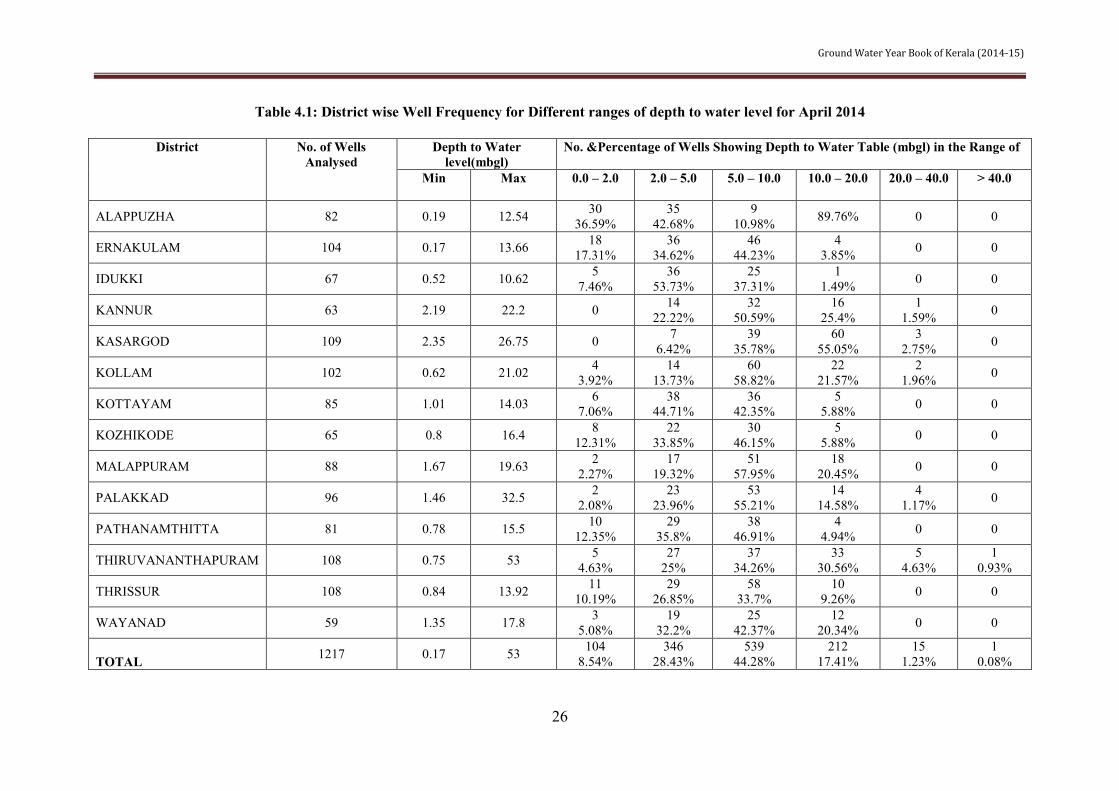
Depth to water level during April 2014
During the month of April 2014 the depth to water level in Kerala State in dug wells varied
widely from 0.17 to 53.0 mbgl. Shallow water level in the range of 0 – 2 mbgl is seen in
Alappuzha district, coastal tracts of Ernakulam, in the valley portion found in the eastern part of
Idukki district and also as small patches in remaining districts. The areas falling in the midland
region generally show water level in the range of 2 – 10 mbgl. Water level of more than 20 m bgl
is seen as patches in Thiruvananthapuram,Kollam,Palakkad, Malappuram, Kannur and Kasargod
districts. The district-wise well frequency for different ranges of depth to water level during April
2014 has been prepared and is given in Table 4.1. The analysis of the data reveals that 81.26 % of
the monitoring wells (GWMWs) shows water level within the range of 0.1 to10 mbgl. Deeper
water level (> 20 mbgl) is seen in Thiruvananthapuram (Poovar, Pulluvila and Kanjiramkulam),
Kollam, Malappuram and Kasargod district as isolated pockets which can be attributed to the
local hydrogeological conditions mainly due to thick lateritic overburden and moreover the wells
are located in an elevated area. The map showing the depth to water level in Kerala State during
April 2014 is given in Figure 4.1. In four districts viz Kollam, Malappuram, Palakkad and
Kannur, more than 50% of monitoring wells show water level greater than 5 m bgl.Deepest water
level is encountered in Thiruvananthapuram district..

Ground Water Year Book of Kerala (2014-15)
20
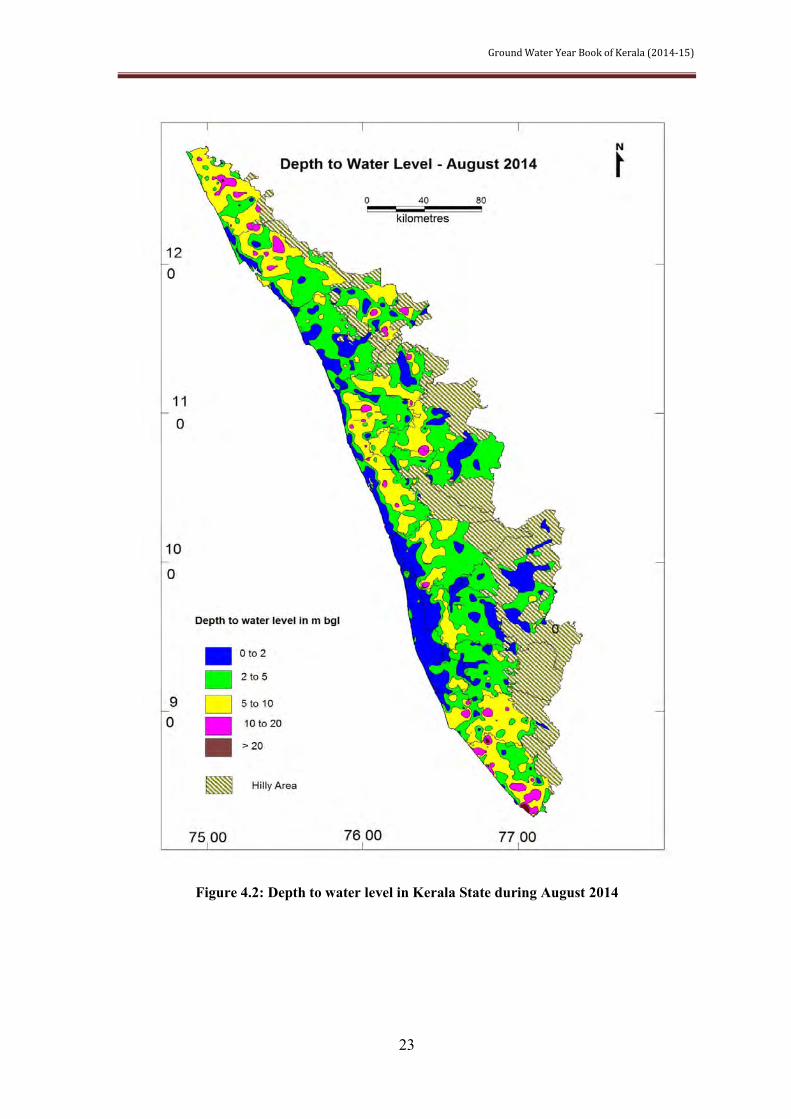
Depth to water level during August 2014
During the month of August 2014 the depth to water level in Kerala State in dug wells
varied widely from 0.05 to 55.0 mbgl. Shallow water level in the range of 0 – 2 mbgl is
seen in Alappuzha district, coastal tracts of Ernakulam, in the valley portion found in the
eastern part of Idukki and Kottayam districts and also as small patches in remaining
districts. The areas falling in the midland region generally show water level in the range
of 2 – 10 mbgl. Water level of more than 20 m bgl is seen as patches in
Thiruvananthapuram, and Kasargod districts. The district-wise well frequency for
different ranges of depth to water level during August 2014 has been prepared and is
given in Table 4.2. The analysis of the data reveals that 93.36 % of the monitoring wells
(GWMWs) shows water level within the range of 0.1 to10 mbgl. Deeper water level (>
20 mbgl) is seen in Thiruvananthapuram (Poovar, Pulluvila and Kanjiramkulam), and
Kasargod district as isolated pockets which can be attributed to the local hydrogeological
conditions mainly due to thick lateritic overburden and moreover the wells are located in
an elevated area. The map showing the depth to water level in Kerala State during August
2014 is given in Figure 4.2. Only Kasargod district it is observed that more than 50% of
monitoring wells show water level greater than 5 m bgl.Deepest water level is
encountered in Thiruvananthapuram district.
Depth to water level during November 2014
During the month of November 2014 the depth to water level in the State varied
widely from 0.05 to 56.5 mbgl in dug wells. Shallow water level in the range of 0 – 2
mbgl is seen in Alappuzha district, coastal tracts of Ernakulam, Thrissur,Kozhikkod and
Kannur districts and in the valley portion located in the eastern part of Idukki and
Kottayam districts and also as small patches in remaining districts. The areas falling in
the midland region generally show water level in the range of 2 – 10 mbgl. Water level of
more than 20 m bgl is seen as isolated patches in Thiruvananthapuram, and Kasargod
districts. The district-wise well frequency for different ranges of depth to water level
during November 2014 has been prepared and is given in Table 4.3. The analysis of the
data reveals that 90.84 % of the monitoring wells (GWMWs) have water levels within the
range of 0.1 to10 mbgl. Deeper water level (> 20 mbgl) is seen in Thiruvananthapuram
(Poovar, Pulluvila and Kanjiramkulam), and Kasargod district as isolated pockets which
can be attributed to the local hydrogeological conditions such as thick lateritic
overburden and the wells situated at elevated areas. The map showing the depth to water

Ground Water Year Book of Kerala (2014-15)
21
level in Kerala State during November 2014 is given in Figure 4.3. Only in Kasargod
district more than 50% of monitoring wells show water level greater than 5 m
bgl.Deepest water level is recorded in Thiruvananthapuram district.
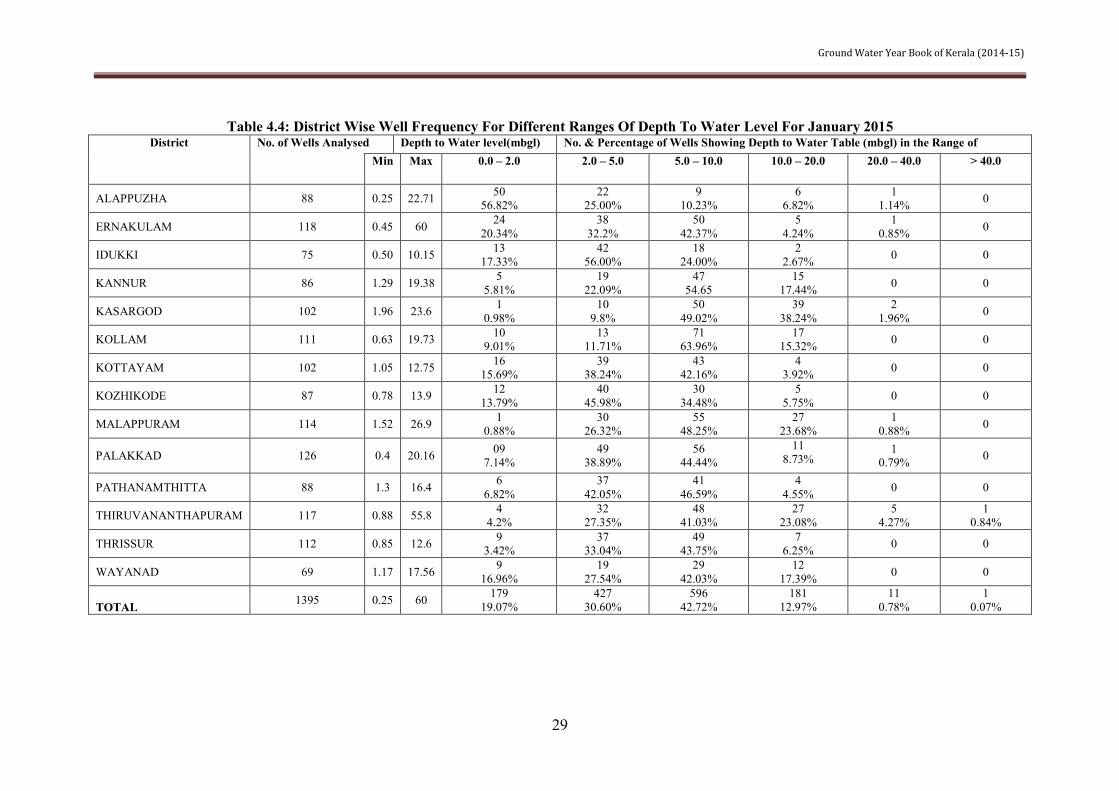
Depth to water level during January 2015
During the month of January 2015 the depth to water level in the State varied
widely from 0.25 to 60 mbgl in dug wells. Shallow water level in the range of 0 – 2 mbgl
is seen in Alappuzha district, coastal tracts of Ernakulam, Thrissur,Kozhikkod and
Kannur districts and in the valley portion located in the eastern part of Idukki and
Kottayam districts and also as small patches in remaining districts. The areas falling in
the midland region generally show water level in the range of 2 – 10 mbgl. Water level of
more than 20 m bgl is seen as isolated patches in Thiruvananthapuram, and Kasargod
districts. The district-wise well frequency for different ranges of depth to water level
during January 2015 has been prepared and is given in Table 4.4. The analysis of the
data reveals that 86.16 % of the monitoring wells (GWMWs) have water levels within the
range of 0.1 to10 mbgl. Deeper water level (> 20 mbgl) is seen in Thiruvananthapuram
(Poovar, Pulluvila and Kanjiramkulam), and Kasargod district as isolated pockets which
can be attributed to the local hydrogeological conditions such as thick lateritic
overburden and the wells situated at elevated areas. The map showing the depth to water
level in Kerala State during January 2015 is given in Figure 4.4. Only in Kollam district
more than 50% of monitoring wells show water level greater than 5 m bgl and in
Kasargod district it is around 50%. Deepest water level is recorded in
Thiruvananthapuram district.

Ground Water Year Book of Kerala (2014-15)
22
Figure 4.1: Depth to water level in Kerala State during April 2014
Ground Water Year Book of Kerala (2014-15)
23
Figure 4.2: Depth to water level in Kerala State during August 2014

Ground Water Year Book of Kerala (2014-15)
24
Figure 4.3: Depth to water level in Kerala State during November 2014

Ground Water Year Book of Kerala (2014-15)
25
Figure 4.4: Depth to water level in Kerala State during January2015
Ground Water Year Book of Kerala (2014-15)
26
Table 4.1: District wise Well Frequency for Different ranges of depth to water level for April 2014
District
No. of Wells Analysed
Depth to Water level(mbgl)
No. &Percentage of Wells Showing Depth to Water Table (mbgl) in the Range of
Min Max 0.0 – 2.0 2.0 – 5.0 5.0 – 10.0 10.0 – 20.0 20.0 – 40.0 > 40.0
ALAPPUZHA 82 0.19 12.54 30 36.59%
35 42.68%
9 10.98% 89.76% 0 0
ERNAKULAM 104 0.17 13.66 18 17.31%
36 34.62%
46 44.23%
4 3.85% 0 0
IDUKKI 67 0.52 10.62 5 7.46%
36 53.73%
25 37.31%
1 1.49% 0 0
KANNUR 63 2.19 22.2 0 14 22.22%
32 50.59%
16 25.4%
1 1.59% 0
KASARGOD 109 2.35 26.75 0 7 6.42%
39 35.78%
60 55.05%
3 2.75% 0
KOLLAM 102 0.62 21.02 4 3.92%
14 13.73%
60 58.82%
22 21.57%
2 1.96% 0
KOTTAYAM 85 1.01 14.03 6 7.06%
38 44.71%
36 42.35%
5 5.88% 0 0
KOZHIKODE 65 0.8 16.4 8 12.31%
22 33.85%
30 46.15%
5 5.88% 0 0
MALAPPURAM 88 1.67 19.63 2 2.27%
17 19.32%
51 57.95%
18 20.45% 0 0
PALAKKAD 96 1.46 32.5 2 2.08%
23 23.96%
53 55.21%
14 14.58%
4 1.17% 0
PATHANAMTHITTA 81 0.78 15.5 10 12.35%
29 35.8%
38 46.91%
4 4.94% 0 0
THIRUVANANTHAPURAM 108 0.75 53 5 4.63%
27 25%
37 34.26%
33 30.56%
5 4.63%
1 0.93%
THRISSUR 108 0.84 13.92 11 10.19%
29 26.85%
58 33.7%
10 9.26% 0 0
WAYANAD 59 1.35 17.8 3 5.08%
19 32.2%
25 42.37%
12 20.34% 0 0
TOTAL 1217 0.17 53 104
8.54% 346
28.43% 539
44.28% 212
17.41% 15
1.23% 1
0.08%

Ground Water Year Book of Kerala (2014-15)
27
Table 4.2 : District Wise Well Frequency For Different Ranges Of Depth To Water Level For August 2014
District
No. of Wells Analysed
Depth to Water level(mbgl)
No. &Percentage of Wells Showing Depth to Water Table (mbgl) in the Range of
Min Max 0.0 – 2.0 2.0 – 5.0 5.0 – 10.0 10.0 – 20.0 20.0 – 40.0 > 40.0
ALAPPUZHA 77 0.05 10.15 54 70.13%
14 18.18%
8 10.39%
1 1.3% 0 0
ERNAKULAM 108 0.15 13.3 39 36.11%
40 37.04%
28 25.93%
1 0.93% 0 0
IDUKKI 65 0.37 7.63 26 40.00%
33 50.77%
6 9.23% 0 0 0
KANNUR 87 0.34 19.99 13 14.94%
32 36.78%
33 37.93%
09 10.34% 0 0
KASARGOD 118 0.46 21.94 10 8.47%0
24 20.34%
65 55.08%
18 15.25%
1 0.85% 0
KOLLAM 104 0.25 19.15 17 16.35%
37 35.58%
42 40.38%
08 7.697% 0 0
KOTTAYAM 89 0.16 10.3 32 35.96%
35 39.33%
21 23.6%
1 1.12% 0 0
KOZHIKODE 76 0.17 8.7 35 46.05%
28 36.84%
13 17.11% 0 0 0
MALAPPURAM 103 0.2 19.2 29 28.16%
31 31.1%
34 33.01%
9 8.74% 0 0
PALAKKAD 114 0.44 28.9 26 22.81%
54 47.37%
28 24.56 %
5 4.39%
1 0.85% 0
PATHANAMTHITTA 77 0.2 12.9 26 33.77%
43 55.84%
7 9.09%
1 1.3% 0 0
THIRUVANANTHAPURAM 112 0.05 55 9 8.04%
43 38.39%
38 33.93%
18 16.07%
3 2.68%
1 0.89%
THRISSUR 110 0.15 11.35 30 27.27%
40 36.36%
37 33.64%
3 2.73% 0 0
WAYANAD 55 0.45 15.7 20 36.36%
13 23.64%
16 29.09%
06 10.91% 0 0
TOTAL 1295 0.05 55 366
28.26% 467
36.06% 376
29.03% 80
6.17% 5
0.38% 1
0.08%

Ground Water Year Book of Kerala (2014-15)
28
Table 4.3: District Wise Well Frequency For Different Ranges Of Depth To Water Level For November 2014
District
No. of Wells Analysed Depth to Water level(mbgl) No. &Percentage of Wells Showing Depth to Water Table (mbgl) in the Range of Min Max 0.0 – 2.0 2.0 – 5.0 5.0 – 10.0 10.0 – 20.0 20.0 – 40.0 > 40.0
ALAPPUZHA 71 0.01 11.15 43 60.56%
17 23.94%
8 11.27%
3 4.23% 0 0
ERNAKULAM 116 0.05 15.2 42 36.21%
36 31.03%
33 28.45%
5 4.31% 0 0
IDUKKI 63 0.4 8.1 15 23.81%
37 58.73%
11 17.46% 0 0 0
KANNUR 81 0.59 19.25 9 11.11%
24 29.63%
36 44.44%
12 14.81% 0 0
KASARGOD 120 1.45 39.3 4 3.33%
17 14.17%
68 56.67%
28 15.25%
3 2.5% 0
KOLLAM 98 0.52 18.88 14 14.29%
23 23.47%
55 56.12%
6 6.12% 0 0
KOTTAYAM 86 0.3 11.35 18 20.93%
39 45.35%
27 31.4%
2 2.33% 0 0
KOZHIKODE 86 0.34 13.42 25 29.07%
33 38.37%
25 29.07%
3 3.49% 0 0
MALAPPURAM 104 0.4 16.11 17 16.35%
28 26.92%
48 46.15%
11 10.58% 0 0
PALAKKAD 122 0.54 18.2 17 13.93%
61 50.00%
38 31.15%
6 4.92% 0 0
PATHANAMTHITTA 81 0.7 14.8 13 16.05%
28 34.57%
38 46.91%
2 2.47% 0 0
THIRUVANANTHAPURAM 119 0.85 56.5 5 4.2%
40 33.61%
47 39.5%
22 18.49%
4 3.36% 1 0.84%
THRISSUR 111 0.54 11.62 22 19.82%
35 31.53%
50 45.05%
4 3.6% 0 0
WAYANAD 63 0.94 16.82 8 12.7%
21 33.33%
25 39.68%
9 14.29% 0 0
TOTAL 1321 0.05 56.5 252 19.07%
439 33.23%
509 38.53%
113 8.55%
7 0.52%
1 0.07%
Ground Water Year Book of Kerala (2014-15)
29
Table 4.4: District Wise Well Frequency For Different Ranges Of Depth To Water Level For January 2015 District
No. of Wells Analysed Depth to Water level(mbgl) No. & Percentage of Wells Showing Depth to Water Table (mbgl) in the Range of Min Max 0.0 – 2.0 2.0 – 5.0 5.0 – 10.0 10.0 – 20.0 20.0 – 40.0 > 40.0
ALAPPUZHA 88 0.25 22.71 50 56.82%
22 25.00%
9 10.23%
6 6.82%
1 1.14% 0
ERNAKULAM 118 0.45 60 24 20.34%
38 32.2%
50 42.37%
5 4.24%
1 0.85% 0
IDUKKI 75 0.50 10.15 13 17.33%
42 56.00%
18 24.00%
2 2.67% 0 0
KANNUR 86 1.29 19.38 5 5.81%
19 22.09%
47 54.65
15 17.44% 0 0
KASARGOD 102 1.96 23.6 1 0.98%
10 9.8%
50 49.02%
39 38.24%
2 1.96% 0
KOLLAM 111 0.63 19.73 10 9.01%
13 11.71%
71 63.96%
17 15.32% 0 0
KOTTAYAM 102 1.05 12.75 16 15.69%
39 38.24%
43 42.16%
4 3.92% 0 0
KOZHIKODE 87 0.78 13.9 12 13.79%
40 45.98%
30 34.48%
5 5.75% 0 0
MALAPPURAM 114 1.52 26.9 1 0.88%
30 26.32%
55 48.25%
27 23.68%
1 0.88% 0
PALAKKAD 126 0.4 20.16 09 7.14%
49 38.89%
56 44.44%
11 8.73%
1 0.79% 0
PATHANAMTHITTA 88 1.3 16.4 6 6.82%
37 42.05%
41 46.59%
4 4.55% 0 0
THIRUVANANTHAPURAM 117 0.88 55.8 4 4.2%
32 27.35%
48 41.03%
27 23.08%
5 4.27%
1 0.84%
THRISSUR 112 0.85 12.6 9 3.42%
37 33.04%
49 43.75%
7 6.25% 0 0
WAYANAD 69 1.17 17.56 9 16.96%
19 27.54%
29 42.03%
12 17.39% 0 0
TOTAL 1395 0.25 60 179
19.07% 427
30.60% 596
42.72% 181
12.97% 11
0.78% 1
0.07%

Ground Water Year Book of Kerala (2014-15)
30
V. WATER LEVEL FLUCTUATION IN KERALA DURING 2014-2015
In Kerala the premonsoon water level measurements are carried out during April and
postmonsoon measurements during August and November. The fourth water level measurement
is during January. The estimation of water level fluctuation between premonsoon and
postmonsoon is very important in the estimation of natural recharge to groundwater regime,
which gives the dynamic resource of available groundwater.
The water level fluctuation between and pre and postmonsoon periods in coastal alluvium,
riverine alluvium and valley fills are mostly restricted to 4 meters. In laterites water level
fluctuation is generally in the range of a few centimetres to 9 metres, but mostly restricted to 4 m.
In crystalline areas the water level fluctuation is in the range of a few cm to 6m.
Fluctuation between April 2014 and August 2014
Comparison of August 2014 water level with that of April 2014 indicates rise in water level in the
range of 0 – 8 .00 metres in most parts of the State whereas fall in water level also is noticed in
certain small isolated pockets mainly in Thiruvananthapuram, Kollam,Kottayam,Pathanamthitta,
Ernakulam , Kozhikkode and hilly tracts of the western boarder of Kannur and Wayanad
districts. In the southern districts of Kerala the rise in water level is in the range of 0 – 2 m as
seen in major parts of the area, whereas in the northern districts of Kerala rise in water level up to
8 m is seen. Rise in water level is represented by 94.55 % of total monitoring wells.
The map of Kerala showing fluctuation between August 2014 and April 2014 is given in Figure
5.1. District-wise well frequency for different ranges of water level fluctuation (August 2014 and
April 2014 ) is given in Table 5.1.
Fluctuation between April 2014 and November 2014
Comparison of November 2014 water level with that of April 2014 indicates rise in water level
in the range of 0 – 8 .00 metres in most parts of the State whereas fall in water level also is
noticed in certain small isolated pockets mainly in Thiruvananthapuram,
Kottayam,Pathanamthitta, Ernakulam , Kozhikkode and Wayanad districts. In the southern
and northern districts of Kerala state, the rise in water level is in the range of 2-8 m, whereas in
the central districts of Kerala rise in water level in the range of 0-2 is predominantly seen. Also
the rise in water level in Malappuram, Thrissur and Palakkad districts is in the range of 2-8
m.Rise in water level is represented by 88.79 % of total monitoring wells.
The map of Kerala showing fluctuation between November 2014 and April 2014 is given in
Figure 5.2. District-wise well frequency for different ranges of water level fluctuation
(November 2014 and April 2014) is given in Table 5.2.

Ground Water Year Book of Kerala (2014-15)
31
Fluctuation between April 2014 and January 2015
Comparison of January 2015 water level with that of April 2014 indicates rise in water level in
the range of 0 – 4 .00 metres in most parts of the State whereas fall in water level is noticed in
certain small isolated pockets mainly in Thiruvananthapuram, Kollam ,Kottayam,Pathanamthitta,
Ernakulam , Kozhikkode and Kasargod districts. In general the rise in water level is in the range
of 0-2 m theought out all districts except Pathanamthitta district where fall is predominant. Rise
in water level in the range of 4 m and above is noticed in isolated pockets in Palakkad, Thrissur
and Thiruvananthapuram districts. Rise in water level is represented by 75.13 % of total
monitoring wells.
The map of Kerala showing fluctuation between January 2015 and April 2014 is given in
Figure 5.2. District-wise well frequency for different ranges of water level fluctuation (January
2015 and April 2014 ) is given in Table 5.2.

Ground Water Year Book of Kerala (2014-15)
32
Figure 5.1: Water Level Fluctuation between April 2014 and August 2014

Ground Water Year Book of Kerala (2014-15)
33
Figure 5.2: Water Level Fluctuation between April 2014 and November 2014

Ground Water Year Book of Kerala (2014-15)
34
Figure 5.3: Water Level Fluctuation between January and 2015April 2014
Ground Water Year Book of Kerala (2014-15)
35
Table 5.1: District wise – Fluctuation and Frequency Distribution for Different Ranges from April 2014 – August 2014 District No. of
Wells Range of Fluctuation (m) No. &Percentage of Wells /Percentage Showing Fluctuation Total No. of Wells
Rise Fall Rise Fall Rise Fall Min Max Min Max 0 to 2 2 to 4 >4 0 to 2 2 to 4 >4
ALAPPUZHA 70 0.07 6.75 0.03 1.96 45 64.29%
15 21.43%
5 7.14%
5 7.14%
0 65 5
ERNAKULAM 93 0.02 6.86 0.1 3.15 51
54.84% 26
27.96% 6
6.45% 6
6.45% 3
3.23% 0 83 9
IDUKKI 63 0.07 5.84 0.07 0.07 35 55.56%
23 36.51%
4 6.3%
1 1.59%
0 0 62 1
KANNUR 61 0.46 7.41 0.05 2.8 18 29.51%
26 42.62%
13 21.31%
2 3.28%
2 3.28%
0 57 4
KASARGOD 106 0.38 15.41 0.28 7.81 24 22.64%
27 25.47%
53 50.00%
1 0.94%
0 1 0.94%
104 2
KOLLAM 99 0.11 15.99 0.06 3.77 35 35.35%
37 37.37%
20 20.2%
6 6.06%
1 1.01%
0
92 7
KOTTAYAM 83 0.1 8.17 0.07 1.57 44 53.01%
30 36.14%
6 7.23%
3 3.61%
0
0
80 3
KOZHIKODE 63 0.25 7.7 1.25 3.9 20 31.75%
25 39.68%
15 23.81%
1 1.59%
1 1.59%
0 60 2
MALAPPURAM 91 0.01 14.94 17 18.68%
46 50.55%
28 30.77%
0 0 0 91 0
PALAKKAD 95 0.3 17.06 0.04 2.69 24 25.26%
39 41.05%
28 12.5%
2 2.11% 2 2.11%
0 91 4
PATHANAMTHITTA 72 0.08 7 0.02 0.59 27 37.5%
30 41.67%
9 12.5%
6 8.33%
0 0 66 6
THIRUVANANTHAPURAM 102 0.1 6.59 0.08 4.04 49 48.04%
31 30.39%
10 9.8%
10 9.8%
1 0.98%
90 11
THRISSUR 103 0.05 6.39 0.35 1.11 37 35.92%
48 46.6%
15 14.5%
3 2.91%
0 0 100 3
WAYANAD 55 0.2 13.3 1.35 2.69 24 43.64%
16 29.09%
12 21.82%
1 1.82%
1 1.82%
0 52 2
TOTAL
1156 0.46 5.84
0.00 7.81 450
38.92% 419
36.24% 224
19.37% 47
4.06% 10
0.86% 2
0.17% 1093
94.55 % 59
5.1%

Ground Water Year Book of Kerala (2014-15)
36
Table 5.2: District wise – Fluctuation and Frequency Distribution for Different Ranges from April 2014 – November 2014 District No. of
Wells Range of Fluctuation (m) No. &Percentage of Wells /Percentage Showing Fluctuation Total No. of Wells
Rise Fall Rise Fall Rise Fall Min Max Min Max 0 to 2 2 to 4 >4 0 to 2 2 to 4 >4
ALAPPUZHA 64 0.01 2.92 0.06 4.21 53 82.81%
5 7.81%
0 5 7.81%
0 1 1.56%
58 6
ERNAKULAM 96 0.1 7.45 0.05 3.25 61
63.54% 15
15.63% 7
7.29% 11
11.46% 2 2.08%
0 83 13
IDUKKI 60 0.12 4.02 0.02 0.87 47 78.33%
8 13.33%
1 1.67%
4 6.67%
0 0 56 4
KANNUR 57 0.1 6.35 0.04 3.25 31 54.38%
14 24.56%
7 12.28%
3 5.26%
2 3.51%
0 52 5
KASARGOD 106 0.05 11.9 0.4 7.7 41 38.68%
41 38.68%
22 20.75%
1 0.94%
0 1 0.94%
104 2
KOLLAM 93 0.1 12.66 0.04 3.78 42 45.16%
32 34.41%
12 12.9%
6 6.45%
1 1.08%
0
86 7
KOTTAYAM 82 0.01 4.97 0.03 2.27 62
75.61% 10
12.2% 4
4.88% 4
4.88% 2
2.24%
0 76 6
KOZHIKODE 64 0.18 5.99 0.04 5.37 31 48.44%
21 32.81%
1 1.56%
7 10.94%
3 4.69%
1 1.56%
53 11
MALAPPURAM 84 0.11 16.61 0.09 1.7 41
48.81% 35
41.67% 3
3.57% 5
5.95% 0 0 79 5
PALAKKAD 95 0.08 15.16 0.80 2.77 36 37.89%
40 42.11%
16 16.84%
1 1.05%
2 2.11%
0 92 3
PATHANAMTHITTA 76 0.03 4.24 0.03 6.96 40 52.63%
2 2.63%
2 2.63%
27 35.53%
4 5.26%
1 1.32%
44 32
THIRUVANANTHAPURAM 107 0.01 10.77 0.03 4.04 44 41.12%
33 30.84%
13 12.15%
14 13.08%
2 1.87%
1 0.93%
90 17
THRISSUR 102 0.16 6.04 0.09 1.94 56 54.9%
29 28.43%
7 6.8%
10 9.81%
0 0 92 10
WAYANAD 56 0.08 9.45 0.01 1.87 35 62.50%
12 21.43%
2 3.57%
7 12.5%
0 0 49 7
TOTAL 1142 0.18 2.92
0.01 7.7 620 54.29%
297 26%
97 8.49%
105 9.19.%
18 1.57%
5 0.43%
1014 88.79 %
128 11.2%
Ground Water Year Book of Kerala (2014-15)
37
Table 5.3: District wise – Fluctuation and Frequency Distribution for Different Ranges from April 2014 – January 2015
District No. of
Wells Range of Fluctuation (m) No. &Percentage of Wells /Percentage Showing Fluctuation Total No. of Wells
Rise Fall Rise Fall Rise Fall Min Max Min Max 0 to 2 2 to 4 >4 0 to 2 2 to 4 >4
ALAPPUZHA 77 0.02 2.1 0.03 4.21 53 68.83%
2 2.6%
0 21 27.27%
0 1 1.3%
55 22
ERNAKULAM 94 0.05 3.82 0.08 24.8 51
54.26% 9
9.57% 0 30
31.91% 1 1.06%
2 2.1%
60 33
IDUKKI 62 0.02 2.92 0.01 2.13 49 79.03%
5 8.06%
0 7 11.29%
1 1.61%
0 54 8
KANNUR 60 0.01 5.39 0.03 4.28 37 61.67%
6 10.00%
3 5.00%
11 18.33%
2 3.33%
1 1.61%
46 14
KASARGOD 91 0.05 10.96 0.04 9.16 46 50.55%
25 27.47%
7 7.69%
11 12.09%
1 1.1%
1 1.1%
78 13
KOLLAM 100 0.01 10.44 0.03 4.88 56 56.00%
14 14.00%
4 4.00%
21 21.00%
3 3.00%
1 1.00%
74 25
KOTTAYAM 82 0.01 3.47 0.03 3.49 54
65.85% 6
7.32% 0 18
21.95% 4
4.88%
0 60 22
KOZHIKODE 61 0.02 3.45 0.1 6.17 43 70.49%
4 14.00%
0 8 13.11%
5 8.2%
1 1.64%
47 14
MALAPPURAM 90 0.03 9.7 0.04 4.44 51 56.57%
7 7.78%
2 2.22%
27 30.00%
1 1.11%
1 1.11%
60 29
PALAKKAD 93 0.03 10.82 0.02 0.93 56 60.22%
24 25.81%
6 6.43%
7 7.53%
0 0 86 7
PATHANAMTHITTA 79 0.03 2.59 0.01 3.25 28 35.44%
2 2.53%
0 44 55.70%
4 5.06%
0 30 48
THIRUVANANTHAPURAM 102 0.07 10.48 0.01 2.81 61 59.8%
14 13.73%
2 1.96%
21 20.59%
4 3.92%
0 77 25
THRISSUR 99 0.02 4.92 0.01 1.03 75 75.76%
10 10.10%
3 3.03%
10 10.1%
0 0 88 10
WAYANAD 56 0.06 7.31 0.03 2.45 39 69.64%
5 8.93%
2 3.57%
7 12.5%
3 5.36%
0 46 10
TOTAL 1146 0.07 2.1 0.01 24.8 699
60.99% 133
11.60% 29
2.53% 243
21.20.% 29
2.53% 8
0.69% 861 75.13
% 280
24.43%
Ground Water Year Book of Kerala (2014-15)
38
VI. COMPARISON OF 2014-15 WATER LEVELS WITH THE
DECADAL MEAN (2004-2013)
Water levels during the year 2014-15 in comparison with the decadal mean (2004-2013) value of
the respective measurements is discussed in this chapter. The analysis brings out the deviations in
water level from the general behaviour of water level of the past decade. In general, the change in
water level is confined to the range of +2 to –2 m.
Fluctuation between Mean April (2004-2013) and April 2014
The change in water level over the last ten years period is brought out by the comparison of water
level with the mean value of April measurements of the period 2004-2013.This analysis indicate
that the change in water level is mostly restricted to +2 (rise) to -2 (fall) m as recorded by 89.54
% of GWMW. However fall in waterlevel is predominant in many parts of the state as
represented by 47.36 %. of monitoring wells. The frequency of wells showing rise and fall in
different ranges (0-2m,2-4m, 4m ) when compared with decade mean water level is given in
Table 6.1. Figure 6.1 shows the fluctuation in Kerala state for April 2014 with respect to
Decadal mean (2004-2013).
Fluctuation between Mean August (2004-2013) and August 2014
The change in water level over the last ten years period is brought out by the comparison of water
level with the mean value of August measurements of the period 2004-2013.This analysis
indicate that the change in water level is mostly restricted to +2 (rise) to -2 (fall) m as recorded by
89.88 % of GWMW. However fall in waterlevel is predominant in many parts of the state as
represented by 27 % of monitoring wells.The frequency of wells showing rise and fall in different
ranges (0-2m,2-4m, 4m ) when compared with decade mean water level is given in Table 6.2.
Figure 6.2 shows the water level fluctuation in the state for August 2014 with respect to
Decadal mean (2004-2013).
Fluctuation between Mean November (2004-2013) and November 2014
The change in water level over the last ten years period is brought out by the comparison of water
level with the mean value of November measurements of the period 2004-2013.This analysis
indicate that the change in water level is mostly restricted to +2 (rise) to -2 (fall) m as recorded by
93.47 % of GWMW. However fall in waterlevel is predominant mainly in central and northern
parts of the state as represented by 57.48 % of monitoring wells. Rise in water level is confined
to Trivandrum and Kolam and isolated patches in Kannur and Kasargod districts.The frequency
of wells showing rise and fall in different ranges (0-2m,2-4m, 4m ) when compared with decade
Ground Water Year Book of Kerala (2014-15)
39
mean water level is given in Table 6.3. Figure 6.3 shows the water level fluctuation in the state
for November 2014 with respect to Decadal mean (2004-2013).
Fluctuation between Mean January (2005-2014) and January 2015
The change in water level over the last ten years period is brought out by the comparison
of water level with the mean value of January measurements of the period 2005-2014.This
analysis indicate that the change in water level is mostly restricted to +2 (rise) to -2 (fall) m as
recorded by 92.22 % of GWMW. However fall in waterlevel is predominant mainly in Kollam,
Palakkad and Malappuram districts as represented by 46.86 % of monitoring wells. Rise in water
level is predominant in Kottayam,Ernakulam,Thrissur,Kozhikkod and Wayanad and Kannur
districts and southern side of Iduki and Trivandrum districts.The frequency of wells showing rise
and fall in different ranges (0-2m,2-4m, 4m ) when compared with decade mean water level is
given in Table 6.4. Figure 6.4 shows the water level fluctuation in the state for January 2015
with respect to Decadal mean (2005-2014).

Ground Water Year Book of Kerala (2014-15)
40
Figure 6.1: Water Level Fluctuation April 2014 with respect to Decadal mean

Ground Water Year Book of Kerala (2014-15)
41
Figure 6.2: Water Level Fluctuation August 2014 with respect to Decadal mean

Ground Water Year Book of Kerala (2014-15)
42
Figure 6.3: Water Level Fluctuation November 2014 with respect to Decadal mean
Ground Water Year Book of Kerala (2014-15)
43
Figure 6.4: Water Level Fluctuation January 2015 with respect to Decadal mean

Ground Water Year Book of Kerala (2014-15)
44
Table 6.1: District wise Well Frequency for Different Ranges of Water Level Fluctuation (April 2014 – Decadal mean (April 2004-2013) District No. of
Wells Range of Fluctuation (m) No. &Percentage of Wells /Percentage Showing Fluctuation Total No. of Wells
Rise Fall Rise Fall Rise Fall Min Max Min Max 0 to 2 2 to 4 >4 0 to 2 2 to 4 >4
ALAPPUZHA 68 0.02 1.58 0.03 3.21 40 58.82%
0 0 25 36.76%
2 2.94%
40 27
ERNAKULAM 84 0.01 2.9 0.01 2.46 40
47.62% 1
1.19% 0 39
46.43% 4 4.76%
0 41 43
IDUKKI 50 0.05 6.26 0.03 2.22 25 50.00%
1 2.00%
1 2.00%
21 42.00%
1 2.00%
0 27 22
KANNUR 52 0.05 5.26 0.06 2.65 18 34.62%
3 5.77%
2 3.85%
27 51.92%
2 3.85%
0 23 29
KASARGOD 58 0.03 5.71 0.06 8.35 4 6.90%
1 1.72%
1 1.72%
39 67.24%
9 15.52%
4 6.9%
6 52
KOLLAM 62 0.01 1.27 0.04 5.8 24 38.71%
2 3.23%
4 6.45%
26 41.94%
3 4.84%
3 4.84%
30 32
KOTTAYAM 67 0.05 1.48 0.02 1.83 44 65.67%
0 0 23 34.33%
0 0 44 23
KOZHIKODE 54 0.02 8.19 0.03 3.9 26 48.15%
3 5.56%
1 1.85%
22 40.74%
2 3.7%
0 30 24
MALAPPURAM 61 0.01 4.42 0.01 4.04 25 40.98%
2 3.28%
1 1.64%
31 50.82%
1 1.25%
1 1.25%
28 33
PALAKKAD 80 0.02 3.57 0.05 2.14 31 38.75%
3 3.75%
0 44 55.00%
1 1.25%
0 34 45
PATHANAMTHITTA 62 0.09 3.42 0.04 0.99 49 79.03%
4 6.45%
0 9 14.52%
0 0 53 9
THIRUVANANTHAPURAM 74 0.05 3.61 0.1 3.44 31 41.89%
9 12.16%
0 29 39.19%
5 6.76%
0 40 34
THRISSUR 72 0.02 2.27 0.02 3.51 36 50.00%
1 1.39%
0 34 47.22%
1 1.39%
0 37 35
WAYANAD 59 0.04 4.7 0.02 3.93 29 59.18%
04 8.16%
1 2.04%
14 28.57%
1 2.04%
0 34 15
TOTAL
893 1.48 0.09
0.01 8.35 422
64.08% 34
13.51% 11
3.8% 383
16.33% 32
0.9% 8
0.6% 467
52.29 % 423
47.36%

Ground Water Year Book of Kerala (2014-15)
45
Table 6.2: District wise Well Frequency for Different Ranges of Water Level Fluctuation (August 2014-Decadal mean (August 2004-2013)
District No. of Wells
Range of Fluctuation (m) No. &Percentage of Wells /Percentage Showing Fluctuation Total No. of Wells Rise Fall Rise Fall Rise Fall
Min Max Min Max 0 to 2 2 to 4 >4 0 to 2 2 to 4 >4
ALAPPUZHA 60 0.01 3.71 0.03 1.91 43 71.67%
5 8.33%
0 12 20.00%
0 48 12
ERNAKULAM 81 3.32 0.04 4.17 61
75.31% 3
3.7% 0 16
19.75% 0 1
1.23% 64 17
IDUKKI 50 0.04 4.18 0.08 0.77 44 88.00%
1 2.00%
1 2.00%
4 8.00%
0 0 46 4
KANNUR 54 0.01 4.58 0.07 1.53 24 34.44%
1 1.85%
1 1.85%
27 50.00%
0 0 56 27
KASARGOD 59 0.01 5.38 0.00 2.95 28 47.46%
2 3.39%
1 3.39%
25 42.37%
3 5.08% 0 31 28
KOLLAM 67 0.01 12.26 0.04 3.49 33 49.25%
13 19.4%
6 8.96%
11 16.42%
4 5.97%
0 52 15
KOTTAYAM 69 0.04 3.37 0.01 3.58 50 72.46%
3 4.35%
0 14 20.29%
2 2.9%
0 53 16
KOZHIKODE 56 0.00 3.5 0.15 0.95 40 71.43%
9 16.07%
0 6 10.71%
0 0 49 6
MALAPPURAM 76 0.08 5.45 0.05 1.33 59 77.63%
5 6.58%
1 1.32%
11 14.47%
0 0 65 11
PALAKKAD 77 0.03 4.32 0.01 3.65 34 44.16%
2 2.6%
1 1.3%
39 50.65%
1 1.3%
0 37 40
PATHANAMTHITTA 58 0.07 8.23 0.1 0.62 31 53.45%
14 21.14%
7 12.07%
6 10.34%
0 0 52 6
THIRUVANANTHAPURAM 77 0.03 3.22 0.00 4.75 39 50.65%
14 18.18%
0 17 22.08%
5 6.49%
2 2.6%
53 24
THRISSUR 70 0.04 4.06 0.00 1.28 45 64.29%
1 1.43%
1 1.43%
23 32.86%
0 0 47 23
WAYANAD 46 0.00 3.8 0.04 5.4 27 58.7%
5 10.87%
0 10 21.74%
3 6.52%
1 2.17%
32 14
TOTAL
900 3.22 0.08
0.00 5.4 588
65.33% 78
8.66% 19
2.11% 221
24.55% 18
2 % 4
0.44% 655
73 % 243
27%

Ground Water Year Book of Kerala (2014-15)
46
Table 6.3: District wise Well Frequency for Different Ranges of Water Level Fluctuation (November 2014 – Decadal mean (November 2004-2013) District No. of
Wells Range of Fluctuation (m) No. &Percentage of Wells /Percentage Showing Fluctuation Total No. of Wells
Rise Fall Rise Fall Rise Fall Min Max Min Max 0 to 2 2 to 4 >4 0 to 2 2 to 4 >4
ALAPPUZHA 64 0 7.5 0.07 2.88 18 71.67%
0 1 1.56%
43 67.19%
2 3.13%
19 45
ERNAKULAM 97 0.01 2.96 0.02 5.06 56
75.31% 3
3.09% 0 35
36.08% 1 1.03%
2 2.06%
59 38
IDUKKI 46 0.02 1.18 0.01 2.48 18 88.00%
0 0 27 58.7%
1 2.17%
0 18 28
KANNUR 54 0.01 2.69 0.07 1.8 17 34.44%
2 3.7%
0 35 64.81%
0 0 19 35
KASARGOD 65 0.01 7.07 0.04 26.21 26 47.46%
1 1.54%
33 50.77%
4 6.15%
1 1.54%
27 38
KOLLAM 65 0.06 9.86 0.01 2.28 35 49.25%
2 3.08%
3 4.62%
24 36.92%
1 1.54%
0 40 25
KOTTAYAM 67 0.04 1.7 0.00 4.09 12 72.46%
0 0 51 76.12%
3 4.48%
1 1.49%
12 55
KOZHIKODE 71 0.02 1.51 0.02 1.37 28 71.43%
0 0 43 60.56%
0 0 28 43
MALAPPURAM 80 0.01 3.27 0.11 2.83 38 77.63%
2 2.5%
0 36 45.00%
4 5.00%
0 40 40
PALAKKAD 92 0.02 7.06 0.06 3.8 44 44.16%
4 4.35%
3 3.26%
38 41.3%
2 2.17%
0 51 40
PATHANAMTHITTA 73 0.05 2.5 0.02 3.8 16 53.45%
1 1.37%
0 50 68.49%
6 8.22%
0 17 56
THIRUVANANTHAPURAM 82 0.05 2.85 0.02 29.71 27 50.65%
6 7.32%
0 44 53.66%
3 3.66%
2 2.44%
33 49
THRISSUR 85 0.01 2.57 0.01 1.2 41 64.29%
1 1.18%
0 42 49.51%
0 0 42 42
WAYANAD 54 0.02 3.01 0.02 1.53 15 58.7%
1 1.85%
0 38 70.37%
0 0 16 38
TOTAL
995 1.18 0.06
0.00 29.71 391
39.29% 22
2.21% 8
0.8 539
54.17% 27
5.72% 6
0.6% 421
42.31 % 572
57.48%

Ground Water Year Book of Kerala (2014-15)
47
Table 6. 4: District wise Well Frequency for Different Ranges of Water Level Fluctuation (January 2015 – Decadal mean (January 2005-2014)
District No. of Wells
Range of Fluctuation (m) No. Percentage of Wells /Percentage Showing Fluctuation Total No. of Wells Rise Fall Rise Fall Rise Fall
Min Max Min Max 0 to 2 2 to 4 >4 0 to 2 2 to 4 >4
ALAPPUZHA 62 0.03 8.20 0.02 14.55 47 73.44%
2 3.13%
1 1.56%
9 14.06%
0 3 4.65%
50 12
ERNAKULAM 87 0.02 9.74 0.06 1.90 53 60.92%
4 4.60%
2 2.30%
28 32.18%
0 0 59 28
IDUKKI 46 0.11 3.66 0.08 0.51 36 78.26%
6 13.04%
0 4 8.70%
0 0 42 4
KANNUR 48 0.02 2.98 0.03 3.26 38 79.17%
4 8.33%
0 5 10.42%
1 2.08%
0 42 6
KASARGOD 51 0.10 9.25 0.03 9.06 25 49.02%
8 15.69%
5 9.80%
10 19.61%
2 3.92%
1 1.96%
38 13
KOLLAM 57 0.08 9.35 0.06 7.08 31 54.39%
11 19.30%
4 7.02%
8 14.04%
1 1.75%
1 1.75%
46 10
KOTTAYAM 65 0.02 24.75 0.11 1.62 43 66.15%
10 15.38%
2 3.08%
10 15.38%
0 0 55 10
KOZHIKODE 59 0.03 3.74 0.02 4.12 37 62.71%
5 8.47%
0 14 23.73%
1 1.69%
1 1.69%
42 16
MALAPPURAM 79 0.01 8.01 0.01 2.06 54 68.35%
9 11.39%
4 5.06%
11 13.92%
1 1.27%
0 67 12
PALAKKAD 87 0.10 12.14 0.10 1.65 51 58.62%
22 25.29%
6 6.90%
7 8.05%
0 0 79 7
PATHANAMTHITTA 59 0.10 6.75 0.10 1.50 42 71.19%
1 1.69%
1 1.69%
14 23.73%
0 0 44 14
THIRUVANANTHAPURAM 67 0.08 6.67 0.01 2.38 40 59.70%
16 23.88%
4 5.91%
6 8.96%
1 1.49%
0 60 7
THRISSUR 74 0.02 7.62 0.03 1.24 48 64.86%
10 13.51%
4 5.41%
12 16.22%
0 0 62 12
WAYANAD 45 0.10 4.10 0.07 3.10 24 53.33%
12 26.67%
1 2.22%
7 15.56%
1 2.22%
0 37 8
TOTAL
888
569
64.01% 120
13.51% 34
3.82% 145
16.32% 8
0.9% 6
0.7% 723
81.4% 159
17.9%
Ground Water Year Book of Kerala (2014-15)
48
VII LONG TERM GROUND WATER LEVEL TREND
The long-term water level data was analysed for the period of 2005-2014. The analysis of pre-
monsoon water level trend for the last decadal period (i.e during 2005 – 2014) indicates that only
37.74 % of GWMWs have recorded negligible change in water level in the range of +0.05 to –
0.05 m/year. 28.67% of monitoring wells have recorded declining trend in the range of 0.05 to
0.2 m/year and 10.84 % of monitoring wells have recorded declining trend above 0.2 m/year. The
15.45 % of monitoring wells have recorded rising trend in the range of 0.05 to 0.2 m/year and
7.28 % of monitoring wells have recorded rising trend above 0.2 m/year. From the above data, it
is clear that the long term trend for the pre-monsoon period indicates a decline in water level
represented by about 39.51 % of the total wells excluding the wells showing negligible change in
water level which is of 37.74% . The maps showing pre-monsoon water level trend for the period
2004-2013 is shown in Figure 7.1.
The analysis of post-monsoon water level trend for the last decadal period (i.e during 2005–
2014) indicates that only 26.77 % of GWMWs have recorded negligible change in water level in
the range of +0.05 to –0.05 m/year. The 16.86 % of monitoring wells have recorded declining
trend in the range of 0.05 to 0.2 m/year and 7.8 % of monitoring wells have recorded declining
trend above 0.2 m/year. 26.77 % of monitoring wells have recorded rising trend in the range of
0.05 to 0.2 m/year and 8.13 % of monitoring wells have recorded rising trend above 0.2 m/year.
The data analysis indicates that the long-term ground water level trend shows a rising trend in
major portions of the state represented by about 34.9 % of the total wells excluding the wells
showing negligible change in water level which is of 40.38%. The maps showing pre-monsoon
water level trend for the period 2004-2013 is shown in Figure 7.2.
Typical hydrographs showing the negligible change in water level are depicted in Figures 7.3 &
7.4. Many of the monitoring wells which are showing declining pre-monsoon water level, have a
rising or a steady post monsoon water level trend, indicating the enhanced ground water recharge
to recoup to the original level (Figure 7.5 & 7.6). A few monitoring wells like Palakkad and
Mannanthala have shown falling trend of both pre-monsoon and post-monsoon water levels
(Figure 7.7 & 7.8).

Ground Water Year Book of Kerala (2014-15)
49
Figure 7.1: Pre-monsoon water level trend for the period 2005-2014

Ground Water Year Book of Kerala (2014-15)
50
Figure 7.2: Post -monsoon water level trend for the period 2005-2014

Ground Water Year Book of Kerala (2014-15)
51
Figure 7.3: Hydrograph of GWMWs tapping phreatic aquifer in laterites at Kommeri, Kannur
Figure 7.4: Hydrograph of GWMW tapping phreatic aquifer in laterites at Madavur, Thiruvananthapuram District
Figure 7.5: Hydrograph of GWMW tapping phreatic aquifer in laterites at Kottiyur, Kannur District

Ground Water Year Book of Kerala (2014-15)
52
Figure 7.6: Hydrograph of GWMW tapping phreatic aquifer in laterites at Ayur, Kollam District
Figure 7.7: Hydrograph of GWMW tapping phreatic aquifer in weathered crystallines at Palghat, Palakkad District
Figure 7.8: Hydrograph of GWMW tapping phreatic aquifer in laterites at Mannanthala, Thiruvananthapuram District

Ground Water Year Book of Kerala (2014-15)
53
VIII. BEHAVIOUR OF PIEZOMETRIC HEADS IN DEEP
AQUIFERS OF CONFINED/SEMICONFINED NATURE DURING
THE YEAR 2014-2015
A total of 269 piezometers constructed by CGWB in various districts of the State are being
monitored four times a year. Out of these 74 piezometers (Tube wells) are constructed in
sedimentary areas. The depth range of these piezometers is from 10 m. to 450 m. The remaining
195 piezometers (Bore wells) are in hard rock areas and the depth range of these wells is from 10
m. to 300 m. About 44% of these borewells are tapping shallow fracture zones within 30 metres
depth. These wells were manually monitored for water level during the months of April, August,
November 2014 and January 2015. The analysis of the data acquired from these piezometers is
discussed below.
Sedimentary area:
In the deeper aquifers of Tertiary age, ground water occurs under confined / semi-confined
conditions. In the shallow aquifers in Tertiary formation in northern Kerala and in Recent alluvial
formations in coastal plains, ground water occurs under unconfined to semi-confined condition.
The piezometric heads in these aquifers is at about 18 m.amsl in the eastern boundary of recharge
areas of Tertiary beds and reduced to near MSL in coastal areas. The depth to piezometric heads
in deep tube wells tapping confined aquifers ranges from 1.08 to 29.02 mbgl during April 2014
(premonsoon). The annual fluctuation of the piezometric head in the year 2014 – 15 is mostly
restricted to 3 metres. Free flowing wells are also encountered in some places and the decline in
head with time is inferred from the reduction in free flow. Analysis of the long term piezometric
head data of deeper aquifers at Karthikapally tapping Quilon and Warkali formations are showing
a declining trend in both during pre-monsoon and post-monsoon. Hydrographs of piezometers at
Karthikapally (Alleppey District) tapping Warkali and Quilon aquifers are shown in Figures 8.1
& 8.2.
Crystalline area:
In hard rock areas, groundwater occurs under confined / semi-confined conditions in the deep
fracture zones and unconfined to semi-confined conditions in shallow fractured zones. The depth
to piezometric heads in bore wells range from 0.12 to 31.15 m bgl during pre-monsoon period
(April 2013). About 88.7 % of the borewells in the hard rock areas are showing piezometric head
of less than 10 mbgl. The annual fluctuation of piezometric head (between April and November
months) is in the range of 0.3 – 10 metres. The hydrograph of the hard rock piezometers are
given in Figures. 8.3 & 8.4.

Ground Water Year Book of Kerala (2014-15)
54
Figure 8.1 Hydrograph of Piezometer tapping Warkalai aquifer at Karthikapally(N), Alappuzha District
Figure 8.2 Hydrograph of Piezometer tapping Quilon aquifer at Karthikapally(S), Alappuzha District
Figure 8.3 Hydrograph of Piezometer tapping fractured aquifers at Vadakkancherry, Palakkad District

Ground Water Year Book of Kerala (2014-15)
55
Figure. 8.4: Hydrograph of Piezometer tapping fractured aquifers at Koduvayur, Palakkad District

Ground Water Year Book of Kerala (2014-15)
56
IX. HYDROCHEMISTRY
The chemical quality of shallow groundwater in Kerala State has been evaluated by sampling and
analysing the water samples from 620 National Hydrograph Monitoring Wells. The water
samples were collected during April 2012 representing the premonsoon quality. The frequency
distribution of electrical conductivity data of National Hydrograph Monitoring Wells is presented
for entire Kerala State as well as district-wise in Tables 9.1and 9.2.
Table 9.1: Frequency Distribution of Electrical Conductivity (Microsiemens/cm at 250C) in the National Hydrograph MonitoringWells in Kerala State during April 2012- Statewise
Electrical Conductivity Range (Microsiemens/cm at 250C)
No. of Monitoring Wells %
0-500 569 91.8 501-1000 42 6.8 >1000 9 1.4
Table 9.2: Frequency Distribution of Electrical Conductivity (Microsiemens/cm at 250C) in National Hydrograph Monitoring Wells during April 2012- Districtwise
Sl. No.
Name of the district
Total No.of Samples
Electrical Conductivity (Microsiemens/cm at 250C)
0-500 501-1000 >1000 No.of
Samples % No.of
Samples % No.of
Samples %
1 Kasargod 21 21 100 0 0 0 0 2 Cannanore 39 39 100 0 0 0 0 3 Calicut 46 46 100 0 0 0 0 4 Wyanad 34 34 100 0 0 0 0 5 Malappuram 59 53 89.8 5 8.47 1 1.6 6 Trichur 50 47 94 2 4 1 2 7 Palakkad 75 51 68 19 26 5 6 8 Ernakulam 47 45 95.7 1 2.1 1 2.1 9 Kottayam 54 54 100 0 0 0 0 10 Idukki 39 37 94.8 2 5.2 0 0 11 Alleppey 46 37 80.43 8 17.39 1 2.1 12 Pathanamthitta 35 34 97.1 1 2.9 0 0 13 Kollam 40 38 95 2 5 0 0 14 Thiruvananthapura
m 35 32 91.4 1 2.85 2 5.7
The shallow groundwater in Kerala State is generally of good quality, 91.6% of the wells had
registered electrical conductivity below 500 Microsiemens/cm at 250C, 8% of the wells had
recorded electrical conductivity in the range 501-1000 Microsiemens/cm at 250C and 1.4% had
recorded electrical conductivity above 1000 Microsiemens/cm at 250C. Out of 11 wells which had
registered electrical conductivity value 1000Microsiemens/cm at 250C and above, three wells
namely Azhikode of Thrissur district, Srikandapuram of Ernakulam district and Patannakad of

Ground Water Year Book of Kerala (2014-15)
57
Alleppey district had recorded the value as more than 3000 Microsiemens/cm at 250C. Other 9
wells had registered their electrical conductivity value less than 2000Microsiemens/cm at 250C.
Locations where the values of parameters like electrical conductivity more than 750
Microsiemens/cm at 250C, chloride more than 250 mg/L and nitrate more than 45 mg/L are
tabulated in Table 9.3.
The locations where the electrical conductivity had exceeded 1000 Microsiemens/cm at 250C in
districts other than Palghat district are all in Coastal plains. Due to Closeness to sea and
backwaters a marginal increase of dissolved solids in groundwater is observed during the summer
months. In Palghat district all the locations where the electrical conductivity had exceeded 1000
Microsiemens/cm at 250C are situated in the eastern and southern part of the district. The easten
part of Palghat district is more mineralised as per the geological set up of the State, which is
evident from the Geological Map of Kerala State. 25 wells which had shown nitrate concentration
above 45mg/L in the entire state are distributed sporadically over the State and are not confined to
any area. These stations are most likely to represent the levels of localized pollution. The
locations where the value of electrical conductiovity exceeds 1000 Microsiemens/cm at 250C and
nitrate more than 45 mg/L is given in Figure 9.1 and 9.2 respectively.
During 2010, permonsoon and postmonsoon samples has been collected and the chemical
analysis data of water samples is given in Annexure II.
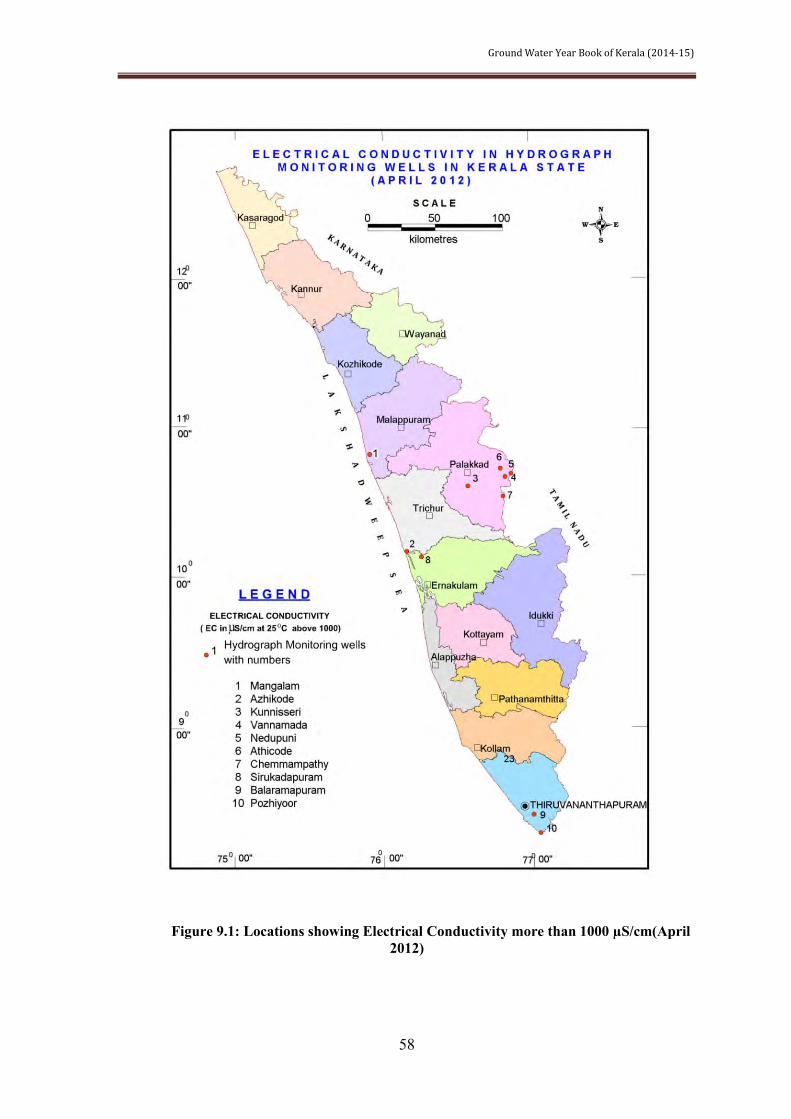
Ground Water Year Book of Kerala (2014-15)
58
Figure 9.1: Locations showing Electrical Conductivity more than 1000 µS/cm(April 2012)
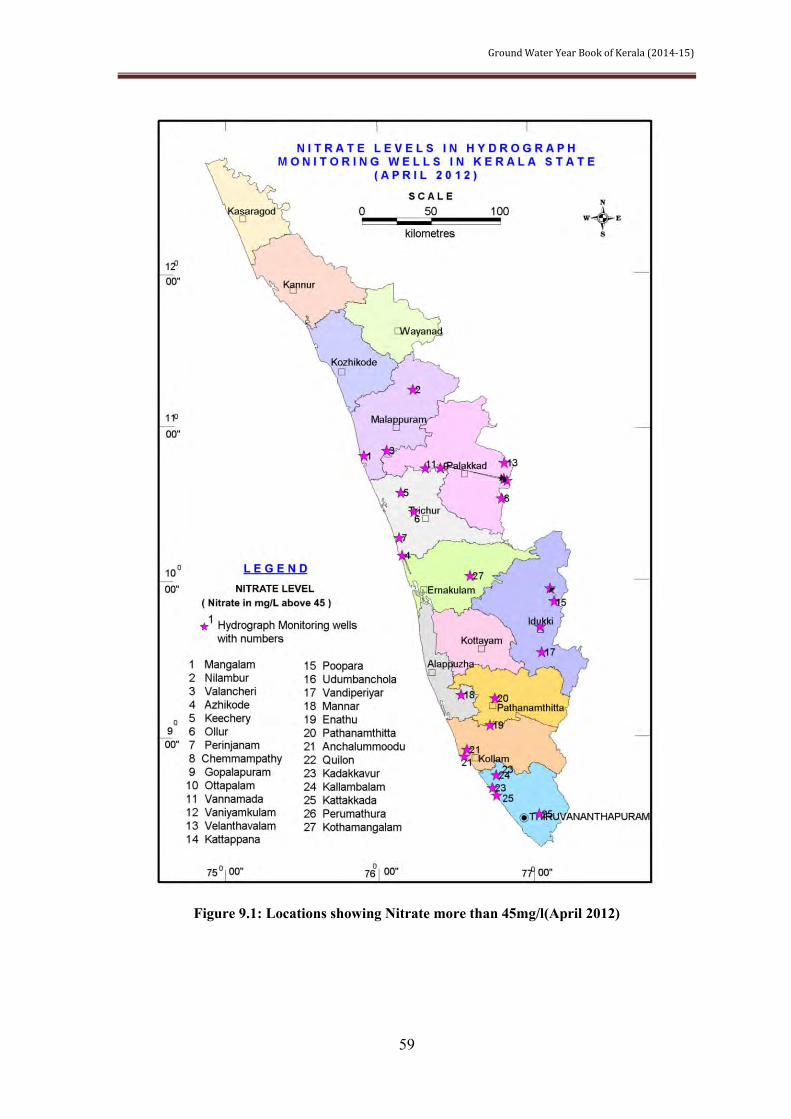
Ground Water Year Book of Kerala (2014-15)
59
Figure 9.1: Locations showing Nitrate more than 45mg/l(April 2012)

Ground Water Year Book of Kerala (2014-15)
60
Table 9.3: National Hydrograph Monitoring Wells noted for localized pollution
Sl No. Location District Latitude Long EC > 1000µS/cm
Cl> 250 mg/l NO3>45mg/l
1 Mangalam Malappuram 10.85 75.92 1040 227
2 Azhikode Trichur 10.20 76.17 3400 1065 59
3 Kunnisseri Palghat 10.64 76.59 1900 532 -
4 Vannamada Palghat 10.70 76.85 1100 - 106
5 Nedupuni Palghat 10.72 76.89 1100 - -
6 Athicode Palghat 10.76 76.81 1280 - -
7 Chemmampathy Palghat 10.57 76.83 1140 - 100
8 Sirukadapuram Ernakulam 3600 1136 -
9 Balaramapuram Trivandrum 8.43 77.05 1020 -
10 Pozhiyoor Trivandrum 8.3 77.10 1360 256 -
11 Nilambur Malappuram 11.28 76.24 - - 73
12 Valancheri Malappuram 10.88 76.07 - - 47
13 Keechery Trichur 10.61 76.16 - - 68
14 Ollur Trichur 10.48 76.25 - - 63
15 Gopalapuram Palghat 10.69 76.87 - - 168
16 Ottapalam Palghat 10.77 76.43 - - 83
17 Vaniyamkulam Palghat 10.77 76.33 - - 56
18 Velanthavalam Palghat 10.80 76.85 - - 59
19 Kattappana Idukki 9.73 77.09 - - 101
20 Poopara Idukki 9.98 77.15 - - 72
21 Udumbanchola Idukki 9.9 77.18 - - 58
22 Vandiperiyar Idukki 9.57 77.1 - - 75
23 Mannar Alleppey - - 81
24 Enathu Pathanamthitta 9.09 76.76 - - 60
25 Pathanamthitta Pathanamthitta 9.26 76.79 - - 70

Ground Water Year Book of Kerala (2014-15)
61
26 Anchalummoodu Quilon 8.93 76.60 - - 69
27 Quilon Quilon 8.88 76.58 - - 93
28 Kadakkavur Trivandrum 8.68 76.77 - - 53
29 Kallambalam Trivandrum 8.76 76.80 - - 52
30 Kattakkada Trivandrum 8.51 77.08 - - 55
31 Perumathura Trivandrum 8.63 76.80 - - 57

Ground Water Year Book of Kerala (2014-15)
62
X SUM UP
1. The total number of Ground Water Monitoring Wells (GWMW) in Kerala State as
on 31.03.2015 was 1638. These monitoring wells include 1369 dug-wells tapping
phreatic aquifers and 269 piezometers tapping phreatic zones and deeper aquifers
in sedimentary as well as hard rock terrains. The water level monitoring was
carried out in the months of April, August and November 2014 and January 2015.
Water sampling was carried out in 620 GWMWs (dug-wells) during the month of
April 2012.
2. The monitoring wells are spread over in all the physiographic regions of the State.
62 % of which fall in the midland region, 18 % in coastal plains, 15 % in high
lands and 5 % in plateau region.
3. Out of the monitoring wells tapping phreatic aquifer, 65% of the well are tapping
lateritic aquifer which is the widely distributed aquifer in the State, 17 % tapping
weathered and fractured crystallines followed by coastal alluvium and river
alluvium represented by 15 % and 3 % respectively.
4. The total rainfall ranged from 1876 to 3769 mm during the period from April 2014
to March 2015. The maximum rainfall was recorded in Idukki district and the
minimum in Trivandrum district. During the southwest monsoon season,
Trivandrum district recorded 871 mm and Kasargod district recorded 3007 mm,
which are the lowest and highest rainfall respectively. During the northeast
monsoon season, Kasargod district recorded the lowest rainfall of 338 mm and
kottayam district recorded the highest rainfall of 639.
5. During the southwest monsoon season from June to September 2014, the departure
of rainfall varied from – 11% to 19% in different districts. There is no scanty and
deficient rainfall recordrd during this season.
6. During the northeast monsoon season from October to December 2014, the
departure of rainfall varied from – 30% to 16 % in different districts There are four
districts were received deficient type of rainfall during this season. Normal rainfall
is recorded in ten districts.

Ground Water Year Book of Kerala (2014-15)
63
7. During the months of January to March 2015, the departure of rainfall varied from
-45 to 173%. Four districts were recorded maximum from the deficient rainfall in
the negative side.No scanty rainfall was recorded during the winter season.
8. The depth of water level varies from place to place according to the topographical
conditions and is widely in the range of near ground level to 55 m bgl. However
water level is in the range of 1 – 10 mbgl in major parts of Kerala State. In the
coastal plains of the Kerala State and in certain areas in high ranges of Idukki and
Pathanamthitta districts shallow water level in the range of 1 – 6 m bgl is seen. In
mid land region water level is generally in the range of 2 – 15 m bgl. However
deep water level in the range of 10 – 30 m bgl is seen in certain areas of
Kasaragod, Wayanad, Palakkad, Kollam and Thiruvananthapuram districts where
thick lateritic overburden occurs.
9. During April 2014 about 81.26% of monitoring wells was showing water level
within the depth range of 0.10 to 10 mbgl. Whereas about 93.36% of monitoring
wells were showing water level of less than 10 mbgl during August 2013.
10. The comparison of August 2013 water level with that of April 2013 indicates that
80.72% of monitoring wells shows rise in water level whereas 18.21% shows fall
in water level. Rise in water level is recorded in major part of the state.
11. Comparison of water level data of the year 2014 – 2015 with the decadal mean
value of the period 2004 – 2013 and 2005-2014 indicates that majority of
monitoring wells (80%-April, 89%-August, 93%- November, 92%-January) have
recorded either rise or fall in water level with the magnitude of less than 2 m.
indicating insignificant change in water level over the past decade.
12. Long term ground water level trend for the pre-monsoon period indicate a rise in
water level in the range of 0.05-0.2 m/year is more predominant.
13. Long term ground water level trend for the post-monsoon period indicate that
majority of the state shows negligible change in the trend.
14. The chemical quality of shallow groundwater in Kerala State has been evaluated
by sampling and analysing the water samples collected from Ground Water
Monitoring Wells established in various physiographic divisions tapping different
aquifers. During April 2012, 620 water samples have been collected which

Ground Water Year Book of Kerala (2014-15)
64
represents the premonsoon ground water quality and are subjected to physical and
chemical analysis.
15. Majority of the water samples show electrical conductivity within 500 µS/cm. The
low conductivity of water samples can be attributed to the peculiar physiographic
setting of the state. 91.6% of the wells had registered electrical conductivity below
500 µS /cm at 250C, 8% of the wells had recorded electrical conductivity in the
range 501-1000 µS /cm at 250C and 1.4 % had recorded electrical conductivity
above 1000 µS /cm at250C which is local in nature.
16. The chemical analysis data shows that in some of the water samples concentration
of chloride, fluoride and nitrate are above the permissible limit. In the case of
fluoride, concentration in excess of 1.5 m/l is observed only in the eastern part of
Palakkad district tapping shallow dug wells. While nitrate concentration above 45
mg/l is noticed in 25 wells in the entire state which are sporadically distributed
over the state and are not confined to any area represents the local pollution.
**************************

Ground Water Year Book of Kerala (2014-15)
65
Annexure I Ground Water Level Data of GWMW’s in Kerala State during 2014 -15
District Well Type Site Name April 14
August 14
November 14
January 15
ALAPPUZHA Dug Well Adikattukulangara 5.55 3.4 3.55 5
Alapuzha Town 3.9 3 3.5 3.8 Alleppey 1.95 1.21 1.91 2.11
Ambalapuzha 1.9 0.3 1 1.4 Aranootimangalam 9.6 5.1 7.45 7.5 Arukutti 2.2 0.92 1.42 2.07
Arur 1.82 0.3 1 1.45 Champakulam 0.71 0.5 1.8 1.47
Chandirur(R1) 2.12 0.49 1.34 1.84 Charummud 2.64 5.15 2.71 Chelakkad 1.65
Chengannur 6.65 1.8 6.6 4.7 Chennithala South 2.84 1.91 1.15 1.7
Cherthalai 0.91 0.54 0.75 0.8 Cheruvaranam 2.57 0.45 1.4 2
Chettikulangara 2.05 0.65 1.1 1.15 Edathua(R2) 1.02 0.7 0.5 1 Eramallur 2.3 0.85 1.5 1.7
Ezhupunna1 0.97 0.95 Haripad 3.03 0.74 1.37 1.98
Idakunnam 12.54 7.32 10.8 12.5 Kadaikadu 4.2 Kaidavana-R1 1.35 0.3 1.3
Kaipapuram (Muhamma) 2 Kalavamkodam 1.82 0.45 1.65 1.85
Kalavur 1.57 0.25 0.65 1.05 Kallissery 3.53 1.93 3.3 3.6
Kanichukulangara 2.22 2.1 2 2.2 Karumancherry 2.15 Karuvatta (R1) 0.4 2.3 1.75
Kattanam 11.85 10.15 11.15 12.35 Kattoor1 1.87 0.87 1.45
Kavungal 1.75 Kayamkulam 1.28 0.2 0.15 0.6 Kokkamangalam 1.9
Kudassanad 5.26 4.8 5.9 Kunnamkari 0.85 1.65
Kuttitheruvu (Kayamkulam) 3.21 0.49 1.2 2.1

Ground Water Year Book of Kerala (2014-15)
66
ALAPPUZHA Dug Well Kuzhamathu 12.25 5.5 10.5 12.5 Mahadevikad 0.56 0.3 0.55 0.7 Mananchery 2.82 0.3 2.2 2.8
Mancombu 0.37 0.3 1.5 1.4 Mannar 5.62 4.37 2.7 5.67
Mavelikara 3.11 0.54 1.54 2.24 Mulakuzha1 4.87 1.15 3.95 6.27
Muthukulam 2.4 0.4 0.7 1.65 Muttam 0.25 1.05 1.4 Muttar 1.32 1.4
Naduvattom 2.16 4.05 Nangiarkulangara 2.25 0.75 1.1
Nedumudi (pupalli) 0.43 0.05 0.1 0.25 Neerkunnam(R1) 2.21 0.3 1.15 Nooranad 5.34 7.3 9.55 9.55
Oachira1 (Krishnapuram) 4.69 1.68 2.51 3.31 Ottappunna 0.67 2.15 2.15 2.45
Pacha(R3) 1.34 0.25 0.63 1.15 Pallarimangalam 2.47 0.55 1 1.25
Panavally 2.1 0.5 1 1.3 Pandanad 3.5 2.52 3 5.37 Panurkara 1.65
Parayakkad 2.5 Parumala-R1 7.08 3.2 5.75 6.35
Pathiyur-R1 1.64 0.1 0.5 0.8 Pattanakad 1.55 0.95 0.95 1.25 Punnapra 2.76 2.1 2
Purakkad (R1) 2.45 1.51 2.41 2.41 Ramankari-R1 0.64 0.3 0.5 0.95
Thaikattusseri-R1 1.52 0.5 1 1.3 Thakazhi 1.9 0.25 0.95
Thalavadi (R1) 1.45 Thamarakulam 3.28 2.86 3.1 Thaneermukkam 1.15 0.4 1.3
Thevery 2.41 0.4 Thottapally 2.32 0.18 1.1
Thuravur 3.32 2.12 2.2 Trikkunnapuzha (R1) 0.19 1.2 1.45 1.05 Valavanad 1.51 0.3 0.7 1
Vallikunnam 3.24 1.27 3.3 1.8 Vanaswargam 1.88 0.64 0.55 1.5
Vandanam 2.98 0.2 1.98 2.25

Ground Water Year Book of Kerala (2014-15)
67
ALAPPUZHA Dug Well Veeyapuram 0.8 1 1.2 Venmani (R1) 2.7 0.97 1.75 2 Tube Well Chettikulangara Pz 3.7 3.3
Ezhupunna 1.6 1.12 1.2 1.5 Haripad(c) 10.55 6.15 10.45
Haripad(e) 5.48 8.27 8.48 Haripad(n) 10.7 7.05 8.5 10.95
Haripad(s) 10.25 Haripad(w) 10.3 Kalarkode(c) 3.34 3.55 3.05 3.25
Kalarkode(e) 3.38 5.32 Kalarkode(s) 2.07 2.1 1.4
Kalarkode(w) 3.1 6.8 Karthikapalli(north) 11.3 Karthikapally(south) 14 13.45
Karumady 2.05 1.61 1.86 2.21 Kattanam1 11.8 8.4 9.95 11.1
Krishnapuram(n) 15.5 11.99 14.82 Krishnapuram(s) 5.4 6.5
Mannancherry (30m) 7.5 Mannar 6.07 4.37 2.7 5.67 Mudhukulam 1 0.45
Muttam(south) 4.61 2.32 6.37 4.42 Preethigulangara-centre 12.99
ERNAKULAM Bore Well Aikaranad1 2.75 3.15 3.15 Arakuzha Pz 6.9 4.4 4.4 4.9 Edakkattuvoyal PZ 8.9 14.1 9.7
Illithode 6.52 5.72 6.22 6.82 Irumbanam2 4.44 0.48 1.23 2.38
Kanjiramattom 13.66 13.3 13.1 13.75 Kizhakombu 6.94 1.85 0.7 8.8
Kodussery 8.17 7.37 6.77 8.17 Koovappady 6.05 Malayattur1 8.85 8.7 9.2
Namakuzhi 9.9 3 5.9 6.9 Poothrikka Pz 9.15
Punnakad 2.56 1.25 0.95 2.35 Thirumaradi 4.81 4.1 4.25 5.4 Vazhagam 6.97
Veliyanad 4.97 2.45 3.95 4.05 Dug Well Aikaranad 4.75 7.3 7.3 4.9
Alwaye 12.05 11.15 11.25

Ground Water Year Book of Kerala (2014-15)
68
ERNAKULAM Dug Well Anchalpetty-R1 6.15 5.85 6.05 5.85 Angamali (R1) 7.18 5.48 5.6 6.88 Anicadu 3.1
Arakunnam 8.95 10.55 Arakuzha 6.15
Attara 6.3 6.75 7 3.9 Chalakka 1.83 1.88 2.48
Chellanum 1.16 0.91 0.81 1.11 Chengamanad 8.98 7.18 7.68 8.58 Cherai 1.4 0.8 0.7 1.5
Cheria Kadavu 0.42 0.4 0.47 0.6 Cherukadapuram 2.11 1.3 1.25 1.58
Chowara (R1) 6.35 5.15 6.25 7.15 Chulli (R1) 4.39 2.25 3.85 4.65 East Marady 5.2 5.9
Edakkatuvayal 10.27 9.17 10.52 11.32 Edapally 1.78 1.12 1.32 1.62
Edavanakad 0.17 0.7 Elur North (R1) 1.75 1.9 2.05
Fort cochin 2.37 1.45 1.65 2.25 Ilanji 7.55 Illithode 1 6.8
Irumbanam (R1) 3.31 0.5 1.2 2.65 Jaikeralam 7.46 5 5.65 7
Kadavoor 5.7 Kadungallur 1.55 1.95 Kakur 3.55 2.65 3.25 3.85
Kalady (R1) 3.4 5.6 Kallorkad 3 2.8 2.5 2.9
Kalur 7 4 2.9 6 Kandakadavu 1.7
Kanjavamattom 6.6 6.7 6.8 7.2 Kanjur 7.4 5.2 6.2 6.9 Kapparassery 2.32 1.12 1.82
Karukutti (R2) 6.85 6.65 8.15 Karumalloor 2.95
Keerampara 3 2.9 2.2 3.3 Keezhillam 7.3 6.9 6.3 7 Kizhakombu 8.15 1.85 0.7 8.8
Kodanad 4.7 Kodussery 9.4 7.37 6.77 8.17
Kodussery (R1) 7.7
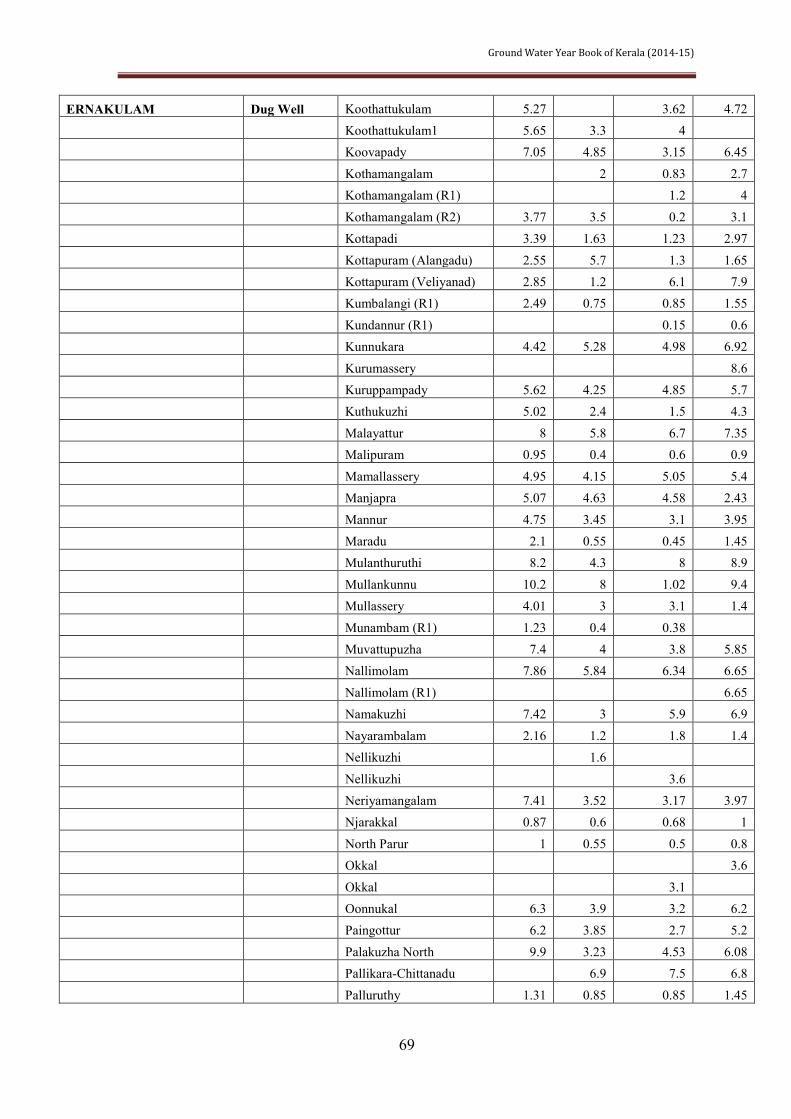
Ground Water Year Book of Kerala (2014-15)
69
ERNAKULAM Dug Well Koothattukulam 5.27 3.62 4.72 Koothattukulam1 5.65 3.3 4 Koovapady 7.05 4.85 3.15 6.45
Kothamangalam 2 0.83 2.7 Kothamangalam (R1) 1.2 4
Kothamangalam (R2) 3.77 3.5 0.2 3.1 Kottapadi 3.39 1.63 1.23 2.97
Kottapuram (Alangadu) 2.55 5.7 1.3 1.65 Kottapuram (Veliyanad) 2.85 1.2 6.1 7.9 Kumbalangi (R1) 2.49 0.75 0.85 1.55
Kundannur (R1) 0.15 0.6 Kunnukara 4.42 5.28 4.98 6.92
Kurumassery 8.6 Kuruppampady 5.62 4.25 4.85 5.7 Kuthukuzhi 5.02 2.4 1.5 4.3
Malayattur 8 5.8 6.7 7.35 Malipuram 0.95 0.4 0.6 0.9
Mamallassery 4.95 4.15 5.05 5.4 Manjapra 5.07 4.63 4.58 2.43
Mannur 4.75 3.45 3.1 3.95 Maradu 2.1 0.55 0.45 1.45 Mulanthuruthi 8.2 4.3 8 8.9
Mullankunnu 10.2 8 1.02 9.4 Mullassery 4.01 3 3.1 1.4
Munambam (R1) 1.23 0.4 0.38 Muvattupuzha 7.4 4 3.8 5.85 Nallimolam 7.86 5.84 6.34 6.65
Nallimolam (R1) 6.65 Namakuzhi 7.42 3 5.9 6.9
Nayarambalam 2.16 1.2 1.8 1.4 Nellikuzhi 1.6
Nellikuzhi 3.6 Neriyamangalam 7.41 3.52 3.17 3.97 Njarakkal 0.87 0.6 0.68 1
North Parur 1 0.55 0.5 0.8 Okkal 3.6
Okkal 3.1 Oonnukal 6.3 3.9 3.2 6.2 Paingottur 6.2 3.85 2.7 5.2
Palakuzha North 9.9 3.23 4.53 6.08 Pallikara-Chittanadu 6.9 7.5 6.8
Palluruthy 1.31 0.85 0.85 1.45

Ground Water Year Book of Kerala (2014-15)
70
ERNAKULAM Dug Well Pambakuda 6.75 4.2 4.9 6.9 Parakkadavu 2.92 1.1 0.9 2.3 Paravur 1.5 0.75 1.1 8.17
Pattimattom 6.8 4.3 Payyal 6 2.35 2.15 3.8
Peechanikad 9.11 5.9 Perumbadavam 7.2 5.45 5.75 6.85
Perumbavoor (R1) 1.4 1.15 Pindimana 5 0.25 0.05 1.95 Piravom 5 5 5.15 5.7
Poothotta 3.18 0.78 1.98 2.58 Poothrikka 8.2
Pothanikad 4.5 2.2 0.8 Pulluvazhi 5.3 4.6 4.5 4.9 Punithura 3.12 2.85 1.25 2.25
Punnakad1 0.5 0.7 0.25 1.75
Puthankurissu (Neriyamangalam Road) 5.16 2.8 3.05
Puthankurisu (R1) 5.26 4.3 4.5 5.8 Ramamangalam 6.54 6.3 6 6.7
Randar 4.63 Thabore 8
Thalakode 4.45 3.4 2.8 3.9 Thattekad 3.45
ThattekadR-1 1.3 3.45 2.25 1.65 Thirumaradi 4.76 4.1 4.25 5.4 Thrikalathur 4.5 4.5 5.1
Thuruthi 3.89 2.5 2 3.3 Trikkakara 9.55 9.4
Tripunithura 3.1 1.7 1.7 2.5 Vadavucode 1.35 Valayanchirangara 6.92 6.62 6.42 8.12
Vallom (R1) 7.53 5.88 6.18 6.85 Varapuzha 2.5 0.35 2.25
Vazhakkulam North 5.55 5.25 5.65 6.45 Vypeen 0.8 0.22 0.35 0.45
Vytila 2.53 1.35 1.65 2.1 Tube Well Kadavanthara 6.3 5.8 5.9 5.9 IDUKKI Bore Well Alakode 4.36 3.09 3.73 4.33
Anakkara 49.4 49.4 49.4 41.4 Karimkunnam2 3.18 1.38 3.7 2.55
Karumannur 4.42 2.11 3.26 4.11 Kattappana 10.52 6.66 6.74

Ground Water Year Book of Kerala (2014-15)
71
IDUKKI Dug Well Mundieruma 5.6 3.64 4.1 4.65 Santhanpara 4.14 2.2 Thankamoni 3.48 1.48 3.5 2.3
Adimali 6 4.07 4.87 6.47 Alakkode1 4.28 3.4 4.1 4.2
Ambazhachal 6.04 3.62 3.45 3.33 Amravathi 3.44 2.53 2.45 2.75
Anakkara 7.36 5.94 6.55 41.4 Anavilasam 5.2 5.2 Arikuzha 5.37 2.3 4.7 5.2
Balagram ( Third camp) 3 Byson Valley 9.85 10
Carady Goody Estate 2.56 0.89 1.7 1.85 Chathurangapara 0.52 0.45 0.4 0.5 Cheenikuzhi 3.16 0.94 1.53 2.2
Cheriyar 2.96 2 2.4 2.45 Chittoor 4.24 2.3 3.81 4.05
Churuli 2.56 1.73 1.93 2.18 Cumbummettu 2.15 3.05
Devikulam 3.41 2.35 2.85 3 Elamdesom 6.78 3.12 5.25 6.1 Elappara 1.55 1.13 1.37 1.52
Idukki 4.53 2.57 3.05 3.45 Irattayar (R1) 2.81 2.12 2.25 2.45
Kaliyar 6.08 3.77 4.75 5.3 Kanchiyar 10.62 7.63 7.55 8.8 Karimkunnam (R1) 2.8 3.25 3.4
Karumanoor 4.12 1.78 3.2 3.95 Kattapana 3.28 1.6 2.15 2.52
Kochera 0.8 1.9 Kodikulam east 5.29 2.5 4 4.9
Kolani 3.91 1.2 2.55 3.3 Kolapra 5.52 3.8 4.1 4.25 Kulamavu 7.69 4.15 6.3 6.55
Kumaramangalam 4.14 3.15 3.7 4.35 Kumili 3.93 1.51 1.8 2.2
Kuttikanam (R1) 6.22 1.9 5.2 8.35 Machiplavu 9.02 5.85 7.9 8.8 Manjappara 2.7 1.4 1.8 1.55
Marykulam 4.71 2.12 2.85 3.95 Memala 4 4.5
Moolamattam 5.68 3.5 4.4 5.9
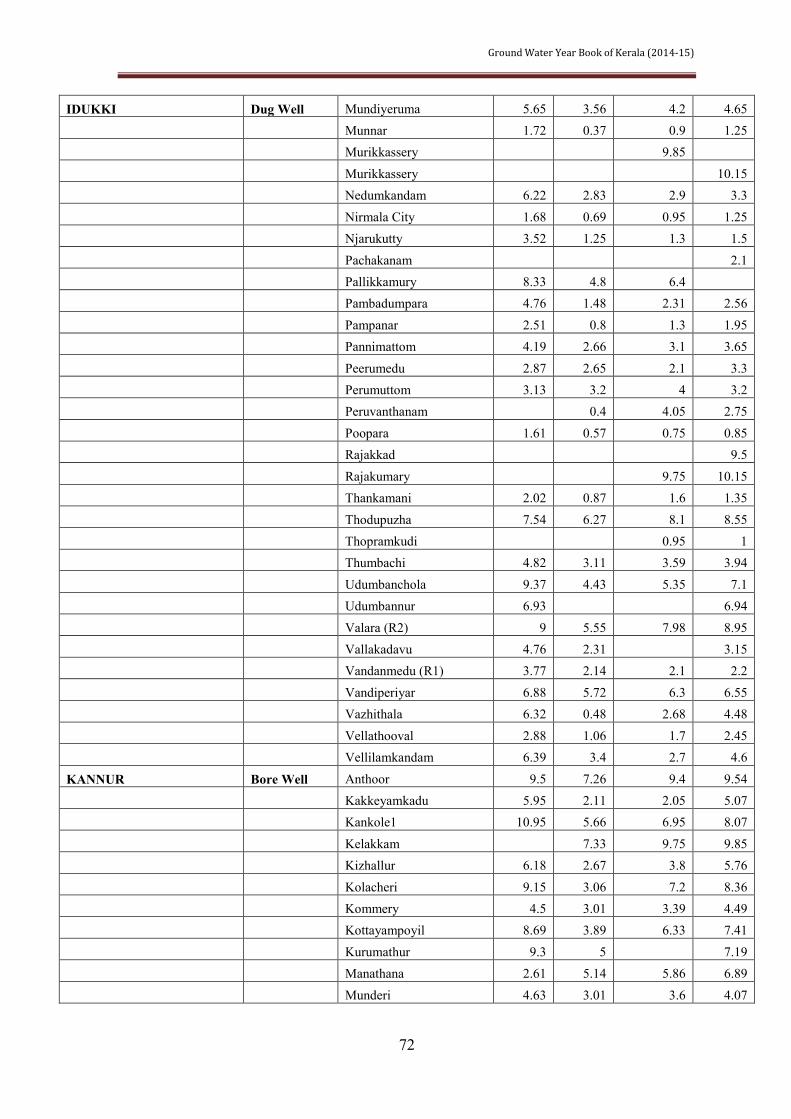
Ground Water Year Book of Kerala (2014-15)
72
IDUKKI Dug Well Mundiyeruma 5.65 3.56 4.2 4.65 Munnar 1.72 0.37 0.9 1.25 Murikkassery 9.85
Murikkassery 10.15 Nedumkandam 6.22 2.83 2.9 3.3
Nirmala City 1.68 0.69 0.95 1.25 Njarukutty 3.52 1.25 1.3 1.5
Pachakanam 2.1 Pallikkamury 8.33 4.8 6.4 Pambadumpara 4.76 1.48 2.31 2.56
Pampanar 2.51 0.8 1.3 1.95 Pannimattom 4.19 2.66 3.1 3.65
Peerumedu 2.87 2.65 2.1 3.3 Perumuttom 3.13 3.2 4 3.2 Peruvanthanam 0.4 4.05 2.75
Poopara 1.61 0.57 0.75 0.85 Rajakkad 9.5
Rajakumary 9.75 10.15 Thankamani 2.02 0.87 1.6 1.35
Thodupuzha 7.54 6.27 8.1 8.55 Thopramkudi 0.95 1 Thumbachi 4.82 3.11 3.59 3.94
Udumbanchola 9.37 4.43 5.35 7.1 Udumbannur 6.93 6.94
Valara (R2) 9 5.55 7.98 8.95 Vallakadavu 4.76 2.31 3.15 Vandanmedu (R1) 3.77 2.14 2.1 2.2
Vandiperiyar 6.88 5.72 6.3 6.55 Vazhithala 6.32 0.48 2.68 4.48
Vellathooval 2.88 1.06 1.7 2.45 Vellilamkandam 6.39 3.4 2.7 4.6
KANNUR Bore Well Anthoor 9.5 7.26 9.4 9.54 Kakkeyamkadu 5.95 2.11 2.05 5.07 Kankole1 10.95 5.66 6.95 8.07
Kelakkam 7.33 9.75 9.85 Kizhallur 6.18 2.67 3.8 5.76
Kolacheri 9.15 3.06 7.2 8.36 Kommery 4.5 3.01 3.39 4.49 Kottayampoyil 8.69 3.89 6.33 7.41
Kurumathur 9.3 5 7.19 Manathana 2.61 5.14 5.86 6.89
Munderi 4.63 3.01 3.6 4.07
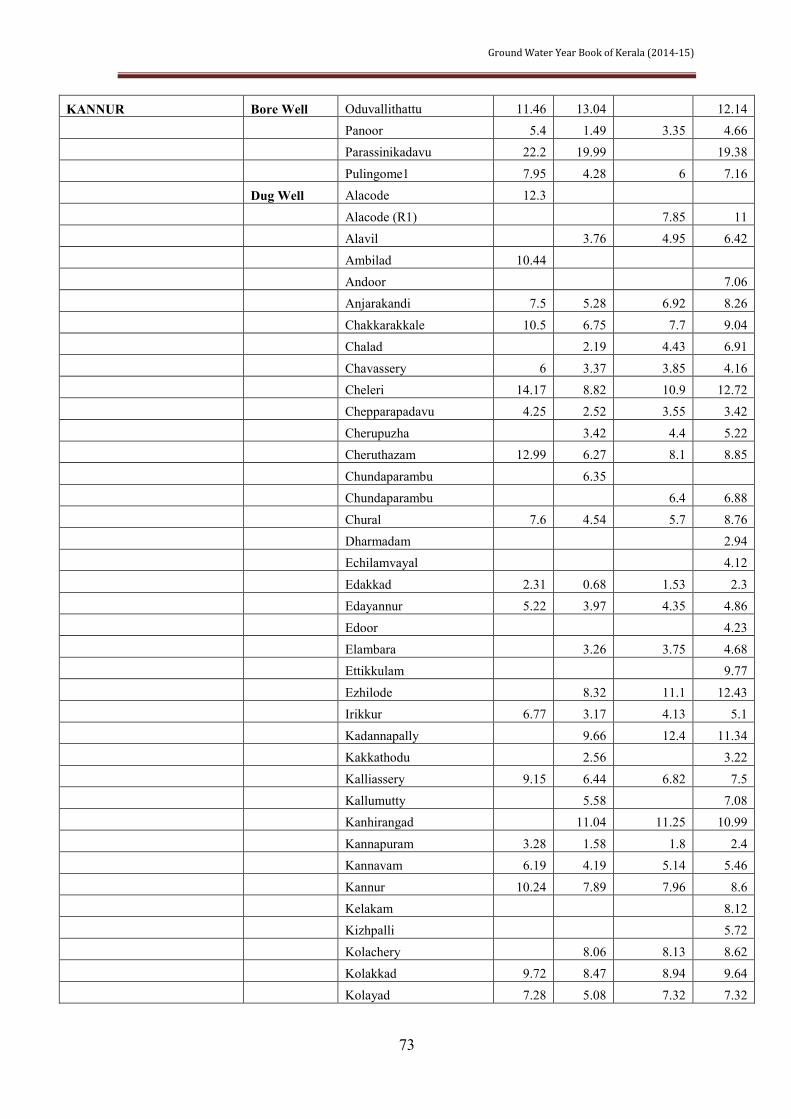
Ground Water Year Book of Kerala (2014-15)
73
KANNUR Bore Well Oduvallithattu 11.46 13.04 12.14 Panoor 5.4 1.49 3.35 4.66 Parassinikadavu 22.2 19.99 19.38
Pulingome1 7.95 4.28 6 7.16 Dug Well Alacode 12.3
Alacode (R1) 7.85 11 Alavil 3.76 4.95 6.42
Ambilad 10.44 Andoor 7.06 Anjarakandi 7.5 5.28 6.92 8.26
Chakkarakkale 10.5 6.75 7.7 9.04 Chalad 2.19 4.43 6.91
Chavassery 6 3.37 3.85 4.16 Cheleri 14.17 8.82 10.9 12.72 Chepparapadavu 4.25 2.52 3.55 3.42
Cherupuzha 3.42 4.4 5.22 Cheruthazam 12.99 6.27 8.1 8.85
Chundaparambu 6.35 Chundaparambu 6.4 6.88
Chural 7.6 4.54 5.7 8.76 Dharmadam 2.94 Echilamvayal 4.12
Edakkad 2.31 0.68 1.53 2.3 Edayannur 5.22 3.97 4.35 4.86
Edoor 4.23 Elambara 3.26 3.75 4.68 Ettikkulam 9.77
Ezhilode 8.32 11.1 12.43 Irikkur 6.77 3.17 4.13 5.1
Kadannapally 9.66 12.4 11.34 Kakkathodu 2.56 3.22
Kalliassery 9.15 6.44 6.82 7.5 Kallumutty 5.58 7.08 Kanhirangad 11.04 11.25 10.99
Kannapuram 3.28 1.58 1.8 2.4 Kannavam 6.19 4.19 5.14 5.46
Kannur 10.24 7.89 7.96 8.6 Kelakam 8.12 Kizhpalli 5.72
Kolachery 8.06 8.13 8.62 Kolakkad 9.72 8.47 8.94 9.64
Kolayad 7.28 5.08 7.32 7.32

Ground Water Year Book of Kerala (2014-15)
74
KANNUR Dug Well Kommeri 4.45 3.52 4.16 4.36 Koothuparamba 9.35 5.21 7.02 8.33 Koottummukham 4.38 5.4 4.87
Kottayampoil 8.74 5.3 6.92 7.52 Kottiyur 7.28 7.33 7.44 7.19
Kotty 1.61 1.85 2.42 Kozhichal 5.33 3.68 4.8 6.73
Kunnaru 2.84 0.52 0.92 1.47 Kunnoth 2.06 4.87 5.32 Kuppam 1.78 1.8 1.83
Kuyilur 1.33 2.97 3.81 Mahe (R1) 1.67
Manantheri 9.22 5.52 6.64 7.86 Manattana 4.49 2.2 2.67 3.12 Mathamangalam (R1) 7.28
Mathil 9.21 6.42 7.6 8.3 Mattanur 7.78 4.98 6 7.94
Mayyil 11.73 10.01 10.25 10.45 Mekunnu 5.62
Mele Chovva 7.98 7.52 7.65 8.01 Melepukkom 10.26 6.23 5.79 8.25 Meruvambayi 5.8 2.63 4.51 5.44
Mokeri 7.12 7.05 8.37 9.87 Munderi 9.21 5.88 6.32 7.24
Muzhakunnu 4.5 3.46 3.54 4.47 Nayattupara 14.45 7.04 8.1 9.06 Nellunni 3.92
Nuchiyad 5.52 7.41 7.58 Oduvalli 15.47 15.05 16.86
Palleri 7.02 Pallikkuni 3.45 1.54 2.92 4.22
Palloor (Mahe) 9.04 Pannoor 4.14 Panunda 8.72 12.02 13.64
Pappinissery West 1.08 1.2 1.84 Parassinikadavu DW 10.6 13.4 13.75 14.46
Pathiriyad 7.82 Pattiyam 2.19 1.27 1.77 5.64 Payyannur 6.9 3.34 4.63 5.72
Pazhayangadi 2.9 0.34 0.9 1.51 Peravoor 5.2 4.31 4.98 4.85
Peringome 8.22 5.24 7.66 7.51
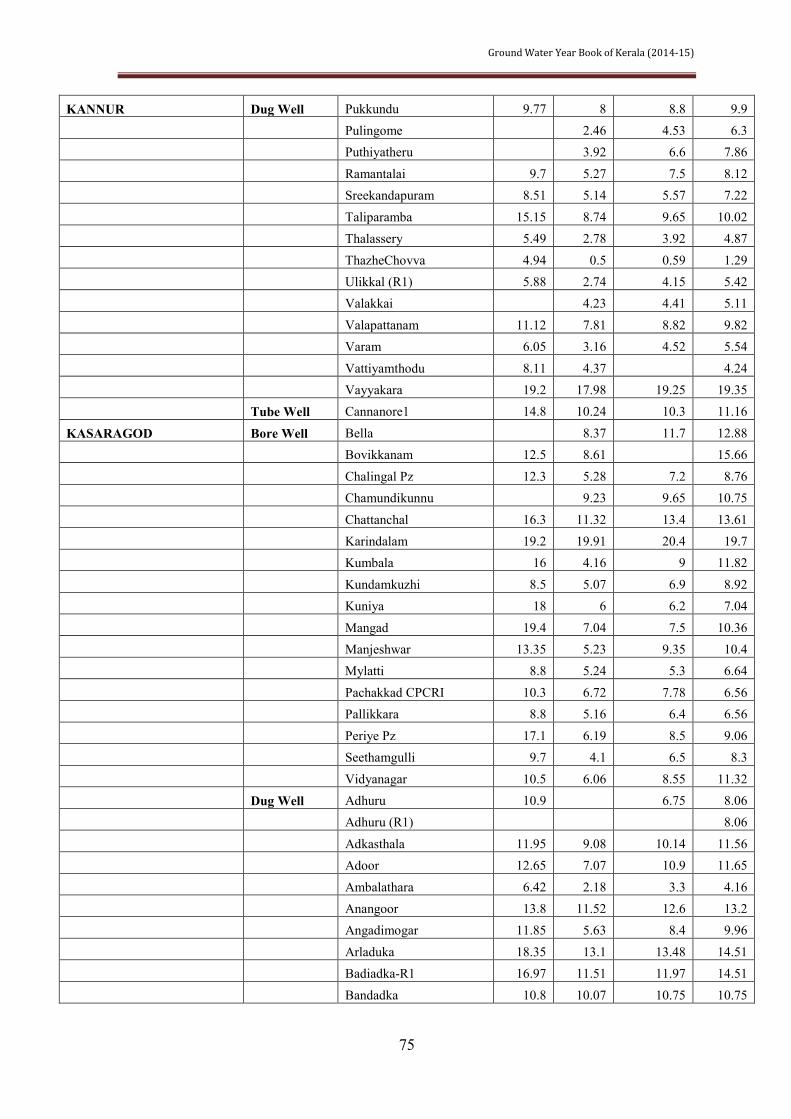
Ground Water Year Book of Kerala (2014-15)
75
KANNUR Dug Well Pukkundu 9.77 8 8.8 9.9 Pulingome 2.46 4.53 6.3 Puthiyatheru 3.92 6.6 7.86
Ramantalai 9.7 5.27 7.5 8.12 Sreekandapuram 8.51 5.14 5.57 7.22
Taliparamba 15.15 8.74 9.65 10.02 Thalassery 5.49 2.78 3.92 4.87
ThazheChovva 4.94 0.5 0.59 1.29 Ulikkal (R1) 5.88 2.74 4.15 5.42 Valakkai 4.23 4.41 5.11
Valapattanam 11.12 7.81 8.82 9.82 Varam 6.05 3.16 4.52 5.54
Vattiyamthodu 8.11 4.37 4.24 Vayyakara 19.2 17.98 19.25 19.35 Tube Well Cannanore1 14.8 10.24 10.3 11.16
KASARAGOD Bore Well Bella 8.37 11.7 12.88 Bovikkanam 12.5 8.61 15.66
Chalingal Pz 12.3 5.28 7.2 8.76 Chamundikunnu 9.23 9.65 10.75
Chattanchal 16.3 11.32 13.4 13.61 Karindalam 19.2 19.91 20.4 19.7 Kumbala 16 4.16 9 11.82
Kundamkuzhi 8.5 5.07 6.9 8.92 Kuniya 18 6 6.2 7.04
Mangad 19.4 7.04 7.5 10.36 Manjeshwar 13.35 5.23 9.35 10.4 Mylatti 8.8 5.24 5.3 6.64
Pachakkad CPCRI 10.3 6.72 7.78 6.56 Pallikkara 8.8 5.16 6.4 6.56
Periye Pz 17.1 6.19 8.5 9.06 Seethamgulli 9.7 4.1 6.5 8.3
Vidyanagar 10.5 6.06 8.55 11.32 Dug Well Adhuru 10.9 6.75 8.06 Adhuru (R1) 8.06
Adkasthala 11.95 9.08 10.14 11.56 Adoor 12.65 7.07 10.9 11.65
Ambalathara 6.42 2.18 3.3 4.16 Anangoor 13.8 11.52 12.6 13.2 Angadimogar 11.85 5.63 8.4 9.96
Arladuka 18.35 13.1 13.48 14.51 Badiadka-R1 16.97 11.51 11.97 14.51
Bandadka 10.8 10.07 10.75 10.75
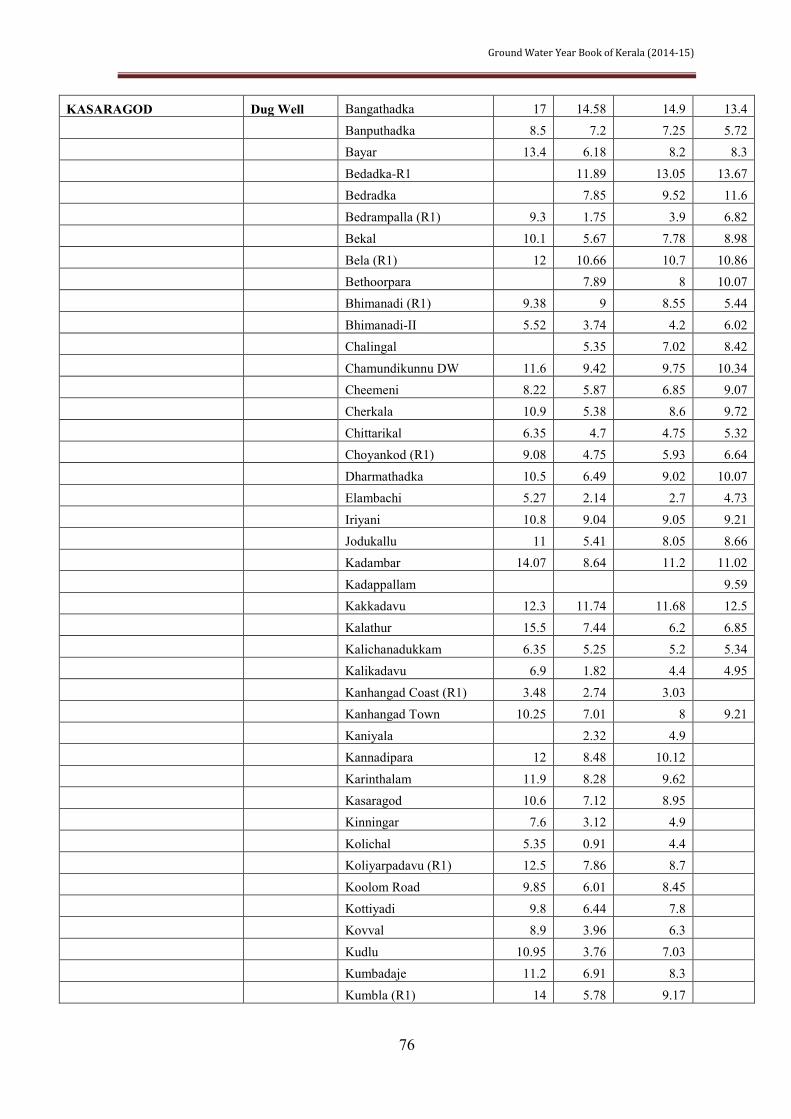
Ground Water Year Book of Kerala (2014-15)
76
KASARAGOD Dug Well Bangathadka 17 14.58 14.9 13.4 Banputhadka 8.5 7.2 7.25 5.72 Bayar 13.4 6.18 8.2 8.3
Bedadka-R1 11.89 13.05 13.67 Bedradka 7.85 9.52 11.6
Bedrampalla (R1) 9.3 1.75 3.9 6.82 Bekal 10.1 5.67 7.78 8.98
Bela (R1) 12 10.66 10.7 10.86 Bethoorpara 7.89 8 10.07 Bhimanadi (R1) 9.38 9 8.55 5.44
Bhimanadi-II 5.52 3.74 4.2 6.02 Chalingal 5.35 7.02 8.42
Chamundikunnu DW 11.6 9.42 9.75 10.34 Cheemeni 8.22 5.87 6.85 9.07 Cherkala 10.9 5.38 8.6 9.72
Chittarikal 6.35 4.7 4.75 5.32 Choyankod (R1) 9.08 4.75 5.93 6.64
Dharmathadka 10.5 6.49 9.02 10.07 Elambachi 5.27 2.14 2.7 4.73
Iriyani 10.8 9.04 9.05 9.21 Jodukallu 11 5.41 8.05 8.66 Kadambar 14.07 8.64 11.2 11.02
Kadappallam 9.59 Kakkadavu 12.3 11.74 11.68 12.5
Kalathur 15.5 7.44 6.2 6.85 Kalichanadukkam 6.35 5.25 5.2 5.34 Kalikadavu 6.9 1.82 4.4 4.95
Kanhangad Coast (R1) 3.48 2.74 3.03 Kanhangad Town 10.25 7.01 8 9.21
Kaniyala 2.32 4.9 Kannadipara 12 8.48 10.12
Karinthalam 11.9 8.28 9.62 Kasaragod 10.6 7.12 8.95 Kinningar 7.6 3.12 4.9
Kolichal 5.35 0.91 4.4 Koliyarpadavu (R1) 12.5 7.86 8.7
Koolom Road 9.85 6.01 8.45 Kottiyadi 9.8 6.44 7.8 Kovval 8.9 3.96 6.3
Kudlu 10.95 3.76 7.03 Kumbadaje 11.2 6.91 8.3
Kumbla (R1) 14 5.78 9.17

Ground Water Year Book of Kerala (2014-15)
77
KASARAGOD Dug Well Kundamkuzhy 7.47 2.12 3.85 Kuttikol 15.2 14.73 14.6 Madhur 16.1 8.38 4.9 6.34
Mandecap 8.35 4.16 5.92 Mangad 13 7.04 9.25 10.36
Mangalpady (R1) 12.75 7.24 10.4 11.7 Manjeswar 7.6 2.68 3.65 6.41
Mavinakatta 26.75 21.94 22.7 23.6 Mavungal 9.6 2.62 5.55 5.96 Melparamba 15.8 9.72 11.68 13.25
Miyapadavu 13.12 11.18 11.27 12.02 Mogral (R1) 11.45 2.2 7.45 10.54
Mogral Puthur 11.46 Movvar 14.32 13.9 14.19 Muligadde 9.64 5.05 8.47 8.99
Muliyar 7.05 5.02 5.75 6.32 Mulleria 17.1 17.38 17.5 18.2
Munnad 10.45 9.08 9.63 9.52 Naimarmoola 8.85 7.06 8.1 8.32
Nattakkal 12.6 12.2 11.8 13.72 Nellikatta 9.9 4.54 7.3 8.64 Nileshwar 5.9 1.92 3.75 4.91
Odayanchal 3.72 1.92 2.4 2.85 Pachambla 11 5.66 6.9 9.16
Padiyathadka 9.4 5.82 7.02 7.9 Paivalike 10.4 6.94 8.28 8.86 Pallam 10.1 5.16 7 8.87
Panathur 11.15 5.97 10.55 10.97 Parappa north 9.1 7.2 8.36 9.22
Peraladkam 6.95 3.29 6.21 6.99 Periyattadukkam 12.7 5.38 7.3 9.26
Periye 11.8 7.77 8.2 8.81 Perla 9.5 5.64 6.75 8.14 Poinachi-R1 14.45 13.47 13.45 14.24
Pookatta 16.85 7.51 8.5 11.21 Povval 13.3 11.64 12.5 12.71
Pullur 8.6 5.32 6.85 7.62 Putheriyadukkam 2.7 10.51 10.4 11.86 Puthige 12.6 5.46 7.6 9.05
Rajapuram 6.05 4.11 5.35 7.82
Sasthangode (Sastha Nagar) 25.2 19.73 21.15 23.36
Sorga 9.5 6.01 6.6 7.46
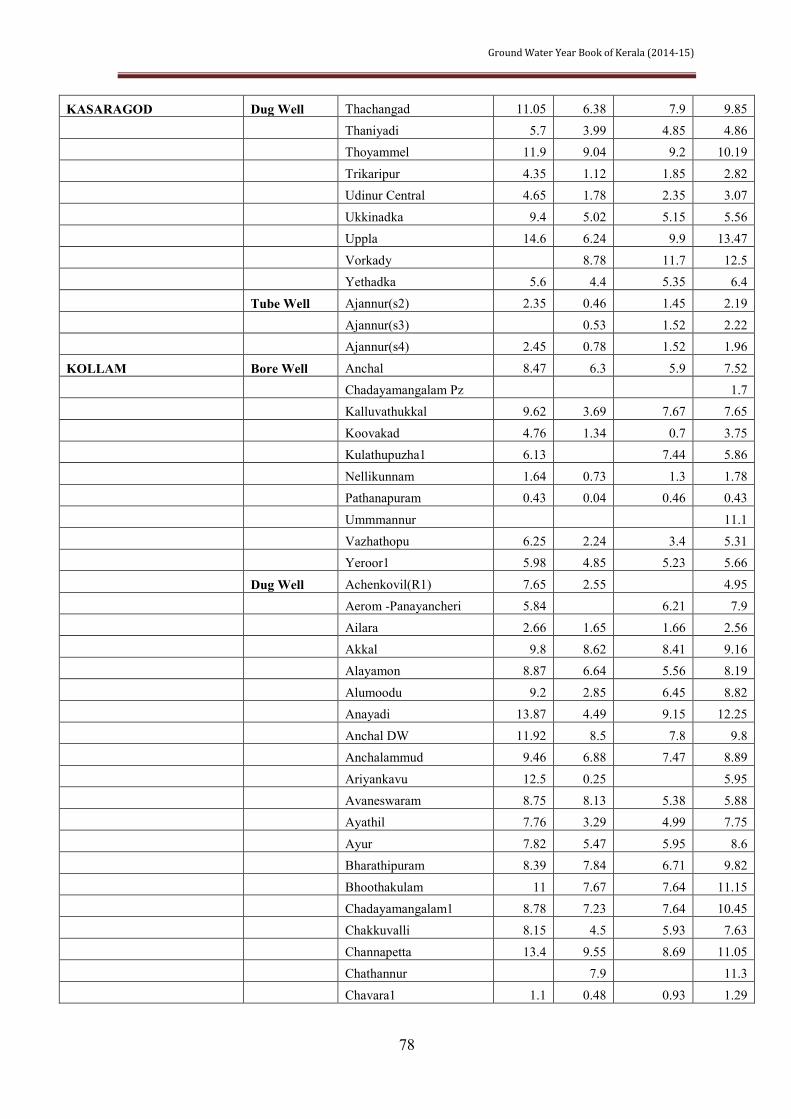
Ground Water Year Book of Kerala (2014-15)
78
KASARAGOD Dug Well Thachangad 11.05 6.38 7.9 9.85 Thaniyadi 5.7 3.99 4.85 4.86 Thoyammel 11.9 9.04 9.2 10.19
Trikaripur 4.35 1.12 1.85 2.82 Udinur Central 4.65 1.78 2.35 3.07
Ukkinadka 9.4 5.02 5.15 5.56 Uppla 14.6 6.24 9.9 13.47
Vorkady 8.78 11.7 12.5 Yethadka 5.6 4.4 5.35 6.4 Tube Well Ajannur(s2) 2.35 0.46 1.45 2.19
Ajannur(s3) 0.53 1.52 2.22 Ajannur(s4) 2.45 0.78 1.52 1.96
KOLLAM Bore Well Anchal 8.47 6.3 5.9 7.52 Chadayamangalam Pz 1.7 Kalluvathukkal 9.62 3.69 7.67 7.65
Koovakad 4.76 1.34 0.7 3.75 Kulathupuzha1 6.13 7.44 5.86
Nellikunnam 1.64 0.73 1.3 1.78 Pathanapuram 0.43 0.04 0.46 0.43
Ummmannur 11.1 Vazhathopu 6.25 2.24 3.4 5.31 Yeroor1 5.98 4.85 5.23 5.66
Dug Well Achenkovil(R1) 7.65 2.55 4.95 Aerom -Panayancheri 5.84 6.21 7.9
Ailara 2.66 1.65 1.66 2.56 Akkal 9.8 8.62 8.41 9.16 Alayamon 8.87 6.64 5.56 8.19
Alumoodu 9.2 2.85 6.45 8.82 Anayadi 13.87 4.49 9.15 12.25
Anchal DW 11.92 8.5 7.8 9.8 Anchalammud 9.46 6.88 7.47 8.89
Ariyankavu 12.5 0.25 5.95 Avaneswaram 8.75 8.13 5.38 5.88 Ayathil 7.76 3.29 4.99 7.75
Ayur 7.82 5.47 5.95 8.6 Bharathipuram 8.39 7.84 6.71 9.82
Bhoothakulam 11 7.67 7.64 11.15 Chadayamangalam1 8.78 7.23 7.64 10.45 Chakkuvalli 8.15 4.5 5.93 7.63
Channapetta 13.4 9.55 8.69 11.05 Chathannur 7.9 11.3
Chavara1 1.1 0.48 0.93 1.29
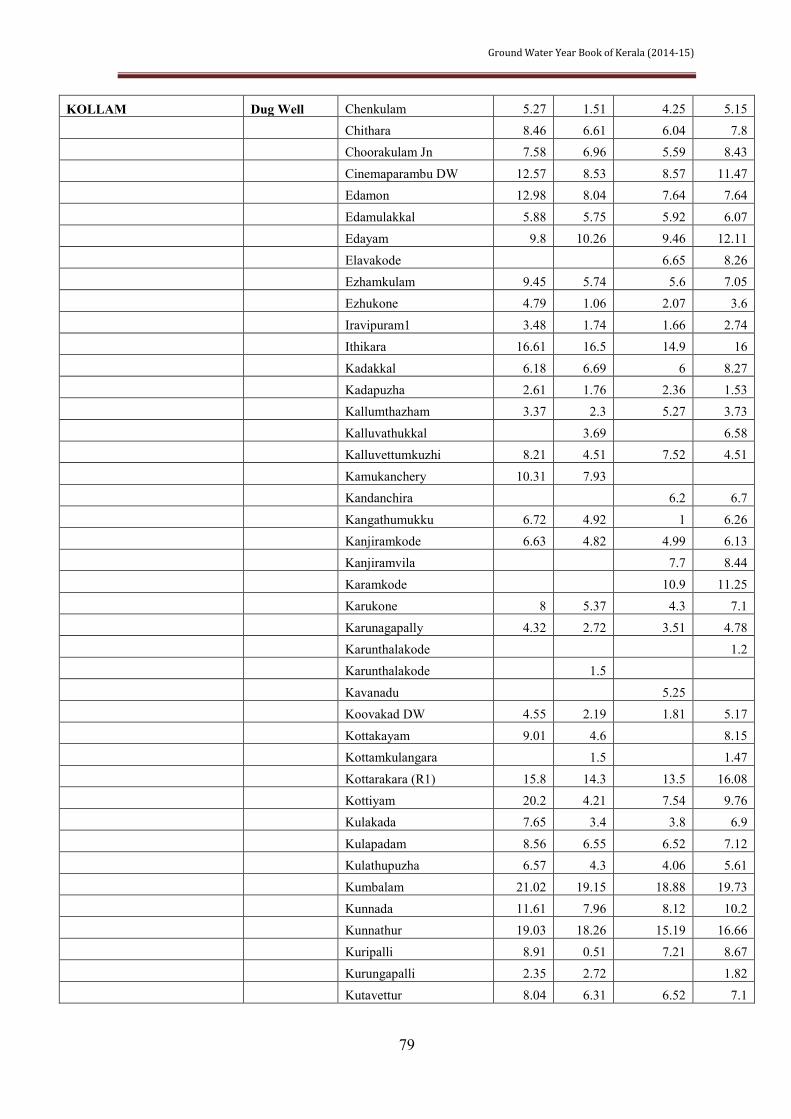
Ground Water Year Book of Kerala (2014-15)
79
KOLLAM Dug Well Chenkulam 5.27 1.51 4.25 5.15 Chithara 8.46 6.61 6.04 7.8 Choorakulam Jn 7.58 6.96 5.59 8.43
Cinemaparambu DW 12.57 8.53 8.57 11.47 Edamon 12.98 8.04 7.64 7.64
Edamulakkal 5.88 5.75 5.92 6.07 Edayam 9.8 10.26 9.46 12.11
Elavakode 6.65 8.26 Ezhamkulam 9.45 5.74 5.6 7.05 Ezhukone 4.79 1.06 2.07 3.6
Iravipuram1 3.48 1.74 1.66 2.74 Ithikara 16.61 16.5 14.9 16
Kadakkal 6.18 6.69 6 8.27 Kadapuzha 2.61 1.76 2.36 1.53 Kallumthazham 3.37 2.3 5.27 3.73
Kalluvathukkal 3.69 6.58 Kalluvettumkuzhi 8.21 4.51 7.52 4.51
Kamukanchery 10.31 7.93 Kandanchira 6.2 6.7
Kangathumukku 6.72 4.92 1 6.26 Kanjiramkode 6.63 4.82 4.99 6.13 Kanjiramvila 7.7 8.44
Karamkode 10.9 11.25 Karukone 8 5.37 4.3 7.1
Karunagapally 4.32 2.72 3.51 4.78 Karunthalakode 1.2 Karunthalakode 1.5
Kavanadu 5.25 Koovakad DW 4.55 2.19 1.81 5.17
Kottakayam 9.01 4.6 8.15 Kottamkulangara 1.5 1.47
Kottarakara (R1) 15.8 14.3 13.5 16.08 Kottiyam 20.2 4.21 7.54 9.76 Kulakada 7.65 3.4 3.8 6.9
Kulapadam 8.56 6.55 6.52 7.12 Kulathupuzha 6.57 4.3 4.06 5.61
Kumbalam 21.02 19.15 18.88 19.73 Kunnada 11.61 7.96 8.12 10.2 Kunnathur 19.03 18.26 15.19 16.66
Kuripalli 8.91 0.51 7.21 8.67 Kurungapalli 2.35 2.72 1.82
Kutavettur 8.04 6.31 6.52 7.1

Ground Water Year Book of Kerala (2014-15)
80
KOLLAM Dug Well Madathara 4.65 4.45 6.58 Manapalli 6.33 3.13 4.43 5.77 Mayyanad 6.16
Mayyanad 4.75 5.47 Meenad 6.05 3.56 4.56 5.31
Meenkulam 8.8 7.68 6.33 8.18 Mulavana 12.1 9.1 11.05
Muthukumel 6.64 4.24 4.26 6.33 Mynagapalli 10.82 5.23 7.1 8.53 Nallila 6.27 5.64 5.81 6.35
Nedungolam 12.48 3.84 7.03 9.3 Neendakara1 0.95 0.59 0.84 1.05
Nellikunnam DW 1.05 2.36 Nilamel 4.15 3.45 3.4 4.11 Oachira1 0.62 4.39 0.52 0.83
Odanavattom 7.65 4.09 4.33 5.51 Ottakal 6.84 6.27 5.12 7.25
Oyur 10.2 5.35 6.93 8.5 Palamoodu 9.82 3.4 7.85 11.44
Pallickal 6.77 4.43 3.35 5.75 Pangalukadu 5.98 6.13 5.39 6.52 Panmana-Manayil 3.38 0.99 1.55 2.62
Paripally1 12.38 4.9 8.92 8.98 Pattanapuram 11.15 8.04 6.73 9.14
Pavitreswaram 5.39 2.82 3.4 4.36 Perinad 6.98 5.81 6.17 7.55 Perumkulam 8.28 6.21 4.96 6.55
Pozhikara 6.14 3.8 4.8 5.75 Punalur-i1 10.23 8.97
Punnala (R1) 7.25 5.86 5.38 6.08 Puthiyathura 0.65 0.58 0.63
Quilon 8.12 7.13 7.4 8.32 Roduvila 8.82 4.68 6.49 7.72 Sasthamkottah (R1) 5.59 2.73 4.93 5.59
Sooranadu 6.38 3.58 4.68 5.61 Tadicaud 8.6 6.12 6.18 7.71
Tevalakara 8.06 7.12 8.13 2.71 Thattamala 2.85 1.28 1.38 2.88 Thenmala 6.39 6.2 7.03
Ummannur 9.8 6.86 6.79 8.45 Vadakkumthala west 2.29 0.75 1.42 2.02
Vallikavu 1.8 0.34 0.83 1.06

Ground Water Year Book of Kerala (2014-15)
81
KOLLAM Dug Well Vazhathoppu 7.95 4.25 5.12 7.13 Veliyam 12.07 7.12 7.04 9.03 Vendar 7.89
Vilakkupara 11.77 8.54 7.52 9.85 Yeroor 2.72 1.21 1.33 1.87
Tube Well Chavara-e 13.81 11.05 14.41 13.91 Chavara-n2 1.03
Chavara-n3 14.33 Chavara-west 1.9 1.68 1.78 1.86 Manappalli 12.32 12.38 16.1 17.2
Nallila1 6.07 7.35 7.03 7.5 Perinad1 34 32 33.3 34.3
Trikkadavur 15.45 10.37 9.68 13.58 Vayyankara 15.33 15.52 14.1 15.4 KOTTAYAM Bore Well Ettumannur 1.56 0.88 0.75 1.4
Kidangoor 7.62 4.68 5.7 6.8 Kuravilangad 5 1.98 3.03 4.33
Poonjar 5.63 2.1 3.53 5.73 Thrikodithanam 13.51 8.82 10.55
Dug Well Anandasram 8.19 9.76 7.65 10.45 Arunuttimangalam 6.39 5.75 5.82 5.77 Ayamkudi 12.14 6.05 7.25 9.45
Ayarkunnam 7.03 3.81 3.75 4.7 Brahmamangalam 10.7 6.25 6.6 8.2
Chamampathal 4.07 2.95 3.15 3.3 Changanasserry 2.92 1.72 1.96 2.41 Chempu 2.97 1.13 1.8 2.45
Chengalam South 1.01 1.08 1 1.25 Cheruthikara 4.94 3.05 4.05 5.3
Cheruvalli 6.02 5.48 5 5.95 Chotti 3.97 1 3.9 5.4
Chungam 3.72 Edakadathy 9.5 9.2 Edamaruku 4.82 1.76 3.3 4
Edinjillam 3.61 1.65 2 2.6 Elamkulam 4.44 1.89 3.3 3.47
Erumeli 4.42 2.25 3.7 4.9 Ethakuzhy ( Kallara) 3.53 1.62 2.4 2.95 Ettumannur East 3.89 2.83
Ettumannur East (R1) 5.55 7 Iykarakunnam 9.39 7.37 8.32 8.57
Kadaplamattom 5.37 5.07 5.35 5.5

Ground Water Year Book of Kerala (2014-15)
82
KOTTAYAM Dug Well Kaduthuruthi 6.51 5.97 5.37 5.87 Kalakatty 4.04 2.44 3.74 4.34 Kalathipady 8.72 6.85 8.7 9.5
Kalathur 6.17 7.44 6.2 6.85 Kangazha 6.48 5.18 5.7 6.35
Kanjirapally 8.98 3.88 4.44 8.1 Kidangur-R1 5.07 3.22 3.7 4.75
Kollappally 3.17 0.63 2.5 3.25 Kooroppada 4.49 3.3 3.8 4.3 Koothrappally 5.44 3.5 5.3 4.65
Kottayam1 12.77 9.39 10.74 11.44 Kozha 3.68 1.46 1.7 2.1
Kozhuvanal 4.86 2.88 4.48 4.68 Kudavechur 3.02 0.9 0.4 1.8 Kumarakom 1.18 0.16 0.45 1.05
Kummannur 7.36 5.18 5.25 5.5 Kuravilangad1 6.08 2.35 3.3 3.9
Kurichy (Sachivothamapuram) 8
Kuruppanthara 1.8 2
Kuttikal-R1 3.32 2.15 2.83 3.62 Kuvapalli 4.58 3.81 6.85 6.25
Madapally 2.61 1.11 1.4 1.85 Manimala 4.58 3.83 4.65 5.3
Mannanam 5.67 6.3 6.95 Marangattu palli 3.47 1.44 2.52 2.65 Melukavu Mattom 6.48 3.56 4.75 5.8
Monipalli 1.28 0.94 1.22 1.27 Mukkada 7.96 3.72 4.25 4.8
Mukkoottuthara 1.6 1.95 Mundakayam 9.12 0.95 4.15 5.65 Mundukuzhi 11.58 5.78 6.65 10.3
Mutholi 5.9 6.3 Narianganam 4.7 2.39 3.15 4.75
Nedumkunnam 5.3 5.5 Neendur 4.12 1.95 2.33 2.9
Paippad 9.23 6.46 7.25 8.15 Palai 6.04 3.33 4.67 5.17 Palamkadavu 2.35 1.21 1.56 2.2
Pallikathodu 7.51 2.35 Pallikkathodu (R1) 5.25 6.55
Pallom (nattagam) 7.47 4.79 5.05 6.85 Pambadi 5.96 7.16 8.2 8.2
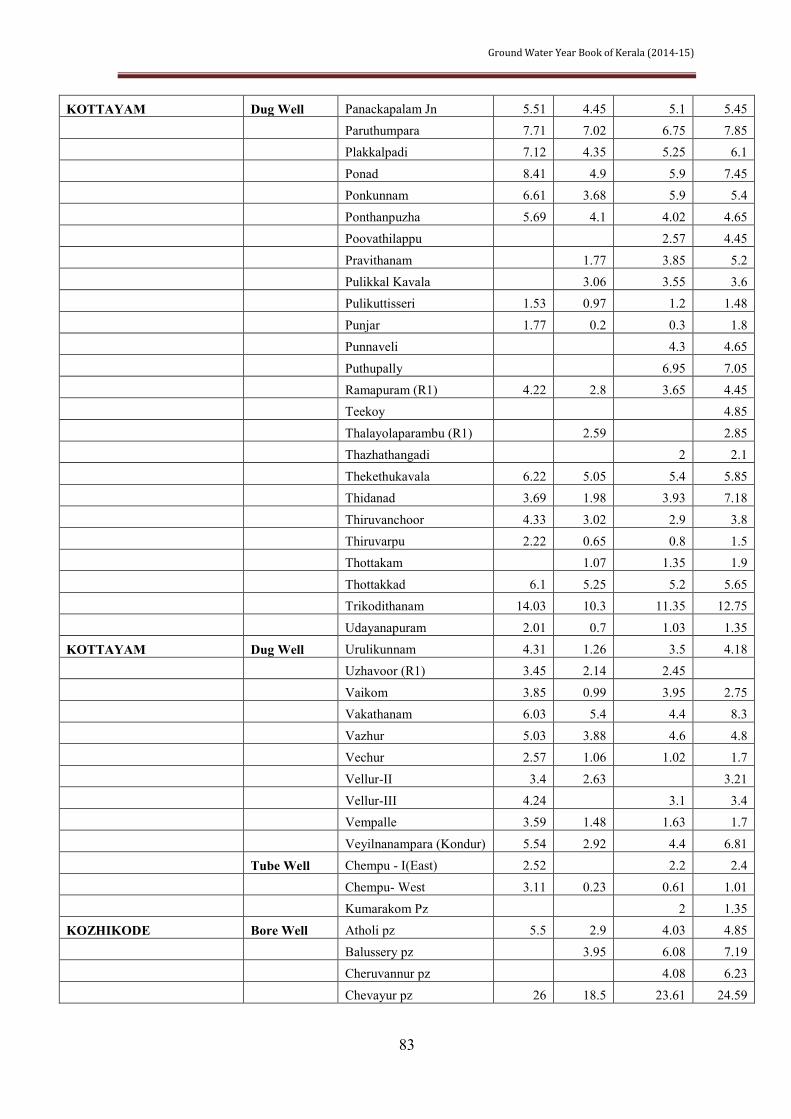
Ground Water Year Book of Kerala (2014-15)
83
KOTTAYAM Dug Well Panackapalam Jn 5.51 4.45 5.1 5.45 Paruthumpara 7.71 7.02 6.75 7.85 Plakkalpadi 7.12 4.35 5.25 6.1
Ponad 8.41 4.9 5.9 7.45 Ponkunnam 6.61 3.68 5.9 5.4
Ponthanpuzha 5.69 4.1 4.02 4.65 Poovathilappu 2.57 4.45
Pravithanam 1.77 3.85 5.2 Pulikkal Kavala 3.06 3.55 3.6 Pulikuttisseri 1.53 0.97 1.2 1.48
Punjar 1.77 0.2 0.3 1.8 Punnaveli 4.3 4.65
Puthupally 6.95 7.05 Ramapuram (R1) 4.22 2.8 3.65 4.45 Teekoy 4.85
Thalayolaparambu (R1) 2.59 2.85 Thazhathangadi 2 2.1
Thekethukavala 6.22 5.05 5.4 5.85 Thidanad 3.69 1.98 3.93 7.18
Thiruvanchoor 4.33 3.02 2.9 3.8 Thiruvarpu 2.22 0.65 0.8 1.5 Thottakam 1.07 1.35 1.9
Thottakkad 6.1 5.25 5.2 5.65 Trikodithanam 14.03 10.3 11.35 12.75
Udayanapuram 2.01 0.7 1.03 1.35 KOTTAYAM Dug Well Urulikunnam 4.31 1.26 3.5 4.18 Uzhavoor (R1) 3.45 2.14 2.45
Vaikom 3.85 0.99 3.95 2.75 Vakathanam 6.03 5.4 4.4 8.3
Vazhur 5.03 3.88 4.6 4.8 Vechur 2.57 1.06 1.02 1.7
Vellur-II 3.4 2.63 3.21 Vellur-III 4.24 3.1 3.4 Vempalle 3.59 1.48 1.63 1.7
Veyilnanampara (Kondur) 5.54 2.92 4.4 6.81 Tube Well Chempu - I(East) 2.52 2.2 2.4
Chempu- West 3.11 0.23 0.61 1.01 Kumarakom Pz 2 1.35 KOZHIKODE Bore Well Atholi pz 5.5 2.9 4.03 4.85
Balussery pz 3.95 6.08 7.19 Cheruvannur pz 4.08 6.23
Chevayur pz 26 18.5 23.61 24.59

Ground Water Year Book of Kerala (2014-15)
84
KOZHIKODE Dug Well Feroke pz 3.55 7.45 8.92 9.72 Kalikadavu pz 3.6 3.05 2.84 3.31 Karuvannur pz 1.25 0.47 0.78
Kokallur pz 8.25 6.75 7.03 7.03 Mavoor pz 4.43
Mavoor pz 5.63 Thodannur(east) 5.44 1.59
Thodannur(west) 5.31 5.82 Thuneri pz 5.12 2.6 3.55 4.06 Vellimadakunnu pz 13.4 7 20 19.5
Atholi 4.7 1.65 3 3.45 Badagara 5.76 3.94 4.81 5.44
Balusseri 7.38 2.43 5.46 7.08 Beypore 4.05 0.45 0.86 2.31 Bhumivathukkal 6.67 0.87 5.98 6.77
Calicut Beach 2.8 1.15 2.18 2.62 Chaliyam 0.9 1.47 2.64
Chelannur 1.6 0.4 0.34 0.99 Chelavur 5.9 2.4 8.5 9.37
Chemencheri 0.73 1.65 2.6 Cheruvannur West 5.3 2.5 3.25 4.14 Chevayur 13.65 8.05 9.75 12.16
Chiulavi (Niravamal) 7.41 Chulur 6.1 1.55 5.55
Devarkoil 6 4.7 7.07 8.2 Elattur 4.25 1.7 Elattur (R1) 0.25
Feroke DW 12.9 10.82 11.83 12.26 Kakkayam 3.55 2.7 3.21 3.2
Kakkur 6.8 2.45 3.99 5.24 Kallachi 1.3 0.7 0.8 1.52
Kannoor 4.39 4.6 Karaparamba 2.8 2 2.48 2.64 Kariyathumpara 2.9 1.85 3 2.88
Karuvannur 1.1 2.35 3.24 3.27 Kayapanachi 4.69 3 3.9 4.54
Kodencherry 1.08 1.17 Kodinattumukku 3.5 1.6 0.71 Koduvalli 8.95 2.05 6.17 7.85
Koduvalli North 4.23 Koodathumpara 3.7 0.37 0.42
Koothali 4.7 2.5 2.58 4.47

Ground Water Year Book of Kerala (2014-15)
85
KOZHIKODE Dug Well Kozhikode 16.4 8.7 10.41 13.09 Kunnamangalam 12.1 5.23 8.43 10.22 Kunnumakkara 1.28 1.82
Kurachund 4.2 3.95 5.32 5.38 Kuttampur 4.95 1.85 2.02
Kuttiyadi 7.3 6.4 7.88 7.67 Malayamma 5.2 1.02 1.22 4.55
Manassery 3.23 Mattanodu 9.2 6.7 8.14 8.75 Mavoor-i 5.35 2.75 6.53 5.24
Mavoor-ii 9.45 5.7 8.07 9.04 Melady 1 1.35 0.82 1.45
Meppayur 0.8 0.8 3.41 3.89 Moodali 1.97 Mukkali 5.27 2.23 3.53 4.48
Muliyangal 1.98 Murampathy 5.75
Nadapuram 1.3 1.86 2.77 Naduvannur 7.4 3.85 6.18 7.3
Nallalam 4.5 0.7 0.99 2.21 Nanminda 6.95 2.5 3.87 5.9 Narikunni 4.7 0.6 1 1.25
Nayarkuzhi 7.15 3.2 5.78 6.3 Orkattery 1.15 2.63
Pathimangalam 12.1 5.8 10.1 10.75 Pavangad 2.38 Perambra 5.4 1.15 2.26 6.82
Perumpally 3.45 Peruvayal 6.3 2.77 5.23 6.6
Pudukayam 9.16 6.8 7.08 7.87 Pudupadi 2.55 2.05 2.37 2.33
Pudupanam 3.5 4.5 5.38 Punnasseri 7.9 4.55 5.3 7.25 Puthur 8.4 5.35 6.64 7.57
Quilandy 3.13 4.64 5.5 Ramanattukara (R1) 0.85 1.69 2.07
Tamarasseri 1.72 0.77 1.19 1.13 Thenamkuzhi 1.4 1.56 2.97 Thikkodi 6.75 2 4.3 7.07
Thiruvallur 1.5 0.65 0.62 1.12 Thiruvambady 3.2 3.85
Thodannur 3.9 6.35 6.23

Ground Water Year Book of Kerala (2014-15)
86
KOZHIKODE Dug Well Tuneri1 4.47 3 3.49 3.96 Ulliyeri 3.6 1.55 2.48 3.08 Unnikulam 1.5 0.95 1.27 2.32
Valayam 8.13 4.5 5.92 6.47 Vattoli 4.6 2.5 3.7 4.81
Vellimadakunnu 13.3 7 13.42 12.97 Villyapalli 7.65 5.1 6.31 6.57
West Pudupadi 2.5 1.9 2.54 4.59 Tube Well Chombala(pz) 4.55 Chombala(w1) 5.21 1.65 3.11 4.08
Chombala(w2) 1.9 2.82 3.51 Chombala(w3) 5.03 1.5 3.04 4.29
Chombala(w4) 2.97 4.24 Meladi 0.17 0.86 1.38 MALAPPURAM Bore Well Anakkayam 7.9 4.8 7.02 7.52
Cherukulam 12 7.69 9.96 11.1 Edakkara 17.5 14.66 14.92 16.3
Kaladi1 9.94 6.85 7.09 7.55 Karavarakundu Pz 12.22 6.17 9.5 11.5
Karulayi 4.18 1.59 2.31 3.91 Karuvambram 20.25 Kavanur 7.47
Kizhakkumpuram 23.6 Narukara 4.74
Nediyirippu Pz 2.74 Othukkungal 34.14 19.2 26.9 Pandalur 9.9 5.66 6.84 9.2
Pangh 15.37 8.5 9.64 11.6 Parambilpeedika 24.74 25.29 22.69 26.4
Ponmala 13.01 5.51 9.42 Puzhakkattkiri 3.38 6.6 6.8
Thelakkad 20.52 10.82 Thiruvali 7.64 5.3 5.5 7.8 Thozhuvannur 25.22
Thuvur 11.41 6.91 8.04 9.81 Wandur Pz 16.4
Dug Well Akkaparamba 8.87 6.82 7.92 8.65 Amminikad 6.58 2.12 4.25 5 Anakkayam 8.26 3.77 5.64 7.52
Angadipuram 8.51 4.54 6.55 9.04 Arikode 4.7 0.65 8.31
Ariyallur 3.57 0.6 0.91 2.86

Ground Water Year Book of Kerala (2014-15)
87
MALAPPURAM Dug Well Athani 1.67 6.62 7.47 Athanikkal 6.12 0.56 3.56 4.5 Athirumada 13.27 11.7 11.95 13.39
Beeranchira 6.83 6.25 6.44 7.8
Buliyampadam (Velumbiampadam) 5.1 2 4 4.95
Chamravattom 1.67 0.2 0.4 1.52 Chemmalassery 5.4
Cherani 7.4 2 4.47 6.1 Cherukara 7.34 4.72 5.87 7.65
Cherukode 5.2 Cherukulam 11.7 7.69 9.96 11.1
Chokkad 1.3 2.35 4.3 Chungathara1 4.35 0.95 1.95 2.95 Edappal 14.36 10.2 11.2 13.07
Edavanna1 9.92 6 8.45 9.51 Edayur 8.02 3.8 6.7 7.8
Eriyad 4.87 2.1 2.85 3.3 Iswaramangalam 3.92 0.6 1.15 2.04 Kadalundi 5.01 3.05 3.61 4.6
Kadampuzha 10.46 7.75 9.58 10.42 Kadannamanna 7.54 3.09 3.56 6.2
Kadungapuram 9.74 7.4 8.4 Kalikavu 5.4 2.35 3.65 4.6
Kanjiramukku 6.97 2.9 4.15 5.72 Kariavattam 8.8 5.22 7 7.7 Karipol 11.07 9.07 9.35 9.6
Karulai 8.65 6.87 8.05 8.71 Karumbil 12.25 13.75
Karunechi 19.63 14.2 16.11 16.31 Karuvankallu 6.74 6.73 7.86 8.4 Karuvarakundu 3.41 1.37 2.05 3.05
Kattumunda (R1) 6.7 9.9 10.5 Kavanur1 9.5 5.95 7.86 9
Kizhumuri 12 7.9 9.95 12.45 Kondotty 4.67 0.89 1.5 3.54
Kottakkal 8.84 6.12 7.31 10 Kottapuram 7.27 5.92 5.2 8.56
Krishnapuram Puthentheru 4.29 0.72 1.46 3.6
Kulattur 1.45 3.1 6.12
Kuruva 9.92 10.77 13 Kuttipuram 0.42 0.9 3.5 Malappuram 11.6 6.25 7.66 11
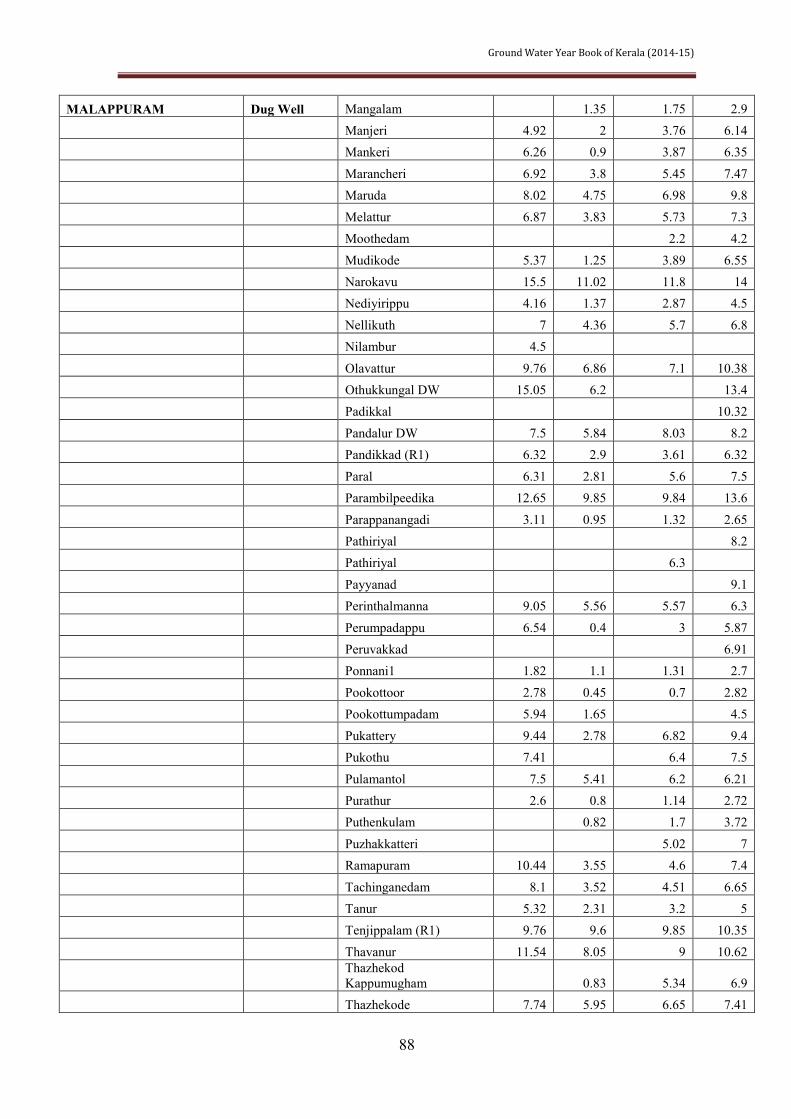
Ground Water Year Book of Kerala (2014-15)
88
MALAPPURAM Dug Well Mangalam 1.35 1.75 2.9 Manjeri 4.92 2 3.76 6.14 Mankeri 6.26 0.9 3.87 6.35
Marancheri 6.92 3.8 5.45 7.47 Maruda 8.02 4.75 6.98 9.8
Melattur 6.87 3.83 5.73 7.3 Moothedam 2.2 4.2
Mudikode 5.37 1.25 3.89 6.55 Narokavu 15.5 11.02 11.8 14 Nediyirippu 4.16 1.37 2.87 4.5
Nellikuth 7 4.36 5.7 6.8 Nilambur 4.5
Olavattur 9.76 6.86 7.1 10.38 Othukkungal DW 15.05 6.2 13.4 Padikkal 10.32
Pandalur DW 7.5 5.84 8.03 8.2 Pandikkad (R1) 6.32 2.9 3.61 6.32
Paral 6.31 2.81 5.6 7.5 Parambilpeedika 12.65 9.85 9.84 13.6
Parappanangadi 3.11 0.95 1.32 2.65 Pathiriyal 8.2 Pathiriyal 6.3
Payyanad 9.1 Perinthalmanna 9.05 5.56 5.57 6.3
Perumpadappu 6.54 0.4 3 5.87 Peruvakkad 6.91 Ponnani1 1.82 1.1 1.31 2.7
Pookottoor 2.78 0.45 0.7 2.82 Pookottumpadam 5.94 1.65 4.5
Pukattery 9.44 2.78 6.82 9.4 Pukothu 7.41 6.4 7.5
Pulamantol 7.5 5.41 6.2 6.21 Purathur 2.6 0.8 1.14 2.72 Puthenkulam 0.82 1.7 3.72
Puzhakkatteri 5.02 7 Ramapuram 10.44 3.55 4.6 7.4
Tachinganedam 8.1 3.52 4.51 6.65 Tanur 5.32 2.31 3.2 5 Tenjippalam (R1) 9.76 9.6 9.85 10.35
Thavanur 11.54 8.05 9 10.62
Thazhekod Kappumugham 0.83 5.34 6.9
Thazhekode 7.74 5.95 6.65 7.41

Ground Water Year Book of Kerala (2014-15)
89
MALAPPURAM Dug Well Thirunavaya 4.88 2.52 3.82 5 ThiruvaliDW 0.47 0.91 2 Thrikkalangode 4.21 0 1.6 4
Thuvur DW 5.95 8.25 10.81 Tirukkad 3.5 5.95 7.9
Tirur 14.24 10.6 14.36 10.81 Tirurangadi 12.12 13.65
Tripanchi 7.7 6.72 9.4 10.6 Uppada 4.11 0.7 1.5 3 Vadakkemanna 8.75 3.95 5.2 8.08
Valancheri 7.32 6.64 Valancheri R1 9.32 10.1
Valavannur 10.66 6.92 10.55 15.1 Valiyakunnu 9.25 Vallambur 8.7 4.67 6.96 8.3
Vaniyambalam 3.71 6.81 Vazhikadavu 7.45 3.81 3.83 4.61
Vellila1 4.4 6.1 7 Vengad 7.06 8.51 6.72 8.9
Vengad 7.06 3.38 6.72 8.9 Venniyur 9.45 Vettom1 3.78 2.2 1.86 2.9
Vylattur (R1) 10.45 8.2 9.91 12.4 Wandur 9.68 6.4 8.3 9.65
Tube Well Vettom 3.64 PALAKKAD Bore Well Cherpulassery Pz 22.5 8.66 7.34 18.27 Kadukkankunnu 3.03
Kallepully 5.54 Kanjikode(FCRI) 12.3 5.61 5.2 8.08
Kannadi 1.6 0.96 2.12 2.87 Karimpuzha 4.9 2.34 2.7 4.24
Koduvayur 8.62 2.42 5.78 5.35 Kongad 5.8 3 3.1 4.68 Kozhipara Pz 5.2 1.56 1 2.38
Kulapully Pz 19.74 Kunnamkattupathy Pz 9.62
Kunnissery 10.7 7.74 6.3 7.34 Lakkidi Thekkumangalam 17.5 9.6 14.8 17.08 Malampuzha Pz 7.87
Malampuzha1 5 1.72 4.4 5.08 Moochangundu 32.5 11.3 10.7 10.89
Mundur Pz 24 12.1 14.12 19.24

Ground Water Year Book of Kerala (2014-15)
90
PALAKKAD Bore Well Muttikulangara Pz 16.64 Nemmara1 3.36 Ottapalam Pz 32.5 28.9
Padur 17.4 14.5 18.2 16.17 Panayur(Athikodu) Pz 4.18
Pattambi Pz 8.4 5.6 6.8 6.97 Peringottukurissu 12.57 10.1 10.06 11.04
Perumatty 10.9 9.5 Plachimada 21.5 4.44 9.36 10.68 Pullundassery 5.2 2.16 2.26 2.68
Thenkara 2.31 0.64 1.26 1.15 Thirumittacode 27.6 17.9 10.46
Thiruveegapuram 13.54 11.1 10.1 10.42 Trithala Pz 4.9 7.3 7.67 4.23 Vadakarapathy Pz 16.69
Vadakkancherry1 12.9 7.72 9.08 10.16 Vadanamkurissu 11.12
Vaniyamkulam1 9.32 9.02 6.56 6.88 Vennakara 14.21
Villooni 62 24.15 11.12 20.17 Dug Well Adiparanda 8.55 3.51 4.24 6.26 Alanallur 10.21 6.16 7.16 8.32
Alathur 5.76 2.08 1.88 2.19 Ambalaparambu 1.02 1.32 0.92
Ambalappara 9.13 5.82 7.21 8.12 Ariyur 8.22 7.52 9.23 Ariyur (R1) 10.61 8.22 7.52 9.35
Athipetta 4.16 1.3 2.22 3.07 Banglow Kunnu 9.42 5.75 7.69 8.13
Chakkanthara 3.08 1.22 1.82 2.48 Chalisseri 10.1 5.66 7.72 8.98
Chemmampathi 10.83 4.55 4 6.3 Cherpulassery (R1) 10.05 7.65 8.16 9.35 Chittoor 5.99 2.3 3.81 4.05
Chulliar Dam 4.54 3.09 4.31 Chullimada 3.56 4.46 2.22
Chullimade 9.13 3.4 3.79 Chunangad 7.8 Dhoni 7.7 1.6 4.75 6.69
Ellissery 6.46 4.52 5.3 5.73 Eruthenpathi 2.78 3.72
Gopalapuram 13.72 6.54 5.92 8.4

Ground Water Year Book of Kerala (2014-15)
91
PALAKKAD Dug Well Kadampazhipuram 3.92 3.62 3.67 4.4 Kalladikode 8.26 3.44 6.08 8.36 Kambilichungam 4.24 0.88 1.08 2.54
Kanjikode 7.8 2.02 2.82 5.58 Kanjirapuzha 1.26 2.12 2.42
Kannadi 4.95 0.7 0.54 1 Kannimari 6.1 1.71 2.61 3.48
Karimpuzha 3.12 1.46 2.45 2.04 Kodavayur 6.88 2.36 2.81 4.52 Kodumbu 3.5
Kodunthirapalli 4.3 Kollengode 4.25 3 1.96 4.16
Kongad1 3.14 3.62 5.04 Kootanad 9.13 4.96 8.94 10.02 Koppam 6.04 3.57 4.4 5.53
Koppanur 2.99 Kottapuram 2.6 5.2 7
Kottassery (Vattassery) 2.62 3.52 Kottayi 2.6
Kozhinjampara 3.62 Kozhinjampara-R1 2.5 3.62 5.78 Kozhipara 5.8 2.14 1.92 2.9
Kudallur 7.8 4.61 4.76 6.06 Kullimattom 2.05 2.47 4.2
Kumaramputtur 3.6 1.16 2.04 4.02 Kumaranallur 10.26 7.52 9.07 9.82 Kunisseri 5.87 1 2.27 3.81
Kuzhalmannam 5.51 1.53 2.1 2.75 Malampuzha 3.36 1.42 1.75 1.68
Mankara 5.44 3.56 3.72 3.48 Mannarkkad 3.28
Mannarkkad (R1) 4.44 3.62 3.28 3.98 Mathur 3.62 Mattumanda 3.56 1.81 2.97 3.28
Meenakshipuram 6.78 2.7 2.95 5.48 Meenkara 6.6 1.2 1.52 4.07
Melarkode 7.56 4.45 7.11 7.53 Mochukundu 2.65 4.72 6.71 Mundur 4.62 0.44 1.25 2.86
Muthalamada1 7.2 3.06 3.13 4.28 Naikarapadi 5.98 6.97
Nellaya 5.82 2.82 7.92

Ground Water Year Book of Kerala (2014-15)
92
PALAKKAD Dug Well Nemmara 2.81 1.32 1.79 2.53 Odannur 7.4 2.5 4.96 4.06 Ongallur 5.65 6.77 7.9
Oothara 1.18 1.03 2.01 Ottapalam 9.2 5.16 7.79 7.38
Padur DW 7.02 3.24 4.02 4.15 Palakkad 6.02 1.3 1.97 2.52
Palamattom 4 5.38 7.62 Palappuram-ii 8.82 6.97 5.97 7.76 Palghat 9.3 3.8 5.72 7.52
Pallathery 5.25 1.86 1.85 1.43 Panayur 4.4 2.08 2.12 1.81
Pattambi 5.83 2.67 4.39 6.53 Pattanchery 3.93 1.61 2.78 2.03 Peringode 9.38 7.27 8.47 9.47
Peringottukurissu DW 6.33 3.46 3.58 4.07 Perumatty1 5.45 3.66 2.8 3.02
Pookkottukavu 5.58 Pudhunagaram 1.7 3.16 5.26
Pudhupariyaram 6.02 2.05 3.17 4.68 Pulpally 4.55 0.6 1.44 1.45 Punchapadam 8.49 6.04 6.32 6.82
Ramakrishnapady 8.73 5.02 4.26 7.51 Shoranur 6.22 5.27 5.27 6.13
Sreekrishnapuram 9.12 7.04 7.52 8.33 Tannirkod 7.65 7.79 Tannirkod 4.61
Tenkara 2.31 1.37 1.47 2.24 Thachanattukara 12.74 7.44 7.93 10
Thachanpara 2.61 0.74 1.24 1.71 Thirumittacode DW 2.16 4.44 5.63
Thiruvegapuram 9.22 7.38 7.44 7.81 Tholanur 3.87 2.3 3.1 2.42 Trittala 5.02 7.71 7.48 4.37
Ummini 6.3 3.22 4.67 4.55 Vadakkancherry 4.23 2.7 3.32 5.16
Vadanakkurissi 5.58 3.89 5.5 4.57 Vallapuzha 7.32 2.18 2.96 5.14 Vaniyamkulam 7.59 3.76 5.08 6.14
Vannamada 7.35 3.26 3.47 4.62 Velanthavalam 4.28 4.02 5.7
Vilayur 7.19 3.71 4.2 5.19

Ground Water Year Book of Kerala (2014-15)
93
PALAKKAD Dug Well Walayar 6.04 4.07 3.02 4.63 PATHANAMTHITTA Bore Well Chandanapally 1.43 0.29 Chetheckal 1.13 1.05 2.45
Elanthoor 1.75 1.8 1.9 3.9 Ezhamkulam 6.54 5.74 5.6 7.05
Kadumeenchira Pz 15.5 12.9 14.8 16.4 Kalleli Pz 4.21 2.65 4.75
Koipuram Pz 11.83 12.1 11.9 Kottangal Pz 2.24 9.2 2.6 Kunnamthanam 3.75 0.2 1.85 3.45
Malayalapuzha Pz 18.25 6.6 18.4 Manthanam 11.27 9.9
Ottathekku 5.34 0.9 4.15 5.25 Pandalam 3.05 3.85 4.15 Thayattumala 9.34 6.45 8.65 9.35
Vallicode 3.37 2.55 3.25 2.75 PATHANAMTHITTA Dug Well Adoor (R2) 9.26 2.32 9.05 8.8
Adoor Bypass 3.7 Angadikkal 7.2 8.2 9
Ankamuzhi 5.76 2.51 5.79 5.94 Aruvapulam 4.2 Athiringal (R1) 7.79 3.51 6.6 5.3
Chalapally 1.82 3.05 2.1 Cherukolpuzha (Airoor) 6 4 4.8
Chethekkal 1.88 1.75 2 2.5 Chittar (R1) 9.36 3.22 8.4 9.3 Churakod 7.08 3.7 5.4 6.2
Edakkulam 5.97 2.89 7.37 6.15 Elanthur 2.44 2.08 2.1 2
Elavumthitta 7.06 3.5 6.4 7 Enathu 8.65 3.4 4.55 7.35
Eraviperoor 2.85 1.25 5.25 6.1 Ezhamkulam 6.86 4.8 5.6 7.05 Ezhumattoor 3.83 3.85 3.8 4.7
Kadambanad 3.71 2.6 4.45 6.95 Kadammanitta 5.55 3.36 6.75 6.7
Kadumeenchira 9.22 4.6 5.8 7.5 Kaipattoor 6.8 Kalanjoor 5.69 2.65 3.45 7.65
Karikulam (R1) 2.34 1.6 3.8 3.6 Kaviyur (R1) 10.53 6.2 9.2 9.2
Kidanganoor 4.6 0.75 3.9 4.8

Ground Water Year Book of Kerala (2014-15)
94
PATHANAMTHITTA Dug Well Kodumon 4.2 6.3 Koipuram (R1) 6.92 2.97 7.3 8.47 Konni 5.2 3.15 4.05 5.25
Koodal 6.69 6.27 6.72 6.92 Kottanadu 3.7 2.25 5.25 3.65
Kottangal 1.47 1.77 3.05 1.9 Kozhenchery 1.84 1 1.6 3.1
Kuditha 8.87 Kulanada 7.8 4.65 Kumbanad 6.13 3.23 6.48 6.43
Kumplampoika 2.24 2 2 2.45 Kunnamthanam1 6.2 9.7 13.4
Kuttoor 3.22 1.47 3.3 3.92 Laha balawadi 2.3 2.4 2.4 2.9 Laha peruman 9.9 9.4 9.7 9.9
Malayalapuzha 5.28 3.7 5.65 6.6 Mallapally 4 3 4.15 4.65
Maniyar 4.91 2.4 5.2 4.7 Mannadi 3.16 0.85 1.4 2.3
Murani 2.87 2.8 2.3 Muthoor 4.17 1.5 2.75 3.7 Naduvathumuzhi 5.08 1.8 6.6
Naranganam (R1) 3.4 1.9 1.9 1.51 Nilakkal 5.75 4.47 5.47 5.47
Omallur(R1) 8.28 4.75 7.85 8.25 Pandalam Town 0.78 1.1 0.7 2.22 Pandalam-1 4.19 1.45 4.55 3.95
Paranthal 8.3 1.3 Pathanamthitta 1.53 1.45 3.75 4.75
Pattazhi 6.75 Peringara (R1) 2.22 0.5 1.6 1.85
Plappally 2.4 0.91 1.66 2.46 Podiyadi 3.1 0.5 3.65 2.1 Poothangara 5.2
Prakkanam 5.66 2.95 8.2 6.2 Pulikeezh 3.39 1.42 3.55 1.55
Pullad 6.02 3.1 7.1 7.32 Ranni i 5.74 2.3 1.5 3.15 Ranni perunad 6.73 5.85 6.25
Thadiyur 7.33 2.6 7.3 7.65 Thannithodu 6.04 3.2 6.2 7.1
Thatta (R1) 1.24 0.2 1.2 2.06

Ground Water Year Book of Kerala (2014-15)
95
PATHANAMTHITTA Dug Well Thelliyur 8.3 5 7.3 7.55 Thiruvalla 3.35 8.1 10.5 Thumpaman 8.04 4.15 7.6 8.45
Ullannur 6.67 4.3 7.1 7 V Kottayam 8.53 4.7 6.7 9.3
Vadasserikara 3.45 3.05 2.95 3.9 Vaipur 1.28 1.87 1.4 1.3
Valiakavu ( Vakayar) 3.4 Vallamkulam 5.06 2.45 4.05 5.35 Vallikod 4.4 2.6 4.1 4.9
Vechoochira 3.58 3.4 5.7 4.55 Vennikulam 3.34 2.85 3.55 3.55
THIRUVANANTHAPURAM Bore Well Aralumoodu Pz 40 Ariyanadu Pz 5.28 3.59 6.07 7.03 Attingal Pz 6.69 6.2 5.8 6.1
Chengal Pz 16.71 16.85 13.07 14.05 Kulathoor pz 16.26 16.8 12.2
Manambur Pz 12.78 10.68 11.97 12.02 Mangalapuram Pz 21 16.3 18.95 18.98
Mannanthala Pz 6.84 5.18 5.83 Mithranikethan Pz 10.5 8.03 9.66 Nemom Pz 14.05 13.55 3.95 3.57
Pattom Pz 8.84 6.8 8.1 7.53 Peringamala Pz 12.67 9.55 9.47 11.95
Perumkadavila Pz 10.41 7.72 7.65 Ponganadu Pz 7.4 6.3 2.55 Sreekariyam Pz 14 10.57 11.85
Thattattumala 7.37 6.89 5.57 5.77 Udayankulangara Pz 10.9
Udayankulangara Pz 10.85 Vazhakkad Pz 9.25 10.01 10.01
Vengod Pz 8.51 5.71 5.44 6.52 Vilappilsala Pz 9.17 6.69 6.58 9.07 Dug Well Amboori 9.45 6.3 7.33 9
Anappara 9.49 4 5.1 5.94 Anjengo 0.75 0.05 1.25 0.9
Aralumoodu 11.71 15.75 13.02 14.16 Ariyanadu 4.25 3.3 3.89 5.44 Arukannukuzhi 4.43 4.43 3.93 6.49
Aruvikara 4.15 1.5 1.99 2.63 Athazhamangalam 19.2 18 17.6 17.7
Attingal 11.73 9.2 8.45 9.95

Ground Water Year Book of Kerala (2014-15)
96
THIRUVANANTHAPURAM Dug Well Ayyankode 8.06 5.72 7.69 Azhoor 12.34 9.85 7.49 11.22 Balaramapuram(R1) 9.49 7.35 6.82 8.22
Bharathanoor 9.62 6.07 6.15 7.62 Changa 10.38 6.5 5.37 7.02
Chaykottukonam 7.92 5.8 5.77 7.3 Cheeranikara 4.7 5.29 7.32
Chembur 11.47 7.25 7.7 9.23 Chennampara 9.84 5.05 6.83 8.15 Cherunniyur 15.76 14.3 13.05 14.55
Chirayinkil 10.3 8.7 6.96 8.7 Chittagode 6.48 5.48 5.99 6.36
Chowara 19.9 Chullimanoor 6.17 4.15 4.85 6.43 Edavai 13.28 7.9 8.12
Ithye 6.26 4.5 7.13 7.74 Kadakkavur(R1) 4.5 2.7 2.55 3.3
Kallambalam(R1) 9.46 4.91 7.06 8.93 Kallar 2.21 3.6 4.08
Kallikkad 1.32 0.8 0.85 1.38 Kandala 12.15 8.75 9.8 10.5 Kanjiramkulam 60 55 60
Kanjiramkulam Church 21.36 Kappil 10.6 9.5 10.63 11.16
Karakulam 3.42 3.5 2.4 2.9 Kariavattom 4.42 2.65 2.7 3.14 Karinga 2.9 2.3 2.38 2.52
Kattakkada 5.5 2.15 2.75 4.08 Kazhakkuttom 3.8 2.55 2.63 2.8
Kilimannor 3.84 5.34 6.95 Kochuveli(R1) 2.53 1.7 2.36 2.95
Korani 7.92 6.95 6.4 6.38 Kulathur 12.44 10.76 9.81 10.76 Madavur 12.01 8.3 8.86 10.15
Malayadi 3.8 5.15 4.28 4.5 Mangalapuram 20.37 18.85 18.52 18.73
Mannanthala 8.04 5.5 6.3 7.6 Maruthamala 3.71 6.16 7.51 Meenangal 6.95 6.76 7.72
Melvettoor 35.25 35.95 33.75 33.05 Mulloor 20.81 14.66 24.85 20.2
Murukumpuzha(R1) 3.62 2.15 2.51 3.11
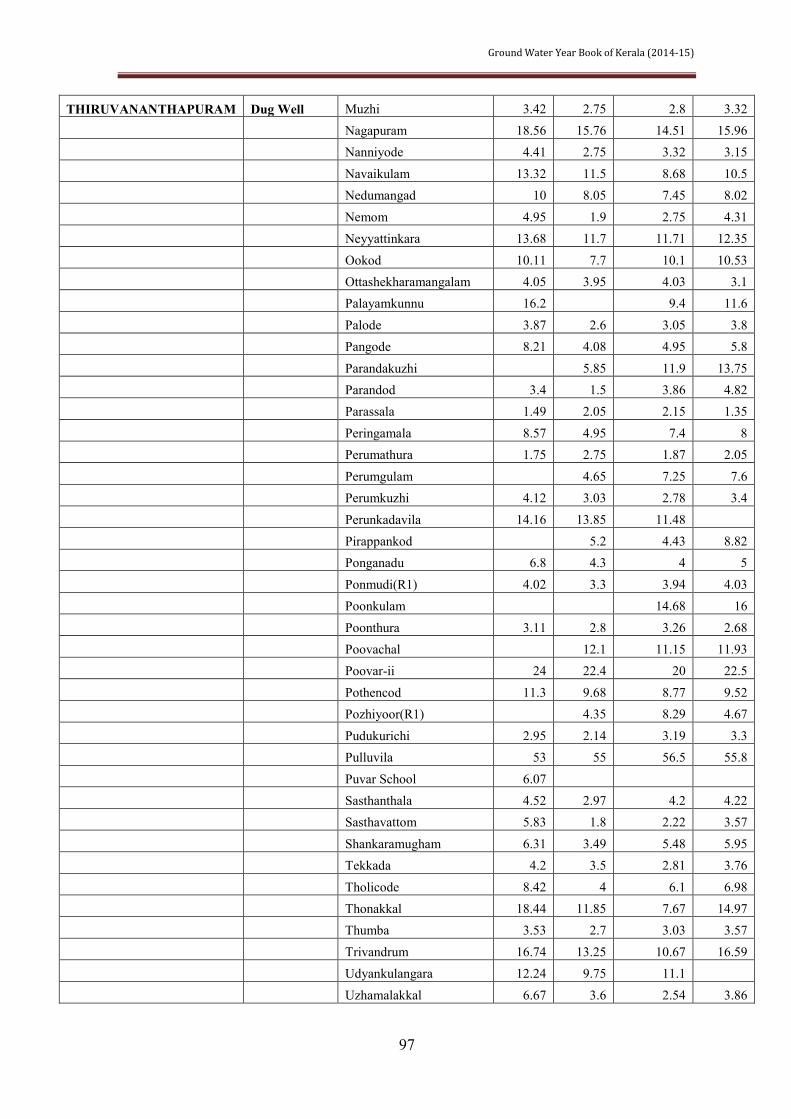
Ground Water Year Book of Kerala (2014-15)
97
THIRUVANANTHAPURAM Dug Well Muzhi 3.42 2.75 2.8 3.32 Nagapuram 18.56 15.76 14.51 15.96 Nanniyode 4.41 2.75 3.32 3.15
Navaikulam 13.32 11.5 8.68 10.5 Nedumangad 10 8.05 7.45 8.02
Nemom 4.95 1.9 2.75 4.31 Neyyattinkara 13.68 11.7 11.71 12.35
Ookod 10.11 7.7 10.1 10.53 Ottashekharamangalam 4.05 3.95 4.03 3.1 Palayamkunnu 16.2 9.4 11.6
Palode 3.87 2.6 3.05 3.8 Pangode 8.21 4.08 4.95 5.8
Parandakuzhi 5.85 11.9 13.75 Parandod 3.4 1.5 3.86 4.82 Parassala 1.49 2.05 2.15 1.35
Peringamala 8.57 4.95 7.4 8 Perumathura 1.75 2.75 1.87 2.05
Perumgulam 4.65 7.25 7.6 Perumkuzhi 4.12 3.03 2.78 3.4
Perunkadavila 14.16 13.85 11.48 Pirappankod 5.2 4.43 8.82 Ponganadu 6.8 4.3 4 5
Ponmudi(R1) 4.02 3.3 3.94 4.03 Poonkulam 14.68 16
Poonthura 3.11 2.8 3.26 2.68 Poovachal 12.1 11.15 11.93 Poovar-ii 24 22.4 20 22.5
Pothencod 11.3 9.68 8.77 9.52 Pozhiyoor(R1) 4.35 8.29 4.67
Pudukurichi 2.95 2.14 3.19 3.3 Pulluvila 53 55 56.5 55.8
Puvar School 6.07 Sasthanthala 4.52 2.97 4.2 4.22 Sasthavattom 5.83 1.8 2.22 3.57
Shankaramugham 6.31 3.49 5.48 5.95 Tekkada 4.2 3.5 2.81 3.76
Tholicode 8.42 4 6.1 6.98 Thonakkal 18.44 11.85 7.67 14.97 Thumba 3.53 2.7 3.03 3.57
Trivandrum 16.74 13.25 10.67 16.59 Udyankulangara 12.24 9.75 11.1
Uzhamalakkal 6.67 3.6 2.54 3.86

Ground Water Year Book of Kerala (2014-15)
98
THIRUVANANTHAPURAM Dug Well Vakkom 5.65 3.85 2.96 3.64 Valakkad 10.96 9.81 9.3 9.74 Vamanapuram 3.08 1.5 2.2 2.93
Varkala 15.21 11.36 12.86 13.54 Vattapara 11.02 8.55 7.43 8.51
Vattavila 7.99 7 10.05 8.46 Vazhichal 6.4 5.6 4.71 5.93
Veeranakavu 4.6 4.4 4.53 5.05 Vellanad 3.8 4.88 5.55 Vellarada(R1) 4.9 2.9 3.68 4.83
Venganoor 19.79 Vengod 6.7
Venjaramoodu 10.78 7.3 7.9 9.03 Venpakal 7.98 8.6 8.49 8.72 Veyloor 26.38 26.72 25.72 25.32
Vilapilshala 9.54 8 6.5 7.4 Vithura 8.32 6.22 7.42 8.86
Vizhinjam 0.95 1.05 1.12 0.88 THIRUVANANTHAPURAM Tube Well Edava 18 13.28 13.92 14.77
Tube Well Varkala Deep 18.85 20.65 19.75 20.05 Varkala(shallow) 18.27 16.52 16.58 17 THRISSUR Bore Well Arimpur 8 4.19 5.57 6.45
Ayyanthole 10.53 4.22 5.6 Chelakara Pz 7.09 2.96 3.6
Chowannur 19.83 19.5 16.33 21.69 Desamangalam 7.62 Kodakara 12.47 9.71
Madakkathara Pz 6.55 Mapranam 13.84 10.75 11.27 12.4
Palakal 11.29 7.21 8.36 10.37 Poyya (poopathy) 10.2 7.11 8 9.25
Ramavarmapuram 23.4 27.52 22.13 15.15 Vandarapalli 7.58 7.33 7.9 Velloor 6.84 14.05
Velur 6.51 10.15 13.97 Dug Well Adatt 12.75 11.35 11.62 12.02
Akalad 4.03 2.71 2.95 3.6 Amballur 7.28 5.35 6.97 7.4 Annamanda 5 2.88 3.32 4.4
Arimpur1 4.02 3.25 3.25 3.25 Athani 8 1.67 6.62 7.47
Athani Parambu 1.54

Ground Water Year Book of Kerala (2014-15)
99
THRISSUR Dug Well Attoor 7.59 6.8 7.68 Ayyanthole DW 11.82 7.65 9.95 11.8 Azhikode 1.51 0.54
Azhikode1 1.81 1.33 1.29 1.79 Chalakudi 9.22 7.44 8.05 8.58
Chammannur 3.99 2.24 2.17 3.55 Chavakkad 5.07 1.22 1.24 2.22
Chelakara 6.82 2.15 2.02 3.55 Chelakod 3.43 1.85 2.25 2.37 Cherenkonam 6.06 3.12 3.87 4.99
Cherpu 9.65 6.45 6.97 7.52 Cherukunnu 5.65 2.35 3.3 4.62
Cheruthuruthi (R1) 6.4 Cheruthuruthi1 5.43 Choondal 9.32 6.77 7.7 8.62
Deshamangalam 7.9 Deshamangalam 6.67
Dyyal Ambalam Jn 6.7 8.05 8.62 East Fort 8.55 6.48 7.88 8.32
Echipara 7.5 3.55 1.98 2.88 Edamuttom 3.06 0.15 0.64 1.42 Edathrinji 0.84 0.57 0.68 0.85
Engandiyur-R1 3.87 1.8 1.91 2.8 Eriyad 1.85 2.1 1.19 3.3
Eriyad1 1.85 1.35 Erumapetty 9.78 5.67 5.91 7.33 Guruvayur 1.74 1.24 0.92 2.26
Irinjalakuda 8.84 2.95 6.42 7.65 Irinjalakuda1 4.67 3.35 3.97 5.32
Kallettumkara 4.26 3.93 4.54 4.1 Kallumpuram 8.41 7.3 7.55 8.3
Kallur 9.65 7.05 7.7 7.95 Kanjirapally 4.75 3.88 4.44 4.55 Kannara 5.65 7.6 4.95
Karikkad 8.79 4.18 6.77 7.75 Karuppadanna 3.26 0.56 0.8 1.73
Kattakampala 13.76 10.58 10.75 11.25 Kattoor 8.18 3.12 4.07 5.6 Keecheri 8.6 6.94 7.1 7.75
Killimangalam 7.43 6.3 5.73 7 Kizhakkumuri 6.84 6.53 6.65 7.15
Kodacherry 1.48 2.59 3 1.28
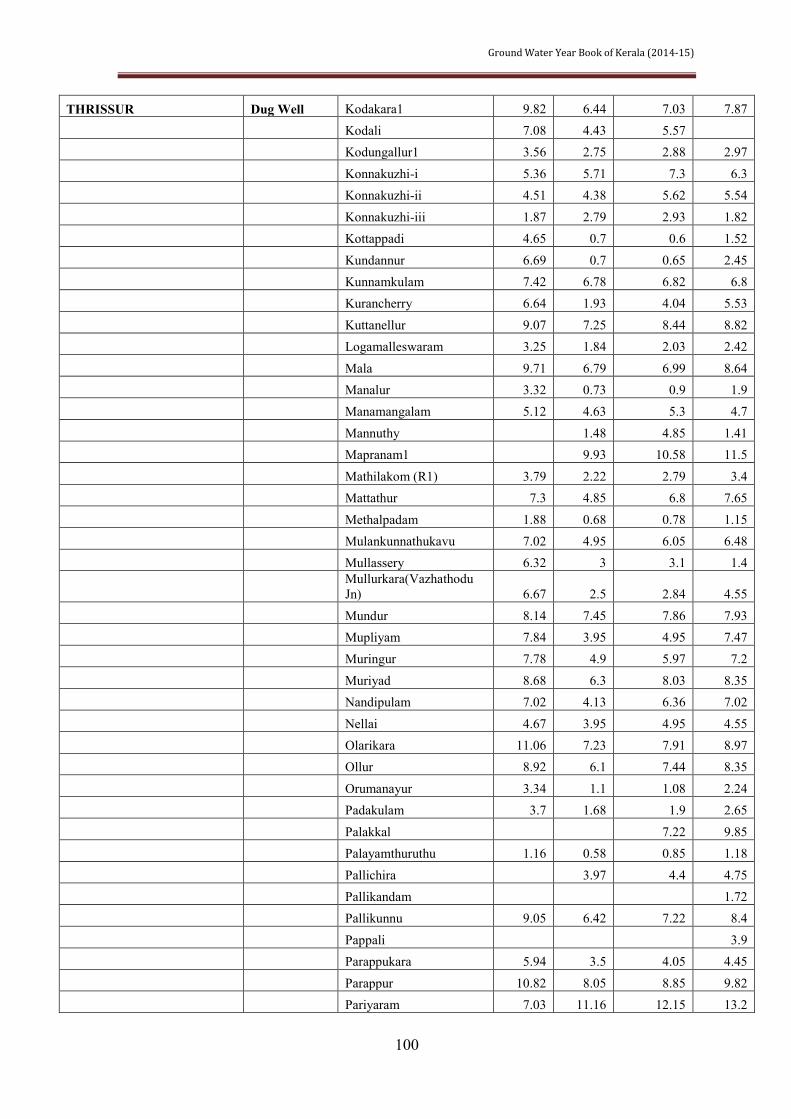
Ground Water Year Book of Kerala (2014-15)
100
THRISSUR Dug Well Kodakara1 9.82 6.44 7.03 7.87 Kodali 7.08 4.43 5.57 Kodungallur1 3.56 2.75 2.88 2.97
Konnakuzhi-i 5.36 5.71 7.3 6.3 Konnakuzhi-ii 4.51 4.38 5.62 5.54
Konnakuzhi-iii 1.87 2.79 2.93 1.82 Kottappadi 4.65 0.7 0.6 1.52
Kundannur 6.69 0.7 0.65 2.45 Kunnamkulam 7.42 6.78 6.82 6.8 Kurancherry 6.64 1.93 4.04 5.53
Kuttanellur 9.07 7.25 8.44 8.82 Logamalleswaram 3.25 1.84 2.03 2.42
Mala 9.71 6.79 6.99 8.64 Manalur 3.32 0.73 0.9 1.9 Manamangalam 5.12 4.63 5.3 4.7
Mannuthy 1.48 4.85 1.41 Mapranam1 9.93 10.58 11.5
Mathilakom (R1) 3.79 2.22 2.79 3.4 Mattathur 7.3 4.85 6.8 7.65
Methalpadam 1.88 0.68 0.78 1.15 Mulankunnathukavu 7.02 4.95 6.05 6.48 Mullassery 6.32 3 3.1 1.4
Mullurkara(Vazhathodu Jn) 6.67 2.5 2.84 4.55
Mundur 8.14 7.45 7.86 7.93 Mupliyam 7.84 3.95 4.95 7.47 Muringur 7.78 4.9 5.97 7.2
Muriyad 8.68 6.3 8.03 8.35 Nandipulam 7.02 4.13 6.36 7.02
Nellai 4.67 3.95 4.95 4.55 Olarikara 11.06 7.23 7.91 8.97 Ollur 8.92 6.1 7.44 8.35
Orumanayur 3.34 1.1 1.08 2.24 Padakulam 3.7 1.68 1.9 2.65
Palakkal 7.22 9.85 Palayamthuruthu 1.16 0.58 0.85 1.18
Pallichira 3.97 4.4 4.75 Pallikandam 1.72 Pallikunnu 9.05 6.42 7.22 8.4
Pappali 3.9 Parappukara 5.94 3.5 4.05 4.45
Parappur 10.82 8.05 8.85 9.82 Pariyaram 7.03 11.16 12.15 13.2

Ground Water Year Book of Kerala (2014-15)
101
THRISSUR Dug Well Pattikad 1.59 1.54 Pavaratty1 3.57 0.92 1.39 2.4 Pazhayannur 6.39 2.1 4.27 5.81
Pazhuvil 10.38 7.56 9.14 9.82 Perambra 6.44 4.99 2.26 6.82
Perinjanam (R1) 2.27 1.47 0.95 2.1 Perumpilavu Junction 9.96 6.82 9.26 9.8
Potta 2.55 2.05 3.02 1.25 Poyya 13.92 7.53 8.04 12.6 Pudukad1 2.94 1.73 1.93 2.4
Pullikanni 3.92 0.46 1.12 1.95 Punnayoor 5.42 2.55 2.9 4.22
Puthenchira 9.95 7.64 8.2 8.75 Ramanchetty 5.87 3.1 3.83 4.47 Tekkumkara 8.37 5.55 6.15 7.35
Trichur 7.02 6.04 6.33 6.88 Triprayar 4.38 1.95 2.65 3.4
Vadanapalli 1.54 Vaniyampara 5.52 1.17 2.09 3.82
Varavur 6.65 4.75 6.4 6.25 Vellanikara 4.16 1.59 2.33 2.9 Vellikulangara 5.27 4.4 5.05 4.7
Vellur 8.7 6.15 6.5 6.8 Velupadam 5.88 3.38 4.3
Vettikkattiri 7.5 2.02 4.92 7.07 Viyyur 4.87 1.92 2.25 2.4 Wadakkanchery 11.86 9 10.4
Tube Well Arattukadavu 1.34 0.73 0.83 Engandiyur1 4.67 2.64 2.72
WAYANAD Bore Well Kottathara 3.8 3.15 3.49 3.53 Kuppadi(east) 19.7 17.4 15.31 15.33
Pookode 2.3 1.4 2.41 2.2 Poothady 8.15 5.72 Pozhutana1 2.8 2.94 3.27
Ullissery(w) 1.4 0.33 0.67 Valliyurkavu(e) 2.15 0.32 1.2 1.16
Valliyurkavu(w) 2.1 0.45 1.22 1.23 Dug Well Ambalavayal 7.9 3.15 9.12 9.07 Appapara 5.85 2.15 3.02 3.4
Arimula 9.2 5.85 8.04 7.38 Baveli 5.12
Begur 8.8 8.55 8.24 8.5

Ground Water Year Book of Kerala (2014-15)
102
WAYANAD Dug Well CC Junction 9.52 9.78 Cheenkeri 7.75 4.9 5.52 6.83 Chellakod 7.1 7.49
Chenad 15.7 15.7 14.41 14.18 Cheyyambam 2.6 1 1.92 3.7
Chulliyod 11.66 12.59 Dasanakkara 2.7 2.5 4.24 5.15
Kalpetta-R1 2.85 1.05 2.39 2.9 Kamblakat 16.9 13.25 15.62 16.16 Kanjirangad 1.87
Kappiset 6.09 8 Karani 6.26 6.57
Kattikulam 4.4 7.09 4.32 6.45 Kavumandam 5.9 5.4 5.58 5.62 Kellur -5th Mile 14.2 0.9 4.75 6.89
Koliyadi 2.85 0.82 1.21 1.37 Koodal Kadavu 15.6 13.6 14.78 15.1
Koroth 3.45 1.75 2.56 2.71 Kottathara 3.8 3.15 4.06 4.48
Kottavayal 4.2 4.03 Krishnagiri 4.75 0.77 3.75 4.2 Kuppadi 16.5 15.4 14.34 14.74
Lakkidi 1.4 0.65 0.94 1.18 Mampayil 2.48 0.7 2.76 2.91
Manjapara 9.6 5.37 6.39 7.1 Mannanthody 7.65 4.1 6.13 6.93 Melaputhenkunnu 13.75 11.55 11.99 12.23
Meppady 17.8 14.2 16.82 17.56 Minangadi 5.75 3.95 5.37 1.17
Moolankavu 7.35 4.83 5.32 6.17 Mullankolly 2.62
Muthunga 3.65 2.66 2.61 Muttil 2.65 1.15 2.07 2.03 Nadavayal 6.7 2.75 3.89 4.17
Naykatti 5.45 4.37 4.52 Nedugarana 8.45 6.3 6.87 7.5
Neervaram 14.85 9.36 12.52 13.79 Nenmeni Kunnu 2.2 1.6 2.03 2.28 Noolpuzha 2.11
Noolpuzha (R1) 3.25 1.45 2.31 2.76 Ondyangadi 7.7 6.8 9.57 10.02
Pachilakkad 7.07

Ground Water Year Book of Kerala (2014-15)
103
WAYANAD Dug Well Padinjarattara 8.85 4.6 7.73 Pakkam 4.58 Panamaram 3.65 2.55 2.82 2.9
Pattanikoopu 9.1 5.4 6.12 7.1 Perikallur 13 5.4 7.82 10.32
Perya 5.5 1.12 5.28 5.31 Pookode1 2.25 1.05 2.26 2.45
Pozhutana 6.4 5.58 6.31 6.17 Pulpally 1.6 0.6 1.44 0.4 Punchvayal 11 5.5 7.68 8.6
Puthadi 10.2 Puthadi 4.4
Sulthan Battery 7.1 2.1 3.82 6.88 Talapuzha 2.2 0.5 1.12 1.2 Taruvana 10.6 6.4 8.38 9.1
Thetrode 11.3 7.75 9.06 9.7 Thirunelly 6.45 3.9
Thirunelly (R1) 5.95 1 4.83 5.26 Tholpetty 8.6 4.7 3.11 4.52
Thonichal 5.92 2.72 4.9 5.01 Ullisseri 3.2 0.45 1.13 1.54 Uppupara 6.97
Vaduvanchal 9.15 7.75 8.29 8.44 Valad (R1) 10.01
Valatt 10.8 4.45 9.78 Vallathur 1.35 1.1 1.12 1.38 Vallithodu (Periye) 7.65
Varayal 4.05 1.75 4.23 3.99 Vayittiri 7.5 6.4 7.22 7.1
Vellamunda 5.4 6.75 4.58 4.83 Vengapalli 14.7 8.7 12.83 14.2
Vilambukandam 14.85
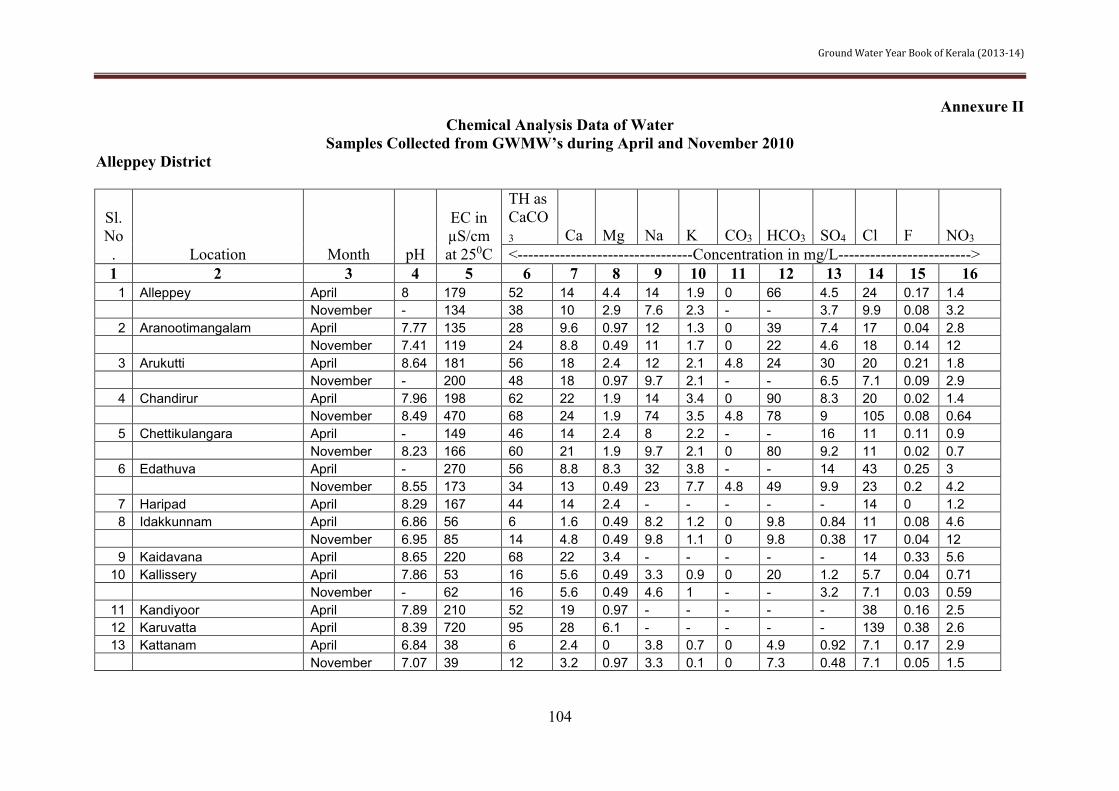
Ground Water Year Book of Kerala (2013-14)
104
Annexure II Chemical Analysis Data of Water
Samples Collected from GWMW’s during April and November 2010 Alleppey District
Sl. No. Location Month pH
EC in µS/cm at 250C
TH as CaCO3 Ca Mg Na K CO3 HCO3 SO4 Cl F NO3 <---------------------------------Concentration in mg/L------------------------->
1 2 3 4 5 6 7 8 9 10 11 12 13 14 15 16 1 Alleppey April 8 179 52 14 4.4 14 1.9 0 66 4.5 24 0.17 1.4
November - 134 38 10 2.9 7.6 2.3 - - 3.7 9.9 0.08 3.2 2 Aranootimangalam April 7.77 135 28 9.6 0.97 12 1.3 0 39 7.4 17 0.04 2.8
November 7.41 119 24 8.8 0.49 11 1.7 0 22 4.6 18 0.14 12 3 Arukutti April 8.64 181 56 18 2.4 12 2.1 4.8 24 30 20 0.21 1.8
November - 200 48 18 0.97 9.7 2.1 - - 6.5 7.1 0.09 2.9 4 Chandirur April 7.96 198 62 22 1.9 14 3.4 0 90 8.3 20 0.02 1.4
November 8.49 470 68 24 1.9 74 3.5 4.8 78 9 105 0.08 0.64 5 Chettikulangara April - 149 46 14 2.4 8 2.2 - - 16 11 0.11 0.9
November 8.23 166 60 21 1.9 9.7 2.1 0 80 9.2 11 0.02 0.7 6 Edathuva April - 270 56 8.8 8.3 32 3.8 - - 14 43 0.25 3
November 8.55 173 34 13 0.49 23 7.7 4.8 49 9.9 23 0.2 4.2 7 Haripad April 8.29 167 44 14 2.4 - - - - - 14 0 1.2 8 Idakkunnam April 6.86 56 6 1.6 0.49 8.2 1.2 0 9.8 0.84 11 0.08 4.6
November 6.95 85 14 4.8 0.49 9.8 1.1 0 9.8 0.38 17 0.04 12 9 Kaidavana April 8.65 220 68 22 3.4 - - - - - 14 0.33 5.6
10 Kallissery April 7.86 53 16 5.6 0.49 3.3 0.9 0 20 1.2 5.7 0.04 0.71 November - 62 16 5.6 0.49 4.6 1 - - 3.2 7.1 0.03 0.59
11 Kandiyoor April 7.89 210 52 19 0.97 - - - - - 38 0.16 2.5 12 Karuvatta April 8.39 720 95 28 6.1 - - - - - 139 0.38 2.6 13 Kattanam April 6.84 38 6 2.4 0 3.8 0.7 0 4.9 0.92 7.1 0.17 2.9
November 7.07 39 12 3.2 0.97 3.3 0.1 0 7.3 0.48 7.1 0.05 1.5
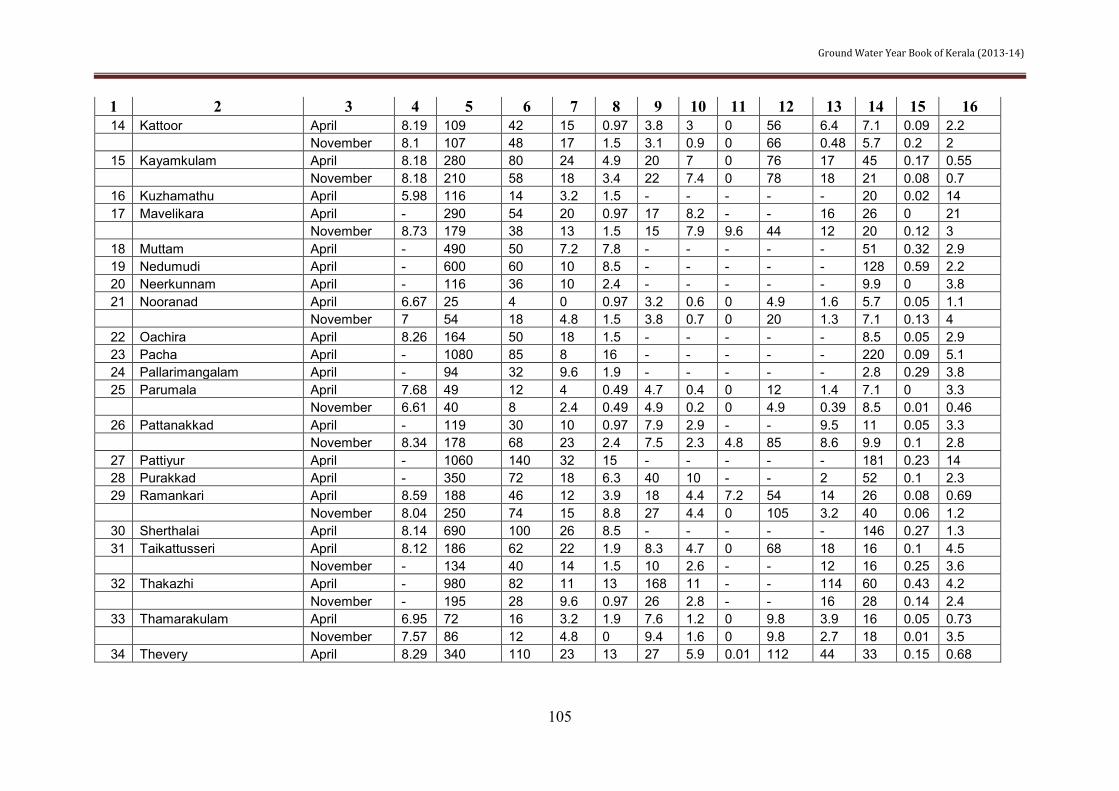
Ground Water Year Book of Kerala (2013-14)
105
1 2 3 4 5 6 7 8 9 10 11 12 13 14 15 16 14 Kattoor April 8.19 109 42 15 0.97 3.8 3 0 56 6.4 7.1 0.09 2.2
November 8.1 107 48 17 1.5 3.1 0.9 0 66 0.48 5.7 0.2 2 15 Kayamkulam April 8.18 280 80 24 4.9 20 7 0 76 17 45 0.17 0.55
November 8.18 210 58 18 3.4 22 7.4 0 78 18 21 0.08 0.7 16 Kuzhamathu April 5.98 116 14 3.2 1.5 - - - - - 20 0.02 14 17 Mavelikara April - 290 54 20 0.97 17 8.2 - - 16 26 0 21
November 8.73 179 38 13 1.5 15 7.9 9.6 44 12 20 0.12 3 18 Muttam April - 490 50 7.2 7.8 - - - - - 51 0.32 2.9 19 Nedumudi April - 600 60 10 8.5 - - - - - 128 0.59 2.2 20 Neerkunnam April - 116 36 10 2.4 - - - - - 9.9 0 3.8 21 Nooranad April 6.67 25 4 0 0.97 3.2 0.6 0 4.9 1.6 5.7 0.05 1.1
November 7 54 18 4.8 1.5 3.8 0.7 0 20 1.3 7.1 0.13 4 22 Oachira April 8.26 164 50 18 1.5 - - - - - 8.5 0.05 2.9 23 Pacha April - 1080 85 8 16 - - - - - 220 0.09 5.1 24 Pallarimangalam April - 94 32 9.6 1.9 - - - - - 2.8 0.29 3.8 25 Parumala April 7.68 49 12 4 0.49 4.7 0.4 0 12 1.4 7.1 0 3.3
November 6.61 40 8 2.4 0.49 4.9 0.2 0 4.9 0.39 8.5 0.01 0.46 26 Pattanakkad April - 119 30 10 0.97 7.9 2.9 - - 9.5 11 0.05 3.3
November 8.34 178 68 23 2.4 7.5 2.3 4.8 85 8.6 9.9 0.1 2.8 27 Pattiyur April - 1060 140 32 15 - - - - - 181 0.23 14 28 Purakkad April - 350 72 18 6.3 40 10 - - 2 52 0.1 2.3 29 Ramankari April 8.59 188 46 12 3.9 18 4.4 7.2 54 14 26 0.08 0.69
November 8.04 250 74 15 8.8 27 4.4 0 105 3.2 40 0.06 1.2 30 Sherthalai April 8.14 690 100 26 8.5 - - - - - 146 0.27 1.3 31 Taikattusseri April 8.12 186 62 22 1.9 8.3 4.7 0 68 18 16 0.1 4.5
November - 134 40 14 1.5 10 2.6 - - 12 16 0.25 3.6 32 Thakazhi April - 980 82 11 13 168 11 - - 114 60 0.43 4.2
November - 195 28 9.6 0.97 26 2.8 - - 16 28 0.14 2.4 33 Thamarakulam April 6.95 72 16 3.2 1.9 7.6 1.2 0 9.8 3.9 16 0.05 0.73
November 7.57 86 12 4.8 0 9.4 1.6 0 9.8 2.7 18 0.01 3.5 34 Thevery April 8.29 340 110 23 13 27 5.9 0.01 112 44 33 0.15 0.68
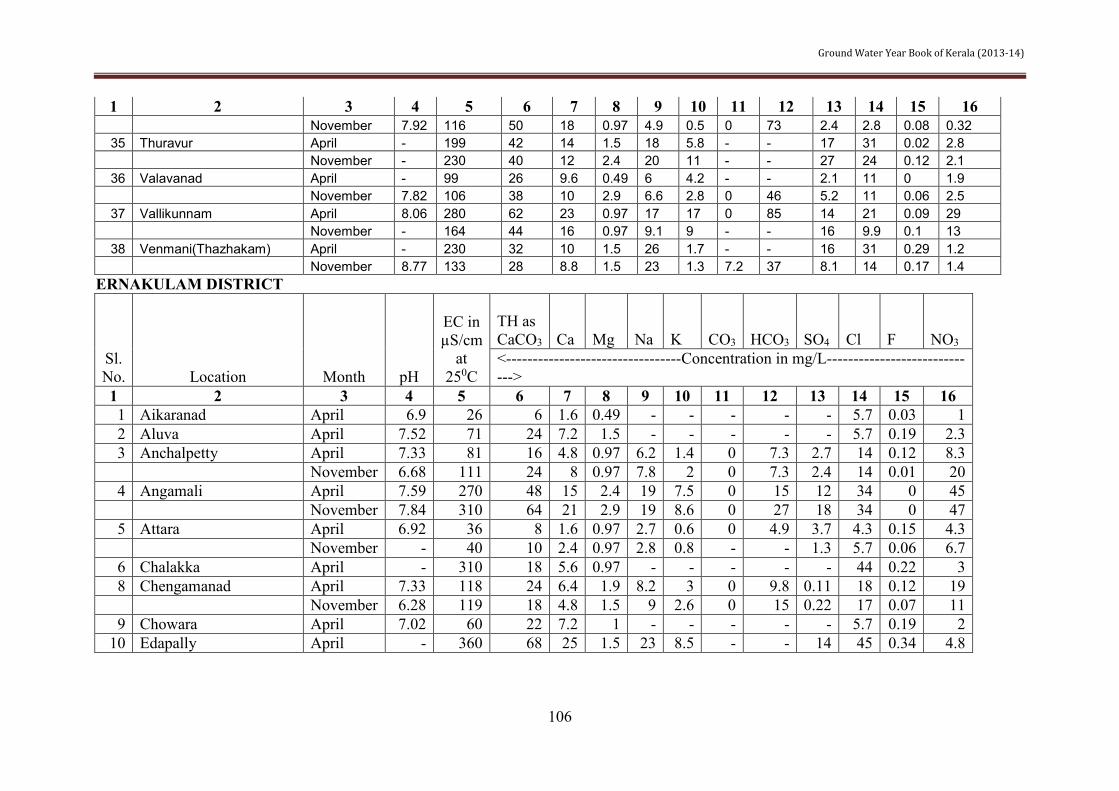
Ground Water Year Book of Kerala (2013-14)
106
1 2 3 4 5 6 7 8 9 10 11 12 13 14 15 16 November 7.92 116 50 18 0.97 4.9 0.5 0 73 2.4 2.8 0.08 0.32
35 Thuravur April - 199 42 14 1.5 18 5.8 - - 17 31 0.02 2.8 November - 230 40 12 2.4 20 11 - - 27 24 0.12 2.1
36 Valavanad April - 99 26 9.6 0.49 6 4.2 - - 2.1 11 0 1.9 November 7.82 106 38 10 2.9 6.6 2.8 0 46 5.2 11 0.06 2.5
37 Vallikunnam April 8.06 280 62 23 0.97 17 17 0 85 14 21 0.09 29 November - 164 44 16 0.97 9.1 9 - - 16 9.9 0.1 13
38 Venmani(Thazhakam) April - 230 32 10 1.5 26 1.7 - - 16 31 0.29 1.2 November 8.77 133 28 8.8 1.5 23 1.3 7.2 37 8.1 14 0.17 1.4
ERNAKULAM DISTRICT
Sl. No. Location Month pH
EC in µS/cm
at 250C
TH as CaCO3 Ca Mg Na K CO3 HCO3 SO4 Cl F NO3 <---------------------------------Concentration in mg/L----------------------------->
1 2 3 4 5 6 7 8 9 10 11 12 13 14 15 16 1 Aikaranad April 6.9 26 6 1.6 0.49 - - - - - 5.7 0.03 1 2 Aluva April 7.52 71 24 7.2 1.5 - - - - - 5.7 0.19 2.3 3 Anchalpetty April 7.33 81 16 4.8 0.97 6.2 1.4 0 7.3 2.7 14 0.12 8.3
November 6.68 111 24 8 0.97 7.8 2 0 7.3 2.4 14 0.01 20 4 Angamali April 7.59 270 48 15 2.4 19 7.5 0 15 12 34 0 45
November 7.84 310 64 21 2.9 19 8.6 0 27 18 34 0 47 5 Attara April 6.92 36 8 1.6 0.97 2.7 0.6 0 4.9 3.7 4.3 0.15 4.3
November - 40 10 2.4 0.97 2.8 0.8 - - 1.3 5.7 0.06 6.7 6 Chalakka April - 310 18 5.6 0.97 - - - - - 44 0.22 3 8 Chengamanad April 7.33 118 24 6.4 1.9 8.2 3 0 9.8 0.11 18 0.12 19
November 6.28 119 18 4.8 1.5 9 2.6 0 15 0.22 17 0.07 11 9 Chowara April 7.02 60 22 7.2 1 - - - - - 5.7 0.19 2
10 Edapally April - 360 68 25 1.5 23 8.5 - - 14 45 0.34 4.8

Ground Water Year Book of Kerala (2013-14)
107
1 2 3 4 5 6 7 8 9 10 11 12 13 14 15 16 November - 176 - - - - - - - - - - - 12 Edakkattuvayal April 7.53 57 10 3.2 0.49 - - - - - 5.7 0.08 3.1 13 Elur North April - 2000 155 26 22 - - - - - 576 0.56 3.5 14 Illithode November - 133 32 12 0.49 3.8 0.9 - - 1.9 7.1 0.06 3.4 15 Koothattukulam April 7.25 65 20 5.6 1.5 3.1 1.1 0 9.8 1.8 8.5 0.1 1.8
November 7.41 172 30 9.6 1.5 11 13 0 20 7.5 21 0.04 21 16 Kothamangalam November 7.25 67 16 5.6 0.49 5.2 1.5 0 15 2.7 8.5 0 4.9 17 Kottapuram April 7.87 121 24 7.2 1.5 8.2 4.4 0 24 12 13 0.16 0.86
November - 167 36 13 0.97 12 5 - - 13 17 0.03 2.2 18 Kumbalangi April - 173 24 9.6 0 13 5.4 - - 15 14 0.16 1.4
November 8.84 280 122 46 1.9 3.9 2.4 9.6 122 6.6 4.3 0.15 3.4 19 Malayattur April 7.26 83 22 5.6 1.9 - - - - - 7.1 0.2 3.6 20 Malipuram April 8.26 240 74 25 2.9 16 2.7 0 85 3.1 30 0.25 3
November - 280 46 16 1.5 10 3.7 - - 3.7 20 0.12 1.6 21 Mallussery April 6.89 122 14 4.8 0.49 11 3.1 0 4.9 1.1 23 0.23 14
November 6.65 90 14 4 0.97 7.5 2.4 0 2.4 0 17 0.07 9.4 22 Mulanthuruthi April 7.48 58 16 5.6 0.49 3.3 1.2 0 20 2 7.1 0.12 0.19
November 7.43 131 24 9.6 0 10 1.3 0 9.8 2.2 18 0.19 23 23 Munambam April - 380 60 13 6.8 41 8.2 - - 31 68 0.36 2.9
November - 360 78 28 1.9 5.7 2.1 - - 0 2.8 0.37 3.4 24 Muvattupuzha April 8.59 240 70 20 4.9 5.1 10 4.8 34 30 17 0.02 8.6
November 7.7 230 78 23 4.9 6.8 7.9 0 46 23 16 0.12 17 25 Neriyamangalam April 8.03 88 32 10 1.5 1.9 1.1 0 34 0.97 7.1 0.03 0.55
November 7.2 68 22 7.2 0.97 2.7 1.4 0 20 1.5 4.3 0 6.8 26 Oonukkal April 8.98 290 66 14 7.8 28 2.4 12 56 53 4.3 0.27 0.53
November 6.87 86 26 8 1.5 3.2 1.2 0 4.9 5.7 9.9 0 18 27 Pambukuda April 7.33 83 16 5.6 0.49 6.1 4.3 0 7.3 3.4 11 0.11 16
November 7.53 80 18 4.8 1.5 4.7 3.2 0 9.8 1.7 9.9 0.19 13 28 Palakuzha North
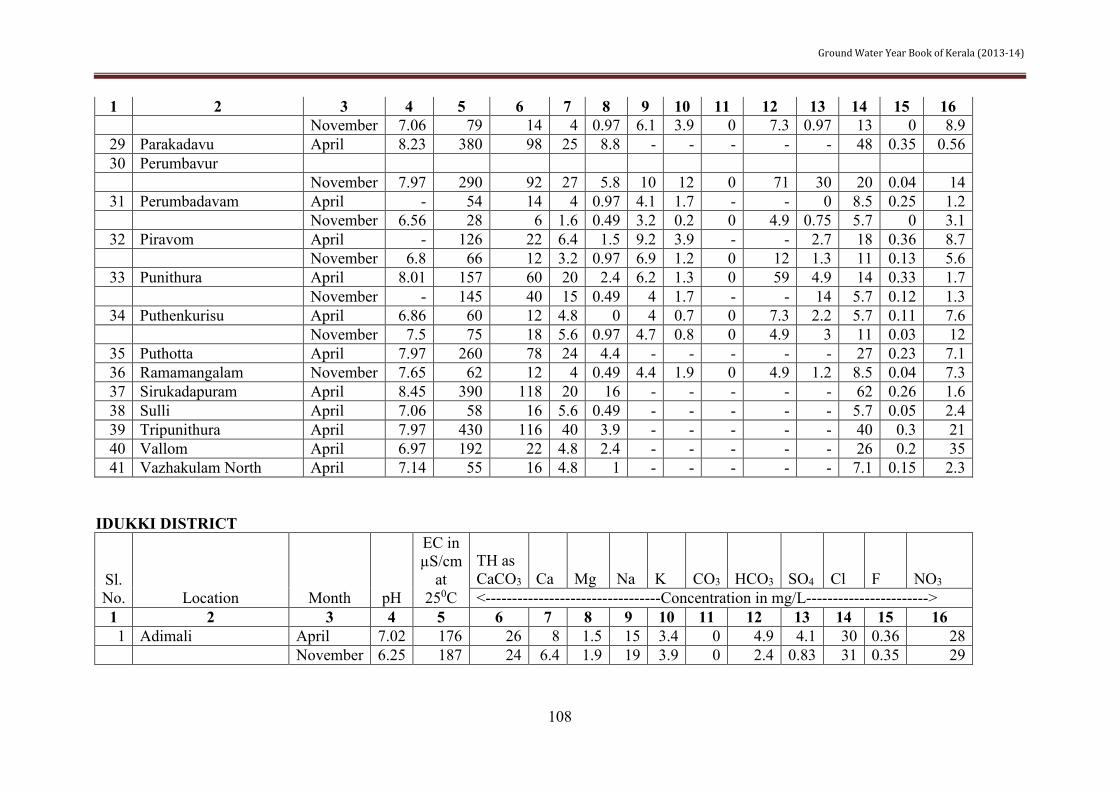
Ground Water Year Book of Kerala (2013-14)
108
1 2 3 4 5 6 7 8 9 10 11 12 13 14 15 16 November 7.06 79 14 4 0.97 6.1 3.9 0 7.3 0.97 13 0 8.9 29 Parakadavu April 8.23 380 98 25 8.8 - - - - - 48 0.35 0.56 30 Perumbavur
November 7.97 290 92 27 5.8 10 12 0 71 30 20 0.04 14 31 Perumbadavam April - 54 14 4 0.97 4.1 1.7 - - 0 8.5 0.25 1.2
November 6.56 28 6 1.6 0.49 3.2 0.2 0 4.9 0.75 5.7 0 3.1 32 Piravom April - 126 22 6.4 1.5 9.2 3.9 - - 2.7 18 0.36 8.7
November 6.8 66 12 3.2 0.97 6.9 1.2 0 12 1.3 11 0.13 5.6 33 Punithura April 8.01 157 60 20 2.4 6.2 1.3 0 59 4.9 14 0.33 1.7
November - 145 40 15 0.49 4 1.7 - - 14 5.7 0.12 1.3 34 Puthenkurisu April 6.86 60 12 4.8 0 4 0.7 0 7.3 2.2 5.7 0.11 7.6
November 7.5 75 18 5.6 0.97 4.7 0.8 0 4.9 3 11 0.03 12 35 Puthotta April 7.97 260 78 24 4.4 - - - - - 27 0.23 7.1 36 Ramamangalam November 7.65 62 12 4 0.49 4.4 1.9 0 4.9 1.2 8.5 0.04 7.3 37 Sirukadapuram April 8.45 390 118 20 16 - - - - - 62 0.26 1.6 38 Sulli April 7.06 58 16 5.6 0.49 - - - - - 5.7 0.05 2.4 39 Tripunithura April 7.97 430 116 40 3.9 - - - - - 40 0.3 21 40 Vallom April 6.97 192 22 4.8 2.4 - - - - - 26 0.2 35 41 Vazhakulam North April 7.14 55 16 4.8 1 - - - - - 7.1 0.15 2.3
IDUKKI DISTRICT
Sl. No. Location Month pH
EC in µS/cm
at 250C
TH as CaCO3 Ca Mg Na K CO3 HCO3 SO4 Cl F NO3 <---------------------------------Concentration in mg/L----------------------->
1 2 3 4 5 6 7 8 9 10 11 12 13 14 15 16 1 Adimali April 7.02 176 26 8 1.5 15 3.4 0 4.9 4.1 30 0.36 28
November 6.25 187 24 6.4 1.9 19 3.9 0 2.4 0.83 31 0.35 29

Ground Water Year Book of Kerala (2013-14)
109
1 2 3 4 5 6 7 8 9 10 11 12 13 14 15 16 2 Anakkara April 7.63 91 30 10 0.97 2.7 1.6 0 37 2.4 5.7 0.16 4.4
November 7.74 100 38 14 0.97 3.1 1.7 0 54 0.46 5.7 0.46 2.8 3 Chinikuzhi April 7.33 91 26 8.8 0.97 - - - - - 7.1 0.12 2.4 4 Churuli April 8.44 105 38 10 2.9 5 1.2 4.8 46 2 7.1 0.13 0
November 7.64 74 22 5.6 1.9 5 1.2 0 39 1 4.3 0.52 0.77 5 Elapara April 6.97 176 38 11 2.4 8.9 3.6 0 20 3.2 24 0.11 22
November 7.52 149 38 12 1.9 8.9 4.7 0 37 4.4 18 0.45 10 6 Idukki April 7.63 64 14 4.8 0.49 4.7 1.2 0 22 2 7.1 0.18 0.84
November 7.21 58 12 3.2 0.97 5.9 0.9 0 20 1 7.1 0.44 3.2 7 Kaliyar April 7.13 198 44 11 3.9 12 5.4 0 22 11 26 0.15 27
November 7 210 48 12 4.4 13 6.6 0 12 3 30 0.48 42 8 Kanchiyar April 7.68 271 96 13 16 4.7 2.6 0 76 0.94 27 0.32 28
November 7.91 153 56 14 5.4 6.4 1.8 0 73 0 13 0.57 6.1 9 Karimkunnam April 7.42 251 58 17 3.9 11 7.1 0 39 8.9 28 0.16 26
November 7.19 66 14 4 0.97 4.5 4.1 0 22 2.9 7.1 0.45 5.2 10 Karumannoor April 7.36 115 28 8 1.9 - - - - - 18 0 4.2 11 Kattapana April 5.32 749 130 28 15 52 16 0 0 1.2 107 0.18 173
November 4.71 590 104 24 11 46 20 0 0 0.37 89 0.78 133 12 Koilkadavu April 7.77 246 66 17 5.8 13 4.6 0 68 13 26 0.33 11
November 7.89 270 74 18 7.3 19 5.7 0 66 11 27 0.74 31 13 Kulamavu April 7.42 156 32 7.2 3.4 11 2 0 12 0.29 24 0.09 31
November 6.49 116 24 4.8 2.9 7.3 2.9 0 4.9 0 17 0.48 30 14 Kumili April 8.19 520 140 26 18 - - - - - 78 0.36 10 15 Kuttikanam April 6.81 49 14 3.2 1.5 2.3 1.6 0 9.8 1.7 5.7 0.1 5.1
November 6.97 54 12 4 0.49 3.1 2.2 0 9.8 1.5 7.1 0.44 7.6 16 Marykulam April 7.16 64 18 3.2 2.4 3.5 2.5 0 17 1 8.5 0.14 9.3
November 7.42 47 12 3.2 0.97 3.8 0.9 0 17 0 7.1 0.38 0 17 Moolamattom April 7.29 128 34 10 1.9 6.7 0.7 0 27 4.7 14 0.17 15
November 7.15 80 24 5.6 2.4 5.3 0.6 0 20 0.93 9.9 0.44 10

Ground Water Year Book of Kerala (2013-14)
110
1 2 3 4 5 6 7 8 9 10 11 12 13 14 15 16 18 Munnar April 7.33 80 18 5.6 0.97 4.8 3 0 15 1.3 8.5 0.25 16
November 7.29 97 20 6.4 0.97 6.7 2.7 0 20 1.5 11 0.48 12 19 Nedumkandam April 7.3 298 72 22 3.9 18 3.1 0 61 4.7 58 0.2 1.7
November 7.75 340 90 29 4.4 27 3.6 0 76 3.8 65 0.43 1.2 20 Nirmala City April 7.82 106 26 5.6 2.9 5.5 1.8 0 22 5.8 11 0.2 7.7
November 7.4 82 18 4 1.9 5.9 0.9 0 24 0.46 11 0.43 0 21 Pambadumpara April - 152 32 8 2.9 12 1.8 - - 4.6 20 - 7.3
November 7.17 143 34 7.2 3.9 10 3.3 0 29 1.7 17 0.37 16 22 Peruvanthanam April 7.03 59 14 3.2 1.5 3.7 1 0 9.8 1.5 7.1 0.52 8.6
November 6.99 48 12 3.2 0.97 3.3 0.9 0 9.8 0 5.7 0.54 9.5 23 Poopara April 7.58 635 150 38 13 41 10 0 61 12 96 0.2 121
November 7.78 350 90 23 7.8 26 8.7 0 90 14 37 0.62 39 24 Thodupuzha April 7.61 145 36 10 2.4 - - - - - 16 0.28 24 25 Thumbachi April 7.21 63 18 6.4 0.49 3 1.4 0 22 2.2 5.7 0.21 3.6
November 7.38 51 14 4.8 0.49 2.8 0.6 0 22 0.1 2.8 0.5 3.2 26 Udumbanchola April 7.04 328 66 18 5.4 - - - - - 81 0.27 55 27 Valara April 7.37 103 30 8.8 1.9 3.9 3.3 0 27 1.9 9.9 0.39 11
November 7.24 79 16 4.8 0.97 4.3 5.1 0 12 0 11 0.46 9 28 Vaden April 7.74 339 70 20 4.9 - - - - - 43 0.25 8.6 29 Vallakadavu April 7.62 164 46 10 4.9 9.6 2.6 0 73 3 9.9 0.23 8.5
November 7.75 169 52 14 3.9 11 3.7 0 88 3.6 11 0.48 2.5 30 Vandiperiyar April 7.1 756 105 22 12 - - - - - 110 0.17 128 31 Vellathuval April 7.47 70 18 5.6 0.97 5.5 0.9 0 34 0.84 4.3 0.19 1.6
November 7.2 49 12 4 0.49 4.3 0.9 0 20 0 4.3 0.53 1.3 32 Vellilamkandam April 7.16 63 10 3.2 0.49 - - - - - 11 0.04 0.41 33 Vazhuthala April 7.39 56 14 4 0.97 3.2 0.7 0 15 2.1 7.1 0.19 0.06
November 7.33 59 14 4.8 0.49 4.1 0.9 0 20 0.1 7.1 0.46 0.58

Ground Water Year Book of Kerala (2013-14)
111
KANNUR DISTRICT
Sl. No. Location Month pH
EC in µS/cm
at 250C
TH as CaCO3 Ca Mg Na K CO3 HCO3 SO4 Cl F NO3 <---------------------------------Concentration in mg/L------------------------------->
1 2 3 4 5 6 7 8 9 10 11 12 13 14 15 16 1 Aralam April 7.63 34 10 1.6 1.5 2.8 0.2 0 12 0 2.8 0 0.21
November 7.45 34 10 3.2 0.49 2.6 0.2 0 12 0.00 5.70 0.00 0.00 2 Kannur April 7.77 152 38 11 2.4 - - - - - 13 0.50 0.30 3 Chakkarakkallu April 7.15 111 14 4 0.97 - - - - - 20 0.18 18 4 Chepparapadavu April 7.43 66 20 3.2 2.9 4.8 0.4 0 17 1.00 9.90 traces 4.40
November 7.19 64 20 4.8 1.9 4.6 0.5 0 24 0.00 8.50 0.00 4.40 5 Cheleri April 9.43 42 8 3.2 traces 2.4 0.8 - - traces 5.70 0 3.80
November 6.51 30 6 1.6 0.49 2.8 0.4 0.00 4.90 0.00 5.70 0.10 3.30 6 Cheruthazham April 7.11 44 6 1.6 0.49 4.7 0.3 0 7.30 1.00 8.50 0.46 3.20
November 6.98 43 6 1.6 0.49 4.7 0.4 0 2.40 0.00 8.50 0.00 4.20 7 Chural April 7.16 54 14 4.8 0.49 - - - - - 7.10 0.14 2.40 8 Dharmadam April 8.09 118 28 10 0.49 9.2 0.9 0 27 4.60 17 0.17 1.90 9 Edakkad April 7.56 186 50 14 3.4 - - - - - 24 0.34 1.60
November 7.64 200 58 20 1.9 13 2.5 0 59 13 23 0.04 5.60 10 Edayannur April 7.37 43 10 3.2 0.49 - - - - - 8.50 0.09 12 11 Ettikulam April 7.66 73 20 6.4 0.97 4.2 1.1 0 24 1.50 7.10 0.54 0.50
November 6.99 36 8 1.6 0.97 3.6 0.4 0 7.30 0.00 7.10 0.01 2.30 12 Irikkur April 7.38 280 114 31 8.8 8 3.9 9.6 90 22 17 0.17 0.28
November 7.95 141 44 9.6 4.9 8.6 2.8 0 56 1.20 14.00 0.00 7.00 13 Iritty April 7.14 43 8 2.4 0.49 4.1 0.7 0 12 2.00 5.70 0 1.20
November 7.11 55 12 4 0.49 3.6 2 0 9.80 0.72 7.10 0.04 5.50 14 Kannapuram April 7.48 68 18 4 2 4.3 1.3 0 15 2.00 8.5 0.37 3.70
November 8.15 490 156 55 4.4 25 28 0 246 22.00 36.00 0.13 14.00

Ground Water Year Book of Kerala (2013-14)
112
1 2 3 4 5 6 7 8 9 10 11 12 13 14 15 16 15 Kannavam April 8.43 190 42 12 2.9 15 2.7 2.4 39 8.00 24 0.04 5.50
November 7.59 80 22 4.8 2.4 6.1 1.6 0 24 1.20 9.90 0.04 6.40 16 Kommeri April 7.9 55 20 3.2 2.9 3 0.4 0 22 1.60 4.30 0 0.32
November 7.37 36 12 3.2 0.97 2.1 0.1 0 15 0.00 5.70 0.02 0.00 17 Koothuparamba April 7.5 460 92 23 8.3 - - - - - 61 0.14 132 18 kottayampoyil April 7.09 59 6 1.6 0.49 7.5 0.4 0 4.90 0 11 0 8.90
November 6.11 58 8 1.6 0.97 7.5 0.3 0 4.90 0.00 11.00 0.07 9.80 19 Kottiyur April 8.02 124 44 14 2.4 5 0.5 0 46 1.50 13 0 0.23
November 7.29 61 22 5.6 1.9 3.9 0.4 0 29 0.00 5.70 0.00 2.00 20 kozhichal April 7.79 95 34 5.6 4.9 4.7 0.5 0 39 1.10 7.10 0.08 3.30
November 6.92 42 14 2.4 1.9 2.4 0.3 0 15 0.00 5.70 0.08 2.20 21 Mahe April - 670 105 34 4.9 - - - - - 128 0.39 4.60 22 Manantheri April 8.06 116 36 6.4 4.9 - - - - - 8.50 0.14 0.73 23 Manathana April 7.12 63 8 1.6 0.97 - - - - - 11 0.08 4.40 24 Mathamangalam April 7.14 93 16 2.4 2.4 9.4 1.2 0 4.90 0 14 0 16
November 6.81 80 16 4.8 0.97 6.7 0.7 0 9.80 0.00 9.90 0.01 16.00 25 Mattannur April 6.24 173 28 6.4 2.9 12 6.6 0 2.40 0 28 0.05 30
November 6.26 190 36 7.2 4.4 15 7.2 0 4.90 0.00 34.00 0.04 37.00 26 Mattara April 7.364 68 22 4.8 2.4 - - - - - 7.10 0.02 2.20 27 Mayyil April 7.16 69 14 4 0.97 - - - - - 13 0.08 4.70
28 Melepukkam (Peringalam) April 7.02 75 10 1.6 1.5 - - - - - 16 0.14 11
29 Meruvambayi April 7.75 91 18 3.2 2.4 7.8 1.1 0 17 1.50 9.90 0 8.60 November 7.02 46 10 3.2 0.49 5.2 0.3 0 12 0.29 8.50 0.20 3.50 30 Mokeri 24.04.10 7.19 210 16 4 1.5 - - - - - 43 0.14 20 31 Muzhakkunnu April 8.11 120 28 7.2 2.4 8.5 2.1 0 34 4.50 13 0 1.10
November 8.04 80 20 5.6 1.5 6.6 1.2 0 24 0.00 11.00 0.00 0.73 32 Padiriyad April 7.39 48 8 3.2 traces - - - - - 11 0.08 2.20 33 Pallikunnu April 7.05 35 8 1.6 0.97 - - - - - 7.10 0.09 2.40

Ground Water Year Book of Kerala (2013-14)
113
1 2 3 4 5 6 7 8 9 10 11 12 13 14 15 16 34 Palloor April - 280 36 12 1.5 - - - - - 53 0.32 34 35 Panunda April 7 60 8 1.6 0.97 - - - - - 9.90 0.12 6.7 36 Pattiyam April 7 86 16 3.2 1.9 - - - - - 16 0.12 7.2 37 Pazhayangadi April 7.51 121 48 14 2.9 4.6 0.3 0 37 15 4.30 0.5 2.9
November 7.83 178 72 25 2.4 4.7 1.1 0 88 9.80 9.90 0.03 1.30 38 Peringome April 7.39 159 36 9.6 2.9 11 3.4 0 20 4.10 21 0.02 18
November 7.44 127 36 9.6 2.9 8.4 4.1 0 29 2.80 16.00 0.00 10.00 39 Pukkundu April 8.09 109 28 8 1.9 7.5 1.8 0 44 0 8.50 0 3.20
November 7.18 89 14 4.8 0.49 10 0.5 0 4.90 0.00 14.00 0.00 16.00 40 Pulingome April 8.69 200 82 17 9.7 - - - - - 14 0.14 0.25 41 Ramanthali April 6.59 39 10 1.6 1.5 4.1 0.4 0 2.40 1.00 9.90 0 2.70
November 6.8 36 6 1.6 0.49 3.9 0.2 0 2.40 0.00 8.50 0.00 2.20 42 Sreekandapuram April 8.38 78 16 3.2 1.9 - - - - - 13 0.08 7.9 43 Taliparamba April 8.46 197 58 14 5.8 14 4.4 9.6 66 3.50 13 0.02 0.36
November - 240 48 14 3.4 19 9.9 - - 4.60 33.00 0.07 39.00 44 Thalassery April 8.42 360 76 22 5.4 26 14 18 24 24 37 0.5 37
November 7.85 470 142 48 5.4 25 18 0 171 21 36 0 45 45 Ullikkal April 7.42 51 8 3.2 traces - - - - - 14 0.05 3.5 46 Valapattanam April 8.04 260 84 26 4.4 12 5.7 0 83 20 20 0.44 5.1
November 7 127 30 8.8 1.9 10 0.7 0 12 12 16 0 10 47 Vayakkara April 8.3 250 104 18 14 - - - - - 7.1 0.22 0.25
KASARGOD DISTRICT
Sl. No. Location Month pH
EC in µS/cm
at 250C
TH as CaCO3 Ca Mg Na K CO3
HCO3 SO4 Cl F NO3
<---------------------------------Concentration in mg/L----------------------> 1 2 3 4 5 6 7 8 9 10 11 12 13 14 15 16 1 Angadimogar April 7.74 166 42 9.6 4.4 13 1.4 0 27 0.44 26 0.06 15

Ground Water Year Book of Kerala (2013-14)
114
1 2 3 4 5 6 7 8 9 10 11 12 13 14 15 16 November 7.5 173 36 11 1.9 18 0.9 0 37 0 28 0.05 13
2 Badiadka April 7.83 131 44 17 0.49 6.9 1.4 0 46 12 8.5 0.12 2.4 November - 143 38 13 1.5 6.7 1.5 - - 7.6 9.9 0.31 1.3
3 Bandadukka April 7.13 87 24 8 0.97 4.8 1.4 0 20 5.4 9.9 0.05 1.8 November 7.5 69 18 6.4 0.49 4.6 1 0 20 1.8 8.5 0.01 3.6
4 Bedadka April 7.08 42 14 1.6 2.4 3.3 0.2 0 9.8 0.53 5.7 0.01 3 November - 50 10 2.4 0.97 4.8 0.4 - - 0 8.5 0.18 1.5
5 Bedrampalla April - 95 24 7.2 1.5 - - - - - 4.3 0 4.2 6 Bekal April - 176 28 6.4 2.9 18 1.5 - - 0.76 26 0.18 36
November 4.73 270 66 14 7.8 19 2.9 0 0 0 37 0.31 18 7 Bhimanadi April - 73 20 4 2.4 6 0.4 - - 0 8.5 0 0.37
November 7.28 47 12 3.2 0.97 4.3 0.2 0 17 0 5.7 0.17 2.6 8 Chayangode April 8.17 165 54 14 4.9 13 1.7 0 100 2.5 7.1 0.15 0.23 9 Chittarikkal April 7.81 60 18 4.8 1.5 3.8 0.2 0 22 2.2 5.7 0 2.8
November 7.33 47 16 3.2 1.9 2.9 0.1 0 15 0 5.7 0 4.7 10 Kadapallam April 7.76 94 34 11 1.5 4.6 1.5 0 37 3.4 7.1 0.07 0.51
November - 69 16 5.6 0.49 3.3 1.1 - - 1 8.5 0 0.14 11 Kakkadavu April 8.74 131 50 15 2.9 6.6 1.8 4.8 51 3.5 14 0.04 0.38 12 Kasargod April 7 181 32 8.8 2.4 18 3 0 12 8.1 34 0.15 12
November 7.38 151 28 8.8 1.5 14 2.7 0 15 6.3 27 0 9 13 Koliyurkadavu April 7.01 22 4 0.8 0.49 - - - - - 4.3 0.17 0.13 14 Kumbla April 8.32 190 68 18 5.8 11 2.8 0.01 90 5 13 0 0.45
November - 116 26 7.2 1.9 12 1.3 - - 0 20 0.2 9.7 15 Kuttikole April 7.47 39 10 0.8 1.9 3.2 0.8 0 12 1.1 4.3 0 1.1
November - 37 8 2.4 0.49 2.5 0.4 - - 0 4.3 0 0.38 16 Manjeshwar April 7.27 230 26 7.2 1.9 29 4.4 0 15 0 51 0.12 13
November 7.21 210 28 7.2 2.4 22 4.9 0 7.3 0 45 0.27 23 17 Mavinakatta April - 133 30 10 0.97 - - - - - 9.9 0 1.2 18 Mogaral April - 103 18 7.2 0 9.8 1.1 - - 5.6 16 0.12 2.1
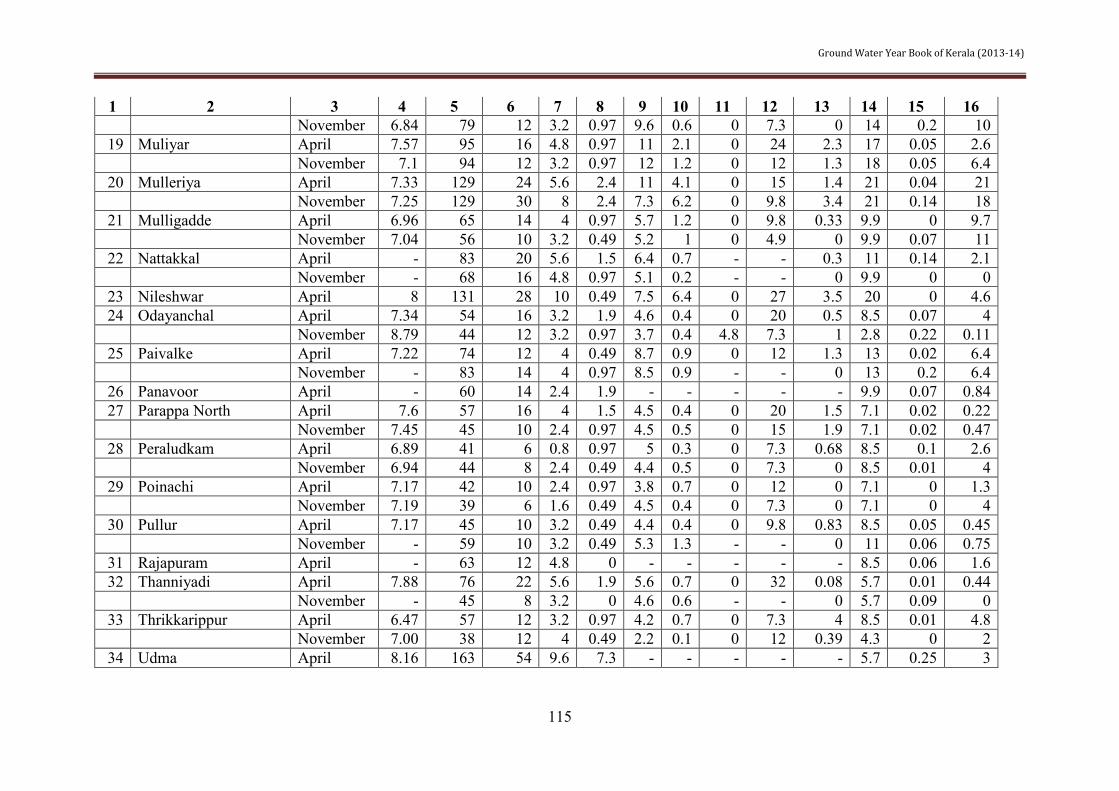
Ground Water Year Book of Kerala (2013-14)
115
1 2 3 4 5 6 7 8 9 10 11 12 13 14 15 16 November 6.84 79 12 3.2 0.97 9.6 0.6 0 7.3 0 14 0.2 10 19 Muliyar April 7.57 95 16 4.8 0.97 11 2.1 0 24 2.3 17 0.05 2.6
November 7.1 94 12 3.2 0.97 12 1.2 0 12 1.3 18 0.05 6.4 20 Mulleriya April 7.33 129 24 5.6 2.4 11 4.1 0 15 1.4 21 0.04 21
November 7.25 129 30 8 2.4 7.3 6.2 0 9.8 3.4 21 0.14 18 21 Mulligadde April 6.96 65 14 4 0.97 5.7 1.2 0 9.8 0.33 9.9 0 9.7
November 7.04 56 10 3.2 0.49 5.2 1 0 4.9 0 9.9 0.07 11 22 Nattakkal April - 83 20 5.6 1.5 6.4 0.7 - - 0.3 11 0.14 2.1
November - 68 16 4.8 0.97 5.1 0.2 - - 0 9.9 0 0 23 Nileshwar April 8 131 28 10 0.49 7.5 6.4 0 27 3.5 20 0 4.6 24 Odayanchal April 7.34 54 16 3.2 1.9 4.6 0.4 0 20 0.5 8.5 0.07 4
November 8.79 44 12 3.2 0.97 3.7 0.4 4.8 7.3 1 2.8 0.22 0.11 25 Paivalke April 7.22 74 12 4 0.49 8.7 0.9 0 12 1.3 13 0.02 6.4
November - 83 14 4 0.97 8.5 0.9 - - 0 13 0.2 6.4 26 Panavoor April - 60 14 2.4 1.9 - - - - - 9.9 0.07 0.84 27 Parappa North April 7.6 57 16 4 1.5 4.5 0.4 0 20 1.5 7.1 0.02 0.22
November 7.45 45 10 2.4 0.97 4.5 0.5 0 15 1.9 7.1 0.02 0.47 28 Peraludkam April 6.89 41 6 0.8 0.97 5 0.3 0 7.3 0.68 8.5 0.1 2.6
November 6.94 44 8 2.4 0.49 4.4 0.5 0 7.3 0 8.5 0.01 4 29 Poinachi April 7.17 42 10 2.4 0.97 3.8 0.7 0 12 0 7.1 0 1.3
November 7.19 39 6 1.6 0.49 4.5 0.4 0 7.3 0 7.1 0 4 30 Pullur April 7.17 45 10 3.2 0.49 4.4 0.4 0 9.8 0.83 8.5 0.05 0.45
November - 59 10 3.2 0.49 5.3 1.3 - - 0 11 0.06 0.75 31 Rajapuram April - 63 12 4.8 0 - - - - - 8.5 0.06 1.6 32 Thanniyadi April 7.88 76 22 5.6 1.9 5.6 0.7 0 32 0.08 5.7 0.01 0.44
November - 45 8 3.2 0 4.6 0.6 - - 0 5.7 0.09 0 33 Thrikkarippur April 6.47 57 12 3.2 0.97 4.2 0.7 0 7.3 4 8.5 0.01 4.8
November 7.00 38 12 4 0.49 2.2 0.1 0 12 0.39 4.3 0 2 34 Udma April 8.16 163 54 9.6 7.3 - - - - - 5.7 0.25 3
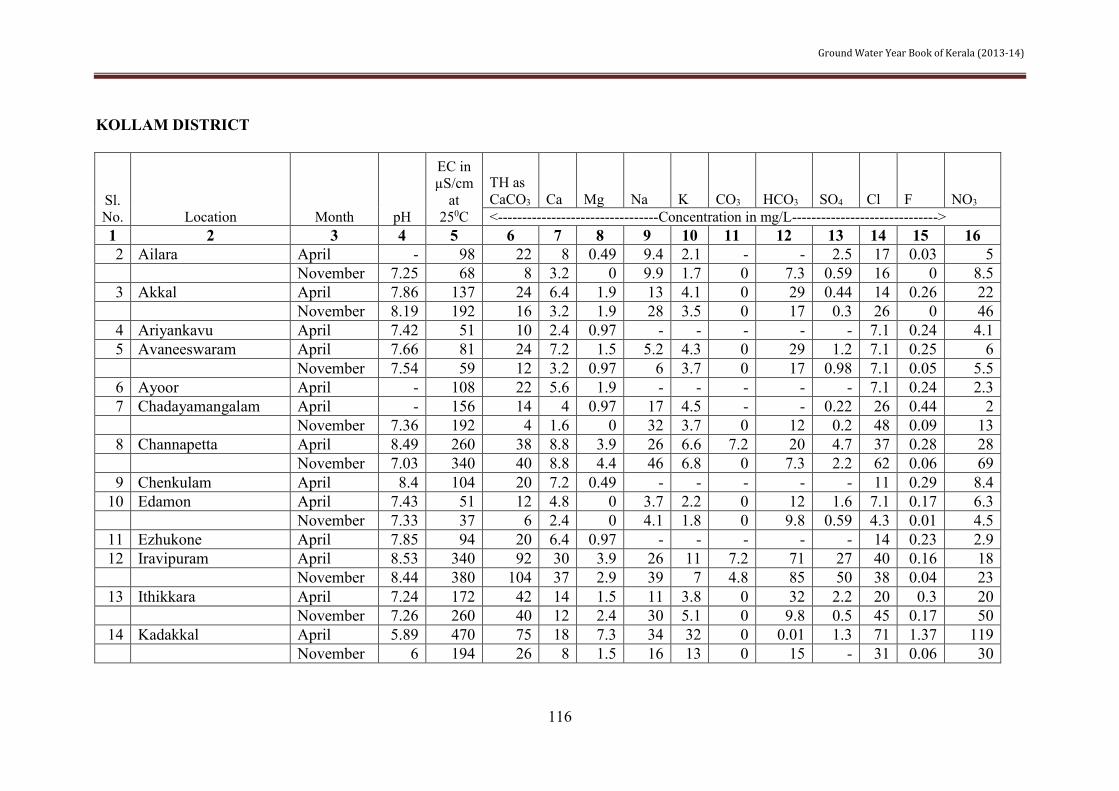
Ground Water Year Book of Kerala (2013-14)
116
KOLLAM DISTRICT
Sl. No. Location Month pH
EC in µS/cm
at 250C
TH as CaCO3 Ca Mg Na K CO3 HCO3 SO4 Cl F NO3 <---------------------------------Concentration in mg/L------------------------------>
1 2 3 4 5 6 7 8 9 10 11 12 13 14 15 16 2 Ailara April - 98 22 8 0.49 9.4 2.1 - - 2.5 17 0.03 5
November 7.25 68 8 3.2 0 9.9 1.7 0 7.3 0.59 16 0 8.5 3 Akkal April 7.86 137 24 6.4 1.9 13 4.1 0 29 0.44 14 0.26 22
November 8.19 192 16 3.2 1.9 28 3.5 0 17 0.3 26 0 46 4 Ariyankavu April 7.42 51 10 2.4 0.97 - - - - - 7.1 0.24 4.1 5 Avaneeswaram April 7.66 81 24 7.2 1.5 5.2 4.3 0 29 1.2 7.1 0.25 6
November 7.54 59 12 3.2 0.97 6 3.7 0 17 0.98 7.1 0.05 5.5 6 Ayoor April - 108 22 5.6 1.9 - - - - - 7.1 0.24 2.3 7 Chadayamangalam April - 156 14 4 0.97 17 4.5 - - 0.22 26 0.44 2
November 7.36 192 4 1.6 0 32 3.7 0 12 0.2 48 0.09 13 8 Channapetta April 8.49 260 38 8.8 3.9 26 6.6 7.2 20 4.7 37 0.28 28
November 7.03 340 40 8.8 4.4 46 6.8 0 7.3 2.2 62 0.06 69 9 Chenkulam April 8.4 104 20 7.2 0.49 - - - - - 11 0.29 8.4
10 Edamon April 7.43 51 12 4.8 0 3.7 2.2 0 12 1.6 7.1 0.17 6.3 November 7.33 37 6 2.4 0 4.1 1.8 0 9.8 0.59 4.3 0.01 4.5 11 Ezhukone April 7.85 94 20 6.4 0.97 - - - - - 14 0.23 2.9 12 Iravipuram April 8.53 340 92 30 3.9 26 11 7.2 71 27 40 0.16 18
November 8.44 380 104 37 2.9 39 7 4.8 85 50 38 0.04 23 13 Ithikkara April 7.24 172 42 14 1.5 11 3.8 0 32 2.2 20 0.3 20
November 7.26 260 40 12 2.4 30 5.1 0 9.8 0.5 45 0.17 50 14 Kadakkal April 5.89 470 75 18 7.3 34 32 0 0.01 1.3 71 1.37 119
November 6 194 26 8 1.5 16 13 0 15 - 31 0.06 30

Ground Water Year Book of Kerala (2013-14)
117
1 2 3 4 5 6 7 8 9 10 11 12 13 14 15 16 15 Kadapuzha April 7.41 88 28 4.8 3.9 - - - - - 8.5 0.21 0.66 16 Kuttavettur April 7.64 125 32 10 1.5 10 1 0 34 3.2 13 0.22 14
November 8.33 128 20 5.6 1.5 16 1 Tr 24 1.2 21 0 15 17 Karunagapally April 8.17 330 96 32 3.9 - - - - - 40 0.24 4.7 18 Kollam April 7.77 148 40 14 1.5 9.8 1.6 0 34 2.2 20 0.12 4.8
November 8.13 230 64 24 0.97 20 1.8 0 49 7.7 31 0 22 19 Kottakayam April 7.56 51 14 4.8 0.49 3.4 0.9 0 22 0.66 2.8 0.27 1.2
November 7.48 49 10 3.2 0.49 4.4 1.2 0 12 0 5.7 0.04 7.8 20 Kottarakkara April 8.45 200 38 11 2.4 19 5.7 4.8 27 3.2 30 0.15 17
November 7.57 146 24 6.4 1.9 16 3.5 0 20 1.7 30 0.06 11 21 Kulakkada April 8.49 280 104 37 2.9 10 4.7 7.2 100 12 14 0.22 4.1
November 7.57 98 18 5.6 0.97 12 1.4 0 22 0.98 17 0.06 8.3 22 Kulathupuzha April 7.54 270 34 10 1.9 26 8.9 0 22 2.2 41 0.2 46
November 7.64 230 30 8 2.4 26 9.2 0 20 5.2 40 0.06 32 23 Kumbalam April 7.92 90 26 9.6 0.49 - - - - - 11 0.19 7.2 24 Kunnada April 8.05 97 22 7.2 0.97 8 4.7 0 27 1.2 14 0.13 7.4
November 7.06 76 6 2.4 0 11 2.9 0 4.9 0.79 20 0 4.6 25 Madathara April 7.35 198 36 10 2.4 - - - - - 30 0.21 31 26 Nallila April 7.1 84 22 7.2 0.97 5.9 1.7 0 15 1.8 13 0.08 14
November 6.44 88 10 2.4 0.97 11 1.4 0 4.9 1.1 18 0.04 10 27 Neendakara April 8.23 210 78 22 5.8 - - - - - 14 0.19 4.3 28 Oyur April 7.99 99 24 8 0.97 - - - - - 9.9 0.15 11 29 Paripalli April 6.92 184 32 6.4 3.9 - - - - - 31 0.29 38 30 Pavitreswaram April 7.89 100 12 3.2 0.97 11 2.5 0 9.8 1.5 20 0.31 3.3
November 7.22 47 4 0.8 0.49 5.7 1.7 0 4.9 0.69 11 0.06 0.64 31 Perinad April 7.75 176 32 12 0.49 19 1 0 32 2.2 28 0.13 8.4
November 7.32 165 28 9.6 0.97 18 2.3 0 12 8 30 0 15 32 Pozhikkara April 7.42 440 78 14 10 47 1.2 0 41 41 75 0.2 9.4
November 7.72 260 50 9.6 6.3 32 0.1 0 20 38 48 0.02 5.4

Ground Water Year Book of Kerala (2013-14)
118
1 2 3 4 5 6 7 8 9 10 11 12 13 14 15 16 33 Punalur April 7.91 112 30 11 0.49 - - - - - 11 0.12 0.75 34 Punnila April 8.25 104 22 7.2 0.97 9 4.7 0 34 1.8 11 0.25 6.2
November 7.46 98 16 4 1.5 12 3.6 0 15 1.6 23 0 6.1 35 Sasthamkotta April 7.38 123 24 7.2 1.5 - - - - - 21 0.2 8 36 Sooranadu April 7.38 82 16 4.8 0.97 - - - - - 13 0.16 11 37 Tadicaud April - 143 22 5.6 1.9 - - - - - 21 0.22 3 38 Thenmala April - 120 20 4.8 1.9 - - - - - 14 0.33 3.2 39 Thevalakkara April 7.13 101 22 7.2 0.97 8.9 1.5 0 17 2.5 16 0.12 8.1
November 4.87 88 8 2.4 0.49 8 0.8 0 0 0.3 14 0 9.8 40 Ummannur April - 230 36 12 1.5 19 8.6 - - 2.3 31 0.35 20 41 Vadakkumthala West April 3.87 510 85 26 4.9 36 12 0 0 34 68 0.29 70
November 7.66 290 66 23 2.1 24 6.7 0 20 27 43 0.05 42 42 Vallikavu April 8.98 210 66 22 2.9 12 2.6 9.6 44 11 23 0.25 1.5
November - 146 30 11 0.62 17 0.3 - - 11 24 0.08 1.9 43 Yeroor April - 420 70 19 5.4 - - - - - 55 0.22 57
KOTTAYAM DISTRICT
Sl. No. Location Month pH
EC in µS/cm
at 250C
TH as CaCO3 Ca Mg Na K
CO3 HCO3 SO4 Cl F NO3
<---------------------------------Concentration in mg/L-------------------------> 1 2 3 4 5 6 7 8 9 10 11 12 13 14 15 16 1 Anandasram April 7.21 85 22 8.8 0 4.2 1.2 0 22 1.3 9.9 0.26 6.8
November - 85 14 4 0.97 6 4.8 - - 1.6 13 0.32 4.9 2 Ariparamba April 7.7 117 26 7.2 1.9 - - - - - 16 0.19 2.3 3 Ayamkudi April 7.35 50 12 3.2 0.97 - - - - - 7.1 0 3.3 4 Changanassery April 7.2 544 96 25 8.3 - - - - - 77 0 50 5 Edinjillam April 7.06 304 36 10 2.4 13 27 0 4.9 32 28 0.17 43
November - 250 32 10 1.5 14 28 - - 33 23 0.1 17 6 Elamkulam April 7.86 136 52 16 2.9 2 2.3 0 54 5.1 5.7 0.19 5.1

Ground Water Year Book of Kerala (2013-14)
119
1 2 3 4 5 6 7 8 9 10 11 12 13 14 15 16 November 8.19 65 24 7.2 1.5 3 0.7 0 29 2.6 4.3 0.12 0.69
7 Iykarakunnam April 7.65 96 12 3.2 0.97 9.2 2.1 0 12 1.5 16 0.04 7.7 November 7.62 89 20 5.6 1.5 7.9 1.8 0 24 5.2 14 0.12 0
8 Kaduthuruthi April 7.13 252 40 9.6 3.9 18 3.8 0 15 2.9 51 0.22 16 November 7.58 192 38 9.6 3.4 19 3.7 0 24 7.5 33 0.31 11
9 Kalakatty April 7.74 142 42 13 2.4 5 4.6 0 34 6.9 9.9 0.35 13 November - 97 24 8 0.97 5.1 4.8 - - 5.4 8.5 0.15 1.4 10 Kalattur April 7.27 63 18 4.8 1.5 3.6 1.2 0 7.3 0.32 9.9 0.27 9.8
November 6.61 43 10 3.2 0.49 3.1 0.9 0 4.9 1.4 7.1 0.15 4.6 11 Kanjirapalli April 8.12 113 30 8 2.4 4.5 1.4 0 17 6 8.5 0 13
November 7.65 77 30 10 0.97 2 0.5 0 27 10 2.8 0.1 3.1 12 Kangazha April 7.4 147 36 11 1.9 - - - - - 17 0.13 16 13 Kidangur April 7.14 70 12 3.2 0.97 5.9 1 0 7.3 0.47 13 0.05 8.6
November 6.98 68 14 3.2 1.5 6.8 1.2 0 9.8 1.6 11 0.06 10 14 Kottayam April 6.93 53 8 3.2 0 4.2 0.6 0 2.4 2.1 8.5 0 6.8
November 7.41 330 74 22 4.4 25 12 0 37 27 38 0.11 46 15 Kozha April 6.96 96 20 5.6 1.5 5.6 2.7 0 7.3 1.6 13 0.36 18
November 7.44 81 16 4.8 0.97 5.9 2.8 0 12 2.1 13 0.07 9.3 16 Kozhuvanal April 8.56 67 16 4.8 0.97 - - - - - 8.5 0.1 5.9 17 Kumarakom April 8.25 424 180 65 4.4 - - - - - 26 0 2 18 Kuttikkal April 6.8 87 18 4.8 1.5 - - - - - 9.9 0.24 13 19 Kuvapalli April 7.42 95 32 9.6 1.9 2.7 1 0 22 1.2 7.1 0 22
November 7.08 49 16 5.6 0.49 2.9 0.7 0 12 0.26 5.7 0.23 9.4 20 Marangattupalli April 7.2 113 24 7.2 1.5 8.3 1.4 0 17 7 18 0.07 4
November 6.98 132 24 7.2 1.5 12 1.7 0 15 3.3 23 0.19 15 21 Monipalli April 7.19 121 28 7.2 2.4 - - - - - 17 0 19 22 Mukkada April 7.74 172 40 10 3.4 - - - - - 20 0.22 28 23 Mundakayam April 6.85 60 16 4 1.5 2.8 0.6 0 4.9 0.98 8.5 0.18 13
November - 101 26 8 1.5 6.9 2.4 - - 7.4 11 0.08 11

Ground Water Year Book of Kerala (2013-14)
120
1 2 3 4 5 6 7 8 9 10 11 12 13 14 15 16 24 Mundukuzhi April 7.06 40 10 3.2 0.49 - - - - - 7.1 0.05 3.2 25 Naranganam April 7.07 33 8 2.4 0.49 1.8 0.6 0 2.4 0.98 4.3 0.3 3.4
November 7.29 32 12 3.2 0.97 1.6 0.8 0 9.8 2.4 4.3 0.21 3.4 26 Paipad April 5.8 238 38 11 2.4 12 12 0 0 5.5 33 0 49
November 6.32 51 10 3.2 0.49 4.5 0.5 0 2.4 1.6 8.5 0.22 7.4 27 Pala April 7.52 105 30 8 2.4 4.5 0.7 0 29 4.5 9.9 0.34 4.9
November 7.46 66 22 5.6 1.9 4.9 0.4 0 22 2.8 5.7 0.15 7.3 28 Palamkadavu April 7.56 520 96 21 11 - - - - - 101 0.22 7.3
29 Pallikathodu April 7.78 70 20 7.2 0.49 2 1.8 0 24 3.5 5.7 0.11 0.82 November 7.15 54 14 3.2 1.5 5.3 0.8 0 12 2 9.9 0.09 5.9
30 Pallom(Nattagam) April 7.12 87 16 5.6 0.49 - - - - - 13 0.03 9.8 31 Pambadi April 7.45 97 22 6.4 1.5 - - - - - 9.9 0.11 0
32 Paruthumpara April 7.07 125 14 4.8 0.49 14 3 0 4.9 1.5 26 0 9.7 November 7.34 61 14 4.8 0.49 4.6 1.5 0 12 4.5 7.1 0.1 6.7
33 Plakkalpadi April 7.21 150 20 4.8 1.9 14 0.9 0 4.9 1.3 31 0 12 November 6.88 72 16 4 1.5 6 2.2 0 9.8 3.3 11 0.06 10
34 Pulikuttisseri April 7.84 459 156 53 5.8 - - - - - 60 0.2 1.4 35 Punjar April 7.08 46 10 2.4 0.97 4 1 0 7.3 1.7 7.1 0.08 5
November 7.2 30 8 2.4 0.49 2.3 0.8 0 9.8 1.5 4.3 0.12 0.89 36 Talayolaparambu April 7.34 429 106 34 5.4 17 16 0 34 46 55 0.42 27
November 7.61 350 94 30 4.9 19 15 0 44 40 34 0.08 16 37 Thekkethumkavala April 7.76 113 30 5.6 3.9 - - - - - 9.9 0.24 3.7
38 Tiruvarpu April 8.12 447 110 33 6.8 33 11 0 151 18 50 0.38 0.85 November 7.23 83 18 4.8 1.5 6 2.7 0 12 2 11 0.06 11
39 Tottakkad April 7.06 64 18 4 1.9 3.7 0.9 0 17 1.8 7.1 0 5.9 November 6.75 40 8 3.2 0 3.5 0.8 0 7.3 1.2 7.1 0 5.5
40 Trikodithanam April 7.22 104 18 5.6 0.97 - - - - - 18 0.16 4.2 41 Urulikunnam April 7.34 85 12 2.4 1.5 - - - - - 14 0.32 9 42 Vaikom April 8 1625 370 126 13 - - - - - 362 0.13 49

Ground Water Year Book of Kerala (2013-14)
121
1 2 3 4 5 6 7 8 9 10 11 12 13 14 15 16 43 Vazhur April 7.6 55 14 4 0.97 - - - - - 7.1 0 2.2 44 Vechur April 7.7 179 64 22 2.4 - - - - - 8.5 0 3.3
45 Velloor April 7.74 185 46 7.2 6.8 15 0.5 0 66 13 17 0 2 November 7.43 58 16 3.2 1.9 5.2 1.1 0 17 0 8.5 0.09 3.9
46 Vempallil April 7.05 90 16 4 1.5 - - - - - 14 0 8.6 November 6.75 40 8 3.2 0 3.5 0.8 0 7.3 1.2 7.1 0 5.5
KOZHIKODE DISTRICT
Sl. No. Location Month pH
EC in µS/cm
at 250C
TH as CaCO3 Ca Mg Na K CO3 HCO3 SO4 Cl F NO3 <---------------------------------Concentration in mg/L------------------------------>
1 2 3 4 5 6 7 8 9 10 11 12 13 14 15 16 1 Badagara April 7.49 370 110 30 8.5 - - - - - 57 0.18 31
November 7.7 590 100 29 6.8 - - - - - 54 - 35 2 Balusseri April 7.07 210 34 8 3.4 25 4.8 0 12 2 47 0 18
November 7.05 240 36 9.6 2.9 24 6.7 0 7.3 0.49 45 0 41 3 Beypore April 7.96 440 115 32 8.5 - - - - - 51 0.14 52 4 Bhoomivathukkal April 7.4 69 16 4.8 0.97 6.5 0.9 0 17 0 11 0.22 6.9
November 7.17 64 10 3.2 0.49 7.2 1.8 0 12 0 11 0 5.9 5 Chelavur April 7.52 140 24 4.8 2.9 - - - - - 24 0.14 11 6 Chemencheri April 7.74 220 75 26 2.4 - - - - - 20 0.18 17 7 Chevayur April 7.53 120 34 8.8 2.9 - - - - - 14 0.16 11 8 Devarkoil April 8.45 160 34 10 2 14 1.5 7.2 2.4 2.5 33 0 17
November 7.04 160 34 9.6 2.4 16 1.7 0 15 1.9 28 0 21 9 Elattur April 8.11 230 100 34 3.4 6.2 8 0 149 2.5 11 0.05 4.9
November - 250 54 19 1.5 16 7 - - 0 26 0.53 16 10 Farooq April 6.65 426 46 15 1.9 - - - - - 48 - 10 11 Kakkayam April 7.39 60 12 3.2 0.97 5.2 1.5 0 22 2 5.7 0.17 4.4

Ground Water Year Book of Kerala (2013-14)
122
1 2 3 4 5 6 7 8 9 10 11 12 13 14 15 16 November 6.94 37 10 3.2 0.49 2.7 1.1 0 15 1.5 4.3 0 1.3 12 Kannankara April 8.54 170 38 11 2.4 16 4.9 0 27 10 24 0.09 15 13 Kayapanachi April 7.27 137 24 4 3.4 - - - - - 37 0.12 1.2 14 Koduvalli April 7.87 110 36 9.6 2.9 8.4 1.2 0 73 0 7.1 0.11 0.26
November 7.43 71 18 4 1.9 5.9 1.8 0 24 0 8.5 0 5.1 15 Koodathumpara April 7.89 97 24 6.4 2 - - - - - 17 0.16 1.1 16 Koothali April 7.05 44 8 3.2 traces 3 1.8 0 7.3 0 5.7 0.02 8
November 7.11 32 6 1.6 0.49 2.5 0.9 0 7.3 0.3 4.3 0.15 2.2 17 Kozhikode April 7.75 230 60 18 3.4 18 1.3 0 39 7.5 38 0.09 15
November 7.94 220 74 26 1.9 10 1.4 0 71 16 18 0 10 18 Malayamma April 7.23 78 20 4 2.4 6.5 0.9 0 27 0 9.9 0.09 3.9
November 7.48 56 16 4.8 0.97 4.1 0.1 0 22 0.2 5.7 0 2.9 19 Mattanad April 7.25 81 22 5.6 2 6.7 1 0 15 1 16 0.04 6.4
November 7.96 60 16 5.6 0.49 5.4 0.7 0 15 0 9.9 0 4.2 20 Mavoor I April 7.26 39 10 1.6 1.5 - - - - - 11 0.16 4.4 21 Mavoor II April 7.22 84 16 4.8 0.97 - - - - - 14 0.1 1 22 Meppayyur April 7.1 136 32 9.6 2 10 4.5 0 9.8 7 21 0.04 16
November 4.74 43 4 0.8 0.49 0.8 0.4 0 0 3.5 2.8 0 0.96 23 Modern Bazaar April 7.63 250 70 22 3.9 - - - - - 28 0.2 6.5 24 Mukkali April 6.94 97 20 4.8 2 9.7 4.6 0 7.3 6.5 16 0.12 6.2
November 6.77 75 14 4.8 0.49 5.9 2.3 0 4.9 4.1 11 0 6 25 Nadapuram April 7.47 160 44 13 2.9 14 2.9 0 56 7 19 0.12 4.1
November 8.84 141 28 7.2 2.4 16 2.7 9.6 24 6.3 20 0.2 0.83 26 Perambra April 7.48 106 30 12 traces 6.3 1.7 0 39 0 9.9 0.1 8.4
November 7.7 93 34 13 0.49 4.5 0.8 0 46 2 8.5 0 0 27 Peruvayal April 7.44 77 24 5.6 2.4 4.9 0.7 0 34 traces 8.5 0.2 1.6
November 7.77 114 34 9.6 2.4 7.4 1 0 49 5.1 11 0.17 0 28 Pudukayam April 7.28 41 10 2.4 0.97 4.1 0.4 0 12 0 5.7 0.07 2.6
November 7.07 39 8 2.4 0.49 4.1 0.5 0 12 0 5.7 0 2.3
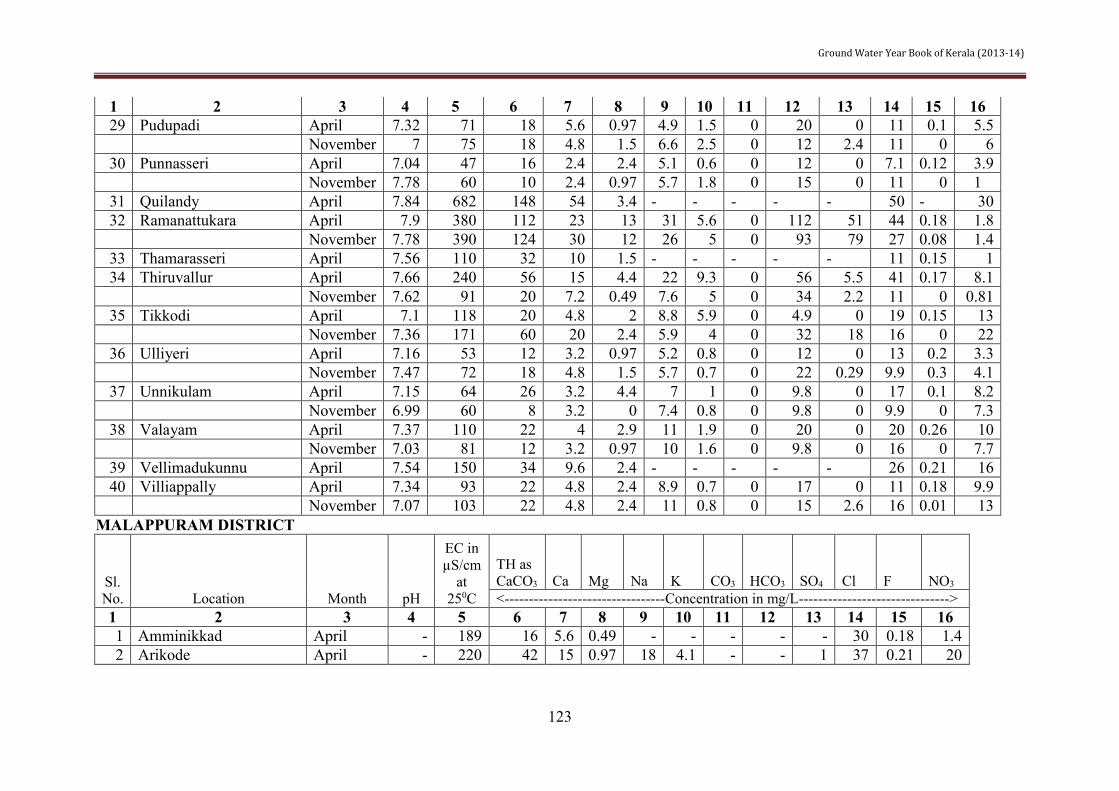
Ground Water Year Book of Kerala (2013-14)
123
1 2 3 4 5 6 7 8 9 10 11 12 13 14 15 16 29 Pudupadi April 7.32 71 18 5.6 0.97 4.9 1.5 0 20 0 11 0.1 5.5
November 7 75 18 4.8 1.5 6.6 2.5 0 12 2.4 11 0 6 30 Punnasseri April 7.04 47 16 2.4 2.4 5.1 0.6 0 12 0 7.1 0.12 3.9
November 7.78 60 10 2.4 0.97 5.7 1.8 0 15 0 11 0 1 31 Quilandy April 7.84 682 148 54 3.4 - - - - - 50 - 30 32 Ramanattukara April 7.9 380 112 23 13 31 5.6 0 112 51 44 0.18 1.8
November 7.78 390 124 30 12 26 5 0 93 79 27 0.08 1.4 33 Thamarasseri April 7.56 110 32 10 1.5 - - - - - 11 0.15 1 34 Thiruvallur April 7.66 240 56 15 4.4 22 9.3 0 56 5.5 41 0.17 8.1
November 7.62 91 20 7.2 0.49 7.6 5 0 34 2.2 11 0 0.81 35 Tikkodi April 7.1 118 20 4.8 2 8.8 5.9 0 4.9 0 19 0.15 13
November 7.36 171 60 20 2.4 5.9 4 0 32 18 16 0 22 36 Ulliyeri April 7.16 53 12 3.2 0.97 5.2 0.8 0 12 0 13 0.2 3.3
November 7.47 72 18 4.8 1.5 5.7 0.7 0 22 0.29 9.9 0.3 4.1 37 Unnikulam April 7.15 64 26 3.2 4.4 7 1 0 9.8 0 17 0.1 8.2
November 6.99 60 8 3.2 0 7.4 0.8 0 9.8 0 9.9 0 7.3 38 Valayam April 7.37 110 22 4 2.9 11 1.9 0 20 0 20 0.26 10
November 7.03 81 12 3.2 0.97 10 1.6 0 9.8 0 16 0 7.7 39 Vellimadukunnu April 7.54 150 34 9.6 2.4 - - - - - 26 0.21 16 40 Villiappally April 7.34 93 22 4.8 2.4 8.9 0.7 0 17 0 11 0.18 9.9
November 7.07 103 22 4.8 2.4 11 0.8 0 15 2.6 16 0.01 13 MALAPPURAM DISTRICT
Sl. No. Location Month pH
EC in µS/cm
at 250C
TH as CaCO3 Ca Mg Na K CO3 HCO3 SO4 Cl F NO3 <---------------------------------Concentration in mg/L------------------------------->
1 2 3 4 5 6 7 8 9 10 11 12 13 14 15 16 1 Amminikkad April - 189 16 5.6 0.49 - - - - - 30 0.18 1.4 2 Arikode April - 220 42 15 0.97 18 4.1 - - 1 37 0.21 20

Ground Water Year Book of Kerala (2013-14)
124
1 2 3 4 5 6 7 8 9 10 11 12 13 14 15 16 November 7.73 129 36 8.8 3.4 8.6 2.4 0 41 1.5 13 0.15 12
3 Athiramada April 7.63 66 18 6.4 0.49 5.7 0.6 0 27 1.7 7.1 0.04 2 November 7.5 71 16 4.8 0.97 5.7 0.9 0 22 1.3 8.5 0.11 3.9
4 Buliyampadam April - 250 20 5.6 1.5 23 32 - - 14 27 0 8.3 November 8.46 410 58 11 7.3 40 30 7.2 115 22 38 0.21 26
5 Chamravattam April 8.16 525 80 20 7.3 72 1.3 0 73 16 121 0.32 0.61 November 8.16 230 78 16 9.2 16 2.2 0 102 6.5 24 0.32 2.7
6 Cherukara April 7.25 88 16 4 1.5 9.7 1.3 0 15 1.1 16 0.04 11 November 7.42 142 28 4.8 3.9 14 2.3 0 17 3.1 21 0.11 21
7 Chokkad April - 198 20 7.2 0.49 31 2.7 - - 2.7 43 0.1 1.3 November 8.17 420 116 30 10 30 6.1 0 105 5.9 68 0.22 20
8 Chungathara April - 520 68 18 5.4 78 8.8 - - 29 119 0.37 13 November 4.28 350 44 8.8 5.4 40 6.5 0 0 0.47 67 0.16 44
9 Edappal April 7.61 131 36 7.2 4.4 8.9 0.5 0 27 1 16 0 16 November 5.91 191 26 5.6 2.9 23 2.4 0 4.9 0.28 33 0.13 38 10 Edavanna April 7.78 175 40 11 2.9 - - - - - 23 0.11 15 11 Iswaramangalam April 8.49 1195 230 30 38 178 13 30 214 23 241 0.35 2.2 12 Kadalundi April - 910 275 74 22 - - - - - 103 0.27 3.3 13 Kadannamanna April 7.86 78 18 4 1.9 - - - - - 5.7 0.1 0.5 14 Kalikavu April - 124 16 5.6 0.49 12 4.1 - - 2.6 20 0.21 11
November 7.25 146 26 6.4 2.4 12 4.5 0 15 1.3 21 0.17 18 15 Kanjiramukku April 7.8 169 36 10 2.4 17 1.2 0 39 3.5 30 0.05 2.3
November 7.94 330 62 23 0.97 32 1.4 0 68 4.7 64 0.14 3.8 16 Karavarakundu April 7.68 71 18 4 1.9 6.8 1.5 0 22 1.9 9.9 0 5.4
November 7.15 85 16 4.8 0.97 7.7 1.5 0 12 1.2 14 0.14 9.9 17 Kariavattom April 7.8 109 22 5.6 1.9 12 1.7 0 37 0.79 18 0 1.4
November 7.04 110 14 3.2 1.5 11 2.2 0 4.9 0.29 21 0.08 14 18 Karipol April 7.73 54 14 3.2 1.5 - - - - - 8.5 0.15 1 19 Karulai April - 230 38 8 4.4 - - - - - 34 0.21 5.9

Ground Water Year Book of Kerala (2013-14)
125
1 2 3 4 5 6 7 8 9 10 11 12 13 14 15 16 20 Kattumunda April - 82 14 5.6 0 - - - - - 9.9 0.02 5.7 21 Kizhmuri April 7.61 112 16 4.8 0.97 - - - - - 16 0 20 22 Kondotty April - 99 20 4.8 1.9 11 1 - - 0 17 0.22 5.9
November 7.38 105 26 5.6 2.9 7.4 1.5 0 29 3.5 11 0.12 6 23 Kottakkal(nearby well) April - 550 68 18 5.8 - - - - - 100 0 73 24 Kulattur(nearby well) April - 138 20 7.2 0.49 - - - - - 21 0.54 6.4 25 Kuruva April 8.2 108 32 11 0.97 - - - - - 5.7 0.06 0.5 26 Kuttipuram April - 298 35 10 2.4 37 4.8 - - 17 36 0.26 11 27 Malappuram April - 123 24 5.6 2.4 11 2.9 - - 1.8 21 0.22 5.1
November 7.16 150 22 4.8 2.4 17 1.4 0 15 1.6 24 0.13 22 28 Mangalam April 3.44 824 150 50 6.1 69 14 *0 *0 90 85 0.26 145 29 Manjeri April - 460 68 16 6.8 - - - - - 77 0.25 24 30 Marancheri April 7.03 108 24 7.2 1.5 7.9 2.1 0 17 4.1 14 0.02 27 31 Maruda April - 220 30 11 0.49 26 3.2 - - 0.9 44 0.11 30
November 7.86 185 52 16 2.9 13 1.5 0 54 0.38 24 0.2 11 32 Melattur April - 172 40 14 0.97 16 0.7 - - 0.97 37 0.11 9
November 7.73 210 60 13 6.8 14 0.8 0 41 0.95 36 0.1 13 33 Mudikode April 8.12 160 32 8 2.9 - - - - - 24 0.06 9.8
November 8 370 92 28 5.4 25 13 0 71 38 45 0.1 11 39 Perinthalmanna April 8.5 400 90 22 8.8 - - - - - 58 0.26 38 40 Perumpadappu April 7.34 210 30 9.6 1.5 28 5 0 17 10 44 0.09 12
November 6.51 64 8 2.4 0.49 5.9 1 0 2.4 0.57 13 0.1 7.1 41 Ponnani April - 1360 160 46 11 208 12 - - 53 383 0.03 20 42 Pookottor April 7.8 141 38 8 4.4 13 2.2 0 51 5.3 20 0.1 2.6
November 7.81 134 34 8.8 2.9 8.9 2.3 0 46 3.2 14 0.12 1.4 43 Pukattery April - 171 40 14 1.5 - - - - - 14 0.49 2.1 44 Pukoothu April 8.22 113 34 8.8 2.9 - - - - - 11 0.19 1.4 45 Pulamanthol April - 430 58 18 3.4 48 18 - - 0 99 0.19 38
November 7.58 660 95 18 12 82 17 0 37 9.2 164 0.12 45 46 Tachinganedam April - 115 34 8.8 2.9 - - - - - 5.7 0.06 2.9

Ground Water Year Book of Kerala (2013-14)
126
1 2 3 4 5 6 7 8 9 10 11 12 13 14 15 16 47 Tanur April 7.89 176 20 6.4 0.97 - - - - - 27 0.06 0.55 48 Tazhekode April - 129 26 6.4 2.4 - - - - - 23 0.15 8.4 49 Tenhipalam April 7.43 109 16 4.8 0.97 - - - - - 18 0.05 12 50 Thavannur April 8.33 166 58 21 1.5 7.7 1.2 4.8 59 5 16 0 0.09 51 Thiruvali April 8.2 121 34 8.8 2.9 - - - - - 9.9 0.22 1.9 52 Thuvur April - 159 34 11 1.5 - - - - - 20 0.16 7.9 53 Tirunavaya April 8.89 282 94 15 14 19 1.5 18 67 20 26 0.15 3.2 54 Tirur April 7.84 153 34 8 3.4 13 1.9 0 27 3 21 0.06 17
November 8.09 220 72 15 8.3 15 2.1 0 88 4.1 24 0.32 6.3 55 Tirurangadi April 7.44 95 16 5.6 0.49 - - - - - 17 0.07 4 56 Tripanchi April 8.72 94 22 4.8 2.4 8.7 0.7 7.2 4.9 0.32 16 0.15 6.6
November 7.36 101 22 4 2.9 7.2 0.5 0 12 0.19 17 0.08 10 57 Vadakkemanna April - 220 32 10 1.5 - - - - - 40 0.42 24 58 Valancheri April 8.88 645 110 26 11 72 12 6 31 11 146 0.05 50
November 7.12 80 10 2.4 0.97 8.5 2.2 0 7.3 0.09 16 0.12 7.3 59 Vazhikadavu April 8.12 360 86 18 9.7 38 16 0 171 19 34 0.17 0.9
November 7.88 91 34 8 3.4 5.3 0.5 0 54 0.85 2.8 0.14 0.2 60 Vylattur April 4.49 76 6 1.6 0.49 - - - - - 13 0.07 12 61 Wandur April 7.32 210 34 8.8 2.9 21 7.7 0 17 0.9 41 0.15 28
November 7.37 68 14 3.2 1.5 6.1 0.9 0 12 0.47 9.9 0.08 6.3 PALAKKAD DISTRICT
Sl. No. Location Month pH
EC in µS/cm
at 250C
TH as CaCO3 Ca Mg Na K CO3 HCO3 SO4 Cl F NO3 <---------------------------------Concentration in mg/L----------------------------->
1 2 3 4 5 6 7 8 9 10 11 12 13 14 15 16 1 Adiparanda April 8.94 154 24 7.2 1.5 20 1.1 14 32 0 23 0.37 1.1
November 8.44 95 22 6.4 1.5 9.5 1.6 2.4 44 1.1 8.5 0.12 0.27 2 Agali April 8.21 800 185 44 18 89 3.2 0 92 49 142 0.44 76

Ground Water Year Book of Kerala (2013-14)
127
1 2 3 4 5 6 7 8 9 10 11 12 13 14 15 16 November 8.36 540 115 22 15 72 2.3 12 146 52 53 0.46 42
3 Alanallur April - 250 26 9.6 0.49 - - - - - 50 0.27 4.6 4 Alathur April 8.64 510 145 22 22 41 2.4 18 67 21 107 0.63 3.5
November 8.51 460 138 22 20 41 5.7 7.2 115 31 71 0.56 0.52 5 Ambalappara April 7.89 139 34 8.8 2.9 12 0.9 0 46 0 24 0.23 0
November 7.74 91 16 4.8 0.97 11 0.5 0 15 0.32 24 0.02 2.7 6 Ariyur April 7.94 74 26 9.6 0.49 - - - - - 2.8 0.16 0.27 7 Athikode April 8.82 1640 236 14 49 - - - - - 292 1.3 1.6 8 Athipetta April 8.53 430 98 12 16 36 24 9.6 134 0 74 0.38 0.34
November 8.34 240 88 22 8.3 15 1.5 Tr 107 6.6 21 0.4 0.75 9 Chakkanthara April - 250 36 7.2 4.4 - - - - - 27 0.16 0.74
10 Chalisseri April 7.95 151 26 7.2 1.9 16 4.7 0 34 0 31 0.14 1.1 November 6.7 152 22 6.4 1.5 13 4.5 0 4.9 0.63 27 0.08 21 11 Chavadiyur April 8.55 540 160 9.6 33 - - - - - 25 0.71 7.2
12 Chemmampathi(Near by well) April - 500 100 16 15 57 16 - - 38 103 0.61 25
November 8.42 390 164 25 25 16 2.3 4.8 122 71 14 0.26 5.3 13 Cherpulassery April - 156 48 2.4 10 13 15 - - 8.1 16 0.22 2.5
November - 200 60 14 6.3 16 4.7 - - 5.3 30 0.16 1.3 14 Chittoor April - 790 60 6 11 - - - - - 68 0.43 2.4 15 Chullimade April - 740 120 10 23 117 2.4 - - 45 100 0.58 0.6
November - 1060 115 10 22 210 2.5 - - 43 92 1.56 4.9 16 Erattakulam April 8.74 250 74 9.6 12 - - - - - 24 0.43 0.6 17 Gopalapuram April - 670 120 30 11 84 2.6 - - 0 156 0.63 68
November - 630 150 38 13 61 1.2 - - 3.9 107 0.4 101 18 Kakkupady April - 147 26 9.6 0.49 - - - - - 17 0.27 0.69 19 Kalladikode April 8.77 114 14 4 0.97 - - - - - 17 0.08 5.6 20 Kanjikode April - 820 25 4 3.6 115 82 - - 40 132 0.49 36
November - 850 90 6 18 83 96 - - 37 114 0.22 21

Ground Water Year Book of Kerala (2013-14)
128
1 2 3 4 5 6 7 8 9 10 11 12 13 14 15 16 21 Kanjirapuzha April 8.1 106 34 13 0.49 6.8 1.4 0 59 0 8.5 0.17 0.84
November 7.95 98 26 8.8 0.97 8.2 0.6 0 41 0.95 11 0.02 2.4 22 Karavannorthara April 8.74 520 165 36 18 - - - - - 115 0.47 0.56 23 Karimpuzha April 7.28 35 6 0.8 0.97 - - - - - 8.5 0.03 0.51 24 Karumkulam April 8.76 380 138 14 25 - - - - - 37 0.42 0.76 25 Kodavayur April 8.6 200 38 6.4 5.4 - - - - - 18 0.66 0.39 26 Kollengode April - 540 110 9.6 21 - - - - - 92 0.38 1 27 Kongad April 8.82 350 82 17 9.7 - - - - - 50 0.17 52 28 Kopanur April - 1930 50 4 9.7 - - - - - 231 4.85 2.1 29 Koppam April - 161 30 7.2 2.9 20 2.5 - - 0 33 0.18 0.58
November - 157 24 7.2 1.5 20 2 - - 1.3 33 0.14 12 30 Kottanad April 8.65 121 22 7.2 0.97 - - - - - 20 0.06 5.4 31 Kottapuram April 8.44 210 48 13 3.9 - - - - - 28 0.15 15 32 Kozhippara April 8.61 970 225 18 44 - - - - - 178 0.5 0.66 33 Kudallur April 8.59 153 38 13 1.5 - - - - - 17 0.2 0.27 34 Kumaramputhur April 8.18 117 34 9.6 2.4 - - - - - 9.9 0.21 0.07 35 Kumaranallur April 8.32 129 30 8 2.4 - - - - - 23 0 0.86 36 Kuzhalmannam April 8.82 490 88 13 14 - - - - - 50 0.6 0.24 37 Malampuzha April 8.57 340 72 16 7.8 - - - - - 58 0.17 1.3
November 8.27 195 74 18 7.3 9.7 3 0 88 12 13 0.26 0.52 38 Mankara April - 230 30 10 0.97 24 12 - - 17 33 0.21 8
November 8.29 290 68 14 8.3 25 12 0 78 21 34 0.06 14 39 Mannarghat April - 280 52 15 3.4 - - - - - 43 0.11 37 40 Mattumandha April - 290 32 10 1.5 - - - - - 54 0.15 1.6 41 Mattathukkad April 8.97 790 130 10 26 - - - - - 85 1.29 33 42 Meenakshipuram April - 740 80 14 11 108 11 - - 48 146 0.42 70
November - 790 155 24 23 94 8.4 - - 58 110 0.2 80 43 Mundur April - 157 28 9.6 0.97 19 2.6 - - 0 20 0.39 5
November - 210 62 10 8.8 17 6.3 - - 5.5 16 0.16 2.7

Ground Water Year Book of Kerala (2013-14)
129
1 2 3 4 5 6 7 8 9 10 11 12 13 14 15 16 44 Nadupeni April 8.97 1140 215 16 43 - - - - - 142 1.42 41 45 Odannur April 7.72 137 34 7.2 3.9 10 3.1 0 39 0 18 0.26 0
November 8.01 159 44 8.8 5.4 12 3.4 0 37 10 23 0.1 4.5 46 Oottara April - 770 95 2 22 - - - - - 103 1.25 6.6 47 Ottapalam April 7.92 370 46 9.6 5.4 54 1.4 0 59 0 77 0.14 24
November 8.48 520 90 18 11 54 27 6 49 38 75 0.1 71 48 Palappuram April 8.82 710 115 24 13 - - - - - 96 0.18 108 49 Palghat April 8.79 410 64 11 8.8 60 2 9.6 63 27 75 0.57 2.6
November - 480 124 15 21 52 1.5 - - 39 67 0.75 0.49 50 Panayur April 8.85 470 142 14 26 - - - - - 60 0.62 0.72 51 Pattambi April 8.7 280 66 16 6.3 26 5.3 7.2 49 12 44 0.26 7.9
November 8.18 270 64 15 6.3 25 5.3 0 49 17 43 0.06 20 52 Peringode April 7.8 118 20 5.6 1.5 - - - - - 24 0.04 0.83 53 Perumatti April 8.75 410 124 14 22 - - - - - 34 1.11 0.48 54 Pudhupariyaram April - 260 48 10 5.4 - - - - - 40 0.45 11 55 Punchapadam April 8.71 74 12 4 0.49 7.5 3.8 2.4 24 0 9.9 0.25 0.78
November 7.42 81 16 3.2 1.9 7.4 4 0 15 0.1 11 0.02 9.4 56 RVP Pudhur April 8.65 290 102 15 16 - - - - - 23 0.58 1.3 57 Shornur April 8.81 210 74 18 6.8 14 2.9 14 83 1.8 24 0.23 0
November 8.05 126 28 6.4 2.9 12 2.2 0 44 2.8 17 0.02 4.5 58 Tachanattukara April - 183 20 8 0 - - - - - 33 0.04 18 59 Tannirkode April - 112 16 5.6 0.49 - - - - - 18 0.23 4.4 60 Tavalam April - 230 42 16 0.49 - - - - - 40 0.26 22 61 Tenkara April - 110 24 8.8 0.49 - - - - - 9.9 0.19 3.2 62 Thachanpara April - 162 24 8 0.97 14 8.6 - - 0.58 21 0.24 2.6
November 8.13 240 46 15 1.9 28 3.4 0 41 2.4 33 0.03 42 63 Tholanur April 8.41 350 102 23 11 25 15 7.2 117 10 45 0.41 1.2
November 8.22 125 40 11 2.9 7.1 2 0 56 3.2 8.5 0.1 2.9 64 Trittala April - 410 88 13 14 - - - - - 62 0.32 0.67

Ground Water Year Book of Kerala (2013-14)
130
1 2 3 4 5 6 7 8 9 10 11 12 13 14 15 16 65 Vadakkancherry April - 780 100 14 16 - - - - - 146 0.27 49 66 Vallapuzha April 8.16 134 34 7.2 3.9 - - - - - 13 0.23 4.2 67 Vaniyamkulam April - 870 90 32 2.4 - - - - - 220 0.38 59 68 Vattassery(Kottassery) April 7.78 110 30 8 2.4 - - - - - 7.1 0.07 1.2 69 Walayar(near by well) April 8.87 720 195 18 36 - - - - - 139 0.92 6.7
PATHANAMTHITTA DISTRICT
Sl. No. Location Month pH
EC in µS/cm
at 250C
TH as CaCO3 Ca Mg Na K CO3 HCO3 SO4 Cl F NO3 <---------------------------------Concentration in mg/L------------------------------>
1 2 3 4 5 6 7 8 9 10 11 12 13 14 15 16 1 Angadikkal North April 8.39 70 18 7.2 0 4.3 2.1 2.4 24 1.7 5.7 0.27 0.57
November 7.21 73 22 5.6 1.9 3.5 0.5 0 24 1.4 5.7 0 3 2 Ankamuzhi April 7.33 96 18 5.6 0.97 7.3 3.9 0 15 0 9.9 0.2 15
November 6.91 60 10 3.2 0.49 4.5 3.6 0 7.3 0.97 8.5 0.08 8.4 3 Aranmula April 7.7 220 66 13 8.3 14 1.2 0 54 11 17 0.3 23
November 7.68 250 80 15 10 15 1.2 0 61 11 24 0 30 4 Enathu April 8.49 500 90 24 7.3 46 16 4.8 27 21 88 0.31 43
November 7.93 330 80 23 5.4 24 12 0 78 33 36 0.07 21 5 Ilanthur April 8.44 82 18 6.4 0.49 6.6 2.6 2.4 15 2.1 13 0.35 4.5
November 7.16 92 20 5.6 1.5 7.2 3.4 0 22 2.5 13 0.06 5.7 6 Karikulam April 7.34 137 34 9.6 2.4 7.7 1.9 0 24 3.3 17 0.17 12
November 7.36 63 22 6.4 1.5 4 1.4 0 29 1.4 7.1 0.01 3.4 7 Kaviyur April 7.65 56 12 4 0.49 5.2 0.9 0 12 1.2 5.7 0.2 9
November 5.73 69 10 2.4 0.97 8.5 1.2 0 7.3 0.29 14 0.11 9.6 8 Konni April - 132 28 8.8 1.5 6.8 7.5 - - 0 17 0.36 2.9
November 6.81 220 40 8 4.9 19 8.2 0 9.8 1.4 45 0.03 24 9 Koodal April 7.13 74 18 5.6 0.97 - - - - - 9.9 0.15 10

Ground Water Year Book of Kerala (2013-14)
131
1 2 3 4 5 6 7 8 9 10 11 12 13 14 15 16 10 Kootanadu April 7.37 133 24 6.4 1.9 11 3.3 0 15 3.1 23 0.32 10
November 6.88 125 20 4.8 1.9 11 4.2 0 9.8 2.8 20 0.13 16 11 Kumplanipoika April 8.5 73 20 5.6 1.5 - - - - - 8.5 0.34 7.1 12 Laha Balawadi April 7.41 87 24 7.2 1.5 4 3.8 0 20 4.4 9.9 0.23 11
November 6.88 48 12 3.2 0.97 2.4 2.5 0 9.8 2.4 5.7 0 7 13 Mallapally April 7.25 60 14 4 1 4.7 1.4 0 9.8 1.4 8.5 0.18 6.6
November 6.94 53 12 4 0.49 4.8 1.4 0 9.8 0.97 8.5 0 6 14 Muthoor April 7.25 92 30 9.6 1.5 3.3 2.5 0 17 13 8.5 0.31 1.7
November 7.19 188 40 14 0.97 15 4.8 0 24 21 20 0 23 15 Naduvathumuzhi April - 93 22 8 0.5 - - - - - 7.1 0.19 1.1 16 Nilakkal April - 87 24 8 1 4.4 2.2 - - 0.78 8.5 0.19 3.1
November 6.66 89 20 4.8 1.9 7.4 1.3 0 9.8 0.29 18 0.01 11 17 Pandalam April 7.48 69 24 4 3.4 5.3 0.2 0 24 0.7 8.5 0.26 4.3
November 7.16 57 16 2.4 2.4 5.3 0.4 0 22 0.57 8.5 0 2.8 18 Pathanamthitta April 7.29 230 52 13 4.9 18 5.6 0 17 3.9 31 0.22 57
November 6.95 230 58 18 3.4 17 5.9 0 15 11 30 0.15 53 19 Peringara April 8.09 172 52 9.6 6.8 13 0.9 0 63 3.3 20 0.3 5.8
November 7.52 106 36 5.6 5.4 7.8 0.2 0 44 2.5 11 0.22 6.3 20 Plapally April 7.75 55 16 5.6 0.5 2.5 2.4 0 24 1.5 4.3 0.03 0.49
November 7.15 43 12 4 0.49 2.2 2 0 17 1.7 4.3 0 1.6 21 Prakkanam April 8.16 63 10 3.2 0.5 5.4 4.6 0 15 0.43 9.9 0.24 4.3
November 6.93 44 8 2.4 0.49 4.4 1.1 0 4.9 0.96 9.9 0.04 4.1 22 Pulikeezh April - 85 30 9.6 1.5 4.1 1.1 - - 3.5 7.1 0.28 1.3
November 8.04 161 74 26 2.2 4.2 0.7 0 95 9.6 4.3 0.06 0.09 23 Ranni April 7.74 61 12 4.8 0 4.3 2 0 12 0.74 7.1 0.2 7.7
November 7.15 43 8 1.6 0.97 3.9 1.6 0 7.3 0 8.5 0.16 5.2 24 Ranni Perunad April - 93 26 7.2 1.9 4.9 4.1 - - 0 5.7 0.41 1.4
November 7.55 82 24 7.2 1.5 6.1 2 0 29 2.4 7.1 0 7.9 25 Thatta April 7.99 82 26 8.8 1 3.9 2.5 0 27 6.8 7.1 0.57 0.77

Ground Water Year Book of Kerala (2013-14)
132
1 2 3 4 5 6 7 8 9 10 11 12 13 14 15 16 November 7.56 69 22 8 0.49 4.4 1.3 0 29 2.5 8.5 0.37 0.71 26 Thelliyur April 7.76 103 30 8 2.4 7 3.1 0 29 5.5 11 0.32 5.2
November 8.33 99 26 8 1.5 7.3 2.5 Tr 32 7 9.9 0.05 5 27 Ullannur April 7.35 51 18 4.8 1.5 3 2.7 0 15 2.4 4.3 0 3.7
November 7 43 8 2.4 0.49 4 2.1 0 4.9 0.76 9.9 0 4.4 28 Vadasserikkara April 8.19 124 50 16 2.4 3.5 0.9 0 44 7.8 5.7 0.35 9.2
November 7.49 85 32 11 1.1 3.2 0.5 0 32 7.3 4.3 0.31 5.6 November 7.15 43 8 1.6 0.97 3.9 1.6 0 7.3 0 8.5 0.16 5.2 24 Ranni Perunad April - 93 26 7.2 1.9 4.9 4.1 - - 0 5.7 0.41 1.4
November 7.55 82 24 7.2 1.5 6.1 2 0 29 2.4 7.1 0 7.9 25 Thatta April 7.99 82 26 8.8 1 3.9 2.5 0 27 6.8 7.1 0.57 0.77
November 7.56 69 22 8 0.49 4.4 1.3 0 29 2.5 8.5 0.37 0.71 26 Thelliyur April 7.76 103 30 8 2.4 7 3.1 0 29 5.5 11 0.32 5.2
November 8.33 99 26 8 1.5 7.3 2.5 Tr 32 7 9.9 0.05 5 27 Ullannur April 7.35 51 18 4.8 1.5 3 2.7 0 15 2.4 4.3 0 3.7
November 7 43 8 2.4 0.49 4 2.1 0 4.9 0.76 9.9 0 4.4 28 Vadasserikkara April 8.19 124 50 16 2.4 3.5 0.9 0 44 7.8 5.7 0.35 9.2
November 7.49 85 32 11 1.1 3.2 0.5 0 32 7.3 4.3 0.31 5.6 THRISSUR DISTRICT
Sl. No. Location Month pH
EC in µS/cm
at 250C
TH as CaCO3 Ca Mg Na K CO3 HCO3 SO4 Cl F NO3 <---------------------------------Concentration in mg/L----------------------------->
1 2 3 4 5 6 7 8 9 10 11 12 13 14 15 16 1 Adatt April 7.32 153 20 5.6 1.5 16 3.4 0 12 0.5 28 0 15
November 6.94 129 14 4 0.97 20 2.4 0 4.9 0 28 0.32 12 2 Annamanada April 7.81 151 24 5.6 2.4 17 7.2 0 9.8 3.1 26 0.04 20
November 6.93 168 26 7.2 1.9 19 5.2 0 7.3 0 37 0.11 20

Ground Water Year Book of Kerala (2013-14)
133
1 2 3 4 5 6 7 8 9 10 11 12 13 14 15 16 3 Athani April 7.83 95 16 5.6 0.5 7.1 2.4 0 9.8 0 17 0.14 12
November 8.45 184 46 13 3.4 15 10 7.2 49 3 27 0.2 0.66 4 Azhikode April - 1850 220 38 31 260 27 - - 225 420 0.33 8.5 5 Chalakudy April - 62 10 3.2 0.49 7.4 1.9 - - 1.2 11 0 2.1
November 6.11 50 16 2.4 2.4 4.7 0.2 0 7.3 0 9.9 0.16 5.2 6 Chavakkad April 8.8 210 54 17 2.9 17 7.2 9.6 39 21 23 0.2 2.4
November 7.79 192 62 22 1.9 12 2.7 0 78 12 16 0.27 1.6 7 Chelakkara April - 240 32 13 0 29 1.4 - - 15 38 0.65 1.2
November 8.22 440 160 22 26 32 4.1 0 185 19 55 0.53 0 8 Chelakkod April - 68 14 3.2 1.5 6.2 1.4 - - 0.3 8.5 0.24 1 9 Cherukunnu April 7.33 69 8 1.6 0.97 - - - - - 11 0.02 0.4
10 Echipara April - 66 18 7.2 0 4.3 1.4 - - 2.1 8.5 0 0.32 11 Erumapetty April - 97 16 4 1.5 9 2 - - 2.2 14 0.12 5.9
November 7.44 95 18 4 1.9 10 2.1 0 12 0 16 0.12 10 12 Guruvayur April 8.58 200 58 16 4.4 17 2.5 4.8 59 5 26 0.13 2.3
November 7.94 200 60 15 5.4 22 2.4 0 90 1 26 0.14 0 13 Irinjalakuda April 7.59 73 20 6.4 0.97 5.7 1.5 0 22 2.6 8.58 0.14 2.7 14 Keechery April - 350 56 14 5.4 - - - - - 60 0.2 61
November 8.27 480 104 23 11 62 4.4 Tr 195 15 62 0.36 0 15 Kallumpuram April 7.9 300 60 12 7.3 - - - - - 48 0.16 61 16 Kodungallur April - 350 48 18 0.97 30 11 - - 28 43 0.36 17
November - 520 94 34 1.9 46 12 - - 48 60 0.56 48 17 Kombazha April 7.6 137 30 8.8 1.9 13 4.6 0 46 3.5 14 0.23 1.8
November 8.29 135 18 5.6 0.97 13 8.2 Tr 39 3 20 0 3.3 18 Konnakuzhi I April 7.22 34 10 2.4 0.97 2.8 0.5 0 12 0.3 5.7 0.1 0.1
November 7.21 35 12 3.2 0.97 2.8 0 0 17 0 4.3 0.07 0.29 19 Konnakuzhi ii April 6.31 90 14 4 0.97 9.5 2.3 0 4.9 3.1 18 0 9.8 20 Kunnamkulam April - 69 14 3.2 1.5 - - - - - 11 0.14 3.4 21 Kundannur April 8.57 460 134 17 22 - - - - - 85 0.34 4.6
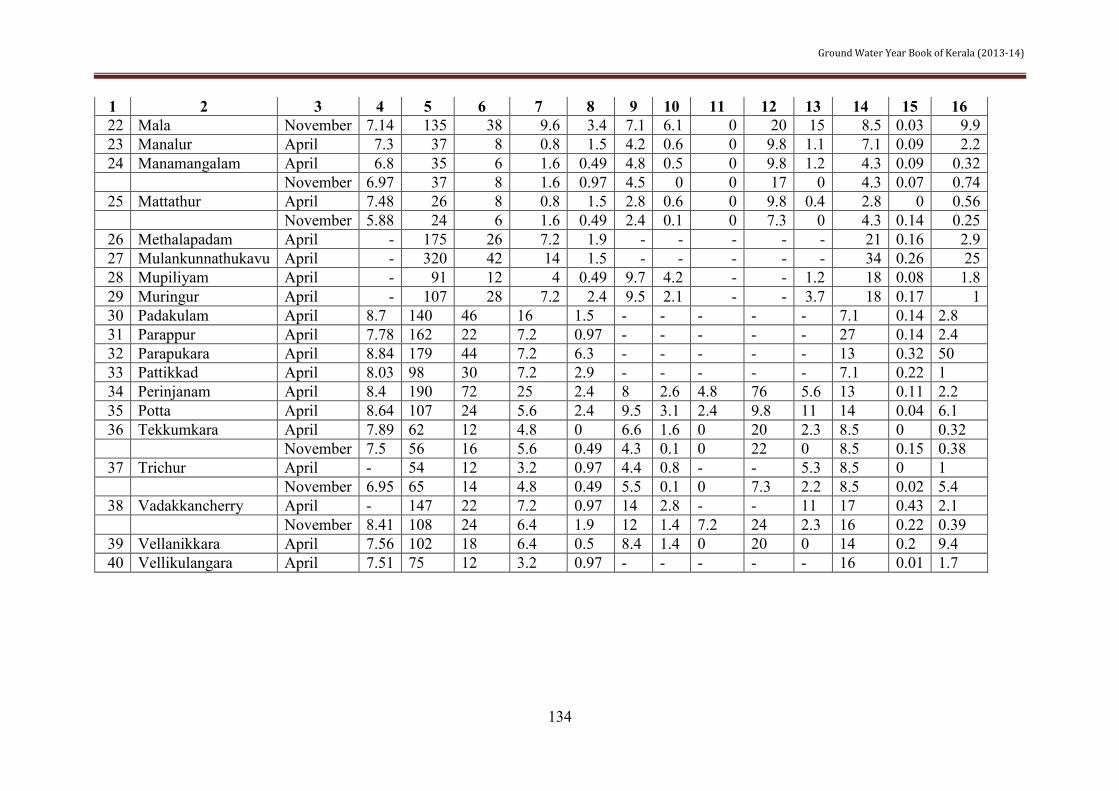
Ground Water Year Book of Kerala (2013-14)
134
1 2 3 4 5 6 7 8 9 10 11 12 13 14 15 16 22 Mala November 7.14 135 38 9.6 3.4 7.1 6.1 0 20 15 8.5 0.03 9.9 23 Manalur April 7.3 37 8 0.8 1.5 4.2 0.6 0 9.8 1.1 7.1 0.09 2.2 24 Manamangalam April 6.8 35 6 1.6 0.49 4.8 0.5 0 9.8 1.2 4.3 0.09 0.32
November 6.97 37 8 1.6 0.97 4.5 0 0 17 0 4.3 0.07 0.74 25 Mattathur April 7.48 26 8 0.8 1.5 2.8 0.6 0 9.8 0.4 2.8 0 0.56
November 5.88 24 6 1.6 0.49 2.4 0.1 0 7.3 0 4.3 0.14 0.25 26 Methalapadam April - 175 26 7.2 1.9 - - - - - 21 0.16 2.9 27 Mulankunnathukavu April - 320 42 14 1.5 - - - - - 34 0.26 25 28 Mupiliyam April - 91 12 4 0.49 9.7 4.2 - - 1.2 18 0.08 1.8 29 Muringur April - 107 28 7.2 2.4 9.5 2.1 - - 3.7 18 0.17 1 30 Padakulam April 8.7 140 46 16 1.5 - - - - - 7.1 0.14 2.8 31 Parappur April 7.78 162 22 7.2 0.97 - - - - - 27 0.14 2.4 32 Parapukara April 8.84 179 44 7.2 6.3 - - - - - 13 0.32 50 33 Pattikkad April 8.03 98 30 7.2 2.9 - - - - - 7.1 0.22 1 34 Perinjanam April 8.4 190 72 25 2.4 8 2.6 4.8 76 5.6 13 0.11 2.2 35 Potta April 8.64 107 24 5.6 2.4 9.5 3.1 2.4 9.8 11 14 0.04 6.1 36 Tekkumkara April 7.89 62 12 4.8 0 6.6 1.6 0 20 2.3 8.5 0 0.32
November 7.5 56 16 5.6 0.49 4.3 0.1 0 22 0 8.5 0.15 0.38 37 Trichur April - 54 12 3.2 0.97 4.4 0.8 - - 5.3 8.5 0 1
November 6.95 65 14 4.8 0.49 5.5 0.1 0 7.3 2.2 8.5 0.02 5.4 38 Vadakkancherry April - 147 22 7.2 0.97 14 2.8 - - 11 17 0.43 2.1
November 8.41 108 24 6.4 1.9 12 1.4 7.2 24 2.3 16 0.22 0.39 39 Vellanikkara April 7.56 102 18 6.4 0.5 8.4 1.4 0 20 0 14 0.2 9.4 40 Vellikulangara April 7.51 75 12 3.2 0.97 - - - - - 16 0.01 1.7

Ground Water Year Book of Kerala (2013-14)
135
TRIVANDRUM DISTRICT
Sl. No. Location Month pH
EC in µS/cm
at 250C
TH as CaCO3 Ca Mg Na K CO3 HCO3 SO4 Cl F NO3 <---------------------------------Concentration in mg/L----------------------------->
1 2 3 4 5 6 7 8 9 10 11 12 13 14 15 16 1 Amboori April 7.72 119 24 7.2 1.5 13 0.8 0 15 0 17 0.1 21
November 6.36 106 16 4.8 0.97 12 1 0 4.9 1.5 17 0.1 23 2 Anjengo April - 258 46 12 3.9 - - - - - 34 0 1.5 3 Aruvikkara April 8.02 95 18 6.4 0.49 - - - - - 14 0 3 4 Athazhamangalam April 7.94 116 26 7.2 1.9 - - - - - 17 0.4 4.4 5 Attingal April 7.71 115 26 8.8 0.97 - - - - - 18 0.13 3.4 6 Chirayinkil April 7.72 341 38 9.6 3.4 - - - - - 70 0.3 8.8 7 Chittagodu April 7.89 312 36 10 2.4 - - - - - 50 0.29 18 8 Kadakkavur April 7.55 388 86 19 9.2 31 3 0 24 26 62 0.02 53
November 7.2 320 88 22 8.3 24 3.7 0 34 82 21 0.2 17 9 Kallambalam April - 431 44 12 3.4 - - - - - 67 0.36 52
10 Kallar April - 96 32 9.6 1.9 6.1 2.6 - - 1.5 8.5 0.08 3.6 November 7.37 55 16 4.8 0.97 3.2 1.1 0 20 2.8 5.7 0.12 1.2 11 Kallikkad April 8.1 290 24 7.2 1.5 - - - - - 62 0.27 8.4 12 Kattakada April 7.81 410 40 9.6 3.9 44 17 0 4.9 0.07 112 0.25 15
November 4.3 290 22 4.8 2.4 24 14 0 0 1.5 74 0.15 7.5 13 Kazhakuttam April 8.49 390 90 27 5.4 30 5.9 2.4 32 56 41 0 43
November 7.7 370 110 35 5.4 30 7.6 0 112 63 30 0.09 9 14 Kilimanoor April 7.89 204 44 14 2.4 - - - - - 24 0.26 8.7 15 Kochuveli April 8.06 207 44 15 1.5 - - - - - 14 0.12 2 16 Korani April 7.93 165 30 10 0.97 16 2.9 0 34 6 26 0.06 5.1
November 7.57 220 26 9.6 0.49 35 1.6 0 32 2.1 44 0.1 22 17 Kulathur April 8.16 141 38 13 1.5 - - - - - 14 0.38 2.6 18 Madavur April - 115 14 4 0.97 9.7 4.6 - - 0.14 17 0.12 8.8

Ground Water Year Book of Kerala (2013-14)
136
1 2 3 4 5 6 7 8 9 10 11 12 13 14 15 16 November 7.17 93 16 4.8 0.97 8.9 2.7 0 22 0.97 14 0.09 7.6 19 Mannanthala April 7.66 232 24 5.6 2.4 26 6.4 0 15 0.04 43 0.09 31
November 6.69 230 22 4.8 2.4 35 8.1 0 9.8 0.58 50 0.15 41 20 Maruthamala April 8.23 140 34 11 1.5 9.8 4.6 0 41 2.6 14 0.17 9.2
November 7.14 96 16 5.6 0.49 8.4 3.7 0 12 3 13 0.06 12 21 Murukumpuzha April 7.81 298 66 22 2.4 - - - - - 55 0 0.62 22 Nagapuram April 7.96 189 30 8 2.4 - - - - - 41 0.11 3.1 23 Nedumangad April 7.97 166 24 8 0.97 16 5.6 0 34 2.1 27 0.07 13
November 7.27 106 28 9.6 0.97 5 2.4 0 17 8.9 13 0.13 4.9 24 Nemom April 8.23 410 64 16 5.8 42 12 0 15 8.4 74 0.16 79
November 6.96 440 78 16 9.2 42 13 0 7.3 4.6 77 0.21 82 25 Neyyattinkara April 7.69 230 38 10 2.9 22 3.8 0 22 0.82 33 0.13 38
November 7.44 210 34 8.8 2.9 22 3.4 0 29 1.3 37 0.1 28 26 Palode April 8.35 179 28 8.8 1.5 16 6.9 2.4 24 6.1 21 0.35 20
November 7.06 165 28 8.8 1.5 13 7.1 0 12 2.6 23 0.06 34 27 Panavoor April - 109 20 7.2 0.49 - - - - - 13 0.2 2 28 Pangode April - 271 28 10 49 30 7.3 - - 0 50 0 51
November 7 139 18 5.6 0.97 17 4.4 0 7.3 0.19 24 0.18 27 29 Parassala April - 1169 155 28 21 - - - - - 295 0.38 2.9 30 Perumathura April - 706 100 36 2.4 - - - - - 149 0.58 34 31 Perumgur April - 246 16 4.8 0.97 - - - - - 50 0.18 4.2 32 Perumkadavila April 8.19 102 22 5.6 1.9 8 3.4 0 29 2 11 0.16 4.8
November 7.4 102 24 5.6 2.4 7.2 4 0 32 1.5 14 0.32 6 33 Perumkuzhi April 8.44 330 86 26 5.4 24 0.9 4.8 39 34 40 0 20
November 7.99 570 194 63 8.8 39 0.5 0 122 39 68 0.13 66 34 Pirappankod April - 107 14 5.6 0 8.6 4.9 - - 0 14 0.27 7.7
November 7.11 130 14 4.8 0.49 19 2.4 0 12 0.39 21 0.35 23 35 Pudukurichi April - 719 100 32 4.9 89 15 - - 28 132 0.51 80
November 8.33 530 122 38 6.8 62 9.9 Tr 183 13 75 0.3 22

Ground Water Year Book of Kerala (2013-14)
137
1 2 3 4 5 6 7 8 9 10 11 12 13 14 15 16 36 Ponmudi April 7.6 84 22 6.4 1.5 - - - - - 8.5 0.02 12 37 Poonthura April - 270 64 20 3.4 16 6.5 - - 14 31 0.25 42
November 8.33 200 50 16 2.4 11 8.8 2.4 32 6.7 27 0.1 12 38 Pozhiyoor April - 1480 145 14 27 238 23 - - 149 284 0.32 23
November 8.22 1960 275 46 39 272 33 0 238 191 390 0.35 22 39 Pulluvila April - - - - - - - - - - - - -
November 7.17 116 20 4.8 1.9 14 0.7 0 15 1.2 27 0.1 9.5 40 Puvar( School) April 8.39 964 145 34 15 - - - - - 178 0.18 51 41 Sasthanthala April - 1286 40 10 3.6 - - - - - 373 0.28 1 42 Thonnakkal April 7.48 158 28 8.8 1.5 - - - - - 23 0.16 20 43 Trivandrum April 8.55 232 44 11 3.9 22 3.9 4.8 20 4.6 37 0.07 22
November 7.08 139 30 8.8 1.9 12 2.2 0 9.8 8.2 20 0.21 19 44 Vamanapuram April 8.31 369 66 20 3.9 28 26 4.8 88 20 47 0.4 3.9
November 7.9 360 94 31 3.9 26 20 0 107 26 43 0.23 24 45 Varkala April - 329 54 16 3.4 32 2.9 - - 5.2 58 0.06 46
November 6.73 270 44 9.6 4.9 26 2.6 0 4.9 0.68 61 0.2 41 46 Vellanad April 7.77 74 18 6.4 0.49 - - - - - 7.1 0.2 4.6 47 Vellarada April - 772 40 6 6.1 - - - - - 164 0.02 21 48 Vellayani April - 185 34 9.6 2.4 - - - - - 33 0.16 7.3 49 Veiyloor April 7.88 554 45 12 3.6 - - - - - 110 0.02 50 50 Venpakal April - 133 28 9.6 0.97 - - - - - 14 0 0.65 51 Vidura April 7.88 147 28 8.8 1.5 - - - - - 18 0.04 23
WAYANAD DISTRICT
Sl. No. Location Month pH
EC in µS/cm at 250C
TH as CaCO3 Ca Mg Na K CO3 Cl F NO3 <---------------------------------Concentration in mg/L--------------------------->
1 2 3 4 5 6 7 8 9 10 11 12 13 14 1 Ambalavayal April 7.36 220 50 12 4.9 20 6.1 0 18 3 31
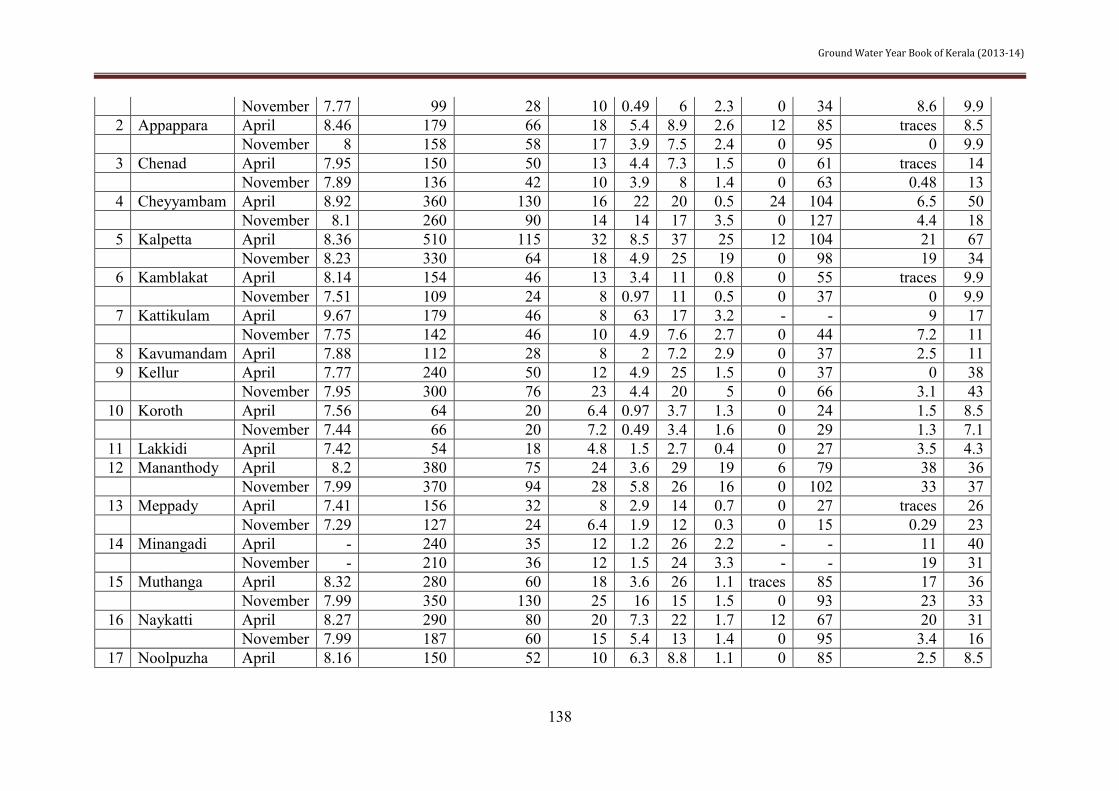
Ground Water Year Book of Kerala (2013-14)
138
November 7.77 99 28 10 0.49 6 2.3 0 34 8.6 9.9 2 Appappara April 8.46 179 66 18 5.4 8.9 2.6 12 85 traces 8.5
November 8 158 58 17 3.9 7.5 2.4 0 95 0 9.9 3 Chenad April 7.95 150 50 13 4.4 7.3 1.5 0 61 traces 14
November 7.89 136 42 10 3.9 8 1.4 0 63 0.48 13 4 Cheyyambam April 8.92 360 130 16 22 20 0.5 24 104 6.5 50
November 8.1 260 90 14 14 17 3.5 0 127 4.4 18 5 Kalpetta April 8.36 510 115 32 8.5 37 25 12 104 21 67
November 8.23 330 64 18 4.9 25 19 0 98 19 34 6 Kamblakat April 8.14 154 46 13 3.4 11 0.8 0 55 traces 9.9
November 7.51 109 24 8 0.97 11 0.5 0 37 0 9.9 7 Kattikulam April 9.67 179 46 8 63 17 3.2 - - 9 17
November 7.75 142 46 10 4.9 7.6 2.7 0 44 7.2 11 8 Kavumandam April 7.88 112 28 8 2 7.2 2.9 0 37 2.5 11 9 Kellur April 7.77 240 50 12 4.9 25 1.5 0 37 0 38
November 7.95 300 76 23 4.4 20 5 0 66 3.1 43 10 Koroth April 7.56 64 20 6.4 0.97 3.7 1.3 0 24 1.5 8.5
November 7.44 66 20 7.2 0.49 3.4 1.6 0 29 1.3 7.1 11 Lakkidi April 7.42 54 18 4.8 1.5 2.7 0.4 0 27 3.5 4.3 12 Mananthody April 8.2 380 75 24 3.6 29 19 6 79 38 36
November 7.99 370 94 28 5.8 26 16 0 102 33 37 13 Meppady April 7.41 156 32 8 2.9 14 0.7 0 27 traces 26
November 7.29 127 24 6.4 1.9 12 0.3 0 15 0.29 23 14 Minangadi April - 240 35 12 1.2 26 2.2 - - 11 40
November - 210 36 12 1.5 24 3.3 - - 19 31 15 Muthanga April 8.32 280 60 18 3.6 26 1.1 traces 85 17 36
November 7.99 350 130 25 16 15 1.5 0 93 23 33 16 Naykatti April 8.27 290 80 20 7.3 22 1.7 12 67 20 31
November 7.99 187 60 15 5.4 13 1.4 0 95 3.4 16 17 Noolpuzha April 8.16 150 52 10 6.3 8.8 1.1 0 85 2.5 8.5

Ground Water Year Book of Kerala (2013-14)
139
1 2 3 4 5 6 7 8 9 10 11 12 13 14 18 Padinjarattara April - 96 32 8 2.9 4.8 1.1 - - 0 5.7
November 7.4 310 66 17 5.8 32 1.6 0 29 7.5 45 19 Panamaram April 8.37 310 75 18 7.3 27 5.2 12 98 17 34
November - 191 38 11 2.4 17 4.8 - - 6.2 26 20 Perikallur April 9.68 320 40 14 1.2 39 2.3 - - 7.5 64
November 7.92 240 42 12 2.9 33 1.3 0 93 0.19 36 21 Periya April 8.17 96 30 7.2 2.9 5.8 1.9 0 39 1 11
November 6.96 22 6 1.6 0.49 2 0.5 0 7.3 0 4.3 22 Pozhutana April 7.39 103 24 5.6 2.4 6.2 6.3 0 34 5 13
23 Pulpally(new well) April 8.72 400 110 14 18 42 4.5 24 153 15 40
November 8.39 590 125 14 22 60 33 18 159 55 50
24 Sulthan Bathery April 8.53 530 120 18 18 51 29 18 116 20 87
November - 260 20 7.2 0.49 25 24 - - 26 34 25 Talapozha April 7.68 85 26 8 1.5 5.6 0.7 0 32 1 14 26 Taruvana April 6.72 101 22 3.2 3.4 9 0.4 0 9.8 traces 21
November 4.67 102 24 4 3.4 6.3 0.6 0 0 0 23 27 Tirunelly April 7.26 43 14 4 0.97 2.6 0.5 0 24 traces 5.7 28 Vaduvanchal April 7.24 169 44 11 3.9 9.7 5.8 0 22 0 19
November 7.19 167 42 10 3.9 10 5.3 0 20 0.39 20 29 Valatt April 8.3 82 32 11 0.97 3.1 0.7 4.8 37 0 7.1
November 7.42 57 20 6.4 0.97 2.8 0.5 0 22 0.38 7.1 30 Vellamunda April 8.31 240 110 30 8.5 13 3.4 12 110 8.5 21
November 7.3 49 12 3.2 0.97 4.1 1.5 0 20 0 7.1 31 Vyttiri April 7.78 182 48 13 3.9 11 7 0 44 20 19
November 7.41 260 64 18 4.4 13 9.4 0 37 24 28 November 8.39 590 125 14 22 60 33 18 159 55 50
- Not Analysed

Central Ground Water Board Kerala Region Kedaram, Kesavadasapuram Thiruvananthapuram – 695004 Kerala State. Ph: 0471-2442175,2442191 Fax: 0471- 2555026, 2442191 E-mail : [email protected] Web: www.cgwb.gov.in, www.mowr.gov.in
केन्द्रीयभूमिजल बोर्ड केरल क्षेत्र
'केदारि', केशवदासपुरि
ततरुवनतंपुरि – 695004
केरलराज्य
दरूभाष :0471-2442175,2442191
फैक्स::0471-2555026,2442191
इ-िेल : [email protected]
वेब: www.cgwb.gov.in, www.mowr.gov.in