Gross State Domestic Product of Telangana State Advance ...
16
Gross State Domestic Product of Telangana State Advance Estimates, 2019-20 (28-02-2020) Directorate of Economics and Statistics Government of Telangana, Hyderabad
Transcript of Gross State Domestic Product of Telangana State Advance ...
Gross State Domestic Product
of
Telangana State
Advance Estimates, 2019-20
(28-02-2020)
Directorate of Economics and Statistics Government of Telangana, Hyderabad
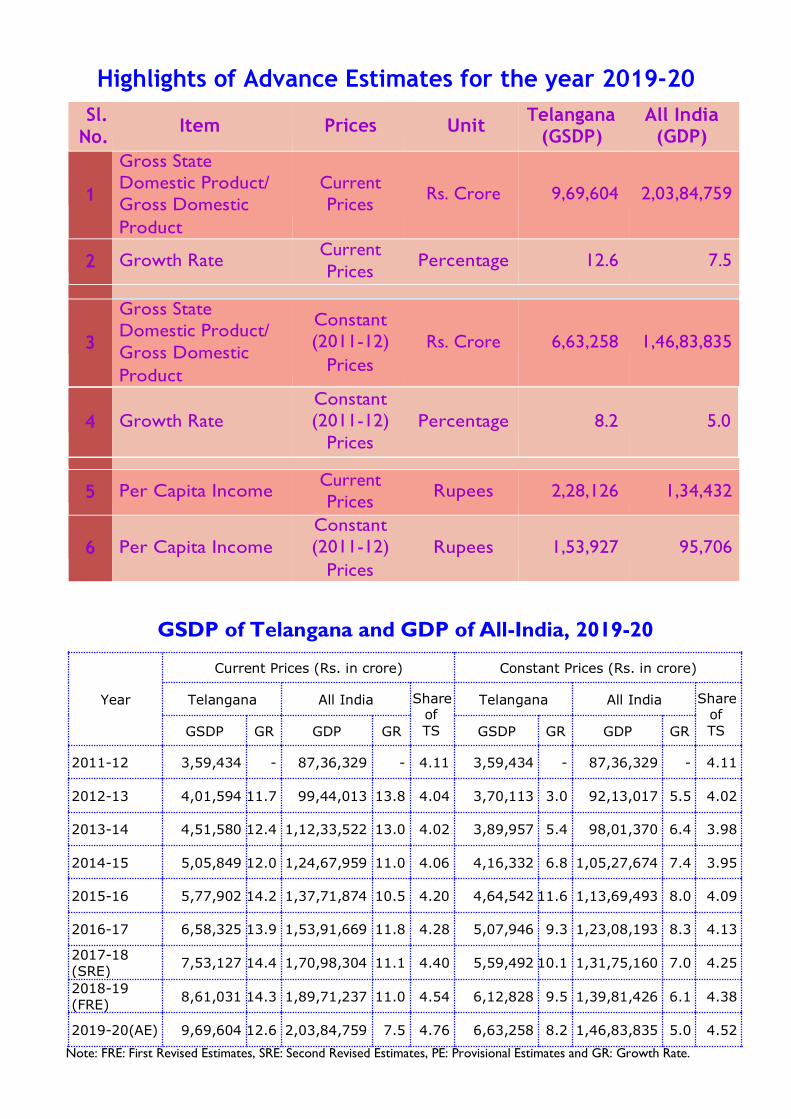
Highlights of Advance Estimates for the year 2019-20
Sl.
No. Item Prices Unit
Telangana (GSDP)
All India (GDP)
1
Gross State
Domestic Product/
Gross Domestic
Product
Current
Prices
Rs. Crore
9,69,604
2,03,84,759
2 Growth Rate Current
Prices Percentage 12.6 7.5
3
Gross State
Domestic Product/
Gross Domestic
Product
Constant
(2011-12)
Prices
Rs. Crore
6,63,258
1,46,83,835
4
Growth Rate
Constant
(2011-12)
Prices
Percentage
8.2
5.0
5 Per Capita Income Current
Prices Rupees 2,28,126 1,34,432
6 Per Capita Income
Constant
(2011-12)
Prices
Rupees
1,53,927
95,706
GSDP of Telangana and GDP of All-India, 2019-20
Year
Current Prices (Rs. in crore) Constant Prices (Rs. in crore)
Telangana All India Share of
TS
Telangana All India Share of
TS GSDP GR GDP GR GSDP GR GDP GR
2011-12 3,59,434 - 87,36,329 - 4.11 3,59,434 - 87,36,329 - 4.11
2012-13 4,01,594 11.7 99,44,013 13.8 4.04 3,70,113 3.0 92,13,017 5.5 4.02
2013-14 4,51,580 12.4 1,12,33,522 13.0 4.02 3,89,957 5.4 98,01,370 6.4 3.98
2014-15 5,05,849 12.0 1,24,67,959 11.0 4.06 4,16,332 6.8 1,05,27,674 7.4 3.95
2015-16 5,77,902 14.2 1,37,71,874 10.5 4.20 4,64,542 11.6 1,13,69,493 8.0 4.09
2016-17 6,58,325 13.9 1,53,91,669 11.8 4.28 5,07,946 9.3 1,23,08,193 8.3 4.13
2017-18 (SRE)
7,53,127 14.4 1,70,98,304 11.1 4.40 5,59,492 10.1 1,31,75,160 7.0 4.25
2018-19 (FRE)
8,61,031 14.3 1,89,71,237 11.0 4.54 6,12,828 9.5 1,39,81,426 6.1 4.38
2019-20(AE) 9,69,604 12.6 2,03,84,759 7.5 4.76 6,63,258 8.2 1,46,83,835 5.0 4.52
Note: FRE: First Revised Estimates, SRE: Second Revised Estimates, PE: Provisional Estimates and GR: Growth Rate.
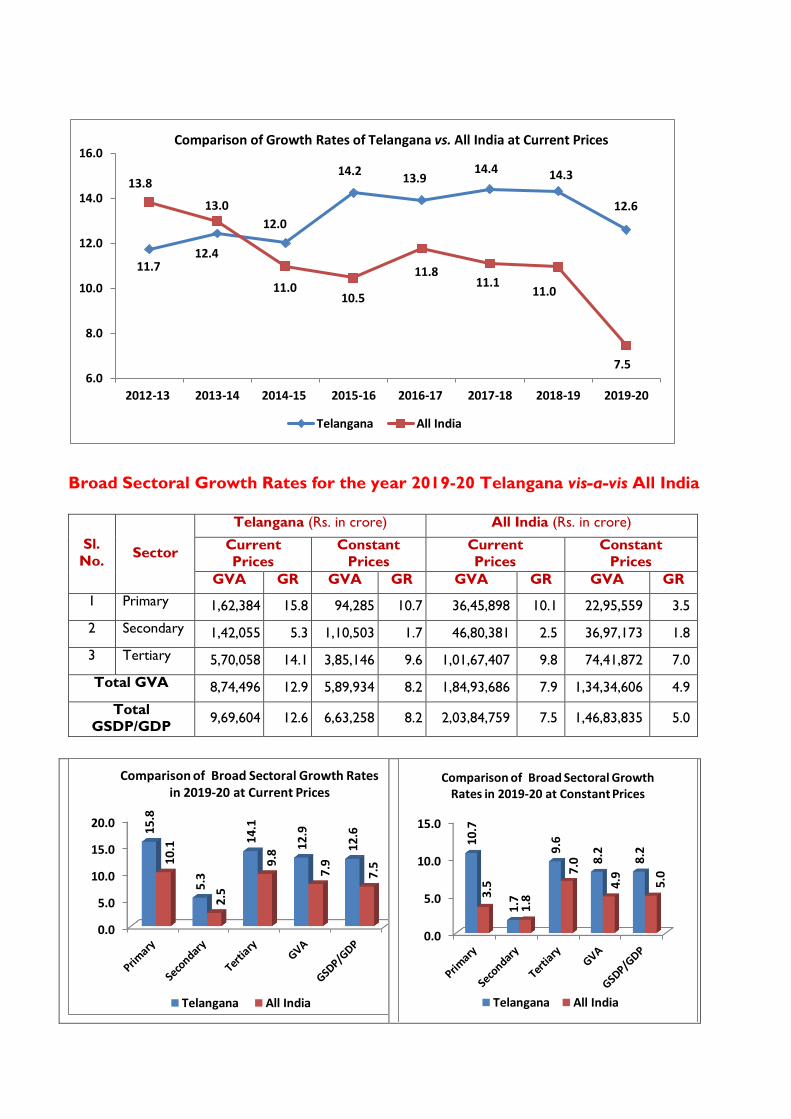
Broad Sectoral Growth Rates for the year 2019-20 Telangana vis-a-vis All India
Sl.
No. Sector
Telangana (Rs. in crore) All India (Rs. in crore)
Current
Prices
Constant
Prices
Current
Prices
Constant
Prices
GVA GR GVA GR GVA GR GVA GR
1 Primary 1,62,384 15.8 94,285 10.7 36,45,898 10.1 22,95,559 3.5
2 Secondary 1,42,055 5.3 1,10,503 1.7 46,80,381 2.5 36,97,173 1.8
3 Tertiary 5,70,058 14.1 3,85,146 9.6 1,01,67,407 9.8 74,41,872 7.0
Total GVA 8,74,496 12.9 5,89,934 8.2 1,84,93,686 7.9 1,34,34,606 4.9
Total
GSDP/GDP 9,69,604 12.6 6,63,258 8.2 2,03,84,759 7.5 1,46,83,835 5.0
11.712.4
12.0
14.213.9
14.4 14.3
12.6
13.8
13.0
11.010.5
11.811.1
11.0
7.56.0
8.0
10.0
12.0
14.0
16.0
2012-13 2013-14 2014-15 2015-16 2016-17 2017-18 2018-19 2019-20
Comparison of Growth Rates of Telangana vs. All India at Current Prices
Telangana All India
0.0
5.0
10.0
15.0
20.0
15.8
5.3
14.1
12.
9
12.
6
10.
1
2.5
9.8
7.9
7.5
Comparison of Broad Sectoral Growth Rates in 2019-20 at Current Prices
Telangana All India
0.0
5.0
10.0
15.0
10.7
1.7
9.6
8.2 8.2
3.5
1.8
7.0
4.9
5.0
Comparison of Broad Sectoral Growth Rates in 2019-20 at Constant Prices
Telangana All India
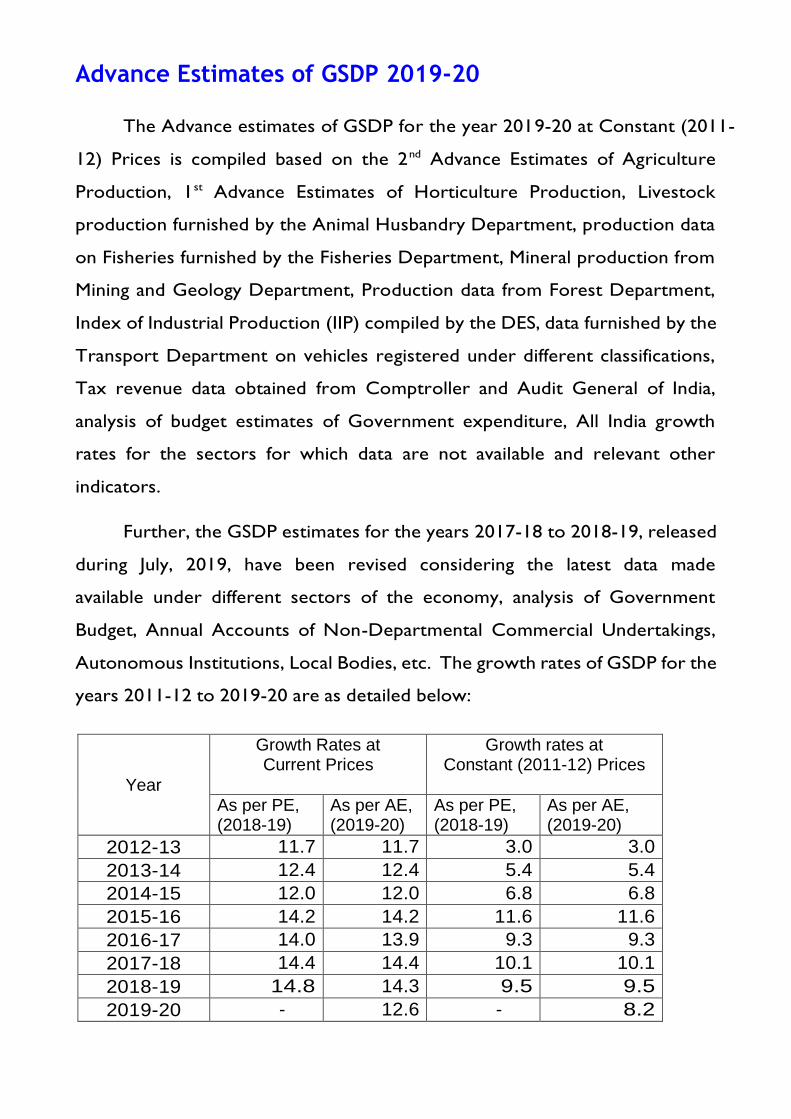
Advance Estimates of GSDP 2019-20
The Advance estimates of GSDP for the year 2019-20 at Constant (2011-
12) Prices is compiled based on the 2nd Advance Estimates of Agriculture
Production, 1st Advance Estimates of Horticulture Production, Livestock
production furnished by the Animal Husbandry Department, production data
on Fisheries furnished by the Fisheries Department, Mineral production from
Mining and Geology Department, Production data from Forest Department,
Index of Industrial Production (IIP) compiled by the DES, data furnished by the
Transport Department on vehicles registered under different classifications,
Tax revenue data obtained from Comptroller and Audit General of India,
analysis of budget estimates of Government expenditure, All India growth
rates for the sectors for which data are not available and relevant other
indicators.
Further, the GSDP estimates for the years 2017-18 to 2018-19, released
during July, 2019, have been revised considering the latest data made
available under different sectors of the economy, analysis of Government
Budget, Annual Accounts of Non-Departmental Commercial Undertakings,
Autonomous Institutions, Local Bodies, etc. The growth rates of GSDP for the
years 2011-12 to 2019-20 are as detailed below:
Year
Growth Rates at Current Prices
Growth rates at Constant (2011-12) Prices
As per PE, (2018-19)
As per AE, (2019-20)
As per PE, (2018-19)
As per AE, (2019-20)
2012-13 11.7 11.7 3.0 3.0
2013-14 12.4 12.4 5.4 5.4
2014-15 12.0 12.0 6.8 6.8
2015-16 14.2 14.2 11.6 11.6
2016-17 14.0 13.9 9.3 9.3
2017-18 14.4 14.4 10.1 10.1
2018-19 14.8 14.3 9.5 9.5
2019-20 - 12.6 - 8.2
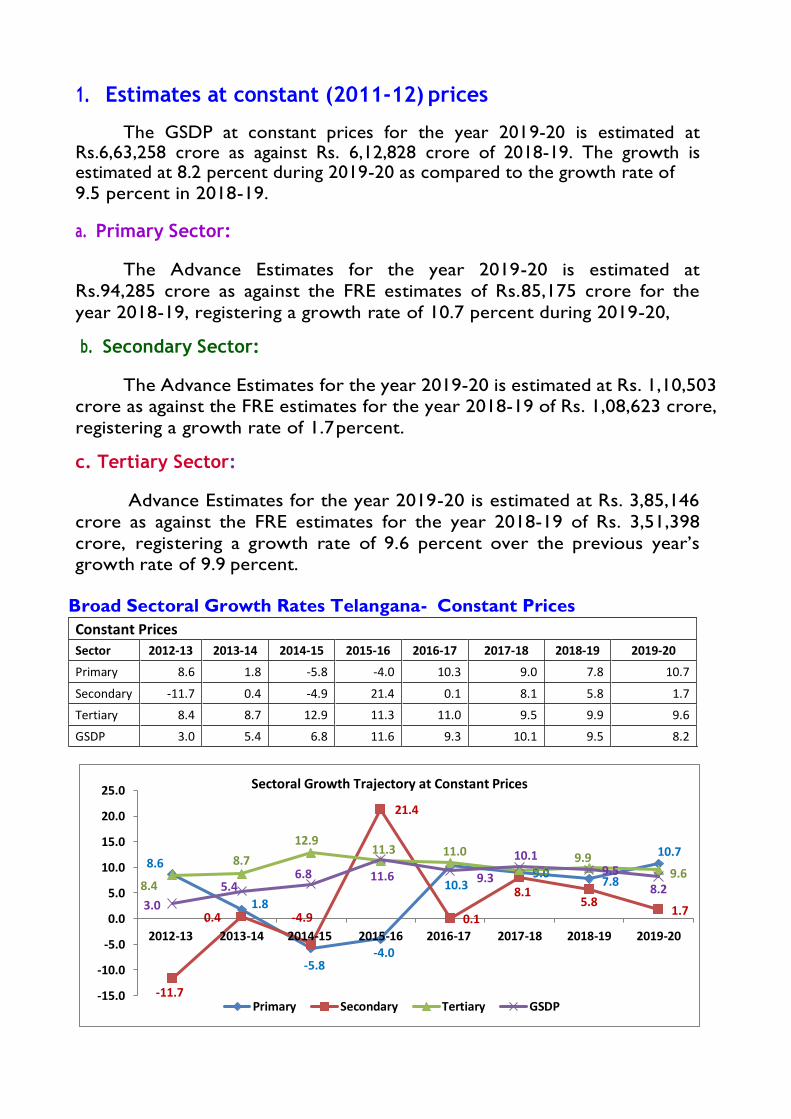
1. Estimates at constant (2011-12) prices
The GSDP at constant prices for the year 2019-20 is estimated at Rs.6,63,258 crore as against Rs. 6,12,828 crore of 2018-19. The growth is estimated at 8.2 percent during 2019-20 as compared to the growth rate of 9.5 percent in 2018-19.
a. Primary Sector:
The Advance Estimates for the year 2019-20 is estimated at
Rs.94,285 crore as against the FRE estimates of Rs.85,175 crore for the
year 2018-19, registering a growth rate of 10.7 percent during 2019-20,
b. Secondary Sector:
The Advance Estimates for the year 2019-20 is estimated at Rs. 1,10,503 crore as against the FRE estimates for the year 2018-19 of Rs. 1,08,623 crore,
registering a growth rate of 1.7 percent.
c. Tertiary Sector:
Advance Estimates for the year 2019-20 is estimated at Rs. 3,85,146
crore as against the FRE estimates for the year 2018-19 of Rs. 3,51,398
crore, registering a growth rate of 9.6 percent over the previous year’s growth rate of 9.9 percent.
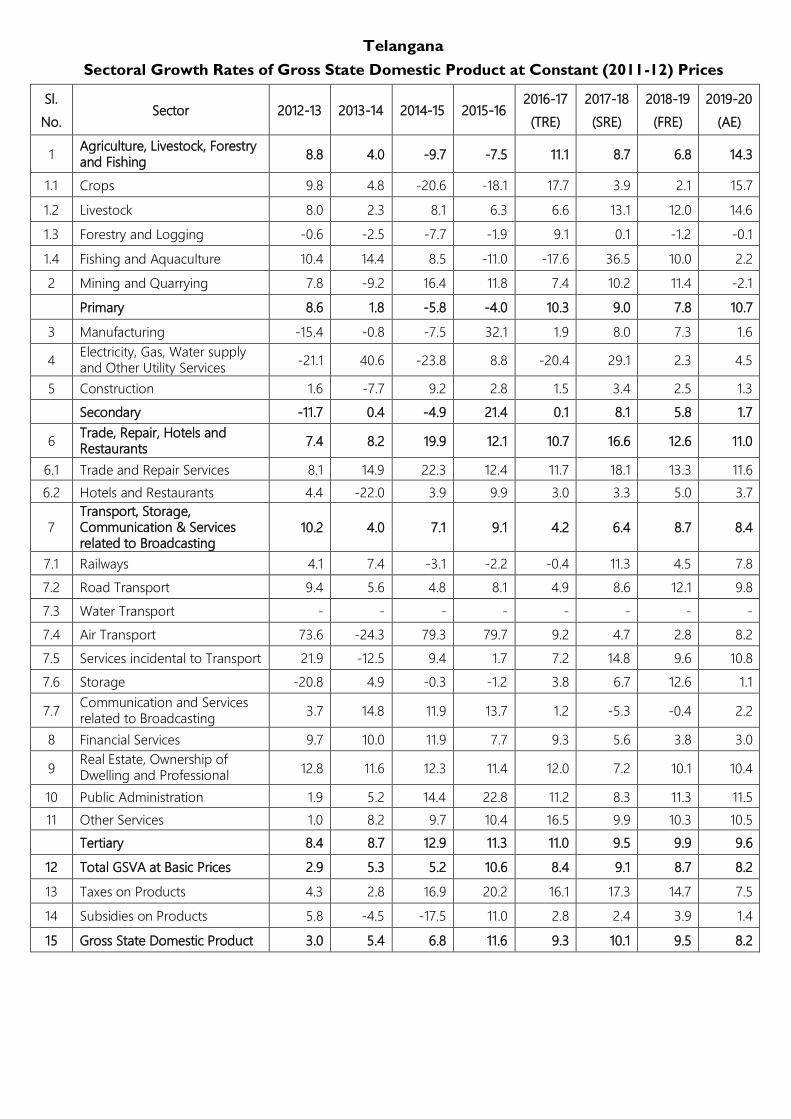
Broad Sectoral Growth Rates Telangana- Constant Prices
Constant Prices
Sector 2012-13 2013-14 2014-15 2015-16 2016-17 2017-18 2018-19 2019-20
Primary 8.6 1.8 -5.8 -4.0 10.3 9.0 7.8 10.7
Secondary -11.7 0.4 -4.9 21.4 0.1 8.1 5.8 1.7
Tertiary 8.4 8.7 12.9 11.3 11.0 9.5 9.9 9.6
GSDP 3.0 5.4 6.8 11.6 9.3 10.1 9.5 8.2
8.6
1.8
-5.8-4.0
10.39.0
7.8
10.7
-11.7
0.4 -4.9
21.4
0.1
8.15.8
1.7
8.4
8.7
12.911.3 11.0
9.59.9
9.6
3.0
5.46.8 11.6 9.3
10.19.5
8.2
-15.0
-10.0
-5.0
0.0
5.0
10.0
15.0
20.0
25.0
2012-13 2013-14 2014-15 2015-16 2016-17 2017-18 2018-19 2019-20
Sectoral Growth Trajectory at Constant Prices
Primary Secondary Tertiary GSDP
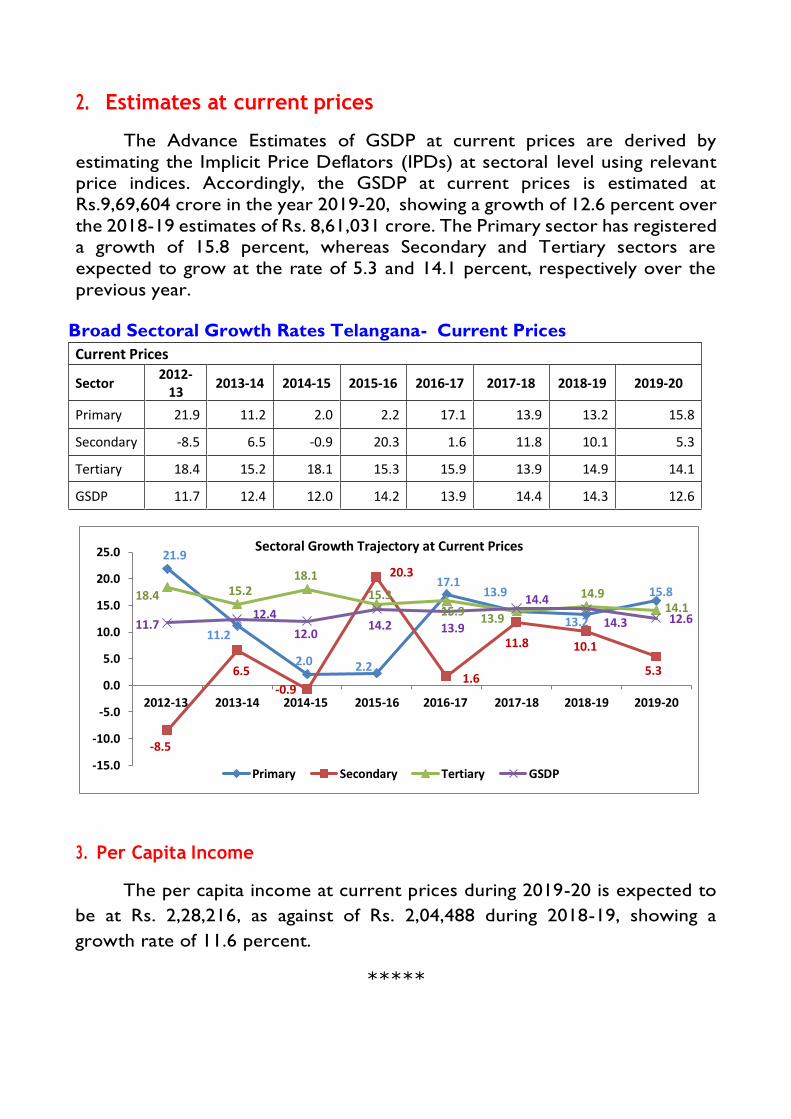
2. Estimates at current prices
The Advance Estimates of GSDP at current prices are derived by
estimating the Implicit Price Deflators (IPDs) at sectoral level using relevant price indices. Accordingly, the GSDP at current prices is estimated at
Rs.9,69,604 crore in the year 2019-20, showing a growth of 12.6 percent over
the 2018-19 estimates of Rs. 8,61,031 crore. The Primary sector has registered a growth of 15.8 percent, whereas Secondary and Tertiary sectors are
expected to grow at the rate of 5.3 and 14.1 percent, respectively over the
previous year.
Broad Sectoral Growth Rates Telangana- Current Prices
Current Prices
Sector 2012-
13 2013-14 2014-15 2015-16 2016-17 2017-18 2018-19 2019-20
Primary 21.9 11.2 2.0 2.2 17.1 13.9 13.2 15.8
Secondary -8.5 6.5 -0.9 20.3 1.6 11.8 10.1 5.3
Tertiary 18.4 15.2 18.1 15.3 15.9 13.9 14.9 14.1
GSDP 11.7 12.4 12.0 14.2 13.9 14.4 14.3 12.6
,
3. Per Capita Income
The per capita income at current prices during 2019-20 is expected to
be at Rs. 2,28,216, as against of Rs. 2,04,488 during 2018-19, showing a
growth rate of 11.6 percent.
*****
21.9
11.2
2.0 2.2
17.113.9
13.2
15.8
-8.5
6.5
-0.9
20.3
1.6
11.8 10.1
5.3
18.4 15.218.1
15.315.9
13.9
14.914.1
11.712.4
12.014.2 13.9
14.4
14.3 12.6
-15.0
-10.0
-5.0
0.0
5.0
10.0
15.0
20.0
25.0
2012-13 2013-14 2014-15 2015-16 2016-17 2017-18 2018-19 2019-20
Sectoral Growth Trajectory at Current Prices
Primary Secondary Tertiary GSDP
Telangana
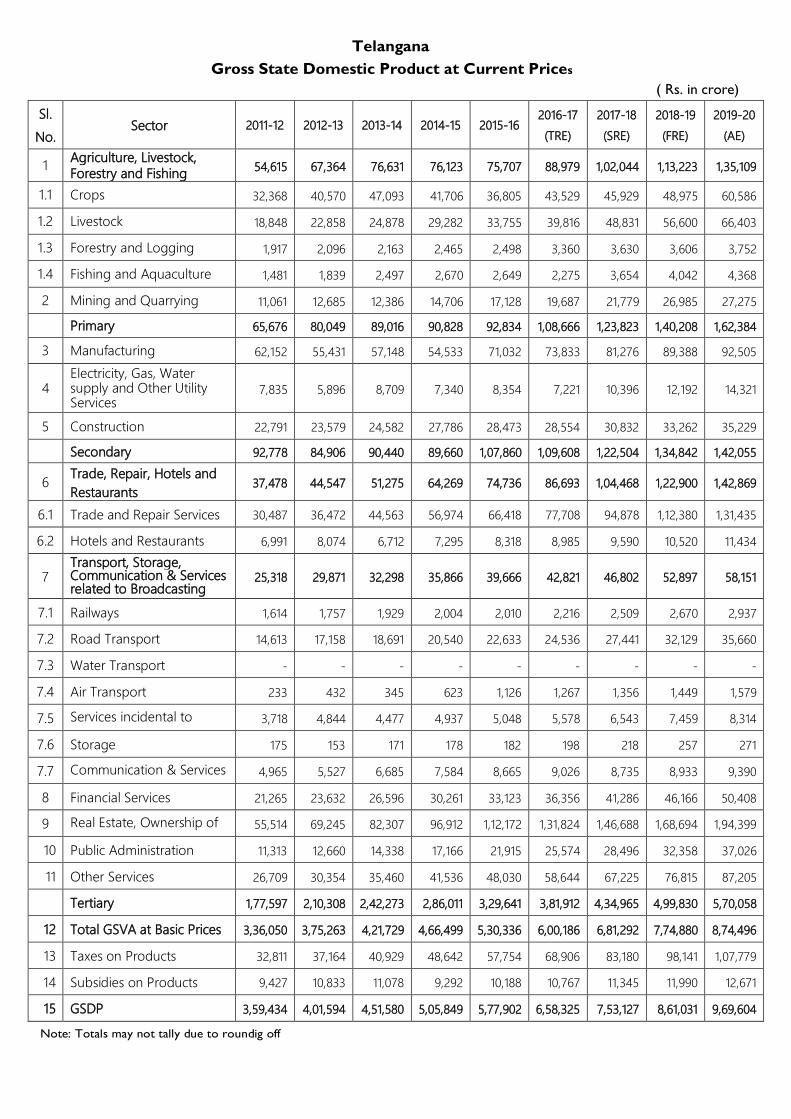
Gross State Domestic Product at Current Prices
( Rs. in crore)
Sl.
No. Sector 2011-12 2012-13 2013-14 2014-15 2015-16
2016-17
(TRE)
2017-18
(SRE)
2018-19
(FRE)
2019-20
(AE)
1 Agriculture, Livestock, Forestry and Fishing
54,615 67,364 76,631 76,123 75,707 88,979 1,02,044 1,13,223 1,35,109
1.1 Crops 32,368 40,570 47,093 41,706 36,805 43,529 45,929 48,975 60,586
1.2 Livestock 18,848 22,858 24,878 29,282 33,755 39,816 48,831 56,600 66,403
1.3 Forestry and Logging 1,917 2,096 2,163 2,465 2,498 3,360 3,630 3,606 3,752
1.4 Fishing and Aquaculture 1,481 1,839 2,497 2,670 2,649 2,275 3,654 4,042 4,368
2 Mining and Quarrying 11,061 12,685 12,386 14,706 17,128 19,687 21,779 26,985 27,275
Primary 65,676 80,049 89,016 90,828 92,834 1,08,666 1,23,823 1,40,208 1,62,384
3 Manufacturing 62,152 55,431 57,148 54,533 71,032 73,833 81,276 89,388 92,505
4 Electricity, Gas, Water supply and Other Utility Services
7,835 5,896 8,709 7,340 8,354 7,221 10,396 12,192 14,321
5 Construction 22,791 23,579 24,582 27,786 28,473 28,554 30,832 33,262 35,229
Secondary 92,778 84,906 90,440 89,660 1,07,860 1,09,608 1,22,504 1,34,842 1,42,055
6 Trade, Repair, Hotels and
Restaurants 37,478 44,547 51,275 64,269 74,736 86,693 1,04,468 1,22,900 1,42,869
6.1 Trade and Repair Services 30,487 36,472 44,563 56,974 66,418 77,708 94,878 1,12,380 1,31,435
6.2 Hotels and Restaurants 6,991 8,074 6,712 7,295 8,318 8,985 9,590 10,520 11,434
7 Transport, Storage, Communication & Services related to Broadcasting
25,318 29,871 32,298 35,866 39,666 42,821 46,802 52,897 58,151
7.1 Railways 1,614 1,757 1,929 2,004 2,010 2,216 2,509 2,670 2,937
7.2 Road Transport 14,613 17,158 18,691 20,540 22,633 24,536 27,441 32,129 35,660
7.3 Water Transport - - - - - - - - -
7.4 Air Transport 233 432 345 623 1,126 1,267 1,356 1,449 1,579
7.5 Services incidental to
Transport
3,718 4,844 4,477 4,937 5,048 5,578 6,543 7,459 8,314
7.6 Storage 175 153 171 178 182 198 218 257 271
7.7 Communication & Services
related to Broadcasting
4,965 5,527 6,685 7,584 8,665 9,026 8,735 8,933 9,390
8 Financial Services 21,265 23,632 26,596 30,261 33,123 36,356 41,286 46,166 50,408
9 Real Estate, Ownership of
Dwelling and Professional
Services
55,514 69,245 82,307 96,912 1,12,172 1,31,824 1,46,688 1,68,694 1,94,399
10 Public Administration 11,313 12,660 14,338 17,166 21,915 25,574 28,496 32,358 37,026
11 Other Services 26,709 30,354 35,460 41,536 48,030 58,644 67,225 76,815 87,205
Tertiary 1,77,597 2,10,308 2,42,273 2,86,011 3,29,641 3,81,912 4,34,965 4,99,830 5,70,058
12 Total GSVA at Basic Prices 3,36,050 3,75,263 4,21,729 4,66,499 5,30,336 6,00,186 6,81,292 7,74,880 8,74,496
13 Taxes on Products 32,811 37,164 40,929 48,642 57,754 68,906 83,180 98,141 1,07,779
14 Subsidies on Products 9,427 10,833 11,078 9,292 10,188 10,767 11,345 11,990 12,671
15 GSDP 3,59,434 4,01,594 4,51,580 5,05,849 5,77,902 6,58,325 7,53,127 8,61,031 9,69,604
Note: Totals may not tally due to roundig off
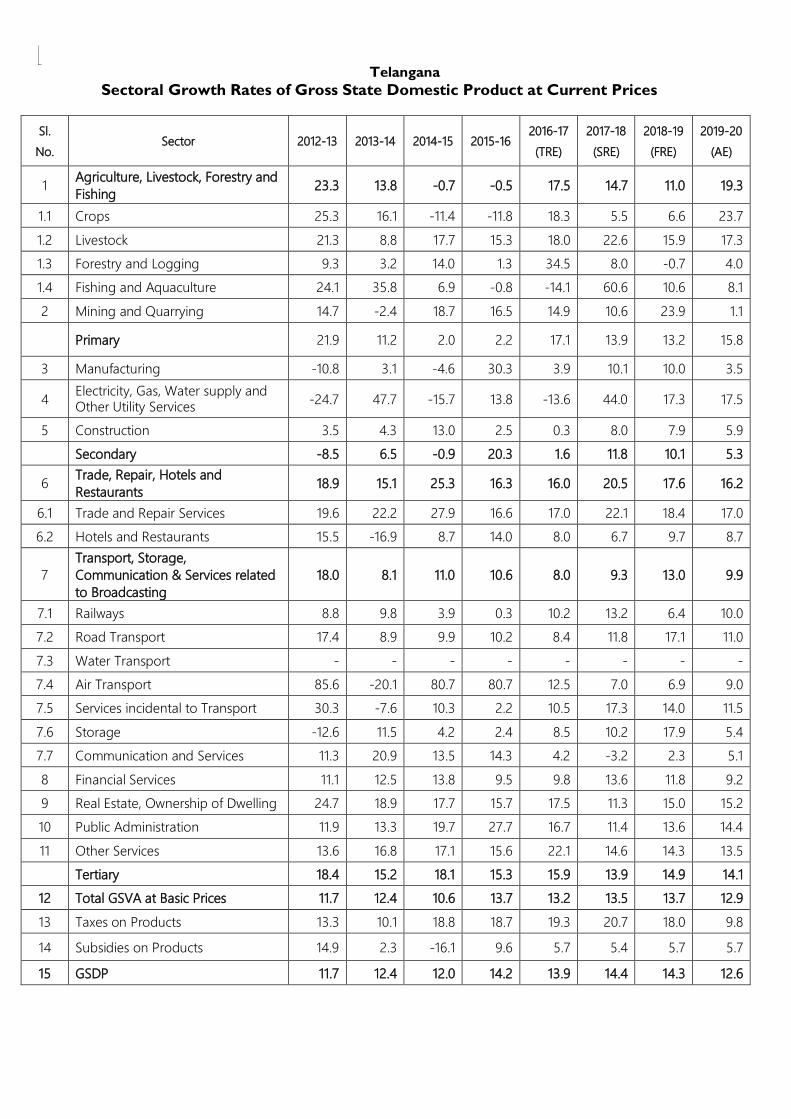
Telangana
Sectoral Growth Rates of Gross State Domestic Product at Current Prices
Sl.
No. Sector 2012-13 2013-14 2014-15 2015-16
2016-17
(TRE)
2017-18
(SRE)
2018-19
(FRE)
2019-20
(AE)
1 Agriculture, Livestock, Forestry and
Fishing 23.3 13.8 -0.7 -0.5 17.5 14.7 11.0 19.3
1.1 Crops 25.3 16.1 -11.4 -11.8 18.3 5.5 6.6 23.7
1.2 Livestock 21.3 8.8 17.7 15.3 18.0 22.6 15.9 17.3
1.3 Forestry and Logging 9.3 3.2 14.0 1.3 34.5 8.0 -0.7 4.0
1.4 Fishing and Aquaculture 24.1 35.8 6.9 -0.8 -14.1 60.6 10.6 8.1
2 Mining and Quarrying 14.7 -2.4 18.7 16.5 14.9 10.6 23.9 1.1
Primary 21.9 11.2 2.0 2.2 17.1 13.9 13.2 15.8
3 Manufacturing -10.8 3.1 -4.6 30.3 3.9 10.1 10.0 3.5
4 Electricity, Gas, Water supply and Other Utility Services
-24.7 47.7 -15.7 13.8 -13.6 44.0 17.3 17.5
5 Construction 3.5 4.3 13.0 2.5 0.3 8.0 7.9 5.9
Secondary -8.5 6.5 -0.9 20.3 1.6 11.8 10.1 5.3
6 Trade, Repair, Hotels and
Restaurants 18.9 15.1 25.3 16.3 16.0 20.5 17.6 16.2
6.1 Trade and Repair Services 19.6 22.2 27.9 16.6 17.0 22.1 18.4 17.0
6.2 Hotels and Restaurants 15.5 -16.9 8.7 14.0 8.0 6.7 9.7 8.7
7
Transport, Storage,
Communication & Services related
to Broadcasting
18.0 8.1 11.0 10.6 8.0 9.3 13.0 9.9
7.1 Railways 8.8 9.8 3.9 0.3 10.2 13.2 6.4 10.0
7.2 Road Transport 17.4 8.9 9.9 10.2 8.4 11.8 17.1 11.0
7.3 Water Transport - - - - - - - -
7.4 Air Transport 85.6 -20.1 80.7 80.7 12.5 7.0 6.9 9.0
7.5 Services incidental to Transport 30.3 -7.6 10.3 2.2 10.5 17.3 14.0 11.5
7.6 Storage -12.6 11.5 4.2 2.4 8.5 10.2 17.9 5.4
7.7 Communication and Services
related to Broadcasting
11.3 20.9 13.5 14.3 4.2 -3.2 2.3 5.1
8 Financial Services 11.1 12.5 13.8 9.5 9.8 13.6 11.8 9.2
9 Real Estate, Ownership of Dwelling
and Professional Services
24.7 18.9 17.7 15.7 17.5 11.3 15.0 15.2
10 Public Administration 11.9 13.3 19.7 27.7 16.7 11.4 13.6 14.4
11 Other Services 13.6 16.8 17.1 15.6 22.1 14.6 14.3 13.5
Tertiary 18.4 15.2 18.1 15.3 15.9 13.9 14.9 14.1
12 Total GSVA at Basic Prices 11.7 12.4 10.6 13.7 13.2 13.5 13.7 12.9
13 Taxes on Products 13.3 10.1 18.8 18.7 19.3 20.7 18.0 9.8
14 Subsidies on Products 14.9 2.3 -16.1 9.6 5.7 5.4 5.7 5.7
15 GSDP 11.7 12.4 12.0 14.2 13.9 14.4 14.3 12.6
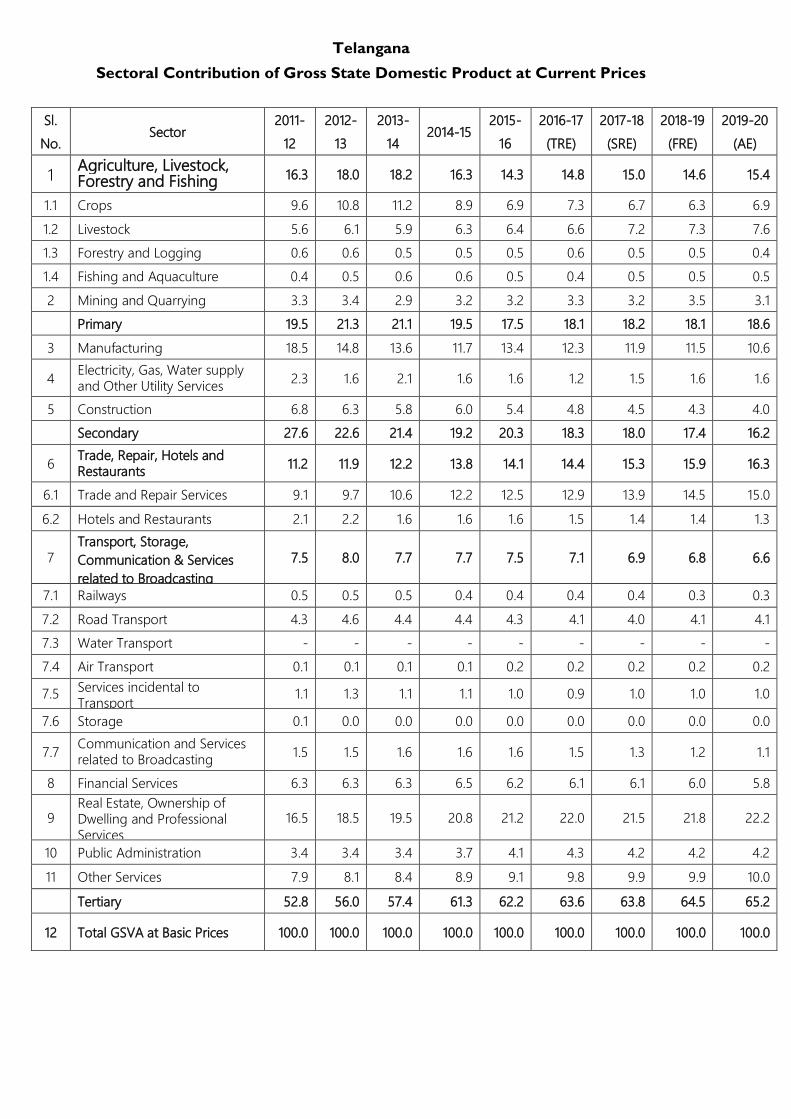
Telangana
Sectoral Contribution of Gross State Domestic Product at Current Prices
Sl.
No. Sector
2011-
12
2012-
13
2013-
14 2014-15
2015-
16
2016-17
(TRE)
2017-18
(SRE)
2018-19
(FRE)
2019-20
(AE)
1 Agriculture, Livestock, Forestry and Fishing 16.3 18.0 18.2 16.3 14.3 14.8 15.0 14.6 15.4
1.1 Crops 9.6 10.8 11.2 8.9 6.9 7.3 6.7 6.3 6.9
1.2 Livestock 5.6 6.1 5.9 6.3 6.4 6.6 7.2 7.3 7.6
1.3 Forestry and Logging 0.6 0.6 0.5 0.5 0.5 0.6 0.5 0.5 0.4
1.4 Fishing and Aquaculture 0.4 0.5 0.6 0.6 0.5 0.4 0.5 0.5 0.5
2 Mining and Quarrying 3.3 3.4 2.9 3.2 3.2 3.3 3.2 3.5 3.1
Primary 19.5 21.3 21.1 19.5 17.5 18.1 18.2 18.1 18.6
3 Manufacturing 18.5 14.8 13.6 11.7 13.4 12.3 11.9 11.5 10.6
4 Electricity, Gas, Water supply and Other Utility Services
2.3 1.6 2.1 1.6 1.6 1.2 1.5 1.6 1.6
5 Construction 6.8 6.3 5.8 6.0 5.4 4.8 4.5 4.3 4.0
Secondary 27.6 22.6 21.4 19.2 20.3 18.3 18.0 17.4 16.2
6 Trade, Repair, Hotels and Restaurants
11.2 11.9 12.2 13.8 14.1 14.4 15.3 15.9 16.3
6.1 Trade and Repair Services 9.1 9.7 10.6 12.2 12.5 12.9 13.9 14.5 15.0
6.2 Hotels and Restaurants 2.1 2.2 1.6 1.6 1.6 1.5 1.4 1.4 1.3
7 Transport, Storage,
Communication & Services
related to Broadcasting
7.5 8.0 7.7 7.7 7.5 7.1 6.9 6.8 6.6
7.1 Railways 0.5 0.5 0.5 0.4 0.4 0.4 0.4 0.3 0.3
7.2 Road Transport 4.3 4.6 4.4 4.4 4.3 4.1 4.0 4.1 4.1
7.3 Water Transport - - - - - - - - -
7.4 Air Transport 0.1 0.1 0.1 0.1 0.2 0.2 0.2 0.2 0.2
7.5 Services incidental to Transport
1.1 1.3 1.1 1.1 1.0 0.9 1.0 1.0 1.0
7.6 Storage 0.1 0.0 0.0 0.0 0.0 0.0 0.0 0.0 0.0
7.7 Communication and Services related to Broadcasting
1.5 1.5 1.6 1.6 1.6 1.5 1.3 1.2 1.1
8 Financial Services 6.3 6.3 6.3 6.5 6.2 6.1 6.1 6.0 5.8
9 Real Estate, Ownership of Dwelling and Professional Services
16.5 18.5 19.5 20.8 21.2 22.0 21.5 21.8 22.2
10 Public Administration 3.4 3.4 3.4 3.7 4.1 4.3 4.2 4.2 4.2
11 Other Services 7.9 8.1 8.4 8.9 9.1 9.8 9.9 9.9 10.0
Tertiary 52.8 56.0 57.4 61.3 62.2 63.6 63.8 64.5 65.2
12 Total GSVA at Basic Prices 100.0 100.0 100.0 100.0 100.0 100.0 100.0 100.0 100.0
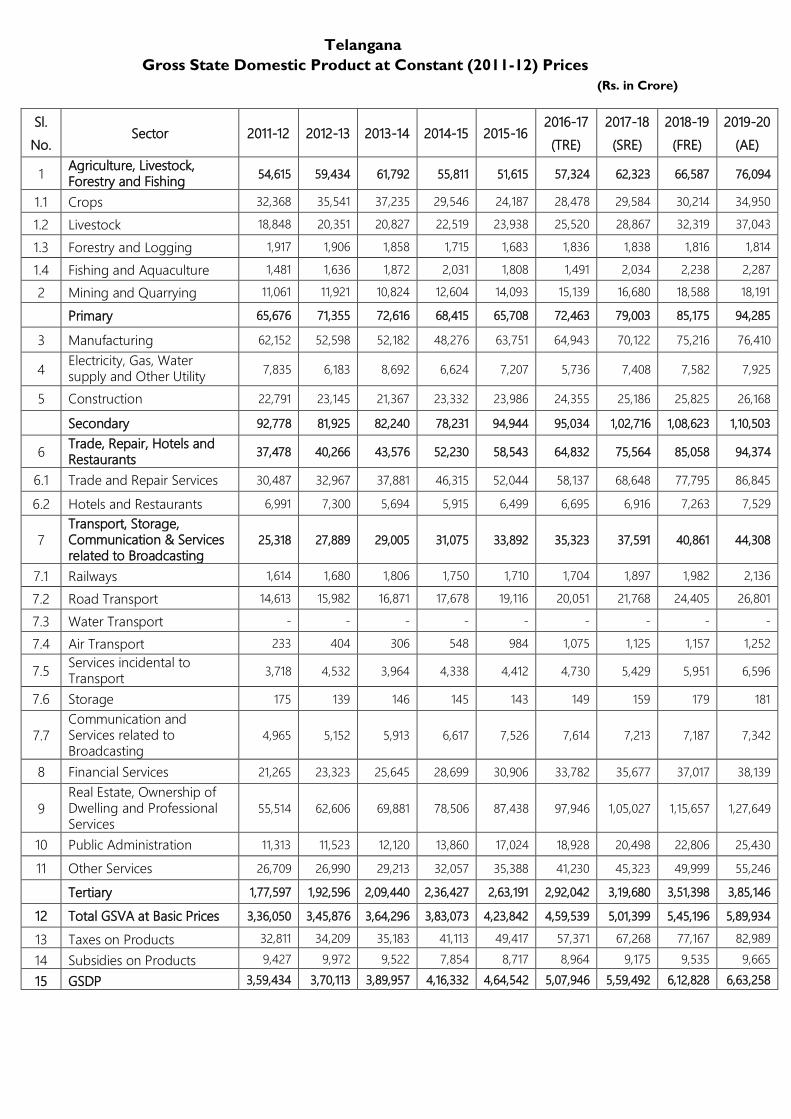
Telangana
Gross State Domestic Product at Constant (2011-12) Prices
(Rs. in Crore)
Sl.
No. Sector 2011-12 2012-13 2013-14 2014-15 2015-16
2016-17
(TRE)
2017-18
(SRE)
2018-19
(FRE)
2019-20
(AE)
1 Agriculture, Livestock, Forestry and Fishing
54,615 59,434 61,792 55,811 51,615 57,324 62,323 66,587 76,094
1.1 Crops 32,368 35,541 37,235 29,546 24,187 28,478 29,584 30,214 34,950
1.2 Livestock 18,848 20,351 20,827 22,519 23,938 25,520 28,867 32,319 37,043
1.3 Forestry and Logging 1,917 1,906 1,858 1,715 1,683 1,836 1,838 1,816 1,814
1.4 Fishing and Aquaculture 1,481 1,636 1,872 2,031 1,808 1,491 2,034 2,238 2,287
2 Mining and Quarrying 11,061 11,921 10,824 12,604 14,093 15,139 16,680 18,588 18,191
Primary 65,676 71,355 72,616 68,415 65,708 72,463 79,003 85,175 94,285
3 Manufacturing 62,152 52,598 52,182 48,276 63,751 64,943 70,122 75,216 76,410
4 Electricity, Gas, Water supply and Other Utility Services
7,835 6,183 8,692 6,624 7,207 5,736 7,408 7,582 7,925
5 Construction 22,791 23,145 21,367 23,332 23,986 24,355 25,186 25,825 26,168
Secondary 92,778 81,925 82,240 78,231 94,944 95,034 1,02,716 1,08,623 1,10,503
6 Trade, Repair, Hotels and Restaurants
37,478 40,266 43,576 52,230 58,543 64,832 75,564 85,058 94,374
6.1 Trade and Repair Services 30,487 32,967 37,881 46,315 52,044 58,137 68,648 77,795 86,845
6.2 Hotels and Restaurants 6,991 7,300 5,694 5,915 6,499 6,695 6,916 7,263 7,529
7 Transport, Storage, Communication & Services related to Broadcasting
25,318 27,889 29,005 31,075 33,892 35,323 37,591 40,861 44,308
7.1 Railways 1,614 1,680 1,806 1,750 1,710 1,704 1,897 1,982 2,136
7.2 Road Transport 14,613 15,982 16,871 17,678 19,116 20,051 21,768 24,405 26,801
7.3 Water Transport - - - - - - - - -
7.4 Air Transport 233 404 306 548 984 1,075 1,125 1,157 1,252
7.5 Services incidental to Transport
3,718 4,532 3,964 4,338 4,412 4,730 5,429 5,951 6,596
7.6 Storage 175 139 146 145 143 149 159 179 181
7.7 Communication and Services related to Broadcasting
4,965 5,152 5,913 6,617 7,526 7,614 7,213 7,187 7,342
8 Financial Services 21,265 23,323 25,645 28,699 30,906 33,782 35,677 37,017 38,139
9 Real Estate, Ownership of Dwelling and Professional Services
55,514 62,606 69,881 78,506 87,438 97,946 1,05,027 1,15,657 1,27,649
10 Public Administration 11,313 11,523 12,120 13,860 17,024 18,928 20,498 22,806 25,430
11 Other Services 26,709 26,990 29,213 32,057 35,388 41,230 45,323 49,999 55,246
Tertiary 1,77,597 1,92,596 2,09,440 2,36,427 2,63,191 2,92,042 3,19,680 3,51,398 3,85,146
12 Total GSVA at Basic Prices 3,36,050 3,45,876 3,64,296 3,83,073 4,23,842 4,59,539 5,01,399 5,45,196 5,89,934
13 Taxes on Products 32,811 34,209 35,183 41,113 49,417 57,371 67,268 77,167 82,989
14 Subsidies on Products 9,427 9,972 9,522 7,854 8,717 8,964 9,175 9,535 9,665
15 GSDP 3,59,434 3,70,113 3,89,957 4,16,332 4,64,542 5,07,946 5,59,492 6,12,828 6,63,258
Telangana
Sectoral Growth Rates of Gross State Domestic Product at Constant (2011-12) Prices
Sl.
No. Sector 2012-13 2013-14 2014-15 2015-16
2016-17
(TRE)
2017-18
(SRE)
2018-19
(FRE)
2019-20
(AE)
1 Agriculture, Livestock, Forestry and Fishing
8.8 4.0 -9.7 -7.5 11.1 8.7 6.8 14.3
1.1 Crops 9.8 4.8 -20.6 -18.1 17.7 3.9 2.1 15.7
1.2 Livestock 8.0 2.3 8.1 6.3 6.6 13.1 12.0 14.6
1.3 Forestry and Logging -0.6 -2.5 -7.7 -1.9 9.1 0.1 -1.2 -0.1
1.4 Fishing and Aquaculture 10.4 14.4 8.5 -11.0 -17.6 36.5 10.0 2.2
2 Mining and Quarrying 7.8 -9.2 16.4 11.8 7.4 10.2 11.4 -2.1
Primary 8.6 1.8 -5.8 -4.0 10.3 9.0 7.8 10.7
3 Manufacturing -15.4 -0.8 -7.5 32.1 1.9 8.0 7.3 1.6
4 Electricity, Gas, Water supply and Other Utility Services
-21.1 40.6 -23.8 8.8 -20.4 29.1 2.3 4.5
5 Construction 1.6 -7.7 9.2 2.8 1.5 3.4 2.5 1.3
Secondary -11.7 0.4 -4.9 21.4 0.1 8.1 5.8 1.7
6 Trade, Repair, Hotels and Restaurants
7.4 8.2 19.9 12.1 10.7 16.6 12.6 11.0
6.1 Trade and Repair Services 8.1 14.9 22.3 12.4 11.7 18.1 13.3 11.6
6.2 Hotels and Restaurants 4.4 -22.0 3.9 9.9 3.0 3.3 5.0 3.7
7 Transport, Storage, Communication & Services related to Broadcasting
10.2 4.0 7.1 9.1 4.2 6.4 8.7 8.4
7.1 Railways 4.1 7.4 -3.1 -2.2 -0.4 11.3 4.5 7.8
7.2 Road Transport 9.4 5.6 4.8 8.1 4.9 8.6 12.1 9.8
7.3 Water Transport - - - - - - - -
7.4 Air Transport 73.6 -24.3 79.3 79.7 9.2 4.7 2.8 8.2
7.5 Services incidental to Transport 21.9 -12.5 9.4 1.7 7.2 14.8 9.6 10.8
7.6 Storage -20.8 4.9 -0.3 -1.2 3.8 6.7 12.6 1.1
7.7 Communication and Services related to Broadcasting
3.7 14.8 11.9 13.7 1.2 -5.3 -0.4 2.2
8 Financial Services 9.7 10.0 11.9 7.7 9.3 5.6 3.8 3.0
9 Real Estate, Ownership of Dwelling and Professional Services
12.8 11.6 12.3 11.4 12.0 7.2 10.1 10.4
10 Public Administration 1.9 5.2 14.4 22.8 11.2 8.3 11.3 11.5
11 Other Services 1.0 8.2 9.7 10.4 16.5 9.9 10.3 10.5
Tertiary 8.4 8.7 12.9 11.3 11.0 9.5 9.9 9.6
12 Total GSVA at Basic Prices 2.9 5.3 5.2 10.6 8.4 9.1 8.7 8.2
13 Taxes on Products 4.3 2.8 16.9 20.2 16.1 17.3 14.7 7.5
14 Subsidies on Products 5.8 -4.5 -17.5 11.0 2.8 2.4 3.9 1.4
15 Gross State Domestic Product 3.0 5.4 6.8 11.6 9.3 10.1 9.5 8.2
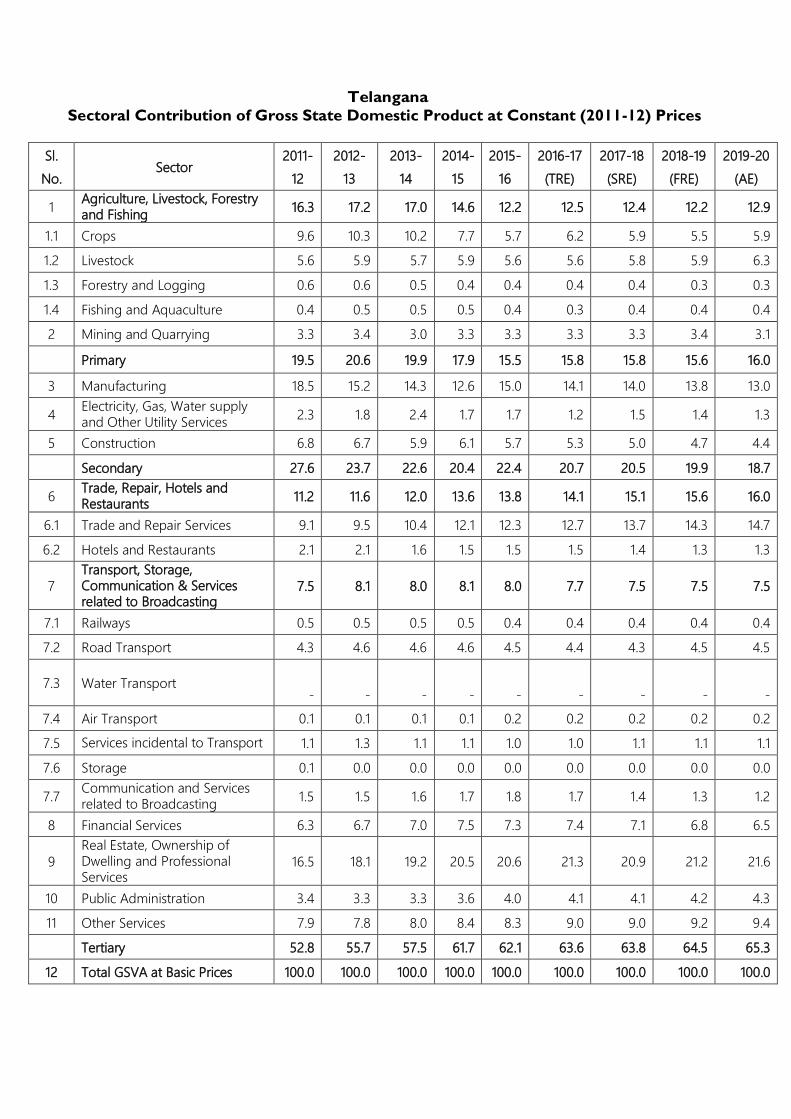
Telangana
Sectoral Contribution of Gross State Domestic Product at Constant (2011-12) Prices
Sl.
No. Sector
2011-
12
2012-
13
2013-
14
2014-
15
2015-
16
2016-17
(TRE)
2017-18
(SRE)
2018-19
(FRE)
2019-20
(AE)
1 Agriculture, Livestock, Forestry and Fishing
16.3 17.2 17.0 14.6 12.2 12.5 12.4 12.2 12.9
1.1 Crops 9.6 10.3 10.2 7.7 5.7 6.2 5.9 5.5 5.9
1.2 Livestock 5.6 5.9 5.7 5.9 5.6 5.6 5.8 5.9 6.3
1.3 Forestry and Logging 0.6 0.6 0.5 0.4 0.4 0.4 0.4 0.3 0.3
1.4 Fishing and Aquaculture 0.4 0.5 0.5 0.5 0.4 0.3 0.4 0.4 0.4
2 Mining and Quarrying 3.3 3.4 3.0 3.3 3.3 3.3 3.3 3.4 3.1
Primary 19.5 20.6 19.9 17.9 15.5 15.8 15.8 15.6 16.0
3 Manufacturing 18.5 15.2 14.3 12.6 15.0 14.1 14.0 13.8 13.0
4 Electricity, Gas, Water supply and Other Utility Services
2.3 1.8 2.4 1.7 1.7 1.2 1.5 1.4 1.3
5 Construction 6.8 6.7 5.9 6.1 5.7 5.3 5.0 4.7 4.4
Secondary 27.6 23.7 22.6 20.4 22.4 20.7 20.5 19.9 18.7
6 Trade, Repair, Hotels and Restaurants
11.2 11.6 12.0 13.6 13.8 14.1 15.1 15.6 16.0
6.1 Trade and Repair Services 9.1 9.5 10.4 12.1 12.3 12.7 13.7 14.3 14.7
6.2 Hotels and Restaurants 2.1 2.1 1.6 1.5 1.5 1.5 1.4 1.3 1.3
7 Transport, Storage, Communication & Services related to Broadcasting
7.5 8.1 8.0 8.1 8.0 7.7 7.5 7.5 7.5
7.1 Railways 0.5 0.5 0.5 0.5 0.4 0.4 0.4 0.4 0.4
7.2 Road Transport 4.3 4.6 4.6 4.6 4.5 4.4 4.3 4.5 4.5
7.3 Water Transport
-
-
-
-
-
-
-
-
-
7.4 Air Transport 0.1 0.1 0.1 0.1 0.2 0.2 0.2 0.2 0.2
7.5 Services incidental to Transport 1.1 1.3 1.1 1.1 1.0 1.0 1.1 1.1 1.1
7.6 Storage 0.1 0.0 0.0 0.0 0.0 0.0 0.0 0.0 0.0
7.7 Communication and Services related to Broadcasting
1.5 1.5 1.6 1.7 1.8 1.7 1.4 1.3 1.2
8 Financial Services 6.3 6.7 7.0 7.5 7.3 7.4 7.1 6.8 6.5
9 Real Estate, Ownership of Dwelling and Professional Services
16.5 18.1 19.2 20.5 20.6 21.3 20.9 21.2 21.6
10 Public Administration 3.4 3.3 3.3 3.6 4.0 4.1 4.1 4.2 4.3
11 Other Services 7.9 7.8 8.0 8.4 8.3 9.0 9.0 9.2 9.4
Tertiary 52.8 55.7 57.5 61.7 62.1 63.6 63.8 64.5 65.3
12 Total GSVA at Basic Prices 100.0 100.0 100.0 100.0 100.0 100.0 100.0 100.0 100.0
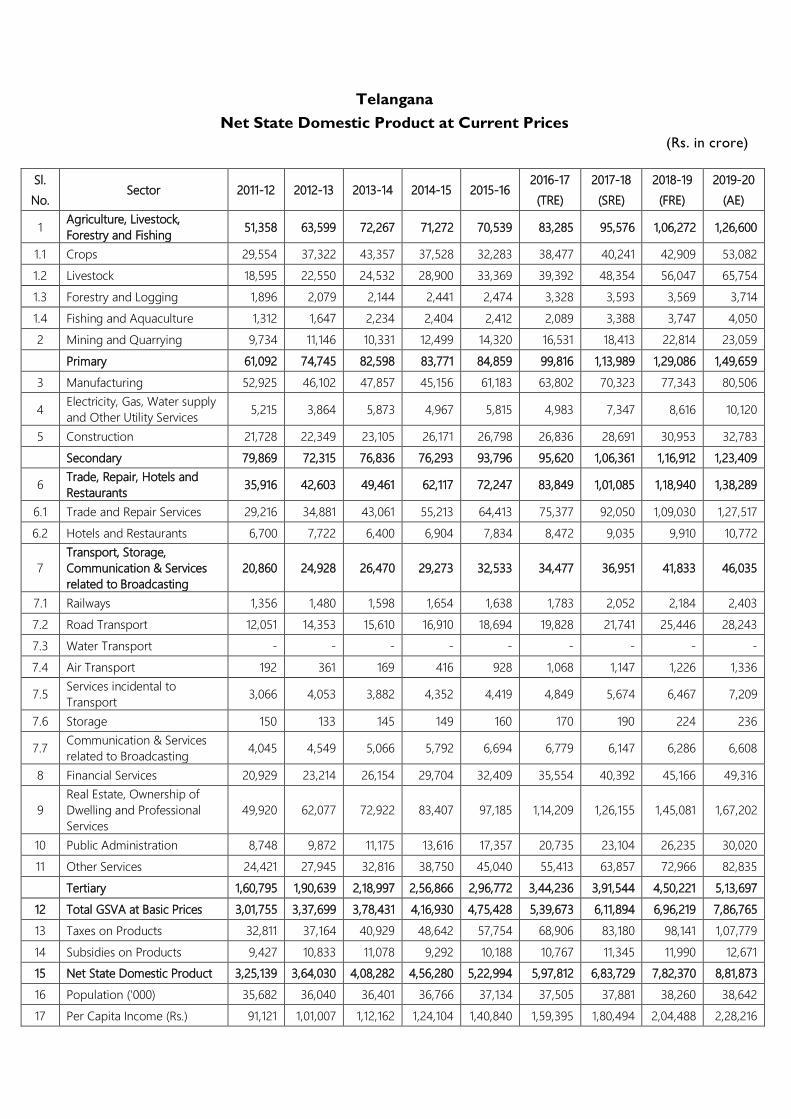
Telangana
Net State Domestic Product at Current Prices
(Rs. in crore)
Sl.
No. Sector 2011-12 2012-13 2013-14 2014-15 2015-16
2016-17
(TRE)
2017-18
(SRE)
2018-19
(FRE)
2019-20
(AE)
1 Agriculture, Livestock,
Forestry and Fishing 51,358 63,599 72,267 71,272 70,539 83,285 95,576 1,06,272 1,26,600
1.1 Crops 29,554 37,322 43,357 37,528 32,283 38,477 40,241 42,909 53,082
1.2 Livestock 18,595 22,550 24,532 28,900 33,369 39,392 48,354 56,047 65,754
1.3 Forestry and Logging 1,896 2,079 2,144 2,441 2,474 3,328 3,593 3,569 3,714
1.4 Fishing and Aquaculture 1,312 1,647 2,234 2,404 2,412 2,089 3,388 3,747 4,050
2 Mining and Quarrying 9,734 11,146 10,331 12,499 14,320 16,531 18,413 22,814 23,059
Primary 61,092 74,745 82,598 83,771 84,859 99,816 1,13,989 1,29,086 1,49,659
3 Manufacturing 52,925 46,102 47,857 45,156 61,183 63,802 70,323 77,343 80,506
4 Electricity, Gas, Water supply
and Other Utility Services 5,215 3,864 5,873 4,967 5,815 4,983 7,347 8,616 10,120
5 Construction 21,728 22,349 23,105 26,171 26,798 26,836 28,691 30,953 32,783
Secondary 79,869 72,315 76,836 76,293 93,796 95,620 1,06,361 1,16,912 1,23,409
6 Trade, Repair, Hotels and
Restaurants 35,916 42,603 49,461 62,117 72,247 83,849 1,01,085 1,18,940 1,38,289
6.1 Trade and Repair Services 29,216 34,881 43,061 55,213 64,413 75,377 92,050 1,09,030 1,27,517
6.2 Hotels and Restaurants 6,700 7,722 6,400 6,904 7,834 8,472 9,035 9,910 10,772
7
Transport, Storage,
Communication & Services
related to Broadcasting
20,860 24,928 26,470 29,273 32,533 34,477 36,951 41,833 46,035
7.1 Railways 1,356 1,480 1,598 1,654 1,638 1,783 2,052 2,184 2,403
7.2 Road Transport 12,051 14,353 15,610 16,910 18,694 19,828 21,741 25,446 28,243
7.3 Water Transport - - - - - - - - -
7.4 Air Transport 192 361 169 416 928 1,068 1,147 1,226 1,336
7.5 Services incidental to
Transport 3,066 4,053 3,882 4,352 4,419 4,849 5,674 6,467 7,209
7.6 Storage 150 133 145 149 160 170 190 224 236
7.7 Communication & Services
related to Broadcasting 4,045 4,549 5,066 5,792 6,694 6,779 6,147 6,286 6,608
8 Financial Services 20,929 23,214 26,154 29,704 32,409 35,554 40,392 45,166 49,316
9
Real Estate, Ownership of
Dwelling and Professional
Services
49,920 62,077 72,922 83,407 97,185 1,14,209 1,26,155 1,45,081 1,67,202
10 Public Administration 8,748 9,872 11,175 13,616 17,357 20,735 23,104 26,235 30,020
11 Other Services 24,421 27,945 32,816 38,750 45,040 55,413 63,857 72,966 82,835
Tertiary 1,60,795 1,90,639 2,18,997 2,56,866 2,96,772 3,44,236 3,91,544 4,50,221 5,13,697
12 Total GSVA at Basic Prices 3,01,755 3,37,699 3,78,431 4,16,930 4,75,428 5,39,673 6,11,894 6,96,219 7,86,765
13 Taxes on Products 32,811 37,164 40,929 48,642 57,754 68,906 83,180 98,141 1,07,779
14 Subsidies on Products 9,427 10,833 11,078 9,292 10,188 10,767 11,345 11,990 12,671
15 Net State Domestic Product 3,25,139 3,64,030 4,08,282 4,56,280 5,22,994 5,97,812 6,83,729 7,82,370 8,81,873
16 Population ('000) 35,682 36,040 36,401 36,766 37,134 37,505 37,881 38,260 38,642
17 Per Capita Income (Rs.) 91,121 1,01,007 1,12,162 1,24,104 1,40,840 1,59,395 1,80,494 2,04,488 2,28,216
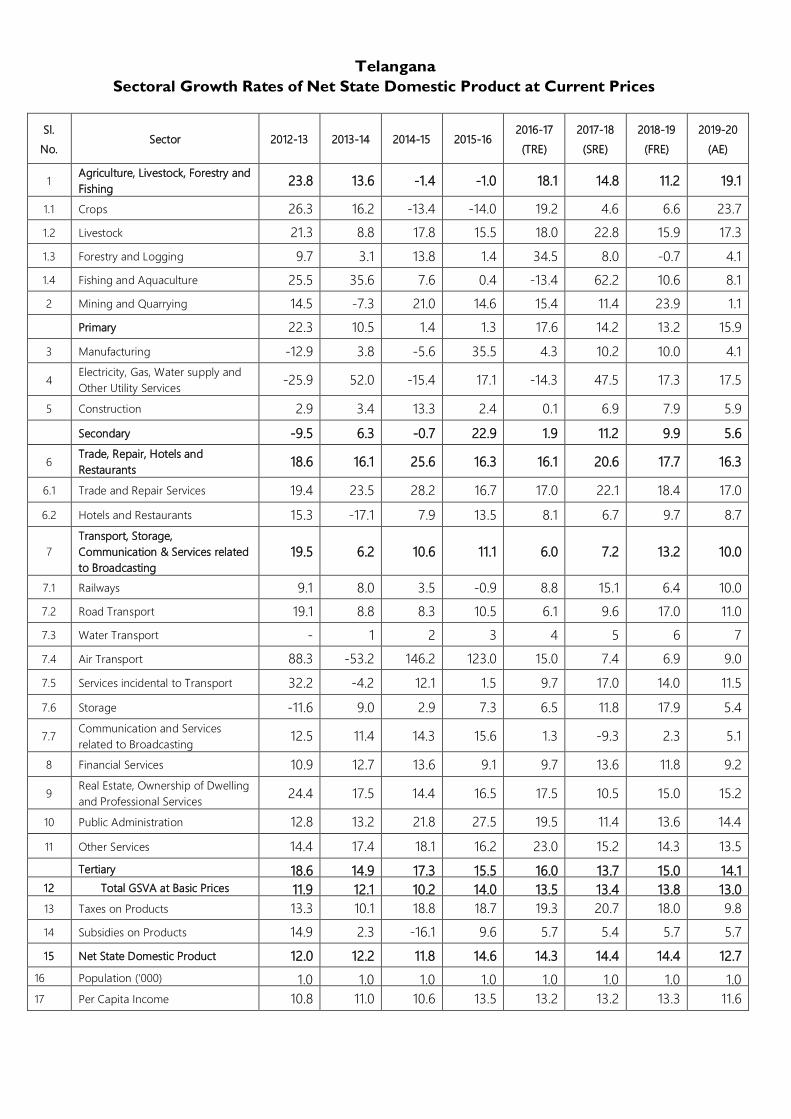
Telangana
Sectoral Growth Rates of Net State Domestic Product at Current Prices
Sl.
No. Sector 2012-13 2013-14 2014-15 2015-16
2016-17
(TRE)
2017-18
(SRE)
2018-19
(FRE)
2019-20
(AE)
1 Agriculture, Livestock, Forestry and
Fishing 23.8 13.6 -1.4 -1.0 18.1 14.8 11.2 19.1
1.1 Crops 26.3 16.2 -13.4 -14.0 19.2 4.6 6.6 23.7
1.2 Livestock 21.3 8.8 17.8 15.5 18.0 22.8 15.9 17.3
1.3 Forestry and Logging 9.7 3.1 13.8 1.4 34.5 8.0 -0.7 4.1
1.4 Fishing and Aquaculture 25.5 35.6 7.6 0.4 -13.4 62.2 10.6 8.1
2 Mining and Quarrying 14.5 -7.3 21.0 14.6 15.4 11.4 23.9 1.1
Primary 22.3 10.5 1.4 1.3 17.6 14.2 13.2 15.9
3 Manufacturing -12.9 3.8 -5.6 35.5 4.3 10.2 10.0 4.1
4 Electricity, Gas, Water supply and
Other Utility Services -25.9 52.0 -15.4 17.1 -14.3 47.5 17.3 17.5
5 Construction 2.9 3.4 13.3 2.4 0.1 6.9 7.9 5.9
Secondary -9.5 6.3 -0.7 22.9 1.9 11.2 9.9 5.6
6 Trade, Repair, Hotels and
Restaurants 18.6 16.1 25.6 16.3 16.1 20.6 17.7 16.3
6.1 Trade and Repair Services 19.4 23.5 28.2 16.7 17.0 22.1 18.4 17.0
6.2 Hotels and Restaurants 15.3 -17.1 7.9 13.5 8.1 6.7 9.7 8.7
7
Transport, Storage,
Communication & Services related
to Broadcasting
19.5 6.2 10.6 11.1 6.0 7.2 13.2 10.0
7.1 Railways 9.1 8.0 3.5 -0.9 8.8 15.1 6.4 10.0
7.2 Road Transport 19.1 8.8 8.3 10.5 6.1 9.6 17.0 11.0
7.3 Water Transport - 1 2 3 4 5 6 7
7.4 Air Transport 88.3 -53.2 146.2 123.0 15.0 7.4 6.9 9.0
7.5 Services incidental to Transport 32.2 -4.2 12.1 1.5 9.7 17.0 14.0 11.5
7.6 Storage -11.6 9.0 2.9 7.3 6.5 11.8 17.9 5.4
7.7 Communication and Services
related to Broadcasting 12.5 11.4 14.3 15.6 1.3 -9.3 2.3 5.1
8 Financial Services 10.9 12.7 13.6 9.1 9.7 13.6 11.8 9.2
9 Real Estate, Ownership of Dwelling
and Professional Services 24.4 17.5 14.4 16.5 17.5 10.5 15.0 15.2
10 Public Administration 12.8 13.2 21.8 27.5 19.5 11.4 13.6 14.4
11 Other Services 14.4 17.4 18.1 16.2 23.0 15.2 14.3 13.5
Tertiary 18.6 14.9 17.3 15.5 16.0 13.7 15.0 14.1 12 Total GSVA at Basic Prices 11.9 12.1 10.2 14.0 13.5 13.4 13.8 13.0
13 Taxes on Products 13.3 10.1 18.8 18.7 19.3 20.7 18.0 9.8
14 Subsidies on Products 14.9 2.3 -16.1 9.6 5.7 5.4 5.7 5.7
15 Net State Domestic Product 12.0 12.2 11.8 14.6 14.3 14.4 14.4 12.7
16 Population ('000) 1.0 1.0 1.0 1.0 1.0 1.0 1.0 1.0
17 Per Capita Income 10.8 11.0 10.6 13.5 13.2 13.2 13.3 11.6
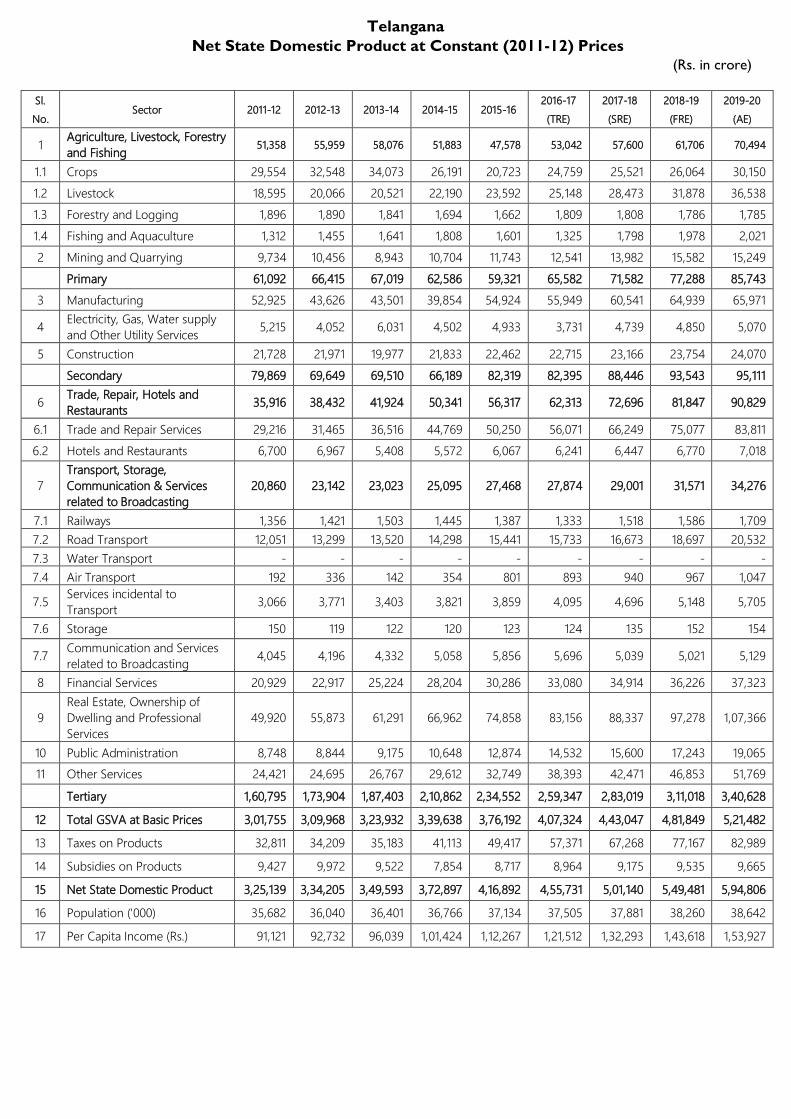
Telangana
Net State Domestic Product at Constant (2011-12) Prices
(Rs. in crore)
Sl.
No. Sector 2011-12 2012-13 2013-14 2014-15 2015-16
2016-17
(TRE)
2017-18
(SRE)
2018-19
(FRE)
2019-20
(AE)
1 Agriculture, Livestock, Forestry
and Fishing 51,358 55,959 58,076 51,883 47,578 53,042 57,600 61,706 70,494
1.1 Crops 29,554 32,548 34,073 26,191 20,723 24,759 25,521 26,064 30,150
1.2 Livestock 18,595 20,066 20,521 22,190 23,592 25,148 28,473 31,878 36,538
1.3 Forestry and Logging 1,896 1,890 1,841 1,694 1,662 1,809 1,808 1,786 1,785
1.4 Fishing and Aquaculture 1,312 1,455 1,641 1,808 1,601 1,325 1,798 1,978 2,021
2 Mining and Quarrying 9,734 10,456 8,943 10,704 11,743 12,541 13,982 15,582 15,249
Primary 61,092 66,415 67,019 62,586 59,321 65,582 71,582 77,288 85,743
3 Manufacturing 52,925 43,626 43,501 39,854 54,924 55,949 60,541 64,939 65,971
4 Electricity, Gas, Water supply
and Other Utility Services 5,215 4,052 6,031 4,502 4,933 3,731 4,739 4,850 5,070
5 Construction 21,728 21,971 19,977 21,833 22,462 22,715 23,166 23,754 24,070
Secondary 79,869 69,649 69,510 66,189 82,319 82,395 88,446 93,543 95,111
6 Trade, Repair, Hotels and
Restaurants 35,916 38,432 41,924 50,341 56,317 62,313 72,696 81,847 90,829
6.1 Trade and Repair Services 29,216 31,465 36,516 44,769 50,250 56,071 66,249 75,077 83,811
6.2 Hotels and Restaurants 6,700 6,967 5,408 5,572 6,067 6,241 6,447 6,770 7,018
7
Transport, Storage,
Communication & Services
related to Broadcasting
20,860 23,142 23,023 25,095 27,468 27,874 29,001 31,571 34,276
7.1 Railways 1,356 1,421 1,503 1,445 1,387 1,333 1,518 1,586 1,709
7.2 Road Transport 12,051 13,299 13,520 14,298 15,441 15,733 16,673 18,697 20,532
7.3 Water Transport - - - - - - - - -
7.4 Air Transport 192 336 142 354 801 893 940 967 1,047
7.5 Services incidental to
Transport 3,066 3,771 3,403 3,821 3,859 4,095 4,696 5,148 5,705
7.6 Storage 150 119 122 120 123 124 135 152 154
7.7 Communication and Services
related to Broadcasting 4,045 4,196 4,332 5,058 5,856 5,696 5,039 5,021 5,129
8 Financial Services 20,929 22,917 25,224 28,204 30,286 33,080 34,914 36,226 37,323
9
Real Estate, Ownership of
Dwelling and Professional
Services
49,920 55,873 61,291 66,962 74,858 83,156 88,337 97,278 1,07,366
10 Public Administration 8,748 8,844 9,175 10,648 12,874 14,532 15,600 17,243 19,065
11 Other Services 24,421 24,695 26,767 29,612 32,749 38,393 42,471 46,853 51,769
Tertiary 1,60,795 1,73,904 1,87,403 2,10,862 2,34,552 2,59,347 2,83,019 3,11,018 3,40,628
12 Total GSVA at Basic Prices 3,01,755 3,09,968 3,23,932 3,39,638 3,76,192 4,07,324 4,43,047 4,81,849 5,21,482
13 Taxes on Products 32,811 34,209 35,183 41,113 49,417 57,371 67,268 77,167 82,989
14 Subsidies on Products 9,427 9,972 9,522 7,854 8,717 8,964 9,175 9,535 9,665
15 Net State Domestic Product 3,25,139 3,34,205 3,49,593 3,72,897 4,16,892 4,55,731 5,01,140 5,49,481 5,94,806
16 Population ('000) 35,682 36,040 36,401 36,766 37,134 37,505 37,881 38,260 38,642
17 Per Capita Income (Rs.) 91,121 92,732 96,039 1,01,424 1,12,267 1,21,512 1,32,293 1,43,618 1,53,927
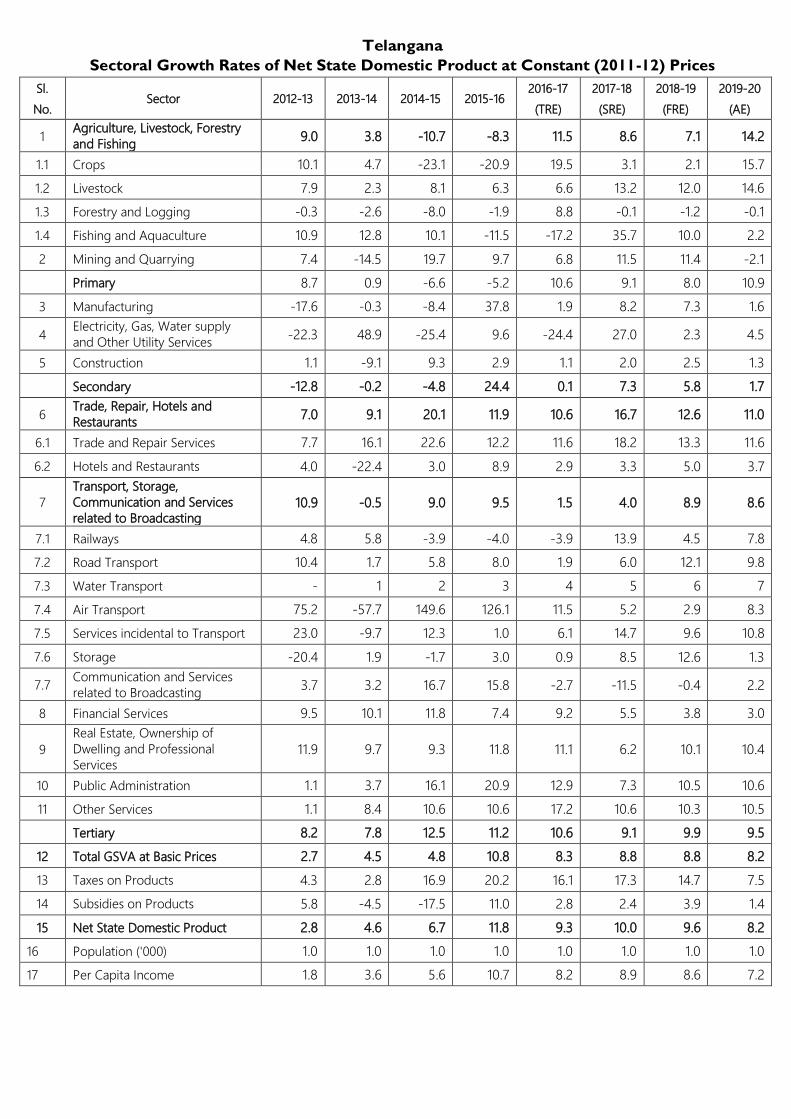
Telangana
Sectoral Growth Rates of Net State Domestic Product at Constant (2011-12) Prices
Sl.
No. Sector 2012-13 2013-14 2014-15 2015-16
2016-17
(TRE)
2017-18
(SRE)
2018-19
(FRE)
2019-20
(AE)
1 Agriculture, Livestock, Forestry and Fishing
9.0 3.8 -10.7 -8.3 11.5 8.6 7.1 14.2
1.1 Crops 10.1 4.7 -23.1 -20.9 19.5 3.1 2.1 15.7
1.2 Livestock 7.9 2.3 8.1 6.3 6.6 13.2 12.0 14.6
1.3 Forestry and Logging -0.3 -2.6 -8.0 -1.9 8.8 -0.1 -1.2 -0.1
1.4 Fishing and Aquaculture 10.9 12.8 10.1 -11.5 -17.2 35.7 10.0 2.2
2 Mining and Quarrying 7.4 -14.5 19.7 9.7 6.8 11.5 11.4 -2.1
Primary 8.7 0.9 -6.6 -5.2 10.6 9.1 8.0 10.9
3 Manufacturing -17.6 -0.3 -8.4 37.8 1.9 8.2 7.3 1.6
4 Electricity, Gas, Water supply and Other Utility Services
-22.3 48.9 -25.4 9.6 -24.4 27.0 2.3 4.5
5 Construction 1.1 -9.1 9.3 2.9 1.1 2.0 2.5 1.3
Secondary -12.8 -0.2 -4.8 24.4 0.1 7.3 5.8 1.7
6 Trade, Repair, Hotels and Restaurants
7.0 9.1 20.1 11.9 10.6 16.7 12.6 11.0
6.1 Trade and Repair Services 7.7 16.1 22.6 12.2 11.6 18.2 13.3 11.6
6.2 Hotels and Restaurants 4.0 -22.4 3.0 8.9 2.9 3.3 5.0 3.7
7
Transport, Storage,
Communication and Services related to Broadcasting
10.9 -0.5 9.0 9.5 1.5 4.0 8.9 8.6
7.1 Railways 4.8 5.8 -3.9 -4.0 -3.9 13.9 4.5 7.8
7.2 Road Transport 10.4 1.7 5.8 8.0 1.9 6.0 12.1 9.8
7.3 Water Transport - 1 2 3 4 5 6 7
7.4 Air Transport 75.2 -57.7 149.6 126.1 11.5 5.2 2.9 8.3
7.5 Services incidental to Transport 23.0 -9.7 12.3 1.0 6.1 14.7 9.6 10.8
7.6 Storage -20.4 1.9 -1.7 3.0 0.9 8.5 12.6 1.3
7.7 Communication and Services related to Broadcasting
3.7 3.2 16.7 15.8 -2.7 -11.5 -0.4 2.2
8 Financial Services 9.5 10.1 11.8 7.4 9.2 5.5 3.8 3.0
9
Real Estate, Ownership of Dwelling and Professional Services
11.9 9.7 9.3 11.8 11.1 6.2 10.1 10.4
10 Public Administration 1.1 3.7 16.1 20.9 12.9 7.3 10.5 10.6
11 Other Services 1.1 8.4 10.6 10.6 17.2 10.6 10.3 10.5
Tertiary 8.2 7.8 12.5 11.2 10.6 9.1 9.9 9.5
12 Total GSVA at Basic Prices 2.7 4.5 4.8 10.8 8.3 8.8 8.8 8.2
13 Taxes on Products 4.3 2.8 16.9 20.2 16.1 17.3 14.7 7.5
14 Subsidies on Products 5.8 -4.5 -17.5 11.0 2.8 2.4 3.9 1.4
15 Net State Domestic Product 2.8 4.6 6.7 11.8 9.3 10.0 9.6 8.2
16 Population ('000) 1.0 1.0 1.0 1.0 1.0 1.0 1.0 1.0
17 Per Capita Income 1.8 3.6 5.6 10.7 8.2 8.9 8.6 7.2