GROCERY STORE TRENDS
29
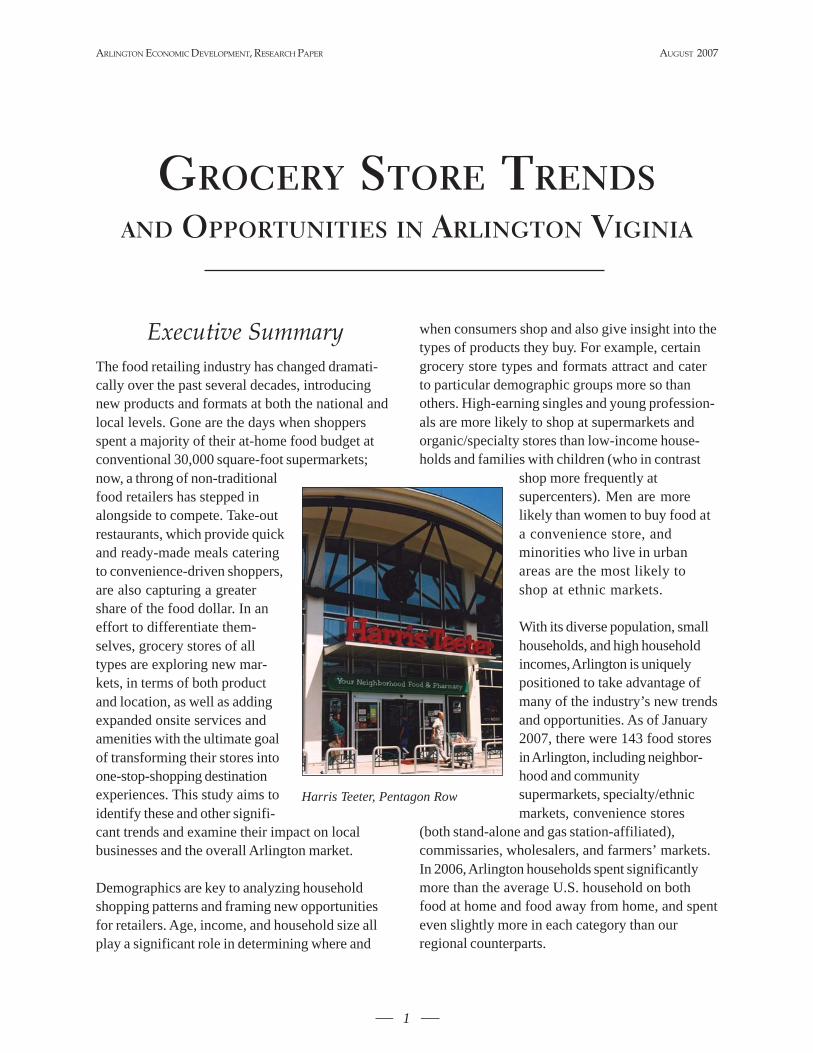
ARLINGTON ECONOMIC DEVELOPMENT, RESEARCH PAPER AUGUST 2007 1 GROCERY S TORE T RENDS AND OPPORTUNITIES IN ARLINGTON V IGINIA Executive Summary The food retailing industry has changed dramati- cally over the past several decades, introducing new products and formats at both the national and local levels. Gone are the days when shoppers spent a majority of their at-home food budget at conventional 30,000 square-foot supermarkets; now, a throng of non-traditional food retailers has stepped in alongside to compete. Take-out restaurants, which provide quick and ready-made meals catering to convenience-driven shoppers, are also capturing a greater share of the food dollar. In an effort to differentiate them- selves, grocery stores of all types are exploring new mar- kets, in terms of both product and location, as well as adding expanded onsite services and amenities with the ultimate goal of transforming their stores into one-stop-shopping destination experiences. This study aims to identify these and other signifi- cant trends and examine their impact on local businesses and the overall Arlington market. Demographics are key to analyzing household shopping patterns and framing new opportunities for retailers. Age, income, and household size all play a significant role in determining where and when consumers shop and also give insight into the types of products they buy. For example, certain grocery store types and formats attract and cater to particular demographic groups more so than others. High-earning singles and young profession- als are more likely to shop at supermarkets and organic/specialty stores than low-income house- holds and families with children (who in contrast shop more frequently at supercenters). Men are more likely than women to buy food at a convenience store, and minorities who live in urban areas are the most likely to shop at ethnic markets. With its diverse population, small households, and high household incomes, Arlington is uniquely positioned to take advantage of many of the industry’s new trends and opportunities. As of January 2007, there were 143 food stores in Arlington, including neighbor- hood and community supermarkets, specialty/ethnic markets, convenience stores (both stand-alone and gas station-affiliated), commissaries, wholesalers, and farmers’ markets. In 2006, Arlington households spent significantly more than the average U.S. household on both food at home and food away from home, and spent even slightly more in each category than our regional counterparts. Harris Teeter, Pentagon Row
Transcript of GROCERY STORE TRENDS
ARLINGTON ECONOMIC DEVELOPMENT, RESEARCH PAPER AUGUST 2007
1
GROCERY STORE TRENDSAND OPPORTUNITIES IN ARLINGTON VIGINIA
Executive SummaryThe food retailing industry has changed dramati-cally over the past several decades, introducingnew products and formats at both the national andlocal levels. Gone are the days when shoppersspent a majority of their at-home food budget atconventional 30,000 square-foot supermarkets;now, a throng of non-traditionalfood retailers has stepped inalongside to compete. Take-outrestaurants, which provide quickand ready-made meals cateringto convenience-driven shoppers,are also capturing a greatershare of the food dollar. In aneffort to differentiate them-selves, grocery stores of alltypes are exploring new mar-kets, in terms of both productand location, as well as addingexpanded onsite services andamenities with the ultimate goalof transforming their stores intoone-stop-shopping destinationexperiences. This study aims toidentify these and other signifi-cant trends and examine their impact on localbusinesses and the overall Arlington market.
Demographics are key to analyzing householdshopping patterns and framing new opportunitiesfor retailers. Age, income, and household size allplay a significant role in determining where and
when consumers shop and also give insight into thetypes of products they buy. For example, certaingrocery store types and formats attract and caterto particular demographic groups more so thanothers. High-earning singles and young profession-als are more likely to shop at supermarkets andorganic/specialty stores than low-income house-holds and families with children (who in contrast
shop more frequently atsupercenters). Men are morelikely than women to buy food ata convenience store, andminorities who live in urbanareas are the most likely toshop at ethnic markets.
With its diverse population, smallhouseholds, and high householdincomes, Arlington is uniquelypositioned to take advantage ofmany of the industry’s new trendsand opportunities. As of January2007, there were 143 food storesin Arlington, including neighbor-hood and communitysupermarkets, specialty/ethnicmarkets, convenience stores
(both stand-alone and gas station-affiliated),commissaries, wholesalers, and farmers’ markets.In 2006, Arlington households spent significantlymore than the average U.S. household on bothfood at home and food away from home, and spenteven slightly more in each category than ourregional counterparts.
Harris Teeter, Pentagon Row
ARLINGTON ECONOMIC DEVELOPMENT, RESEARCH PAPER
2
AUGUST 2007
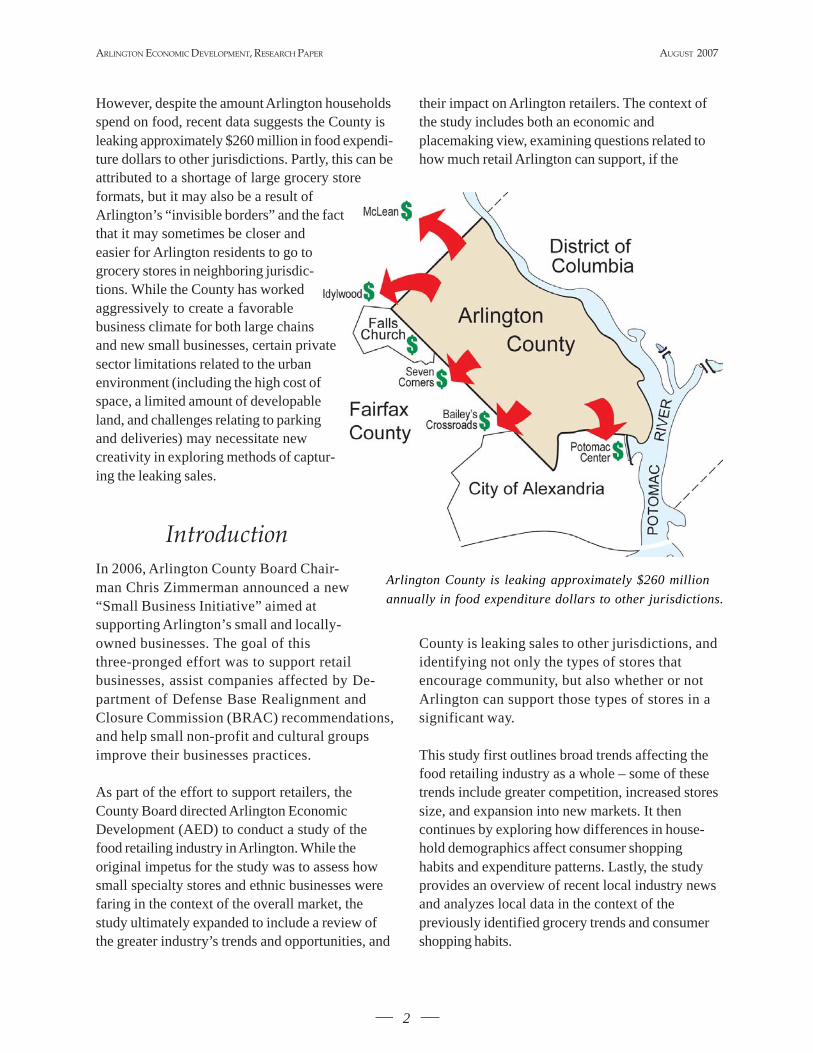
Arlington County is leaking approximately $260 millionannually in food expenditure dollars to other jurisdictions.
However, despite the amount Arlington householdsspend on food, recent data suggests the County isleaking approximately $260 million in food expendi-ture dollars to other jurisdictions. Partly, this can beattributed to a shortage of large grocery storeformats, but it may also be a result ofArlington’s “invisible borders” and the factthat it may sometimes be closer andeasier for Arlington residents to go togrocery stores in neighboring jurisdic-tions. While the County has workedaggressively to create a favorablebusiness climate for both large chainsand new small businesses, certain privatesector limitations related to the urbanenvironment (including the high cost ofspace, a limited amount of developableland, and challenges relating to parkingand deliveries) may necessitate newcreativity in exploring methods of captur-ing the leaking sales.
IntroductionIn 2006, Arlington County Board Chair-man Chris Zimmerman announced a new“Small Business Initiative” aimed atsupporting Arlington’s small and locally-owned businesses. The goal of thisthree-pronged effort was to support retailbusinesses, assist companies affected by De-partment of Defense Base Realignment andClosure Commission (BRAC) recommendations,and help small non-profit and cultural groupsimprove their businesses practices.
As part of the effort to support retailers, theCounty Board directed Arlington EconomicDevelopment (AED) to conduct a study of thefood retailing industry in Arlington. While theoriginal impetus for the study was to assess howsmall specialty stores and ethnic businesses werefaring in the context of the overall market, thestudy ultimately expanded to include a review ofthe greater industry’s trends and opportunities, and
their impact on Arlington retailers. The context ofthe study includes both an economic andplacemaking view, examining questions related tohow much retail Arlington can support, if the
County is leaking sales to other jurisdictions, andidentifying not only the types of stores thatencourage community, but also whether or notArlington can support those types of stores in asignificant way.
This study first outlines broad trends affecting thefood retailing industry as a whole – some of thesetrends include greater competition, increased storessize, and expansion into new markets. It thencontinues by exploring how differences in house-hold demographics affect consumer shoppinghabits and expenditure patterns. Lastly, the studyprovides an overview of recent local industry newsand analyzes local data in the context of thepreviously identified grocery trends and consumershopping habits.
ARLINGTON ECONOMIC DEVELOPMENT, RESEARCH PAPER AUGUST 2007
3
Survey and anecdotal data related to nationaltrends and consumer shopping habits wereobtained primarily from industry associationpublications, including the Food MarketingInstitute, Progressive Grocer, Organic TradeAssociation, National Association of Conve-nience Stores, and the International Council ofShopping Centers, as well as articles and inter-views from major national andregional news publications. Forexpenditure data and demo-graphic information, sourcesincluded the U.S. Census Bureau,the Bureau of Labor Statistics,the USDA Economic ResearchService, as well as severaluniversity research center studiesand publications.
Obtaining data for the localanalysis proved more challenging.While the Arlington CountyCommissioner of Revenue wasable to provide general informa-tion relating to grocery store salesin Arlington, the office could notprovide store-specific data – evenclassified by a general type ofstore – due to privacy regulations.Site plan documents and Certifi-cate of Occupancy reports provided useful, butlimited data pertaining to square-footage of stores.Online data sources such as the U.S. CensusBureau provided good (albeit slightly outdated)local area information, and the Food MarketingInstitute generously shared portions of its regionalsurvey data related to consumer shopping patterns.Staff conducted its own field inventory of grocerystores and ultimately categorized them based onindependent observation and analysis.
Defining Grocery StoresIn a review of the various (non-restaurant) storesthat sell food throughout the County, it quicklybecame apparent that the definition of a grocery
store was not so clear cut. Arlington has stores bigand small, with some that focus on one-stopshopping for mainstream consumers and othersthat cater to specific demographic groups. Forexample, places like 7-Eleven target the in-and-outconvenience shopper, while others like Arrowineencourage customers to linger by holding in-storetastings and educational seminars. And while one
can buy food at both, but theyhave very different characteris-tics with regard to theireconomic contribution andplacemaking value.
It became clear that before anyattempt to inventory Arlington’sgrocery stores could take place,a better definition of a grocerystore and a way to classify thedifferent store types and formatswas needed. The Food Market-ing Institute (FMI), a leadingassociation for the food retailingindustry, defines a grocery storeas “any retail store selling a lineof dry grocery, canned goods, ornonfood items plus some perish-able items.”
Although FMI also provides anear exhaustive list of traditional and non-tradi-tional store types and formats, AED struggled tocategorize Arlington’s stores into the industrydefinitions. The industry defines itself primarilyusing quantitative data related to number of stock-keeping units (SKUs), square-footage, salesvolumes, and percentage of selling area allotted tocertain types of products, none of which speaks towhat makes a store successful in terms of localeconomics or placemaking.
In other words, the industry definitions lack thecritical qualitative information that answers thequestion: “Why would Arlington want one type ofstore versus another?” There is little within the
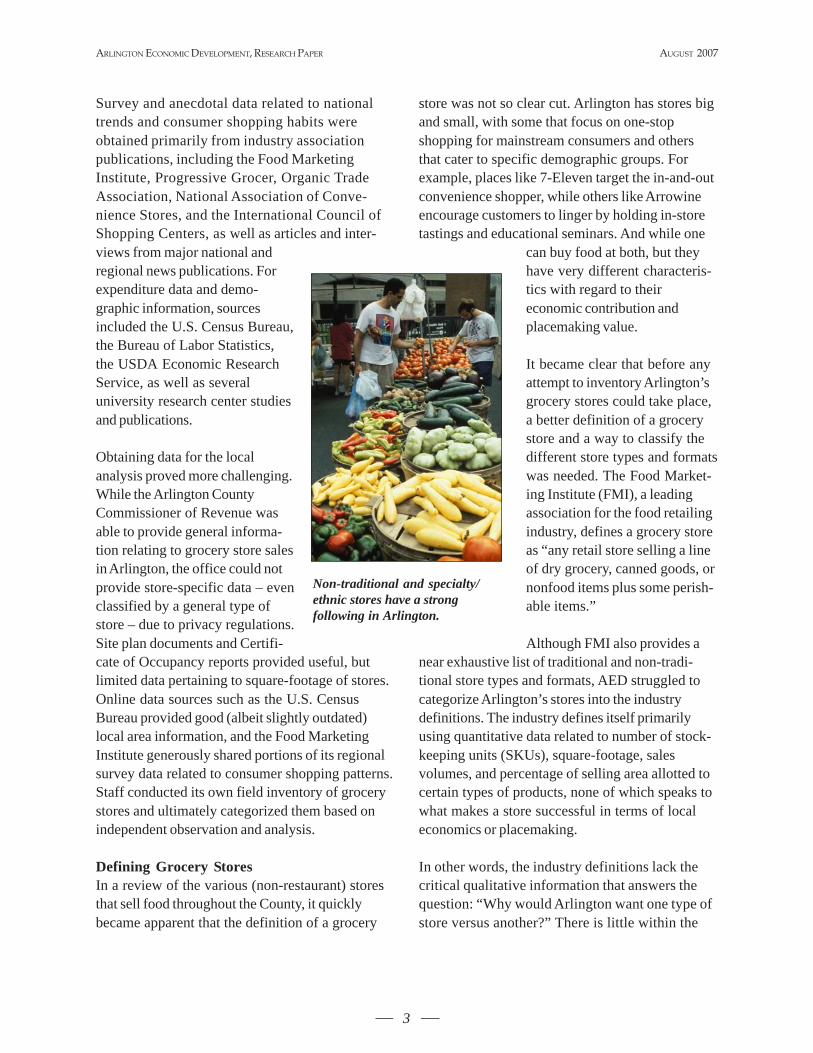
Non-traditional and specialty/ethnic stores have a strongfollowing in Arlington.
ARLINGTON ECONOMIC DEVELOPMENT, RESEARCH PAPER
4
AUGUST 2007
FMI definitions to explain why certainstore types and formats succeed and arewell-suited to urban areas like Arlington.Ultimately, AED determined that theindustry definitions, while a suitable“jumping off point”, were incompletefor the purposes of the study. As aresult, staff formulated its own catego-ries (see p.16). In most cases the AEDcategories incorporate the industry’squantitative information, but are supple-mented with economic sustainability andplacemaking characteristics.
Grocery Industry TrendsWith so many different store types allfighting for market share, the foodretailing industry is changing dramatically.Although food sales have long been thepurview of conventional supermarkets,these once impenetrable retailers are nowfacing fierce competition from other storetypes/formats. Studies suggest that salesby these traditional food retailers, whichaccounted for 52 percent of the market in2004, will only comprise 40 percent ofgrocery sales by 2013.1
What is the cause of the grocery industryto sap such a significant portion of salesfrom traditional retailers? The followingsection explores these key trends:
• Supercenters and wholesalers, whichoperate with higher volumes and canundercut competitors, have movedaggressively into food retailing.
1 Fusaro, Dave. Feb. 28, 2006. Nontraditional Retailers May Overtake Supermarkets, Food Processing Magazine.
FMI Industry-Level DefinitionsConvenience Store — Any full-line, self-service grocery store offeringlimited line of high-convenience items. Open long hours and provideseasy access. The majority sell gasoline with an annual sales of $2million or more. (Example: 7-Eleven)
• Convenience Store (Traditional) - A small, higher-margin storethat offers an edited selection of staple groceries, non-foods, andother convenience food items, i.e., ready-to-heat and ready-to-eatfoods. The traditional format includes those stores that started out asstrictly convenience stores but might also sell gasoline.
• Convenience Store (Petroleum-Based) - The petroleum-basedstores are primarily gas stations with a convenience store.
Internet - An Internet-based grocery distribution operator. Included inthis format are all Internet operators who use the Internet as the primarymeans of accepting grocery orders for home delivery or pickup. Alsoincluded are major food retailers that generate a portion of their salesthrough Internet-based sales. Internet suppliers typically offer 12,000SKUs or more for home delivery. (Example: Peapod)
Supercenter - A large food/drug combination store and massmerchandiser under a single roof. The supercenters offer a wide varietyof food, as well as non-food merchandise. These stores average morethan 170,000 square feet and typically devote as much as 40% of thespace to grocery items. (Examples: Wal-Mart, Kmart, Super Target)
Supermarket - Any full-line self-service grocery store generating asales volume of $2 million or more annually. (Examples: Harris Teeter,Giant, Safeway)
• Conventional Supermarket - The original supermarket formatoffering a full line of groceries, meat, and produce with at least $2million in annual sales. Conventional stores will realize 9% of theirsales in general merchandise/health and beauty care (GM/HBC)products. These stores typically carry approximately 15,000 items,offer a service deli and frequently a service bakery.
• Superstore - A larger version of the conventional supermarket withat least 40,000 square feet in total selling area and 25,000 items.Superstores offer an expanded selection of non-foods(at least 10% GM/HBC).
Wholesale Club - A membership retail/wholesale hybrid with a variedselection and limited variety of products presented in a warehouse-typeenvironment. These 120,000 square-foot stores have 60% to 70% GM/HBC and a grocery line dedicated to large sizes and bulk sales.Memberships include both business accounts and consumer groups.(Examples: Sam’s Club, Costco, BJ’s)
Source: Food Marketing Institute
ARLINGTON ECONOMIC DEVELOPMENT, RESEARCH PAPER AUGUST 2007
5
• Restaurants offering expanded takeout anddelivery options pose a threat by catering to time-pressed and convenience-driven consumers.
• Even amongst themselves, traditional foodretailers are pulling out all the stops to expandtheir product selection and differentiate them-selves from similar store formats.
• Grocery stores are exploring new opportunities inurban markets, wooed by the demographics of“returning-to-the-city” middle- and high-incomesingles, young professionals, and empty-nesters.
• Large format specialty ethnic stores are captur-ing market share in areas with high immigrantpopulations and “ethnic foodies”.
• Food retailers are taking notice of the fast-growing organic foods market. Many stores areexpanding their selection of organic products andactively marketing them to consumers.
Supermarkets Struggle WithIncreased Competition
The conventional supermarket is fighting forsurvival in an ultra-competitive marketplace. Withthe U.S. population growing at a modest rate andthe cost of food holding relatively steady, there is alimited amount of available food dollars, and adiverse group of retailers battling to get it, including(but not limited to) supercenters, wholesale clubs,organic and natural foods stores, specialty markets,convenience stores, and even Internet grocers.
Wal-Mart’s ImpactThere is particular reason to be concerned aboutsupercenters, especially when it comes to Wal-Mart, the nation’s #1 grocery operator. RetailForward, an Ohio-based research firm, estimates
that in 2004, Wal-Mart sold $109 billion in grocer-ies, taking a 19 percent share of the market. Itprojects that the number of Wal-Mart Supercenterswill triple by 2010, attracting an estimated 35
percent share of the grocery business. How?Wal-Mart undercuts supermarket prices by asmuch as 20 percent, but is still able to generateconsiderable grocery profits because of its enor-mous volume and huge buying power. According tothe American Journal of Agricultural Economics, anew Wal-Mart typically captures up to a 17percent share of existing grocery business withinthe first two years of operation.2
Wal-Mart’s crippling effect on the conventionalgrocery industry is not only due to the proliferationof its massive 185,000 square-foot Supercenters.Located intentionally in the same markets to appealto time-pressed shoppers, Wal-Mart’s Neighbor-hood Markets™ directly compete with theconventional supermarket head on with their40,000-50,000 square-foot stores. Similar to largenational chains, Neighborhood Markets offer acomplete grocery line and an array of comple-mentary services (e.g. pharmacy, photo lab,etc.). Like the Supercenters, the NeighborhoodMarkets are tied in to Wal-Mart’s online inven-tory and are able to operate with less staff thanlocal competitors, thus giving them the ability tosignificantly undercut competitors. In 2006,sales at Wal-Marts 110 Neighborhood Marketsapproximated $7 billion.
2 Spring 2007. Washington Area Retail Outlook, Delta Associates.
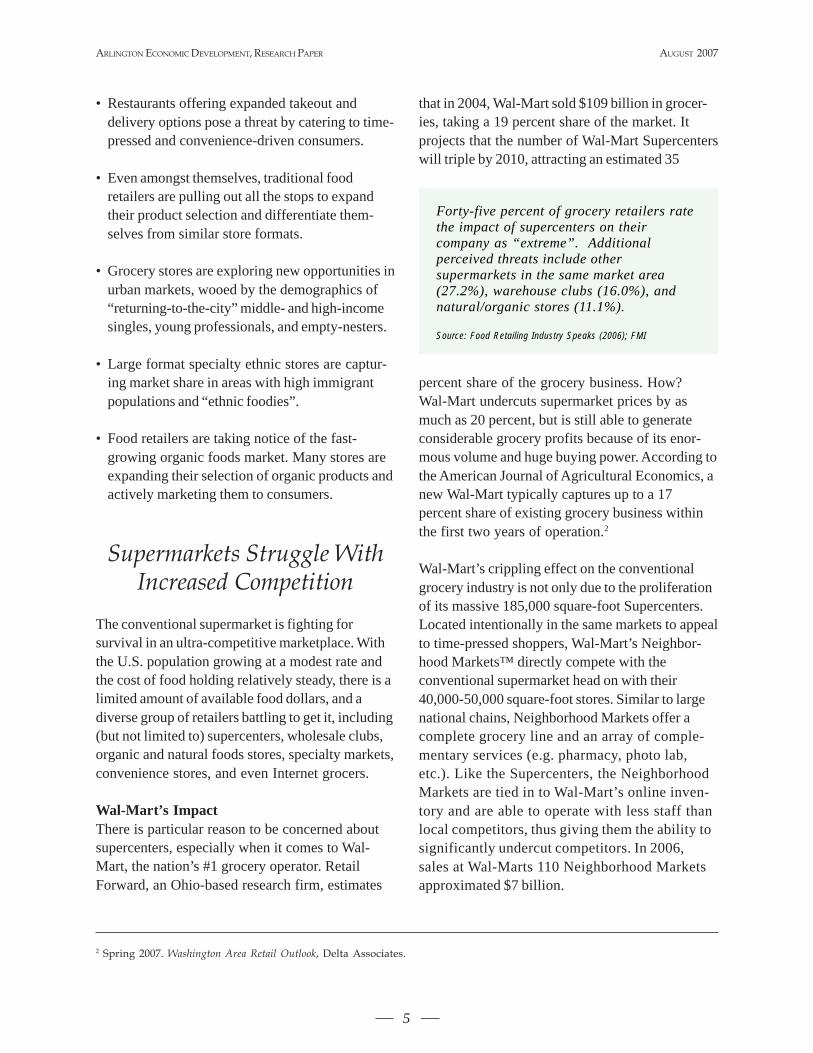
Forty-five percent of grocery retailers ratethe impact of supercenters on theircompany as “extreme”. Additionalperceived threats include othersupermarkets in the same market area(27.2%), warehouse clubs (16.0%), andnatural/organic stores (11.1%).
Source: Food Retailing Industry Speaks (2006); FMI
ARLINGTON ECONOMIC DEVELOPMENT, RESEARCH PAPER
6
AUGUST 2007
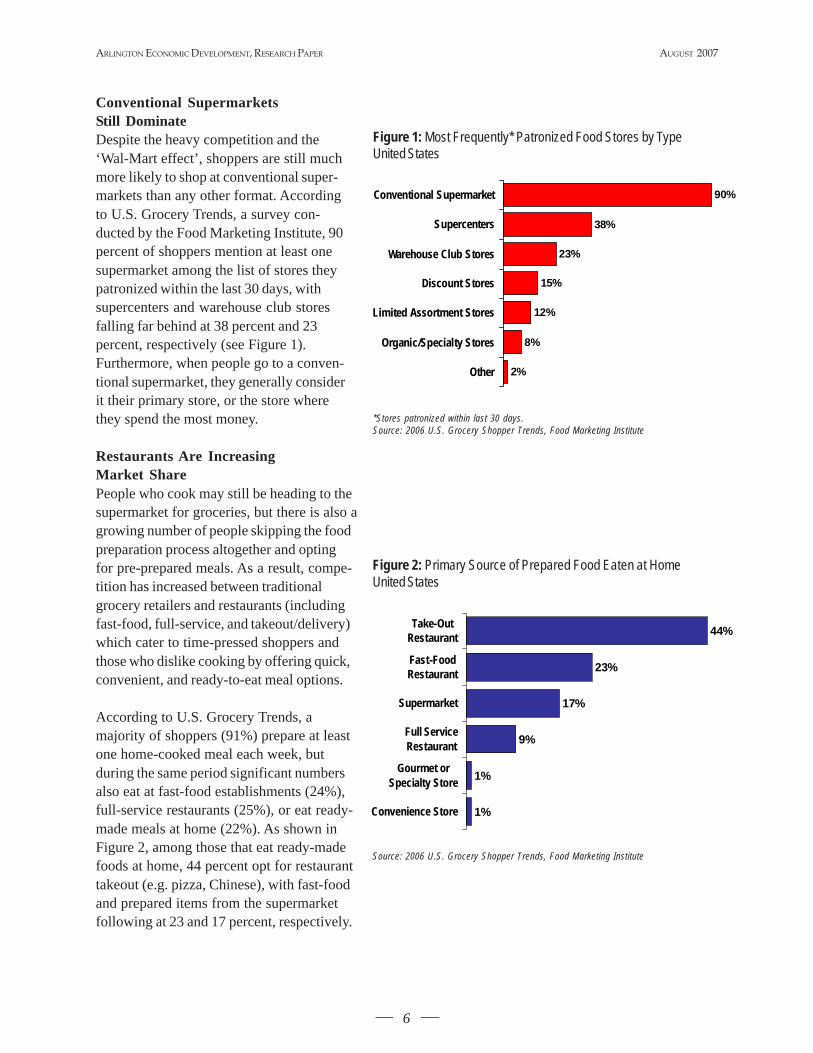
Conventional SupermarketsStill DominateDespite the heavy competition and the‘Wal-Mart effect’, shoppers are still muchmore likely to shop at conventional super-markets than any other format. Accordingto U.S. Grocery Trends, a survey con-ducted by the Food Marketing Institute, 90percent of shoppers mention at least onesupermarket among the list of stores theypatronized within the last 30 days, withsupercenters and warehouse club storesfalling far behind at 38 percent and 23percent, respectively (see Figure 1).Furthermore, when people go to a conven-tional supermarket, they generally considerit their primary store, or the store wherethey spend the most money.
Restaurants Are IncreasingMarket SharePeople who cook may still be heading to thesupermarket for groceries, but there is also agrowing number of people skipping the foodpreparation process altogether and optingfor pre-prepared meals. As a result, compe-tition has increased between traditionalgrocery retailers and restaurants (includingfast-food, full-service, and takeout/delivery)which cater to time-pressed shoppers andthose who dislike cooking by offering quick,convenient, and ready-to-eat meal options.
According to U.S. Grocery Trends, amajority of shoppers (91%) prepare at leastone home-cooked meal each week, butduring the same period significant numbersalso eat at fast-food establishments (24%),full-service restaurants (25%), or eat ready-made meals at home (22%). As shown inFigure 2, among those that eat ready-madefoods at home, 44 percent opt for restauranttakeout (e.g. pizza, Chinese), with fast-foodand prepared items from the supermarketfollowing at 23 and 17 percent, respectively.
Figure 1: Most Frequently* Patronized Food Stores by TypeUnited States
*Stores patronized within last 30 days.Source: 2006 U.S. Grocery Shopper Trends, Food Marketing Institute
90%
38%
23%
15%
12%
8%
2%
Conventional Supermarket
Supercenters
Warehouse Club Stores
Discount Stores
Limited Assortment Stores
Organic/Specialty Stores
Other
Figure 2: Primary Source of Prepared Food Eaten at HomeUnited States
Source: 2006 U.S. Grocery Shopper Trends, Food Marketing Institute
44%
23%
17%
9%
1%
1%
Take-OutRestaurant
Fast-FoodRestaurant
Supermarket
Full ServiceRestaurant
Gourmet orSpecialty Store
Convenience Store
ARLINGTON ECONOMIC DEVELOPMENT, RESEARCH PAPER AUGUST 2007
7
Differentiation andConsolidation in Food Stores
New ServicesAmidst stiff competition, grocery stores arediversifying to attract consumers. From getting acappuccino to filling up your gas tank, retailers areappealing not only to consumers’ desire for conve-nience and “one-stop-shopping”, but they are also
hoping to create destination experiences that willkeep shoppers lingering longer and ultimatelyspending more. According to the authors of TheExperience Economy, a book exploring thestrategies of successful companies, they are on theright track: “Those businesses that relegatethemselves to the diminishing world of goodsand services will be rendered irrelevant. Toavoid this fate, [they] must learn to stage a rich,compelling experience.”3
Yesterday’s ways of luring in customers – byhaving separate bakeries, pharmacies, delis, andfloral departments – have given way to a host ofnew in-store amenities, including cafés, cookingdemonstrations, health screenings and clinics,childcare, dry cleaning, and DVD movie rentals.Many larger food retailers have reached out tocomplementary retail to keep shoppers in the store– bank branches and onsite Starbucks® coffeelocations are common examples. One downside tothis: according to one Midwest firm which special-izes in grocery store-anchored shopping centers, asthe grocery stores bring in “outside tenants” theyonce might have operated next to, they becomemini shopping centers themselves. This trend hasforced developers to scale back shopping centerprojects and made it more difficult for landlords tolease other space in grocery-anchored centers.4
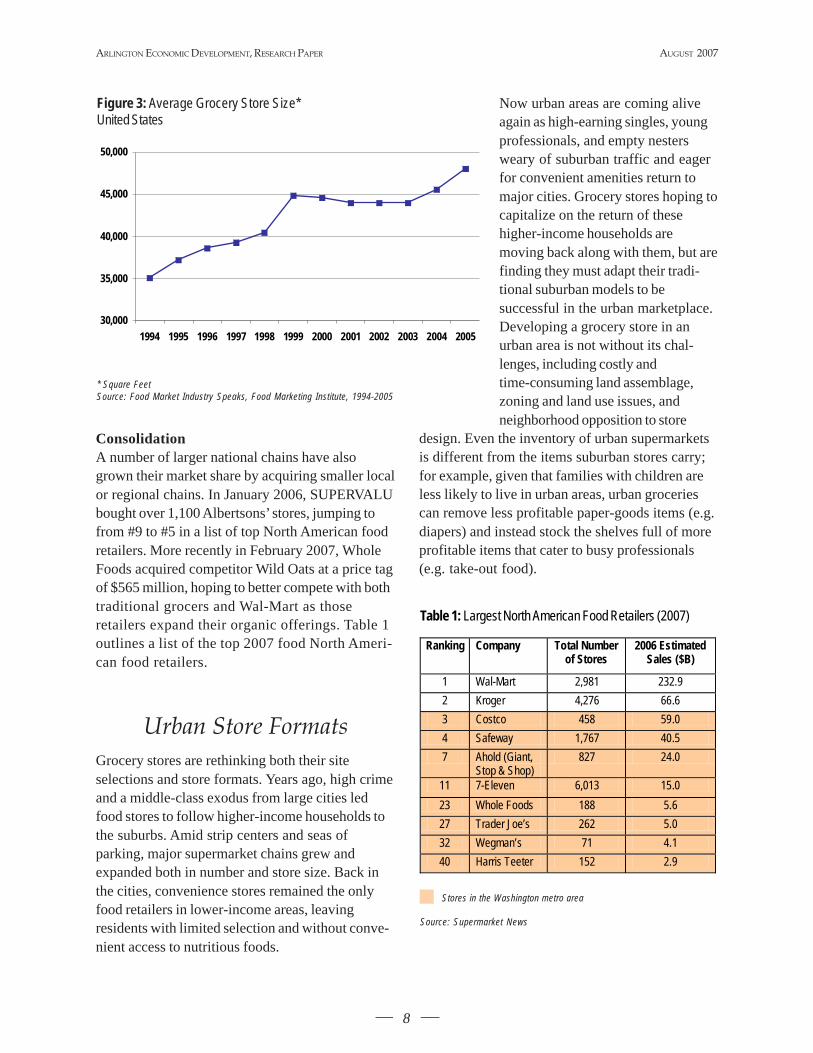
Size ConsiderationsTo accommodate all these on-site new productsand services, grocery stores need more space, andas a result, the median average grocery store sizeis on the rise. According to the Food MarketingInstitute, from 1994 to 2006, the average store sizegrew 37 percent, from 35,100 square feet to 48,750square feet (see Figure 3).
However, some research suggests that while thebig stores are getting massive in their attempts tosqueeze in Starbucks® and the neighborhood drycleaner, the real “growing” market is in the smaller,10,000-20,000 square-foot range, where specialtyretailers like Trader Joe’s are proving that shoppersare willing to forego the large selection of productsat traditional supermarkets for the quality, conve-nience, and service of smaller formats. For someshoppers, the fact that grocery stores are gettingbigger and bigger is not a plus – not only can thelayout of the stores be difficult to navigate, but itcan be a turnoff for those shoppers who only needa few quick convenience items.
3 Gilmore, James H. and B. Joseph Pine. 1999. The Experience Economy, Harvard Business School Press, 25.4 McCartney, Jim. May 2003. Added Services Turn Supermarkets Into Centers, Shopping Centers Today; International Council of
Shopping Centers, 156.
Grocery Stores Appeal toTime-Pressed Shoppers
To appeal to the busy consumer, Super Stop & Shopmarkets have added gadgets and gizmos to encourage aone-stop shopping experience. The center aisle beckonslike a movie marquee, stocked with DVDs, video games,and books. Customers can buy toilet seats and towels,Play-Doh and Barbies as easily as toilet paper, papertowels, and detergent. As part of the chain’s store-within-a-store concept, there is a Staples office supply section in oneaisle, a Boston Chicken outlet in the prepared foods section,and a small dining area equipped with wireless Internetservice. For those in a hurry, Stop & Shop offers self-checkout and a “shopping buddy”, a computer tablet thatgoes on the cart, identifies specials, and navigates thestores at the swipe of a store card.
Source: Fischler, Marcelle S., Super Duper Markets, The New YorkTimes, July 29, 2006
ARLINGTON ECONOMIC DEVELOPMENT, RESEARCH PAPER
8
AUGUST 2007
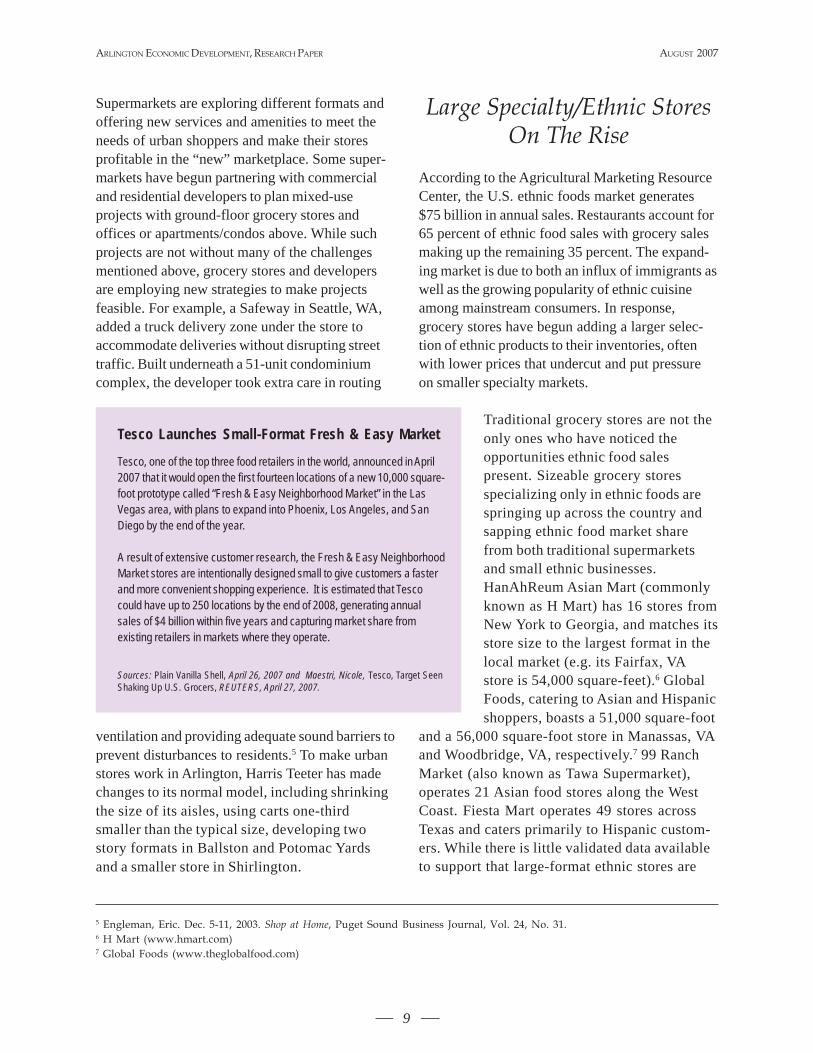
ConsolidationA number of larger national chains have alsogrown their market share by acquiring smaller localor regional chains. In January 2006, SUPERVALUbought over 1,100 Albertsons’ stores, jumping tofrom #9 to #5 in a list of top North American foodretailers. More recently in February 2007, WholeFoods acquired competitor Wild Oats at a price tagof $565 million, hoping to better compete with bothtraditional grocers and Wal-Mart as thoseretailers expand their organic offerings. Table 1outlines a list of the top 2007 food North Ameri-can food retailers.
Urban Store FormatsGrocery stores are rethinking both their siteselections and store formats. Years ago, high crimeand a middle-class exodus from large cities ledfood stores to follow higher-income households tothe suburbs. Amid strip centers and seas ofparking, major supermarket chains grew andexpanded both in number and store size. Back inthe cities, convenience stores remained the onlyfood retailers in lower-income areas, leavingresidents with limited selection and without conve-nient access to nutritious foods.
Now urban areas are coming aliveagain as high-earning singles, youngprofessionals, and empty nestersweary of suburban traffic and eagerfor convenient amenities return tomajor cities. Grocery stores hoping tocapitalize on the return of thesehigher-income households aremoving back along with them, but arefinding they must adapt their tradi-tional suburban models to besuccessful in the urban marketplace.Developing a grocery store in anurban area is not without its chal-lenges, including costly andtime-consuming land assemblage,zoning and land use issues, andneighborhood opposition to store
design. Even the inventory of urban supermarketsis different from the items suburban stores carry;for example, given that families with children areless likely to live in urban areas, urban groceriescan remove less profitable paper-goods items (e.g.diapers) and instead stock the shelves full of moreprofitable items that cater to busy professionals(e.g. take-out food).
Figure 3: Average Grocery Store Size*United States
* Square FeetSource: Food Market Industry Speaks, Food Marketing Institute, 1994-2005
30,000
35,000
40,000
45,000
50,000
1994 1995 1996 1997 1998 1999 2000 2001 2002 2003 2004 2005
Table 1: Largest North American Food Retailers (2007)
Stores in the Washington metro area
Source: Supermarket News
Ranking Company Total Number of Stores
2006 Estimated Sales ($B)
1 Wal-Mart 2,981 232.9 2 Kroger 4,276 66.6 3 Costco 458 59.0 4 Safeway 1,767 40.5 7 Ahold (Giant,
Stop & Shop) 827 24.0
11 7-Eleven 6,013 15.0 23 Whole Foods 188 5.6 27 Trader Joe’s 262 5.0 32 Wegman’s 71 4.1 40 Harris Teeter 152 2.9
ARLINGTON ECONOMIC DEVELOPMENT, RESEARCH PAPER AUGUST 2007
9
Supermarkets are exploring different formats andoffering new services and amenities to meet theneeds of urban shoppers and make their storesprofitable in the “new” marketplace. Some super-markets have begun partnering with commercialand residential developers to plan mixed-useprojects with ground-floor grocery stores andoffices or apartments/condos above. While suchprojects are not without many of the challengesmentioned above, grocery stores and developersare employing new strategies to make projectsfeasible. For example, a Safeway in Seattle, WA,added a truck delivery zone under the store toaccommodate deliveries without disrupting streettraffic. Built underneath a 51-unit condominiumcomplex, the developer took extra care in routing
ventilation and providing adequate sound barriers toprevent disturbances to residents.5 To make urbanstores work in Arlington, Harris Teeter has madechanges to its normal model, including shrinkingthe size of its aisles, using carts one-thirdsmaller than the typical size, developing twostory formats in Ballston and Potomac Yardsand a smaller store in Shirlington.
Large Specialty/Ethnic StoresOn The Rise
According to the Agricultural Marketing ResourceCenter, the U.S. ethnic foods market generates$75 billion in annual sales. Restaurants account for65 percent of ethnic food sales with grocery salesmaking up the remaining 35 percent. The expand-ing market is due to both an influx of immigrants aswell as the growing popularity of ethnic cuisineamong mainstream consumers. In response,grocery stores have begun adding a larger selec-tion of ethnic products to their inventories, oftenwith lower prices that undercut and put pressureon smaller specialty markets.
Traditional grocery stores are not theonly ones who have noticed theopportunities ethnic food salespresent. Sizeable grocery storesspecializing only in ethnic foods arespringing up across the country andsapping ethnic food market sharefrom both traditional supermarketsand small ethnic businesses.HanAhReum Asian Mart (commonlyknown as H Mart) has 16 stores fromNew York to Georgia, and matches itsstore size to the largest format in thelocal market (e.g. its Fairfax, VAstore is 54,000 square-feet).6 GlobalFoods, catering to Asian and Hispanicshoppers, boasts a 51,000 square-foot
and a 56,000 square-foot store in Manassas, VAand Woodbridge, VA, respectively.7 99 RanchMarket (also known as Tawa Supermarket),operates 21 Asian food stores along the WestCoast. Fiesta Mart operates 49 stores acrossTexas and caters primarily to Hispanic custom-ers. While there is little validated data availableto support that large-format ethnic stores are
5 Engleman, Eric. Dec. 5-11, 2003. Shop at Home, Puget Sound Business Journal, Vol. 24, No. 31.6 H Mart (www.hmart.com)7 Global Foods (www.theglobalfood.com)
Tesco Launches Small-Format Fresh & Easy Market
Tesco, one of the top three food retailers in the world, announced in April2007 that it would open the first fourteen locations of a new 10,000 square-foot prototype called “Fresh & Easy Neighborhood Market” in the LasVegas area, with plans to expand into Phoenix, Los Angeles, and SanDiego by the end of the year.
A result of extensive customer research, the Fresh & Easy NeighborhoodMarket stores are intentionally designed small to give customers a fasterand more convenient shopping experience. It is estimated that Tescocould have up to 250 locations by the end of 2008, generating annualsales of $4 billion within five years and capturing market share fromexisting retailers in markets where they operate.
Sources: Plain Vanilla Shell, April 26, 2007 and Maestri, Nicole, Tesco, Target SeenShaking Up U.S. Grocers, REUTERS, April 27, 2007.
ARLINGTON ECONOMIC DEVELOPMENT, RESEARCH PAPER
10
AUGUST 2007
poised to be a major presence in the food retailing,anecdotal evidence suggests they will be animportant segment of the industry to watch.
The Organic Food MarketIn recent years, consumer interest in organic foodshas increased as new research has exposed thepossible adverse effects of pesticides, hormones,and other genetically-altered food. The OrganicTrade Association (OTA) estimates organic foodsales more than tripled between 1997 and 2005,growing from $3.5 to $13.8 billion. During thatsame period, organic food sales averaged anannual growth rate of between 15 and 21 percent,while total U.S. food sales grew only in the rangeof two to four percent.
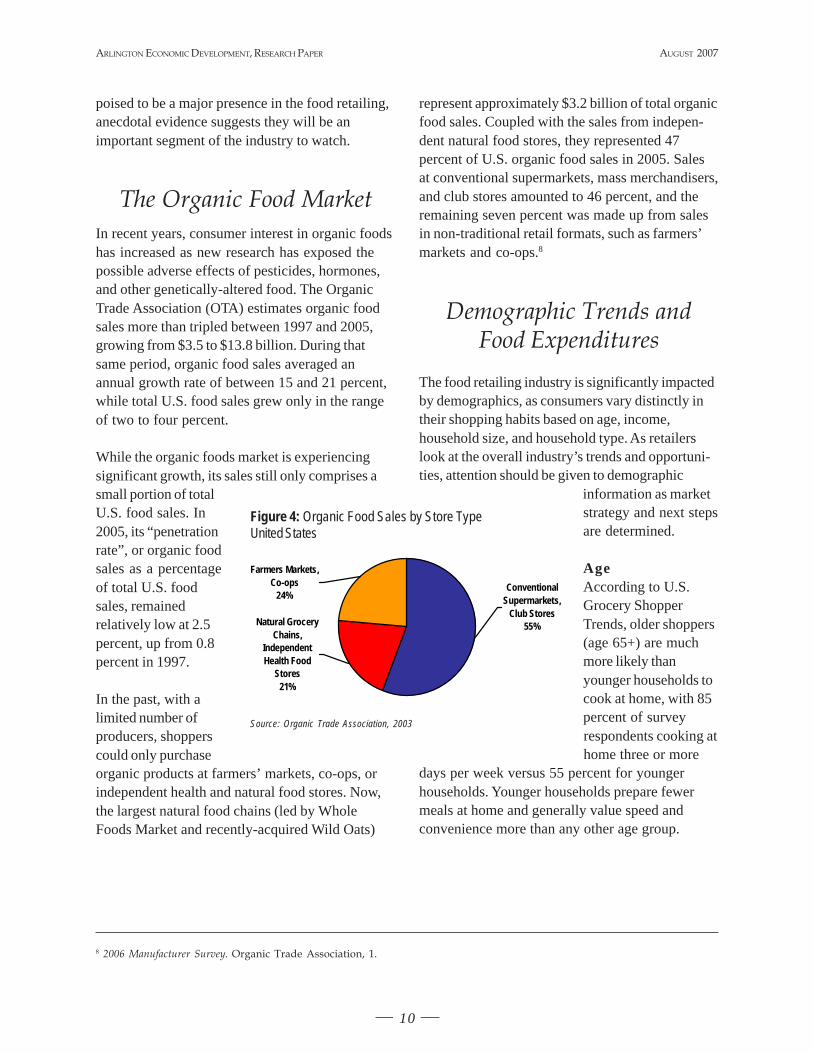
While the organic foods market is experiencingsignificant growth, its sales still only comprises asmall portion of totalU.S. food sales. In2005, its “penetrationrate”, or organic foodsales as a percentageof total U.S. foodsales, remainedrelatively low at 2.5percent, up from 0.8percent in 1997.
In the past, with alimited number ofproducers, shopperscould only purchaseorganic products at farmers’ markets, co-ops, orindependent health and natural food stores. Now,the largest natural food chains (led by WholeFoods Market and recently-acquired Wild Oats)
represent approximately $3.2 billion of total organicfood sales. Coupled with the sales from indepen-dent natural food stores, they represented 47percent of U.S. organic food sales in 2005. Salesat conventional supermarkets, mass merchandisers,and club stores amounted to 46 percent, and theremaining seven percent was made up from salesin non-traditional retail formats, such as farmers’markets and co-ops.8
Demographic Trends andFood Expenditures
The food retailing industry is significantly impactedby demographics, as consumers vary distinctly intheir shopping habits based on age, income,household size, and household type. As retailerslook at the overall industry’s trends and opportuni-ties, attention should be given to demographic
information as marketstrategy and next stepsare determined.
AgeAccording to U.S.Grocery ShopperTrends, older shoppers(age 65+) are muchmore likely thanyounger households tocook at home, with 85percent of surveyrespondents cooking athome three or more
days per week versus 55 percent for youngerhouseholds. Younger households prepare fewermeals at home and generally value speed andconvenience more than any other age group.
Figure 4: Organic Food Sales by Store TypeUnited States
Source: Organic Trade Association, 2003
Natural Grocery Chains,
Independent Health Food
Stores21%
Farmers Markets, Co-ops
24%Conventional
Supermarkets, Club Stores
55%
8 2006 Manufacturer Survey. Organic Trade Association, 1.
ARLINGTON ECONOMIC DEVELOPMENT, RESEARCH PAPER AUGUST 2007
11
Wal-Mart Expands Into Organics
In the spring of 2006, Wal-Mart began expanding its offerings of organic foods, nearly doubling the number of organicproducts on its shelves. The following July, it launched a marketing campaign solely focused on organics, announcing itwanted to make organic products affordable to those who could not afford typical 20-30% premiums, selling them for just10 percent more than their conventional equivalents.
Source: Warner, Melanie, Wal-Mart Eyes Organic Foods, The New York Times, May 12, 2006
ARLINGTON ECONOMIC DEVELOPMENT, RESEARCH PAPER
12
AUGUST 2007
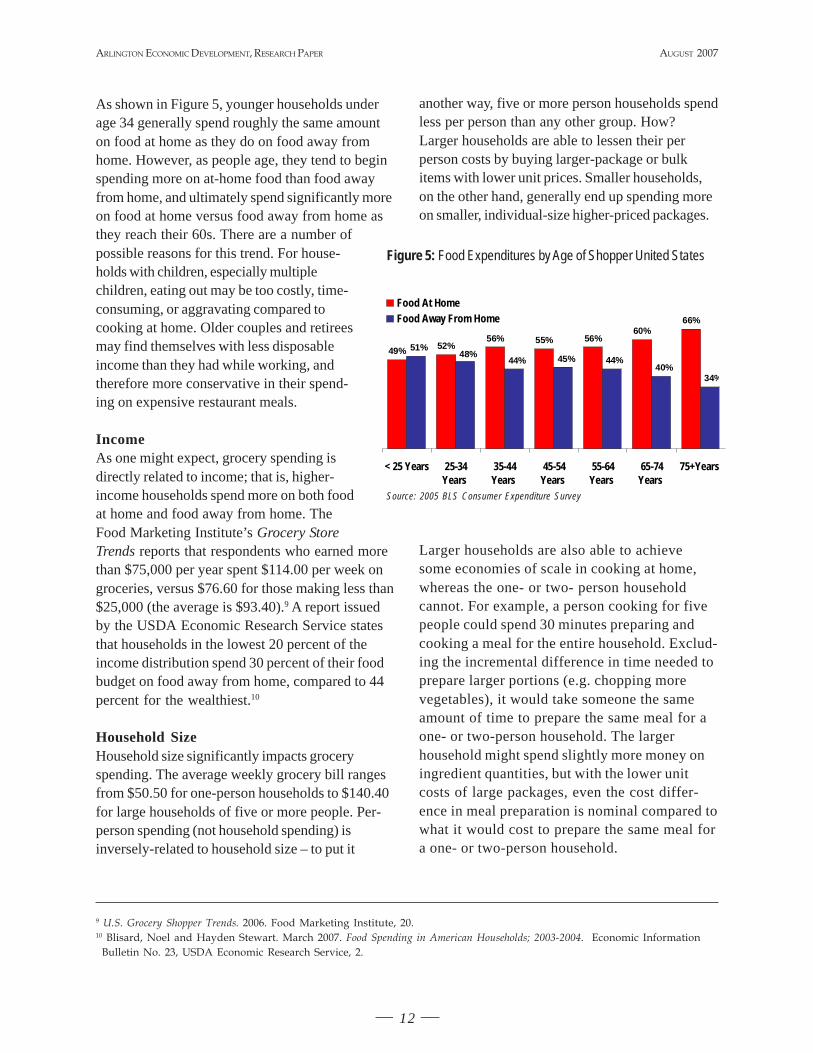
As shown in Figure 5, younger households underage 34 generally spend roughly the same amounton food at home as they do on food away fromhome. However, as people age, they tend to beginspending more on at-home food than food awayfrom home, and ultimately spend significantly moreon food at home versus food away from home asthey reach their 60s. There are a number ofpossible reasons for this trend. For house-holds with children, especially multiplechildren, eating out may be too costly, time-consuming, or aggravating compared tocooking at home. Older couples and retireesmay find themselves with less disposableincome than they had while working, andtherefore more conservative in their spend-ing on expensive restaurant meals.
IncomeAs one might expect, grocery spending isdirectly related to income; that is, higher-income households spend more on both foodat home and food away from home. TheFood Marketing Institute’s Grocery StoreTrends reports that respondents who earned morethan $75,000 per year spent $114.00 per week ongroceries, versus $76.60 for those making less than$25,000 (the average is $93.40).9 A report issuedby the USDA Economic Research Service statesthat households in the lowest 20 percent of theincome distribution spend 30 percent of their foodbudget on food away from home, compared to 44percent for the wealthiest.10
Household SizeHousehold size significantly impacts groceryspending. The average weekly grocery bill rangesfrom $50.50 for one-person households to $140.40for large households of five or more people. Per-person spending (not household spending) isinversely-related to household size – to put it
another way, five or more person households spendless per person than any other group. How?Larger households are able to lessen their perperson costs by buying larger-package or bulkitems with lower unit prices. Smaller households,on the other hand, generally end up spending moreon smaller, individual-size higher-priced packages.
Larger households are also able to achievesome economies of scale in cooking at home,whereas the one- or two- person householdcannot. For example, a person cooking for fivepeople could spend 30 minutes preparing andcooking a meal for the entire household. Exclud-ing the incremental difference in time needed toprepare larger portions (e.g. chopping morevegetables), it would take someone the sameamount of time to prepare the same meal for aone- or two-person household. The largerhousehold might spend slightly more money oningredient quantities, but with the lower unitcosts of large packages, even the cost differ-ence in meal preparation is nominal compared towhat it would cost to prepare the same meal fora one- or two-person household.
9 U.S. Grocery Shopper Trends. 2006. Food Marketing Institute, 20.10 Blisard, Noel and Hayden Stewart. March 2007. Food Spending in American Households; 2003-2004. Economic Information
Bulletin No. 23, USDA Economic Research Service, 2.
Figure 5: Food Expenditures by Age of Shopper United States
Source: 2005 BLS Consumer Expenditure Survey
49% 52%56% 55% 56%
60%66%
51%48%
44% 45% 44%40%
34%
< 25 Years 25-34Years
35-44Years
45-54Years
55-64Years
65-74Years
75+Years
Food At HomeFood Away From Home
ARLINGTON ECONOMIC DEVELOPMENT, RESEARCH PAPER AUGUST 2007
13
Household TypeThe population is becoming more ethnicallydiverse, and as minority groups grow in size, sodoes their buying power. Most notably, the U.S.Hispanic population currently constitutes 14.2percent (or approximately 40.5 million) of the U.S.household population, and is projected to comprisenearly a quarter of the total population by 2050.11
Research suggests this substantial growth, coupledwith greater employment opportunities, will boostHispanics’ buying power to over $863 billion in2007 and nearly $1.2 trillion by 2011.12
A study performed by the Food Marketing Insti-tute, “El Mercado 2005 – U.S. Hispanic GroceryShopper Trends”, explains how Hispanic shoppers’habits differ from the general U.S. shopper.Hispanic shoppers make an average of 26 grocerytrips per month (three times more than the generalU.S. shopper) and spend approximately $133.00per week, whereas non-Hispanic shoppers average$93.40. Like most consumers, they frequentgrocery stores for their basic purchases, but theyare significantly more likely to patronize smallethnic businesses like panaderías (bakeries) andcarnecerías (butcher shops).
Who is Shopping Where?According to U.S. Grocery Trends, some storeformats appeal to particular demographic groupsmore than others. For example, high-earningmiddle-age shoppers and people in their 30s tend tofrequent conventional supermarkets more oftenthan families with children and low-income shop-pers. College-educated shoppers, full-timeworkers, two-person households, and “big spend-ers” also tend to be loyal supermarket shoppers.
High-earning shoppers tend to steer clear ofsupercenters. Only 15 percent of this income groupidentify supercenters as their primary store,compared to 22 percent overall and 43 percent of
the lowest income group. Women, particularlysingle mothers and part-time workers, are alsosignificantly more likely to shop at supercentersthan men. Supercenter shoppers also tend to bepeople who prefer to combine visits to multiplestores into one shopping trip.
When it comes to supermarkets versussupercenters, the influence of geographiclocation on shopping patterns and preferences
Size of Household Average Expenditure
One $62.20
Two $83.20
Three-Four $107.20
Five or More $ 131.40
Table 2: Average Weekly Food Spending byHousehold Size - 2007United States
Source: U.S. Grocery Trends 2007 - FMI
11 March 2004, U.S. Interim Projections by Age, Sex, Race, and Hispanic Origin. U.S. Census Bureau.12 Humphreys, Jeffrey M.. 2006. The Multicultural Economy 2006, Georgia Business and Economic Conditions Vol. 6, No. 3, The
University of Georgia.
Whole Foods Market, Clarendon
ARLINGTON ECONOMIC DEVELOPMENT, RESEARCH PAPER
14
AUGUST 2007
should not be overlooked. People living in theEast are more likely to shop at conventionalsupermarkets than those living in the Midwest,while Midwesterners are significantly morelikely (four times, in fact) than their easterncounterparts to shop at supercenters. Suburbanshoppers tend to frequent supermarkets,whereas shoppers in rural areas or small townsare more likely to shop at supercenters.
Men, along with singles and full-time workers, aremost likely to purchase food at a conveniencestore. Along with high-earning young professionalsand college-educated shoppers, they are alsosignificantly more likely (2x the average shopper)to shop at natural/organic food stores. Theseshoppers tend to be less concerned with price andcost-savings than other demographic groups.
Ethnic supermarkets tend to attract a younger(under age 49) group of shoppers who live in urbanareas (although this may simply be a reflection ofwhere immigrant populations and ethnic marketsare concentrated). Singles and minority shoppersare also more likely to frequent ethnic food stores.
Arlington’s demographics are not typical of thenation’s. With higher than average levels ofhousehold income and educational attainment,small household size, and a young and diversepopulation, Arlington households exhibit differentshopping patterns and habits from the typical U.S.shopper. Nor is the Arlington market, with its densecommercial corridors, typical. While retail in manylocalities surrounding Washington, D.C. is concen-trated in strip centers, Arlington’s retail is spreadamong centers, enclosed malls, and ground floorsof commercial and residential buildings. Thefollowing chapter highlights current market condi-tions in the region and Arlington and then exploresfindings related to local demographics and house-hold expenditures.
The Regional MarketNational industry trends have trickled down to thelocal level, and coupled with increased competition,have led many of the region’s largest retailers tomake changes to stay competitive.
Food Lion has converted 40 of its Maryland andNorthern Virginia stores into Bloom, a high-endalternative that is the result of two years ofresearch and analysis of customer and retailtrends.13 The store bills itself as “a differentkind of grocery store”, and targets convenience-driven shoppers with easy-to-navigate stores,personal scanners to speed the check-outprocess, and a “TableTop” area featuring ready-to-eat meals. In an attempt to capture allsegments of the market, Food Lion has alsoconverted some of its stores to Bottom Dollar, adiscount store.
Giant Food is closing two store locations inPrince George’s County and Fairfax County,and plans to renovate its remaining stores tofeature the types of layouts and products thatappeal to higher-end shoppers. Giant will likelysuffer a loss of profits as a result of WholeFoods’ February 2007 purchase of natural foodscompetitor Wild Oats. Wild Oats and Giant’sonline grocery delivery service, Peapod, joinedforces in the Washington metro area in Septem-ber 2006, with over 120 Wild Oats-brandednatural and organic products available to shop-pers on the Peapod website.14
Wal-Mart will open its first store inside theBeltway this year at the Capitol Plaza ShoppingCenter in Prince George’s County. According tothe American Journal of Agricultural Economics,a new Wal-Mart typically captures a 4-17percent share of existing grocery businesswithin the first two years of operation, a threat-
13 Washington Business Journal, March 2007.14 Wild Oats Markets, Inc. News Release (9/14/06)
ARLINGTON ECONOMIC DEVELOPMENT, RESEARCH PAPER AUGUST 2007
15
ening trend that has likely not escaped the over 20traditional grocery stores within a five-mile radiusof the new Prince George’s location.15
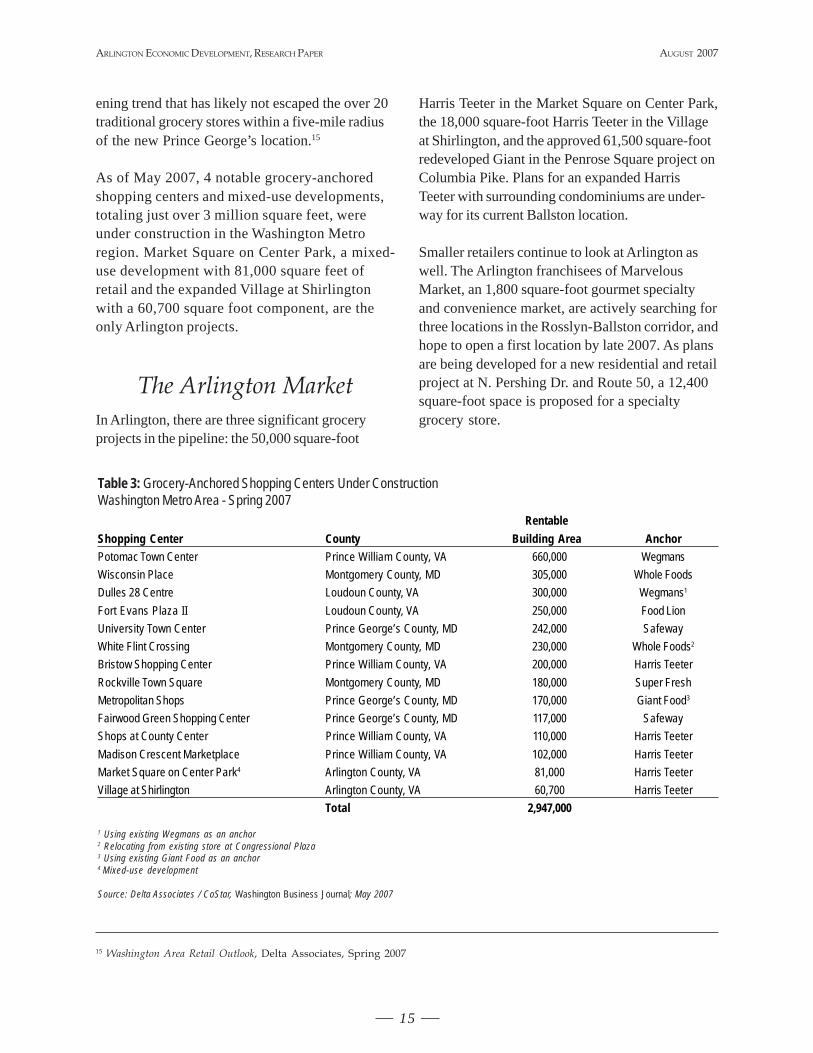
As of May 2007, 4 notable grocery-anchoredshopping centers and mixed-use developments,totaling just over 3 million square feet, wereunder construction in the Washington Metroregion. Market Square on Center Park, a mixed-use development with 81,000 square feet ofretail and the expanded Village at Shirlingtonwith a 60,700 square foot component, are theonly Arlington projects.
The Arlington MarketIn Arlington, there are three significant groceryprojects in the pipeline: the 50,000 square-foot
Harris Teeter in the Market Square on Center Park,the 18,000 square-foot Harris Teeter in the Villageat Shirlington, and the approved 61,500 square-footredeveloped Giant in the Penrose Square project onColumbia Pike. Plans for an expanded HarrisTeeter with surrounding condominiums are under-way for its current Ballston location.
Smaller retailers continue to look at Arlington aswell. The Arlington franchisees of MarvelousMarket, an 1,800 square-foot gourmet specialtyand convenience market, are actively searching forthree locations in the Rosslyn-Ballston corridor, andhope to open a first location by late 2007. As plansare being developed for a new residential and retailproject at N. Pershing Dr. and Route 50, a 12,400square-foot space is proposed for a specialtygrocery store.
15 Washington Area Retail Outlook, Delta Associates, Spring 2007
Table 3: Grocery-Anchored Shopping Centers Under ConstructionWashington Metro Area - Spring 2007
1 Using existing Wegmans as an anchor2 Relocating from existing store at Congressional Plaza3 Using existing Giant Food as an anchor4 Mixed-use development
Source: Delta Associates / CoStar, Washington Business Journal; May 2007
RentableShopping Center County Building Area AnchorPotomac Town Center Prince William County, VA 660,000 WegmansWisconsin Place Montgomery County, MD 305,000 Whole FoodsDulles 28 Centre Loudoun County, VA 300,000 Wegmans1
Fort Evans Plaza II Loudoun County, VA 250,000 Food LionUniversity Town Center Prince George’s County, MD 242,000 SafewayWhite Flint Crossing Montgomery County, MD 230,000 Whole Foods2
Bristow Shopping Center Prince William County, VA 200,000 Harris TeeterRockville Town Square Montgomery County, MD 180,000 Super FreshMetropolitan Shops Prince George’s County, MD 170,000 Giant Food3
Fairwood Green Shopping Center Prince George’s County, MD 117,000 SafewayShops at County Center Prince William County, VA 110,000 Harris TeeterMadison Crescent Marketplace Prince William County, VA 102,000 Harris TeeterMarket Square on Center Park4 Arlington County, VA 81,000 Harris TeeterVillage at Shirlington Arlington County, VA 60,700 Harris Teeter
Total 2,947,000
ARLINGTON ECONOMIC DEVELOPMENT, RESEARCH PAPER
16
AUGUST 2007
Arlington Grocery CategoriesArlington County has a varied mix of grocery storetypes/formats. Although the Food MarketingInstitute definitions helped initially guide theclassification of the store inventory, AED found theneed to modify certain definitions to better reflectthe sizes and types of stores in Arlington. Inparticular, staff created the following categories,defined below: “Commissary”, “Community”,“Neighborhood”, “Specialty/Ethnic”, and “Tran-sient/Temporary”. Industry-level definitions servedwell to characterize Arlington’s conveniencestores, gas station-affiliated convenience stores,and wholesale clubs.
Commissary refers to retail stores on militarybases that offer food and merchandise at reducedprices exclusively to military personnel, retirees,and their families. Commissaries offer a fullgrocery line; most include deli departments,bakeries, fresh seafood counters, and many otherservices and amenities common to conventionalsupermarkets. Commissary patrons purchase itemsat cost plus a five percent surcharge, which coversthe costs of building new commissaries andmodernizing existing ones. The Association of theUnited States Army estimates that commissariesoffer savings of 30 percent or more over commer-cial grocery stores.
Community grocery stores are approximately40,000 square feet or larger and serve a trade areaof approximately 3-6 miles (in Arlington, theaverage community store is 45,471 square feet).They offer a greater selection of products, betterservice, and more amenities. They are often newerstores, and may have a cleaner, brighter appear-ance as well as just provide a more pleasantshopping experience. Community grocery stores inArlington are destinations – shoppers will travelfurther and allot time for dedicated trips (versusmultiple convenience trips to pick up one or twoitems). Shoppers are likely to spend a significantamount of their food at home budget at communitystores. Given the quality of the product line and the
investment into store appearance, prices may besomewhat elevated and attract a more affluentcustomer base.
Neighborhood grocery stores generally offer asimilar product line as community stores, but areless than 40,000 square feet and serve a smallertrade area of approximately 1-3 miles (in Arlington,the average neighborhood store is 17,611 squarefeet). Neighborhood grocery stores, particularlyolder locations, may lack the extended services andamenities that most larger and newer communitystores provide (e.g. pharmacies, bakeries, etc.). Insome cases, this may lead to lower prices andattract more lower-income households.
Neighborhood stores are not a destination –shoppers may patronize them if they need severalquick items for a recipe or forgot something at thecommunity store and do not want to make a returntrip. In some ways, they could be described asmore convenience-oriented without actually beinga convenience store (substantially differentiated bythe size of stores as well as the product line).
Specialty/Ethnic stores are primarily engaged inretailing specialized lines of food, including naturaland health food stores, wine shops, bakeries, etc.They also may carry ethnic products catering tospecific demographic groups. They range fromapproximately 1,500-4,000 square feet (in Arling-ton, the average specialty/ethnic market is 2,257square feet), although there are also a growingnumber of larger-format (10,000-20,000 squarefeet) specialty chains e.g. Trader Joe’s andBalducci’s. Specialty/ethnic markets comprisemuch of what contributes to placemaking inArlington from a food retailing perspective. Incontrast to community or neighborhood stores,price (at least anecdotally) does not seem to carryas much importance for specialty/ethnic shop-pers; more so, what matters is the experience ofgoing to the store, forming a relationship withthe owners and employees, getting personalattention and service, and having a qualityselection of desired products.
ARLINGTON ECONOMIC DEVELOPMENT, RESEARCH PAPER AUGUST 2007
17
Transient/Temporary refers toproducer-only farmers’ markets,meaning that only farmers who sellproducts they grow or produce mayparticipate. There are four farmersmarkets occurring seasonally inArlington, and one (the ArlingtonFarmers’ Market near the CourtHouse Metro station) which operatesyear-round.
Like specialty/ethnic markets, farmers’markets also contribute significantly toplacemaking in Arlington. Not only arethey locally run and operated, for themost part by the various partnerships(e.g. Clarendon Alliance, RosslynRenaissance, etc.), but they connect local buyerswith local farmers. Arlington residents frequentthem not because of a lack of alternatives, butbecause farmers’ markets provide an element ofcommunity that traditional supermarkets do not.
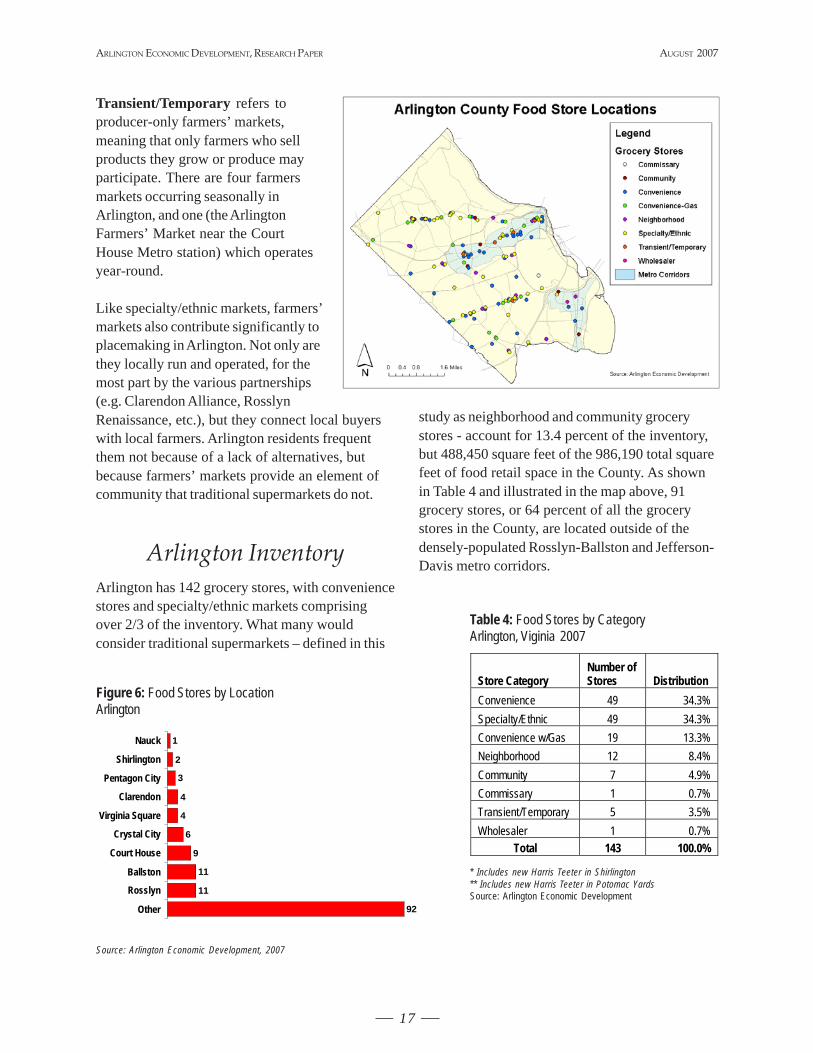
Arlington InventoryArlington has 142 grocery stores, with conveniencestores and specialty/ethnic markets comprisingover 2/3 of the inventory. What many wouldconsider traditional supermarkets – defined in this
study as neighborhood and community grocerystores - account for 13.4 percent of the inventory,but 488,450 square feet of the 986,190 total squarefeet of food retail space in the County. As shownin Table 4 and illustrated in the map above, 91grocery stores, or 64 percent of all the grocerystores in the County, are located outside of thedensely-populated Rosslyn-Ballston and Jefferson-Davis metro corridors.
Table 4: Food Stores by CategoryArlington, Viginia 2007
* Includes new Harris Teeter in Shirlington** Includes new Harris Teeter in Potomac YardsSource: Arlington Economic Development
Store Category Number of Stores Distribution
Convenience 49 34.3% Specialty/Ethnic 49 34.3% Convenience w/Gas 19 13.3% Neighborhood 12 8.4% Community 7 4.9% Commissary 1 0.7% Transient/Temporary 5 3.5% Wholesaler 1 0.7%
Total 143 100.0%
Figure 6: Food Stores by LocationArlington
Source: Arlington Economic Development, 2007
1
2
3
4
4
6
9
11
11
92
Nauck
Shirlington
Pentagon City
Clarendon
Virginia Square
Crystal City
Court House
Ballston
Rosslyn
Other
ARLINGTON ECONOMIC DEVELOPMENT, RESEARCH PAPER
18
AUGUST 2007
DemographicsIn January 2007, Arlington had an estimatedpopulation of 202,800 persons, reflecting a sevenpercent increase since 2000. More than one-thirdof the population is between age20-34, and the County has anaverage household size of 2.15(42.3 percent are one-personhouseholds). It is among the mostdensely populated jurisdictions inthe country with a populationdensity of about 7,761 personsper square mile – in 2000,Arlington was the 13th mostdensely-population jurisdiction inthe United States.16
Arlington’s average median house-hold income is $84,800, well above the averageU.S. household income of $46,242. Sixty-onepercent of the population is employed in profes-sional and managerial occupations, with sales andoffice occupations taking a distant second place at18 percent. Some 66 percent of adults age 25 orover have a bachelor’s degree or higher (versus 24percent nationally), and 30 percent have a graduateor professional degree.
About 35 percent of Arlington residents areHispanic/Latino, African-American, Asian, ormulti-racial, and over a quarter of the populationwas born outside of the United States, compared to12.4 percent nationally.
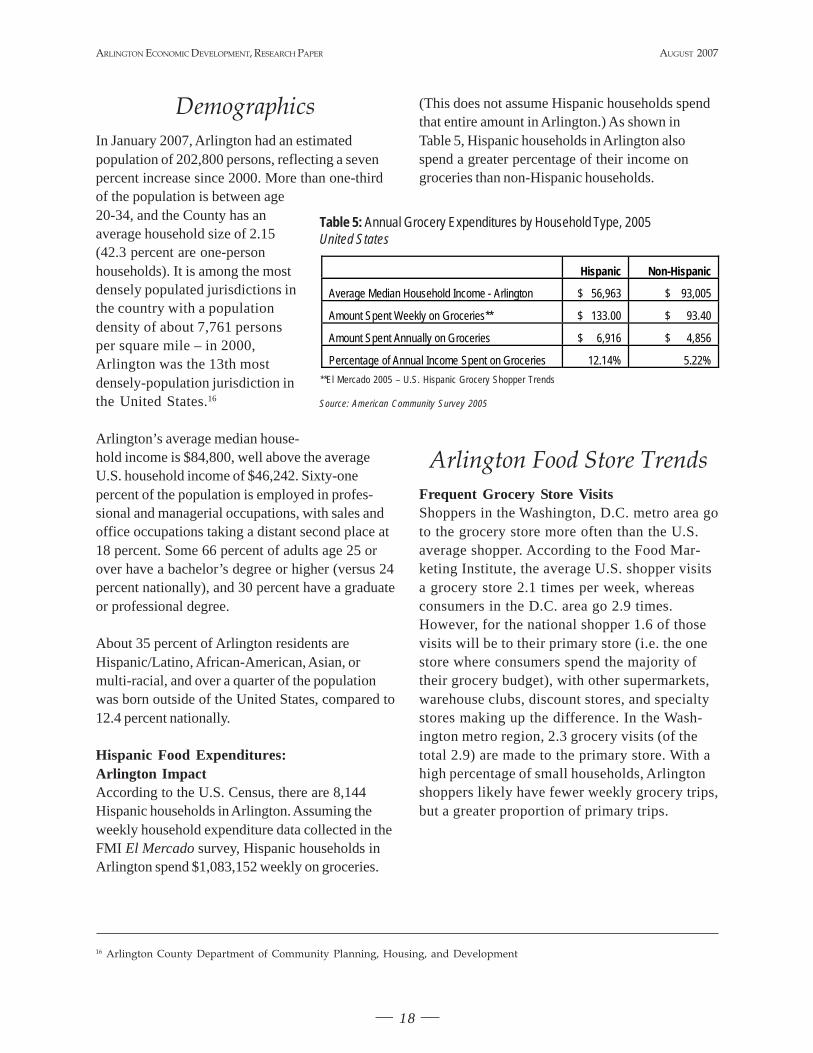
Hispanic Food Expenditures:Arlington ImpactAccording to the U.S. Census, there are 8,144Hispanic households in Arlington. Assuming theweekly household expenditure data collected in theFMI El Mercado survey, Hispanic households inArlington spend $1,083,152 weekly on groceries.
(This does not assume Hispanic households spendthat entire amount in Arlington.) As shown inTable 5, Hispanic households in Arlington alsospend a greater percentage of their income ongroceries than non-Hispanic households.
Arlington Food Store TrendsFrequent Grocery Store VisitsShoppers in the Washington, D.C. metro area goto the grocery store more often than the U.S.average shopper. According to the Food Mar-keting Institute, the average U.S. shopper visitsa grocery store 2.1 times per week, whereasconsumers in the D.C. area go 2.9 times.However, for the national shopper 1.6 of thosevisits will be to their primary store (i.e. the onestore where consumers spend the majority oftheir grocery budget), with other supermarkets,warehouse clubs, discount stores, and specialtystores making up the difference. In the Wash-ington metro region, 2.3 grocery visits (of thetotal 2.9) are made to the primary store. With ahigh percentage of small households, Arlingtonshoppers likely have fewer weekly grocery trips,but a greater proportion of primary trips.
Table 5: Annual Grocery Expenditures by Household Type, 2005United States
**El Mercado 2005 – U.S. Hispanic Grocery Shopper Trends
Source: American Community Survey 2005
Hispanic Non-Hispanic
Average Median Household Income - Arlington $ 56,963 $ 93,005
Amount Spent Weekly on Groceries** $ 133.00 $ 93.40
Amount Spent Annually on Groceries $ 6,916 $ 4,856
Percentage of Annual Income Spent on Groceries 12.14% 5.22%
16 Arlington County Department of Community Planning, Housing, and Development
ARLINGTON ECONOMIC DEVELOPMENT, RESEARCH PAPER AUGUST 2007
19
Take-out & Delivery PopularArlington households eat ready-made meals athome considerably more often than their nationalcounterparts. Forty-three percent of FMI surveyrespondents reported choosing take-out or deliveryfoods 1-2 times per week, while nationally only 18percent reported similar habits. In Arlington, thisdifference could be contributed to a number offactors including:
• High household incomes: The Arlingtonmedian household is $84,800. Consumers withgreater disposable income have less of a need tobuy raw ingredients and spend time cooking athome versus buying more expensiveready-to-eat meals at their convenience.
• Small household size: The averageArlington household size is 2.15 people,but 42 percent are single-person house-holds. The costs of buying groceries tocook at home and buying ready-mademeals may be comparable, and the timeto simply “pick something up” may palein comparison to the time and effortinvolved with buying groceries andcooking at home.
• Workaholics and time-pressedshoppers: The convenience of pre-made foods may appeal to those withlimited time to shop. People who worklong hours or spend little time at homemay fear perishables going to waste intheir absence.
• Younger population: Over one-thirdof Arlington’s population is betweenage 18-34. Some younger residentsmay not know how to cook, may beadverse to it, or, lacking substantialfinancial commitments (e.g. mortgage,childcare), may be able to allocate ahigher percentage of disposableincome towards pre-made food.
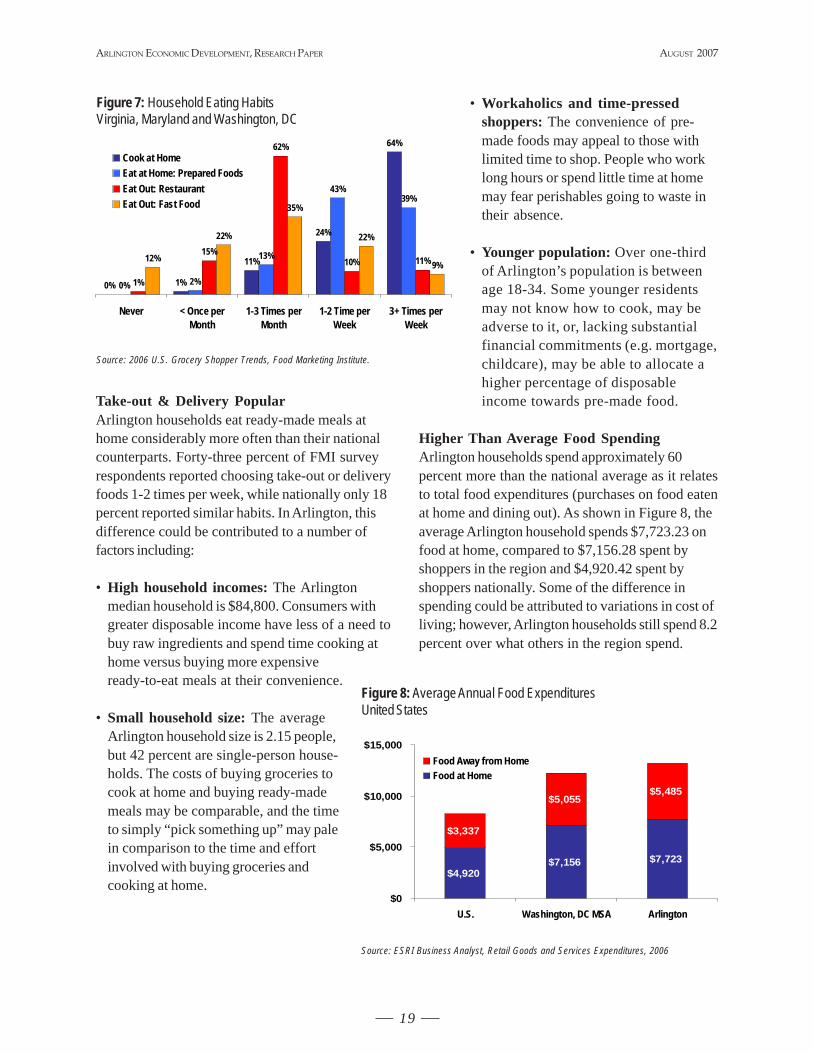
Higher Than Average Food SpendingArlington households spend approximately 60percent more than the national average as it relatesto total food expenditures (purchases on food eatenat home and dining out). As shown in Figure 8, theaverage Arlington household spends $7,723.23 onfood at home, compared to $7,156.28 spent byshoppers in the region and $4,920.42 spent byshoppers nationally. Some of the difference inspending could be attributed to variations in cost ofliving; however, Arlington households still spend 8.2percent over what others in the region spend.
Figure 7: Household Eating HabitsVirginia, Maryland and Washington, DC
Source: 2006 U.S. Grocery Shopper Trends, Food Marketing Institute.
0% 1%
11%
24%
64%
0% 2%
13%
39%
1%
15%
62%
10% 11%12%
22% 22%
9%
43%
35%
Never < Once perMonth
1-3 Times perMonth
1-2 Time perWeek
3+ Times perWeek
Cook at HomeEat at Home: Prepared FoodsEat Out: RestaurantEat Out: Fast Food
Figure 8: Average Annual Food ExpendituresUnited States
Source: ESRI Business Analyst, Retail Goods and Services Expenditures, 2006
$4,920$7,156 $7,723
$3,337
$5,055$5,485
$0
$5,000
$10,000
$15,000
U.S. Washington, DC MSA Arlington
Food Away from HomeFood at Home
ARLINGTON ECONOMIC DEVELOPMENT, RESEARCH PAPER
20
AUGUST 2007
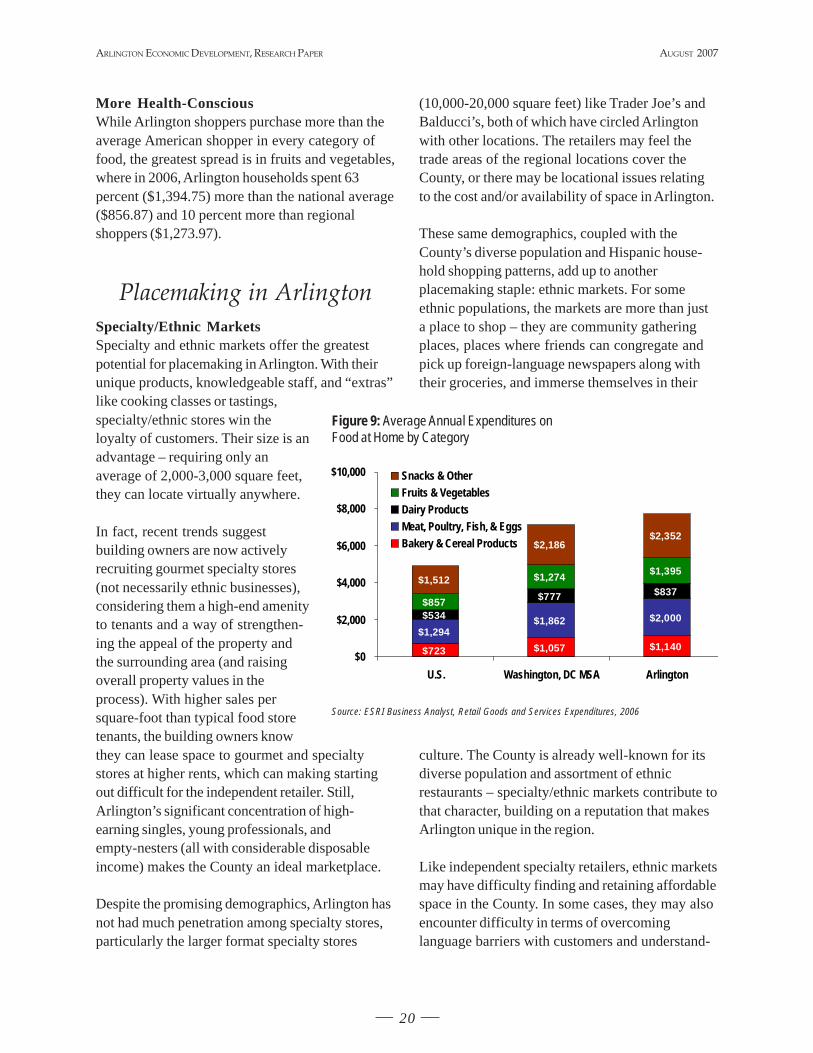
More Health-ConsciousWhile Arlington shoppers purchase more than theaverage American shopper in every category offood, the greatest spread is in fruits and vegetables,where in 2006, Arlington households spent 63percent ($1,394.75) more than the national average($856.87) and 10 percent more than regionalshoppers ($1,273.97).
Placemaking in ArlingtonSpecialty/Ethnic MarketsSpecialty and ethnic markets offer the greatestpotential for placemaking in Arlington. With theirunique products, knowledgeable staff, and “extras”like cooking classes or tastings,specialty/ethnic stores win theloyalty of customers. Their size is anadvantage – requiring only anaverage of 2,000-3,000 square feet,they can locate virtually anywhere.
In fact, recent trends suggestbuilding owners are now activelyrecruiting gourmet specialty stores(not necessarily ethnic businesses),considering them a high-end amenityto tenants and a way of strengthen-ing the appeal of the property andthe surrounding area (and raisingoverall property values in theprocess). With higher sales persquare-foot than typical food storetenants, the building owners knowthey can lease space to gourmet and specialtystores at higher rents, which can making startingout difficult for the independent retailer. Still,Arlington’s significant concentration of high-earning singles, young professionals, andempty-nesters (all with considerable disposableincome) makes the County an ideal marketplace.
Despite the promising demographics, Arlington hasnot had much penetration among specialty stores,particularly the larger format specialty stores
(10,000-20,000 square feet) like Trader Joe’s andBalducci’s, both of which have circled Arlingtonwith other locations. The retailers may feel thetrade areas of the regional locations cover theCounty, or there may be locational issues relatingto the cost and/or availability of space in Arlington.
These same demographics, coupled with theCounty’s diverse population and Hispanic house-hold shopping patterns, add up to anotherplacemaking staple: ethnic markets. For someethnic populations, the markets are more than justa place to shop – they are community gatheringplaces, places where friends can congregate andpick up foreign-language newspapers along withtheir groceries, and immerse themselves in their
culture. The County is already well-known for itsdiverse population and assortment of ethnicrestaurants – specialty/ethnic markets contribute tothat character, building on a reputation that makesArlington unique in the region.
Like independent specialty retailers, ethnic marketsmay have difficulty finding and retaining affordablespace in the County. In some cases, they may alsoencounter difficulty in terms of overcominglanguage barriers with customers and understand-
Figure 9: Average Annual Expenditures onFood at Home by Category
Source: ESRI Business Analyst, Retail Goods and Services Expenditures, 2006
$723 $1,057 $1,140$1,294
$1,862 $2,000$534
$777 $837$857
$1,274 $1,395
$2,352$2,186
$1,512
$0
$2,000
$4,000
$6,000
$8,000
$10,000
U.S. Washington, DC MSA Arlington
Snacks & Other Fruits & VegetablesDairy ProductsMeat, Poultry, Fish, & EggsBakery & Cereal Products
ARLINGTON ECONOMIC DEVELOPMENT, RESEARCH PAPER AUGUST 2007
21
ing the County’s regulatory process. Furthermore,ethnic markets in Arlington face a unique chal-lenge: Arlington’s explosive development over thepast several years brought in new residents withhigh household incomes – in theory, a retailer’sdream. However, the new development has alsodecreased affordability in the County and putpressure on lower-income immigrant and minorityhouseholds, many of which shop at ethnic markets.It is yet to be determined howthis trend of decreasingaffordability will affect ethnicmarkets in Arlington.
CommissariesBetween Fort Myer, thePentagon, various Departmentof Defense agencies andrelated contractors, there aremany active and retired militarypersonnel who live and work inArlington. Although the generalpublic is not permitted to shopat Fort Myer’s commissary, thecommissary does contribute toplacemaking in Arlington byproviding first-rate service andquality amenities to a tight-knit,exclusive community. In a 2006Defense Commissary Agencysurvey, customers rated commissaries at anaverage 4.61 (out of 5) on savings and prices;store hours, decor and appearance; product quality,selection and availability; checkout procedures; andemployee customer service – which garnered thehighest score at 4.77.17
Fort Myer’s commissary caters to the needs of itscustomers; like many grocery stores, it offers a“Grab N’ Go” section for quick ready-made meals,but also has a “Grab N’ Go” 15-minute parkingsection to make those in-and-out trips even easier.Disabled shoppers are allowed to begin shopping
30 minutes before the store opens, and uniformedmilitary have priority at checkout during certainposted hours. With its focus on the military com-munity and its highly-competitive pricing, thecommissary at Fort Myer is likely an oft-over-looked, but important player in Arlington’s foodretailing industry. While the County is experiencingleakage to other jurisdictions, it may also beexperiencing leakage to the commissary as military
personnel and their familiestake advantage of this conve-nient and exclusive amenity.
Convenience StoresSome store types, such asconvenience stores, also varyin the way in which theycontribute to placemaking.Convenience stores as a storetype have their proper place inthe food retailing industry andin Arlington County – theyprovide quick and easy accessto a wide variety of fooditems. Customers do not needto spend time preparingshopping lists, consulting withthe store owner, or navigatingthe aisles with a shoppingcart. They can be in-and-out
in a matter of minutes, an important quality in afast-paced urban area.
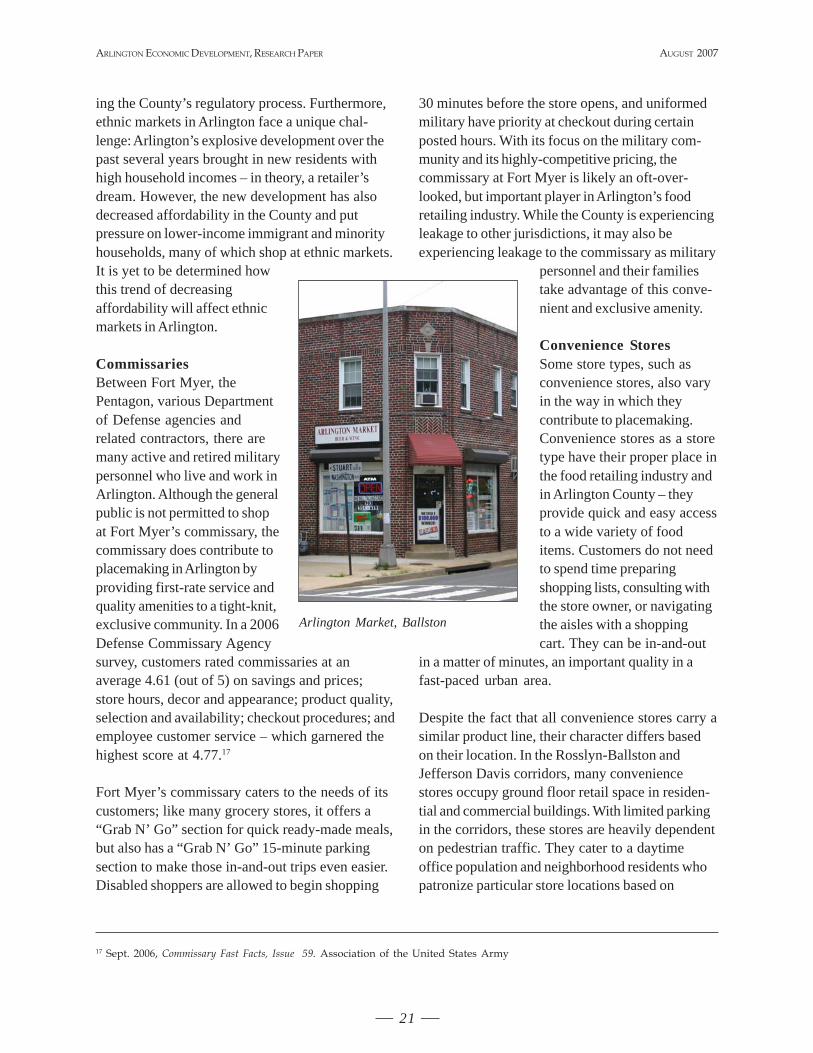
Despite the fact that all convenience stores carry asimilar product line, their character differs basedon their location. In the Rosslyn-Ballston andJefferson Davis corridors, many conveniencestores occupy ground floor retail space in residen-tial and commercial buildings. With limited parkingin the corridors, these stores are heavily dependenton pedestrian traffic. They cater to a daytimeoffice population and neighborhood residents whopatronize particular store locations based on
Arlington Market, Ballston
17 Sept. 2006, Commissary Fast Facts, Issue 59. Association of the United States Army
ARLINGTON ECONOMIC DEVELOPMENT, RESEARCH PAPER
22
AUGUST 2007
proximity. Given that these types of stores aregenerally surrounded by other retail tenants, theyalso may reap ancillary business from their neigh-bors e.g.. one may decide to buy a gallon of milkafter picking up dry cleaning, simply because it isconvenient to do so.
In contrast, outside of the major commercialcorridors, many convenience stores lease space instrip centers or occupy their own properties (7-Eleven is a notable example of the latter).In this scenario, the stores generallyposition themselves along busy roadwaysthat cater to drivers rather than pedestri-ans. Unlike the commercial corridorlocations which serve a small trade area,these stores hope to capture anyone drivingby in need of a quick item. For the driverwho could choose to stop at any number ofconvenience stores on a given route, theseconvenience stores aim to have the easiestin-and-out access and the most availableparking. While the strip center locationsmay reap some ancillary business fromneighboring retailers, the ones that occupytheir own properties are purely focused onconvenience shoppers.
There is a need for convenience store locations inboth ground floor retail of the major commercialcorridors and in the surrounding areas of theCounty. Given that the non-commercial corridorstores are more easily-accessible to a greatervolume of customers, it is possible they achievehigher sales figures which contribute more taxrevenue to County coffers. There is also nodiscounting the importance of capturing driver-oriented sales in Arlington that could otherwiseresult in leakage to surrounding jurisdictions.
Ground floor retail convenience stores contributemore towards the County’s goal of placemaking,providing amenities where people live and work aswell as eliminating the need to have to drive to pickup a few convenience items. However, this doesnot imply that Arlington would be a stronger
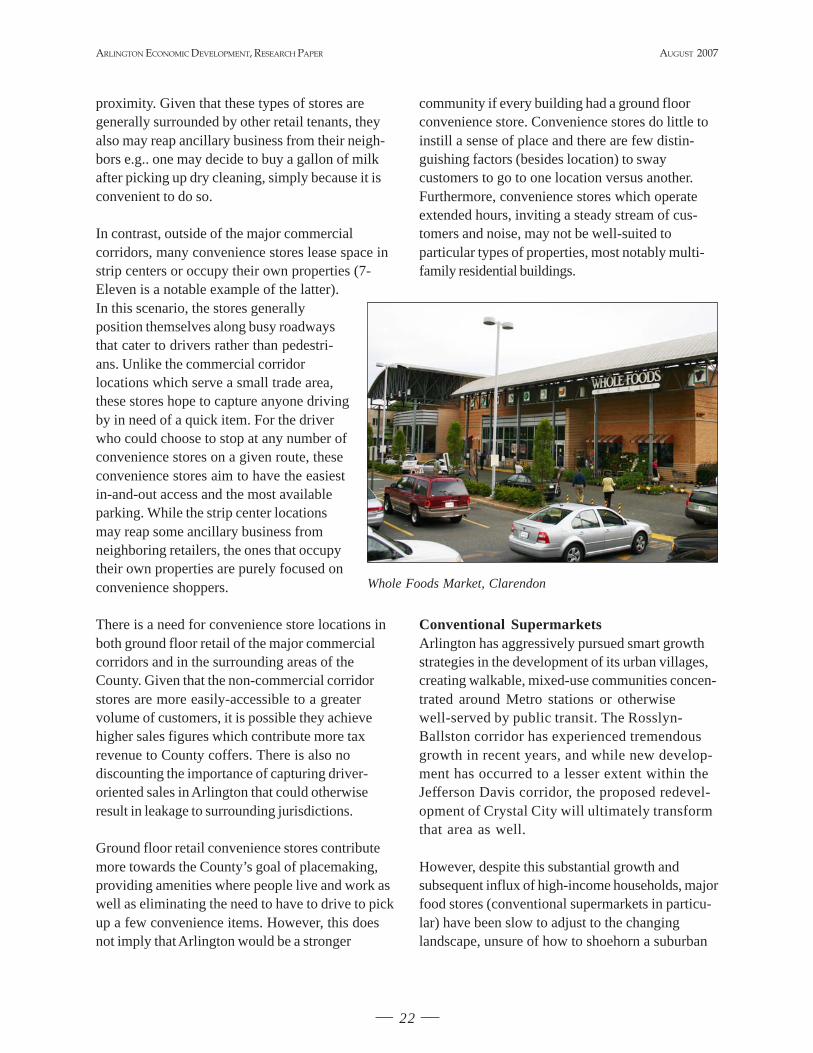
community if every building had a ground floorconvenience store. Convenience stores do little toinstill a sense of place and there are few distin-guishing factors (besides location) to swaycustomers to go to one location versus another.Furthermore, convenience stores which operateextended hours, inviting a steady stream of cus-tomers and noise, may not be well-suited toparticular types of properties, most notably multi-family residential buildings.
Conventional SupermarketsArlington has aggressively pursued smart growthstrategies in the development of its urban villages,creating walkable, mixed-use communities concen-trated around Metro stations or otherwisewell-served by public transit. The Rosslyn-Ballston corridor has experienced tremendousgrowth in recent years, and while new develop-ment has occurred to a lesser extent within theJefferson Davis corridor, the proposed redevel-opment of Crystal City will ultimately transformthat area as well.
However, despite this substantial growth andsubsequent influx of high-income households, majorfood stores (conventional supermarkets in particu-lar) have been slow to adjust to the changinglandscape, unsure of how to shoehorn a suburban
Whole Foods Market, Clarendon
ARLINGTON ECONOMIC DEVELOPMENT, RESEARCH PAPER AUGUST 2007
23
model into a densely-populated urban environment.There has been some movement – in Arlington,Harris Teeter has taken the lead, with mezzanine-level shopping in both its Ballston and (although notin a major corridor) Lee-Harrison locations and thedevelopment of an 18,000 square-foot store in theVillage at Shirlington. Giant will see its 20,000square-foot Columbia Pike store leapfrog into anew 61,500 square-foot store as part of a mixed-used development served primarily by undergroundparking. Still, the challenges of urban developmentand mixed-use development – the lack of availablelarge land parcels, the costs of land and construc-tion, community opposition, and the difficultiesinherent in development partnerships – deter majorfood retailers from taking on what could beconsidered risky and troublesome projects.
These same challenges, particularly the lack oflarge developable sites and community opposition,also make it unlikely that Arlingtonwill ever be able to accommodate asprawling supercenter such as Wal-Mart or a Wegmans, whose store sizeranges from 80,000 to 130,000 squarefeet. Wal-Mart’s smaller formatNeighborhood Market stores couldpossibly have a place in Arlington, butgiven Wal-Mart’s strategy of locatingNeighborhood Market stores in thesame market area as Supercenters,that may also be unlikely. At present,there are no Wal-Mart NeighborhoodMarket locations in the Washington,D.C. metro area. As shopping atsupercenters and large-format storeslike Wegmans grows in popularity,Arlington will likely experience continued leakageto other jurisdictions, notably Fairfax County.
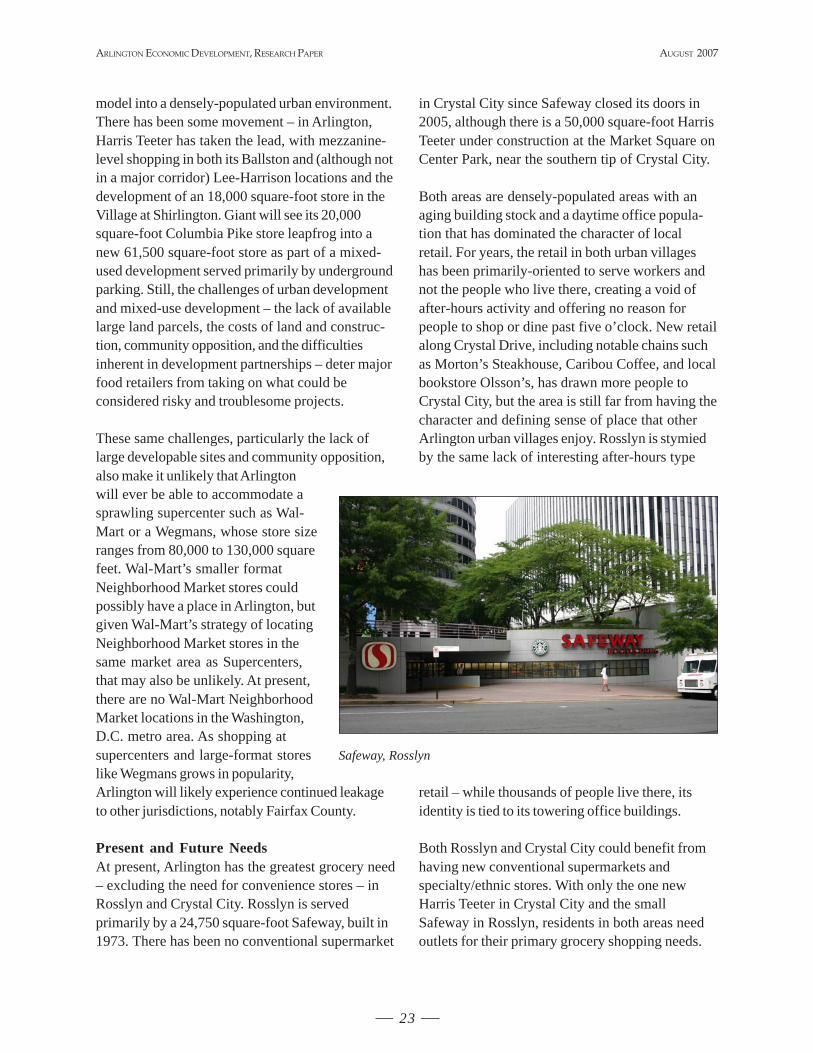
Present and Future NeedsAt present, Arlington has the greatest grocery need– excluding the need for convenience stores – inRosslyn and Crystal City. Rosslyn is servedprimarily by a 24,750 square-foot Safeway, built in1973. There has been no conventional supermarket
in Crystal City since Safeway closed its doors in2005, although there is a 50,000 square-foot HarrisTeeter under construction at the Market Square onCenter Park, near the southern tip of Crystal City.
Both areas are densely-populated areas with anaging building stock and a daytime office popula-tion that has dominated the character of localretail. For years, the retail in both urban villageshas been primarily-oriented to serve workers andnot the people who live there, creating a void ofafter-hours activity and offering no reason forpeople to shop or dine past five o’clock. New retailalong Crystal Drive, including notable chains suchas Morton’s Steakhouse, Caribou Coffee, and localbookstore Olsson’s, has drawn more people toCrystal City, but the area is still far from having thecharacter and defining sense of place that otherArlington urban villages enjoy. Rosslyn is stymiedby the same lack of interesting after-hours type
retail – while thousands of people live there, itsidentity is tied to its towering office buildings.
Both Rosslyn and Crystal City could benefit fromhaving new conventional supermarkets andspecialty/ethnic stores. With only the one newHarris Teeter in Crystal City and the smallSafeway in Rosslyn, residents in both areas needoutlets for their primary grocery shopping needs.
Safeway, Rosslyn
ARLINGTON ECONOMIC DEVELOPMENT, RESEARCH PAPER
24
AUGUST 2007
However, given that the placemaking potential ofboth areas is also stymied by a lack of interestingretail, they would be well-served by specialty/ethnic stores. Not only would the specialty/ethnicstores add something unique about the area andcreate chatter about the new retail, but it couldlikely attract similar-minded businesses, graduallyenhancing the surrounding neighborhood andmaking it a destination people would want to visitand linger at rather than an area to simply pass byon the way to work.
Economic AnalysisSupportable RetailAs of September 2006, Arlington had986,19018 square feet of food store space.Multiplied by $352.50 (median food sales/sf19), Arlington’s total food expenditures were$347,631,975. With an estimated food demandof $610,767,24820, AED estimates that Arling-ton could support an additional 746,483 squarefeet of food retail for a total of 1,732,673square feet of grocery store space.
On a scale of -100 to 100, where -100 repre-sents a total surplus or oversupply and 100represents total leakage or unmet demand,Arlington scores a 20.9 in the food and beveragestore industry.21 Where are those sales going?For food retailers, trade areas are not defined byjurisdictional boundaries. Given Arlington’s smallsize, it is easy for residents who live near theborder of Fairfax County or the City of Alexandria,or those who have easy access to major roadwayssuch as I-66 and Route 50, to shop elsewhere.Stores right over the Arlington County line may beon a shopper’s way home from work, have easier
parking, or carry a better selection of products thanan equidistant Arlington location.
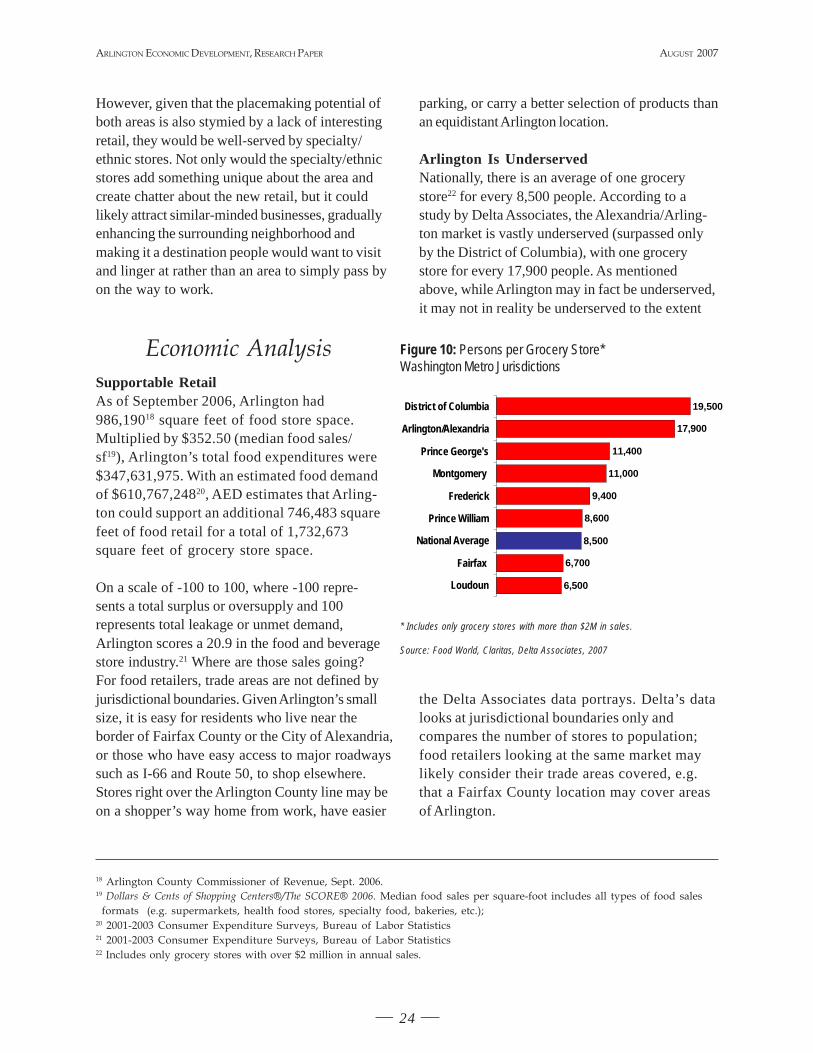
Arlington Is UnderservedNationally, there is an average of one grocerystore22 for every 8,500 people. According to astudy by Delta Associates, the Alexandria/Arling-ton market is vastly underserved (surpassed onlyby the District of Columbia), with one grocerystore for every 17,900 people. As mentionedabove, while Arlington may in fact be underserved,it may not in reality be underserved to the extent
the Delta Associates data portrays. Delta’s datalooks at jurisdictional boundaries only andcompares the number of stores to population;food retailers looking at the same market maylikely consider their trade areas covered, e.g.that a Fairfax County location may cover areasof Arlington.
Figure 10: Persons per Grocery Store*Washington Metro Jurisdictions
* Includes only grocery stores with more than $2M in sales.
Source: Food World, Claritas, Delta Associates, 2007
19,500
17,900
11,400
11,000
9,400
8,600
8,500
6,700
6,500
District of Columbia
Arlington/Alexandria
Prince George's
Montgomery
Frederick
Prince William
National Average
Fairfax
Loudoun
18 Arlington County Commissioner of Revenue, Sept. 2006.19 Dollars & Cents of Shopping Centers®/The SCORE® 2006. Median food sales per square-foot includes all types of food sales
formats (e.g. supermarkets, health food stores, specialty food, bakeries, etc.);20 2001-2003 Consumer Expenditure Surveys, Bureau of Labor Statistics21 2001-2003 Consumer Expenditure Surveys, Bureau of Labor Statistics22 Includes only grocery stores with over $2 million in annual sales.
ARLINGTON ECONOMIC DEVELOPMENT, RESEARCH PAPER AUGUST 2007
25
ConclusionsGiven Arlington’s demographics and householdspending habits, it would seem the County wouldnot lack for food retailers. However, it can bechallenging to attract and retain the right num-ber and types of stores which accomplish boththe County’s economic and placemaking goals.Small specialty/ethnic stores provide uniquenessand diversity in an industry dominated byimpersonal supermarkets and supercenters, butthey face challenges in finding suitable andaffordable space. Convenience stores have astrong place in the market, but vary in terms ofhow they contribute to placemaking. Larger-format conventional supermarkets struggle withdevelopment limitations, all the while trying tohold onto market share as the low prices ofsupercenters/discount stores and the specializedproduct lines of gourmet specialty and ethnicmarkets lure away customers. Supercenters arede-facto excluded from entering urban marketsdue to a lack of large developable parcels andinherent community opposition.
Certain areas of the County, notably Rosslynand Crystal City, are underserved both byconventional supermarkets and specialty/ethnicstores, which are desperately needed as part ofan effort to introduce more interesting retail intothe community and foster a sense of place inwhat are predominately office-oriented neigh-borhoods. Arlington has not had muchpenetration among smaller specialty stores like
Balducci’s and Dean and DeLuca given thatthese retailers tend to want to locate in alreadyestablished and thriving retail markets, but theremay be opportunities for local businesses orindependents in other locations. Given the spacerequirements, Arlington is unlikely to accommo-date a supercenter or a large-formatWegmans-type store.
Arlington has added grocery stores in all itsurban villages, but it still must recruit certainstore types and formats if the County hopes tocapture leaking sales and create and sustainattractive and livable communities. There is aneed for conventional supermarkets – particularlyurban models that can be successful in mixed-use projects and multi-storey formats. HarrisTeeter and Giant have begun introducing newtypes and formats in Arlington, but there still maybe unexplored and improved means of facilitatinggrocery stores in new development and redevel-opment. Convenience stores are well-representedin Arlington; given their ability to fare success-fully in a variety of market conditions (e.g.leasing space in ground floor retail versus occu-pying their own properties along majorroadways), it does not seem the County needs tomake special effort to attract and retain thesetypes of food stores. On the other hand, ifplacemaking is to be a priority, the County willneed to consider creative ways of attracting andretaining specialty/ethnic stores – both the larger10,000-20,000 square-foot Trader Joe’s-typeformats and smaller independent retailers.
This study was prepared by Jennie Geisner, Retail Development Specialist, of ArlingtonEconomic Development.
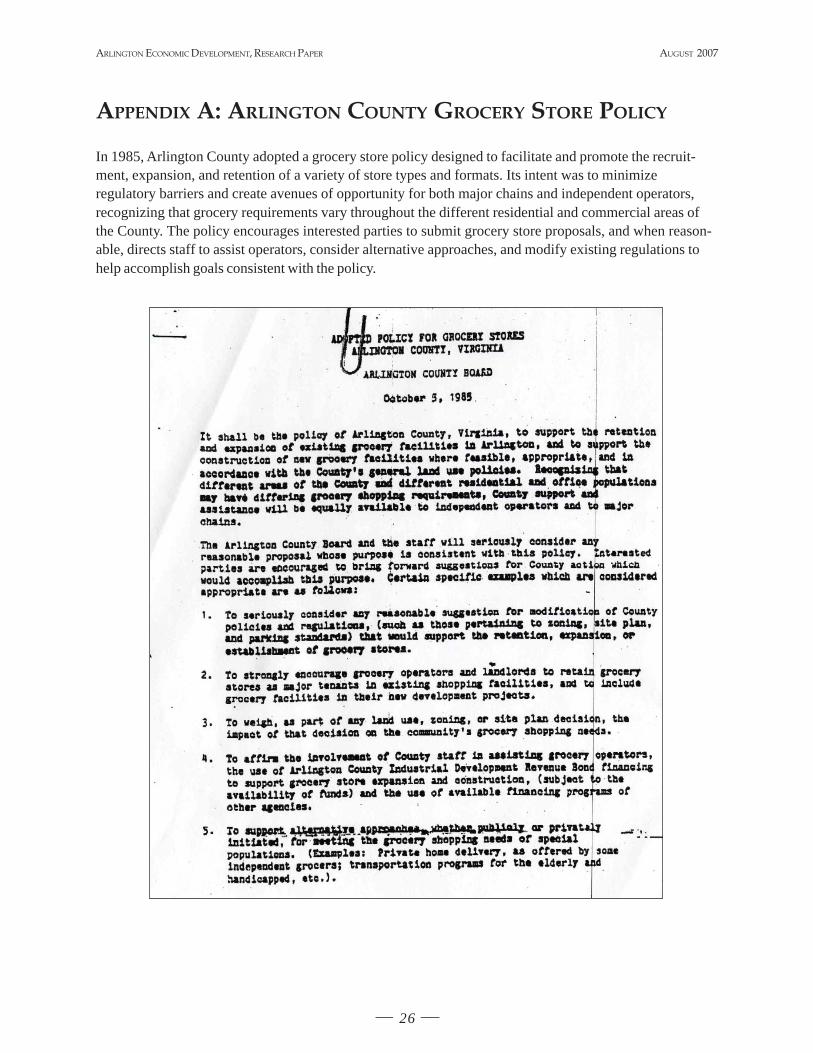
ARLINGTON ECONOMIC DEVELOPMENT, RESEARCH PAPER
26
AUGUST 2007
APPENDIX A: ARLINGTON COUNTY GROCERY STORE POLICY
In 1985, Arlington County adopted a grocery store policy designed to facilitate and promote the recruit-ment, expansion, and retention of a variety of store types and formats. Its intent was to minimizeregulatory barriers and create avenues of opportunity for both major chains and independent operators,recognizing that grocery requirements vary throughout the different residential and commercial areas ofthe County. The policy encourages interested parties to submit grocery store proposals, and when reason-able, directs staff to assist operators, consider alternative approaches, and modify existing regulations tohelp accomplish goals consistent with the policy.
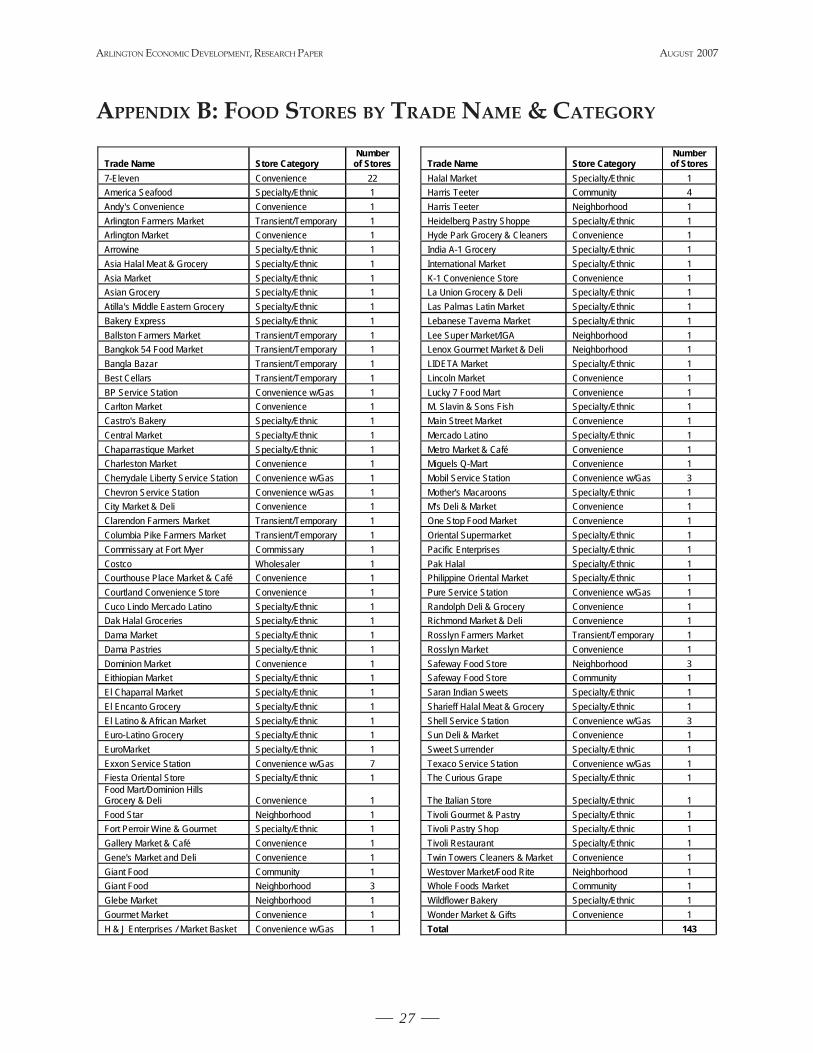
ARLINGTON ECONOMIC DEVELOPMENT, RESEARCH PAPER AUGUST 2007
27
Trade Name Store Category Number
of Stores
Trade Name Store Category Number of Stores
7-Eleven Convenience 22 Halal Market Specialty/Ethnic 1 America Seafood Specialty/Ethnic 1 Harris Teeter Community 4 Andy's Convenience Convenience 1 Harris Teeter Neighborhood 1 Arlington Farmers Market Transient/Temporary 1 Heidelberg Pastry Shoppe Specialty/Ethnic 1 Arlington Market Convenience 1 Hyde Park Grocery & Cleaners Convenience 1 Arrowine Specialty/Ethnic 1 India A-1 Grocery Specialty/Ethnic 1 Asia Halal Meat & Grocery Specialty/Ethnic 1 International Market Specialty/Ethnic 1 Asia Market Specialty/Ethnic 1 K-1 Convenience Store Convenience 1 Asian Grocery Specialty/Ethnic 1 La Union Grocery & Deli Specialty/Ethnic 1 Atilla's Middle Eastern Grocery Specialty/Ethnic 1 Las Palmas Latin Market Specialty/Ethnic 1 Bakery Express Specialty/Ethnic 1 Lebanese Taverna Market Specialty/Ethnic 1 Ballston Farmers Market Transient/Temporary 1 Lee Super Market/IGA Neighborhood 1 Bangkok 54 Food Market Transient/Temporary 1 Lenox Gourmet Market & Deli Neighborhood 1 Bangla Bazar Transient/Temporary 1 LIDETA Market Specialty/Ethnic 1 Best Cellars Transient/Temporary 1 Lincoln Market Convenience 1 BP Service Station Convenience w/Gas 1 Lucky 7 Food Mart Convenience 1 Carlton Market Convenience 1 M. Slavin & Sons Fish Specialty/Ethnic 1 Castro's Bakery Specialty/Ethnic 1 Main Street Market Convenience 1 Central Market Specialty/Ethnic 1 Mercado Latino Specialty/Ethnic 1 Chaparrastique Market Specialty/Ethnic 1 Metro Market & Café Convenience 1 Charleston Market Convenience 1 Miguels Q-Mart Convenience 1 Cherrydale Liberty Service Station Convenience w/Gas 1 Mobil Service Station Convenience w/Gas 3 Chevron Service Station Convenience w/Gas 1 Mother's Macaroons Specialty/Ethnic 1 City Market & Deli Convenience 1 M's Deli & Market Convenience 1 Clarendon Farmers Market Transient/Temporary 1 One Stop Food Market Convenience 1 Columbia Pike Farmers Market Transient/Temporary 1 Oriental Supermarket Specialty/Ethnic 1 Commissary at Fort Myer Commissary 1 Pacific Enterprises Specialty/Ethnic 1 Costco Wholesaler 1 Pak Halal Specialty/Ethnic 1 Courthouse Place Market & Café Convenience 1 Philippine Oriental Market Specialty/Ethnic 1 Courtland Convenience Store Convenience 1 Pure Service Station Convenience w/Gas 1 Cuco Lindo Mercado Latino Specialty/Ethnic 1 Randolph Deli & Grocery Convenience 1 Dak Halal Groceries Specialty/Ethnic 1 Richmond Market & Deli Convenience 1 Dama Market Specialty/Ethnic 1 Rosslyn Farmers Market Transient/Temporary 1 Dama Pastries Specialty/Ethnic 1 Rosslyn Market Convenience 1 Dominion Market Convenience 1 Safeway Food Store Neighborhood 3 Eithiopian Market Specialty/Ethnic 1 Safeway Food Store Community 1 El Chaparral Market Specialty/Ethnic 1 Saran Indian Sweets Specialty/Ethnic 1 El Encanto Grocery Specialty/Ethnic 1 Sharieff Halal Meat & Grocery Specialty/Ethnic 1 El Latino & African Market Specialty/Ethnic 1 Shell Service Station Convenience w/Gas 3 Euro-Latino Grocery Specialty/Ethnic 1 Sun Deli & Market Convenience 1 EuroMarket Specialty/Ethnic 1 Sweet Surrender Specialty/Ethnic 1 Exxon Service Station Convenience w/Gas 7 Texaco Service Station Convenience w/Gas 1 Fiesta Oriental Store Specialty/Ethnic 1 The Curious Grape Specialty/Ethnic 1 Food Mart/Dominion Hills Grocery & Deli Convenience 1
The Italian Store Specialty/Ethnic 1
Food Star Neighborhood 1 Tivoli Gourmet & Pastry Specialty/Ethnic 1 Fort Perroir Wine & Gourmet Specialty/Ethnic 1 Tivoli Pastry Shop Specialty/Ethnic 1 Gallery Market & Café Convenience 1 Tivoli Restaurant Specialty/Ethnic 1 Gene's Market and Deli Convenience 1 Twin Towers Cleaners & Market Convenience 1 Giant Food Community 1 Westover Market/Food Rite Neighborhood 1 Giant Food Neighborhood 3 Whole Foods Market Community 1 Glebe Market Neighborhood 1 Wildflower Bakery Specialty/Ethnic 1 Gourmet Market Convenience 1 Wonder Market & Gifts Convenience 1 H & J Enterprises / Market Basket Convenience w/Gas 1 Total 143
APPENDIX B: FOOD STORES BY TRADE NAME & CATEGORY
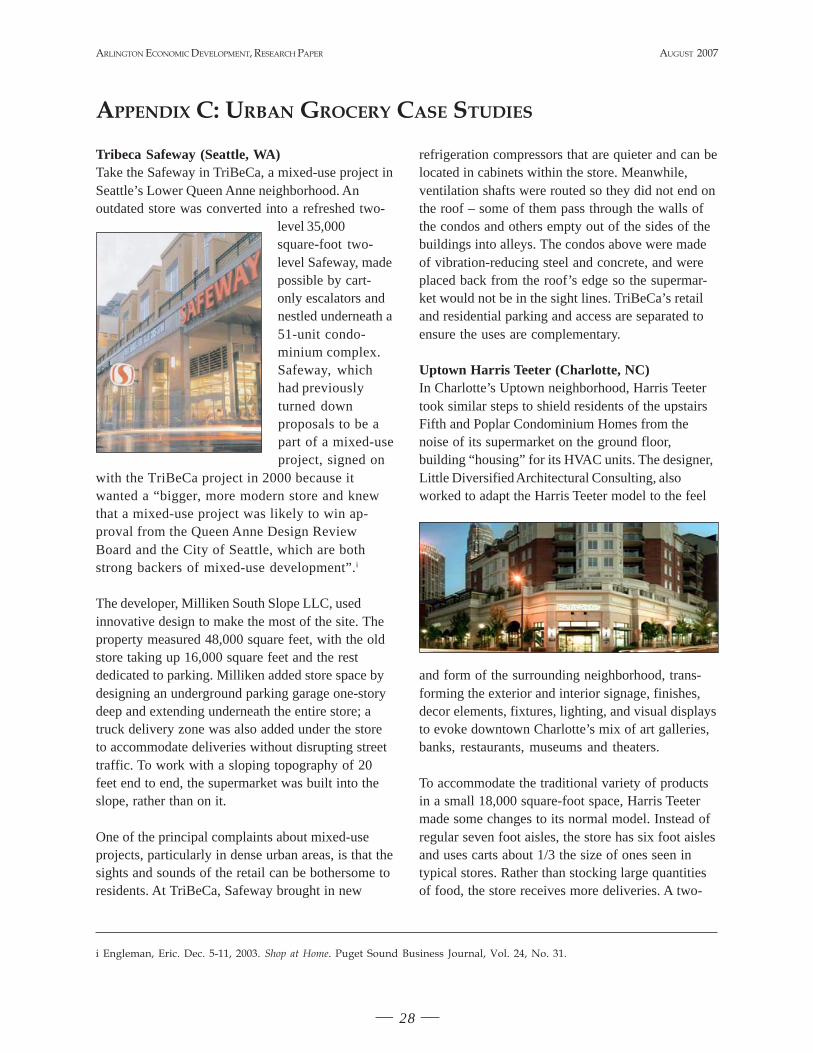
ARLINGTON ECONOMIC DEVELOPMENT, RESEARCH PAPER
28
AUGUST 2007
APPENDIX C: URBAN GROCERY CASE STUDIES
Tribeca Safeway (Seattle, WA)Take the Safeway in TriBeCa, a mixed-use project inSeattle’s Lower Queen Anne neighborhood. Anoutdated store was converted into a refreshed two-
level 35,000square-foot two-level Safeway, madepossible by cart-only escalators andnestled underneath a51-unit condo-minium complex.Safeway, whichhad previouslyturned downproposals to be apart of a mixed-useproject, signed on
with the TriBeCa project in 2000 because itwanted a “bigger, more modern store and knewthat a mixed-use project was likely to win ap-proval from the Queen Anne Design ReviewBoard and the City of Seattle, which are bothstrong backers of mixed-use development”.i
The developer, Milliken South Slope LLC, usedinnovative design to make the most of the site. Theproperty measured 48,000 square feet, with the oldstore taking up 16,000 square feet and the restdedicated to parking. Milliken added store space bydesigning an underground parking garage one-storydeep and extending underneath the entire store; atruck delivery zone was also added under the storeto accommodate deliveries without disrupting streettraffic. To work with a sloping topography of 20feet end to end, the supermarket was built into theslope, rather than on it.
One of the principal complaints about mixed-useprojects, particularly in dense urban areas, is that thesights and sounds of the retail can be bothersome toresidents. At TriBeCa, Safeway brought in new
refrigeration compressors that are quieter and can belocated in cabinets within the store. Meanwhile,ventilation shafts were routed so they did not end onthe roof – some of them pass through the walls ofthe condos and others empty out of the sides of thebuildings into alleys. The condos above were madeof vibration-reducing steel and concrete, and wereplaced back from the roof’s edge so the supermar-ket would not be in the sight lines. TriBeCa’s retailand residential parking and access are separated toensure the uses are complementary.
Uptown Harris Teeter (Charlotte, NC)In Charlotte’s Uptown neighborhood, Harris Teetertook similar steps to shield residents of the upstairsFifth and Poplar Condominium Homes from thenoise of its supermarket on the ground floor,building “housing” for its HVAC units. The designer,Little Diversified Architectural Consulting, alsoworked to adapt the Harris Teeter model to the feel
and form of the surrounding neighborhood, trans-forming the exterior and interior signage, finishes,decor elements, fixtures, lighting, and visual displaysto evoke downtown Charlotte’s mix of art galleries,banks, restaurants, museums and theaters.
To accommodate the traditional variety of productsin a small 18,000 square-foot space, Harris Teetermade some changes to its normal model. Instead ofregular seven foot aisles, the store has six foot aislesand uses carts about 1/3 the size of ones seen intypical stores. Rather than stocking large quantitiesof food, the store receives more deliveries. A two-
i Engleman, Eric. Dec. 5-11, 2003. Shop at Home. Puget Sound Business Journal, Vol. 24, No. 31.
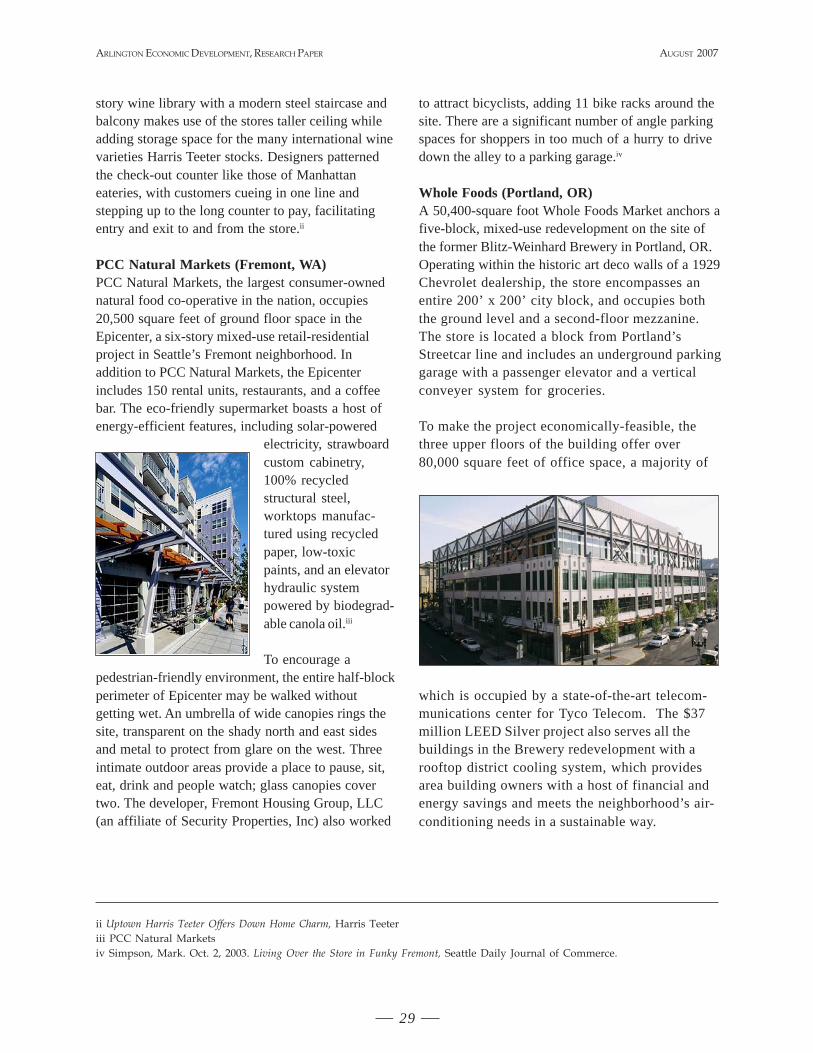
ARLINGTON ECONOMIC DEVELOPMENT, RESEARCH PAPER AUGUST 2007
29
story wine library with a modern steel staircase andbalcony makes use of the stores taller ceiling whileadding storage space for the many international winevarieties Harris Teeter stocks. Designers patternedthe check-out counter like those of Manhattaneateries, with customers cueing in one line andstepping up to the long counter to pay, facilitatingentry and exit to and from the store.ii
PCC Natural Markets (Fremont, WA)PCC Natural Markets, the largest consumer-ownednatural food co-operative in the nation, occupies20,500 square feet of ground floor space in theEpicenter, a six-story mixed-use retail-residentialproject in Seattle’s Fremont neighborhood. Inaddition to PCC Natural Markets, the Epicenterincludes 150 rental units, restaurants, and a coffeebar. The eco-friendly supermarket boasts a host ofenergy-efficient features, including solar-powered
electricity, strawboardcustom cabinetry,100% recycledstructural steel,worktops manufac-tured using recycledpaper, low-toxicpaints, and an elevatorhydraulic systempowered by biodegrad-able canola oil.iii
To encourage apedestrian-friendly environment, the entire half-blockperimeter of Epicenter may be walked withoutgetting wet. An umbrella of wide canopies rings thesite, transparent on the shady north and east sidesand metal to protect from glare on the west. Threeintimate outdoor areas provide a place to pause, sit,eat, drink and people watch; glass canopies covertwo. The developer, Fremont Housing Group, LLC(an affiliate of Security Properties, Inc) also worked
ii Uptown Harris Teeter Offers Down Home Charm, Harris Teeteriii PCC Natural Marketsiv Simpson, Mark. Oct. 2, 2003. Living Over the Store in Funky Fremont, Seattle Daily Journal of Commerce.
to attract bicyclists, adding 11 bike racks around thesite. There are a significant number of angle parkingspaces for shoppers in too much of a hurry to drivedown the alley to a parking garage.iv
Whole Foods (Portland, OR)A 50,400-square foot Whole Foods Market anchors afive-block, mixed-use redevelopment on the site ofthe former Blitz-Weinhard Brewery in Portland, OR.Operating within the historic art deco walls of a 1929Chevrolet dealership, the store encompasses anentire 200’ x 200’ city block, and occupies boththe ground level and a second-floor mezzanine.The store is located a block from Portland’sStreetcar line and includes an underground parkinggarage with a passenger elevator and a verticalconveyer system for groceries.
To make the project economically-feasible, thethree upper floors of the building offer over80,000 square feet of office space, a majority of
which is occupied by a state-of-the-art telecom-munications center for Tyco Telecom. The $37million LEED Silver project also serves all thebuildings in the Brewery redevelopment with arooftop district cooling system, which providesarea building owners with a host of financial andenergy savings and meets the neighborhood’s air-conditioning needs in a sustainable way.