GREX APPLES & PEARS 10 March 2008 Brussels. Southern Hemisphere crop forecasts 2008.
27
GREX APPLES & PEARS 10 March 2008 Brussels
-
Upload
caleb-munn -
Category
Documents
-
view
216 -
download
0
Transcript of GREX APPLES & PEARS 10 March 2008 Brussels. Southern Hemisphere crop forecasts 2008.
GREX APPLES & PEARS
10 March 2008
Brussels

Southern Hemisphere
crop forecasts 2008

Southern hemisphere crop forecasts
Apples
Argentina
Variety 2004 2005 2006 2007 2008
Rio Negro 900.708 1.023.057 940.732 946.643 911.165
Granny Smith 241.953 278.004 186.239 203.243 195.806
Red Delicious/ Top Red 658.755 745.053 606.866 601.063 575.527
Royal Gala 118.810 112.789 111.500
Other 28.817 29.548 28.332
Mendoza 109.253 98.000 *110.000 *100.000 69.121
TOTAL 1.009.961 1.121.057 1.050.732 1.046.643 980.286
Market 2004 2005 2006 2007 2008
Production 1.009.961 1.121.057 1.050.732 1.046.643 980.286 Export 286.420 248.616 235.269 Market offer Domestic 263.545 301.463 284.283 Industry 500.767 496.565 460.734 Total 1.009.961 1.121.057 1.050.732 1.046.643 980.286

Southern hemisphere crop forecasts
Variety 2004 2005 2006 2007 2008
Rio Negro 357.536 431.576 639.777 639.143 617.236
Beure 47.103 44.499 66.978 78.246 80.145
Packhams 129.857 167.676 230.330 256.949 249.834
Williams 180.576 219.401 282.008 286.712 272.557
Other 60.461 17.236 14.700
Mendoza 109.253 98.000 *110.000 *100.000 105.278
TOTAL 466.789 529.576 749.777 739.143 722.514
Pears
Argentina
Market 2004 2005 2006 2007 2008
Production 466.789 529.576 749.777 739.143 722.514 Export 452.188 457.351 447.959 Market offer Domestic 110.370 79.922 79.476 Industry 187.219 201.870 195.079 Total 466.789 529.576 749.777 739.143 722.514

Southern hemisphere crop forecasts
Though the current season is not so mild, it foresees good quality standards.
The control programs against codling moths are increasing and consolidating as an effective technique against the disease.
Pear harvest started 21 January with 1 week delay because social conflicts with fruit pickers. Apple harvest started 28 January.
Late rains and delayed picking have affected the forecasted crop downwards by approximately 3%.
Argentina
Notes on 2008 season:

Southern hemisphere crop forecastsAustralia
Apples
Variety 2004 2005 2006 2007 2008
Bonza 3.228 2.827 2.066 1.178 1.300 Braeburn 3.031 3.802 2.654 2.557 2.700 Cripps pink 47.125 61.108 56.538 55.935 60.000 Cripps red 13.577 20.448 18.137 20.101 22.000 Delicious- Block Red 24.005 24.691 20.976 19.157 19.000 Delicious- Striped Red 27.437 30.925 21.871 19.943 18.000 Fuji 16.958 30.072 22.617 21.528 24.000 Golden Delicious 16.436 24.932 16.197 15.617 15.000 Granny Smith 55.513 66.346 58.898 65.076 67.000 J onagold 4.627 5.867 5.148 3.680 4.000 J onathon 4.317 5.593 3.981 3.016 4.000 Lady Williams 4.924 6.856 5.593 2.202 3.000 Other Early 2.018 2.335 1.833 1.412 2.000 Other Late 3.442 2.730 2.398 2.033 2.000 Royal Gala 28.288 38.053 37.519 36.990 40.000
TOTAL 254.926 326.584 276.427 270.425 284.000

Southern hemisphere crop forecastsAustralia
Pears
Variety 2004 2005 2006 2007 2008
Beurre Bosc 10.482 10.272 9.354 9.702 10.000
Corella 706 1.186 1.454 1.452 1.600
J osephine 3.325 3.361 3.101 2.610 2.900
Nashi 3.515 3.754 3.383 2.919 3.200
Packham 53.297 60.672 55.159 52.192 65.000
Red Anjoy 354 353 351 341 300
Sensation 744 617 673 459 500 Williams Bon Chretien
67.478 68.783 67.184 63.037 60.000
Others 2.161 2.444 1.762 2.053 2.000
TOTAL 142.062 151.442 142.419 134.764 145.500

Southern hemisphere crop forecasts
• Seasonal conditions have been much more favourable for the 2008 crop, quality and size of all varieties should be better than 2007.
• Growing conditions have been milder with more rainfall in most areas supporting excellent fruit quality in 2008.
• There have also been some rationalisation of plantings in some areas, most notably the removal of Williams pears in the Goulburn Valley.
Australia
Notes on 2008 season:
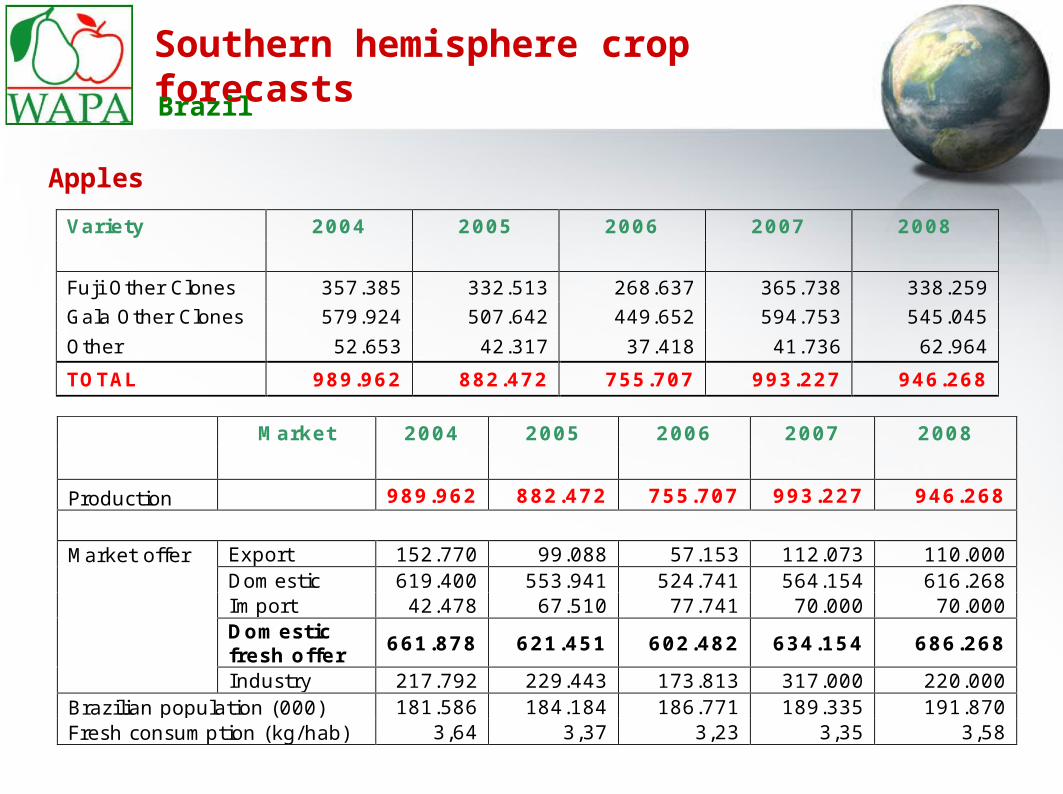
Southern hemisphere crop forecastsBrazil
Apples
Variety 2004 2005 2006 2007 2008
Fuji Other Clones 357.385 332.513 268.637 365.738 338.259
Gala Other Clones 579.924 507.642 449.652 594.753 545.045
Other 52.653 42.317 37.418 41.736 62.964
TOTAL 989.962 882.472 755.707 993.227 946.268
Market 2004 2005 2006 2007 2008
Production 989.962 882.472 755.707 993.227 946.268
Market offer Export 152.770 99.088 57.153 112.073 110.000 Domestic 619.400 553.941 524.741 564.154 616.268 Import 42.478 67.510 77.741 70.000 70.000
Domestic fresh offer
661.878 621.451 602.482 634.154 686.268
Industry 217.792 229.443 173.813 317.000 220.000 Brazilian population (000) 181.586 184.184 186.771 189.335 191.870 Fresh consumption (kg/hab) 3,64 3,37 3,23 3,35 3,58

Southern hemisphere crop forecasts
• Winter was one of the best of the last 10 years.
• This season has been marked so far by local heavy rains during the blooming, all regions were not affected the same way, a reduction of 10% compared to last year is estimated.
• Blossom was concentrated.
• Quality is considered good and size above average. Colour is considered very good.
• Hail hasn’t been a major preoccupation so far. Regularity of rain during the season has been good. No extreme temperatures so far.
• Picking has started week 5 and on week 6 all growers are full speed, one week earlier than estimated.
• Effect of this advance on crop estimate?
Brazil
Notes on 2008 season:

Southern hemisphere crop forecastsChile
Apples
Variety 2005 2006 2007 2008
Braeburn 25.219 29.339 34.255 32.671
Fuji 167.402 184.809 200.435 221.837
Gala 385.861 432.947 476.231 519.622
Granny Smith 388.046 405.882 417.362 426.132
Pink Lady/Crisp P 26.377 35.094 43.709 47.262
Red Delicious 568.689 582.491 605.366 609.869
Other 4.926 4.915 7.000 7.863
TOTAL 1.566.520 1.675.476 1.784.359 1.865.256
Market 2004 2005 2006 2007 2008
Production 1.566.520 1.675.476 1.784.359 1.865.256
Export 738.321 622.975 708.516 761.735 823.490
Market offer Domestic
Industry/waste - -
Total

Southern hemisphere crop forecasts
• Expected uplift in the exports of apples in regards to the previous season 6 – 8 % uplift
• Galas, Fujis and red delicious expected to grow the most • In general the size of the fruit seems to be normal however given the high
temperatures in December and January, the size could be affected. • The incidence of sun spots could also occur, at the same level as last
year. • Higher incidence of apples being diverted to local agro – industry and
processing given increase in local market prices. • The production of apples in general may be a week later than last season. • Slow movement seen on the European market so far – whilst local
European stock is up by 5% this season. Need for caution.• Importers turning toward Eastern Europe in bid to alleviate the market,
given lower production and stock levels in this region.
Notes on 2008 Season
Chile
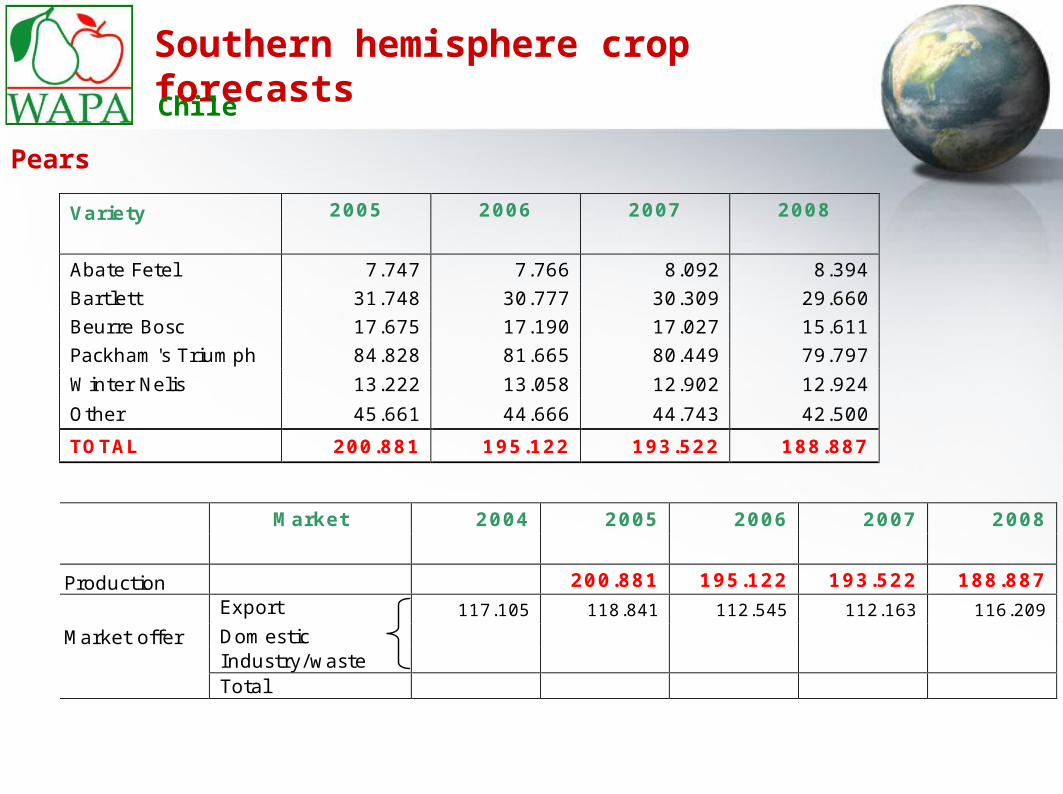
Southern hemisphere crop forecastsChile
Pears
Variety 2005 2006 2007 2008
Abate Fetel 7.747 7.766 8.092 8.394
Bartlett 31.748 30.777 30.309 29.660
Beurre Bosc 17.675 17.190 17.027 15.611
Packham's Triumph 84.828 81.665 80.449 79.797
Winter Nelis 13.222 13.058 12.902 12.924
Other 45.661 44.666 44.743 42.500
TOTAL 200.881 195.122 193.522 188.887
Market 2004 2005 2006 2007 2008
Production 200.881 195.122 193.522 188.887
Export 117.105 118.841 112.545 112.163 116.209
Market offer Domestic Industry/waste Total

Southern hemisphere crop forecasts
• Expected normal season for pears
• Slight uplift in terms of volumes (3 – 4%)
• Main varieties to register increases in export volumes are Forelle and Coscia, and to a lesser degree Abate Fatel and Beurre Bosc.
• Green varieties will most probably be more evenly distributed in terms of sizes, in regards to last season
• Harvest of pear varieties (Coscia) expected to be 1 week later compared to last season.
Notes on 2008 Season
Chile

Southern hemisphere crop forecastsNew Zealand
Variety 2004 2005 2006 2007 2008
Braeburn 216.000 196.615 150.000 167.116 134.713
Fuji 20.000 38.000 33.700 30.324 38.133
J azz 0 3.390 5.000 12.284 21.924
Royal Gala 183.600 178.125 135.000 156.105 155.102
Other 127.900 89.447 68.000 60.953 68.466
TOTAL 547.500 505.577 391.700 426.782 418.338
Apples
Market 2004 2005 2006 2007 2008
Production 547.500 505.577 391.700 426.782 418.338 Export 392.009 329.400 264.000 292.869 271.920 Market offer Domestic 60.000 60.000 44.000 44.000 46.017 Industry 155.431 116.177 83.700 84.035 100.401 Total 547.500 505.577 391.700 426.782 418.338

Southern hemisphere crop forecastsNew Zealand
Pears
Market 2004 2005 2006 2007 2008
Production 12.500 11.150 9.300 9.900 11.366 Export 6.504 6.694 4.700 5.878 6.820
Market offer Domestic - 456 500 500 568 Industry - 4.000 4.100 3.500 3.978 Total 12.500 11.150 9.300 9.900 11.366

Southern hemisphere crop forecasts
• Notable trend for NZ is a reduction in Braeburn and an increase in Jazz.
• Spring frosts in Hawkes Bay have reduced the NZ crop 18,000 tonnes less than 2007. Most affected variety is Braeburn.
• Size is similar to 2007
• Harvest looks to be up to one week later than 2007
• The NZ dollar is as strong against the US$ as last year. It is likely that exporters will look to Europe and Asia where possible for markets.
New Zealand
Notes on 2008 season:

Southern hemisphere crop forecastsSouth Africa
ApplesVariety 2004 2005 2006 2007 2008
Braeburn 24.002 21.297 21.075 22.888 23.106 Fuji 24.801 23.465 25.395 27.553 30.094 Golden Delicious 191.196 161.183 138.992 165.211 154.030 Granny Smith 233.225 193.570 162.515 160.610 176.895 Oregon Spur 10.926 9.259 8.414 9.217 8.648 Pink Lady 48.465 43.091 42.610 46.141 50.225 Royal Gala 87.189 76.920 74.417 80.486 82.671 Starking 61.431 49.955 38.247 41.430 40.125 Topred 54.665 45.467 39.536 42.822 41.923 Other 83.086 78.713 85.726 92.697 102.283
TOTAL 818.987 702.920 636.926 689.054 710.000
Market 2004 2005 2006 2007 2008
Production 818.987 702.920 636.926 689.054 710.000 Export 332.180 273.311 265.189 280.007 280.000 Market offer Domestic 239.827 237.067 205.012 217.313 230.000 Industry 246.980 192.542 166.725 191.734 200.000 Total 818.987 702.920 636.926 689.054 710.000

Southern hemisphere crop forecastsSouth Africa
Pears
Variety 2004 2005 2006 2007 2008
Beurre Bosc 16.162 13.466 11.551 12.843 11.450
Doyenne Du Comice 11.901 9.455 8.255 8.464 8.061
Early Bon Chretien 18.736 21.676 28.484 31.203 30.259
Forelle 54.203 58.218 71.210 78.009 82.453
Packham's Triumph 89.632 88.515 92.568 97.693 95.160
Rosemarie 16.171 15.910 12.009 12.313 11.508 Williams Bon Chretien 81.773 73.690 65.216 82.863 62.709
Other 39.960 35.212 34.539 35.412 35.400
TOTAL 328.538 316.142 323.833 358.799 337.000
Market 2004 2005 2006 2007 2008
Production 328.538 316.142 323.833 358.799 337.000 Export 152.333 141.157 124.691 151.951 146.000 Market offer Domestic 52.939 57.610 57.441 62.313 59.000 Industry 123.266 117.375 141.701 144.535 132.000 Total 328.538 316.142 323.833 358.799 337.000

Southern hemisphere crop forecasts
• Decreasing trend in Granny and Golden hectares seem to have stabilised.
• Decreasing trend in total hectares for both apples and pears expected to stop during 2008 and possible increases over the next 3-5 years.
• Forelle exports expected to grow for at least next 5-8 years (due to increase in hectares).
• Experienced very good winter – adequate cold units and enough water• Flood damage to Langkloof production area, but this will not have a
severe impact on total production.• Producers have been made aware of possibility of smaller fruit.• Exchange rate favourable for exports at the moment (hopefully it will
stay stable throughout the season).• Sharp increase in input costs, especially transport (road and shipping)
as well as direct production costs. • Season approximately 10-14 days late
South Africa
Notes on 2008 season:

Southern Hemisphere crop forecastsConsolidated figures – total production
Apples
Pears
Country 2004 2005 2006 2007 2008 (F) % 08 vs 07 % 08 vs Av Av 04-07Argentina 1.009.961 1.121.057 1.050.732 1.046.643 980.286 -6,34% -7,27% 1.057.098Australia 254.926 326.584 276.427 270.425 284.000 5,02% 0,68% 282.091Brazil 989.962 882.472 755.707 993.227 946.268 -4,73% 4,52% 905.342Chile na 1.566.520 1.675.476 1.784.359 1.865.256 4,53% 11,33% 1.675.452New Zealand 547.500 505.577 391.700 426.782 418.338 -1,98% -10,59% 467.890South Africa 818.987 702.920 636.926 689.054 710.000 3,04% -0,28% 711.972TOTAL 5.105.130 4.786.968 5.212.497 5.204.148 -0,16% 2,05% 5.099.845
Country 2004 2005 2006 2007 2008 (F) % 08 vs 07 % 08 vs Av Av 04-07Argentina 466.789 529.576 749.777 739.143 722.514 -2,25% 16,29% 621.321Australia 142.062 151.442 142.419 134.764 145.500 7,97% 1,98% 142.672Chile na 200.881 195.122 193.522 188.887 -2,40% -3,88% 196.508New Zealand 12.500 11.150 9.300 9.900 11.366 14,81% 6,10% 10.713South Africa 328.538 316.142 323.833 358.799 337.000 -6,08% 1,56% 331.828TOTAL 1.209.191 1.420.451 1.438.135 1.405.267 -2,29% 7,85% 1.303.042

Southern Hemisphere crop forecastsConsolidated figures – export production
Apples
Pears
Country 2006 2007 2008 (F) % 08 vs 07 % 08 vs Av Av 06-07Argentina 286.420 248.616 235.269 -5,37% -12,05% 267.518Brazil 57.153 112.073 110.000 -1,85% 30,00% 84.613Chile 708.516 761.735 823.490 8,11% 12,02% 735.126New Zealand 264.000 292.869 271.920 -7,15% -2,34% 278.435South Africa 265.189 280.007 280.000 0,00% 2,72% 272.598TOTAL 1.581.278 1.695.300 1.720.679 1,50% 5,03% 1.638.289
Country 2006 2007 2008 (F) % 08 vs 07 % 08 vs Av Av 06-07Argentina 452.188 457.351 447.959 -2,05% -1,50% 454.770Chile 112.545 112.163 116.209 3,61% 3,43% 112.354New Zealand 4.700 5.878 6.820 16,03% 28,95% 5.289South Africa 124.691 151.951 146.000 -3,92% 5,55% 138.321TOTAL 694.124 727.343 716.988 -1,42% 0,88% 710.734

Southern Hemisphere
exports

International apples and pears marketsExchange rates - € vs $

International apples and pears marketsExchange rates – SH currencies

Southern Hemisphere exportsApples
935.381 839.881 684.218
133.872
785.976
195.156
0
200.000
400.000
600.000
800.000
1.000.000
2004 2005 2006 2007
SH Apple exports up to week 41
EU
Licences
USA & Canada

EU License monitoring systemComparison with SHAFFE data (w 41)
Countries SHAFFE data License monitoring
Argentina 101.077 109.587
Brasil 101.860 102.489
Chile 231.573 209.047
New Zealand 181.381 197.745
South Africa 170.100 157.358
TOTAL 785.976 776.226