Consumption of pears -...
26
Ferrara, Italy - 19 November 2015 Consumption of pears Daphne van Doorn Interpera - 19 November 2015
Transcript of Consumption of pears -...
Ferrara, Italy - 19 November 2015
Consumption of pears
Daphne van Doorn
Interpera - 19 November 2015
Ferrara, Italy - 19 November 2015
Agenda
1. Trade trends
2. Effects Russian embargo
3. General consumption trends
4. Promotion campaigns
5. Country examples
Ferrara, Italy - 19 November 2015
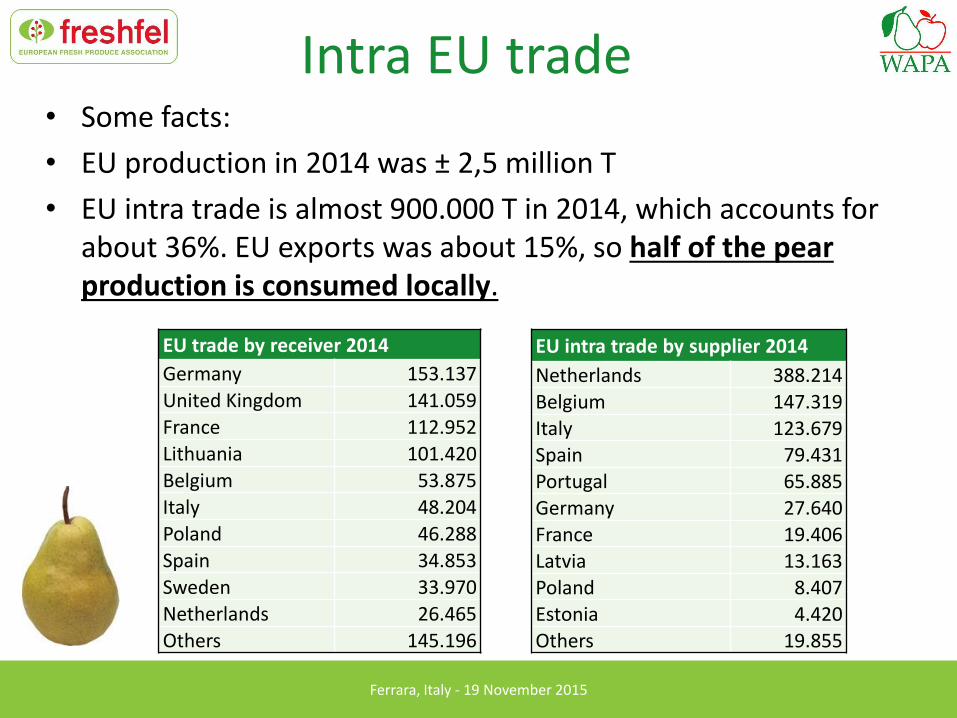
Intra EU trade • Some facts:
• EU production in 2014 was ± 2,5 million T
• EU intra trade is almost 900.000 T in 2014, which accounts for about 36%. EU exports was about 15%, so half of the pear production is consumed locally.
EU intra trade by supplier 2014
Netherlands 388.214
Belgium 147.319 Italy 123.679
Spain 79.431 Portugal 65.885 Germany 27.640
France 19.406 Latvia 13.163
Poland 8.407 Estonia 4.420
Others 19.855
EU trade by receiver 2014
Germany 153.137
United Kingdom 141.059
France 112.952
Lithuania 101.420
Belgium 53.875
Italy 48.204
Poland 46.288
Spain 34.853
Sweden 33.970
Netherlands 26.465
Others 145.196
Ferrara, Italy - 19 November 2015
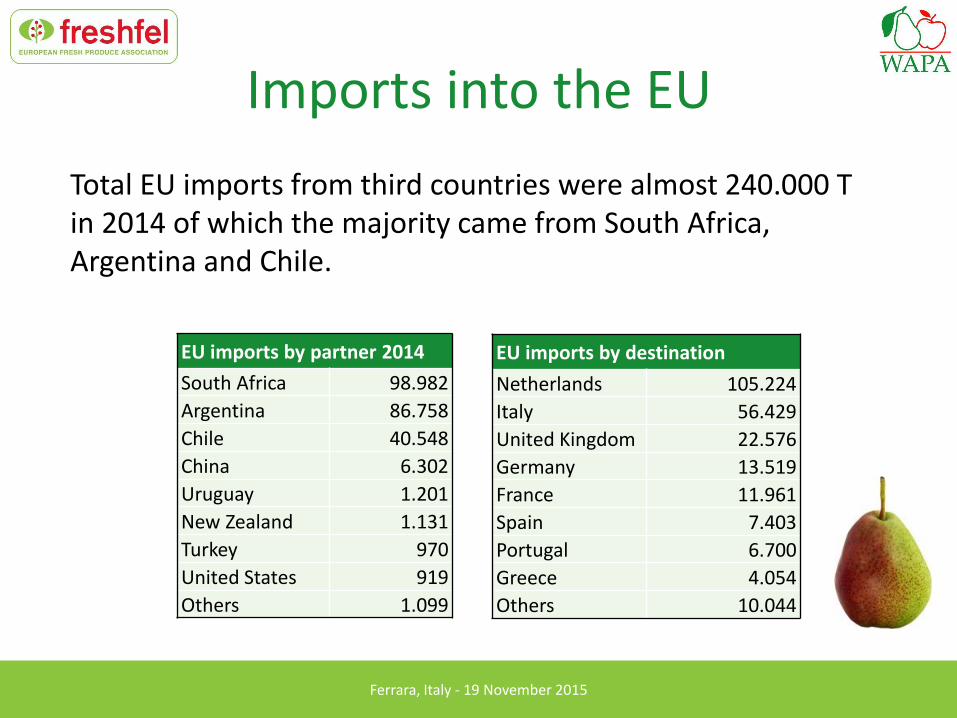
Imports into the EU
EU imports by partner 2014
South Africa 98.982
Argentina 86.758
Chile 40.548
China 6.302
Uruguay 1.201
New Zealand 1.131
Turkey 970
United States 919
Others 1.099
Total EU imports from third countries were almost 240.000 T in 2014 of which the majority came from South Africa, Argentina and Chile.
EU imports by destination
Netherlands 105.224
Italy 56.429
United Kingdom 22.576
Germany 13.519
France 11.961
Spain 7.403
Portugal 6.700
Greece 4.054
Others 10.044

Ferrara, Italy - 19 November 2015
Export trade is increasing
0
20 000
40 000
60 000
80 000
100 000
120 000
140 000
EU exports by exporting country (2014 in T) incl. re-export
0
50 000
100 000
150 000
200 000
250 000
300 000
350 000
400 000
450 000
500 000
2010 2011 2012 2013 2014
EU exports to third countries
Average 10-13 Average 10-13 /14
374.141 26,1%
Exports are up 26% in 2014 compared to the average 2010-2013
Although only 15% of EU production
goes to international trade
EU Country 2014 exports Av 10-13/ 14
Belgium 133.731 -13,9%
Lithuania 39.690 148,0%
Netherlands 65.004 7,4%
Portugal 37.854 62,9%
Spain 40.922 36,5%
Poland 27.931 18,4%
Italy 16.042 57,7%
France 5.343 -21,0%
Slovenia 2.556 56,7%
Greece 2.290 -4,8%
Ferrara, Italy - 19 November 2015
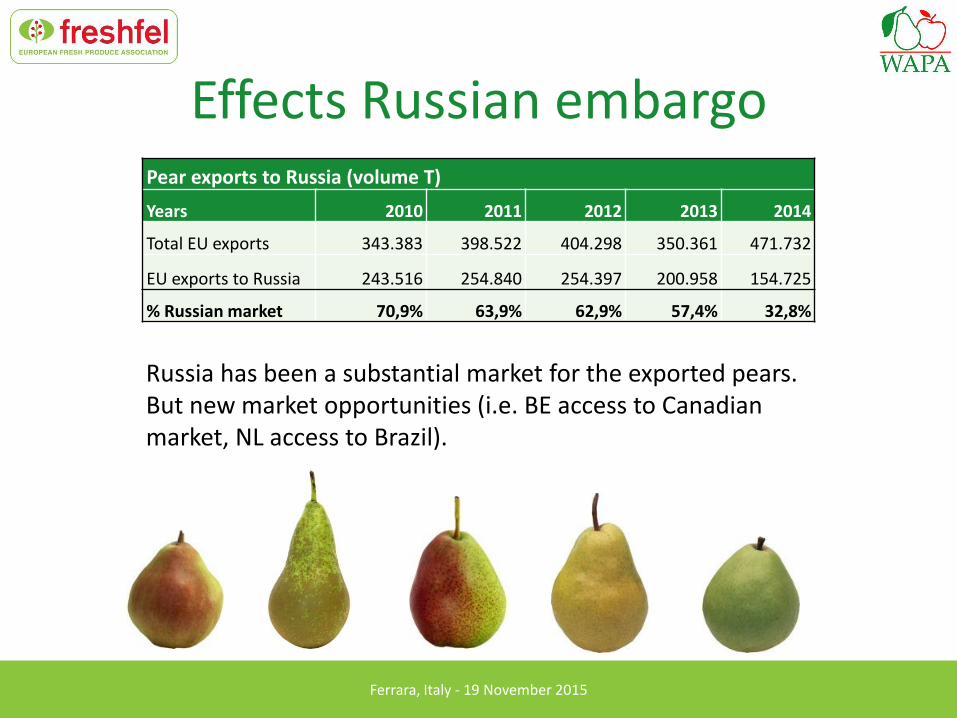
Effects Russian embargo Pear exports to Russia (volume T)
Years 2010 2011 2012 2013 2014
Total EU exports 343.383 398.522 404.298 350.361 471.732
EU exports to Russia 243.516 254.840 254.397 200.958 154.725
% Russian market 70,9% 63,9% 62,9% 57,4% 32,8%
Russia has been a substantial market for the exported pears. But new market opportunities (i.e. BE access to Canadian market, NL access to Brazil).
Ferrara, Italy - 19 November 2015
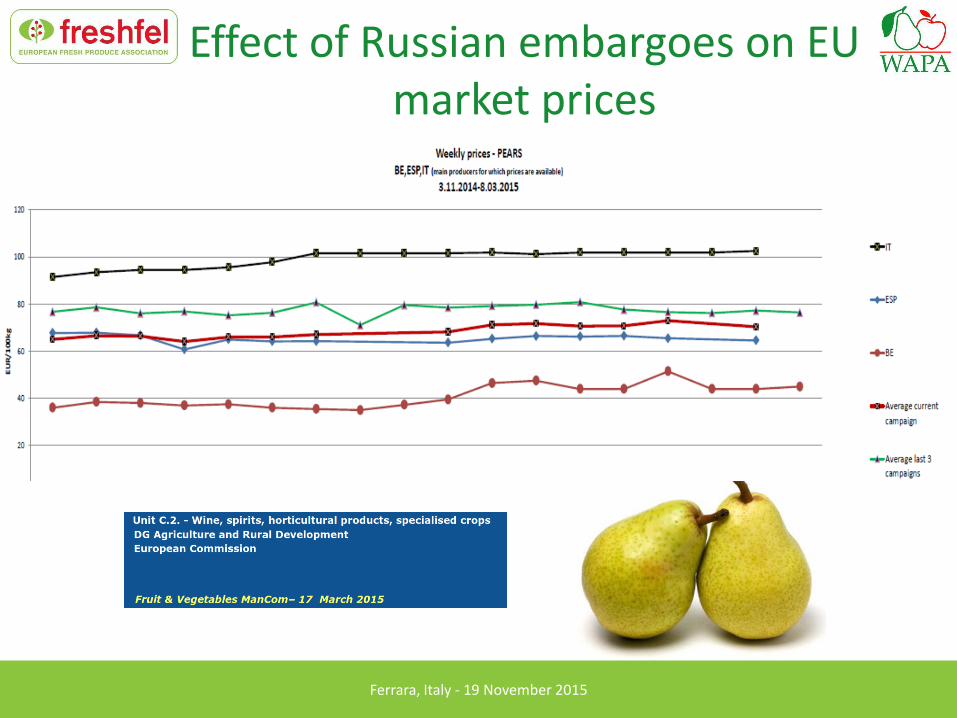
Effect of Russian embargoes on EU market prices
Ferrara, Italy - 19 November 2015
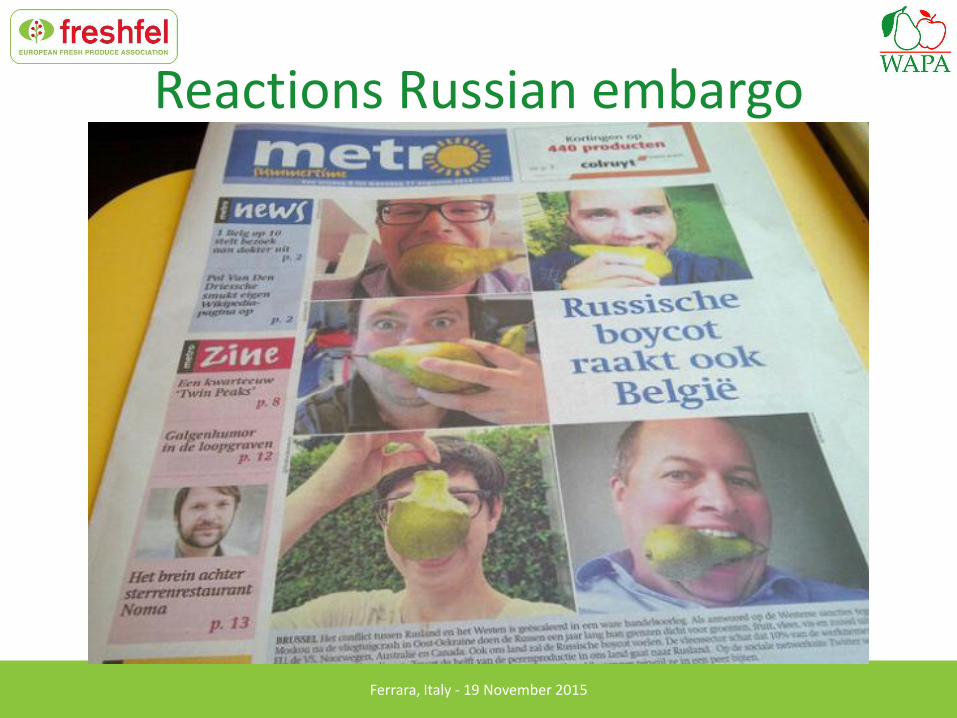
Reactions Russian embargo
Ferrara, Italy - 19 November 2015
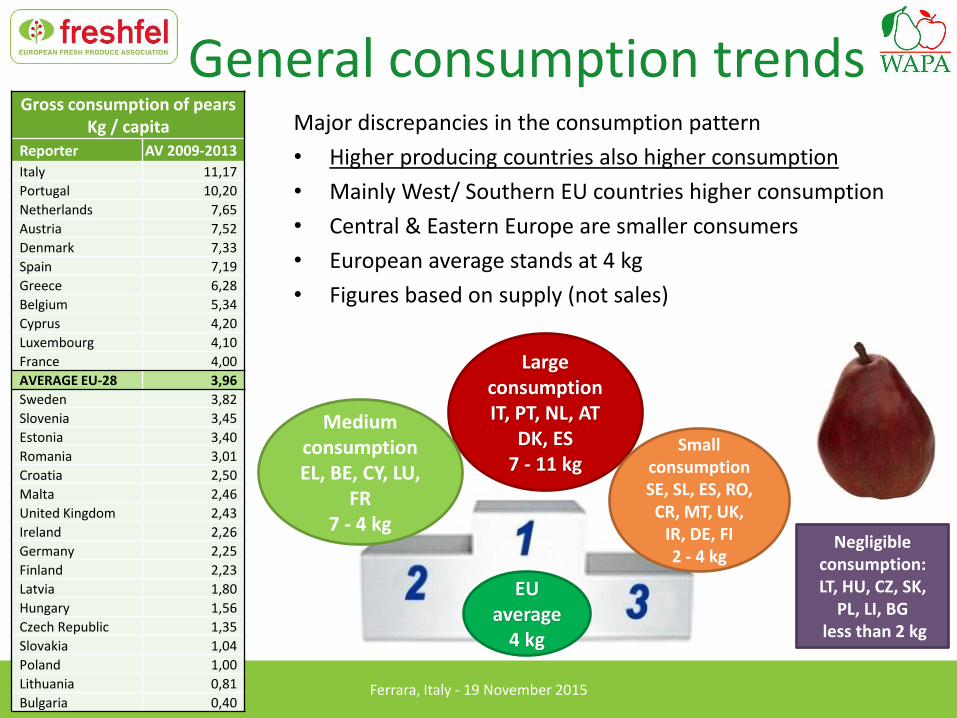
General consumption trends Gross consumption of pears
Kg / capita
Reporter AV 2009-2013
Italy 11,17
Portugal 10,20
Netherlands 7,65
Austria 7,52
Denmark 7,33
Spain 7,19
Greece 6,28
Belgium 5,34
Cyprus 4,20
Luxembourg 4,10
France 4,00
AVERAGE EU-28 3,96
Sweden 3,82
Slovenia 3,45
Estonia 3,40
Romania 3,01
Croatia 2,50
Malta 2,46
United Kingdom 2,43
Ireland 2,26
Germany 2,25
Finland 2,23
Latvia 1,80
Hungary 1,56
Czech Republic 1,35
Slovakia 1,04
Poland 1,00
Lithuania 0,81
Bulgaria 0,40
EU average
4 kg
Large consumption IT, PT, NL, AT
DK, ES 7 - 11 kg
Medium consumption EL, BE, CY, LU,
FR 7 - 4 kg
Small consumption SE, SL, ES, RO,
CR, MT, UK, IR, DE, FI 2 - 4 kg
Negligible consumption: LT, HU, CZ, SK,
PL, LI, BG less than 2 kg
Major discrepancies in the consumption pattern
• Higher producing countries also higher consumption
• Mainly West/ Southern EU countries higher consumption
• Central & Eastern Europe are smaller consumers
• European average stands at 4 kg
• Figures based on supply (not sales)
Ferrara, Italy - 19 November 2015
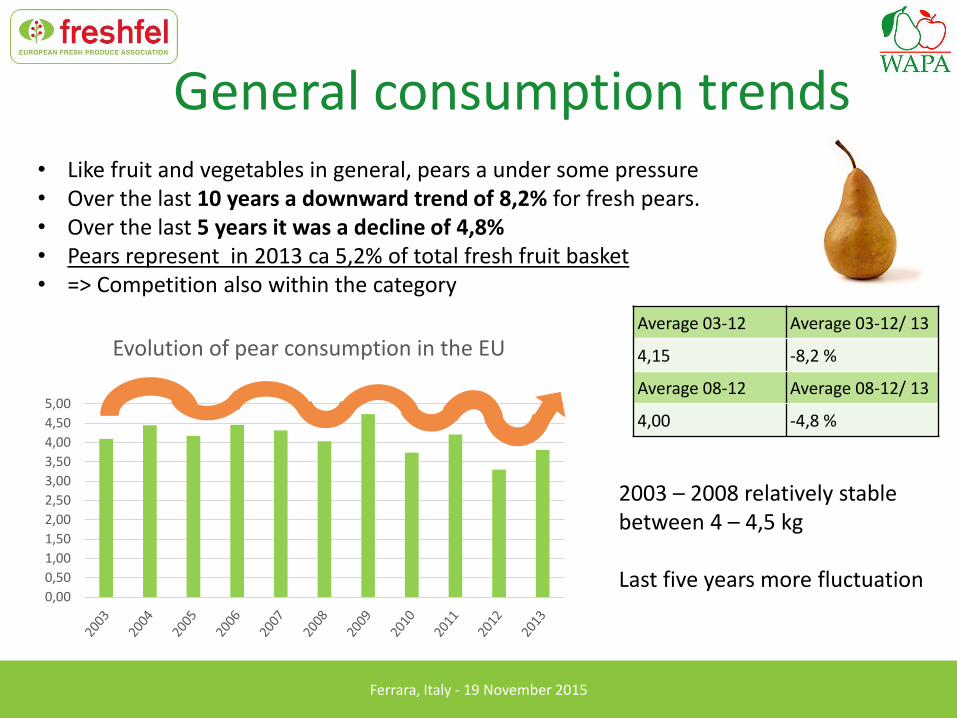
General consumption trends
Average 03-12 Average 03-12/ 13
4,15 -8,2 %
Average 08-12 Average 08-12/ 13
4,00 -4,8 %
0,00
0,50
1,00
1,50
2,00
2,50
3,00
3,50
4,00
4,50
5,00
Evolution of pear consumption in the EU
2003 – 2008 relatively stable between 4 – 4,5 kg Last five years more fluctuation
• Like fruit and vegetables in general, pears a under some pressure • Over the last 10 years a downward trend of 8,2% for fresh pears. • Over the last 5 years it was a decline of 4,8% • Pears represent in 2013 ca 5,2% of total fresh fruit basket • => Competition also within the category
Ferrara, Italy - 19 November 2015
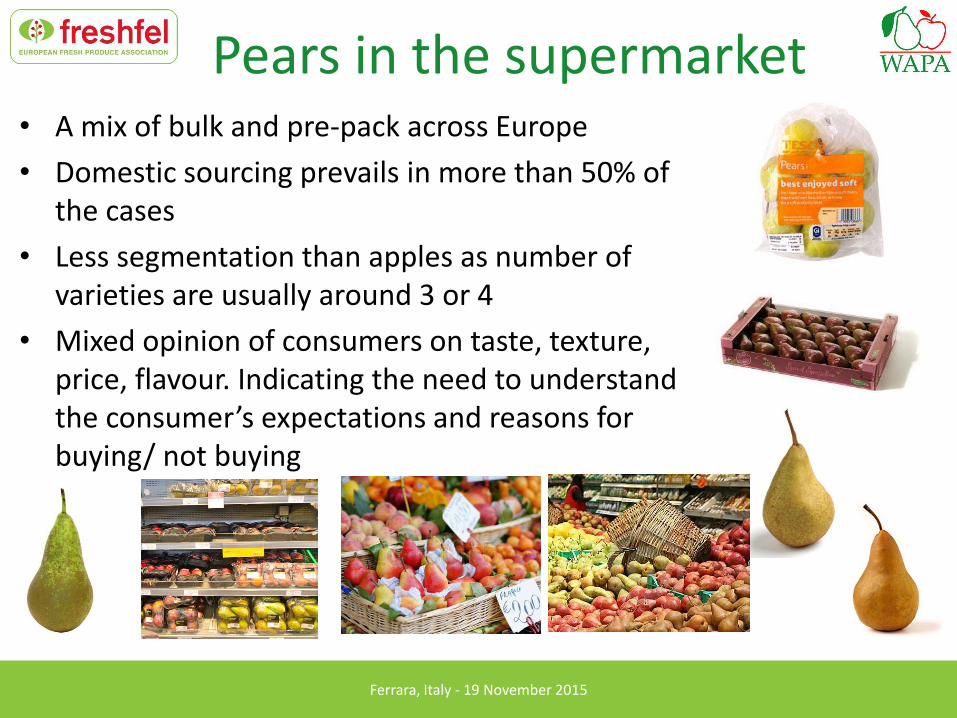
Pears in the supermarket • A mix of bulk and pre-pack across Europe
• Domestic sourcing prevails in more than 50% of the cases
• Less segmentation than apples as number of varieties are usually around 3 or 4
• Mixed opinion of consumers on taste, texture, price, flavour. Indicating the need to understand the consumer’s expectations and reasons for buying/ not buying
Ferrara, Italy - 19 November 2015
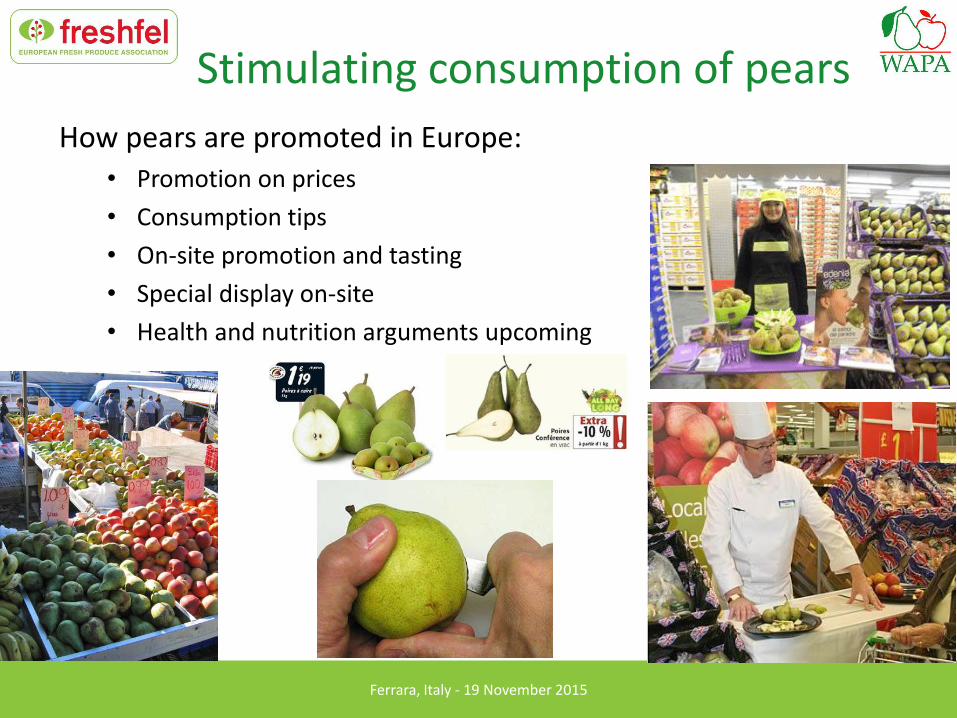
Stimulating consumption of pears
How pears are promoted in Europe: • Promotion on prices
• Consumption tips
• On-site promotion and tasting
• Special display on-site
• Health and nutrition arguments upcoming
Ferrara, Italy - 19 November 2015
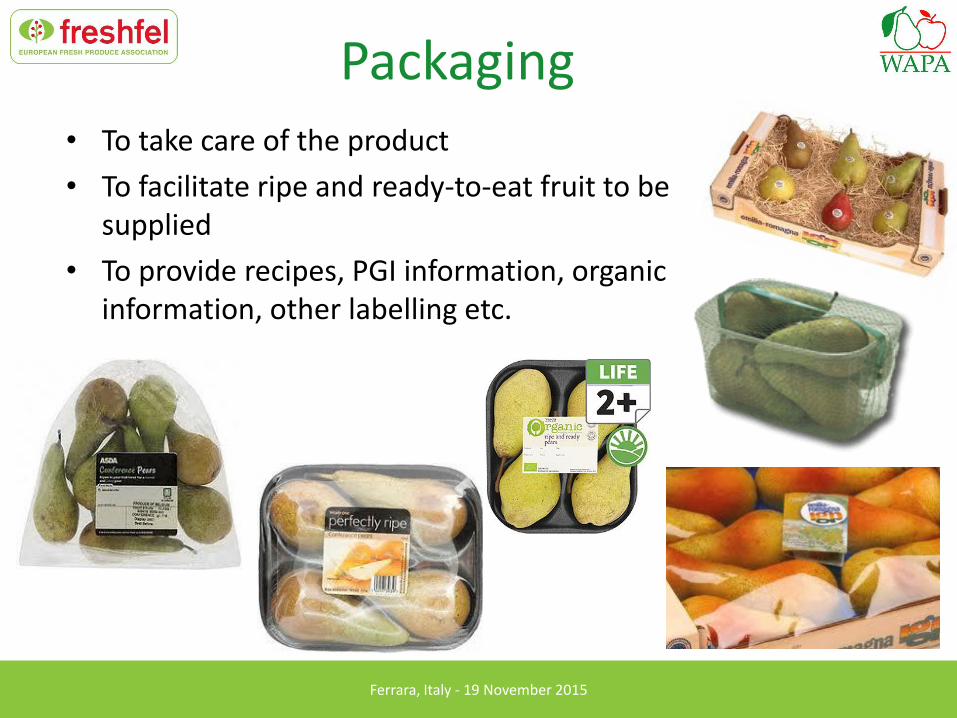
Packaging • To take care of the product
• To facilitate ripe and ready-to-eat fruit to be supplied
• To provide recipes, PGI information, organic information, other labelling etc.
Ferrara, Italy - 19 November 2015
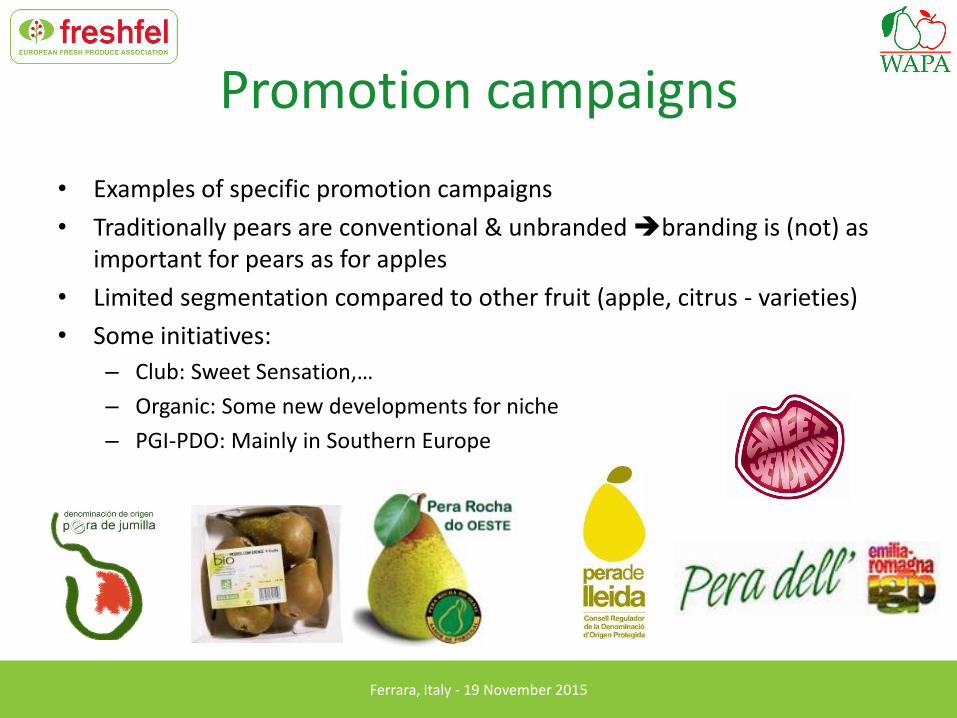
Promotion campaigns
• Examples of specific promotion campaigns
• Traditionally pears are conventional & unbranded branding is (not) as important for pears as for apples
• Limited segmentation compared to other fruit (apple, citrus - varieties)
• Some initiatives:
– Club: Sweet Sensation,…
– Organic: Some new developments for niche
– PGI-PDO: Mainly in Southern Europe
Ferrara, Italy - 19 November 2015
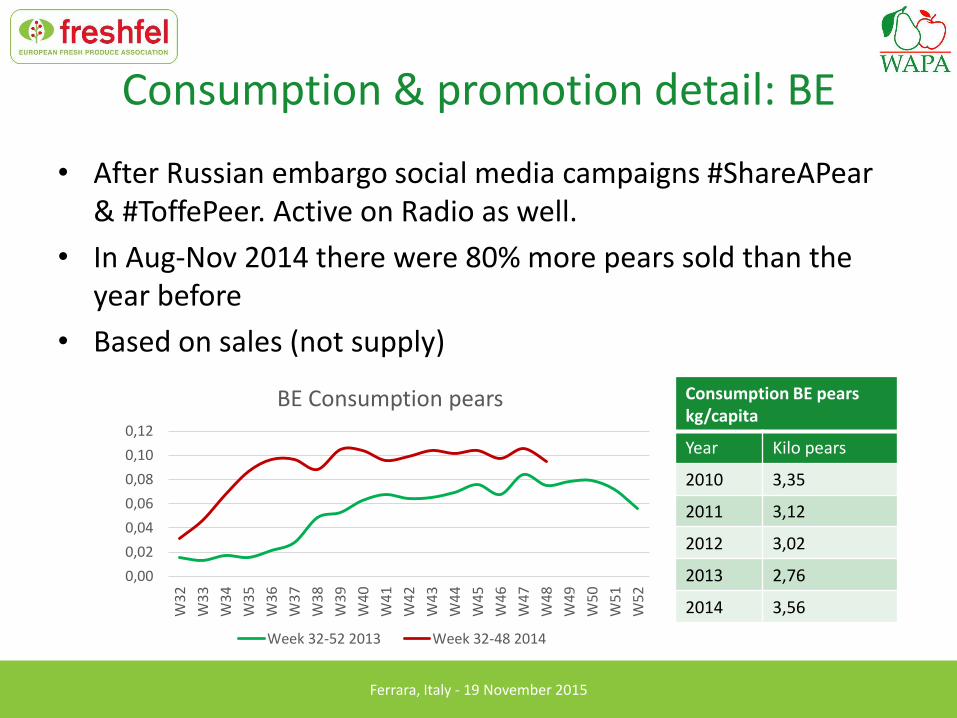
Consumption & promotion detail: BE
• After Russian embargo social media campaigns #ShareAPear & #ToffePeer. Active on Radio as well.
• In Aug-Nov 2014 there were 80% more pears sold than the year before
• Based on sales (not supply)
Consumption BE pears kg/capita
Year Kilo pears
2010 3,35
2011 3,12
2012 3,02
2013 2,76
2014 3,56
0,00
0,02
0,04
0,06
0,08
0,10
0,12
W32
W33
W34
W35
W36
W37
W38
W39
W40
W41
W42
W43
W44
W45
W46
W47
W48
W49
W50
W51
W52
BE Consumption pears
Week 32-52 2013 Week 32-48 2014
Ferrara, Italy - 19 November 2015
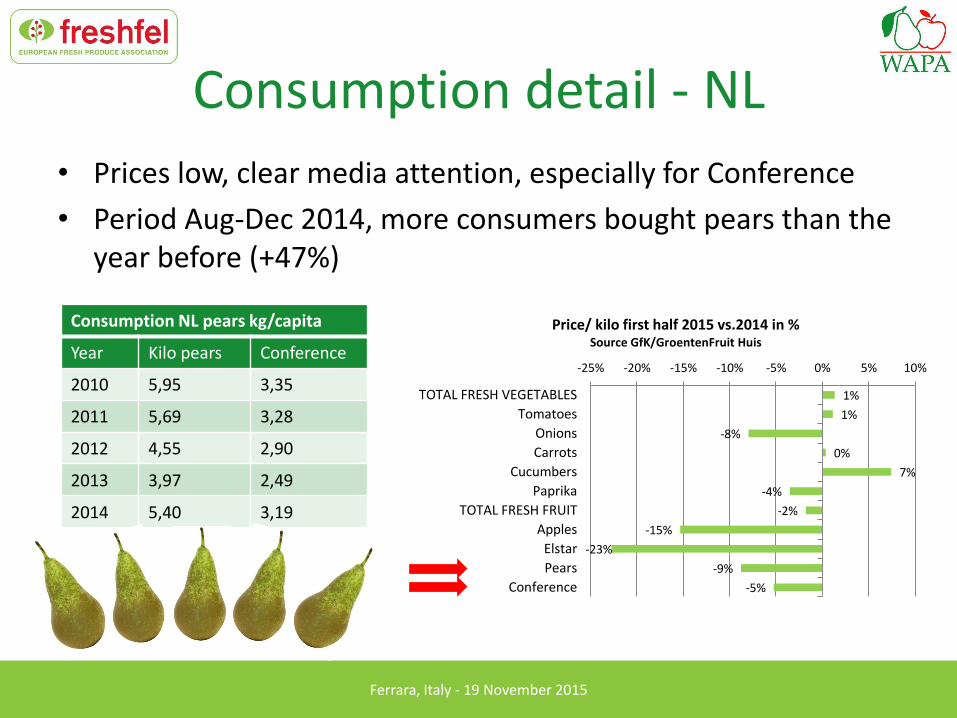
Consumption detail - NL
• Prices low, clear media attention, especially for Conference
• Period Aug-Dec 2014, more consumers bought pears than the year before (+47%)
Consumption NL pears kg/capita
Year Kilo pears Conference
2010 5,95 3,35
2011 5,69 3,28
2012 4,55 2,90
2013 3,97 2,49
2014 5,40 3,19
1%
1%
-8%
0%
7%
-4%
-2%
-15%
-23%
-9%
-5%
-25% -20% -15% -10% -5% 0% 5% 10%
TOTAL FRESH VEGETABLES
Tomatoes
Onions
Carrots
Cucumbers
Paprika
TOTAL FRESH FRUIT
Apples
Elstar
Pears
Conference
Price/ kilo first half 2015 vs.2014 in % Source GfK/GroentenFruit Huis
Ferrara, Italy - 19 November 2015
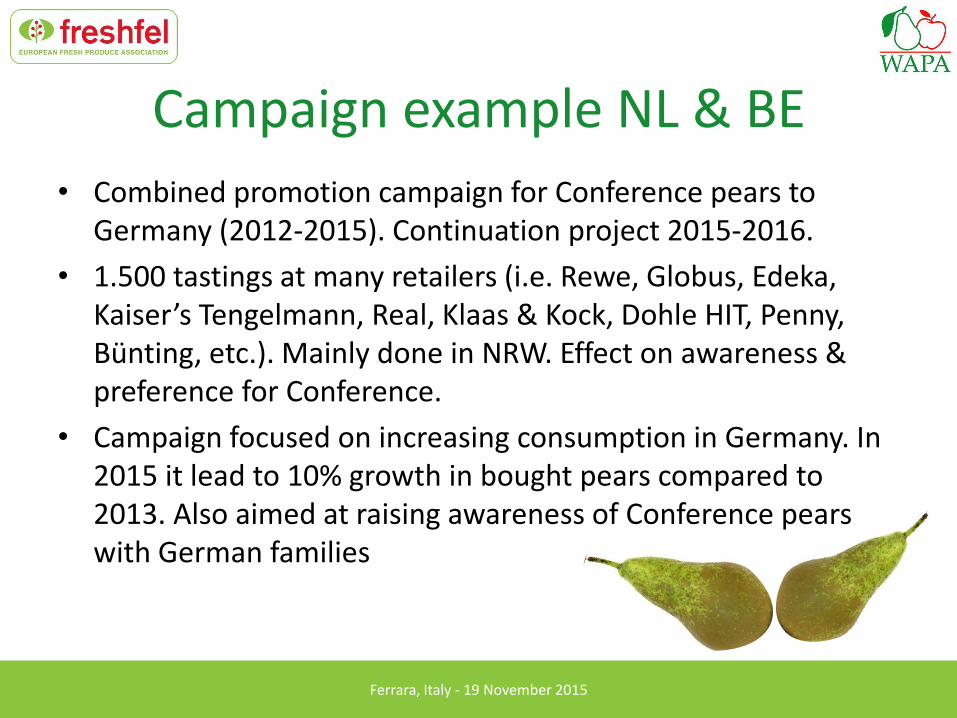
Campaign example NL & BE
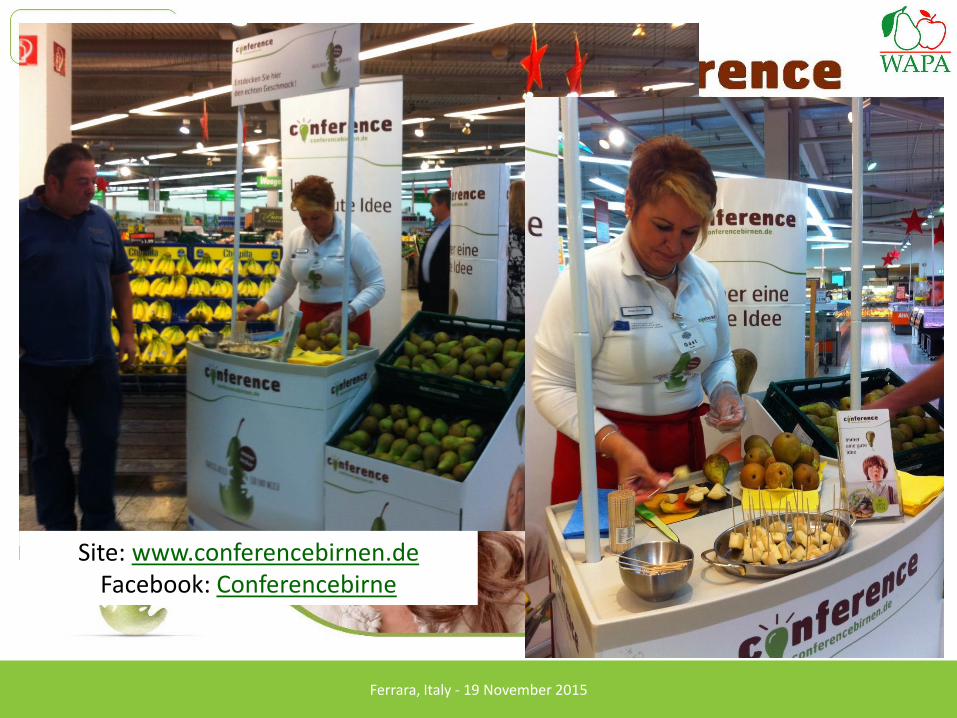
• Combined promotion campaign for Conference pears to Germany (2012-2015). Continuation project 2015-2016.
• 1.500 tastings at many retailers (i.e. Rewe, Globus, Edeka, Kaiser’s Tengelmann, Real, Klaas & Kock, Dohle HIT, Penny, Bünting, etc.). Mainly done in NRW. Effect on awareness & preference for Conference.
• Campaign focused on increasing consumption in Germany. In 2015 it lead to 10% growth in bought pears compared to 2013. Also aimed at raising awareness of Conference pears with German families
Ferrara, Italy - 19 November 2015
Site: www.conferencebirnen.de Facebook: Conferencebirne
Ferrara, Italy - 19 November 2015
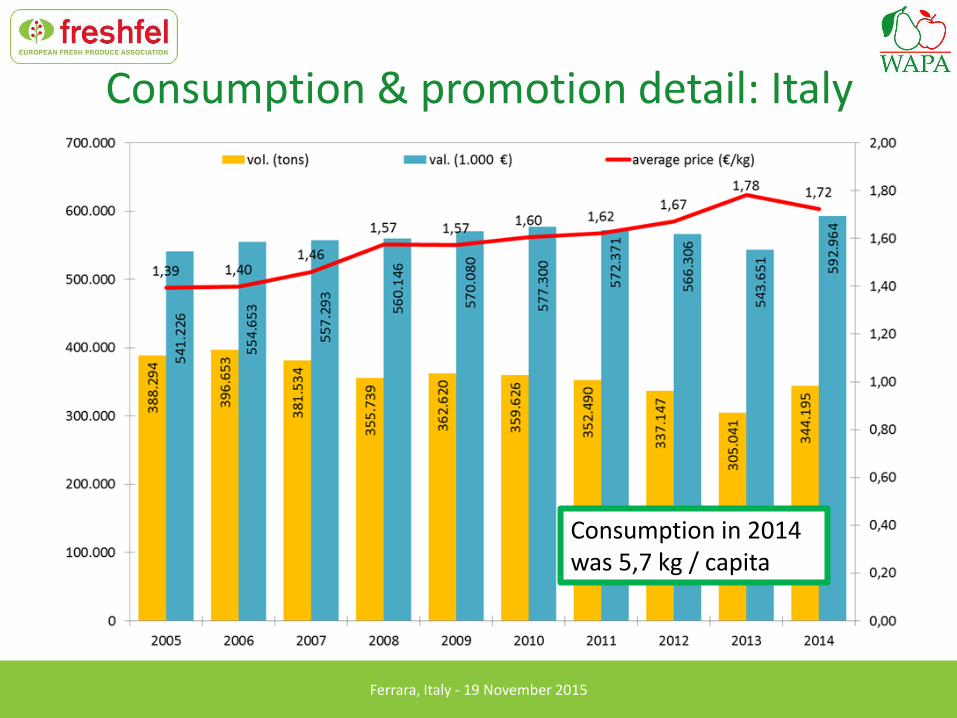
Consumption & promotion detail: Italy
Consumption in 2014 was 5,7 kg / capita
Ferrara, Italy - 19 November 2015
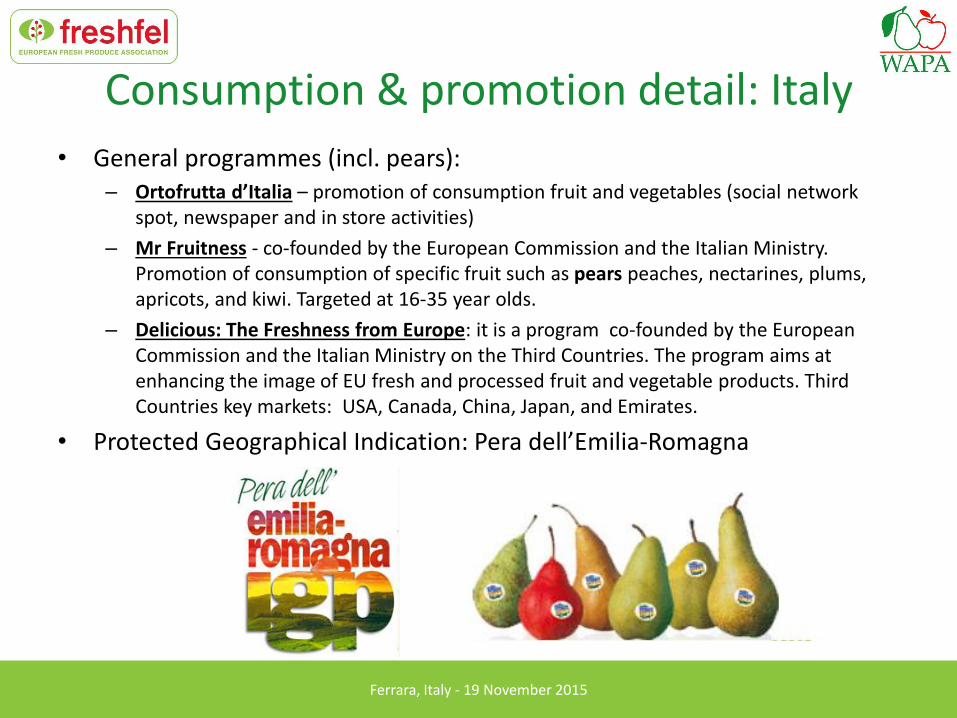
Consumption & promotion detail: Italy
• General programmes (incl. pears): – Ortofrutta d’Italia – promotion of consumption fruit and vegetables (social network
spot, newspaper and in store activities)
– Mr Fruitness - co-founded by the European Commission and the Italian Ministry. Promotion of consumption of specific fruit such as pears peaches, nectarines, plums, apricots, and kiwi. Targeted at 16-35 year olds.
– Delicious: The Freshness from Europe: it is a program co-founded by the European Commission and the Italian Ministry on the Third Countries. The program aims at enhancing the image of EU fresh and processed fruit and vegetable products. Third Countries key markets: USA, Canada, China, Japan, and Emirates.
• Protected Geographical Indication: Pera dell’Emilia-Romagna
Ferrara, Italy - 19 November 2015
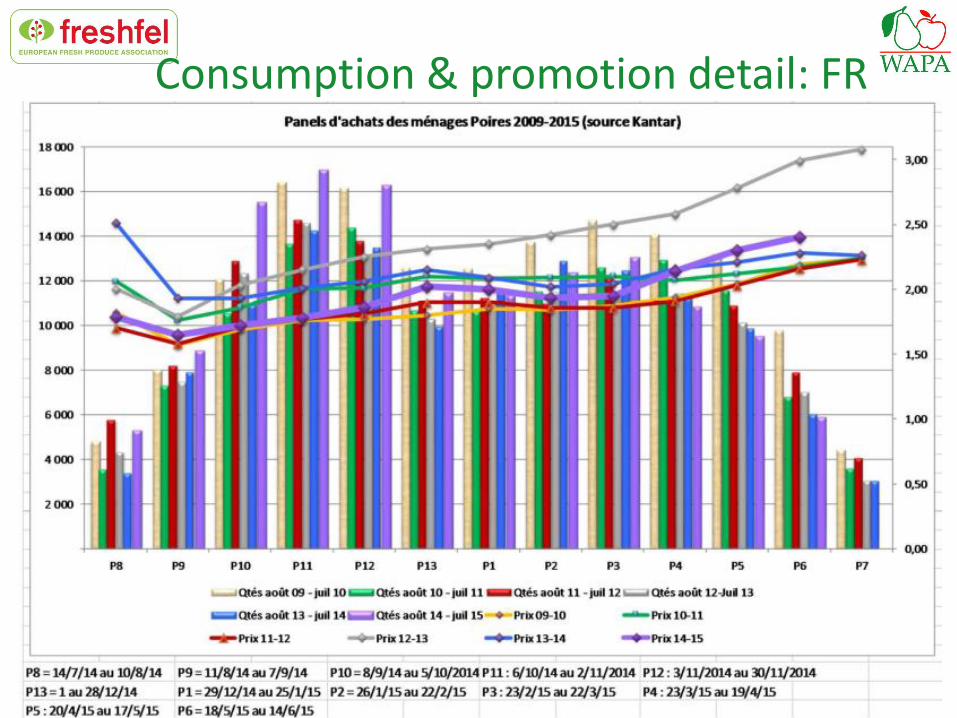
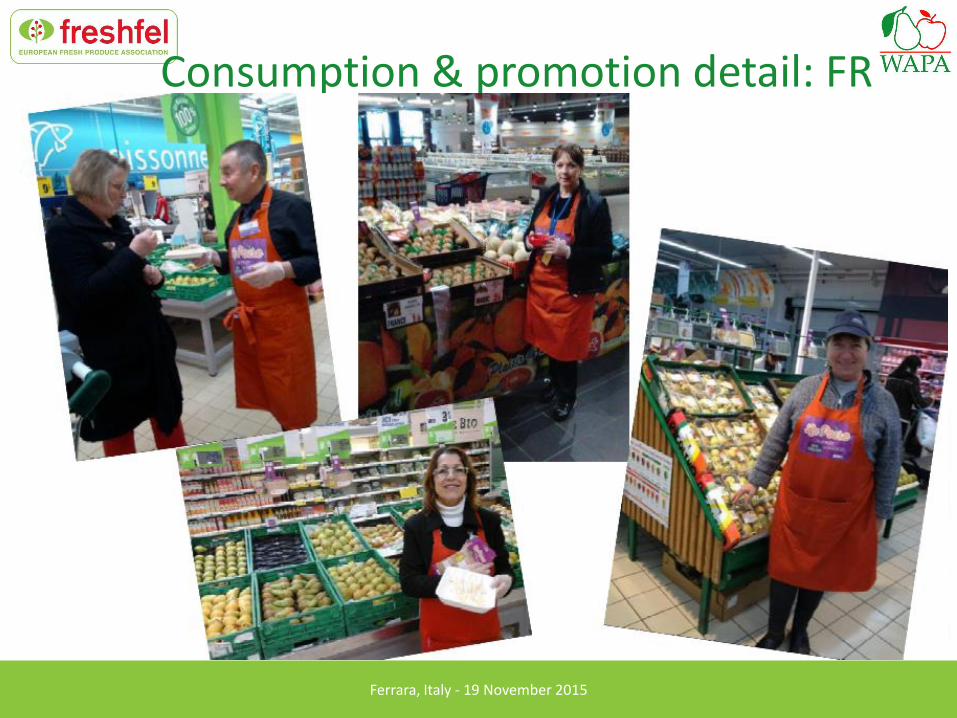
Consumption & promotion detail: FR
• Household overview: clear increase during season 2014-2015
Ferrara, Italy - 19 November 2015
Consumption & promotion detail: FR
• Promotion programme for summer and winter pears – Summer pears (for Guyot and Williams): point of sale
promotion, tasting and flyers etc. for 105 days in 62 retailers. Caused an increase in sales of about 10-50%
– Autumn/ Winter pears (for Comice, Conférence, Passe Crassane, Angélys and Sweet Sensation): point of sale promotion, tasting and flyers etc. for 195 days
– Overvall very good feedback from the stores and from the consumers.
Ferrara, Italy - 19 November 2015
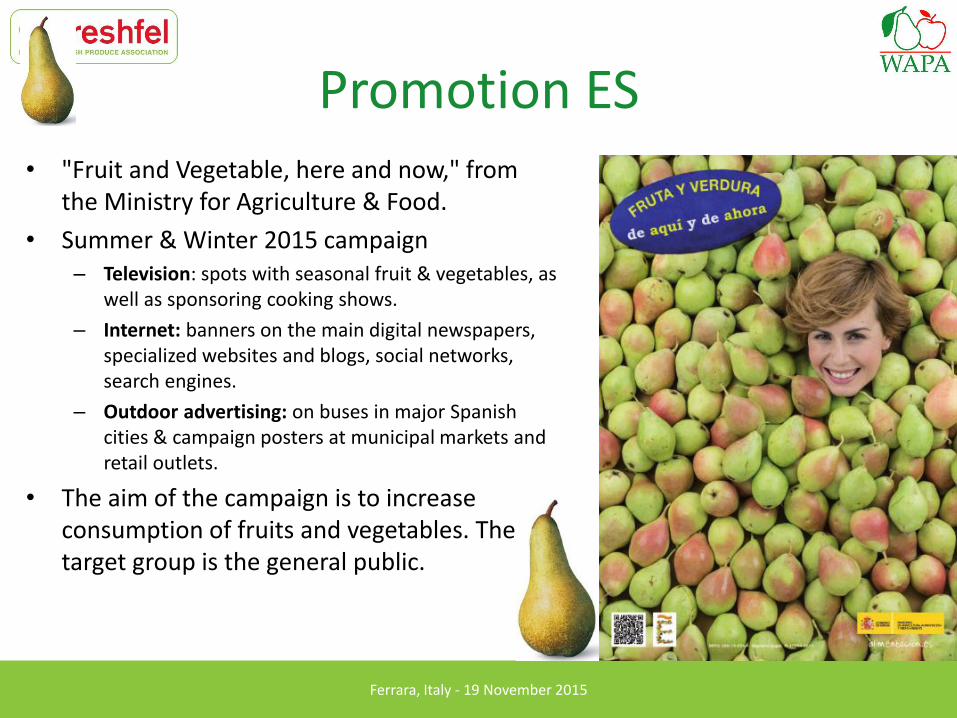
Promotion ES • "Fruit and Vegetable, here and now," from
the Ministry for Agriculture & Food.
• Summer & Winter 2015 campaign – Television: spots with seasonal fruit & vegetables, as
well as sponsoring cooking shows.
– Internet: banners on the main digital newspapers, specialized websites and blogs, social networks, search engines.
– Outdoor advertising: on buses in major Spanish cities & campaign posters at municipal markets and retail outlets.
• The aim of the campaign is to increase consumption of fruits and vegetables. The target group is the general public.
Ferrara, Italy - 19 November 2015
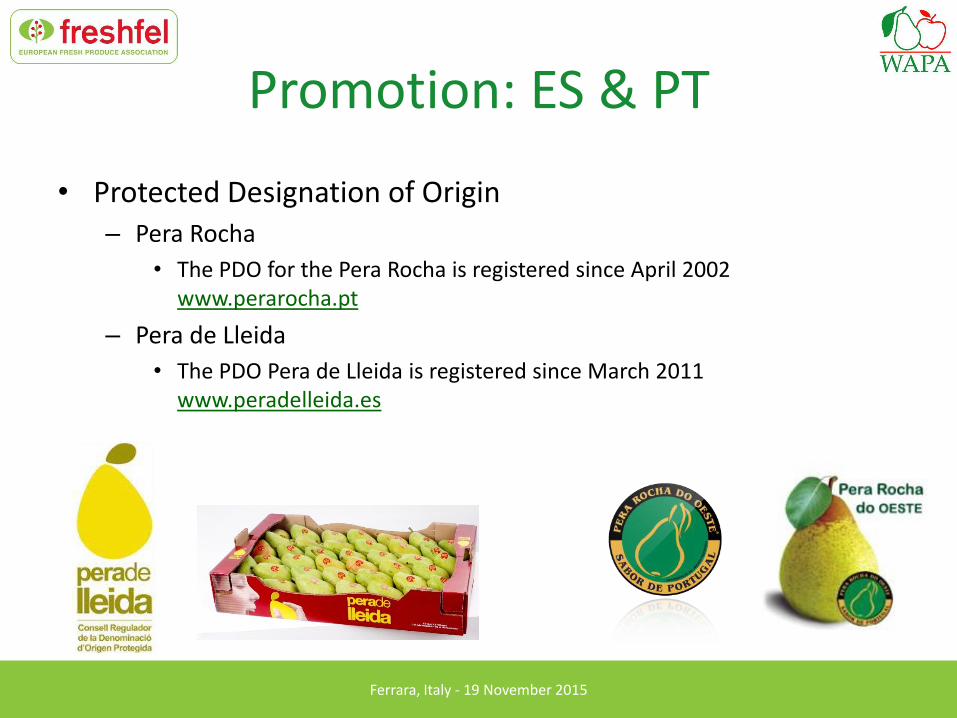
Promotion: ES & PT
• Protected Designation of Origin – Pera Rocha
• The PDO for the Pera Rocha is registered since April 2002 www.perarocha.pt
– Pera de Lleida
• The PDO Pera de Lleida is registered since March 2011 www.peradelleida.es
Ferrara, Italy - 19 November 2015
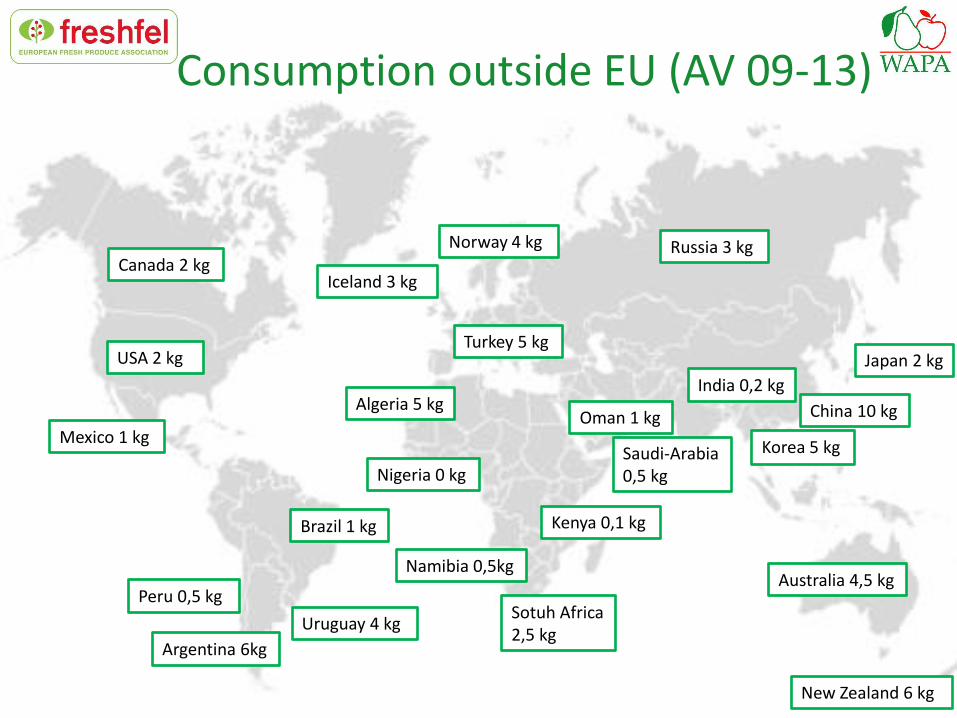
Consumption outside EU (AV 09-13)
Algeria 5 kg
Japan 2 kg
Argentina 6kg
China 10 kg
Canada 2 kg
USA 2 kg
Uruguay 4 kg
Turkey 5 kg
Sotuh Africa 2,5 kg
Saudi-Arabia 0,5 kg
Russia 3 kg
Oman 1 kg
Norway 4 kg
New Zealand 6 kg
Australia 4,5 kg Peru 0,5 kg
Mexico 1 kg Korea 5 kg
India 0,2 kg
Iceland 3 kg
Brazil 1 kg
Nigeria 0 kg
Namibia 0,5kg
Kenya 0,1 kg
Ferrara, Italy - 19 November 2015
Thank you for your attention! World Apple and Pear Association (WAPA)
+ 32 (0) 2 777 15 80
www.wapa-association.org
Freshfel Europe
+ 32 (0) 2 777 15 80
www.freshfel.org