Greet Janssens-Maenhout, Diego Guizzardi, Monica Crippa ... · Greet Janssens-Maenhout, Diego...
7
HTAP_v2 global anthropogenic emission gridmaps for air pollution models: Trade-off between regional specificity and global consistency Greet Janssens-Maenhout, Diego Guizzardi, Monica Crippa, Marilena Muntean, Frank Dentener, George Pouliot, Terry Keating, Qiang Zhang, Jun-ichi Kurokawa, Hugo Denier van der Gon Conclusions: o HTAPv2.2 provides detailed regional estimates of SO2, NOx, CO, NMVOC, NH3, PM10, PM2.5, BC and OC for 2008 and 2010 in monthly 0.1°x0.1° maps ! accounting for the fine spatial resolution and the regional expert information on implemented technologies and end-of-pipe measures o EDGARv4.3 provides insight on potentially assumed technologies/ emission factors/ end-of-pipe abatement implementation ! reveals differences with EMEP/EEA default emission factors o The EDGARv4.3 activity data provide temporal trends 1970-2010 (PEGASOS) ! policy hindcast scenarios to evaluate the climate impact of European air quality legislation over the past 4 decades.
-
Upload
phungxuyen -
Category
Documents
-
view
221 -
download
0
Transcript of Greet Janssens-Maenhout, Diego Guizzardi, Monica Crippa ... · Greet Janssens-Maenhout, Diego...
HTAP_v2 global anthropogenic emission gridmaps for air pollution models: Trade-off between regional specificity and global consistency
Greet Janssens-Maenhout, Diego Guizzardi, Monica Crippa, Marilena Muntean, Frank Dentener, George Pouliot, Terry Keating, Qiang Zhang, Jun-ichi Kurokawa, Hugo Denier van der Gon
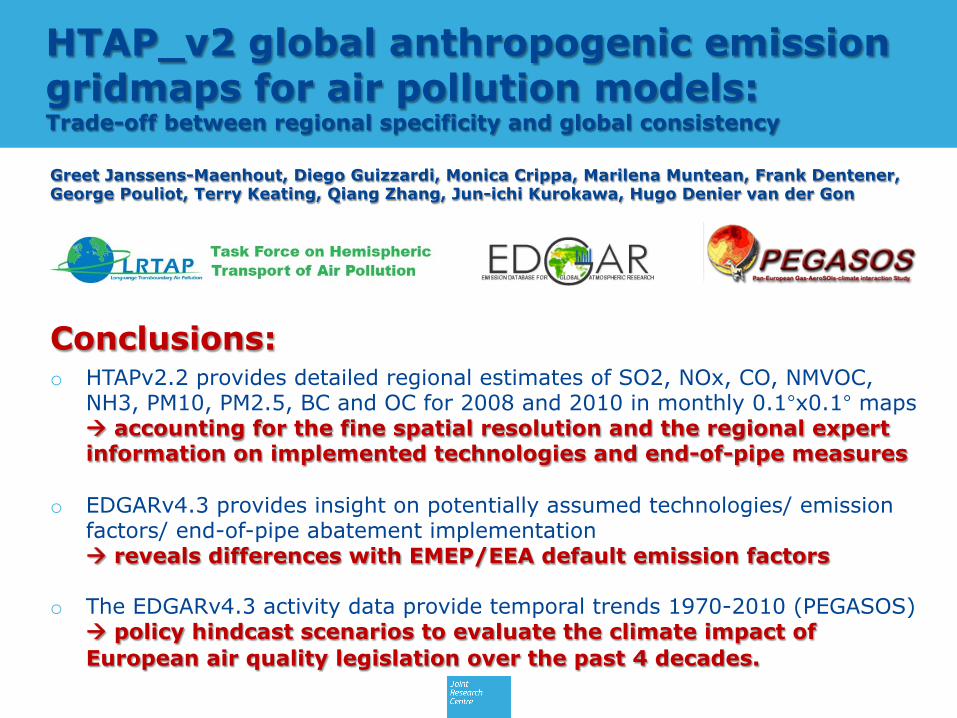
Conclusions:
o HTAPv2.2 provides detailed regional estimates of SO2, NOx, CO, NMVOC, NH3, PM10, PM2.5, BC and OC for 2008 and 2010 in monthly 0.1°x0.1° maps ! accounting for the fine spatial resolution and the regional expert information on implemented technologies and end-of-pipe measures
o EDGARv4.3 provides insight on potentially assumed technologies/ emission factors/ end-of-pipe abatement implementation ! reveals differences with EMEP/EEA default emission factors
o The EDGARv4.3 activity data provide temporal trends 1970-2010 (PEGASOS) ! policy hindcast scenarios to evaluate the climate impact of European air quality legislation over the past 4 decades.

HTAP_v2.2 rationale & compilation
Online: final version HTAP_v2.2 of 18/12/13 on ftp://[email protected] or http://edgar.jrc.ec.europa.eu/htap_v2/index.php?SECURE=123 or ECCAD Used by the TF HTAP modellers community to estimate air pollution impacts Remarks: o Only complete countries/ complete speciation from “official” inventories included. o Sector-specific gapfilling was done occasionally (e.g. EMEP-TNO) o Special allocation of point-sources at borders needed for deriving country totals
(e.g. Power Plants)
HTAPv2.2= harmonised mosaic of official & semi-official 0.1°x0.1° monthly gridmaps, gapfilled for global coverage
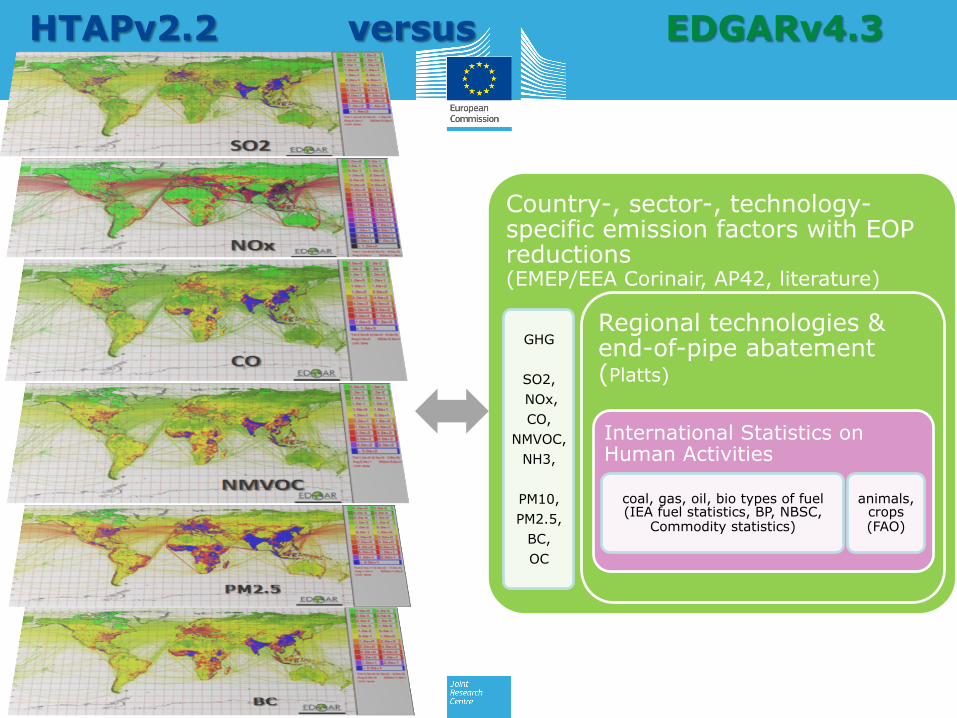
HTAPv2.2 versus EDGARv4.3
EOP reductions
Country-, sector-, technology-specific emission factors with EOP reductions (EMEP/EEA Corinair, AP42, literature)
GHG
SO2, NOx, CO,
NMVOC, NH3,
PM10, PM2.5,
BC, OC
Regional technologies & end-of-pipe abatement (Platts)
International Statistics on Human Activities
coal, gas, oil, bio types of fuel (IEA fuel statistics, BP, NBSC,
Commodity statistics)
animals, crops (FAO)

Intercomparison HTAP_v2.2 A.P.
EDGAR_v4.3 MACCity Klimont et al. (2013)

HTAP_v2.2 aerosols: global per capita analysis
Industrialized countries
(I)
Countries with
Emerging Economy
(E)
Developing Countries
(D)
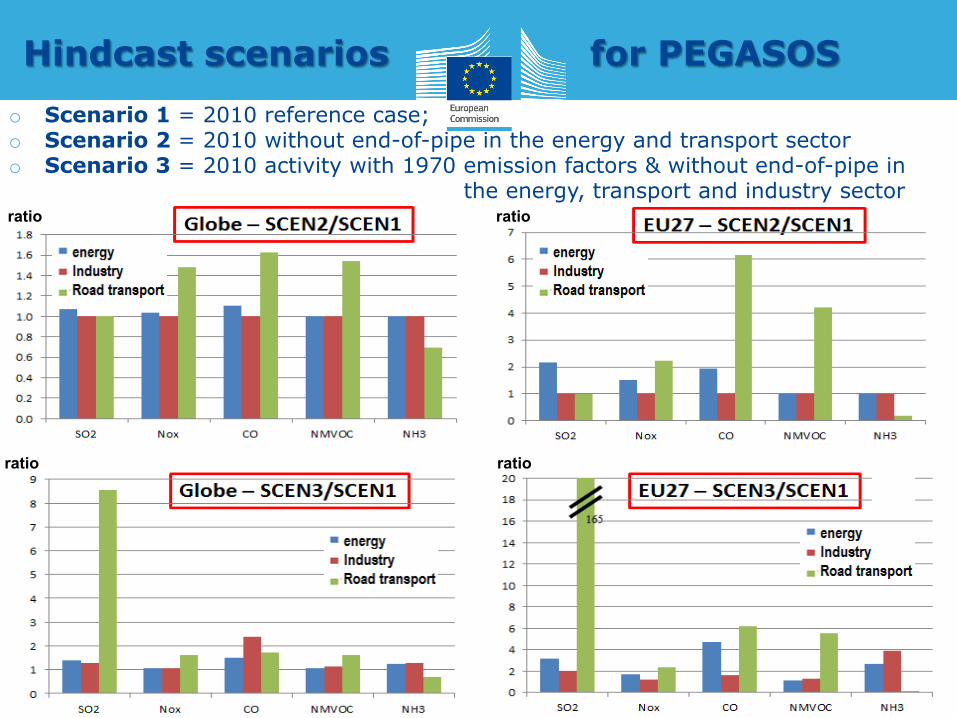
Hindcast scenarios for PEGASOS
o Scenario 1 = 2010 reference case; o Scenario 2 = 2010 without end-of-pipe in the energy and transport sector o Scenario 3 = 2010 activity with 1970 emission factors & without end-of-pipe in
the energy, transport and industry sector ratio
ratio
ratio
ratio
References
o Janssens-Maenhout et al (2014), HTAP_v2 report, No. JRC_90465, in review
o TNO & MACC dataset of TNO, cfr. Kuenen et al (2014), ACPD 14, 5837–5869, 2014
o MEIC dataset of Zhang and He, cfr. Lu et al (2011), ACP 11, 9839-9864, 2011
o REAS dataset of Kurokawa et al (2013), ACP 13, 11019-11058, 2013
o Extension of HTAP_v2 with Hg, which we’ll compare to the EDGARv4.tox1 of Muntean et al (2014), accepted by STOTEN (cfr. Poster session)
Also acknowledged: Katerina Sindelarova, Michael Schulz, Jeroen Kuenen, Aude Mieville, Greg Frost, Ann Kean and the users of HTAP_v2 who sent feedback