
Greening The concretre Jungle Rodjio.pdf · Green Vision of Ascendas Ascendas takes a holistic view...
41
9 th October 2013 By Ero Rodjio Ascendas Services Pte Ltd Greening the Concrete Jungle
Transcript of Greening The concretre Jungle Rodjio.pdf · Green Vision of Ascendas Ascendas takes a holistic view...

9th October 2013
By Ero Rodjio
Ascendas Services Pte Ltd
Greening the Concrete Jungle

Contents
1. Getting to know Ascendas
2. Green vision of Ascendas
3. Walk the talk
4. Our success story

Getting to know Ascendas

Getting to know Ascendas

Getting to know Ascendas
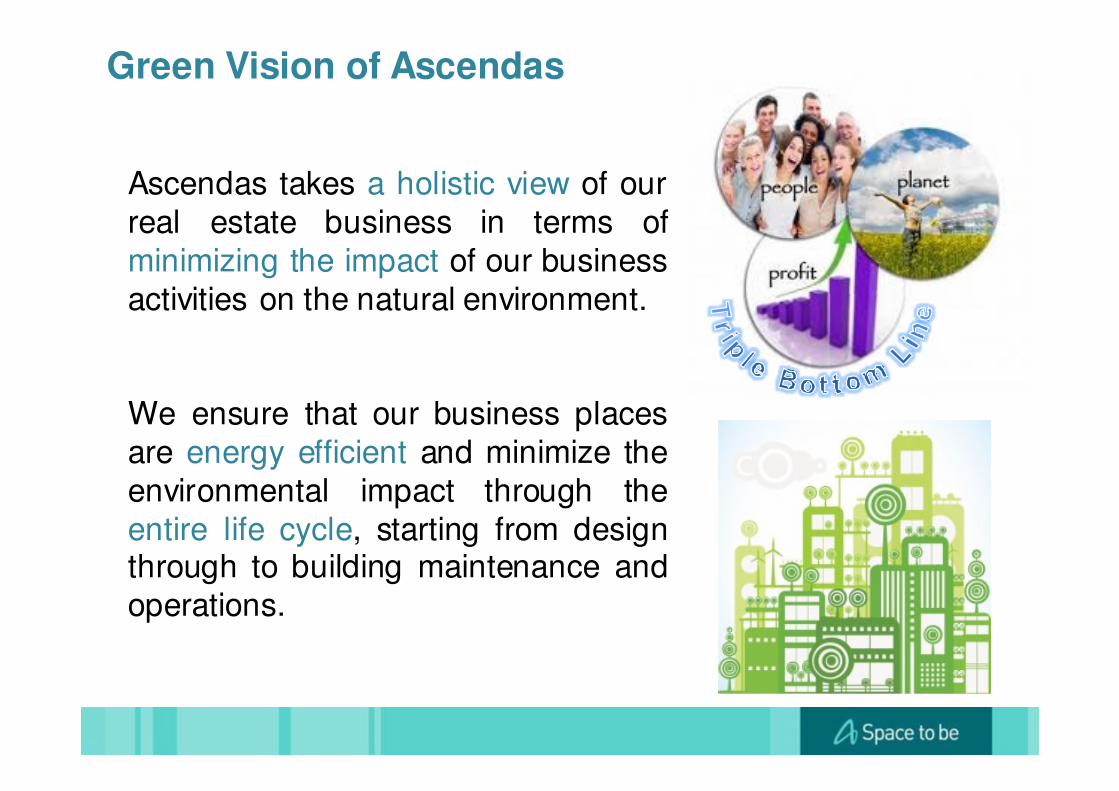
Green Vision of Ascendas
Ascendas takes a holistic view of our
real estate business in terms of
minimizing the impact of our business
activities on the natural environment.
We ensure that our business places
are energy efficient and minimize the
environmental impact through the
entire life cycle, starting from designthrough to building maintenance and
operations.

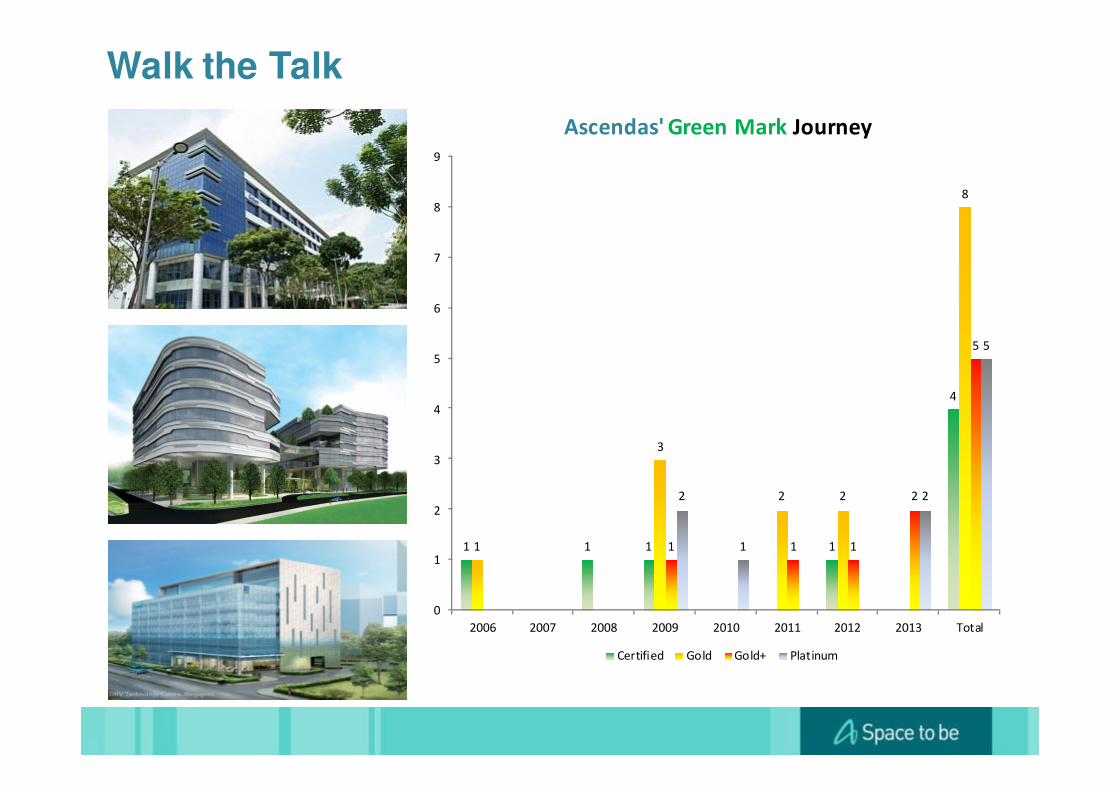
Walk the Talk
• Reduce Energy Consumption
• Improve Space’s Comfort and Health
Commitment
• Air-Cool Chiller
• Old and Inefficient Water-
cool Chiller
• Large Capacity and Long Hours
• High Maintenance Cost
Selection
• Payback Period
• Li fe Cycle Cost
• Replacement at End of Li fe
Justification
• Measured Plant Efficiency
• Calculated Energy Saving
Verification

Walk the Talk
Walk the Talk
1 1 1 1
4
1
3
2 2
8
1 1 1
2
5
2
1
2
5
0
1
2
3
4
5
6
7
8
9
2006 2007 2008 2009 2010 2011 2012 2013 Total
Ascendas' Green Mark Journey
Certified Gold Gold+ Platinum
Our Success Storyat Acer Building

Walk the Talk
• Reduce Energy Consumption
• Improve Space’s Comfort and Health
Commitment
• Air-Cool Chiller
• Old and Inefficient Water-
cool Chiller: 13 years
• Large Capacity and Long Hours
• High Maintenance Cost
Selection
• Payback Period: 6.7 years
• Li fe Cycle Cost
• Replacement at End of Li fe
Justification
• Measured Plant Efficiency: 0.55kW/RT
• Calculated Energy Saving
Verification

Background of Chiller Plant at Acer Building
o ACER BUILDING is located at 29
International Business Park,
Singapore 609923
o TOP in 1996
o A 8-storey tower interlinked by a 5
storey podium with 1 level of
basement carpark.
o Total GFA: 29,185 m2
o Total NLA: 21,226 m2
o Tenants’ operations: Business & Science Park, Retail, and
Ammenities.
o Peak cooling load demand: 686RT with 92% Occupancy
o Off-peak cooling load demand: 372RT

Description Capacity/Power Quantity Remark
Air-Cooled Chiller 200RT 6 Multiple Compressors
CHW Pump 7 Installed with VSD
Description Amount
Annual Energy Consumption (kWh) 2,585,860
Annual Cooling Load (RTh) 1,447,509
Average Annual Chiller Plant Efficiency (kW/RT) 1.786
Annual Chiller Plant Energy Cost (S$) 517,172
Background of Old Chiller Plant at Acer Building
0
1
2
3
4
5
6
0:0
0
0:4
5
1:3
0
2:1
5
3:0
0
3:4
5
4:3
0
5:1
5
6:0
0
6:4
5
7:3
0
8:1
5
9:0
0
9:4
5
10
:30
11
:15
12
:00
12
:45
13
:30
14
:15
15
:00
15
:45
16
:30
17
:15
18
:00
18
:45
19
:30
20
:15
21
:00
21
:45
22
:30
23
:15
0:0
0
# o
f ru
nn
ing
ch
ille
r
Chiller Operation Schedule
Weekday Weekend

Existing Air-cooled Chiller Plant at Acer Building

Description Audit’s Findings
Chiller Each chiller has 7 multiple compressors. 24 compressors were
running out of available 35 compressors when operating 5
chillers during peak load.
CHW Pump 5 numbers of CHW pump were running
CHW Flow Rate Excess flow rate due to 5 number of pumps were running.
CHW ΔT Low ΔT due to excess flow rate
Background of Old Chiller Plant at Acer Building
RECOMMENDATIONS;
1. Replace the Air-Cooled Chiller system to Water-Cooled Chiller system.
2. Optimize selection of chiller’s capacity.
3. Install precision chiller plant monitoring and control system
4. Install auto tube cleaning system
5. Modification of piping work to minimized pressure drop in the water
distribution system
6. Minimized chiller’s enclosure to prevent additional GFA
7. Optimize the plant to achieve efficiency of 0.59 kW/RT

Description Capacity/Power Quantity Remark
Chiller 500 RT 3 Centrifugal
CHW Pump 18.5 kW 3 Horizontal Split
Case
CDW Pump 18.5 kW 3 Horizontal Split
Case
Cooling Tower 7.5 kW 8 Crossflow
Summary of New Chiller Plant at Acer Building

New Water-cooled Chiller Plant (1/4)
Chiller
Cooling Towers
Chilled water Pump
Condenser water Pump
Electrical Panels
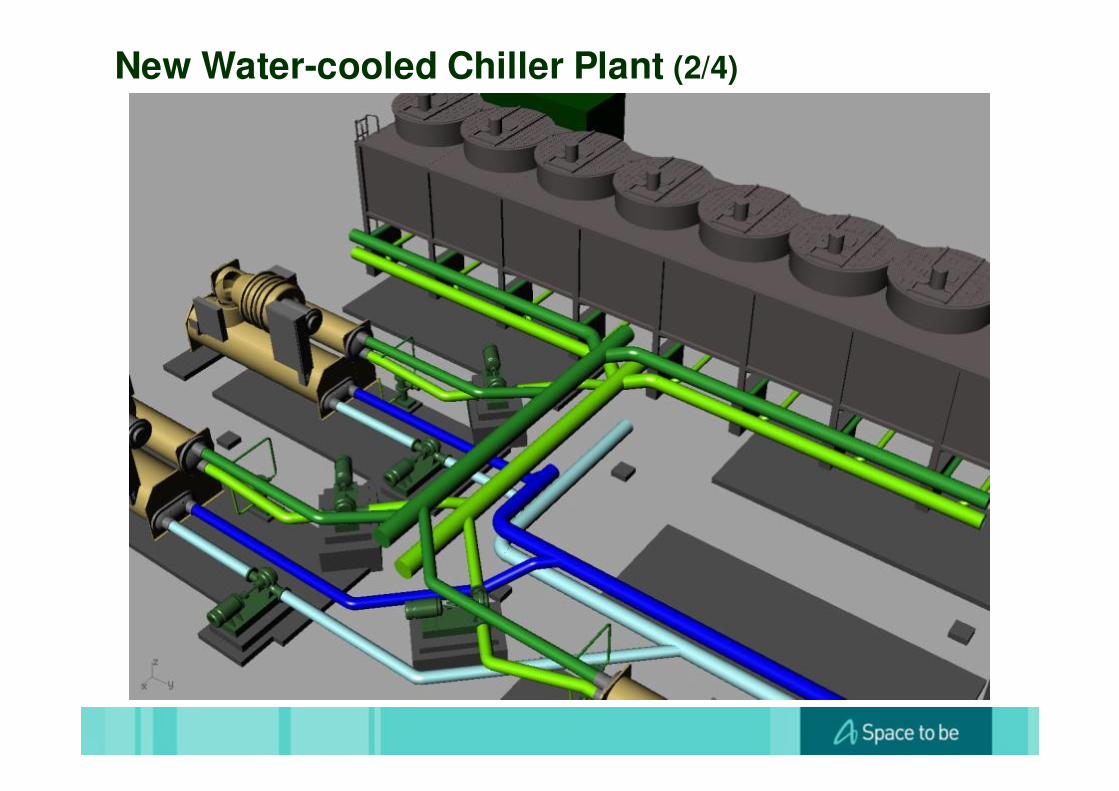
New Water-cooled Chiller Plant (2/4)

New Water-cooled Chiller Plant (3/4)

New Water-cooled Chiller Plant (4/4)

Challenges encountered during construction

Challenges During Construction Period
1. Ensure 24/7 uninterrupted chilled water supply to tenants’
operations.
2. Building a new chilled water and condenser header to reduce
pressure drop along the distribution piping system.
3. Sequencing the chiller replacement is a challenge due to some of the existing air-cooled chillers were no longer in operation and were located in the middle of the plant room.
4. Removal of Trellis above the existing air cooled chillers.
5. Minimize noise and vibration generated during the construction period
6. Prevent damage to water proof system at the roof top
7. Limited floor loading on the ground floor to support a larger crane for
hoisting of equipment and materials (500-ton crane is needed)
8. Localized strengthening of floor slab at basement Car park.
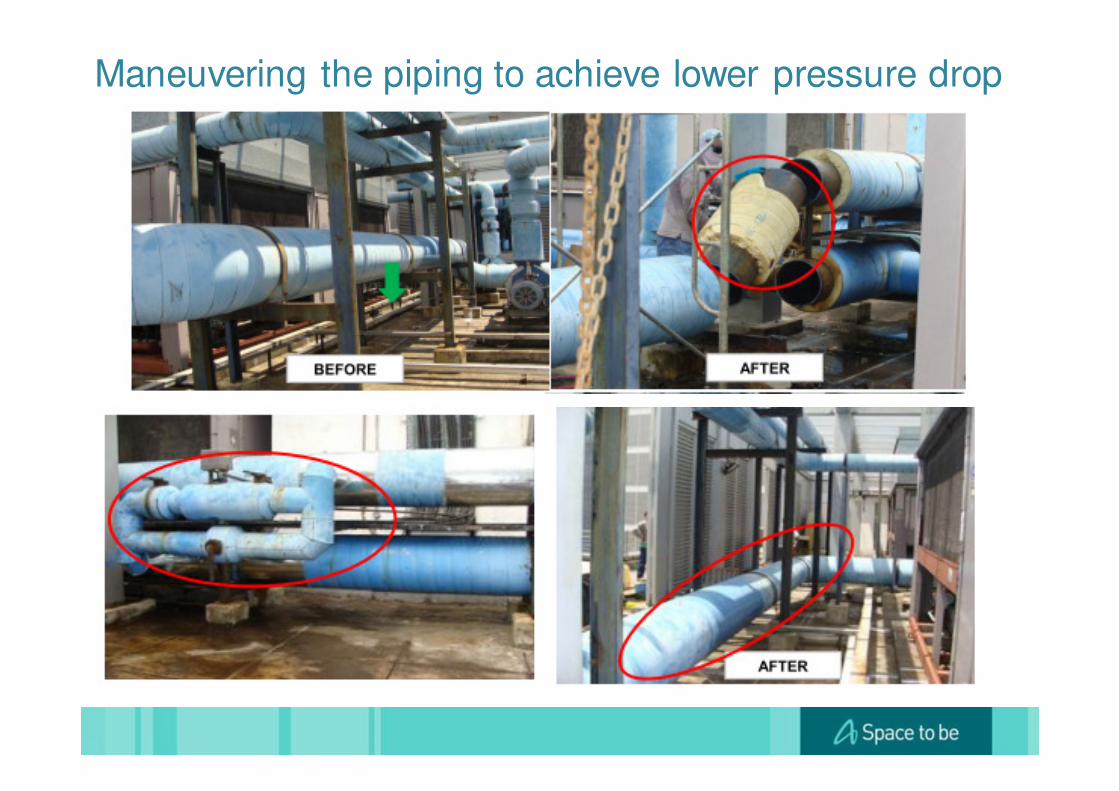
Maneuvering the piping to achieve lower pressure drop
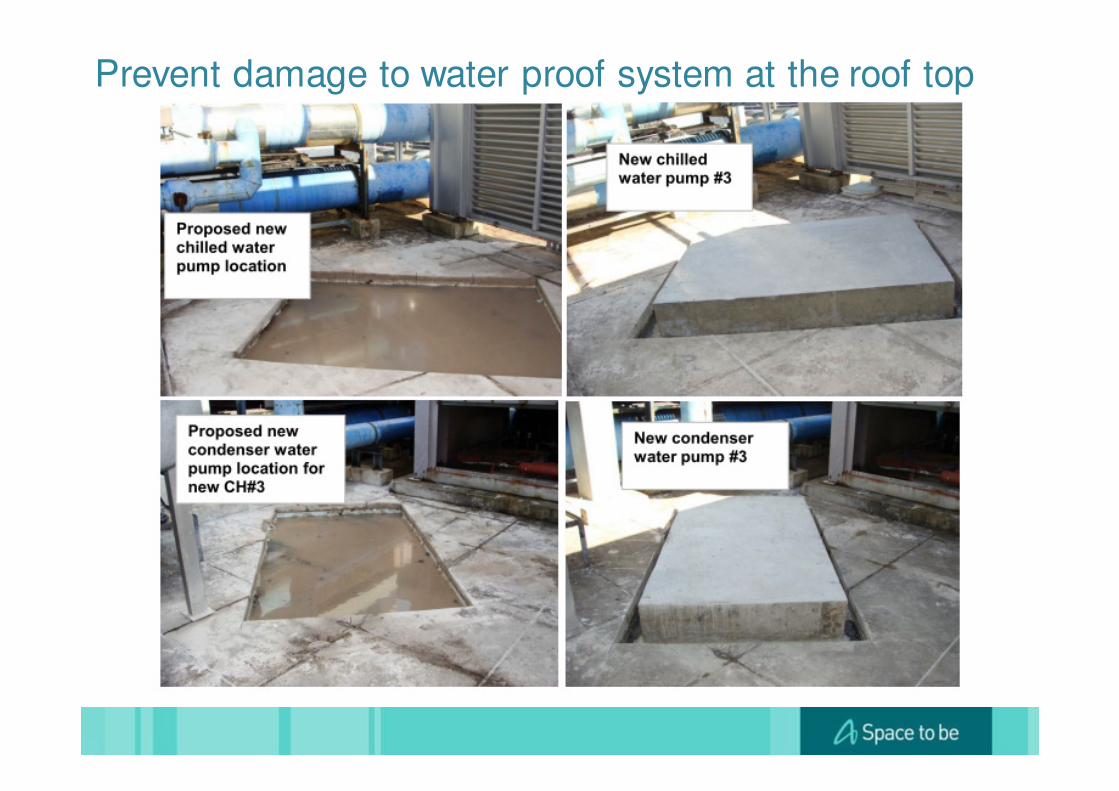
Prevent damage to water proof system at the roof top
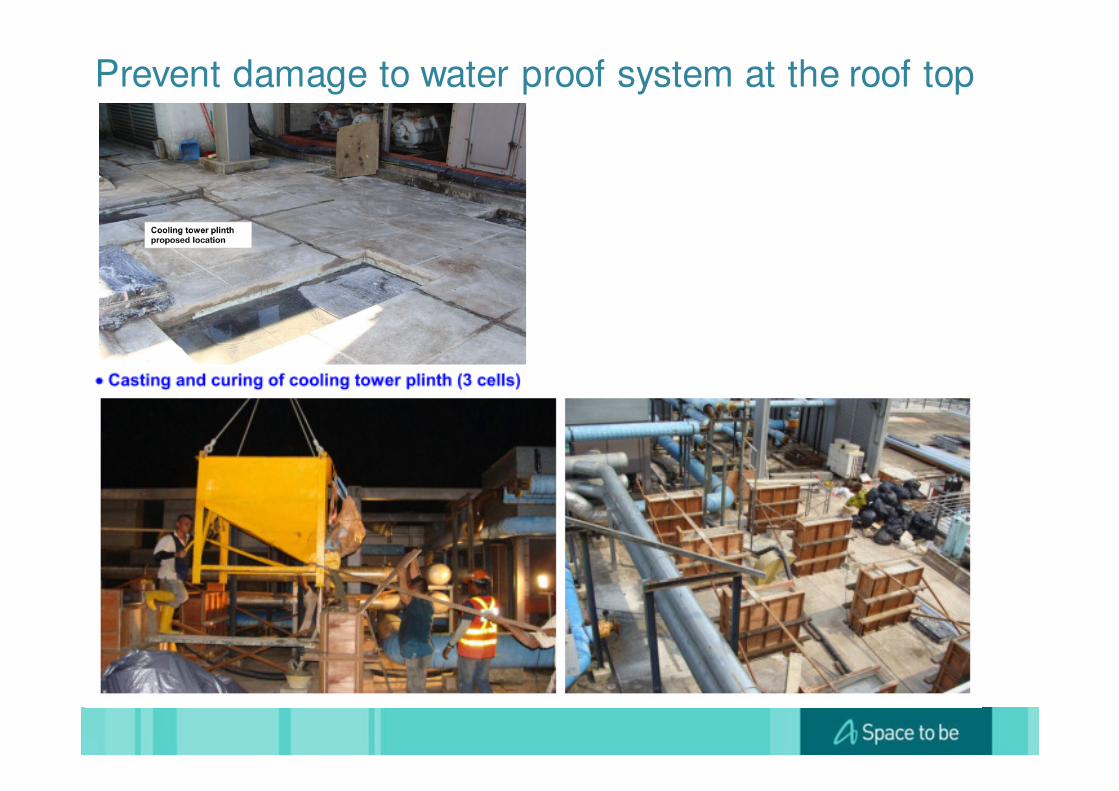
Prevent damage to water proof system at the roof top

Removal of the Trellis to allow hoisting of the Chillers

Providing Temporary Support for the 500TON Crane

Hoisting

Hoisting
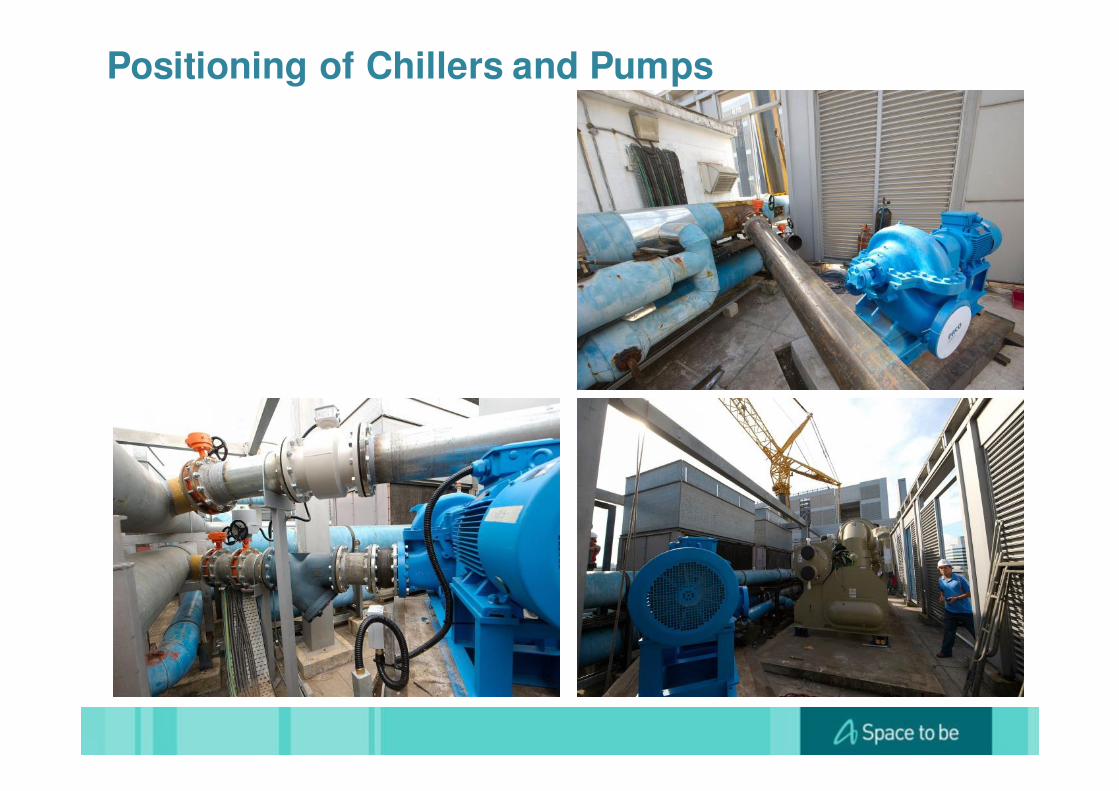
Positioning of Chillers and Pumps

Positioning of Chillers and Pumps

Verification of Result

Accurate and Reliable Energy Management System

Chiller Plant – BMS Control & Monitoring

Chiller Plant Efficiency Profile
0.500.550.600.650.700.750.800.850.900.951.001.051.101.151.201.251.301.351.401.451.501.551.601.651.701.751.801.851.90
Jan-13 Feb-13 Mar-13 Apr-13 May-13 Jun-13 Jul-13 Aug-13
Pla
nt
Eff
icie
ncy
(k
W/R
T)
Actual
Baseline
Target
Actual realized saving from
average plant efficiency of
1.786 kW/RT before to average
plant efficiency of 0.55 kW/RT
after the conversion from air-
cooled to water-cooled chiller
system
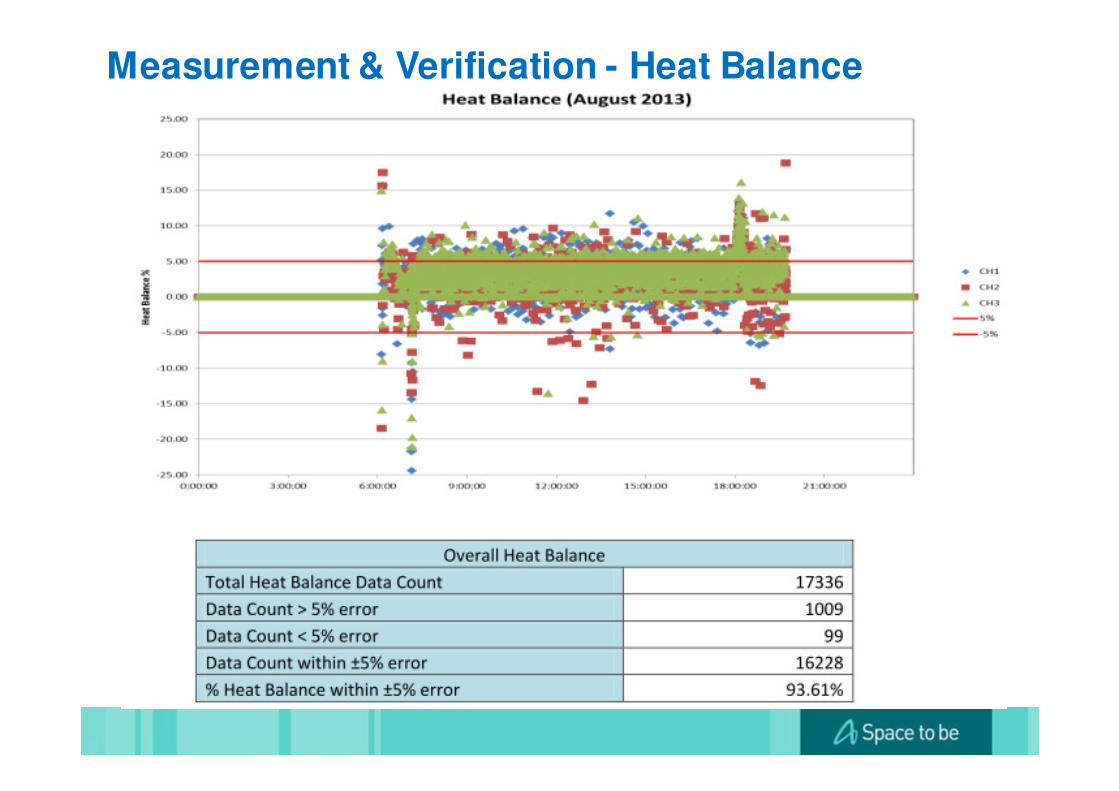
Measurement & Verification - Heat Balance

Benchmark of Chiller Plant Efficiency
Source: ASHRAE
Green Mark
Baseline
0.65kW/RT
Acer Chiller
Plant
0.55kW/RT

Summary of Achievements

Economical, Social and Environmental Impacts
Economy Impact
Annual Energy Saving of 1,771,758 kWh.
Annual Energy Cost Saving of S$299,720.
Payback period of 3.67 years with 50% GREET
fund.
Environmental Impact
Reduction of 864 metric tones of CO2 per year.
Social Impact
Job creation.
Skill Development.
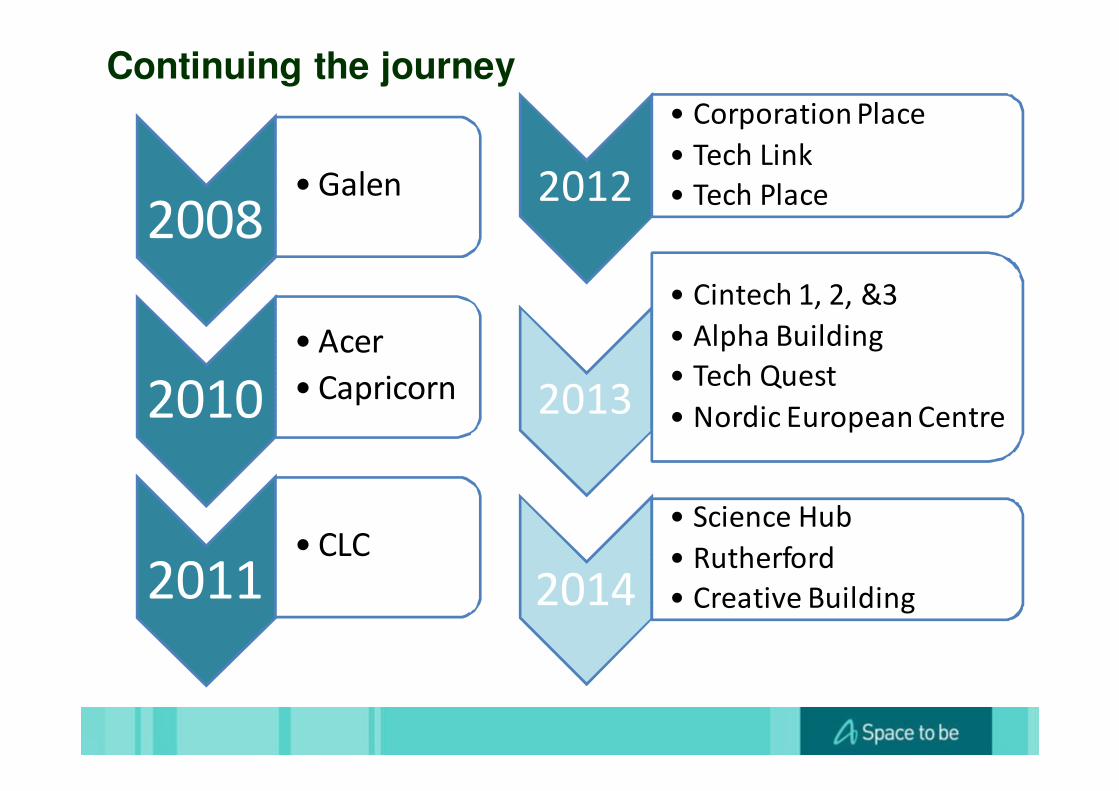
Continuing the journey
2008• Galen
2010• Acer
• Capricorn
2011• CLC
2012
• Corporation Place
• Tech Link
• Tech Place
2013
• Cintech 1, 2, &3
• Alpha Building
• Tech Quest
• Nordic European Centre
2014
• Science Hub
• Rutherford
• Creative Building

Q & A


