ASCENDAS INDIA TRUST Corporate Profile · ASCENDAS INDIA TRUST Corporate Profile Ascendas India...
24
a-iTrust Announcement of Results for the Financial Year Ended 31 March 2018 1 ASCENDAS INDIA TRUST Corporate Profile Ascendas India Trust (“a-iTrust” or the “Trust”) is a Singapore-listed business trust established with the principal objective of owning income-producing real estate used primarily as business space in India. a-iTrust may also acquire, hold and develop land or uncompleted developments to be used for business space with the objective of holding the properties upon completion. Although a-iTrust is a business trust, it has voluntarily adopted certain regulations governing Real Estate Investment Trusts (“REITs”) to enhance the stability of its distributions to unitholders. As at 31 March 2018, a-iTrust has a diversified portfolio of seven IT Parks and six operating warehouses across the primary IT and logistic centres of India, comprising: 1. International Tech Park Bangalore (“ITPB”); 2. International Tech Park Chennai (“ITPC”); 3. CyberVale, Chennai (“CyberVale”); 4. The V, Hyderabad (“The V”); 5. CyberPearl, Hyderabad (“CyberPearl”); 6. aVance Business Hub, Hyderabad (“aVance”); 7. Blueridge Special Economic Zone Phase II, Pune (“BlueRidge 2”); and 8. warehouses at Arshiya Free Trade Warehousing Zone, Panvel (“Arshiya Warehouses”). As at 31 March 2018, the portfolio comprises 12.8 million sq ft of completed properties. In addition, the Trust holds land with potential built-up area of 5.4 million sq ft. About Ascendas-Singbridge Group a-iTrust is managed by Ascendas Property Fund Trustee Pte. Ltd. (the “Trustee-manager”), which is part of Ascendas-Singbridge Group. Ascendas-Singbridge Group is Asia’s leading sustainable urban and business space solutions provider with Assets Under Management exceeding S$20 billion. Jointly owned by Temasek Holdings and JTC Corporation through a 51:49 partnership, the Group undertakes urbanisation projects spanning townships, mixed-use developments and business/industrial parks. Headquartered in Singapore, Ascendas-Singbridge has projects in 29 cities across 9 countries in Asia, including Australia, China, India, Indonesia, Singapore and South Korea. Ascendas-Singbridge holds commercial, hospitality and industrial assets across Asia Pacific. It has a substantial interest in and also manages three Singapore-listed funds under its subsidiary Ascendas, namely Ascendas Reit (a Straits Times Index component stock), Ascendas India Trust and Ascendas Hospitality Trust. Besides these listed funds, it also manages a series of private real estate funds. Functional and Reporting Currency a-iTrust’s functional currency is the Indian Rupee, which is the currency that its earnings are denominated in. The reporting currency for the Trust is Singapore Dollar as distribution to unitholders is made in Singapore Dollar. Income Available for Distribution As a business trust, a-iTrust computes distribution to unitholders based on cash flow generated from operations, rather than accounting profit. To derive the income available for distribution, adjustments are made to ordinary profit before tax to remove primarily non-cash accounting entries.
Transcript of ASCENDAS INDIA TRUST Corporate Profile · ASCENDAS INDIA TRUST Corporate Profile Ascendas India...

a-iTrust Announcement of Results for the Financial Year Ended 31 March 2018
1
ASCENDAS INDIA TRUST
Corporate Profile
Ascendas India Trust (“a-iTrust” or the “Trust”) is a Singapore-listed business trust established with the
principal objective of owning income-producing real estate used primarily as business space in India.
a-iTrust may also acquire, hold and develop land or uncompleted developments to be used for business
space with the objective of holding the properties upon completion. Although a-iTrust is a business trust,
it has voluntarily adopted certain regulations governing Real Estate Investment Trusts (“REITs”) to
enhance the stability of its distributions to unitholders.
As at 31 March 2018, a-iTrust has a diversified portfolio of seven IT Parks and six operating warehouses
across the primary IT and logistic centres of India, comprising:
1. International Tech Park Bangalore (“ITPB”);
2. International Tech Park Chennai (“ITPC”);
3. CyberVale, Chennai (“CyberVale”);
4. The V, Hyderabad (“The V”);
5. CyberPearl, Hyderabad (“CyberPearl”);
6. aVance Business Hub, Hyderabad (“aVance”);
7. Blueridge Special Economic Zone Phase II, Pune (“BlueRidge 2”); and
8. warehouses at Arshiya Free Trade Warehousing Zone, Panvel (“Arshiya Warehouses”).
As at 31 March 2018, the portfolio comprises 12.8 million sq ft of completed properties. In addition, the
Trust holds land with potential built-up area of 5.4 million sq ft.
About Ascendas-Singbridge Group
a-iTrust is managed by Ascendas Property Fund Trustee Pte. Ltd. (the “Trustee-manager”), which is part
of Ascendas-Singbridge Group. Ascendas-Singbridge Group is Asia’s leading sustainable urban and
business space solutions provider with Assets Under Management exceeding S$20 billion. Jointly owned
by Temasek Holdings and JTC Corporation through a 51:49 partnership, the Group undertakes
urbanisation projects spanning townships, mixed-use developments and business/industrial parks.
Headquartered in Singapore, Ascendas-Singbridge has projects in 29 cities across 9 countries in Asia,
including Australia, China, India, Indonesia, Singapore and South Korea. Ascendas-Singbridge holds
commercial, hospitality and industrial assets across Asia Pacific. It has a substantial interest in and also
manages three Singapore-listed funds under its subsidiary Ascendas, namely Ascendas Reit (a Straits
Times Index component stock), Ascendas India Trust and Ascendas Hospitality Trust. Besides these
listed funds, it also manages a series of private real estate funds.
Functional and Reporting Currency
a-iTrust’s functional currency is the Indian Rupee, which is the currency that its earnings are denominated
in. The reporting currency for the Trust is Singapore Dollar as distribution to unitholders is made in
Singapore Dollar.
Income Available for Distribution
As a business trust, a-iTrust computes distribution to unitholders based on cash flow generated from
operations, rather than accounting profit. To derive the income available for distribution, adjustments are
made to ordinary profit before tax to remove primarily non-cash accounting entries.

a-iTrust Announcement of Results for the Financial Year Ended 31 March 2018
2
Distribution Policy
a-iTrust’s policy is to distribute at least 90% of its income available for distribution. a-iTrust retains 10%
of its income available for distribution to provide greater flexibility in growing the Trust. a-iTrust makes
distributions to unitholders on a half-yearly basis for every six-month period ending 30 September and 31
March.
Executive Summary 1234
FY17/18 vs FY16/17
Total property income for the full year increased by 18% to ₹8.9 billion. This was mainly due to
incremental property income of ₹1,156 million from:
Victor, which was leased out in phases after development was completed in June 2016;
BlueRidge 2, which was acquired in February 2017;
1 Indian Rupee is defined herein as INR or ₹. 2 Distribution per unit. 3 Singapore Dollar is defined herein as SGD or S$. 4 Singapore Cent is defined herein as S₵.
INR1 Results FY17/18 Y-on-Y FY17/18 Y-on-Y
4Q Change Change
₹'000 % ₹'000 %
Total property income 2,406,424 15 8,943,237 18
Total property expenses (773,689) 8 (2,854,166) 12
Net property income 1,632,735 19 6,089,071 21
Income available for distribution 887,569 18 3,062,439 8
Income to be distributed 798,812 18 2,756,195 8
Income to be distributed (DPU2) (Indian Rupee) 0.81 12 2.91 6
SGD3 Results FY17/18 Y-on-Y FY17/18 Y-on-Y
4Q Change Change
S$'000 % S$'000 %
Total property income 49,312 12 188,152 20
Total property expenses (15,862) 4 (60,085) 15
Net property income 33,450 15 128,067 23
Income available for distribution 18,075 14 64,232 9
Income to be distributed 16,267 14 57,809 9
Income to be distributed (DPU) (S₵4) 1.65 8 6.10 7
Distribution details
Distribution period 14 February 2018 to 31 March 2018
Distribution amount 0.85 Singapore cents per unit
Ex-distribution date 9.00 am, 15 May 2018
Books closure date 5.00 pm, 17 May 2018
Payment date 25 May 2018
a-iTrust Announcement of Results for the Financial Year Ended 31 March 2018
3
aVance 4, which was acquired in April 2017;
Atria at The V, which was completed in September 2017;
Arshiya Warehouses, which were acquired in February 2018; and
positive rental reversions.
In SGD terms, total property income increased by 20% to S$188.2 million. The SGD depreciated by about
2% against the INR over the same period last year.
Total property expenses increased by 12% to ₹2.9 billion (S$60.1 million), mainly due to property
expenses from new properties.
As a result, net property income for FY17/18 grew by 21% to ₹6.1 billion. In SGD terms, net property
income grew by 23% to S$128.1 million.
Income available for distribution for FY17/18 grew by 8% to ₹3.1 billion. In SGD terms, income
available for distribution increased by 9% to S$64.2 million.
Income to be distributed (DPU) increased by 6% to ₹2.91. In SGD terms, DPU increased by 7% to 6.10
S₵, despite the increase in equity base of 97.4 million units through the private placement in February
2018.
4Q FY17/18 vs 4Q FY16/17
Total property income for the quarter ended 31 March 2018 (“4Q FY17/18”) increased by 15% to ₹2.4
billion due to:
income from Victor, which was leased out in phases after development was completed in June 2016;
income from BlueRidge 2, which was acquired in February 2017;
income from aVance 4, which was acquired in April 2017;
income from Atria at The V, which was completed in September 2017;
Arshiya Warehouses, which were acquired in February 2018; and
positive rental reversions.
In SGD terms, total property income increased by 12% to S$49.3 million. The SGD appreciated by about 3% against the INR over the same period last year.
Total property expenses for 4Q FY17/18 increased by 8% to ₹774 million (S$15.9 million) mainly due
to property expenses from new properties, offset by lower utilities expenses.
Net property income for 4Q FY17/18 increased by 19% to ₹1.6 billion due to the above factors. In SGD
terms, net property income grew by 15% to S$33.5 million.
Income available for distribution for 4Q FY17/18 increased by 18% to ₹888 million, mainly due to higher
net property income. In SGD terms, income available for distribution increased by 14% to S$18.1 million.
Income to be distributed (DPU) increased by 12% to ₹0.81. In SGD terms, DPU increased by 8% to
1.65 S₵, despite the increase in equity base of 97.4 million units through the private placement in
February 2018.

a-iTrust Announcement of Results for the Financial Year Ended 31 March 2018
4
Foreign Exchange Movement
The FX rate of ₹48.8:S$1 used in the income statement was the average rate for 4Q FY17/18. This
represented a year-on-year appreciation of the SGD against INR of about 3%.
The closing FX rate used in the balance sheet, as at 31 March 2018, was ₹49.5:S$1.
Operational and Financial Statistics
Committed portfolio occupancy was 95% as at 31 March 2018. The weighted average lease term and
weighted average lease expiry stood at 6.5 years and 4.5 years respectively. In FY17/18, the retention
rate was 72%5.
Gearing as at 31 March 2018 was 26% on a loan-to-value basis. Gearing is calculated by dividing
effective borrowings6 by the value of Trust properties. At 45% gearing limit, the debt headroom was
S$648.8 million.
Net Asset Value (“NAV”) per unit as at 31 March 2018 increased by 11% to S$0.90 as compared to 31
March 2017. Excluding deferred tax liabilities arising from fair value adjustments on properties, the
adjusted NAV per unit was S$1.15.
5 Excludes leases in The V that were affected by the redevelopment and/or consolidation in Atria building. The retention rate
would have been 70% if those terminations were included. 6 Calculated by adding/deducting derivative financial instruments liabilities/assets, entered to hedge SGD/JPY borrowings to INR,
to/from gross borrowings, including deferred consideration.
SGD/INR average rate for Income Statement SGD/INR closing rate for Balance Sheets as at
Jan Feb Mar Average 31-Mar-18 31-Mar-17 Change
4Q FY17/18 48.1 48.8 49.5 48.8 49.5 46.7 5.9%
4Q FY16/17 47.6 47.4 46.9 47.3
Y-on-Y Change 3.2%
Oct Nov Dec Average
3Q FY17/18 47.6 47.8 47.6 47.7
Q-on-Q Change 2.3%
FY17/18 FY16/17 Change
YTD Average 47.5 48.5 -2.1%

a-iTrust Announcement of Results for the Financial Year Ended 31 March 2018
5
Physical Occupancy Committed Leases
^ Includes committed leases which will commence after 31 March 2018. # Does not include additional 3.4% of space with Letter of Intent executed and
3.3% of space under advanced discussions.
96%99% 100%
88%
99%
96%
72%
100%
Portfolio Occupancy(as at 31 March 2018)
Chennai22%
Hyderabad28%
Bangalore31%
Pune12%
Mumbai7%
Geographical Diversification of Operating Buildings(as at 31 March 2018)
3% 1%
8%
5%
93%^ 2%
98%^
81%^
IT45%
IT/ITES36%
Logistics & Warehousing
7%
ITES6%
Retail & F&B3%
R&D2%
Others1%
Tenant Sectors by Base Rent(as at 31 March 2018)
IT – Information Technology ITES – IT Enabled Services F&B – Food and Beverage R&D – Research and Development
#
1%
12%9%
18%
60%
FY17/18 FY18/19 FY19/20 FY20/21 FY21/22&
Beyond
Portfolio Lease Expiry Profile(as at 31 March 2018)
a-iTrust Announcement of Results for the Financial Year Ended 31 March 2018
6
FINANCIAL REVIEW FOR THE FINANCIAL YEAR ENDED 31 MARCH 2018
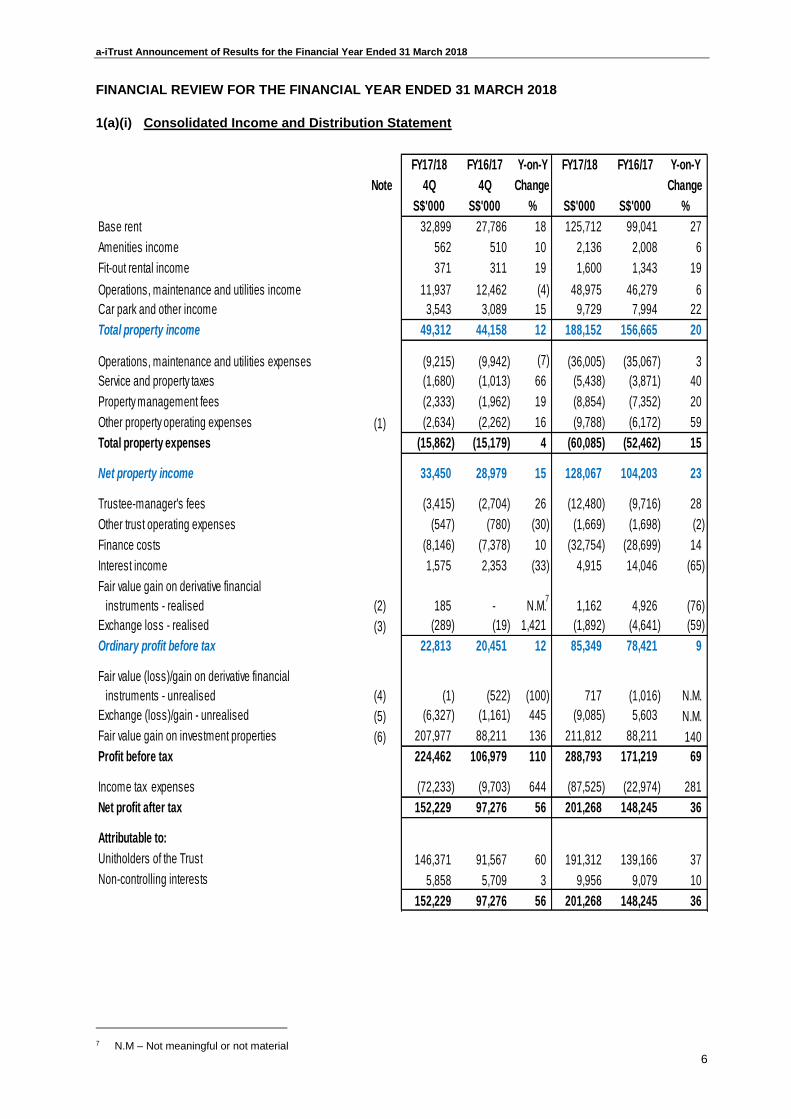
1(a)(i) Consolidated Income and Distribution Statement
7
7 N.M – Not meaningful or not material
FY17/18 FY16/17 Y-on-Y FY17/18 FY16/17 Y-on-Y
Note 4Q 4Q Change Change
S$'000 S$'000 % S$'000 S$'000 %
Base rent 32,899 27,786 18 125,712 99,041 27
Amenities income 562 510 10 2,136 2,008 6
Fit-out rental income 371 311 19 1,600 1,343 19
Operations, maintenance and utilities income 11,937 12,462 (4) 48,975 46,279 6
Car park and other income 3,543 3,089 15 9,729 7,994 22
Total property income 49,312 44,158 12 188,152 156,665 20
Operations, maintenance and utilities expenses (9,215) (9,942) (7) (36,005) (35,067) 3
Service and property taxes (1,680) (1,013) 66 (5,438) (3,871) 40
Property management fees (2,333) (1,962) 19 (8,854) (7,352) 20
Other property operating expenses (1) (2,634) (2,262) 16 (9,788) (6,172) 59
Total property expenses (15,862) (15,179) 4 (60,085) (52,462) 15
Net property income 33,450 28,979 15 128,067 104,203 23
Trustee-manager's fees (3,415) (2,704) 26 (12,480) (9,716) 28
Other trust operating expenses (547) (780) (30) (1,669) (1,698) (2)
Finance costs (8,146) (7,378) 10 (32,754) (28,699) 14
Interest income 1,575 2,353 (33) 4,915 14,046 (65)
Fair value gain on derivative financial
instruments - realised (2) 185 - N.M. 1,162 4,926 (76)
Exchange loss - realised (3) (289) (19) 1,421 (1,892) (4,641) (59)
Ordinary profit before tax 22,813 20,451 12 85,349 78,421 9
Fair value (loss)/gain on derivative financial
instruments - unrealised (4) (1) (522) (100) 717 (1,016) N.M.
Exchange (loss)/gain - unrealised (5) (6,327) (1,161) 445 (9,085) 5,603 N.M.
Fair value gain on investment properties (6) 207,977 88,211 136 211,812 88,211 140
Profit before tax 224,462 106,979 110 288,793 171,219 69
Income tax expenses (72,233) (9,703) 644 (87,525) (22,974) 281
Net profit after tax 152,229 97,276 56 201,268 148,245 36
Attributable to:
Unitholders of the Trust 146,371 91,567 60 191,312 139,166 37
Non-controlling interests 5,858 5,709 3 9,956 9,079 10
152,229 97,276 56 201,268 148,245 36
7
a-iTrust Announcement of Results for the Financial Year Ended 31 March 2018
7
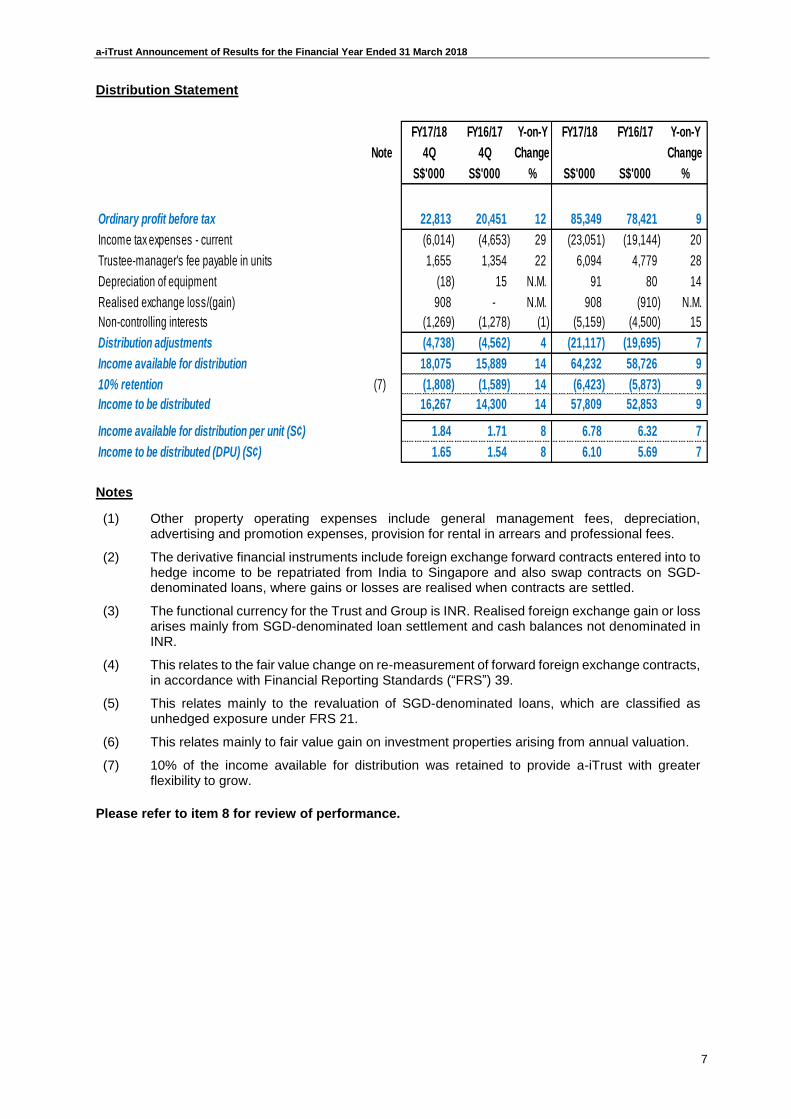
Distribution Statement
Notes
(1) Other property operating expenses include general management fees, depreciation, advertising and promotion expenses, provision for rental in arrears and professional fees.
(2) The derivative financial instruments include foreign exchange forward contracts entered into to hedge income to be repatriated from India to Singapore and also swap contracts on SGD-denominated loans, where gains or losses are realised when contracts are settled.
(3) The functional currency for the Trust and Group is INR. Realised foreign exchange gain or loss arises mainly from SGD-denominated loan settlement and cash balances not denominated in INR.
(4) This relates to the fair value change on re-measurement of forward foreign exchange contracts, in accordance with Financial Reporting Standards (“FRS”) 39.
(5) This relates mainly to the revaluation of SGD-denominated loans, which are classified as unhedged exposure under FRS 21.
(6) This relates mainly to fair value gain on investment properties arising from annual valuation.
(7) 10% of the income available for distribution was retained to provide a-iTrust with greater flexibility to grow.
Please refer to item 8 for review of performance.
FY17/18 FY16/17 Y-on-Y FY17/18 FY16/17 Y-on-Y
Note 4Q 4Q Change Change
S$'000 S$'000 % S$'000 S$'000 %
Ordinary profit before tax 22,813 20,451 12 85,349 78,421 9
Income tax expenses - current (6,014) (4,653) 29 (23,051) (19,144) 20
Trustee-manager's fee payable in units 1,655 1,354 22 6,094 4,779 28
Depreciation of equipment (18) 15 N.M. 91 80 14
Realised exchange loss/(gain) 908 - N.M. 908 (910) N.M.
Non-controlling interests (1,269) (1,278) (1) (5,159) (4,500) 15
Distribution adjustments (4,738) (4,562) 4 (21,117) (19,695) 7
Income available for distribution 18,075 15,889 14 64,232 58,726 9
10% retention (7) (1,808) (1,589) 14 (6,423) (5,873) 9
Income to be distributed 16,267 14,300 14 57,809 52,853 9
Income available for distribution per unit (S¢) 1.84 1.71 8 6.78 6.32 7
Income to be distributed (DPU) (S¢) 1.65 1.54 8 6.10 5.69 7

a-iTrust Announcement of Results for the Financial Year Ended 31 March 2018
8
1(a)(ii) Statement of Comprehensive Income
FY17/18 FY16/17 FY17/18 FY16/17
4Q 4Q
S$'000 S$'000 S$'000 S$'000
Net profit after tax 152,229 97,276 201,268 148,245
Other Comprehensive Income:
Items that may be reclassified subsequently to profit or loss:
- Cash flow hedges 2,055 (707) 5,731 (8,842)
- Translation differences arising from the conversion of
functional currency into presentation currency (32,385) 434 (48,052) 34,553
Total comprehensive income 121,899 97,003 158,947 173,956
Total comprehensive income attributable to:
Unitholders of the Trust 118,573 91,265 152,749 162,100
Non-controlling interests 3,326 5,738 6,198 11,856
121,899 97,003 158,947 173,956
a-iTrust Announcement of Results for the Financial Year Ended 31 March 2018
9
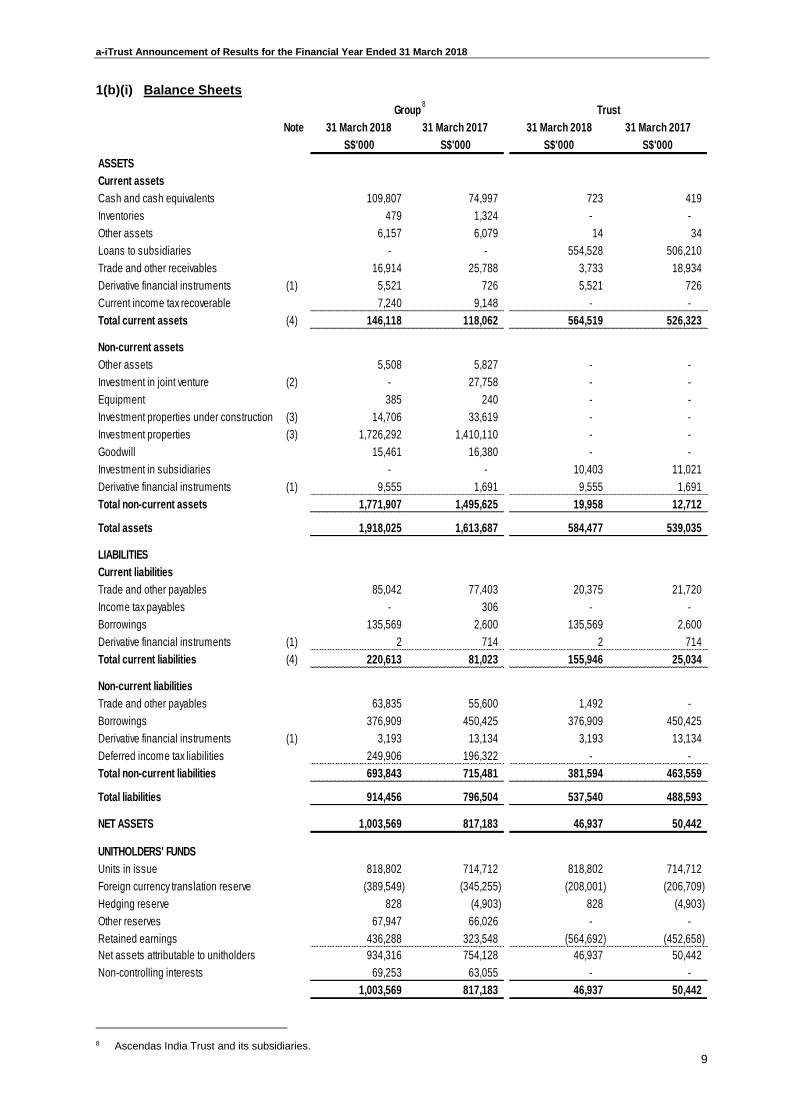
1(b)(i) Balance Sheets8
8 Ascendas India Trust and its subsidiaries.
Group Trust
Note 31 March 2018 31 March 2017 31 March 2018 31 March 2017
S$'000 S$'000 S$'000 S$'000
ASSETS
Current assets
Cash and cash equivalents 109,807 74,997 723 419
Inventories 479 1,324 - -
Other assets 6,157 6,079 14 34
Loans to subsidiaries - - 554,528 506,210
Trade and other receivables 16,914 25,788 3,733 18,934
Derivative financial instruments (1) 5,521 726 5,521 726
Current income tax recoverable 7,240 9,148 - -
Total current assets (4) 146,118 118,062 564,519 526,323
Non-current assets
Other assets 5,508 5,827 - -
Investment in joint venture (2) - 27,758 - -
Equipment 385 240 - -
Investment properties under construction (3) 14,706 33,619 - -
Investment properties (3) 1,726,292 1,410,110 - -
Goodwill 15,461 16,380 - -
Investment in subsidiaries - - 10,403 11,021
Derivative financial instruments (1) 9,555 1,691 9,555 1,691
Total non-current assets 1,771,907 1,495,625 19,958 12,712
Total assets 1,918,025 1,613,687 584,477 539,035
LIABILITIES
Current liabilities
Trade and other payables 85,042 77,403 20,375 21,720
Income tax payables - 306 - -
Borrowings 135,569 2,600 135,569 2,600
Derivative financial instruments (1) 2 714 2 714
Total current liabilities (4) 220,613 81,023 155,946 25,034
Non-current liabilities
Trade and other payables 63,835 55,600 1,492 -
Borrowings 376,909 450,425 376,909 450,425
Derivative financial instruments (1) 3,193 13,134 3,193 13,134
Deferred income tax liabilities 249,906 196,322 - -
Total non-current liabilities 693,843 715,481 381,594 463,559
Total liabilities 914,456 796,504 537,540 488,593
NET ASSETS 1,003,569 817,183 46,937 50,442
UNITHOLDERS' FUNDS
Units in issue 818,802 714,712 818,802 714,712
Foreign currency translation reserve (389,549) (345,255) (208,001) (206,709)
Hedging reserve 828 (4,903) 828 (4,903)
Other reserves 67,947 66,026 - -
Retained earnings 436,288 323,548 (564,692) (452,658)
Net assets attributable to unitholders 934,316 754,128 46,937 50,442
Non-controlling interests 69,253 63,055 - -
1,003,569 817,183 46,937 50,442
8

a-iTrust Announcement of Results for the Financial Year Ended 31 March 2018
10
Notes
(1) The changes in derivative financial instruments (assets and liabilities) are related to fair value
changes upon re-measurement of cross currency swaps, interest rate swaps and forward foreign
exchange contracts.
(2) The decrease in investment in joint venture was related to the acquisition of aVance 4, Hyderabad
in April 2017.
(3) The increase in investment properties is mainly due to annual fair value revaluation of investment
properties and addition of Arshiya Warehouses, aVance 4 and transfer of Atria building upon
completion.
(4) Notwithstanding the net current liability position, based on the Group’s existing financial
resources, the Trustee-manager is of the opinion that the Group will be able to refinance its
borrowings and meet its current obligations as and when they fall due.
1(b)(ii) Gross Borrowings
All borrowings are unsecured. The Trust has entered into derivative financial instruments to
hedge 65% of its gross SGD/JPY borrowings into INR. The fair value of those derivative financial
instruments was at a net asset position of S$11.9 million as at 31 March 2018, which decreases
the Trust’s effective borrowings to S$500.6 million.
31 March 2018 31 March 2017
S$'000 S$'000
Amount payable within one year
Bank loans 70,600 2,600
Medium term notes 64,969 -
135,569 2,600
Amount payable after one year
Bank loans 247,242 255,751
Medium term notes 129,667 194,674
376,909 450,425
Total 512,478 453,025
Group and Trust

a-iTrust Announcement of Results for the Financial Year Ended 31 March 2018
11
1(c) Consolidated Statement of Cash Flows
FY17/18 FY16/17 FY17/18 FY16/17
4Q 4Q
S$'000 S$'000 S$'000 S$'000
Cash flows from operating activities
Net profit after tax 152,229 97,276 201,268 148,245
Adjustments for :
Income tax expenses 72,233 9,703 87,525 22,974
Depreciation of equipment (19) 15 90 80
Finance costs 8,146 7,378 32,754 28,699
Interest income (1,575) (2,353) (4,915) (14,046)
Fair value loss/(gain) on derivative financial
instruments - unrealised 1 522 (717) 1,016
Fair value gain on investment properties (207,977) (88,211) (211,812) (88,211)
Allowance/(write back) for impairment of receivables 251 - 890 (418)
Trustee-manager's fees paid and payable in units 1,655 1,354 6,094 4,779
Exchange differences 7,235 1,161 9,993 (6,513)
Others (4,588) 655 (2,320) 7,581
Operating cash flows before changes in working capital 27,591 27,500 118,850 104,186
Changes in working capital
Inventories 35 447 771 (604)
Other assets 946 797 (420) (920)
Trade and other receivables 4,694 (988) 9 (5,808)
Trade and other payables 16,382 (5,419) 20,269 3,416
Cash flows from operations 49,648 22,337 139,479 100,270
Interest received 1,189 2,967 4,705 12,624
Income tax paid (net) (4,939) (3,883) (21,589) (18,028)
Net cash flows from operating activities 45,898 21,421 122,595 94,866
Cash flows from investing activities
Purchase of equipment - - (253) -
Advance payment of expenditure on investment properties - (6,642) (2,820) (6,642)
Additions to investment properties under construction (6,606) (1,897) (17,753) (9,309)
Additions to investment properties (6,891) (2,969) (9,081) (6,811)
Net cash outflow from acquisition of subsidiary (84,669) (70,284) (94,814) (70,284)
Payment towards deferred consideration of investment properties (1,322) - (6,730) -
Investment in joint venture - (1) - (24,269)
Net cash flows used in investing activities (99,488) (81,793) (131,451) (117,315)
Cash flows from financing activities
Repayment of borrowings (98,500) - (101,100) (45,000)
Distribution to unitholders (22,822) - (76,651) (50,957)
Distribution to non-controlling interests - (1,715) - (1,715)
Interest paid (8,717) (6,659) (32,663) (27,510)
Proceeds from borrowings 109,100 15,800 159,601 132,495
Proceeds from issue of new units 98,685 - 98,685 -
Net cash flows used in financing activities 77,746 7,426 47,872 7,313
Net increase in cash and cash equivalents 24,156 (52,946) 39,016 (15,136)
Cash and cash equivalents at beginning of financial period 88,455 127,943 74,997 85,921
Effects of exchange rate changes on cash and cash equivalents (2,804) - (4,206) 4,212
Cash and cash equivalents at end of financial period 109,807 74,997 109,807 74,997

a-iTrust Announcement of Results for the Financial Year Ended 31 March 2018
12
1(d)(i) Consolidated Statement of Changes in Unitholders’ Funds (Group)
<-------- Attributable to unitholders of the Trust -------->
Units in
issue
Foreign
currency
translation
reserve
Hedging
reserve
Other
reserves
Retained
earnings
Non-
controlling
interests
Total
S$'000 S$'000 S$'000 S$'000 S$'000 S$'000 S$'000
FY17/18
Balance at 1 April 2017 714,712 (345,255) (4,903) 66,026 323,548 63,055 817,183
Profit for the period - - - - 44,941 4,098 49,039
Other comprehensive income for
the period - (14,441) 3,676 - - (1,226) (11,991)
Transfer to other reserves - - - 1,459 (1,459) - -
Issue of new units 4,537 - - - - - 4,537
Distribution to Unitholders - - - - (53,829) - (53,829)
Balance at 31 December 2017 719,249 (359,696) (1,227) 67,485 313,201 65,927 804,939
Profit for the period - - - - 146,371 5,858 152,229
Other comprehensive income for
the period - (29,853) 2,055 - - (2,532) (30,330)
Transfer to other reserves - - - 462 (462) - -
Issue of new units 99,553 - - - - - 99,553
Distribution to Unitholders - - - - (22,822) - (22,822)
Balance at 31 March 2018 818,802 (389,549) 828 67,947 436,288 69,253 1,003,569
FY16/17
Balance at 1 April 2016 710,261 (377,031) 3,939 62,255 239,110 52,914 691,448
Profit for the period - - - - 47,599 3,370 50,969
Other comprehensive income for
the period - 31,371 (8,135) - - 2,748 25,984
Transfer to other reserves - - - 1,082 (1,082) - -
Issue of new units 3,763 - - - - - 3,763
Distribution to Unitholders - - - - (50,957) - (50,957)
Balance at 31 December 2016 714,024 (345,660) (4,196) 63,337 234,670 59,032 721,207
Profit for the period - - - - 91,567 5,709 97,276
Other comprehensive income for
the period - 405 (707) - - 29 (273)
Transfer to other reserves - - - 2,689 (2,689) - -
Issue of new units 688 - - - - - 688
Issuance cost of private
placement - - - - - (1,715) (1,715)
Balance at 31 March 2017 714,712 (345,255) (4,903) 66,026 323,548 63,055 817,183
a-iTrust Announcement of Results for the Financial Year Ended 31 March 2018
13
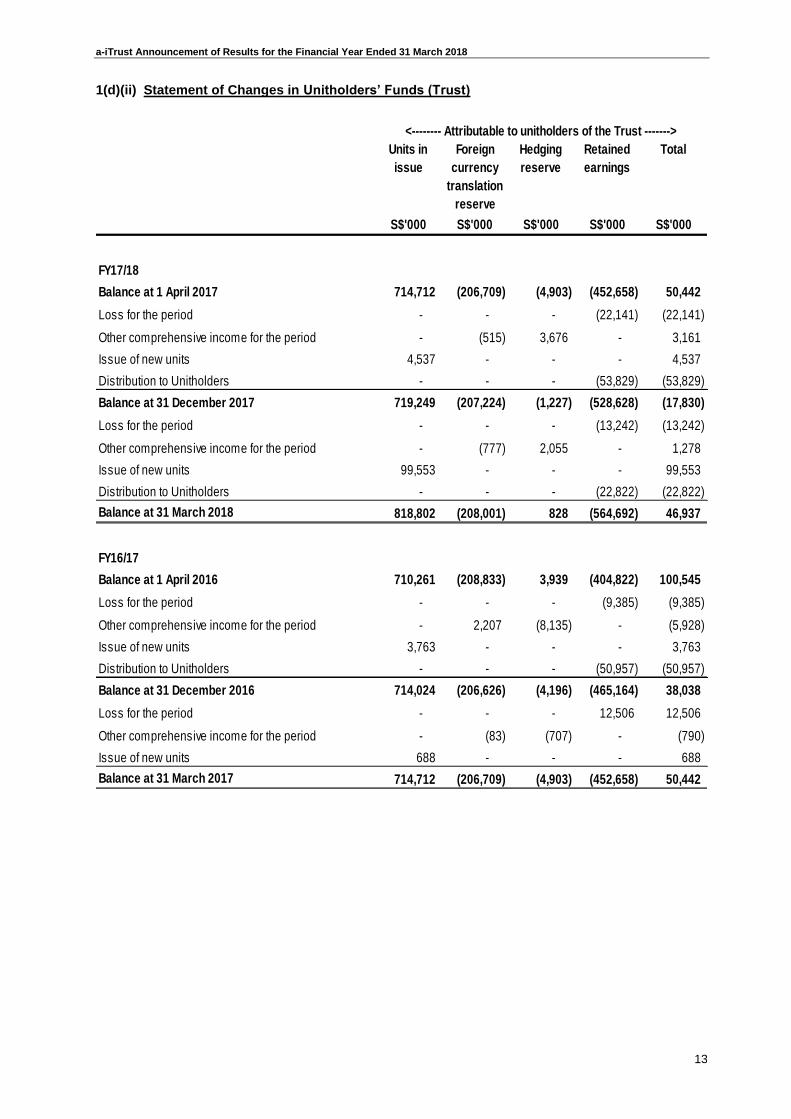
1(d)(ii) Statement of Changes in Unitholders’ Funds (Trust)
<-------- Attributable to unitholders of the Trust ------->
Units in
issue
Foreign
currency
translation
reserve
Hedging
reserve
Retained
earnings
Total
S$'000 S$'000 S$'000 S$'000 S$'000
FY17/18
Balance at 1 April 2017 714,712 (206,709) (4,903) (452,658) 50,442
Loss for the period - - - (22,141) (22,141)
Other comprehensive income for the period - (515) 3,676 - 3,161
Issue of new units 4,537 - - - 4,537
Distribution to Unitholders - - - (53,829) (53,829)
Balance at 31 December 2017 719,249 (207,224) (1,227) (528,628) (17,830)
Loss for the period - - - (13,242) (13,242)
Other comprehensive income for the period - (777) 2,055 - 1,278
Issue of new units 99,553 - - - 99,553
Distribution to Unitholders - - - (22,822) (22,822)
Balance at 31 March 2018 818,802 (208,001) 828 (564,692) 46,937
FY16/17
Balance at 1 April 2016 710,261 (208,833) 3,939 (404,822) 100,545
Loss for the period - - - (9,385) (9,385)
Other comprehensive income for the period - 2,207 (8,135) - (5,928)
Issue of new units 3,763 - - - 3,763
Distribution to Unitholders - - - (50,957) (50,957)
Balance at 31 December 2016 714,024 (206,626) (4,196) (465,164) 38,038
Loss for the period - - - 12,506 12,506
Other comprehensive income for the period - (83) (707) - (790)
Issue of new units 688 - - - 688
Balance at 31 March 2017 714,712 (206,709) (4,903) (452,658) 50,442
a-iTrust Announcement of Results for the Financial Year Ended 31 March 2018
14
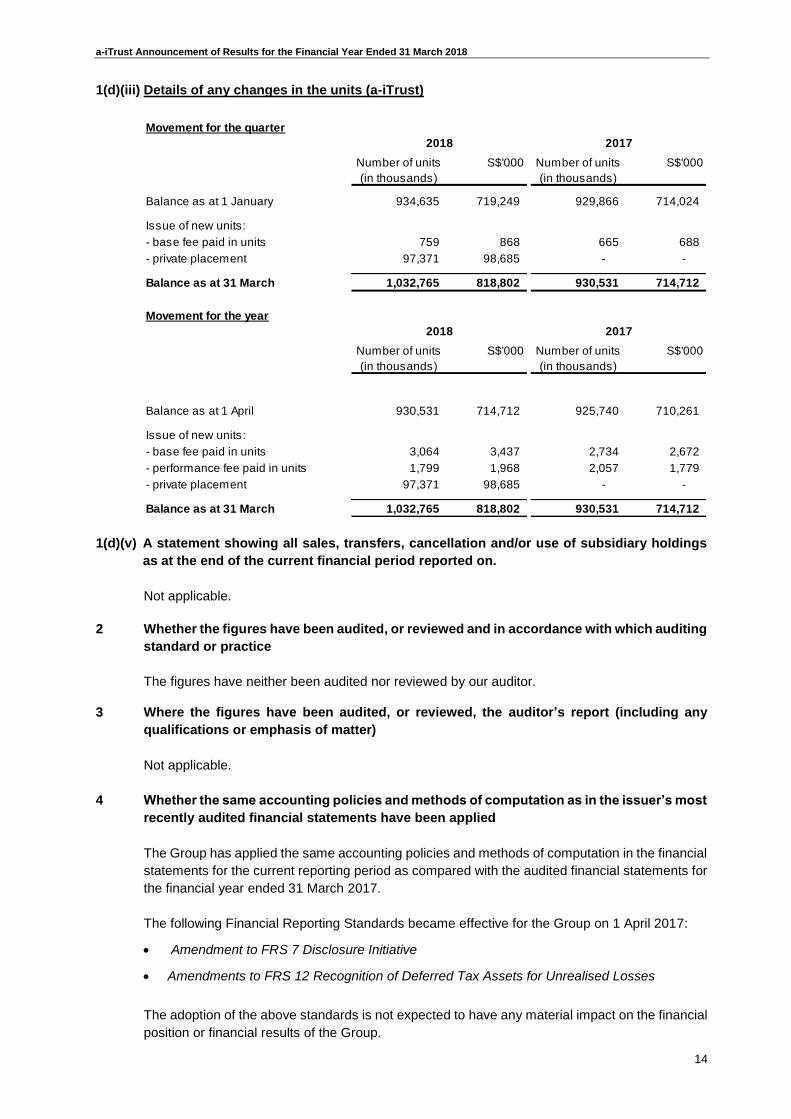
1(d)(iii) Details of any changes in the units (a-iTrust)
1(d)(v) A statement showing all sales, transfers, cancellation and/or use of subsidiary holdings
as at the end of the current financial period reported on.
Not applicable.
2 Whether the figures have been audited, or reviewed and in accordance with which auditing
standard or practice
The figures have neither been audited nor reviewed by our auditor.
3 Where the figures have been audited, or reviewed, the auditor’s report (including any
qualifications or emphasis of matter)
Not applicable.
4 Whether the same accounting policies and methods of computation as in the issuer’s most
recently audited financial statements have been applied
The Group has applied the same accounting policies and methods of computation in the financial
statements for the current reporting period as compared with the audited financial statements for
the financial year ended 31 March 2017.
The following Financial Reporting Standards became effective for the Group on 1 April 2017:
Amendment to FRS 7 Disclosure Initiative
Amendments to FRS 12 Recognition of Deferred Tax Assets for Unrealised Losses
The adoption of the above standards is not expected to have any material impact on the financial
position or financial results of the Group.
Movement for the quarter
2018 2017
Number of units
(in thousands)
S$'000 Number of units
(in thousands)
S$'000
Balance as at 1 January 934,635 719,249 929,866 714,024
Issue of new units:
- base fee paid in units 759 868 665 688
- private placement 97,371 98,685 - -
Balance as at 31 March 1,032,765 818,802 930,531 714,712
Movement for the year
2018 2017
Number of units
(in thousands)
S$'000 Number of units
(in thousands)
S$'000
Balance as at 1 April 930,531 714,712 925,740 710,261
Issue of new units:
- base fee paid in units 3,064 3,437 2,734 2,672
- performance fee paid in units 1,799 1,968 2,057 1,779
- private placement 97,371 98,685 - -
Balance as at 31 March 1,032,765 818,802 930,531 714,712
a-iTrust Announcement of Results for the Financial Year Ended 31 March 2018
15
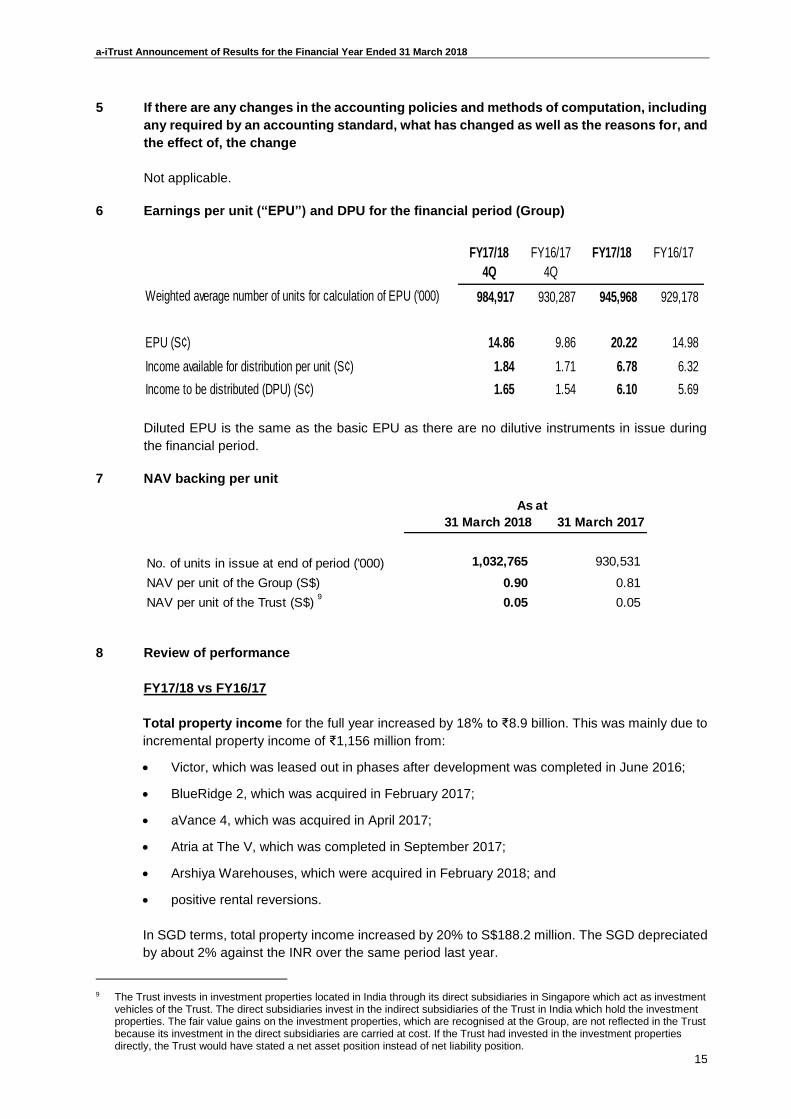
5 If there are any changes in the accounting policies and methods of computation, including
any required by an accounting standard, what has changed as well as the reasons for, and
the effect of, the change
Not applicable.
6 Earnings per unit (“EPU”) and DPU for the financial period (Group)
Diluted EPU is the same as the basic EPU as there are no dilutive instruments in issue during
the financial period.
7 NAV backing per unit9
8 Review of performance
FY17/18 vs FY16/17
Total property income for the full year increased by 18% to ₹8.9 billion. This was mainly due to
incremental property income of ₹1,156 million from:
Victor, which was leased out in phases after development was completed in June 2016;
BlueRidge 2, which was acquired in February 2017;
aVance 4, which was acquired in April 2017;
Atria at The V, which was completed in September 2017;
Arshiya Warehouses, which were acquired in February 2018; and
positive rental reversions.
In SGD terms, total property income increased by 20% to S$188.2 million. The SGD depreciated
by about 2% against the INR over the same period last year.
9 The Trust invests in investment properties located in India through its direct subsidiaries in Singapore which act as investment
vehicles of the Trust. The direct subsidiaries invest in the indirect subsidiaries of the Trust in India which hold the investment properties. The fair value gains on the investment properties, which are recognised at the Group, are not reflected in the Trust because its investment in the direct subsidiaries are carried at cost. If the Trust had invested in the investment properties directly, the Trust would have stated a net asset position instead of net liability position.
FY17/18 FY16/17 FY17/18 FY16/17
4Q 4Q
Weighted average number of units for calculation of EPU ('000) 984,917 930,287 945,968 929,178
EPU (S¢) 14.86 9.86 20.22 14.98
Income available for distribution per unit (S¢) 1.84 1.71 6.78 6.32
Income to be distributed (DPU) (S¢) 1.65 1.54 6.10 5.69
31 March 2018 31 March 2017
No. of units in issue at end of period ('000) 1,032,765 930,531
NAV per unit of the Group (S$) 0.90 0.81
NAV per unit of the Trust (S$) 0.05 0.05
As at
9

a-iTrust Announcement of Results for the Financial Year Ended 31 March 2018
16
Total property expenses increased by 12% to ₹2.9 billion (S$60.1 million), mainly due to
additional property expenses arising from new properties.
As a result, net property income for FY17/18 grew by 21% to ₹6.1 billion. In SGD terms, net
property income grew by 23% to S$128.1 million.
Finance costs increased by ₹164 million (12%) or S$4.1 million (14%) mainly due to an increase
in borrowing levels. Total loans increased due to additional loans taken to invest in BlueRidge 2,
aVance 4 and the development of Atria.
Interest income decreased by ₹449 million (66%) or S$9.1 million (65%) mainly due to lower
interest income pertaining to BlueRidge 2 and aVance 4 debentures, which was treated as inter-
company income after acquisition, and hence, was eliminated on consolidation. Cash reserves
were also used to partially fund the acquisitions thereby lowering the interest income.
Realised gain on derivative financial instruments for FY17/18 of ₹58 million (S$1.2 million)
arose from the refinancing of a SGD-denominated loan that has been hedged into INR, offset by
losses on settlement of foreign exchange forward contracts entered into to hedge income
repatriated from India to Singapore.
Realised exchange loss for FY17/18 of ₹87 million (S$1.8 million) arose mainly from settlement
of a SGD-denominated loan facility. Realised exchange gain or loss is recognised when
borrowings that are denominated in currencies other than the INR are settled. This is offset by
realised gains from revaluation of cash balances not denominated in INR.
Ordinary profit before tax increased by 7% to ₹4.1 billion. In SGD terms, ordinary profit before
tax increased by 9% to S$85.3 million.
Fair value gain on investment properties increased by 153% to ₹10.5 billion (S$211.8 million)
mainly due to compression of capitalisation rates, higher rents and the completion of Atria. In
SGD terms, fair value gain on investment properties increased by 140%.
Income tax expenses increased by ₹3.2 billion (S$64.6 million) mainly due to:
increase of ₹2.0 billion (S$38.7 million) in deferred income tax liability on capital gains due
to fair value revaluation of investment properties;
one-off non-cash write back of Minimum Alternate Tax (“MAT”) credits10 of ₹561 million
(S$12.0 million) in the previous year due to a change in Indian tax regulations where MAT
credits could be carried forward for an additional 5 years;
one-off recognition of MAT credits of ₹366 million (S$7.8 million) at ITPC in the previous year
due to tax exemption benefits obtained; and
higher net property income.
Distribution adjustments:
Current income tax expense at ₹1.1 billion (S$23.1 million).
Trustee-manager fees to be paid in units at ₹290 million (S$6.1 million). The Trustee-
manager has elected to receive 50% of its base fee and performance fee in units and 50%
in cash; hence 50% of the fees are added back to the income available for distribution.
10 MAT credit is the difference between MAT and corporate tax. MAT credit is recognised as deferred tax asset when it is assessed
that the MAT credit paid in the past may be used to offset higher corporate tax payable over future periods. Conversely, MAT credits are written off when it is expected that it cannot be utilised in future.

a-iTrust Announcement of Results for the Financial Year Ended 31 March 2018
17
Income due to non-controlling interests of ₹245 million (S$5.2 million) is deducted from
income available for distribution.
Income available for distribution for FY17/18 increased by 8% to ₹3.1 billion. In SGD terms,
income available for distribution increased by 9% to S$64.2 million.
Income available for distribution per unit for FY17/18 was ₹3.23, or 6.78 S₵. DPU was ₹2.91
or 6.10 S₵ after retaining 10% of income available for distribution.
4Q FY17/18 vs 4Q FY16/17
Total property income for the quarter ended 31 March 2018 (“4Q FY17/18”) increased by 15%
to ₹2.4 billion due to:
income from Victor, which was leased out in phases after development was completed in
June 2016;
income from BlueRidge 2, which was acquired in February 2017;
income from aVance 4, which was acquired in April 2017;
income from Atria at The V, which was completed in September 2017;
Arshiya Warehouses, which were acquired in February 2018; and
positive rental reversions.
In SGD terms, total property income increased by 12% to S$49.3 million. The SGD appreciated by about 3% against the INR over the same period last year.
Total property expenses for 4Q FY17/18 increased by 8% to ₹774 million (S$15.9 million)
mainly due to property expenses from new properties, offset by lower utilities expenses.
Net property income for 4Q FY17/18 increased by 19% to ₹1.6 billion due to the above factors.
In SGD terms, net property income grew by 15% to S$33.5 million.
Finance costs increased by ₹48 million (14%) to ₹397 million (S$8.1 million) mainly due to
increase in borrowing levels. Total loans increased by 13% from S$453.0 million in 4Q FY16/17
to S$512.5 million in 4Q FY17/18 on loans taken for acquisition of BlueRidge 2, aVance 4 and
the development of Atria.
Interest income decreased by ₹35 million (31%) or S$0.8 million (33%) mainly due to lower
interest income pertaining to BlueRidge 2 and aVance 4 debentures, which was treated as inter-
company income after acquisition, and hence, was eliminated on consolidation.
Realised gain on derivative financial instruments for 4Q FY17/18 of ₹9 million (S$0.2 million)
arose from the settlement of foreign exchange forward contracts entered into to hedge income
repatriated from India to Singapore.
Realised exchange loss for 4Q FY17/18 of ₹10 million (S$0.2 million) arose mainly from
settlement of SGD-denominated loan facilities. Realised exchange gain or loss is recognised
when borrowings that are denominated in currencies other than the INR are settled. This is offset
by realised gains from revaluation of cash balances not denominated in INR during the quarter.
As a result, ordinary profit before tax was ₹1.1 billion in 4Q FY17/18, an increase of 16% as
compared to ₹966 million in 4Q FY16/17. In SGD terms, ordinary profit before tax increased by
12% to S$22.8 million.

a-iTrust Announcement of Results for the Financial Year Ended 31 March 2018
18
Unrealised exchange loss for 4Q FY17/18 of ₹307 million (S$6.3 million) relates mainly to the
revaluation of SGD-denominated loans.
Fair value gain on investment properties increased by 149% to ₹10.3 billion (S$208.0 million)
mainly due to compression of capitalisation rates, higher rents and the completion of Atria. In
SGD terms, fair value gain on investment properties increased by 136%.
Income tax expenses increased by ₹3.1 billion (S$62.5 million) mainly due to:
increase of ₹2.0 billion (S$38.7 million) in deferred income tax liability on capital gains due
to fair value revaluation of investment properties;
one-off non-cash write back of Minimum Alternate Tax (“MAT”) credits of ₹561 million
(S$12.0 million) in the previous year due to a change in Indian tax regulations where MAT
credits could be carried forward for an additional 5 years;
one-off recognition of MAT credits of ₹366 million (S$7.8 million) at ITPC in the previous year
due to tax exemption benefits obtained; and
higher current income tax from higher net property income.
Distribution adjustments:
Current income tax expenses of ₹294 million (S$6.0 million).
Trustee-manager fees to be paid in units at ₹81 million (S$1.7 million). The Trustee-
manager has elected to receive 50% of its base fee and performance fee in units and 50%
in cash; hence 50% of the fees are added back to the income available for distribution.
Income due to non-controlling interests of ₹62 million (S$1.3 million) is deducted from
income available for distribution.
Income available for distribution for 4Q FY17/18 increased by 18% to ₹888 million, mainly due
to higher ordinary profit before tax. In SGD terms, income available for distribution increased by
14% to S$18.1 million.
Income available for distribution per unit for 4Q FY17/18 was ₹0.90, or 1.84 S₵. DPU was
₹0.81 or 1.65 S₵ after retaining 10% of income available for distribution. This amounts to an
increase of 12% over 4Q FY16/17 in INR terms and 8% in SGD terms.
4Q FY17/18 vs 3Q FY17/18
INR
FY17/18 FY17/18 Q-on-Q
4Q 3Q Change
₹'000 ₹'000 %
Total property income 2,406,424 2,221,074 8
Total property expenses (773,689) (664,793) 16
Net property income 1,632,735 1,556,281 5
Ordinary profit before tax 1,118,839 1,081,292 3
Income available for distribution 887,569 811,693 9
Income to be distributed 798,812 730,524 9
Income available for distribution per unit (Indian Rupee) 0.90 0.87 3
Income to be distributed (DPU) (Indian Rupee) 0.81 0.79 3

a-iTrust Announcement of Results for the Financial Year Ended 31 March 2018
19
Total property income for 4Q FY17/18 increased by 8% to ₹2.4 billion (S$49.3 million) on
account of incremental contributions from Arshiya Warehouses and Atria, and positive rental
reversions.
Total property expenses for 4Q FY17/18 increased by 16% to ₹774 million (S$15.9 million) on
account of:
increase of ₹62 million (S$1.3 million) in ad-hoc operation and maintenance expenses
across the properties; and
increase in property tax provisions of ₹22 million (S$0.5 million) at BlueRidge 2 due to an
increase in property tax rates.
As a result, net property income for 4Q FY17/18 increased by 5% to ₹1.6 billion. In SGD terms,
net property income increased by 3% to S$33.5 million.
Income available for distribution increased by 9% to ₹888 million, mainly due to higher net
property income. In SGD terms, income available for distribution increased by 6% to S$18.1
million.
9 Variance between forecast and the actual results
No forecast has been disclosed.
10 If the Group has obtained a general mandate from shareholders for Interested Person
Transactions (“IPT”), the aggregate value of each transaction as required under Rule
920(1)(a)(ii). If no IPT mandate has been obtained, a statement to that effect.
a-iTrust has not obtained a general mandate from unitholders for any Interested Person
Transactions.
11 Update on development projects
Redevelopment at The V
a-iTrust has received in-principle approval to redevelop The V in Hyderabad. The V will be
redeveloped in phases over the next 7 to 10 years to increase the leasable area from 1.7 million
sq ft to 4.511 million sq ft.
11 Subject to final approval of the building permit from MSB Committee.
SGD
FY17/18 FY17/18 Q-on-Q
4Q 3Q Change
S$'000 S$'000 %
Total property income 49,312 46,515 6
Total property expenses (15,862) (13,936) 14
Net property income 33,450 32,579 3
Ordinary profit before tax 22,813 22,641 1
Income available for distribution 18,075 16,996 6
Income to be distributed 16,267 15,296 6
Income available for distribution per unit (S₵) 1.84 1.82 1
Income to be distributed (DPU) (S₵) 1.65 1.64 1
a-iTrust Announcement of Results for the Financial Year Ended 31 March 2018
20
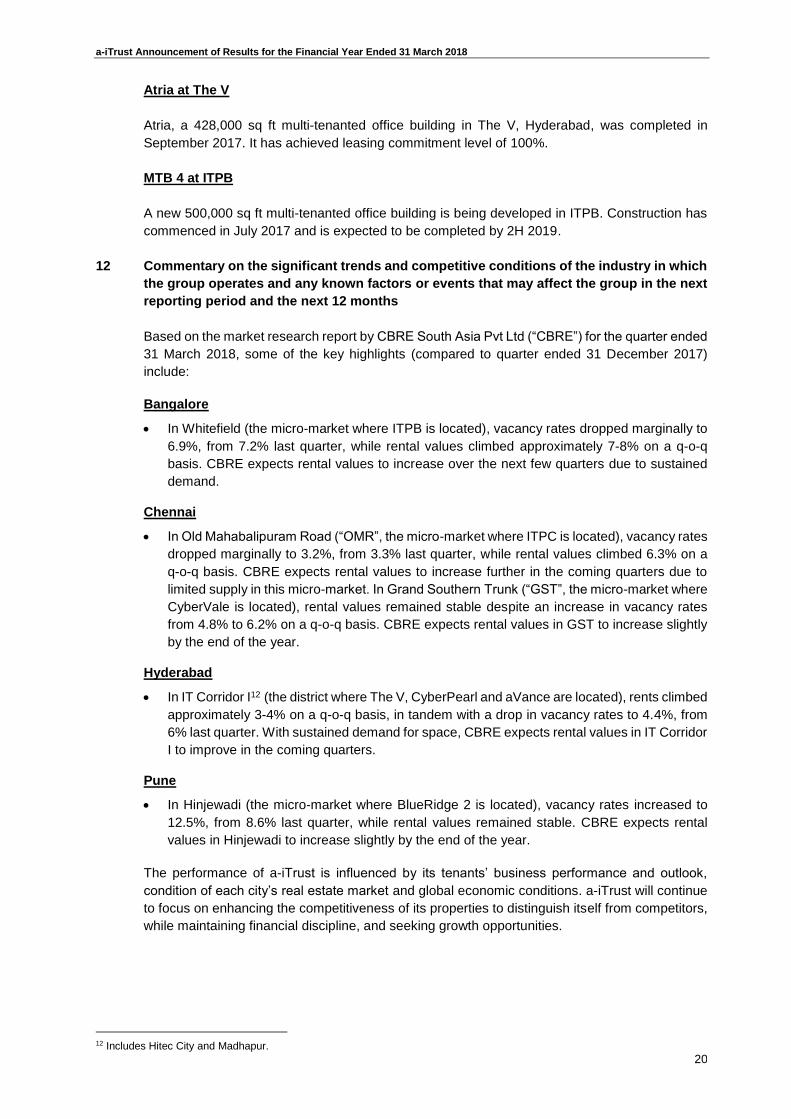
Atria at The V
Atria, a 428,000 sq ft multi-tenanted office building in The V, Hyderabad, was completed in
September 2017. It has achieved leasing commitment level of 100%.
MTB 4 at ITPB
A new 500,000 sq ft multi-tenanted office building is being developed in ITPB. Construction has
commenced in July 2017 and is expected to be completed by 2H 2019.
12 Commentary on the significant trends and competitive conditions of the industry in which
the group operates and any known factors or events that may affect the group in the next
reporting period and the next 12 months
Based on the market research report by CBRE South Asia Pvt Ltd (“CBRE”) for the quarter ended
31 March 2018, some of the key highlights (compared to quarter ended 31 December 2017)
include:
Bangalore
In Whitefield (the micro-market where ITPB is located), vacancy rates dropped marginally to
6.9%, from 7.2% last quarter, while rental values climbed approximately 7-8% on a q-o-q
basis. CBRE expects rental values to increase over the next few quarters due to sustained
demand.
Chennai
In Old Mahabalipuram Road (“OMR”, the micro-market where ITPC is located), vacancy rates
dropped marginally to 3.2%, from 3.3% last quarter, while rental values climbed 6.3% on a
q-o-q basis. CBRE expects rental values to increase further in the coming quarters due to
limited supply in this micro-market. In Grand Southern Trunk (“GST”, the micro-market where
CyberVale is located), rental values remained stable despite an increase in vacancy rates
from 4.8% to 6.2% on a q-o-q basis. CBRE expects rental values in GST to increase slightly
by the end of the year.
Hyderabad
In IT Corridor I12 (the district where The V, CyberPearl and aVance are located), rents climbed
approximately 3-4% on a q-o-q basis, in tandem with a drop in vacancy rates to 4.4%, from
6% last quarter. With sustained demand for space, CBRE expects rental values in IT Corridor
I to improve in the coming quarters.
Pune
In Hinjewadi (the micro-market where BlueRidge 2 is located), vacancy rates increased to
12.5%, from 8.6% last quarter, while rental values remained stable. CBRE expects rental
values in Hinjewadi to increase slightly by the end of the year.
The performance of a-iTrust is influenced by its tenants’ business performance and outlook,
condition of each city’s real estate market and global economic conditions. a-iTrust will continue
to focus on enhancing the competitiveness of its properties to distinguish itself from competitors,
while maintaining financial discipline, and seeking growth opportunities.
12 Includes Hitec City and Madhapur.
a-iTrust Announcement of Results for the Financial Year Ended 31 March 2018
21
13 Distributions
(a) Current financial period - Any distributions declared for the current financial period?
Yes. A distribution of 0.85 Singapore cents has been declared for the period from 14
February 2018 to 31 March 2018.
In conjunction with the Private Placement of new units on 14 February 2018, an advanced
distribution for the period from 1 October 2017 to 13 February 2018 amounting to 2.44
Singapore cents was paid on 12 March 2018.
(b) Corresponding period of the immediately preceding year - Any distributions declared for the
corresponding period of the immediate preceding financial period?
Yes. A distribution of 2.96 Singapore cents has been declared for the period from 1 October
2016 to 31 March 2017.
14 If no distribution has been declared/recommended, a statement to the effect
Refer to paragraph 13. a-iTrust makes distributions to unitholders on a semi-annual basis for
every six-month period ending 30 September and 31 March.
15 Segment Revenue and results for business segments
The Group's investment properties are primarily tenanted for use as business space and are
located in India. The revenues from the Group are derived primarily from corporate tenants and
no single major customer accounts for more than 10% of the base rent as at 31 March 2018.
Therefore, the Manager considers that the Group operates within a single business segment and
within a single geographical segment in India.
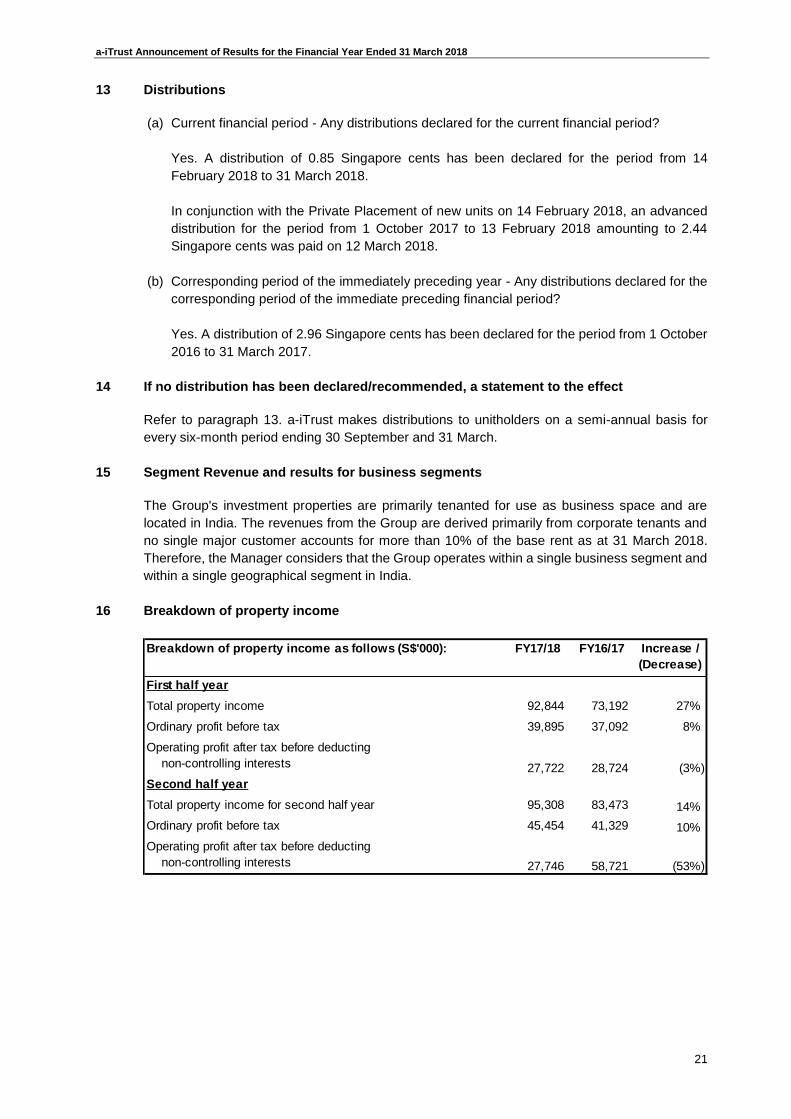
16 Breakdown of property income
Breakdown of property income as follows (S$'000): FY17/18 FY16/17 Increase /
(Decrease)
First half year
Total property income 92,844 73,192 27%
Ordinary profit before tax 39,895 37,092 8%
27,722 28,724 (3%)
Second half year
Total property income for second half year 95,308 83,473 14%
Ordinary profit before tax 45,454 41,329 10%
27,746 58,721 (53%)
Operating profit after tax before deducting
non-controlling interests
Operating profit after tax before deducting
non-controlling interests
a-iTrust Announcement of Results for the Financial Year Ended 31 March 2018
22
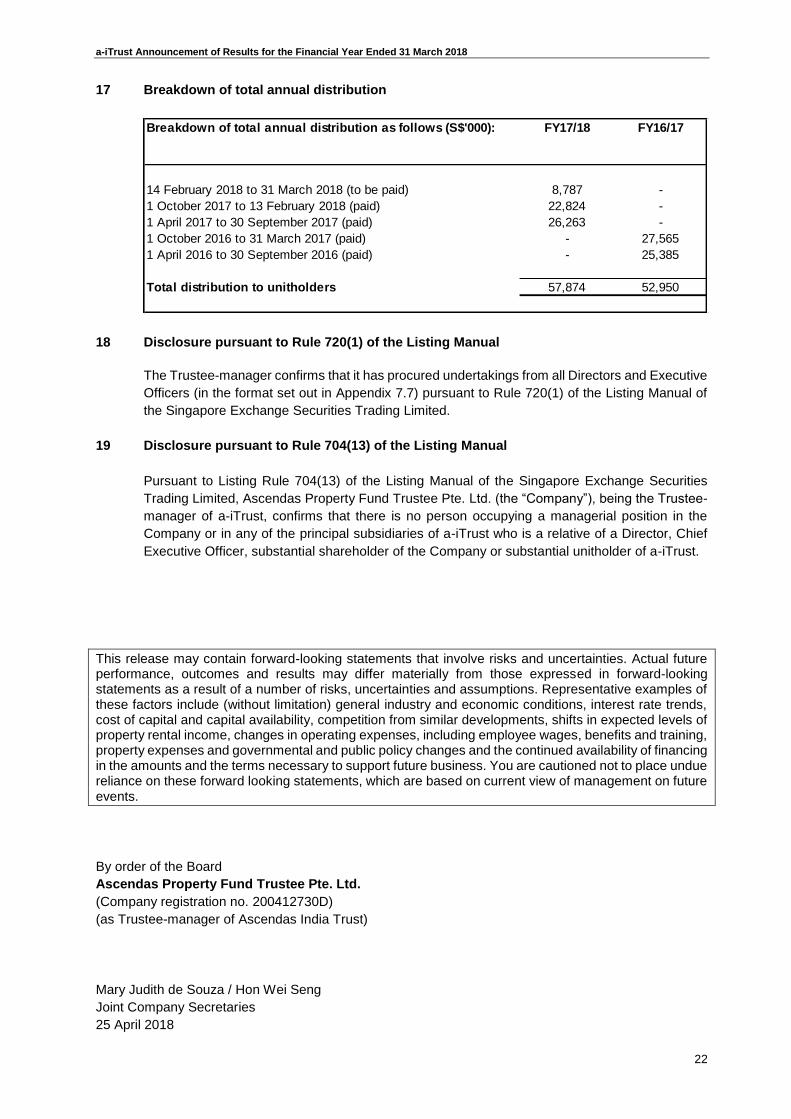
17 Breakdown of total annual distribution
18 Disclosure pursuant to Rule 720(1) of the Listing Manual
The Trustee-manager confirms that it has procured undertakings from all Directors and Executive
Officers (in the format set out in Appendix 7.7) pursuant to Rule 720(1) of the Listing Manual of
the Singapore Exchange Securities Trading Limited.
19 Disclosure pursuant to Rule 704(13) of the Listing Manual
Pursuant to Listing Rule 704(13) of the Listing Manual of the Singapore Exchange Securities
Trading Limited, Ascendas Property Fund Trustee Pte. Ltd. (the “Company”), being the Trustee-
manager of a-iTrust, confirms that there is no person occupying a managerial position in the
Company or in any of the principal subsidiaries of a-iTrust who is a relative of a Director, Chief
Executive Officer, substantial shareholder of the Company or substantial unitholder of a-iTrust.
This release may contain forward-looking statements that involve risks and uncertainties. Actual future performance, outcomes and results may differ materially from those expressed in forward-looking statements as a result of a number of risks, uncertainties and assumptions. Representative examples of these factors include (without limitation) general industry and economic conditions, interest rate trends, cost of capital and capital availability, competition from similar developments, shifts in expected levels of property rental income, changes in operating expenses, including employee wages, benefits and training, property expenses and governmental and public policy changes and the continued availability of financing in the amounts and the terms necessary to support future business. You are cautioned not to place undue reliance on these forward looking statements, which are based on current view of management on future events.
By order of the Board
Ascendas Property Fund Trustee Pte. Ltd.
(Company registration no. 200412730D)
(as Trustee-manager of Ascendas India Trust)
Mary Judith de Souza / Hon Wei Seng
Joint Company Secretaries
25 April 2018
Breakdown of total annual distribution as follows (S$'000): FY17/18 FY16/17
14 February 2018 to 31 March 2018 (to be paid) 8,787 -
1 October 2017 to 13 February 2018 (paid) 22,824 -
1 April 2017 to 30 September 2017 (paid) 26,263 -
1 October 2016 to 31 March 2017 (paid) - 27,565
1 April 2016 to 30 September 2016 (paid) - 25,385
Total distribution to unitholders 57,874 52,950
a-iTrust Announcement of Results for the Financial Year Ended 31 March 2018 APPENDIX 1
23
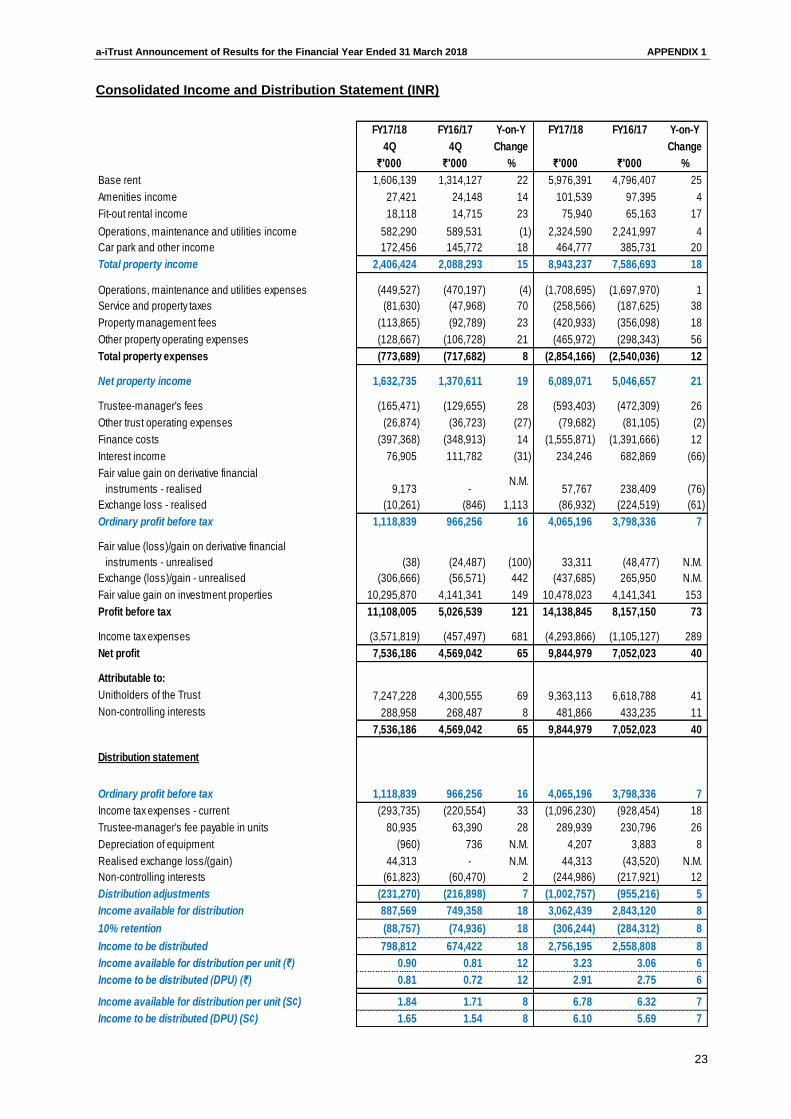
Consolidated Income and Distribution Statement (INR)
FY17/18 FY16/17 Y-on-Y FY17/18 FY16/17 Y-on-Y
4Q 4Q Change Change
₹'000 ₹'000 % ₹'000 ₹'000 %
Base rent 1,606,139 1,314,127 22 5,976,391 4,796,407 25
Amenities income 27,421 24,148 14 101,539 97,395 4
Fit-out rental income 18,118 14,715 23 75,940 65,163 17
Operations, maintenance and utilities income 582,290 589,531 (1) 2,324,590 2,241,997 4
Car park and other income 172,456 145,772 18 464,777 385,731 20
Total property income 2,406,424 2,088,293 15 8,943,237 7,586,693 18
Operations, maintenance and utilities expenses (449,527) (470,197) (4) (1,708,695) (1,697,970) 1
Service and property taxes (81,630) (47,968) 70 (258,566) (187,625) 38
Property management fees (113,865) (92,789) 23 (420,933) (356,098) 18
Other property operating expenses (128,667) (106,728) 21 (465,972) (298,343) 56
Total property expenses (773,689) (717,682) 8 (2,854,166) (2,540,036) 12
Net property income 1,632,735 1,370,611 19 6,089,071 5,046,657 21
Trustee-manager's fees (165,471) (129,655) 28 (593,403) (472,309) 26
Other trust operating expenses (26,874) (36,723) (27) (79,682) (81,105) (2)
Finance costs (397,368) (348,913) 14 (1,555,871) (1,391,666) 12
Interest income 76,905 111,782 (31) 234,246 682,869 (66)
Fair value gain on derivative financial
instruments - realised 9,173 - N.M.
57,767 238,409 (76)
Exchange loss - realised (10,261) (846) 1,113 (86,932) (224,519) (61)
Ordinary profit before tax 1,118,839 966,256 16 4,065,196 3,798,336 7
Fair value (loss)/gain on derivative financial
instruments - unrealised (38) (24,487) (100) 33,311 (48,477) N.M.
Exchange (loss)/gain - unrealised (306,666) (56,571) 442 (437,685) 265,950 N.M.
Fair value gain on investment properties 10,295,870 4,141,341 149 10,478,023 4,141,341 153
Profit before tax 11,108,005 5,026,539 121 14,138,845 8,157,150 73
Income tax expenses (3,571,819) (457,497) 681 (4,293,866) (1,105,127) 289
Net profit 7,536,186 4,569,042 65 9,844,979 7,052,023 40
Attributable to:
Unitholders of the Trust 7,247,228 4,300,555 69 9,363,113 6,618,788 41
Non-controlling interests 288,958 268,487 8 481,866 433,235 11
7,536,186 4,569,042 65 9,844,979 7,052,023 40
Distribution statement
Ordinary profit before tax 1,118,839 966,256 16 4,065,196 3,798,336 7
Income tax expenses - current (293,735) (220,554) 33 (1,096,230) (928,454) 18
Trustee-manager's fee payable in units 80,935 63,390 28 289,939 230,796 26
Depreciation of equipment (960) 736 N.M. 4,207 3,883 8
Realised exchange loss/(gain) 44,313 - N.M. 44,313 (43,520) N.M.
Non-controlling interests (61,823) (60,470) 2 (244,986) (217,921) 12
Distribution adjustments (231,270) (216,898) 7 (1,002,757) (955,216) 5
Income available for distribution 887,569 749,358 18 3,062,439 2,843,120 8
10% retention (88,757) (74,936) 18 (306,244) (284,312) 8
Income to be distributed 798,812 674,422 18 2,756,195 2,558,808 8
Income available for distribution per unit (₹) 0.90 0.81 12 3.23 3.06 6
Income to be distributed (DPU) (₹) 0.81 0.72 12 2.91 2.75 6
Income available for distribution per unit (S¢) 1.84 1.71 8 6.78 6.32 7
Income to be distributed (DPU) (S¢) 1.65 1.54 8 6.10 5.69 7

a-iTrust Announcement of Results for the Financial Year Ended 31 March 2018 APPENDIX 1
24
Balance Sheets (INR)
Group Trust
31 March 2018 31 March 2017 31 March 2018 31 March 2017
₹'000 ₹'000 ₹'000 ₹'000
ASSETS
Current assets
Cash and cash equivalents 5,436,006 3,504,519 35,816 19,561
Inventories 23,704 61,854 - -
Other assets 304,790 284,053 709 1,573
Loans to subsidiaries - - 27,451,905 23,654,672
Trade and other receivables 837,341 1,205,049 184,784 884,763
Derivative financial instruments 273,319 33,926 273,319 33,926
Current income tax recoverable 358,401 427,454 - -
Total current assets 7,233,561 5,516,855 27,946,533 24,594,495
Non-current assets
Other assets 272,697 272,304 - -
Investment in joint venture - 1,297,093 - -
Equipment 19,046 11,209 - -
Investment properties under construction 728,000 1,571,000 - -
Investment properties 85,460,000 65,893,000 - -
Goodwill 765,408 765,408 - -
Investment in subsidiaries - - 515,012 515,012
Derivative financial instruments 473,009 79,002 473,009 79,002
Total non-current assets 87,718,160 69,889,016 988,021 594,014
Total assets 94,951,721 75,405,871 28,934,554 25,188,509
LIABILITIES
Current liabilities
Trade and other payables 4,209,904 3,616,793 1,008,653 1,014,951
Income tax payables - 14,277 - -
Borrowings 6,711,356 121,495 6,711,356 121,495
Derivative financial instruments 104 33,372 104 33,372
Total current liabilities 10,921,364 3,785,937 7,720,113 1,169,818
Non-current liabilities
Trade and other payables 3,160,122 2,598,134 73,920 -
Borrowings 18,658,811 21,047,894 18,658,811 21,047,894
Derivative financial instruments 158,083 613,717 158,083 613,717
Deferred income tax liabilities 12,371,566 9,173,931 - -
Total non-current liabilities 34,348,582 33,433,676 18,890,814 21,661,611
Total liabilities 45,269,946 37,219,613 26,610,927 22,831,429
NET ASSETS 49,681,775 38,186,258 2,323,627 2,357,080
UNITHOLDERS' FUNDS
Units in issue 26,169,471 21,130,351 26,169,471 21,130,351
Hedging reserve 36,558 (238,433) 36,558 (238,433)
Other reserves 2,613,198 2,521,515 - -
Retained earnings 17,434,180 11,826,323 (23,882,402) (18,534,838)
Net assets attributable to unitholders 46,253,407 35,239,756 2,323,627 2,357,080
Non-controlling interests 3,428,368 2,946,502 - -
49,681,775 38,186,258 2,323,627 2,357,080