Green WLANs: On-Demand WLAN Infrastructuresdtipper/2011/GWLANPaper.pdf · Green WLANs: On-Demand...
17
Mobile Netw Appl (2009) 14:798–814 DOI 10.1007/s11036-008-0123-8 Green WLANs: On-Demand WLAN Infrastructures Amit P. Jardosh · Konstantina Papagiannaki · Elizabeth M. Belding · Kevin C. Almeroth · Gianluca Iannaccone · Bapi Vinnakota Published online: 9 December 2008 © Springer Science + Business Media, LLC 2008 Abstract Enterprise wireless local area networks (WLANs) that consist of a high-density of hundreds to thousands of access points (APs) are being deployed rapidly in corporate offices and university campuses. The primary purpose of these deployments is to satisfy user demands for high bandwidth, mobility, and relia- bility. However, our recent study of two such WLANs showed that these networks are rarely used at their peak capacity, and the majority of their resources are frequently idle. In this paper, we bring to attention that a large fraction of idle WLAN resources results in significant energy losses. Thousands of WLANs world- wide collectively compound this problem, while raising serious concerns about the energy losses that will occur in the future. In response to this compelling prob- lem, we propose the adoption of resource on-demand (RoD) strategies for WLANs. RoD strategies power on A. P. Jardosh · E. M. Belding (B ) · K. C. Almeroth UC, Santa Barbara, USA e-mail: [email protected] A. P. Jardosh e-mail: [email protected] K. C. Almeroth e-mail: [email protected] K. Papagiannaki · G. Iannaccone Intel Research, Santa Clara, USA K. Papagiannaki e-mail: [email protected] G. Iannaccone e-mail: [email protected] B. Vinnakota Intel Corporation, Santa Clara, USA e-mail: [email protected] or off WLAN APs dynamically, based on the volume and location of user demand. As a specific solution, we propose SEAR, a practical and elegant RoD strategy for high-density WLANs. We implement SEAR on two wireless networks to show that SEAR is easy to inte- grate in current WLANs, while it ensures no adverse impact on end-user connectivity and performance. In our experiments, SEAR reduces power consumption to 46%. Using our results we discuss several interesting problems that open future directions of research in RoD WLANs. Keywords wireless network · wireless LAN · energy efficiency 1 Introduction WLANs have become indispensable for flexible In- ternet connectivity in corporate offices [4], university campuses [1], and municipal downtowns. 1 Each of these enterprises typically deploys hundreds to thousands of APs inside their buildings and across their cam- puses. Moreover, many WLAN vendors such as Aruba Networks, Meru Networks, Symbol Technologies, and Trapeze Networks 2 have adopted the centralized ap- proach to WLAN management, making high-density WLANs cheaper, easier to manage, and simpler to secure. This practice of centralized management has fueled the growth and proliferation of WLANs. The number 1 http://www.muniwifi.org. 2 arubanetworks.com, merunetworks.com, symbol.com, trapezenetworks.com.
Transcript of Green WLANs: On-Demand WLAN Infrastructuresdtipper/2011/GWLANPaper.pdf · Green WLANs: On-Demand...

Mobile Netw Appl (2009) 14:798–814DOI 10.1007/s11036-008-0123-8
Green WLANs: On-Demand WLAN Infrastructures
Amit P. Jardosh · Konstantina Papagiannaki ·Elizabeth M. Belding · Kevin C. Almeroth ·Gianluca Iannaccone · Bapi Vinnakota
Published online: 9 December 2008© Springer Science + Business Media, LLC 2008
Abstract Enterprise wireless local area networks(WLANs) that consist of a high-density of hundreds tothousands of access points (APs) are being deployedrapidly in corporate offices and university campuses.The primary purpose of these deployments is to satisfyuser demands for high bandwidth, mobility, and relia-bility. However, our recent study of two such WLANsshowed that these networks are rarely used at theirpeak capacity, and the majority of their resources arefrequently idle. In this paper, we bring to attentionthat a large fraction of idle WLAN resources results insignificant energy losses. Thousands of WLANs world-wide collectively compound this problem, while raisingserious concerns about the energy losses that will occurin the future. In response to this compelling prob-lem, we propose the adoption of resource on-demand(RoD) strategies for WLANs. RoD strategies power on
A. P. Jardosh · E. M. Belding (B) · K. C. AlmerothUC, Santa Barbara, USAe-mail: [email protected]
A. P. Jardoshe-mail: [email protected]
K. C. Almerothe-mail: [email protected]
K. Papagiannaki · G. IannacconeIntel Research, Santa Clara, USA
K. Papagiannakie-mail: [email protected]
G. Iannacconee-mail: [email protected]
B. VinnakotaIntel Corporation, Santa Clara, USAe-mail: [email protected]
or off WLAN APs dynamically, based on the volumeand location of user demand. As a specific solution, wepropose SEAR, a practical and elegant RoD strategyfor high-density WLANs. We implement SEAR on twowireless networks to show that SEAR is easy to inte-grate in current WLANs, while it ensures no adverseimpact on end-user connectivity and performance. Inour experiments, SEAR reduces power consumption to46%. Using our results we discuss several interestingproblems that open future directions of research inRoD WLANs.
Keywords wireless network · wireless LAN ·energy efficiency
1 Introduction
WLANs have become indispensable for flexible In-ternet connectivity in corporate offices [4], universitycampuses [1], and municipal downtowns.1 Each of theseenterprises typically deploys hundreds to thousandsof APs inside their buildings and across their cam-puses. Moreover, many WLAN vendors such as ArubaNetworks, Meru Networks, Symbol Technologies, andTrapeze Networks2 have adopted the centralized ap-proach to WLAN management, making high-densityWLANs cheaper, easier to manage, and simpler tosecure.
This practice of centralized management has fueledthe growth and proliferation of WLANs. The number
1http://www.muniwifi.org.2arubanetworks.com, merunetworks.com, symbol.com,trapezenetworks.com.

Mobile Netw Appl (2009) 14:798–814 799
of enterprise deployments and the average number ofAPs in each enterprise WLAN is increasing exponen-tially every year [1, 4, 5]. With increasing budgets,enterprises have now shifted their deployment objec-tive from providing just basic complete coverage todesigning dense WLANs with redundant layers of APs.These redundant APs are dimensioned to provide veryhigh bandwidth in situations where hundreds of en-terprise clients simultaneously run bandwidth-intensiveand delay-sensitive applications. One example of suchan enterprise WLAN is installed at Intel Corporation’sbuildings in Portland, Oregon, where 125 APs havebeen deployed at distances of about 5 m from eachother, within a single four floor building. Another ex-ample is the Microsoft campus at Redmond, WA, whichwill soon have a 5,000 AP centralized WLAN on theircampus [4].
Although redundant capacity benefits enterpriseusers during times of peak demands, our recent studiesshow that peak demand rarely occurs [10]. In fact, onlya small fraction of APs are utilized during the day, andeven fewer during nights and weekends. The majorityof the APs frequently remain idle, which means theyserve no users in the network. In this paper, we extendthese studies to show that not only do the majority ofthe APs remain idle at any instant, they remain idle forlong time intervals—on the order of up to several hours.We believe these studies are representative of the usageof thousands of WLANs deployed worldwide. More-over, as more enterprises add redundancy within theirnetworks, the number of idle APs will increase.
Unfortunately, idle WLAN resources mean wastageof the energy consumed while they remain idle. Tensof thousands of idle APs worldwide are collectivelywasting a significant volume of energy every day. This isa significant problem that has received little attention—and as the number and size of enterprise WLANsincrease, energy wastage is bound to escalate. A similarescalation of power consumption has been observed inInternet-related equipment and in storage and data-centers in the past 20 years [7–9, 16]. Internet-relatedequipment now consumes 74TWh of electricity everyyear costing $6 billion in the United States alone. Thisescalation of power has recently become a serious con-cern. The rapid expansion and proliferation of WLANsat a compound annual growth rate of 32%3 are addingto these costs.
In this paper, we propose that the basic design ofenterprise WLANs must change soon and that WLANsmust adopt power conservation as a fundamental de-
3More statistics are located at http://www.itfacts.biz.
sign goal. Most importantly, we believe that powerconservation should be made a design goal today, sothat the high-density enterprise WLANs that are be-ing rapidly deployed worldwide can soon have powerconservation as a built-in feature. This will mitigatethe harder task of retrofitting all WLANs with powerconservation strategies.
Towards achieving power conservation in high-density WLANs, we advocate the adoption of highly-efficient resource management strategies. Thesestrategies must enable WLANs to scale power con-sumption with user demand. In other words, WLAN re-sources should be made available to users on-demand,when and where they need them, without hamperingcoverage and/or client performance. APs, switches,and controllers should be powered off when no usersare present, and powered on based on the volume andlocation of user demand. However, to ensure completecoverage, resources should be powered off in onlythose areas serviced by multiple layers of APs so that asingle layer of complete coverage can be maintained atall times. Such a policy will also ensure that enterpriseclients will always have access to the WLAN in theenterprise, independent of the time of day.
To this end, we propose and implement SEAR(Survey, Evaluate, Adapt, and Repeat), a practicalpolicy-driven RoD strategy for high-density WLANs.SEAR uses real online measurements to provide anecessary but sufficient set of resources that ensurescomplete coverage and provides sufficient bandwidthto enterprise users. SEAR’s main objective is tomaintain client connectivity and performance whilereducing power wastage. SEAR can save power in anyWLAN relative to the WLAN’s usage characteristicsand/or topology. In other words, on one hand, a highlyredundant WLAN with several layers of overlappingcoverage that is not utilized thoroughly is a candidatefor higher power savings. On the other hand, a heavilyutilized network with a single layer of basic wirelesscoverage can save very little. WLAN administratorscan choose to adopt conservative or aggressive policiesof SEAR to trade-off power savings with clientperformance. Regardless of the policy chosen byindividual WLAN administrators, the use of SEARin the thousands of WLANs will collectively save asignificant volume of energy. SEAR is the first steptowards saving energy in WLANs and opens severalnew research directions, as discussed in Section 6.
In a position paper we published earlier [10], weidentified the power wastage problem in high-densityWLANs and estimated the power savings from a simpledistance-based clustering algorithm implemented in acustom Perl simulator. In this paper, we significantly

800 Mobile Netw Appl (2009) 14:798–814
extend our initial proposal, with the following specificcontributions:
• Detailed discussion of the problem of energy was-tage in large-scale WLANs due to the hundreds tothousands of idle APs world-wide.
• Description of resource management strategies forpower conservation in WLANs and the impact ofdesign choices.
• The design of a new practical policy-driven RoDstrategy called SEAR. SEAR uses measurementsto dynamically power on or off WLAN APs basedon the location and volume of user demand, andmanages user associations to ensure complete cov-erage and sufficient bandwidth to users.
• Demonstration of SEAR’s deployment feasibilitythrough its implementation on two wireless net-works in our department building, using simplemodifications to the current WLAN AP device dri-vers and network architecture.
• Determination of SEAR’s deployment successthrough the study of three key metrics: coverage,client performance, and client (re-)associations.
2 High-density WLANs
In this section we discuss the architecture of a typicalhigh-density, centralized WLAN. We present case stud-ies of two enterprise WLANs, highlighting their activeand idle usage patterns. These case studies show thatenterprise WLANs in different scenarios experiencesignificant idle times. Because of these idle times, aRoD strategy such as SEAR can be used to save energy.
2.1 Architecture
Traditional WLANs consist of APs that provide simplenetwork connectivity for wireless devices in an area.Each of the APs is attached to a wired switch onthe network. Each AP independently executes associ-ation, authentication, IP address acquisition, and dataexchange operations with the WLAN users. This in-dependent execution results in a significant manage-ment challenge for the hundreds of APs in a singleWLAN. To simplify configuration and managementof large-scale enterprise WLANs, companies such asAruba, Meru, Symbol, Trapeze, and Cisco are now sell-ing WLANs that can be managed centrally, as shownin Fig. 1.
In centralized WLANs, the APs, called thin APs,provide a simple point of attachment for WLAN users.The APs are connected to switches that form the wired
Internet
CentralController
Users
Switches
APs
Router
GRE Tunnel
Figure 1 A centralized WLAN infrastructure
back-haul of the WLAN. These APs execute time-critical, but non-intelligent functions of responding toclient probe requests, and transmitting periodic beaconframes that provide clients with the AP’s capabilityinformation. Other complex MAC layer functions, suchas authentication, association, data processing, and dataacknowledgments, are all executed at the central con-troller. The APs and the controller communicate us-ing GRE or LWAPP tunnels formed over the wiredbackhaul network [3]. Each AP encrypts all MAClayer frames received from clients and tunnels thoseframes to the central controller. Similarly, the centralcontroller tunnels MAC-layer frames to each clientvia the AP with which the client is associated. Thewired back-haul consists of either a single or multiplelayers of inter-connected switches, depending on theWLANs’ deployment characteristics. In many WLANs,the switches also power the APs via IEEE 802.3af-specified Power-over-Ethernet (PoE) ports.
2.2 Redundancy
The objective of enterprise WLAN deployments hasmoved beyond just ensuring basic coverage to all areasof the enterprise. Now, enterprise WLANs provide sev-eral additional, or redundant layers of non-interferingAPs with overlapping coverage areas. Such redundantlayers of APs provide sufficient capacity for high band-width demands and also protect the network againstfaults and failures. The number of redundant layers ofAPs varies based on the usage characteristics, designpolicies, and budget restrictions of the enterprise.
2.3 Case studies
In this section we present case studies from two dif-ferent large-scale enterprise WLANs. The first WLAN,deployed inside a building of the Intel Corporation inOregon, consists of 125 APs deployed on four adjacentfloors of a single building. Each floor of the buildingis 80 m × 38 m. The APs are deployed such that one

Mobile Netw Appl (2009) 14:798–814 801
AP serves four to six office cubicles in the immediateproximity of the AP. This results in a high-density ofAPs in the building. The WLAN’s purpose is to providesufficient capacity for the four closest users using voice,data and multimedia applications simultaneously. Thesecond WLAN, deployed on the Dartmouth collegecampus [1], consists of 500 APs spread across 188 build-ings in a 4 km × 5 km area. The purpose of this WLANis to provide basic Internet connectivity to users.
To understand the usage patterns of the APs ineach WLAN, we use Simple Network ManagementProtocol (SNMP) logs collected from each AP at 5-minintervals for a period of 1 month in June 2006 for theIntel WLAN and November 2004 for the DartmouthWLAN [13]. Each SNMP log contains a record ofthe number of users associated with the AP, and thenumber of traffic bytes sent and received between eachuser and the AP. We use this information to computetwo metrics, the percentage of idle APs and the idle APduration, to better understand the usage characteristicsof the APs in both WLANs.
Percentage of idle APs: WLAN APs are consid-ered idle when no users are associated with the APsand therefore the APs are not sending or receivingdata traffic. We compute the percentage of idle APsthroughout each time interval out of all APs in eachWLAN using the SNMP logs. Figure 2a and b shows thepercentage of idle APs per hour in WLANs A and B.The peaks and troughs in the figures indicate night andday times, respectively. We observe that 10% to 80% ofthe APs in the Intel WLAN are idle during the month,whereas 20% to 65% of the APs are idle in DartmouthWLAN. A smaller percentage of Dartmouth WLANAPs remain idle because of its lower density of APs;users have fewer choices of APs for association. As a
result, an AP is more likely to be used by one or moreusers.
AP idle duration: The AP idle duration metric indi-cates how long each AP remains idle before at least asingle user associates with the AP. Using SNMP logsfrom both WLANs, we show in Fig. 2c the CCDF ofthe lengths of time each AP remains idle during thedata collection period of 1-month. We observe thatmore than 70% of the Intel WLAN APs are idle formore than 60 contiguous minutes, while more than 50%of the Dartmouth WLAN APs are idle for more than60 min. Some of the APs remain idle for more thana full day. These idle times can also be attributed tonights and weekends when few or no users associatewith the APs.
2.4 Power consumption: how much?
In centralized WLANs, the three main consumers ofenergy are APs, switches, and controllers. Each APtypically draws up to 10 W power from PoE ports onPoE-compatible switches, from the 15.4 W allocatedper port by PoE specifications. Each WLAN switch,with 24 to 72 PoE ports, consumes up to 350 W eachper hour. This consumption of 350 W is in addition tothe power the switches supply to the APs connectedto them. Commercial central controllers of centralizedWLANs provided by Aruba, Meru, Trapeze, Symbol,and Cisco, that can manage up to 512 APs and 8,192users, consume up to 466 W.
Based on these numbers alone, 100 APs consumeabout 8.76 MWh of energy per year. Such energyconsumption in tens of thousands of APs is far fromnegligible even today—and will continue to increase asWLAN densities increase.
0 1 2 3 40
20
40
60
80
100
Time (Week)
Per
cent
age
of id
le A
Ps
(a) Percentage idle APs in Intel WLAN.
0 1 2 3 4 50
20
40
60
80
100
Time (Week)
Per
cent
age
of id
le A
Ps
(b) Percentage idle APs in Dartmouth WLAN.
0
0.1
0.2
0.3
0.4
0.5
0.6
0.7
0.8
0.9
1
AP idle time (Minutes)
CC
DF
(P
[X >
x])
Intel WLANDartmouth WLAN
1 hour
1 day
1 2 3 4 510 10 1010 10
(c) AP idle times in both WLANs.
Figure 2 Percentage of idle APs per hour and idle times of APs in Intel and Dartmouth WLANs

802 Mobile Netw Appl (2009) 14:798–814
2.5 Power wastage: does it matter?
Today, 74 TWh of electricity is consumed by Internet-related equipment installed in the United Statesalone [8]. This consumption of energy has increaseddramatically only in the past 20 years. Research in-stitutions and universities are currently devising tech-niques to reduce consumption in such networks anddevices. Similar trends in the wireless networking in-dustry are adding to this power consumption. The en-terprise WLAN market is growing at the compoundannual growth rate of 32%,4 with more than 50% of theorganizations in the US deploying WLANs. BecauseWLANs are known to increase work productivity, en-terprises are investing in denser deployments of WLANAPs. Aruba Networks, the leading WLAN vendor, hasreported acquiring 100 new customers for their central-ized WLANs per quarter, with an average of 75 APs perWLAN.5 Tropos, a leading wireless mesh network ven-dor, has deployed more than 500 mesh networks in citydowntowns and other municipal areas with hundredsof routers.6 As millions of dollars are spent on denseWLAN deployments, the aggregate power wasted ineach of those WLANs will rapidly increase since theyare unlikely to be used at their peak capacity at alltimes.
2.6 Power conservation: why now?
We believe that serious steps need to be taken assoon as possible to reduce energy consumption beforemore access points and routers are deployed aroundthe world. If energy conservation is not given a seriousthought today, wireless devices will continue to wasteenergy. Moreover, rewiring a four-storey building costsfive times more than a new deployment itself.7 As aresult, a significant amount of power could be saved ifWLANs were designed with power conservation as adesign goal [10].
While wireless networks of different usage charac-teristics are likely to save different volumes of energy,we believe that any power savings within a networkwill contribute to large cumulative savings worldwide.For that matter, even if all the wireless access pointsdeployed in homes adopt power conservation strate-gies, the cumulative savings will be enormous. Powerconservation in WLANs is similar to the Energy Star
4http://www.itfacts.biz/.5http://www.arubanetworks.com/company/press/2005/07/18.6http://www.tropos.com.7http://www.arubanetworks.com/technology/.
initiative where close to negligible savings within 300million household products have cumulatively saved$14 billion in the year 2006 alone.8
3 Resource on-demand WLANs
To reduce the unnecessary wastage of energy in large-scale and high-density WLANs, we introduce thenotion of Resource On-Demand (RoD) WLANs. Themain objective of RoD WLANs is to efficiently man-age WLAN resources to save energy while ensuringscenario-specific end-user performance guarantees.When user demand is scarce, RoD WLANs reduceresource redundancy by strategically powering offWLAN resources (APs, switches, and routers). As aresult, WLAN coverage is still maintained; only redun-dant coverage is reduced. When user demand increases,WLAN resources are powered on to scale resource andcoverage redundancy proportionately. In high-densityWLANs, RoD strategies will thus reduce energy was-tage without adversely impacting coverage and end-user performance.
3.1 RoD strategy classes
RoD WLANs can adopt two different classes of oper-ating strategies, as described below.
Demand-driven: Using demand-driven RoD strate-gies, WLANs can power on or off resources based onthe user demand assessed by the WLAN at a giventime. The determination of demand is based on thecomputation of one or more appropriate parameters,such as the number of active users in the network andthe volume of offered traffic load. In typical demand-driven strategies, the WLAN’s central controller peri-odically collects information from the APs, estimatesuser demand using scenario-specific parameters, andthen computes the best set of APs, switches, and routersthat will satisfy the estimated user demand. The advan-tage of these strategies is that the WLAN can, at alltimes, ensure high energy savings and satisfy end-userperformance. However, the trade-off is in the overheadof assessing user demands and continuously reconfigur-ing the APs. Therefore, demand-driven strategies aresuitable in scenarios where the user demand may varysignificantly over time. For instance, demand-drivenRoD strategies may be used on university campuseswherein user demand is expected to vary significantlyon a daily, as well as seasonal, basis.
8http://www.energystar.gov/.

Mobile Netw Appl (2009) 14:798–814 803
Schedule-driven: Schedule-driven RoD strategies usepre-determined schedules to power on and off spe-cific WLAN resources. These schedules can either bedetermined from WLAN historical usage patterns orcan be based on the administrators’ experience. Theadvantage of using schedules stems from their min-imal processing overhead. However, the trade-off isthat they fail to power on or off the necessary andsufficient set of resources during times of unexpectedchange in user demand. As a result, schedule-drivensolutions are suitable for scenarios where user demandis closely predictable. For instance, during most confer-ences and meetings, schedules are predetermined andusers are expected to primarily be present during meet-ing times [11]. In such scenarios, network managersmay decide to power all the APs before a meeting be-gins and power all of them off shortly after the meetingis over.
3.2 RoD WLAN design requirements
To ensure the successful adoption of RoD solutions intoday’s WLANs, both classes of RoD strategies shouldfollow a set of design requirements. These require-ments allow RoD strategies to achieve their objectiveof conserving energy without adversely impacting end-user performance. The requirements for an RoD strat-egy are the following:
Requirement 1: Ensure coverage: A good RoD strat-egy is required to maintain the same coverage as itsalways-on counterpart. In other words, powering offAPs must not create coverage holes where users cannotreceive service.
Requirement 2: Maintain client performance: A goodRoD strategy should offer the same service to clientseven when part of the infrastructure is off. Clientservice levels can be maintained by avoiding WLANtopologies in which clients are far away from their clos-est AP or in which an AP is required to support so manyclients that congestion occurs. Within such topologies,clients may experience an increase in packet loss orreduction in the sustainable transmission rate due toweak wireless links or congestion. A good RoD strategyshould be able to deliver performance equivalent tothat of an always-on network.
Requirement 3: Avoid frequent client re-associations:The powering on and off of WLAN APs by RoDstrategies can force clients to change their associationsbetween APs. Frequent re-associations are undesirablebecause re-association delays can break clients’ trafficflows and thereby impact their performance. A good
RoD strategy should avoid frequent client disconnec-tions from the WLAN.
Based on these requirements, we develop a RoDstrategy called Survey, Evaluate, Adapt, and Repeat(SEAR). In the following section, we discuss in detailthe design of SEAR, and feasibility of deploying SEARin current WLANs.
4 SEAR
SEAR is a demand-driven RoD strategy for WLANsthat efficiently manages APs in high-density WLANsand adheres to the design requirements discussed inSection 3. Because it is policy-based, it can be tailoredto achieve the performance desired by WLAN adminis-trators. Based on the policies used, SEAR can conserveenergy while maintaining the same performance clientsreceive in the always-on WLAN. SEAR is designedto be demand-driven because it can then be easilydeployed as well as effectively save power within a widevariety of WLAN scenarios.
SEAR resides on the central controller of a central-ized WLAN through which it can control all APs. Sim-ilar to commercial central WLAN controllers, SEAR isassumed to have complete knowledge of the physicalpositions and state of all APs so that it can efficientlyachieve the desired performance and also power theAPs on or off as necessary. SEAR uses intelligent tech-niques to collect user and traffic information from theAPs to accurately estimate user demand. Based on theoperation policies chosen by network administrators,SEAR powers on or off APs to save energy, whileat most minimally impacting end-user performance.While in the absence of a central controller, distributedstrategies such as Wake-on-WLAN [15] can be utilizedto power on or off APs based on the APs’ local in-formation, we believe that by leveraging the informa-tion collected by a central controller, SEAR can makebetter decisions to save more energy. The operationof SEAR is comprised of four components, as shownin Fig. 3: green clustering, user demand estimation,topology management, and user association manage-ment. The green clustering algorithm clusters APs andselects one cluster-lead AP per cluster. SEAR uses theinformation provided by the green clustering algorithmto initiate a cycle of estimating user demand and per-formance, powering on or off APs, and managing user(re-)associations. SEAR is a demand-driven strategy asdiscussed in Section 3, because we intend to presenta generic RoD framework for any centralized WLANindependent of traffic load characteristics; in WLANswhere traffic load is predictable, a schedule-driven

804 Mobile Netw Appl (2009) 14:798–814
Topology ManagementPower on or off APs
based on estimated demand [Section 4.3]
Demand EstimationEstimate user traffic volume
and/or performance [Section 4.2]
User Management(Re-)Associate clients
based on topology changes [Section 4.4]
Green ClusteringForm AP clusters
& select the cluster-lead APs[Section 4.1]
SEAR
Figure 3 Components of SEAR
strategies may be utilized in order simplify the opera-tion of SEAR. In this section, we discuss in detail thedesign of SEAR’s components and their advantagesand trade-offs.
4.1 Green clustering
SEAR uses a clustering algorithm, called green-clus-tering, to form clusters of APs that are close to eachother. The premise of green-clustering is that if APsare in close proximity, a single AP from each of theseclusters of APs is sufficient to provide basic coverage tousers in the vicinity of any AP within that cluster. As anillustrative example, consider five APs A to E shownin Fig. 4a placed within close proximity. In Fig. 4b, APE provides coverage to the areas covered by APs Ato E. Moreover, the transmit power of the single APs’radio can be increased to provide extended coverage, asillustrated in Fig. 4b. In such a way, users within thenew cluster coverage region will be able to maintainthe same high data-rates, regardless to which AP inthe cluster they are connected. Formation of green-
E D
A
B
C
(a) (b)
C
DE
A
B
AP coverage regions Cluster coverage region
Figure 4 Illustration of cluster formation
Figure 5 Green-clusterformation algorithm
(a) (b)
(c) (d)
2 4 2
3
1 1
3
1
1
2
0
clusters is feasible in high-density WLANs such as theones described in our case studies in Section 2. Thisis because redundant APs are deployed close to eachother with overlapping coverage areas to provision highcapacity to users in their close proximity. The followingsections describe the steps of green-clustering.
4.1.1 Neighborhood discovery
In the first step of green-clustering, we determine whe-ther two APs i and j that belong to the same WLAN canbe members of the same cluster. Consider the APs inFig. 5a as an example of a set of APs in a WLAN. TwoAPs in a WLAN can be members of the same clusterif they are in close physical proximity of each other.We use a passive measurement technique to determinethe proximity of APs. In this technique, the centralcontroller configures each APs’ radio to the same chan-nel for a 1-min interval, even while the APs provideconnectivity to users in the WLAN. The APs then usea virtual interface9 to monitor the beacon messagessent by other APs in the network.10 The 1 min intervalis long enough for the central controller to configureall APs and to record beacon messages over severalseconds. Intervals longer than 1 min may be used ifthe channel characteristics are observed to vary signifi-cantly over the minute. Each AP i records the numberand signal strength of beacon messages received fromall APs. If the median number of beacon messages APi receives from every other AP j per second is denotedas α(i, j) and the median signal strength of the beacons is
9The MadWiFi device driver for Atheros chipset wireless cardsallows devices to use an AP mode as well as a sniffing monitormode to operate simultaneously over the same physical wirelessinterface.10Beacon messages are typically sent by APs at 100 ms intervalsto announce their presence to the clients in the network.

Mobile Netw Appl (2009) 14:798–814 805
denoted using β(i, j), then two APs i and j are assumedto be in close proximity to each other if and only if:
α(i, j) ≥ Nthresh and α( j,i) ≥ Nthresh, and
β(i, j) ≥ Sthresh and β( j,i) ≥ Sthresh
where Nthresh and Sthresh are pre-determined thresholdsfor the median number of beacons per second and themedian signal strength of the beacons, respectively. Wecall the relations shown above the Neighborhood APcondition. For our experiments, we choose Nthresh andSthresh as 9 and −50 dB, respectively. A value of 9for Nthresh ensures that for a pair of APs to belongto the same cluster, they should be close enough sothat both the APs reliably receive at least 9 out of10 beacons from each other.11 We choose Sthresh as−50 dB. These threshold values ensure that the APs arein very close proximity to each other and their wirelesssignals are minimally attenuated due to walls, furniture,doors, windows, or other physical objects. Our choicesof threshold values ensure that the clients in close prox-imity of either AP i or j will receive high packet deliveryfrom either of the two APs.12 In Section 5 we show thatthese values yield good clusters in our evaluation.
Using this technique, every i and j pair of APsis evaluated for its neighborhood AP conditions. Thepairs of APs that satisfy the above condition are addedto each others’ neighborhood sets. At the end of eachmeasurement cycle, which can occur as little as once aday, the neighborhood sets Ri of all APs i in the WLANare computed. For instance, in Fig. 5b, the dotted linesbetween APs indicate that the pair of APs belong toeach others’ neighborhood sets. The measurement cy-cle can be executed once a day when significant changesin the physical characteristics of the scenario are notexpected within the day. These measurements requireall the APs to be configured on the same channel,which, if done frequently, can negatively impact end-user performance. However, shorter time intervals formeasurements can be used in more dynamic scenarios.
4.1.2 Cluster formation
The second step of green-clustering uses the neigh-borhood sets for all APs to form clusters of APs. Weutilize a fast greedy clustering approach, similar to thealgorithm suggested by Bejerano [6]. Consider Ri asthe neighborhood set of AP i, and ni ← ‖Ri‖ as the
11From our experiments we find that requiring each AP to receiveall 10 beacons from its neighbors is an overly strict requirement.12These values are similar to those presented in a recent study byReiss et al. [18].
number of neighbors present in the neighborhood ofAP i. The ni values for all APs are shown in Fig. 5b. An-other set C is used in this algorithm, which consists ofinformation on the clusters of the APs and the membersof each cluster of AP. Cluster set C is initialized to 0,C ← ∅. We then select an AP i with the largest ni atany iteration of cluster formation. We use the AP withthe maximum ni because that AP i is likely to form thelargest green-cluster in the WLAN. In our example, theAP with ni = 4 is chosen as the AP to form the firstcluster.
Once i is chosen, we instantiate Cv as a cluster, addi as the first member of the cluster, and simultaneouslyremove i from all neighborhood sets of other APs. Oncei is added and Cv is formed, we step through all theAPs j in the neighborhood set Ri and add them to Cv
as long as every new j that is added to Cv is in theneighborhood set of every other AP already added toCv . We call this the δ-cluster condition [14]. If the APj satisfies the δ-cluster condition and is added to thecluster Cv , j is removed from the neighbor sets of all itsneighbor APs k, and the nk value for all ks is updated.This is shown in Fig. 5c where the APs that form acluster are removed from the neighborhood sets of allother APs; their updated ni values are also shown. Weremove an AP from all the other neighborhood setsto ensure that each AP is a member of only a singledisjoint cluster. Also note that we include APs in acluster if and only if they satisfy the δ-cluster condition,because otherwise the clients in the vicinity of a clustermay be too far away from an AP in the cluster tomaintain a connection.
Once all the APs that satisfy the δ-cluster condi-tion have been added to cluster Cv , AP i is madethe cluster-head of the cluster, and all the other APsare tagged as secondary APs of Cv . This algorithm ofcluster formation from the neighborhood set of eachAP is iterative in the sense that APs are added toa cluster at every iteration and removed from neigh-borhood sets simultaneously. Since each WLAN con-sists of a fixed number of finite APs and becauseAPs are added to only a single disjoint cluster, ouralgorithm is bound to achieve a definite solution [6].The final clusters of APs from Fig. 5a are shown inFig. 5d.
Once SEAR forms green clusters of APs, the cluster-head APs from each cluster remain powered on bydefault at all times. Since the APs within a cluster arein close proximity from each other, all the clients withinthe same cluster region will be able to communicatewith the cluster-head AP without impacting their per-formance. Moreover, since the transmit power of APsin a high-density WLAN is often reduced significantly

806 Mobile Netw Appl (2009) 14:798–814
to avoid excessive overlapping of AP coverage areas,the cluster-head AP of each cluster may increase itstransmit power by default so that the WLAN maintainsthe same coverage as an always-on WLAN. An increasein the transmit power of the cluster-head AP avoidsan adverse impact on end-user performance and willnot increase the cluster-head APs’ power consumptionsignificantly either. In the next step of SEAR, we ex-plain how other secondary APs are powered on withinclusters based on the location and estimated volume ofuser demand in the network.
4.1.3 Trade-offs of clustering thresholds
SEAR’s measurements-based technique of forminggreen clusters ensures that APs that form clusters arein close proximity of each other. The constraints on thecloseness of the APs can be varied based on thresholdsof signal attenuation Sthresh and packet loss rate Nthresh
between APs. The choice of thresholds is a trade-off between power savings and client performance. Inother words, low thresholds are indicative of closerproximity between APs, which means smaller sizesof clusters, smaller power savings, but better clientperformance. Conversely, higher thresholds relax theclustering constraints, which results in larger clustersand more power savings—although, client performancemay deteriorate. Based on the acceptable performancebounds of WLANs, administrators can individuallychoose their thresholds and thereby control the relativepower savings within their WLANs. In Section 5 of thispaper, we use low thresholds of 9 and −50 dB to ensurethat APs that are extremely close to each other areclustered.
4.2 Demand estimation
One of the foremost tasks of any demand-driven RoDstrategy is user demand estimation within each green-cluster. User demand estimation assists SEAR in mak-ing strategic decisions to power on or off the WLANAPs within each cluster. An accurate estimate of userdemand is helpful in maintaining client performance,while achieving significant power savings.
The accuracy of the estimate is determined by a setof metrics as well as the usage characteristics of theWLAN. For instance, the count of users in a cluster isa simple metric to estimate user demand. However, theproblem with a simple count of users is that it can over-or under-estimate user demand within a cluster if manyusers generate little traffic or few users generate heavytraffic load, respectively. Alternatively, a metric suchas the data-rates of frames sent by clients can be used
because low frame data-rates indicate the occurrenceof frame collisions due to heavy traffic load within thecluster. Unfortunately, frame data-rates are not a directmeasure of the user demand in the network.
In this paper we use channel utilization (channelbusy time) to estimate user demand [12, 19], because itencompasses the user demand estimation properties ofuser count as well as data-rates. Channel utilization isdefined as the percentage of time the medium remainsbusy due to the transmission of bytes in the network ordue to inter-frame spacings.
Each AP in the WLAN continuously sniffs MAClayer data and control frames transmitted by all theclients and APs in its vicinity on the same channel,and computes both the aggregate channel utilizationof the medium in the vicinity of each AP, and thechannel utilization per client connected to that AP [12].Since the MadWifi wireless device drivers for Atheroswireless cards allow a single radio interface to be con-figured in AP mode as well as monitor mode, the APsmay sniff traffic without interrupting or impacting APoperations. The APs periodically send their computedchannel utilization values to SEAR’s central controller,along with the count of the number of clients associatedwith the AP and the channel utilization values for eachclient connected to that AP.
Using all this information sent by APs in the WLAN,SEAR establishes the area in the network with excessdemand, based on the cluster to which the APs belong,and the volume of user demand based on the channelutilization metric values computed at each AP. In thenext step, we describe how SEAR uses this channelutilization information to power on and off APs in theWLAN.
4.3 Topology management
At regular reconfiguration intervals Ireconf, SEAR usesthe information on channel utilization values per APand the number of clients connected to an AP to poweron or off secondary APs within a cluster. If the aggre-gate channel utilization value at any AP i exceeds apre-configured trigger threshold Tthresh and the numberof clients connected to that AP is greater than one,SEAR powers on an additional secondary AP withini’s the cluster. The intuition behind this policy is that ifmore than a single client causes the aggregate channelutilization at an AP i to increase to a value greater thanTthresh, then the cluster of APs to which i belongs ex-periences excess traffic load. As a result, SEAR shouldpower on another AP within the same cluster so thatthe clients have an additional AP to which they canconnect. If the number of clients connected to the AP is

Mobile Netw Appl (2009) 14:798–814 807
one, then powering on an additional AP will not reducethe load per AP because a single user’s load cannot bedistributed between two APs.13
Once the secondary AP within the same cluster ispowered on, SEAR ensures that the APs within thesame cluster are configured to appropriate channels,that minimize overlap. SEAR distributes the load fromthe clients between all the APs within the cluster sothat the clients receive better performance, as describedin the following section. If a secondary AP in theWLAN does not have any clients connected to it for aninterval of Tidle, the AP reports this to SEAR’s centralcontroller. The central controller powers off this AP sothat power can be saved.
Transmit power settings: The transmit powers of APsin high-density WLANs are often decreased in order toservice clients only in their close vicinity. An RoD strat-egy such as SEAR can therefore increase the transmitpower of APs when fewer APs per cluster are poweredon, and decrease the power as more APs are utilized. Adetailed algorithm for transmit power control in RoDWLANs is not discussed in this paper, and forms inter-esting future work. In our experiments, we maintain thetransmit power of all APs to their radios’ maximum of19 dBm (= 79 mW) at all times.
In the following section we discuss the techniqueSEAR uses to distribute users and load within APs of acluster once it powers on or off a secondary AP.
4.4 User management
As discussed in Section 3, one of the requirements ofa RoD strategy such as SEAR is to reduce associationinstability and maintain client performance. Because ofthis requirement, SEAR carefully manages the asso-ciation of users within the WLAN by reducing exces-sive roaming of users between APs. SEAR proactivelyswitches clients between APs in a cluster of APs tobalance the load detected within a cluster so that eachclient in the cluster experiences better performance.
Load balancing: At Ireconf intervals, SEAR powers onan additional AP within a cluster if any AP withinthe cluster reports “overload” to the controller. Letus call the aggregate channel utilization reported byan AP i as Ui; the number of clients connected with
13Note that a client in the WLAN is identified by the uniqueMAC address of its device’s wireless interface. As a result, de-vices with more than one wireless interface will be considered asmore than one client.
the same AP i as Ni; and the channel utilization perclient c connected with an AP i as Pc,i. SEAR’s centralcontroller generates a sorted list of clients per AP ibased on the Pc,i values.
The SEAR central controller’s next step is to movehalf the load from AP i to the new AP, say, AP j.SEAR moves half the load to the new AP in orderto evenly balance the load between the two APs sothat the clients connected with either AP experience anequally better performance. To achieve this movementof load, SEAR iteratively moves the client with thegreatest traffic load in the sorted list of clients from AP ito AP j. As the SEAR controller moves a client to thenew AP j, it updates the aggregate utilization of AP iby subtracting the per-client channel utilization of thatclient. The new aggregate channel utilization for AP iafter the subtraction is denoted as U ′
i , and utilization onAP j is denoted as U j. SEAR continues to move clientsfrom AP i to AP j until: U ′
i ≤ 12 × Ui and U j ≤ Tthresh. If
a move of a user from i to j leads to the violation of thesecond condition, then we proceed down the ranked listuntil we satisfy the terminating condition. The SEARcentral controller repeats this process of balancing loadfor all the APs that report an aggregate channel uti-lization value greater than Tthresh. SEAR chooses tomove the topmost client in the sorted list first becausesuch a move is likely to cause the fewest number ofclients to handoff from one AP to another. This strategythus complies with the requirement of an RoD strategyavoiding significant association instability.
We use the above load diversion strategy becauseit satisfies the third requirement of a good RoD strat-egy and is easy to implement and deploy. However,the design and implementation of more efficient loaddiversion mechanisms is interesting future work.
Enforcing user association: SEAR uses access controlblack lists to enforce a client handoff between APs. TheMadWifi Atheros chipset wireless driver allows an APto use such black lists of MAC addresses of clients. Ifthe MAC address of a client is present in that list, theAP will not allow the client to associate with it. Theadvantage of using black-lists on APs is that the clientsare forced to associate with only those APs on whichthey are not black-listed. As a client is moved from anAP i to AP j, the client is added to AP i’s black-list. Thisforces the client to disconnect from AP i and associatewith the new AP j.
While a black list-based strategy was effective inre-associating users in our implementation of SEAR,we could replace it by using the upcoming IEEE802.11v [2] standard where APs can explicitly ask usersto re-associate with an alternate AP.

808 Mobile Netw Appl (2009) 14:798–814
5 Evaluation
In this section we first justify the use of a central-ized RoD strategy through the evaluation of a simpledistributed strategy. Our evaluation demonstrates theweaknesses of a distributed approach. We then imple-ment and evaluate SEAR in two wireless networks toshow that it satisfies the three requirements of a goodRoD strategy. The main objectives of implementingSEAR in real networks are to: (a) understand theeffectiveness of implementing green clustering withincurrent wireless devices; (b) study the impact of greenclustering on end-user performance; and (c) evaluatethe feasibility of user and topology management strate-gies to successfully power on and off APs for energysavings under realistic traffic conditions.
5.1 Sniff-n-sleep RoD strategy
To begin, we first evaluate a simple distributed strategyfor RoD WLANs. We call this strategy Sniff-n-Sleep.Our objective is to show that a simple-to-implementdistributed strategy similar to Wake-on-WLAN [15]can be used to save energy in a WLAN, but haslimitations that are likely to degrade the performanceachieved by clients.
Sniff-n-sleep is a strategy in which each AP in aWLAN independently makes decisions to power itselfoff when it does not see any clients in its vicinity.The APs wake up after a sleep interval tsleep to checkwhether there are clients in the network requestingaccess. An AP remains powered on for tsniff and stayson upon the detection of a client unless that clientassociates with a different AP. Otherwise, it goes backto sleep.
We evaluate the sniff-n-sleep strategy to estimate theenergy savings and its performance implications in anoperational WLAN. For this purpose, we place ninewireless nodes next to nine IEEE 802.11b/g productionAPs deployed on two adjacent floors of our build-ing. The nine APs provide connectivity to the clientspresent on the two floors of the building; the locationof these nine APs are marked as squares and labeled A,D, G, H, I, J, K, L, and O in Fig. 6. The nine wirelessnodes are small form factor desktop machines runningthe Linux kernel 2.6 OS. We deploy these nodes to forma WLAN parallel to the production WLAN deployedin our building because the production WLAN is notopen for experimentation. In this way, our experimen-tal WLAN has coverage nearly identical to that of theproduction WLAN.
The wireless nodes we use for this evaluation consistof two wireless interfaces with Atheros chipset IEEE
Figure 6 The floor map of two adjacent floors of our building,indicating the locations of APs, cluster-head APs, and clients
802.11 b/g wireless cards that are controlled by theopen-source MadWiFI drivers. Both the interfaces areconfigured to operate in monitor mode and they sniffMAC layer frames on the same channel as their adja-cent AP. One wireless interface, called ifap, implementsthe sniff-n-sleep strategy by powering on and off basedon the client activity it observes in its vicinity. Whenthis interface is powered up, it records a time-stampedlist of all the wireless MAC layer frames transmittedby the clients in its vicinity. We call this list listap. Thesecond interface, called ifsniff , remains powered on allthe time and records a time-stamped list of all the wire-less MAC-layer frames transmitted by all the clients;the list is called listsniff . The wireless frames recordedby this interface will be the same as or very similar tothe frames that the adjacent production AP records.
We performed three sets of experiments, each for aduration of 7 days. In all experiments, we use tsleep =60 s. This value is short enough to avoid long clientwait times and long enough to avoid rapid poweringon and off of the AP. The problems with powering onand off APs rapidly is that it can cause several clientre-associations. We used three values of tsniff , 10, 30,and 60 s, for each of the three sets of experiments.The energy savings in each experiment are computedas the percentage of time the ifap interface is poweredoff over the total time for the experiment. We comparethe two lists listap and listsniff for each wireless node toidentify the frames ifap missed while it was asleep. Thedifference twait between the time when a missed framewas detected by ifsniff and the time at which ifap wakesup is defined as the wait time for the user in the network.

Mobile Netw Appl (2009) 14:798–814 809
We call this interval the wait time because a wirelessclient may have to wait twait before it detects an AP inits vicinity.
Figure 7 shows the CDF of wait times for users forthe three sets of experiments. Not surprisingly, there isa clear trade-off between the energy savings and userwait times for all three sets of experiments. In otherwords, short tsniff results in more energy savings buthigher user wait times. With a short tsniff , the AP sleepsmore often and does not spend enough time checkingfor the presence of users. Thus, users must wait for alonger duration before they can connect with the APagain.
The evaluation of the sniff-n-sleep strategy showsthat even though energy savings can be achieved bydeploying a simple strategy, the trade-off is that usersmust wait up to tsleep time before they can even detectthe presence of a WLAN. This wait time negativelyimpacts the user experience. Based on this conclusion,we believe that a well-coordinated strategy such asSEAR should be used to ensure complete coverage inthe network and prevent long association wait times.
5.2 Performance evaluation of SEAR
We evaluate SEAR to ensure that it satisfies each ofthe three requirements of a good RoD strategy listed inSection 3.2. Since one of the primary objectives of thispaper is to understand the feasibility of implementinga RoD strategy using current devices and software,instead of simulation, we use two wireless networks forour evaluation.
0 10 20 30 40 50 600
0.1
0.2
0.3
0.4
0.5
0.6
0.7
0.8
0.9
1
Number of Seconds
CD
F
tsleep
= 60 seconds, tsniff
= 10 seconds
tsleep
= 60 seconds, tsniff
= 30 seconds
tsleep
= 60 seconds, tsniff
= 60 seconds
Figure 7 CDF of wait times experienced by APs when tsleep =60 s, and tsniff is 10, 30, and 60 s. The percentage energy savingsfor the three sets are 71.2%, 57%, and 43%, respectively
The first network is a WLAN consisting of 15 APsand nine clients deployed on two adjacent floors ofour department building. The locations of these APsare marked as black squares and labeled AP A to APO in Fig. 6; there are six more APs deployed for thisexperiment than in the previous section. We deploythese extra APs to create a denser WLAN for therest of our evaluation. Using this network, we evaluatethe impact of SEAR’s green-clustering on WLAN cov-erage and client throughput, and compute the powersavings achieved using SEAR.
The second network of three APs and nine clientlaptops is deployed within a single room. We use thisnetwork to closely evaluate the impact of SEAR’s userassociation management mechanisms on the perfor-mance of a high density of clients.
5.2.1 Ensuring coverage
In this section we evaluate SEAR’s ability to maintainWLAN coverage: the first design requirement for agood RoD WLAN strategy.
Green cluster formation: We use our green-clusteringalgorithm from Section 4 to cluster the 15 APs in ournetwork. In our experiments, we set Nthresh and Sthresh
threshold values as 9 and −50 dB, respectively. Thepairs of APs that satisfy these thresholds are connectedby dotted lines in Fig. 6. The seven green clusters ofAPs, each consisting of 1, 2, or 3 APs are shown usingsolid lines between each other in Fig. 6. In each cluster,the cluster-head AP is identified by a solid triangle.
Although the APs in pairs (L, K) and (M, K) inFig. 6 are within close physical proximity to each other,they do not satisfy the neighborhood AP condition.This is because a thick wall and a metal cabinet existsbetween the APs which heavily attenuates the wirelesssignals. If the pair of APs were in the same cluster, wesuspect that the clients on either side of the wall maynot have been able to communicate with the AP on theopposite side. Based on this observation, we concludethat using our measurement-based approach for clusterformation is likely to yield clusters that ensure betterclient performance than an approach that uses Euclidiandistances between APs.
Client connections: Once the clusters of APs areformed, we place nine client laptops on two floors ofour department building. The locations of these laptopsare marked by stars in Fig. 6. We choose to spread theclients across the two floors of the department buildingbecause the objective of our experiments is to evaluateclient coverage and performance in a wide area of theWLAN. The clients are IBM Thinkpad Laptops run-
810 Mobile Netw Appl (2009) 14:798–814
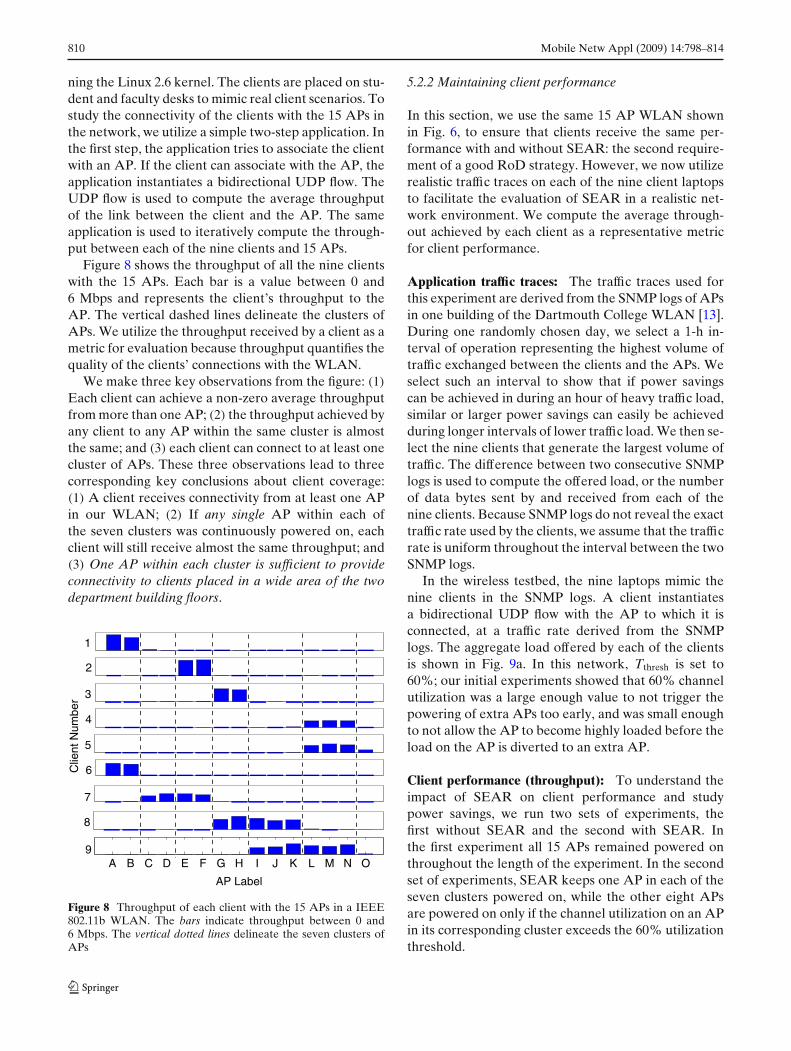
ning the Linux 2.6 kernel. The clients are placed on stu-dent and faculty desks to mimic real client scenarios. Tostudy the connectivity of the clients with the 15 APs inthe network, we utilize a simple two-step application. Inthe first step, the application tries to associate the clientwith an AP. If the client can associate with the AP, theapplication instantiates a bidirectional UDP flow. TheUDP flow is used to compute the average throughputof the link between the client and the AP. The sameapplication is used to iteratively compute the through-put between each of the nine clients and 15 APs.
Figure 8 shows the throughput of all the nine clientswith the 15 APs. Each bar is a value between 0 and6 Mbps and represents the client’s throughput to theAP. The vertical dashed lines delineate the clusters ofAPs. We utilize the throughput received by a client as ametric for evaluation because throughput quantifies thequality of the clients’ connections with the WLAN.
We make three key observations from the figure: (1)
Each client can achieve a non-zero average throughputfrom more than one AP; (2) the throughput achieved byany client to any AP within the same cluster is almostthe same; and (3) each client can connect to at least onecluster of APs. These three observations lead to threecorresponding key conclusions about client coverage:(1) A client receives connectivity from at least one APin our WLAN; (2) If any single AP within each ofthe seven clusters was continuously powered on, eachclient will still receive almost the same throughput; and(3) One AP within each cluster is sufficient to provideconnectivity to clients placed in a wide area of the twodepartment building floors.
Clie
nt N
umbe
r
A B C D E F G H I J K L M N O
AP Label
5
6
7
8
4
3
2
1
9
Figure 8 Throughput of each client with the 15 APs in a IEEE802.11b WLAN. The bars indicate throughput between 0 and6 Mbps. The vertical dotted lines delineate the seven clusters ofAPs
5.2.2 Maintaining client performance
In this section, we use the same 15 AP WLAN shownin Fig. 6, to ensure that clients receive the same per-formance with and without SEAR: the second require-ment of a good RoD strategy. However, we now utilizerealistic traffic traces on each of the nine client laptopsto facilitate the evaluation of SEAR in a realistic net-work environment. We compute the average through-out achieved by each client as a representative metricfor client performance.
Application traffic traces: The traffic traces used forthis experiment are derived from the SNMP logs of APsin one building of the Dartmouth College WLAN [13].During one randomly chosen day, we select a 1-h in-terval of operation representing the highest volume oftraffic exchanged between the clients and the APs. Weselect such an interval to show that if power savingscan be achieved in during an hour of heavy traffic load,similar or larger power savings can easily be achievedduring longer intervals of lower traffic load. We then se-lect the nine clients that generate the largest volume oftraffic. The difference between two consecutive SNMPlogs is used to compute the offered load, or the numberof data bytes sent by and received from each of thenine clients. Because SNMP logs do not reveal the exacttraffic rate used by the clients, we assume that the trafficrate is uniform throughout the interval between the twoSNMP logs.
In the wireless testbed, the nine laptops mimic thenine clients in the SNMP logs. A client instantiatesa bidirectional UDP flow with the AP to which it isconnected, at a traffic rate derived from the SNMPlogs. The aggregate load offered by each of the clientsis shown in Fig. 9a. In this network, Tthresh is set to60%; our initial experiments showed that 60% channelutilization was a large enough value to not trigger thepowering of extra APs too early, and was small enoughto not allow the AP to become highly loaded before theload on the AP is diverted to an extra AP.
Client performance (throughput): To understand theimpact of SEAR on client performance and studypower savings, we run two sets of experiments, thefirst without SEAR and the second with SEAR. Inthe first experiment all 15 APs remained powered onthroughout the length of the experiment. In the secondset of experiments, SEAR keeps one AP in each of theseven clusters powered on, while the other eight APsare powered on only if the channel utilization on an APin its corresponding cluster exceeds the 60% utilizationthreshold.

Mobile Netw Appl (2009) 14:798–814 811
1 2 3 4 5 6 7 8 90246
Client NumberAvg
. Thr
ough
put (
Kbp
s)
0 600 1200 1800 2400 3000 3600
2
4
Time (Seconds)
Clie
nt L
oad
(Kbp
s)
With SEAR Without SEARA A E E
G GM N M N
A AD C
I J K N
Client 1
Client 2Client 3
(a)
(b)
Figure 9 a Nine clients’ load in a 15 AP WLAN. b Averagethroughput received by the nine clients, without and with SEAR
Figure 9b shows the average throughput achievedby clients in both the sets of the experiments. Thelabel above the bars indicates the AP the client wasassociated with during the experiment. We observe thatwhen SEAR was used, the average throughput receivedby the clients 4, 5, 7, 8, and 9 is 1.2% to 7.1% less thanthe throughput received by them in the first set. Thissmall drop in average throughput occurs because someof the APs are powered off and the clients associatewith an AP that do not provide them with the highestthroughput. Fortunately, the drop in throughput is nottoo high. We believe that WLANs with a higher densityof APs and/or stricter neighborhood AP conditionsare likely to have an even smaller impact on clientperformance.
Power savings: In our experiments, SEAR did notfind the need to power on any extra APs in the network.This happened because the channel utilization on noneof the APs exceeded the 60% threshold. As a result,since only seven APs out of the 15 APs remainedpowered on, the power consumed by SEAR was about46%. We believe that greater power saving can beachieved in WLANs with a higher density of APs. Onthe other hand, a greater density of users and largertraffic volume will make SEAR power on more APs,and therefore the power saving is likely to be smaller.To closely study such dynamic behavior, in the nextsection we utilize a network that has three APs and nineclients congregated close to each other in a single room.
5.2.3 Performance of user management
In this section, we evaluate SEAR’s user managementmechanisms in a WLAN with a high density of users.
We study the power savings in this scenario and the cor-responding impact of SEAR on client performance. Weshow how SEAR strategically tries to move the fewestnumber of clients between APs, thereby avoiding fre-quent client re-associations: the third requirement of agood RoD strategy.
We deploy a wireless testbed of three APs and nineclients inside a single room, as shown in Fig. 10. Thenine clients are IBM Thinkpad laptops, with a Atheros-chipset IEEE 802.11 b/g wireless PCMCIA card man-aged by the MadWifi driver. The clients are placed onnine student desks, creating a scenario wherein the lap-tops represent nine wireless network users. The threeAPs are configured on orthogonal channels 1, 6, and11. The APs are placed at an elevation of 7 ft to modela typical WLAN scenario. The APs and clients donot utilize the RTS/CTS mechanism. SEAR’s centralcontroller and the three APs communicate via the APs’Ethernet interface.
Traffic traces: In this experiment, we use the sametraffic traces from the Dartmouth College WLAN aswe used in the previous section. However, in addition tothe traces derived from the 1 hour interval of maximumtraffic volume, we also utilize traces from another 1 hinterval of the same day that experienced the lowesttraffic volume. We again pick nine clients from the lowtraffic interval that have the largest volume of the trafficduring that interval. We evaluate the performance ofthe nine clients during both the low and high 1-h trafficvolume intervals and thus motivate the need for the useof RoD strategies in such scenarios.
Experimental setup: In our experimental setup, thethree APs form a single cluster. APA, as shown in the
AP
AP
AP
A
B
C
SEAR
Central
Controller
8m
8m
Client
Laptops
Figure 10 Layout of APs and clients in the 12-node wirelesstestbed

812 Mobile Netw Appl (2009) 14:798–814
1 2 3 4 5 6 7 8 90
50
100
Meg
aByt
es
1 2 3 4 5 6 7 8 9
50010001500200025003000
Client Number
Meg
aByt
es
Offered Load
Client Throughput
Client Throughput with Load Diversion
(b)
(a)
Figure 11 Aggregate offered load and throughput received bynine clients during the 1-h a low traffic interval, and b high trafficinterval
center of Fig. 10, is the cluster-head AP and thereforeremains powered on at all times. APB and APC arepowered on only when the SEAR’s central controllerdecides to divert users and user load on to an ex-tra AP based on the information it receives from thealready-powered on APs.14 Tthresh is again set to 60%.We choose Ireconf as 5 s so that the SEAR controllercan adapt quickly to traffic conditions. Extra APs arepowered on if needed. Longer Ireconf values may causean increase in the time the central controller takesto power on extra APs but reduces the processingoverhead at the controller. In scenarios where burstsof traffic are rare, larger Ireconf values may be used.We choose Tidle to be 10 s, so that if no clients areassociated with APB or APC they can be powered downwithin 10 s of inactivity to save energy. Also, in ourexperimental scenarios we do not expect the load inthe network to increase just after we shutdown APsafter the Tidle interval. A short Tidle interval can causefrequent powering on and off of APs and frequentswapping of clients between APs, and therefore, inscenarios where the traffic load peaks frequently inshort intervals, a longer Tidle value should be chosenappropriately.
Low traffic volume: Figure 11 shows the offered loadand throughput of the nine clients during the low and
14Note that the “powering on or off” of the APs in our testbedmeans that the wireless interface of the device is activated andshutdown, respectively—and not the entire device itself. In oper-ational WLANs, APs may be actually powered on or off to saveenergy.
high traffic intervals. We observed that during the lowtraffic interval (Fig. 11a), all the nine clients used APA
and SEAR’s central controller did not power on theremaining two APs because the channel utilization onAPA did not exceed the Tthresh threshold of 60%. More-over, each of the nine clients achieved an aggregatethroughput very close to their individual offered load.We conclude that in such low traffic periods, a singleAP within a cluster is enough to provide all clients withsatisfactory performance; extra APs are not needed.Thus, energy can be saved by leaving extra APs pow-ered off.
High traffic volume: On the other hand, Fig. 11bshows that when only a single AP was used to serviceall the users during the heavy traffic interval, the toptwo clients (labeled 1 and 2) experience a drop in theiraggregate throughputs. This performance degradationoccurs due to heavy contention and collisions in themedium caused by the large volume of packets sentby the clients and AP. This performance impact canbe seen more clearly in Fig. 12a, which shows theperformance of the client when only one AP was usedand SEAR’s load diversion is not used.
SEAR’s load diversion by user management: Whenload diversion is used, SEAR’s central controller dy-namically powers on APB and APC to handle the heavyoffered load generated by clients 1 and 2. This is shownin Fig. 12b. APB and APC are powered at instances indi-cated by P and Q, respectively. Client 1 first associates
0 600 1200 1800 2400 3000 36000
1000
2000
3000
4000
Clie
nt T
hrou
ghpu
t (K
bps)
0 600 1200 1800 2400 3000 36000
1000
2000
3000
4000
Time (Seconds)
Clie
nt T
hrou
ghpu
t (K
bps)
Client 1 on AP
Client 2 on AP
Client 2 on AP
Client 1 on AP
PQ
R
(a)
(b)
A
A
B
C
Figure 12 Time series plot of the throughput received by theclients during the heavy traffic load 1-h interval, a withoutSEAR’s load diversion mechanism, and b with SEAR’s loaddiversion mechanism

Mobile Netw Appl (2009) 14:798–814 813
with APA. When the load on APA increases such thatthe channel utilization increases to greater than 60%,APA sends a trap to SEAR’s central controller. Thecontroller uses the load diversion strategy describedin Section 4 and powers on APB. It then uses access-control black-lists to handoff client 1 from APA toAPB. The handoff of client 1 takes about 6 s duringwhich client 1 receives no traffic. Later, at an instanceindicated by Q, the traffic in the network increasesagain—and this time SEAR powers APC and hands-offclient 2 to the new AP. Client 2 also takes about 6 s forthe handoff and receives no packets during that delay.Client 2 is diverted to APC and not APB because APB
is already handling the heavy load of client 1 at time Q.The remaining 7 clients in these experiments continueto be connected to APA.
We observe that the heavy volume of traffic is bal-anced between the three APs and therefore each clientand AP receive a high aggregate throughput. Further,the high bandwidth demands of clients 1 and 2 aremet. The minimal 4% and 2% drop in the aggregatethroughput experienced by clients 1 and 2, respectively,is because of the 6-s handoff delay and the contentionexperienced by the clients just before SEAR poweredon an extra AP. During this high load interval, we seethat the two secondary APs were also powered. WhileAPA and APC remained powered throughout the 1 h,APB was powered off at an instance indicated by R,10 s after Client 1 left the network. This results in about16% aggregate power savings achieved during the 1-hhigh load interval.
Although the handoff delay of 6 s is short enough toprevent clients’ active TCP flows from disconnecting,shorter handoff times can be achieved easily using asmart hand-off algorithm [17] or by deploying the up-coming IEEE 802.11v standard [2].
Our experiments show that in high-density WLANsit is possible to save energy during the intervals of lowload by powering off secondary APs. Secondary APsare only required during heavy load and they can bepowered on-demand with minimal impact on client per-formance. As shown in Table 1, many fat APs we testedpower on in 13 to 35 s, and therefore, clients can easilyremain connected with any already powered-on AP
Table 1 Boot time and power consumption of APs computed byexperimentation and a power meter
Device Boot time (s) Power consumption (W)
Lucent WP-II E 35 11Soekris 5501 25 8.2Linksys WRT54G 13 7DLink DI524 12 5
until the SEAR central controller boots a secondaryAP. Thin APs in centralized WLANs can be pow-ered on much faster. Moreover, clever load predictionalgorithms may be designed to power on secondary APsearly to reduce the impact of boot times.
6 Future research directions
In this section, we discuss future directions of researchin RoD WLANs.
Client performance estimation: Estimation of clientperformance in a production network is a difficult prob-lem to solve because of the large number of metriccombinations and little knowledge of clients’ intendednetwork activities. For RoD WLANs, solving this prob-lem is important because the powering on and offof APs can be better controlled if the network canaccurately detect an impact on client performance. Inthis paper we use client throughput as a performancemetric because it provides a good estimate of client per-formance. However, alternative metrics such as framedata-rate and signal strength, or a combination of themmay be used based on the performance objectives ofeach WLAN.
Topology control algorithms: In this paper we usethreshold-based schemes for powering on or off APs.While such schemes are easy-to-implement and havebeen shown to achieve significant energy savings, webelieve that mature control algorithms should be de-veloped to make smarter decisions in RoD WLANs.Smarter load diversion and hand-off techniques [2, 17]may be used to further minimize the impact of SEARon client performance.
Client participation: We envision future WLAN sce-narios wherein clients actively participate in conservingenergy by informing the WLAN about when they needresources, how many, and for how long. In such scenar-ios, WLANs can generate schedules and power on APsonly during predetermined intervals of time.
Infrastructure support: Extra energy savings can beachieved if power-hungry switches and controllers inthe WLAN can also be powered off during intervalsof low demand. The powering off of switches and con-trollers may require WLAN managers to strategicallyre-wire APs to different switches so that the poweringoff of APs and the switches can be coordinated effi-ciently [10].

814 Mobile Netw Appl (2009) 14:798–814
Hardware modifications: Better hardware-basedpower standby modes can be used to save moreenergy and even further minimize the impact on clientperformance. Strategies such as SEAR can utilizespecialized standby modes on APs for faster poweringon of the APs.
7 Conclusions
This paper proposes the adoption of resource on-demand (RoD) WLAN strategies that can efficientlyreduce energy consumption of a WLAN without ad-versely impacting the performance of clients in thenetwork. We stress that energy-efficient mechanismsfor large-scale and high-density WLANs should be de-signed and developed today—to save energy in futureWLANs and thus avoid the escalation of energy was-tage.
We have proposed a practical RoD strategy, calledSEAR. We have demonstrated that SEAR can be easilyimplemented using current devices, and the on-demandpowering of APs is a feasible strategy that does not ad-versely impact end-user performance. We have also dis-cussed several interesting problems as future researchdirections towards the wide-spread deployment of RoDWLANs. Our next step is to evaluate the performanceof SEAR in large-scale WLANs.
The most important message of this paper is that theenergy wasted in large-scale and high-density WLANsis a new and serious concern. This paper makes thefirst attempt at designing strategies to reduce energywastage in WLANs. However, additional work is stillneeded to avoid the escalation of energy wastage in thefuture.
References
1. Dartmouth College WLAN. http://crawdad.cs.dartmouth.edu2. IEEE 802.11v: wireless network management. http://grouper.
ieee.org/groups/802/11/Reports/tgv_update.htm
3. IETF CAPWAP WG: http://www.ietf.org/html.charters/capwap-charter.html
4. Aruba selected by microsoft for next generation wirelessLAN (2005) http://www.arubanetworks.com/news/release/2005/06/13
5. Forrester research (2006) http://www.forrester.com6. Bejerano Y (2002) Efficient integration of multi-hop wireless
and wired networks with QoS constraints. In: ACM obicom,Atlanta, GA, September 2002
7. Chase JS, Anderson DC, Thakar PN, Vahdat A, Doyle RP(2001) Managing energy and server resources in hosting cen-tres. In: SOSP, Banff, Canada, October 2001
8. Christensen KJ, Gunaratne C, Nordman B, George AD(2004) The next frontier for communications networks:power management. Comput Commun 27:1758–1770,June
9. Gupta M, Singh S (2003) Greening of the internet. In: ACMSIGCOMM, Karlsruhe, Germany, August 2003
10. Jardosh AP, Iannaccone G, Papagiannaki K, Vinnakota B(2007) Towards an energy-star WLAN infrastructure. In:HotMobile, Tucson, AZ, February 2007
11. Jardosh AP, Ramachandran KN, Almeroth KC, Belding EM(2005) Understanding link-layer behavior in highly congestedIEEE 802.11b Wireless networks. In: Proceedings of ACMSIGCOMM workshop E-WIND, Philadelphia, PA, August2005
12. Jardosh AP, Ramchandran KN, Almeroth KC, Belding EM(2005) Understanding congestion in IEEE 802.11b wirelessnetworks. In: Proceedings of USENIX IMC, Berkeley, CA,October 2005
13. Kotz D, Henderson T, Abyzov I (2004) CRAWDAD traceset dartmouth/campus/snmp (v. 2004-11-09). Downloadedfrom http:/ /crawdad.cs.dartmouth.edu/dartmouth/campus/snmp November 2004
14. Meka A, Singh AK (2006) Distributed spatial clustering insensor networks. In: EDBT, Munich, Germany, March 2006
15. Mishra N, Chebrolu K, Raman B, Pathak A (2006) Wake-on-WLAN. In: ACM WWW, Edinburgh, UK, May 2006
16. Pinheiro E, Bianchini R, Dubnicki C (2006) Exploiting re-dundancy to conserve energy in storage systems (2006) In:Sigmetrics, Saint Malo, France, June 2006
17. Ramani I, Savage S (2005) SyncScan: practical fast handofffor 802.11 infrastructure networks. In: Proceedings of IEEEInfocom, Miami, FL, March 2005
18. Reis C, Mahajan R, Rodrig M, Wetherall D, Zahorjan J(2006) Measurement-based models of delivery and interfer-ence in static wireless networks. In: ACM Sigcomm, Pisa,Italy, September 2006
19. Rodrig M, Reis C, Mahajan R, Wetherall D, Zahorjan J(2005) Measurement-based characterization of 802.11 in ahotspot setting. In: Proceedings of EWIND, Philadelphia,PA, August 2005