Green WLANs: On-demand WLAN Infrastructures · Green WLANs: On-demand WLAN Infrastructures ... the...
14
Green WLANs: On-demand WLAN Infrastructures Amit P. Jardosh § , Konstantina Papagiannaki † , Elizabeth M. Belding § , Kevin C. Almeroth § , Gianluca Iannaccone † , Bapi Vinnakota ‡ § UC Santa Barbara † Intel Research ‡ Intel Corporation [email protected], [email protected], [email protected], [email protected], [email protected], [email protected] Abstract Enterprise wireless local area networks (WLANs) that consist of a high-density of hundreds to thousands of access points (APs) are being deployed rapidly in corpo- rate offices and university campuses. The primary pur- pose of these deployments is to satisfy user demands for high bandwidth, mobility, and reliability. However, our recent study of two such WLANs showed that these net- works are rarely used at their peak capacity, and the ma- jority of their resources are frequently idle. In this paper, we bring to attention that a large fraction of idle WLAN resources results in significant energy losses. Thousands of WLANs world-wide collectively compound this prob- lem, while raising serious concerns about the energy losses that will occur in the future. In response to this compelling problem, we propose the adoption of resource on-demand (RoD) strategies for WLANs. RoD strategies power on or off WLAN APs dynamically, based on the volume and location of user demand. As a specific solution, we propose SEAR, a practical and elegant RoD strategy for high-density WLANs. We implement SEAR on two wireless net- works to show that SEAR is easy to integrate in cur- rent WLANs, while it ensures no adverse impact on end- user connectivity and performance. In our experiments, SEAR reduces power consumption by 46%. Using our results we discuss several interesting problems that open future directions of research in RoD WLANs. 1. INTRODUCTION WLANs have become indispensable for flexible Inter- net connectivity in corporate offices [4], university cam- puses [1], and municipal downtowns 1 . Each of these en- terprises typically deploys hundreds to thousands of APs inside their buildings and across their campuses. More- over, many WLAN vendors such as Aruba Networks, Meru Networks, Symbol Technologies, and Trapeze Net- works 2 have adopted the centralized approach to WLAN management, making high-density WLANs cheaper, eas- ier to manage, and simpler to secure. This practice of centralized management has fueled the growth and proliferation of WLANs. The number of enterprise deployments and the average number of APs 1 http://www.muniwifi.org 2 arubanetworks.com,merunetworks.com,symbol.com, trapezenetworks.com in each enterprise WLAN is increasing exponentially every year [1, 5, 4]. With increasing budgets, enterprises have now shifted their deployment objective from pro- viding just basic complete coverage to designing dense WLANs with redundant layers of APs. These redundant APs are dimensioned to provide very high bandwidth in situations where hundreds of enterprise clients simulta- neously run bandwidth-intensive and delay-sensitive ap- plications. One example of such an enterprise WLAN is installed at Intel Corporation’s buildings in Portland, Oregon, where 125 APs have been deployed at distances of about five meters from each other, within a single four floor building. Another example is the Microsoft cam- pus at Redmond, WA, which will soon have a 5000 AP centralized WLAN on their campus [4]. Although redundant capacity benefits enterprise users during times of peak demands, our recent studies show that peak demand rarely occurs [10]. In fact, only a small fraction of APs are utilized during the day, and even fewer during nights and weekends. The majority of the APs frequently remain idle, which means they serve no users in the network. In this paper, we extend these studies to show that not only do the majority of the APs remain idle at any instant, they remain idle for long time intervals - on the order of up to several hours. We believe these studies are representative of the usage of thousands of WLANs deployed worldwide. More- over, as more enterprises add redundancy within their networks, the number of idle APs will increase. Unfortunately, idle WLAN resources mean wastage of the energy consumed while they remain idle. Tens of thousands of idle APs worldwide are collectively wast- ing a significant volume of energy every day. This is a significant problem that has received little attention - and as the number and size of enterprise WLANs in- crease, energy wastage is bound to escalate. A simi- lar escalation of power consumption has been observed in Internet-related equipment and in storage and data- centers in the past 20 years [8, 7, 9, 16]. Internet-related equipment now consumes 74TWh of electricity every year costing $6 billion in the United States alone. This escalation of power has recently become a serious con- cern. The rapid expansion and proliferation of WLANs at a compound annual growth rate of 32% 3 are adding to these costs. 3 More statistics are located at http://www.itfacts.biz 1
Transcript of Green WLANs: On-demand WLAN Infrastructures · Green WLANs: On-demand WLAN Infrastructures ... the...
Green WLANs: On-demand WLAN Infrastructures
Amit P. Jardosh§, Konstantina Papagiannaki†, Elizabeth M. Belding§,Kevin C. Almeroth§, Gianluca Iannaccone†, Bapi Vinnakota‡
§UC Santa Barbara †Intel Research ‡Intel [email protected], [email protected], [email protected],
[email protected], [email protected], [email protected]
Abstract
Enterprise wireless local area networks (WLANs) thatconsist of a high-density of hundreds to thousands ofaccess points (APs) are being deployed rapidly in corpo-rate offices and university campuses. The primary pur-pose of these deployments is to satisfy user demands forhigh bandwidth, mobility, and reliability. However, ourrecent study of two such WLANs showed that these net-works are rarely used at their peak capacity, and the ma-jority of their resources are frequently idle. In this paper,we bring to attention that a large fraction of idle WLANresources results in significant energy losses. Thousandsof WLANs world-wide collectively compound this prob-lem, while raising serious concerns about the energylosses that will occur in the future.
In response to this compelling problem, we proposethe adoption of resource on-demand (RoD) strategiesfor WLANs. RoD strategies power on or off WLANAPs dynamically, based on the volume and location ofuser demand. As a specific solution, we propose SEAR,a practical and elegant RoD strategy for high-densityWLANs. We implement SEAR on two wireless net-works to show that SEAR is easy to integrate in cur-rent WLANs, while it ensures no adverse impact on end-user connectivity and performance. In our experiments,SEAR reduces power consumption by 46%. Using ourresults we discuss several interesting problems that openfuture directions of research in RoD WLANs.
1. INTRODUCTION
WLANs have become indispensable for flexible Inter-net connectivity in corporate offices [4], university cam-puses [1], and municipal downtowns1. Each of these en-terprises typically deploys hundreds to thousands of APsinside their buildings and across their campuses. More-over, many WLAN vendors such as Aruba Networks,Meru Networks, Symbol Technologies, and Trapeze Net-works2 have adopted the centralized approach to WLANmanagement, making high-density WLANs cheaper, eas-ier to manage, and simpler to secure.
This practice of centralized management has fueledthe growth and proliferation of WLANs. The number ofenterprise deployments and the average number of APs
1http://www.muniwifi.org2arubanetworks.com,merunetworks.com,symbol.com,trapezenetworks.com
in each enterprise WLAN is increasing exponentiallyevery year [1, 5, 4]. With increasing budgets, enterpriseshave now shifted their deployment objective from pro-viding just basic complete coverage to designing denseWLANs with redundant layers of APs. These redundantAPs are dimensioned to provide very high bandwidth insituations where hundreds of enterprise clients simulta-neously run bandwidth-intensive and delay-sensitive ap-plications. One example of such an enterprise WLANis installed at Intel Corporation’s buildings in Portland,Oregon, where 125 APs have been deployed at distancesof about five meters from each other, within a single fourfloor building. Another example is the Microsoft cam-pus at Redmond, WA, which will soon have a 5000 APcentralized WLAN on their campus [4].
Although redundant capacity benefits enterprise usersduring times of peak demands, our recent studies showthat peak demand rarely occurs [10]. In fact, only asmall fraction of APs are utilized during the day, andeven fewer during nights and weekends. The majorityof the APs frequently remain idle, which means theyserve no users in the network. In this paper, we extendthese studies to show that not only do the majority ofthe APs remain idle at any instant, they remain idle forlong time intervals - on the order of up to several hours.We believe these studies are representative of the usageof thousands of WLANs deployed worldwide. More-over, as more enterprises add redundancy within theirnetworks, the number of idle APs will increase.
Unfortunately, idle WLAN resources mean wastageof the energy consumed while they remain idle. Tens ofthousands of idle APs worldwide are collectively wast-ing a significant volume of energy every day. This isa significant problem that has received little attention -and as the number and size of enterprise WLANs in-crease, energy wastage is bound to escalate. A simi-lar escalation of power consumption has been observedin Internet-related equipment and in storage and data-centers in the past 20 years [8, 7, 9, 16]. Internet-relatedequipment now consumes 74TWh of electricity everyyear costing $6 billion in the United States alone. Thisescalation of power has recently become a serious con-cern. The rapid expansion and proliferation of WLANsat a compound annual growth rate of 32%3 are addingto these costs.
3More statistics are located at http://www.itfacts.biz
1
In this paper, we propose that the basic design of en-terprise WLANs must change soon and that WLANsmust adopt power conservation as a fundamental designgoal. Most importantly, we believe that power conser-vation should be made a design goal today, so that thehigh-density enterprise WLANs that are being rapidlydeployed worldwide can soon have power conservationas a built-in feature. This will mitigate the harder task ofretrofitting all WLANs with power conservation strate-gies.
Towards achieving power conservation in high-densityWLANs, we advocate the adoption of highly-efficientresource management strategies. These strategies mustenable WLANs to scale power consumption with userdemand. In other words, WLAN resources should bemade available to users on-demand, when and wherethey need them, without hampering coverage and/or clientperformance. APs, switches, and controllers should bepowered off when no users are present, and powered onbased on the volume and location of user demand. How-ever, to ensure complete coverage, resources should bepowered off in only those areas serviced by multiple lay-ers of APs so that a single layer of complete coveragecan be maintained at all times. Such a policy will alsoensure that enterprise clients will always have access tothe WLAN in the enterprise, independent of the time ofday.
To this end, we propose and implement SEAR (Sur-vey, Evaluate, Adapt, and Repeat), a practical policy-driven RoD strategy for high-density WLANs. SEARuses real online measurements to provide a necessary
but sufficient set of resources that ensures complete cov-erage and provides sufficient bandwidth to enterpriseusers. SEAR’s main objective is to maintain client con-nectivity and performance while reducing power was-tage. SEAR can save power in any WLAN relative tothe WLAN’s usage characteristics and/or topology. Inother words, on one hand, a highly redundant WLANwith several layers of overlapping coverage that is notutilized thoroughly is a candidate for higher power sav-ings. On the other hand, a heavily utilized network witha single layer of basic wireless coverage can save verylittle. WLAN administrators can choose to adopt con-servative or aggressive policies of SEAR to trade-offpower savings with client performance. Regardless ofthe policy chosen by individual WLAN administrators,the use of SEAR in the thousands of WLANs will col-lectively save a significant volume of energy. SEARis the first step towards saving energy in WLANs andopens several new research directions, as discussed inSection 6.
In a position paper we published earlier [10], we iden-tified the power wastage problem in high-density WLANsand estimated the power savings from a simple distance-based clustering algorithm implemented in a custom Perlsimulator. In this paper, we significantly extend our ini-tial proposal, with the following specific contributions:
Internet
CentralController
Users
Switches
APs
Router
GRE Tunnel
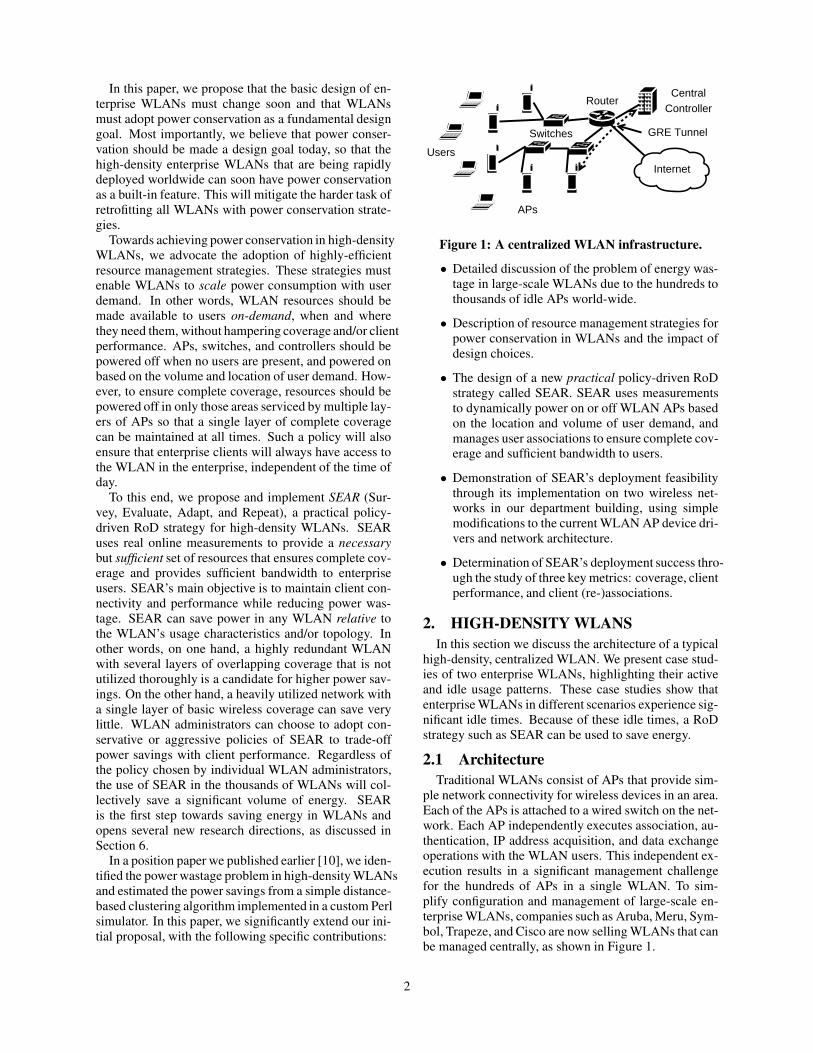
Figure 1: A centralized WLAN infrastructure.
• Detailed discussion of the problem of energy was-tage in large-scale WLANs due to the hundreds tothousands of idle APs world-wide.
• Description of resource management strategies forpower conservation in WLANs and the impact ofdesign choices.
• The design of a new practical policy-driven RoDstrategy called SEAR. SEAR uses measurementsto dynamically power on or off WLAN APs basedon the location and volume of user demand, andmanages user associations to ensure complete cov-erage and sufficient bandwidth to users.
• Demonstration of SEAR’s deployment feasibilitythrough its implementation on two wireless net-works in our department building, using simplemodifications to the current WLAN AP device dri-vers and network architecture.
• Determination of SEAR’s deployment success thro-ugh the study of three key metrics: coverage, clientperformance, and client (re-)associations.
2. HIGH-DENSITY WLANS
In this section we discuss the architecture of a typicalhigh-density, centralized WLAN. We present case stud-ies of two enterprise WLANs, highlighting their activeand idle usage patterns. These case studies show thatenterprise WLANs in different scenarios experience sig-nificant idle times. Because of these idle times, a RoDstrategy such as SEAR can be used to save energy.
2.1 Architecture
Traditional WLANs consist of APs that provide sim-ple network connectivity for wireless devices in an area.Each of the APs is attached to a wired switch on the net-work. Each AP independently executes association, au-thentication, IP address acquisition, and data exchangeoperations with the WLAN users. This independent ex-ecution results in a significant management challengefor the hundreds of APs in a single WLAN. To sim-plify configuration and management of large-scale en-terprise WLANs, companies such as Aruba, Meru, Sym-bol, Trapeze, and Cisco are now selling WLANs that canbe managed centrally, as shown in Figure 1.
2
0 1 2 3 40
20
40
60
80
100
Time (Week)
Per
cent
age
of id
le A
Ps
(a) Percentage idle APs in Intel WLAN.
0 1 2 3 4 50
20
40
60
80
100
Time (Week)
Per
cent
age
of id
le A
Ps
(b) Percentage idle APs in Dartmouth WLAN.
0
0.1
0.2
0.3
0.4
0.5
0.6
0.7
0.8
0.9
1
AP idle time (Minutes)
CC
DF
(P
[X >
x])
Intel WLANDartmouth WLAN
1 hour
1 day
1 2 3 4 510 10 1010 10
(c) AP idle times in both WLANs.
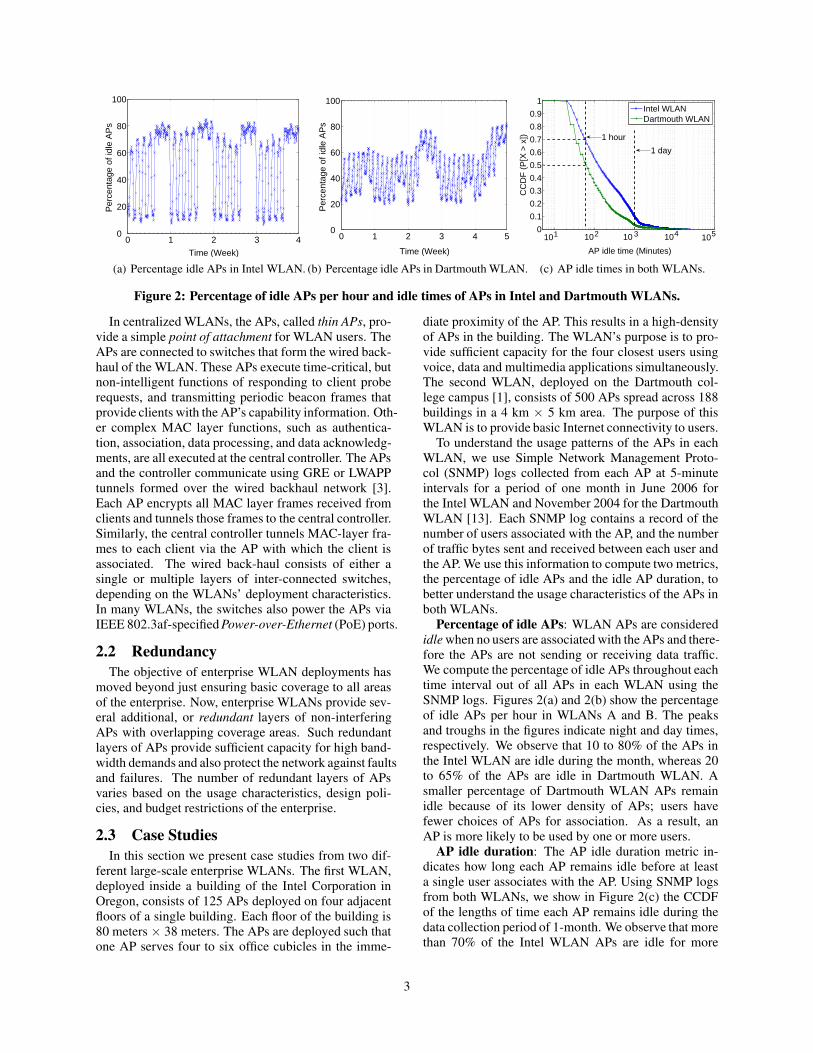
Figure 2: Percentage of idle APs per hour and idle times of APs in Intel and Dartmouth WLANs.
In centralized WLANs, the APs, called thin APs, pro-vide a simple point of attachment for WLAN users. TheAPs are connected to switches that form the wired back-haul of the WLAN. These APs execute time-critical, butnon-intelligent functions of responding to client proberequests, and transmitting periodic beacon frames thatprovide clients with the AP’s capability information. Oth-er complex MAC layer functions, such as authentica-tion, association, data processing, and data acknowledg-ments, are all executed at the central controller. The APsand the controller communicate using GRE or LWAPPtunnels formed over the wired backhaul network [3].Each AP encrypts all MAC layer frames received fromclients and tunnels those frames to the central controller.Similarly, the central controller tunnels MAC-layer fra-mes to each client via the AP with which the client isassociated. The wired back-haul consists of either asingle or multiple layers of inter-connected switches,depending on the WLANs’ deployment characteristics.In many WLANs, the switches also power the APs viaIEEE 802.3af-specified Power-over-Ethernet (PoE) ports.
2.2 Redundancy
The objective of enterprise WLAN deployments hasmoved beyond just ensuring basic coverage to all areasof the enterprise. Now, enterprise WLANs provide sev-eral additional, or redundant layers of non-interferingAPs with overlapping coverage areas. Such redundantlayers of APs provide sufficient capacity for high band-width demands and also protect the network against faultsand failures. The number of redundant layers of APsvaries based on the usage characteristics, design poli-cies, and budget restrictions of the enterprise.
2.3 Case Studies
In this section we present case studies from two dif-ferent large-scale enterprise WLANs. The first WLAN,deployed inside a building of the Intel Corporation inOregon, consists of 125 APs deployed on four adjacentfloors of a single building. Each floor of the building is80 meters × 38 meters. The APs are deployed such thatone AP serves four to six office cubicles in the imme-
diate proximity of the AP. This results in a high-densityof APs in the building. The WLAN’s purpose is to pro-vide sufficient capacity for the four closest users usingvoice, data and multimedia applications simultaneously.The second WLAN, deployed on the Dartmouth col-lege campus [1], consists of 500 APs spread across 188buildings in a 4 km × 5 km area. The purpose of thisWLAN is to provide basic Internet connectivity to users.
To understand the usage patterns of the APs in eachWLAN, we use Simple Network Management Proto-col (SNMP) logs collected from each AP at 5-minuteintervals for a period of one month in June 2006 forthe Intel WLAN and November 2004 for the DartmouthWLAN [13]. Each SNMP log contains a record of thenumber of users associated with the AP, and the numberof traffic bytes sent and received between each user andthe AP. We use this information to compute two metrics,the percentage of idle APs and the idle AP duration, tobetter understand the usage characteristics of the APs inboth WLANs.
Percentage of idle APs: WLAN APs are consideredidle when no users are associated with the APs and there-fore the APs are not sending or receiving data traffic.We compute the percentage of idle APs throughout eachtime interval out of all APs in each WLAN using theSNMP logs. Figures 2(a) and 2(b) show the percentageof idle APs per hour in WLANs A and B. The peaksand troughs in the figures indicate night and day times,respectively. We observe that 10 to 80% of the APs inthe Intel WLAN are idle during the month, whereas 20to 65% of the APs are idle in Dartmouth WLAN. Asmaller percentage of Dartmouth WLAN APs remainidle because of its lower density of APs; users havefewer choices of APs for association. As a result, anAP is more likely to be used by one or more users.
AP idle duration: The AP idle duration metric in-dicates how long each AP remains idle before at leasta single user associates with the AP. Using SNMP logsfrom both WLANs, we show in Figure 2(c) the CCDFof the lengths of time each AP remains idle during thedata collection period of 1-month. We observe that morethan 70% of the Intel WLAN APs are idle for more
3
than 60 contiguous minutes, while more than 50% ofthe Dartmouth WLAN APs are idle for more than 60minutes. Some of the APs remain idle for more than afull day. These idle times can also be attributed to nightsand weekends when few or no users associate with theAPs.
2.4 Power Consumption: How much?
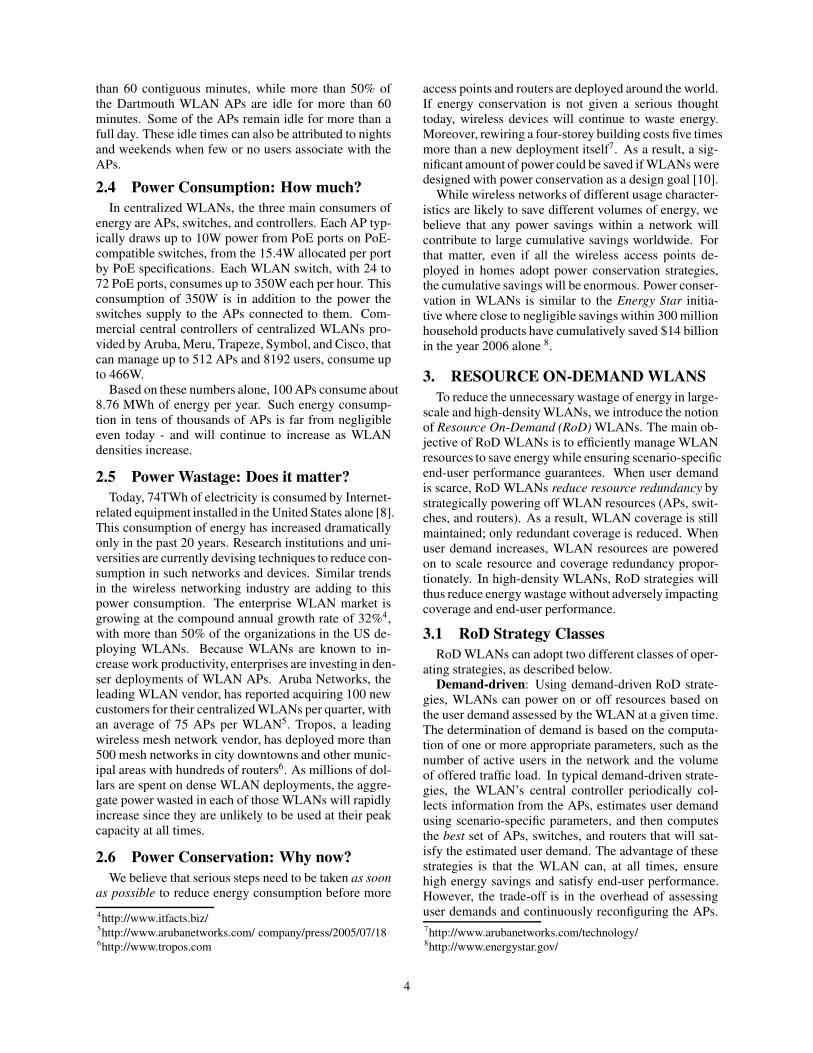
In centralized WLANs, the three main consumers ofenergy are APs, switches, and controllers. Each AP typ-ically draws up to 10W power from PoE ports on PoE-compatible switches, from the 15.4W allocated per portby PoE specifications. Each WLAN switch, with 24 to72 PoE ports, consumes up to 350W each per hour. Thisconsumption of 350W is in addition to the power theswitches supply to the APs connected to them. Com-mercial central controllers of centralized WLANs pro-vided by Aruba, Meru, Trapeze, Symbol, and Cisco, thatcan manage up to 512 APs and 8192 users, consume upto 466W.
Based on these numbers alone, 100 APs consume about8.76 MWh of energy per year. Such energy consump-tion in tens of thousands of APs is far from negligibleeven today - and will continue to increase as WLANdensities increase.
2.5 Power Wastage: Does it matter?
Today, 74TWh of electricity is consumed by Internet-related equipment installed in the United States alone [8].This consumption of energy has increased dramaticallyonly in the past 20 years. Research institutions and uni-versities are currently devising techniques to reduce con-sumption in such networks and devices. Similar trendsin the wireless networking industry are adding to thispower consumption. The enterprise WLAN market isgrowing at the compound annual growth rate of 32%4,with more than 50% of the organizations in the US de-ploying WLANs. Because WLANs are known to in-crease work productivity, enterprises are investing in den-ser deployments of WLAN APs. Aruba Networks, theleading WLAN vendor, has reported acquiring 100 newcustomers for their centralized WLANs per quarter, withan average of 75 APs per WLAN5. Tropos, a leadingwireless mesh network vendor, has deployed more than500 mesh networks in city downtowns and other munic-ipal areas with hundreds of routers6. As millions of dol-lars are spent on dense WLAN deployments, the aggre-gate power wasted in each of those WLANs will rapidlyincrease since they are unlikely to be used at their peakcapacity at all times.
2.6 Power Conservation: Why now?
We believe that serious steps need to be taken as soon
as possible to reduce energy consumption before more
4http://www.itfacts.biz/5http://www.arubanetworks.com/ company/press/2005/07/186http://www.tropos.com
access points and routers are deployed around the world.If energy conservation is not given a serious thoughttoday, wireless devices will continue to waste energy.Moreover, rewiring a four-storey building costs five timesmore than a new deployment itself7. As a result, a sig-nificant amount of power could be saved if WLANs weredesigned with power conservation as a design goal [10].
While wireless networks of different usage character-istics are likely to save different volumes of energy, webelieve that any power savings within a network willcontribute to large cumulative savings worldwide. Forthat matter, even if all the wireless access points de-ployed in homes adopt power conservation strategies,the cumulative savings will be enormous. Power conser-vation in WLANs is similar to the Energy Star initia-tive where close to negligible savings within 300 millionhousehold products have cumulatively saved $14 billionin the year 2006 alone 8.
3. RESOURCE ON-DEMAND WLANS
To reduce the unnecessary wastage of energy in large-scale and high-density WLANs, we introduce the notionof Resource On-Demand (RoD) WLANs. The main ob-jective of RoD WLANs is to efficiently manage WLANresources to save energy while ensuring scenario-specificend-user performance guarantees. When user demandis scarce, RoD WLANs reduce resource redundancy bystrategically powering off WLAN resources (APs, swit-ches, and routers). As a result, WLAN coverage is stillmaintained; only redundant coverage is reduced. Whenuser demand increases, WLAN resources are poweredon to scale resource and coverage redundancy propor-tionately. In high-density WLANs, RoD strategies willthus reduce energy wastage without adversely impactingcoverage and end-user performance.
3.1 RoD Strategy Classes
RoD WLANs can adopt two different classes of oper-ating strategies, as described below.
Demand-driven: Using demand-driven RoD strate-gies, WLANs can power on or off resources based onthe user demand assessed by the WLAN at a given time.The determination of demand is based on the computa-tion of one or more appropriate parameters, such as thenumber of active users in the network and the volumeof offered traffic load. In typical demand-driven strate-gies, the WLAN’s central controller periodically col-lects information from the APs, estimates user demandusing scenario-specific parameters, and then computesthe best set of APs, switches, and routers that will sat-isfy the estimated user demand. The advantage of thesestrategies is that the WLAN can, at all times, ensurehigh energy savings and satisfy end-user performance.However, the trade-off is in the overhead of assessinguser demands and continuously reconfiguring the APs.7http://www.arubanetworks.com/technology/8http://www.energystar.gov/
4
Therefore, demand-driven strategies are suitable in sce-narios where the user demand may vary significantlyover time. For instance, demand-driven RoD strategiesmay be used on university campuses wherein user de-mand is expected to vary significantly on a daily, as wellas seasonal, basis.
Schedule-driven: Schedule-driven RoD strategies usepre-determined schedules to power on and off specificWLAN resources. These schedules can either be deter-mined from WLAN historical usage patterns or can bebased on the administrators’ experience. The advantageof using schedules stems from their minimal process-ing overhead. However, the trade-off is that they failto power on or off the necessary and sufficient set ofresources during times of unexpected change in user de-mand. As a result, schedule-driven solutions are suitablefor scenarios where user demand is closely predictable.For instance, during most conferences and meetings, sche-dules are predetermined and users are expected to pri-marily be present during meeting times [11]. In suchscenarios, network managers may decide to power allthe APs before a meeting begins and power all of themoff shortly after the meeting is over.
3.2 RoD WLAN Design Requirements
To ensure the successful adoption of RoD solutions intoday’s WLANs, both classes of RoD strategies shouldfollow a set of design requirements. These requirementsallow RoD strategies to achieve their objective of con-serving energy without adversely impacting end-user per-formance. The requirements for an RoD strategy are thefollowing:Requirement 1: Ensure coverage: A good RoD strat-egy is required to maintain the same coverage as itsalways-on counterpart. In other words, powering offAPs must not create coverage holes where users cannotreceive service.Requirement 2: Maintain client performance: A goodRoD strategy should offer the same service to clientseven when part of the infrastructure is off. Client servicelevels can be maintained by avoiding WLAN topologiesin which clients are far away from their closest AP or inwhich an AP is required to support so many clients thatcongestion occurs. Within such topologies, clients mayexperience an increase in packet loss or reduction in thesustainable transmission rate due to weak wireless linksor congestion. A good RoD strategy should be able todeliver performance equivalent to that of an always-onnetwork.Requirement 3: Avoid frequent client re-associations:The powering on and off of WLAN APs by RoD strate-gies can force clients to change their associations be-tween APs. Frequent re-associations are undesirable be-cause re-association delays can break clients’ traffic flowsand thereby impact their performance. A good RoDstrategy should avoid frequent client disconnections fromthe WLAN.
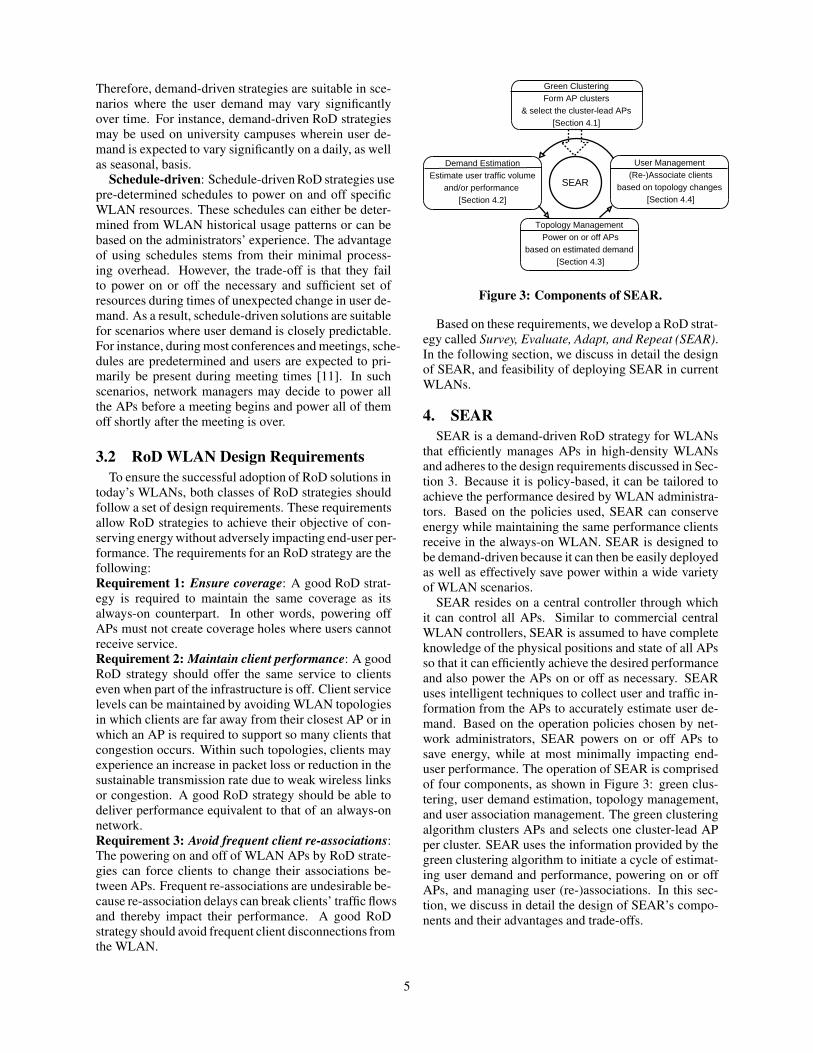
�Topology ManagementPower on or off APs
based on estimated demand [Section 4.3]
Demand EstimationEstimate user traffic volume
and/or performance [Section 4.2]
�User Management(Re-)Associate clients
based on topology changes [Section 4.4]
Green ClusteringForm AP clusters
& select the cluster-lead APs[Section 4.1]
SEAR
Figure 3: Components of SEAR.
Based on these requirements, we develop a RoD strat-egy called Survey, Evaluate, Adapt, and Repeat (SEAR).In the following section, we discuss in detail the designof SEAR, and feasibility of deploying SEAR in currentWLANs.
4. SEAR
SEAR is a demand-driven RoD strategy for WLANsthat efficiently manages APs in high-density WLANsand adheres to the design requirements discussed in Sec-tion 3. Because it is policy-based, it can be tailored toachieve the performance desired by WLAN administra-tors. Based on the policies used, SEAR can conserveenergy while maintaining the same performance clientsreceive in the always-on WLAN. SEAR is designed tobe demand-driven because it can then be easily deployedas well as effectively save power within a wide varietyof WLAN scenarios.
SEAR resides on a central controller through whichit can control all APs. Similar to commercial centralWLAN controllers, SEAR is assumed to have completeknowledge of the physical positions and state of all APsso that it can efficiently achieve the desired performanceand also power the APs on or off as necessary. SEARuses intelligent techniques to collect user and traffic in-formation from the APs to accurately estimate user de-mand. Based on the operation policies chosen by net-work administrators, SEAR powers on or off APs tosave energy, while at most minimally impacting end-user performance. The operation of SEAR is comprisedof four components, as shown in Figure 3: green clus-tering, user demand estimation, topology management,and user association management. The green clusteringalgorithm clusters APs and selects one cluster-lead APper cluster. SEAR uses the information provided by thegreen clustering algorithm to initiate a cycle of estimat-ing user demand and performance, powering on or offAPs, and managing user (re-)associations. In this sec-tion, we discuss in detail the design of SEAR’s compo-nents and their advantages and trade-offs.
5
E D
A
B
C
(a) (b)
C
DE
A
B
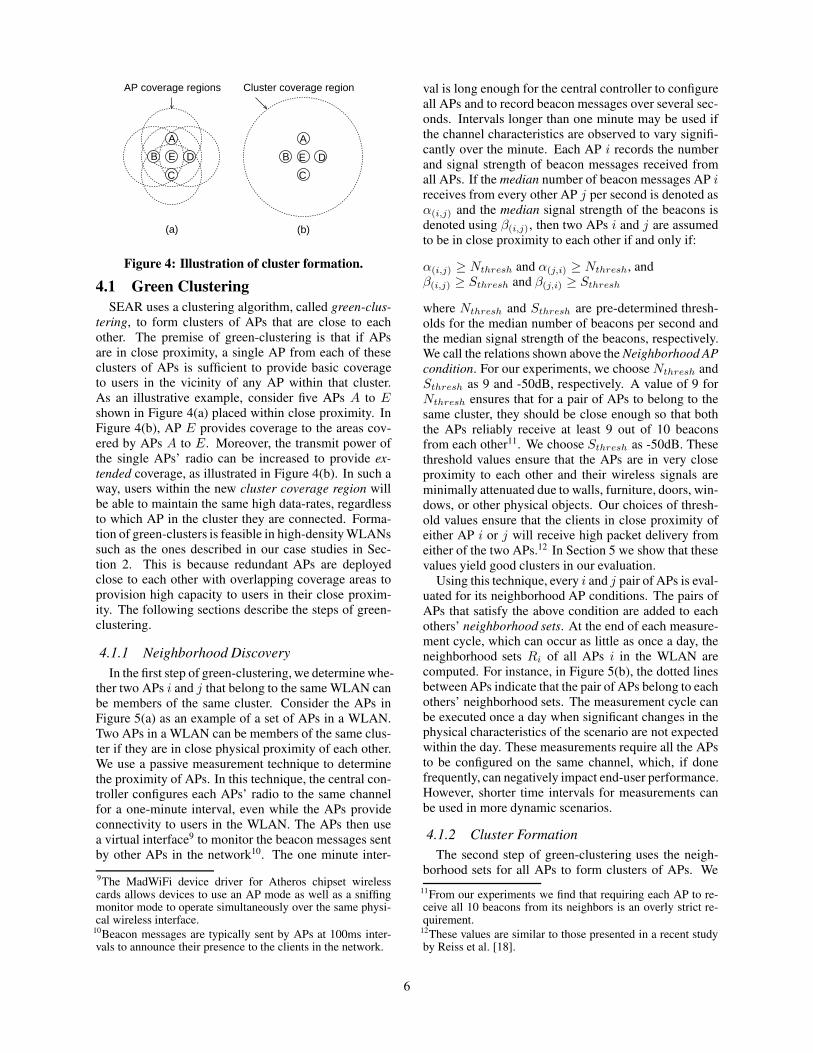
AP coverage regions Cluster coverage region
Figure 4: Illustration of cluster formation.
4.1 Green Clustering
SEAR uses a clustering algorithm, called green-clus-
tering, to form clusters of APs that are close to eachother. The premise of green-clustering is that if APsare in close proximity, a single AP from each of theseclusters of APs is sufficient to provide basic coverageto users in the vicinity of any AP within that cluster.As an illustrative example, consider five APs A to Eshown in Figure 4(a) placed within close proximity. InFigure 4(b), AP E provides coverage to the areas cov-ered by APs A to E. Moreover, the transmit power ofthe single APs’ radio can be increased to provide ex-
tended coverage, as illustrated in Figure 4(b). In such away, users within the new cluster coverage region willbe able to maintain the same high data-rates, regardlessto which AP in the cluster they are connected. Forma-tion of green-clusters is feasible in high-density WLANssuch as the ones described in our case studies in Sec-tion 2. This is because redundant APs are deployedclose to each other with overlapping coverage areas toprovision high capacity to users in their close proxim-ity. The following sections describe the steps of green-clustering.
4.1.1 Neighborhood Discovery
In the first step of green-clustering, we determine whe-ther two APs i and j that belong to the same WLAN canbe members of the same cluster. Consider the APs inFigure 5(a) as an example of a set of APs in a WLAN.Two APs in a WLAN can be members of the same clus-ter if they are in close physical proximity of each other.We use a passive measurement technique to determinethe proximity of APs. In this technique, the central con-troller configures each APs’ radio to the same channelfor a one-minute interval, even while the APs provideconnectivity to users in the WLAN. The APs then usea virtual interface9 to monitor the beacon messages sentby other APs in the network10. The one minute inter-
9The MadWiFi device driver for Atheros chipset wirelesscards allows devices to use an AP mode as well as a sniffingmonitor mode to operate simultaneously over the same physi-cal wireless interface.
10Beacon messages are typically sent by APs at 100ms inter-vals to announce their presence to the clients in the network.
val is long enough for the central controller to configureall APs and to record beacon messages over several sec-onds. Intervals longer than one minute may be used ifthe channel characteristics are observed to vary signifi-cantly over the minute. Each AP i records the numberand signal strength of beacon messages received fromall APs. If the median number of beacon messages AP ireceives from every other AP j per second is denoted asα(i,j) and the median signal strength of the beacons isdenoted using β(i,j), then two APs i and j are assumedto be in close proximity to each other if and only if:
α(i,j) ≥ Nthresh and α(j,i) ≥ Nthresh, andβ(i,j) ≥ Sthresh and β(j,i) ≥ Sthresh
where Nthresh and Sthresh are pre-determined thresh-olds for the median number of beacons per second andthe median signal strength of the beacons, respectively.We call the relations shown above the Neighborhood AP
condition. For our experiments, we choose Nthresh andSthresh as 9 and -50dB, respectively. A value of 9 forNthresh ensures that for a pair of APs to belong to thesame cluster, they should be close enough so that boththe APs reliably receive at least 9 out of 10 beaconsfrom each other11. We choose Sthresh as -50dB. Thesethreshold values ensure that the APs are in very closeproximity to each other and their wireless signals areminimally attenuated due to walls, furniture, doors, win-dows, or other physical objects. Our choices of thresh-old values ensure that the clients in close proximity ofeither AP i or j will receive high packet delivery fromeither of the two APs.12 In Section 5 we show that thesevalues yield good clusters in our evaluation.
Using this technique, every i and j pair of APs is eval-uated for its neighborhood AP conditions. The pairs ofAPs that satisfy the above condition are added to eachothers’ neighborhood sets. At the end of each measure-ment cycle, which can occur as little as once a day, theneighborhood sets Ri of all APs i in the WLAN arecomputed. For instance, in Figure 5(b), the dotted linesbetween APs indicate that the pair of APs belong to eachothers’ neighborhood sets. The measurement cycle canbe executed once a day when significant changes in thephysical characteristics of the scenario are not expectedwithin the day. These measurements require all the APsto be configured on the same channel, which, if donefrequently, can negatively impact end-user performance.However, shorter time intervals for measurements canbe used in more dynamic scenarios.
4.1.2 Cluster Formation
The second step of green-clustering uses the neigh-borhood sets for all APs to form clusters of APs. We
11From our experiments we find that requiring each AP to re-ceive all 10 beacons from its neighbors is an overly strict re-quirement.
12These values are similar to those presented in a recent studyby Reiss et al. [18].
6
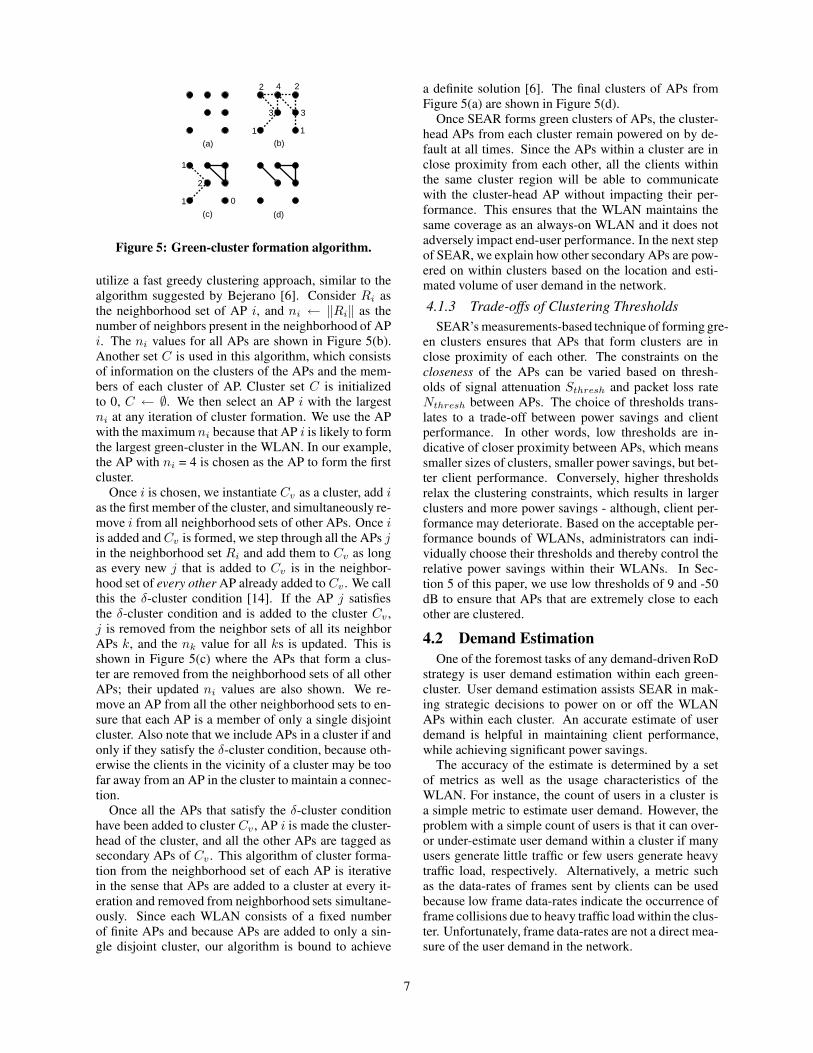
(a) (b)
(c) (d)
2 4 2
3
1 1
3
1
1
2
0
Figure 5: Green-cluster formation algorithm.
utilize a fast greedy clustering approach, similar to thealgorithm suggested by Bejerano [6]. Consider Ri asthe neighborhood set of AP i, and ni ← ‖Ri‖ as thenumber of neighbors present in the neighborhood of APi. The ni values for all APs are shown in Figure 5(b).Another set C is used in this algorithm, which consistsof information on the clusters of the APs and the mem-bers of each cluster of AP. Cluster set C is initializedto 0, C ← ∅. We then select an AP i with the largestni at any iteration of cluster formation. We use the APwith the maximum ni because that AP i is likely to formthe largest green-cluster in the WLAN. In our example,the AP with ni = 4 is chosen as the AP to form the firstcluster.
Once i is chosen, we instantiate Cv as a cluster, add ias the first member of the cluster, and simultaneously re-move i from all neighborhood sets of other APs. Once iis added and Cv is formed, we step through all the APs jin the neighborhood set Ri and add them to Cv as longas every new j that is added to Cv is in the neighbor-hood set of every other AP already added to Cv . We callthis the δ-cluster condition [14]. If the AP j satisfiesthe δ-cluster condition and is added to the cluster Cv ,j is removed from the neighbor sets of all its neighborAPs k, and the nk value for all ks is updated. This isshown in Figure 5(c) where the APs that form a clus-ter are removed from the neighborhood sets of all otherAPs; their updated ni values are also shown. We re-move an AP from all the other neighborhood sets to en-sure that each AP is a member of only a single disjointcluster. Also note that we include APs in a cluster if andonly if they satisfy the δ-cluster condition, because oth-erwise the clients in the vicinity of a cluster may be toofar away from an AP in the cluster to maintain a connec-tion.
Once all the APs that satisfy the δ-cluster conditionhave been added to cluster Cv , AP i is made the cluster-head of the cluster, and all the other APs are tagged assecondary APs of Cv . This algorithm of cluster forma-tion from the neighborhood set of each AP is iterativein the sense that APs are added to a cluster at every it-eration and removed from neighborhood sets simultane-ously. Since each WLAN consists of a fixed numberof finite APs and because APs are added to only a sin-gle disjoint cluster, our algorithm is bound to achieve
a definite solution [6]. The final clusters of APs fromFigure 5(a) are shown in Figure 5(d).
Once SEAR forms green clusters of APs, the cluster-head APs from each cluster remain powered on by de-fault at all times. Since the APs within a cluster are inclose proximity from each other, all the clients withinthe same cluster region will be able to communicatewith the cluster-head AP without impacting their per-formance. This ensures that the WLAN maintains thesame coverage as an always-on WLAN and it does notadversely impact end-user performance. In the next stepof SEAR, we explain how other secondary APs are pow-ered on within clusters based on the location and esti-mated volume of user demand in the network.
4.1.3 Trade-offs of Clustering Thresholds
SEAR’s measurements-based technique of forming gre-en clusters ensures that APs that form clusters are inclose proximity of each other. The constraints on thecloseness of the APs can be varied based on thresh-olds of signal attenuation Sthresh and packet loss rateNthresh between APs. The choice of thresholds trans-lates to a trade-off between power savings and clientperformance. In other words, low thresholds are in-dicative of closer proximity between APs, which meanssmaller sizes of clusters, smaller power savings, but bet-ter client performance. Conversely, higher thresholdsrelax the clustering constraints, which results in largerclusters and more power savings - although, client per-formance may deteriorate. Based on the acceptable per-formance bounds of WLANs, administrators can indi-vidually choose their thresholds and thereby control therelative power savings within their WLANs. In Sec-tion 5 of this paper, we use low thresholds of 9 and -50dB to ensure that APs that are extremely close to eachother are clustered.
4.2 Demand Estimation
One of the foremost tasks of any demand-driven RoDstrategy is user demand estimation within each green-cluster. User demand estimation assists SEAR in mak-ing strategic decisions to power on or off the WLANAPs within each cluster. An accurate estimate of userdemand is helpful in maintaining client performance,while achieving significant power savings.
The accuracy of the estimate is determined by a setof metrics as well as the usage characteristics of theWLAN. For instance, the count of users in a cluster isa simple metric to estimate user demand. However, theproblem with a simple count of users is that it can over-or under-estimate user demand within a cluster if manyusers generate little traffic or few users generate heavytraffic load, respectively. Alternatively, a metric suchas the data-rates of frames sent by clients can be usedbecause low frame data-rates indicate the occurrence offrame collisions due to heavy traffic load within the clus-ter. Unfortunately, frame data-rates are not a direct mea-sure of the user demand in the network.
7
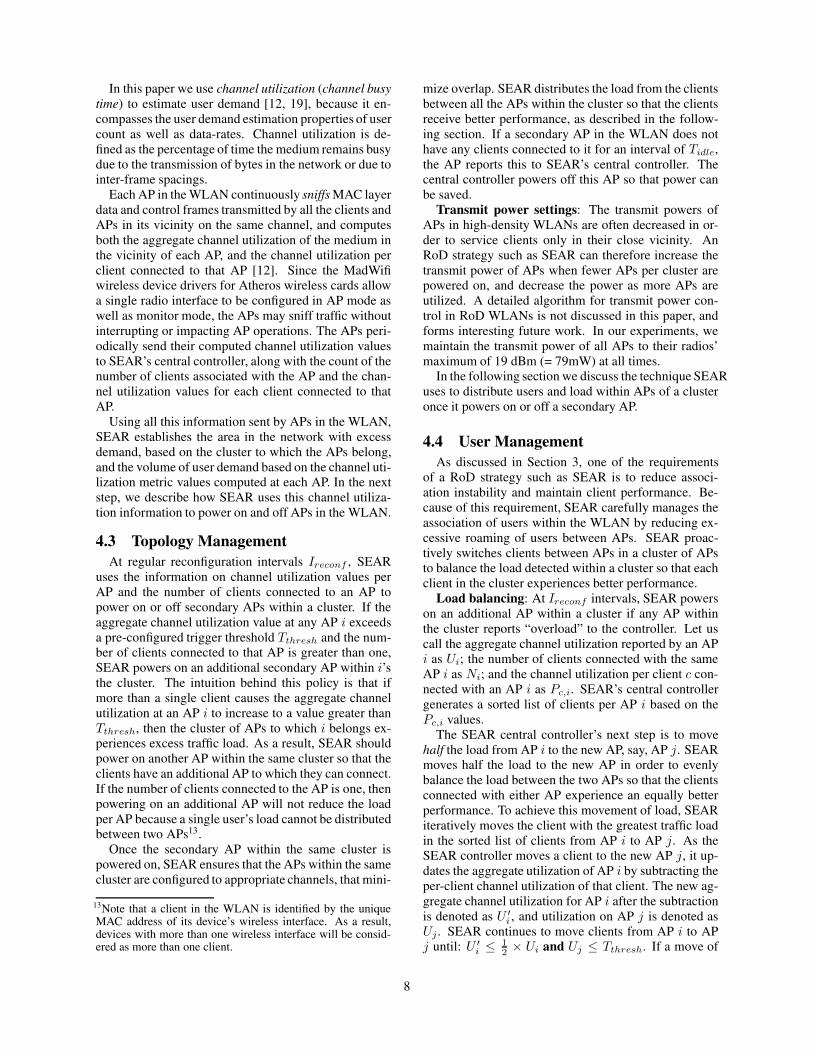
In this paper we use channel utilization (channel busy
time) to estimate user demand [12, 19], because it en-compasses the user demand estimation properties of usercount as well as data-rates. Channel utilization is de-fined as the percentage of time the medium remains busydue to the transmission of bytes in the network or due tointer-frame spacings.
Each AP in the WLAN continuously sniffs MAC layerdata and control frames transmitted by all the clients andAPs in its vicinity on the same channel, and computesboth the aggregate channel utilization of the medium inthe vicinity of each AP, and the channel utilization perclient connected to that AP [12]. Since the MadWifiwireless device drivers for Atheros wireless cards allowa single radio interface to be configured in AP mode aswell as monitor mode, the APs may sniff traffic withoutinterrupting or impacting AP operations. The APs peri-odically send their computed channel utilization valuesto SEAR’s central controller, along with the count of thenumber of clients associated with the AP and the chan-nel utilization values for each client connected to thatAP.
Using all this information sent by APs in the WLAN,SEAR establishes the area in the network with excessdemand, based on the cluster to which the APs belong,and the volume of user demand based on the channel uti-lization metric values computed at each AP. In the nextstep, we describe how SEAR uses this channel utiliza-tion information to power on and off APs in the WLAN.
4.3 Topology Management
At regular reconfiguration intervals Ireconf , SEARuses the information on channel utilization values perAP and the number of clients connected to an AP topower on or off secondary APs within a cluster. If theaggregate channel utilization value at any AP i exceedsa pre-configured trigger threshold Tthresh and the num-ber of clients connected to that AP is greater than one,SEAR powers on an additional secondary AP within i’sthe cluster. The intuition behind this policy is that ifmore than a single client causes the aggregate channelutilization at an AP i to increase to a value greater thanTthresh, then the cluster of APs to which i belongs ex-periences excess traffic load. As a result, SEAR shouldpower on another AP within the same cluster so that theclients have an additional AP to which they can connect.If the number of clients connected to the AP is one, thenpowering on an additional AP will not reduce the loadper AP because a single user’s load cannot be distributedbetween two APs13.
Once the secondary AP within the same cluster ispowered on, SEAR ensures that the APs within the samecluster are configured to appropriate channels, that mini-
13Note that a client in the WLAN is identified by the uniqueMAC address of its device’s wireless interface. As a result,devices with more than one wireless interface will be consid-ered as more than one client.
mize overlap. SEAR distributes the load from the clientsbetween all the APs within the cluster so that the clientsreceive better performance, as described in the follow-ing section. If a secondary AP in the WLAN does nothave any clients connected to it for an interval of Tidle,the AP reports this to SEAR’s central controller. Thecentral controller powers off this AP so that power canbe saved.
Transmit power settings: The transmit powers ofAPs in high-density WLANs are often decreased in or-der to service clients only in their close vicinity. AnRoD strategy such as SEAR can therefore increase thetransmit power of APs when fewer APs per cluster arepowered on, and decrease the power as more APs areutilized. A detailed algorithm for transmit power con-trol in RoD WLANs is not discussed in this paper, andforms interesting future work. In our experiments, wemaintain the transmit power of all APs to their radios’maximum of 19 dBm (= 79mW) at all times.
In the following section we discuss the technique SEARuses to distribute users and load within APs of a clusteronce it powers on or off a secondary AP.
4.4 User Management
As discussed in Section 3, one of the requirementsof a RoD strategy such as SEAR is to reduce associ-ation instability and maintain client performance. Be-cause of this requirement, SEAR carefully manages theassociation of users within the WLAN by reducing ex-cessive roaming of users between APs. SEAR proac-tively switches clients between APs in a cluster of APsto balance the load detected within a cluster so that eachclient in the cluster experiences better performance.
Load balancing: At Ireconf intervals, SEAR powerson an additional AP within a cluster if any AP withinthe cluster reports “overload” to the controller. Let uscall the aggregate channel utilization reported by an APi as Ui; the number of clients connected with the sameAP i as Ni; and the channel utilization per client c con-nected with an AP i as Pc,i. SEAR’s central controllergenerates a sorted list of clients per AP i based on thePc,i values.
The SEAR central controller’s next step is to movehalf the load from AP i to the new AP, say, AP j. SEARmoves half the load to the new AP in order to evenlybalance the load between the two APs so that the clientsconnected with either AP experience an equally betterperformance. To achieve this movement of load, SEARiteratively moves the client with the greatest traffic loadin the sorted list of clients from AP i to AP j. As theSEAR controller moves a client to the new AP j, it up-dates the aggregate utilization of AP i by subtracting theper-client channel utilization of that client. The new ag-gregate channel utilization for AP i after the subtractionis denoted as U ′
i , and utilization on AP j is denoted asUj . SEAR continues to move clients from AP i to APj until: U ′
i ≤12 × Ui and Uj ≤ Tthresh. If a move of
8
a user from i to j leads to the violation of the secondcondition, then we proceed down the ranked list untilwe satisfy the terminating condition. The SEAR cen-tral controller repeats this process of balancing load forall the APs that report an aggregate channel utilizationvalue greater than Tthresh. SEAR chooses to move thetopmost client in the sorted list first because such a moveis likely to cause the fewest number of clients to hand-off from one AP to another. This strategy thus complieswith the requirement of an RoD strategy avoiding sig-nificant association instability.
We use the above load diversion strategy because itsatisfies the third requirement of a good RoD strategyand is easy to implement and deploy. However, the de-sign and implementation of more efficient load diversionmechanisms is interesting future work.
Enforcing user association: SEAR uses access con-trol black lists to enforce a client handoff between APs.The MadWifi Atheros chipset wireless driver allows anAP to use such black lists of MAC addresses of clients.If the MAC address of a client is present in that list, theAP will not allow the client to associate with it. The ad-vantage of using black-lists on APs is that the clients areforced to associate with only those APs on which theyare not black-listed. As a client is moved from an APi to AP j, the client is added to AP i’s black-list. Thisforces the client to disconnect from AP i and associatewith the new AP j.
While a black list-based strategy was effective in re-associating users in our implementation of SEAR, wecould replace it by using the upcoming IEEE 802.11v [2]standard where APs can explicitly ask users to re-associatewith an alternate AP.
5. EVALUATION
In this section we first justify the use of a centralizedRoD strategy through the evaluation of a simple dis-tributed strategy. Our evaluation demonstrates the weak-nesses of a distributed approach. We then implementand evaluate SEAR in two wireless networks to showthat it satisfies the three requirements of a good RoDstrategy. The main objectives of implementing SEARin real networks are to: (a) understand the effectivenessof implementing green clustering within current wire-less devices; (b) study the impact of green clustering onend-user performance; and (c) evaluate the feasibilityof user and topology management strategies to success-fully power on and off APs for energy savings underrealistic traffic conditions.
5.1 Sniff-n-Sleep RoD Strategy
To begin, we first evaluate a simple distributed strat-egy for RoD WLANs. We call this strategy Sniff-n-
Sleep. Our objective is to show that a simple-to-implementdistributed strategy similar to Wake-on-WLAN [15] canbe used to save energy in a WLAN, but has limitationsthat are likely to degrade the performance achieved byclients.
A
E
C
B
G
F
L
K
M
DH
IJ
N
O
Floor 1Floor 2
Cabinet
50m
20m
1
2
3
45
6 7
8
9
= APs = Cluster-head APs = Clients
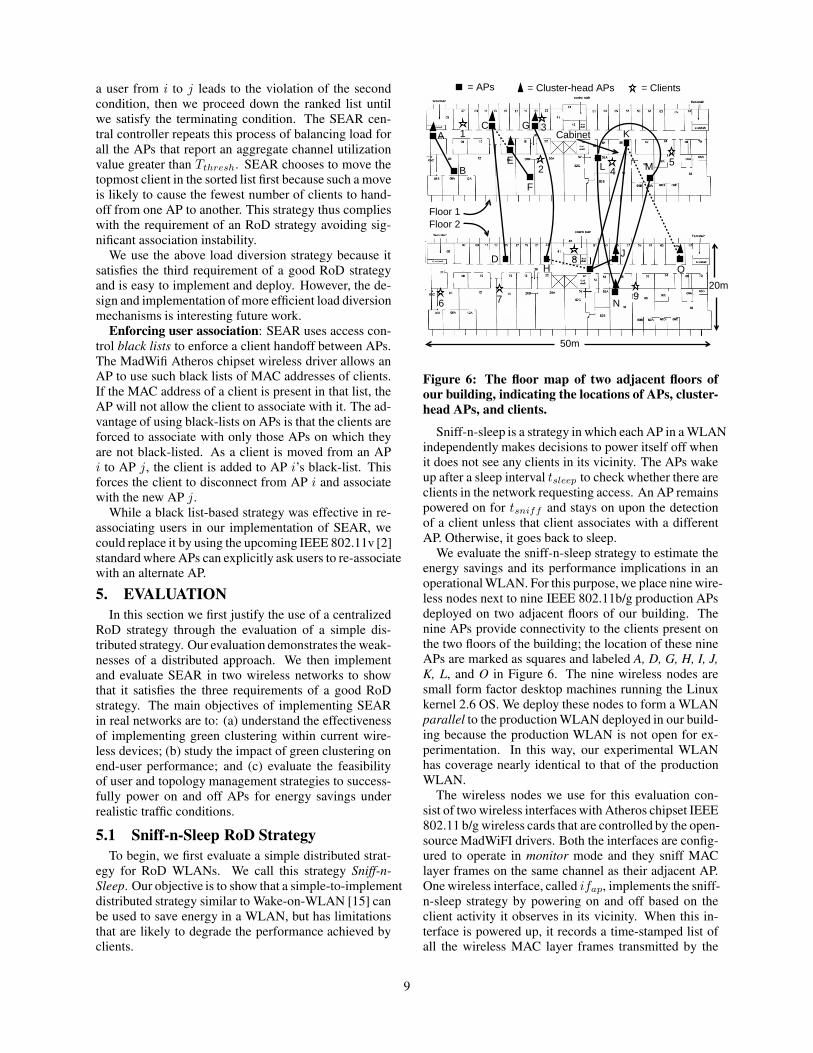
Figure 6: The floor map of two adjacent floors of
our building, indicating the locations of APs, cluster-
head APs, and clients.
Sniff-n-sleep is a strategy in which each AP in a WLANindependently makes decisions to power itself off whenit does not see any clients in its vicinity. The APs wakeup after a sleep interval tsleep to check whether there areclients in the network requesting access. An AP remainspowered on for tsniff and stays on upon the detectionof a client unless that client associates with a differentAP. Otherwise, it goes back to sleep.
We evaluate the sniff-n-sleep strategy to estimate theenergy savings and its performance implications in anoperational WLAN. For this purpose, we place nine wire-less nodes next to nine IEEE 802.11b/g production APsdeployed on two adjacent floors of our building. Thenine APs provide connectivity to the clients present onthe two floors of the building; the location of these nineAPs are marked as squares and labeled A, D, G, H, I, J,
K, L, and O in Figure 6. The nine wireless nodes aresmall form factor desktop machines running the Linuxkernel 2.6 OS. We deploy these nodes to form a WLANparallel to the production WLAN deployed in our build-ing because the production WLAN is not open for ex-perimentation. In this way, our experimental WLANhas coverage nearly identical to that of the productionWLAN.
The wireless nodes we use for this evaluation con-sist of two wireless interfaces with Atheros chipset IEEE802.11 b/g wireless cards that are controlled by the open-source MadWiFI drivers. Both the interfaces are config-ured to operate in monitor mode and they sniff MAClayer frames on the same channel as their adjacent AP.One wireless interface, called ifap, implements the sniff-n-sleep strategy by powering on and off based on theclient activity it observes in its vicinity. When this in-terface is powered up, it records a time-stamped list ofall the wireless MAC layer frames transmitted by the
9
0 10 20 30 40 50 600
0.1
0.2
0.3
0.4
0.5
0.6
0.7
0.8
0.9
1
Number of Seconds
CD
F
tsleep
= 60 seconds, tsniff
= 10 seconds
tsleep
= 60 seconds, tsniff
= 30 seconds
tsleep
= 60 seconds, tsniff
= 60 seconds
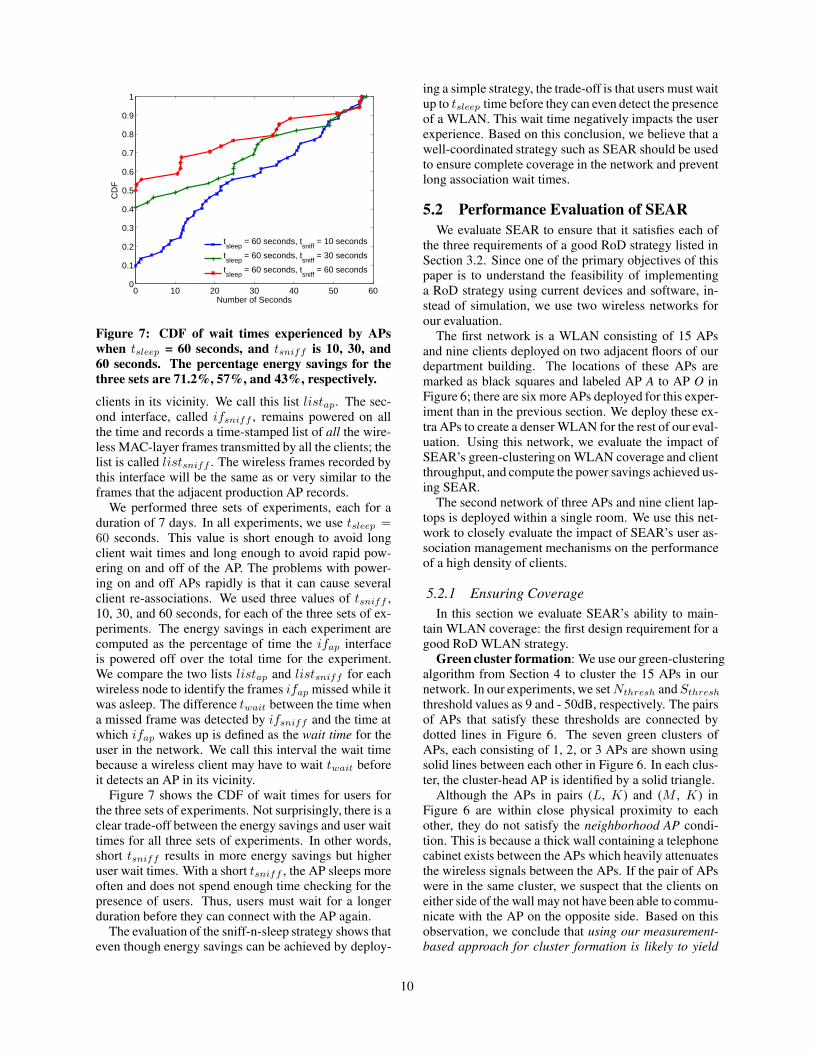
Figure 7: CDF of wait times experienced by APs
when tsleep = 60 seconds, and tsniff is 10, 30, and
60 seconds. The percentage energy savings for the
three sets are 71.2%, 57%, and 43%, respectively.
clients in its vicinity. We call this list listap. The sec-ond interface, called ifsniff , remains powered on allthe time and records a time-stamped list of all the wire-less MAC-layer frames transmitted by all the clients; thelist is called listsniff . The wireless frames recorded bythis interface will be the same as or very similar to theframes that the adjacent production AP records.
We performed three sets of experiments, each for aduration of 7 days. In all experiments, we use tsleep =60 seconds. This value is short enough to avoid longclient wait times and long enough to avoid rapid pow-ering on and off of the AP. The problems with power-ing on and off APs rapidly is that it can cause severalclient re-associations. We used three values of tsniff ,10, 30, and 60 seconds, for each of the three sets of ex-periments. The energy savings in each experiment arecomputed as the percentage of time the ifap interfaceis powered off over the total time for the experiment.We compare the two lists listap and listsniff for eachwireless node to identify the frames ifap missed while itwas asleep. The difference twait between the time whena missed frame was detected by ifsniff and the time atwhich ifap wakes up is defined as the wait time for theuser in the network. We call this interval the wait timebecause a wireless client may have to wait twait beforeit detects an AP in its vicinity.
Figure 7 shows the CDF of wait times for users forthe three sets of experiments. Not surprisingly, there is aclear trade-off between the energy savings and user waittimes for all three sets of experiments. In other words,short tsniff results in more energy savings but higheruser wait times. With a short tsniff , the AP sleeps moreoften and does not spend enough time checking for thepresence of users. Thus, users must wait for a longerduration before they can connect with the AP again.
The evaluation of the sniff-n-sleep strategy shows thateven though energy savings can be achieved by deploy-
ing a simple strategy, the trade-off is that users must waitup to tsleep time before they can even detect the presenceof a WLAN. This wait time negatively impacts the userexperience. Based on this conclusion, we believe that awell-coordinated strategy such as SEAR should be usedto ensure complete coverage in the network and preventlong association wait times.
5.2 Performance Evaluation of SEAR
We evaluate SEAR to ensure that it satisfies each ofthe three requirements of a good RoD strategy listed inSection 3.2. Since one of the primary objectives of thispaper is to understand the feasibility of implementinga RoD strategy using current devices and software, in-stead of simulation, we use two wireless networks forour evaluation.
The first network is a WLAN consisting of 15 APsand nine clients deployed on two adjacent floors of ourdepartment building. The locations of these APs aremarked as black squares and labeled AP A to AP O inFigure 6; there are six more APs deployed for this exper-iment than in the previous section. We deploy these ex-tra APs to create a denser WLAN for the rest of our eval-uation. Using this network, we evaluate the impact ofSEAR’s green-clustering on WLAN coverage and clientthroughput, and compute the power savings achieved us-ing SEAR.
The second network of three APs and nine client lap-tops is deployed within a single room. We use this net-work to closely evaluate the impact of SEAR’s user as-sociation management mechanisms on the performanceof a high density of clients.
5.2.1 Ensuring Coverage
In this section we evaluate SEAR’s ability to main-tain WLAN coverage: the first design requirement for agood RoD WLAN strategy.
Green cluster formation: We use our green-clusteringalgorithm from Section 4 to cluster the 15 APs in ournetwork. In our experiments, we set Nthresh and Sthresh
threshold values as 9 and - 50dB, respectively. The pairsof APs that satisfy these thresholds are connected bydotted lines in Figure 6. The seven green clusters ofAPs, each consisting of 1, 2, or 3 APs are shown usingsolid lines between each other in Figure 6. In each clus-ter, the cluster-head AP is identified by a solid triangle.
Although the APs in pairs (L, K) and (M , K) inFigure 6 are within close physical proximity to eachother, they do not satisfy the neighborhood AP condi-tion. This is because a thick wall containing a telephonecabinet exists between the APs which heavily attenuatesthe wireless signals between the APs. If the pair of APswere in the same cluster, we suspect that the clients oneither side of the wall may not have been able to commu-nicate with the AP on the opposite side. Based on thisobservation, we conclude that using our measurement-
based approach for cluster formation is likely to yield
10
Clie
nt N
umbe
r
A B C D E F G H I J K L M N O
AP Label
5
6
7
8
4
3
2
1
9
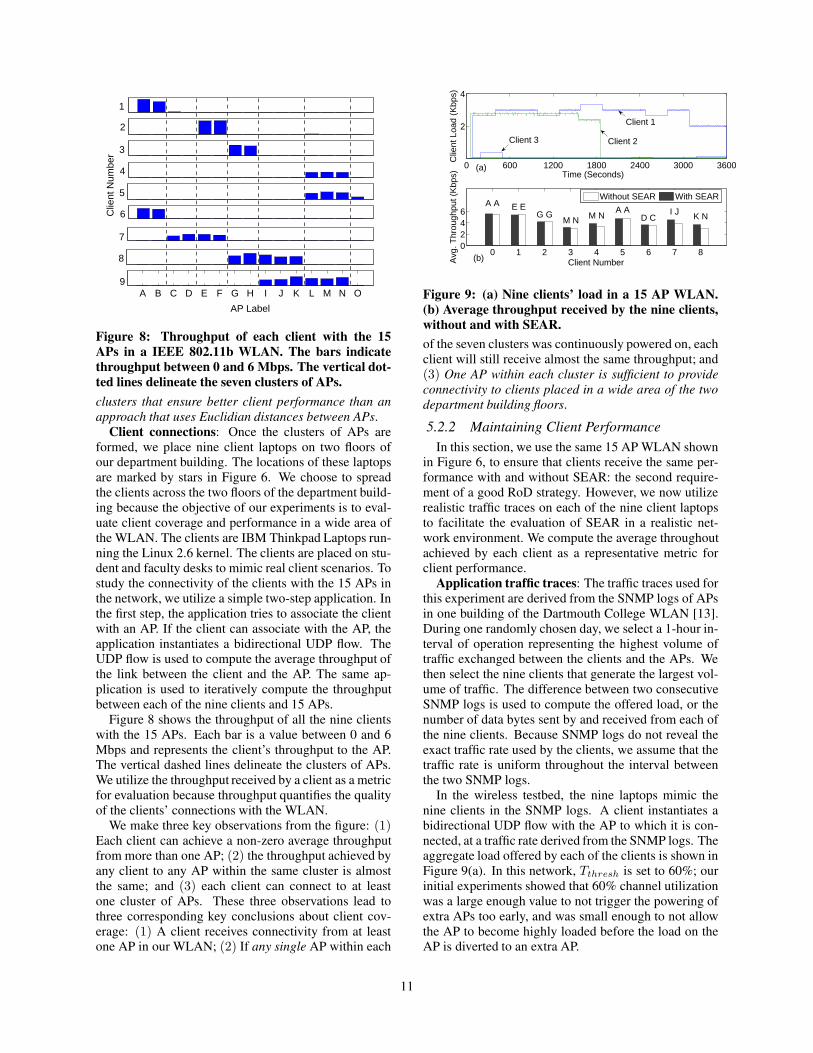
Figure 8: Throughput of each client with the 15
APs in a IEEE 802.11b WLAN. The bars indicate
throughput between 0 and 6 Mbps. The vertical dot-
ted lines delineate the seven clusters of APs.
clusters that ensure better client performance than an
approach that uses Euclidian distances between APs.Client connections: Once the clusters of APs are
formed, we place nine client laptops on two floors ofour department building. The locations of these laptopsare marked by stars in Figure 6. We choose to spreadthe clients across the two floors of the department build-ing because the objective of our experiments is to eval-uate client coverage and performance in a wide area ofthe WLAN. The clients are IBM Thinkpad Laptops run-ning the Linux 2.6 kernel. The clients are placed on stu-dent and faculty desks to mimic real client scenarios. Tostudy the connectivity of the clients with the 15 APs inthe network, we utilize a simple two-step application. Inthe first step, the application tries to associate the clientwith an AP. If the client can associate with the AP, theapplication instantiates a bidirectional UDP flow. TheUDP flow is used to compute the average throughput ofthe link between the client and the AP. The same ap-plication is used to iteratively compute the throughputbetween each of the nine clients and 15 APs.
Figure 8 shows the throughput of all the nine clientswith the 15 APs. Each bar is a value between 0 and 6Mbps and represents the client’s throughput to the AP.The vertical dashed lines delineate the clusters of APs.We utilize the throughput received by a client as a metricfor evaluation because throughput quantifies the qualityof the clients’ connections with the WLAN.
We make three key observations from the figure: (1)Each client can achieve a non-zero average throughputfrom more than one AP; (2) the throughput achieved byany client to any AP within the same cluster is almostthe same; and (3) each client can connect to at leastone cluster of APs. These three observations lead tothree corresponding key conclusions about client cov-erage: (1) A client receives connectivity from at leastone AP in our WLAN; (2) If any single AP within each
0 1 2 3 4 5 6 7 80246
Client NumberAvg
. Thr
ough
put (
Kbp
s)
0 600 1200 1800 2400 3000 3600
2
4
Time (Seconds)
Clie
nt L
oad
(Kbp
s)
Without SEAR With SEARA A E E
G GM N M N
A AD C
I J K N
Client 1
Client 2Client 3
(a)
(b)
Figure 9: (a) Nine clients’ load in a 15 AP WLAN.
(b) Average throughput received by the nine clients,
without and with SEAR.
of the seven clusters was continuously powered on, eachclient will still receive almost the same throughput; and(3) One AP within each cluster is sufficient to provide
connectivity to clients placed in a wide area of the two
department building floors.
5.2.2 Maintaining Client Performance
In this section, we use the same 15 AP WLAN shownin Figure 6, to ensure that clients receive the same per-formance with and without SEAR: the second require-ment of a good RoD strategy. However, we now utilizerealistic traffic traces on each of the nine client laptopsto facilitate the evaluation of SEAR in a realistic net-work environment. We compute the average throughoutachieved by each client as a representative metric forclient performance.
Application traffic traces: The traffic traces used forthis experiment are derived from the SNMP logs of APsin one building of the Dartmouth College WLAN [13].During one randomly chosen day, we select a 1-hour in-terval of operation representing the highest volume oftraffic exchanged between the clients and the APs. Wethen select the nine clients that generate the largest vol-ume of traffic. The difference between two consecutiveSNMP logs is used to compute the offered load, or thenumber of data bytes sent by and received from each ofthe nine clients. Because SNMP logs do not reveal theexact traffic rate used by the clients, we assume that thetraffic rate is uniform throughout the interval betweenthe two SNMP logs.
In the wireless testbed, the nine laptops mimic thenine clients in the SNMP logs. A client instantiates abidirectional UDP flow with the AP to which it is con-nected, at a traffic rate derived from the SNMP logs. Theaggregate load offered by each of the clients is shown inFigure 9(a). In this network, Tthresh is set to 60%; ourinitial experiments showed that 60% channel utilizationwas a large enough value to not trigger the powering ofextra APs too early, and was small enough to not allowthe AP to become highly loaded before the load on theAP is diverted to an extra AP.
11
AP
AP
AP
A
B
C
SEARCentral
Controller
8m
8m
ClientLaptops
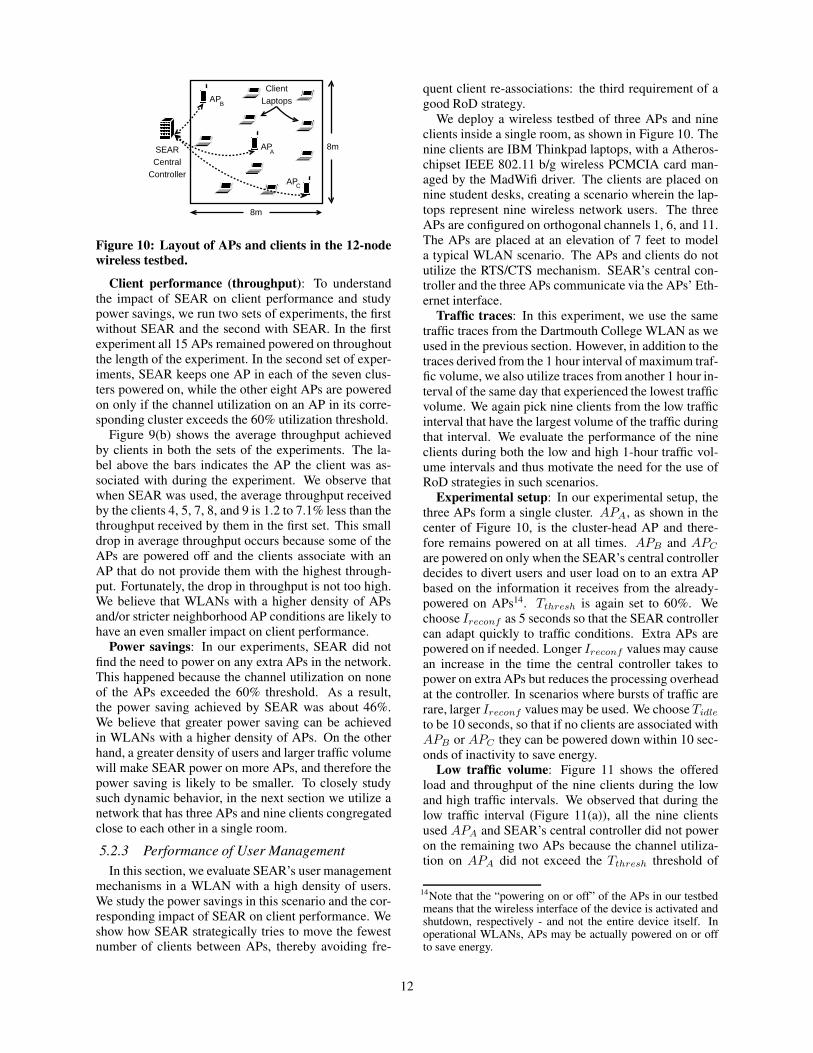
Figure 10: Layout of APs and clients in the 12-node
wireless testbed.
Client performance (throughput): To understandthe impact of SEAR on client performance and studypower savings, we run two sets of experiments, the firstwithout SEAR and the second with SEAR. In the firstexperiment all 15 APs remained powered on throughoutthe length of the experiment. In the second set of exper-iments, SEAR keeps one AP in each of the seven clus-ters powered on, while the other eight APs are poweredon only if the channel utilization on an AP in its corre-sponding cluster exceeds the 60% utilization threshold.
Figure 9(b) shows the average throughput achievedby clients in both the sets of the experiments. The la-bel above the bars indicates the AP the client was as-sociated with during the experiment. We observe thatwhen SEAR was used, the average throughput receivedby the clients 4, 5, 7, 8, and 9 is 1.2 to 7.1% less than thethroughput received by them in the first set. This smalldrop in average throughput occurs because some of theAPs are powered off and the clients associate with anAP that do not provide them with the highest through-put. Fortunately, the drop in throughput is not too high.We believe that WLANs with a higher density of APsand/or stricter neighborhood AP conditions are likely tohave an even smaller impact on client performance.
Power savings: In our experiments, SEAR did notfind the need to power on any extra APs in the network.This happened because the channel utilization on noneof the APs exceeded the 60% threshold. As a result,the power saving achieved by SEAR was about 46%.We believe that greater power saving can be achievedin WLANs with a higher density of APs. On the otherhand, a greater density of users and larger traffic volumewill make SEAR power on more APs, and therefore thepower saving is likely to be smaller. To closely studysuch dynamic behavior, in the next section we utilize anetwork that has three APs and nine clients congregatedclose to each other in a single room.
5.2.3 Performance of User Management
In this section, we evaluate SEAR’s user managementmechanisms in a WLAN with a high density of users.We study the power savings in this scenario and the cor-responding impact of SEAR on client performance. Weshow how SEAR strategically tries to move the fewestnumber of clients between APs, thereby avoiding fre-
quent client re-associations: the third requirement of agood RoD strategy.
We deploy a wireless testbed of three APs and nineclients inside a single room, as shown in Figure 10. Thenine clients are IBM Thinkpad laptops, with a Atheros-chipset IEEE 802.11 b/g wireless PCMCIA card man-aged by the MadWifi driver. The clients are placed onnine student desks, creating a scenario wherein the lap-tops represent nine wireless network users. The threeAPs are configured on orthogonal channels 1, 6, and 11.The APs are placed at an elevation of 7 feet to modela typical WLAN scenario. The APs and clients do notutilize the RTS/CTS mechanism. SEAR’s central con-troller and the three APs communicate via the APs’ Eth-ernet interface.
Traffic traces: In this experiment, we use the sametraffic traces from the Dartmouth College WLAN as weused in the previous section. However, in addition to thetraces derived from the 1 hour interval of maximum traf-fic volume, we also utilize traces from another 1 hour in-terval of the same day that experienced the lowest trafficvolume. We again pick nine clients from the low trafficinterval that have the largest volume of the traffic duringthat interval. We evaluate the performance of the nineclients during both the low and high 1-hour traffic vol-ume intervals and thus motivate the need for the use ofRoD strategies in such scenarios.
Experimental setup: In our experimental setup, thethree APs form a single cluster. APA, as shown in thecenter of Figure 10, is the cluster-head AP and there-fore remains powered on at all times. APB and APC
are powered on only when the SEAR’s central controllerdecides to divert users and user load on to an extra APbased on the information it receives from the already-powered on APs14. Tthresh is again set to 60%. Wechoose Ireconf as 5 seconds so that the SEAR controllercan adapt quickly to traffic conditions. Extra APs arepowered on if needed. Longer Ireconf values may causean increase in the time the central controller takes topower on extra APs but reduces the processing overheadat the controller. In scenarios where bursts of traffic arerare, larger Ireconf values may be used. We choose Tidle
to be 10 seconds, so that if no clients are associated withAPB or APC they can be powered down within 10 sec-onds of inactivity to save energy.
Low traffic volume: Figure 11 shows the offeredload and throughput of the nine clients during the lowand high traffic intervals. We observed that during thelow traffic interval (Figure 11(a)), all the nine clientsused APA and SEAR’s central controller did not poweron the remaining two APs because the channel utiliza-tion on APA did not exceed the Tthresh threshold of
14Note that the “powering on or off” of the APs in our testbedmeans that the wireless interface of the device is activated andshutdown, respectively - and not the entire device itself. Inoperational WLANs, APs may be actually powered on or offto save energy.
12
1 2 3 4 5 6 7 8 90
50
100M
egaB
ytes
1 2 3 4 5 6 7 8 9
50010001500200025003000
Client Number
Meg
aByt
es
Offered Load
Client Throughput
Client Throughput with Load Diversion
(b)
(a)
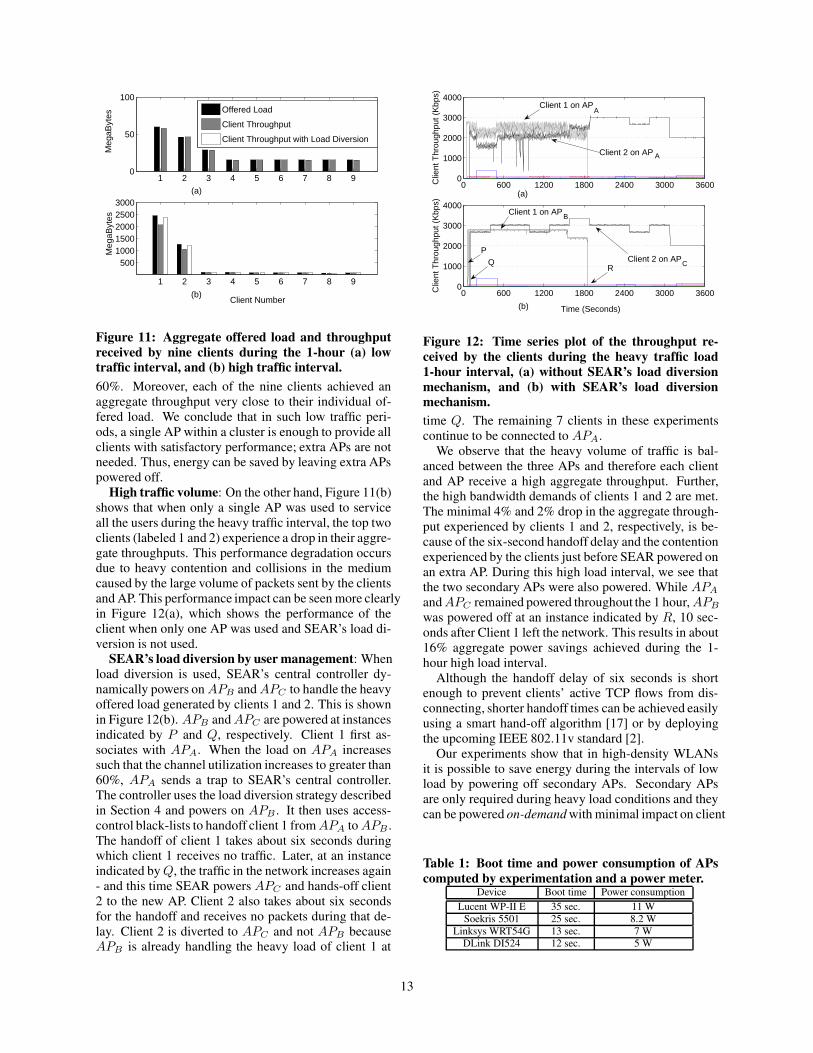
Figure 11: Aggregate offered load and throughput
received by nine clients during the 1-hour (a) low
traffic interval, and (b) high traffic interval.
60%. Moreover, each of the nine clients achieved anaggregate throughput very close to their individual of-fered load. We conclude that in such low traffic peri-ods, a single AP within a cluster is enough to provide allclients with satisfactory performance; extra APs are notneeded. Thus, energy can be saved by leaving extra APspowered off.
High traffic volume: On the other hand, Figure 11(b)shows that when only a single AP was used to serviceall the users during the heavy traffic interval, the top twoclients (labeled 1 and 2) experience a drop in their aggre-gate throughputs. This performance degradation occursdue to heavy contention and collisions in the mediumcaused by the large volume of packets sent by the clientsand AP. This performance impact can be seen more clearlyin Figure 12(a), which shows the performance of theclient when only one AP was used and SEAR’s load di-version is not used.
SEAR’s load diversion by user management: Whenload diversion is used, SEAR’s central controller dy-namically powers on APB and APC to handle the heavyoffered load generated by clients 1 and 2. This is shownin Figure 12(b). APB and APC are powered at instancesindicated by P and Q, respectively. Client 1 first as-sociates with APA. When the load on APA increasessuch that the channel utilization increases to greater than60%, APA sends a trap to SEAR’s central controller.The controller uses the load diversion strategy describedin Section 4 and powers on APB . It then uses access-control black-lists to handoff client 1 from APA to APB .The handoff of client 1 takes about six seconds duringwhich client 1 receives no traffic. Later, at an instanceindicated by Q, the traffic in the network increases again- and this time SEAR powers APC and hands-off client2 to the new AP. Client 2 also takes about six secondsfor the handoff and receives no packets during that de-lay. Client 2 is diverted to APC and not APB becauseAPB is already handling the heavy load of client 1 at
0 600 1200 1800 2400 3000 36000
1000
2000
3000
4000
Clie
nt T
hrou
ghpu
t (K
bps)
0 600 1200 1800 2400 3000 36000
1000
2000
3000
4000
Time (Seconds)
Clie
nt T
hrou
ghpu
t (K
bps)
Client 1 on AP
Client 2 on AP
Client 2 on AP
Client 1 on AP
PQ
R
(a)
(b)
A
A
B
C
Figure 12: Time series plot of the throughput re-
ceived by the clients during the heavy traffic load
1-hour interval, (a) without SEAR’s load diversion
mechanism, and (b) with SEAR’s load diversion
mechanism.
time Q. The remaining 7 clients in these experimentscontinue to be connected to APA.
We observe that the heavy volume of traffic is bal-anced between the three APs and therefore each clientand AP receive a high aggregate throughput. Further,the high bandwidth demands of clients 1 and 2 are met.The minimal 4% and 2% drop in the aggregate through-put experienced by clients 1 and 2, respectively, is be-cause of the six-second handoff delay and the contentionexperienced by the clients just before SEAR powered onan extra AP. During this high load interval, we see thatthe two secondary APs were also powered. While APA
and APC remained powered throughout the 1 hour, APB
was powered off at an instance indicated by R, 10 sec-onds after Client 1 left the network. This results in about16% aggregate power savings achieved during the 1-hour high load interval.
Although the handoff delay of six seconds is shortenough to prevent clients’ active TCP flows from dis-connecting, shorter handoff times can be achieved easilyusing a smart hand-off algorithm [17] or by deployingthe upcoming IEEE 802.11v standard [2].
Our experiments show that in high-density WLANsit is possible to save energy during the intervals of lowload by powering off secondary APs. Secondary APsare only required during heavy load conditions and theycan be powered on-demand with minimal impact on client
Table 1: Boot time and power consumption of APs
computed by experimentation and a power meter.Device Boot time Power consumption
Lucent WP-II E 35 sec. 11 WSoekris 5501 25 sec. 8.2 W
Linksys WRT54G 13 sec. 7 WDLink DI524 12 sec. 5 W
13
performance. As shown in Table 1, many fat APs wetested power on in 13 to 35 seconds, and therefore, clientscan easily remain connected with any already powered-on AP until the SEAR central controller boots a sec-ondary AP. Thin APs in centralized WLANs can be pow-ered on much faster. Moreover, clever load predictionalgorithms may be designed to power on secondary APsearly to reduce the impact of long boot times.
6. FUTURE RESEARCH DIRECTIONS
In this section, we discuss future directions of researchin RoD WLANs.
Client performance estimation: Estimation of clientperformance in a production network is a difficult prob-lem to solve because of the large number of metric com-binations and little knowledge of clients’ intended net-work activities. For RoD WLANs, solving this problemis important because the powering on and off of APscan be better controlled if the network can accuratelydetect an impact on client performance. In this paperwe use client throughput as a performance metric be-cause it provides a good estimate of client performance.However, alternative metrics such as frame data-rate andsignal strength, or a combination of them may be usedbased on the performance objectives of each WLAN.
Topology control algorithms: In this paper we usethreshold-based schemes for powering on or off APs.While such schemes are easy-to-implement and havebeen shown to achieve significant energy savings, webelieve that mature control algorithms should be devel-oped to make smarter decisions in RoD WLANs. Smarterload diversion and hand-off techniques [2, 17] may beused to further minimize the impact of SEAR on clientperformance.
Client participation: We envision future WLAN sce-narios wherein clients actively participate in conservingenergy by informing the WLAN about when they needresources, how many, and for how long. In such scenar-ios, WLANs can generate schedules and power on APsonly during predetermined intervals of time.
Infrastructure support: Extra energy savings can beachieved if power-hungry switches and controllers in theWLAN can also be powered off during intervals of lowdemand. The powering off of switches and controllersmay require WLAN managers to strategically re-wireAPs to different switches so that the powering off of APsand the switches can be coordinated efficiently [10].
Hardware modifications: Better hardware-based powerstandby modes can be used to save more energy andeven further minimize the impact on client performance.Strategies such as SEAR can utilize specialized standbymodes on APs for faster powering on of the APs.
7. CONCLUSIONS
This paper proposes the adoption of resource on-de-mand (RoD) WLAN strategies that can efficiently re-duce energy consumption of a WLAN without adversely
impacting the performance of clients in the network. Westress that energy-efficient mechanisms for large-scaleand high-density WLANs should be designed and de-veloped today - to save energy in future WLANs andthus avoid the escalation of energy wastage.
We have proposed a practical RoD strategy, calledSEAR. We have demonstrated that SEAR can be easily
implemented using current devices, and the on-demand
powering of APs is a feasible strategy that does not ad-
versely impact end-user performance. We have also dis-cussed several interesting problems as future researchdirections towards the wide-spread deployment of RoDWLANs. Our next step is to evaluate the performanceof SEAR in large-scale WLANs.
The most important message of this paper is that theenergy wasted in large-scale and high-density WLANsis a new and serious concern. This paper makes the firstattempt at designing strategies to reduce energy wastagein WLANs. However, additional work is still needed toavoid the escalation of energy wastage in the future.
8. REFERENCES[1] Dartmouth College WLAN. http://crawdad.cs.dartmouth.edu.[2] IEEE 802.11v: Wireless Network Management.
http://grouper.ieee.org/groups/802/11/Reports/tgv update.htm.[3] IETF CAPWAP WG:
http://www.ietf.org/html.charters/capwap-charter.html.[4] Aruba Selected by Microsoft For Next Generation Wireless LAN.
http://www.arubanetworks.com/news/release/2005/06/13, 2005.[5] Forrester Research. http://www.forrester.com, 2006.[6] Y. Bejerano. Efficient Integration of Multi-hop Wireless and Wired
Networks with QoS constraints. In ACM Mobicom, Atlanta, GA,September 2002.
[7] J. S. Chase, D. C. Anderson, P. N. Thakar, A. Vahdat, and R. P. Doyle.Managing Energy and Server Resources in Hosting Centres. In SOSP,Banff, Canada, October 2001.
[8] K. J. Christensen, C. Gunaratne, B. Nordman, and A. D. George. TheNext Frontier for Communications Networks: Power Management.Elsevier Computer Communications, 27:1758–1770, June 2004.
[9] M. Gupta and S. Singh. Greening of the Internet. In ACM SIGCOMM,Karlsruhe, Germany, August 2003.
[10] A. P. Jardosh, G. Iannaccone, K. Papagiannaki, and B. Vinnakota.Towards an Energy-Star WLAN Infrastructure. In HotMobile, Tucson,AZ, February 2007.
[11] A. P. Jardosh, K. N. Ramachandran, K. C. Almeroth, and E. M. Belding.Understanding Link-Layer Behavior in Highly Congested IEEE 802.11bWireless Networks. In Proceedings of ACM SIGCOMM WorkshopE-WIND, Philadelphia, PA, August 2005.
[12] A. P. Jardosh, K. N. Ramchandran, K. C. Almeroth, and E. M. Belding.Understanding Congestion in IEEE 802.11b Wireless Networks. InProceedings of USENIX IMC, Berkeley, CA, October 2005.
[13] D. Kotz, T. Henderson, and I. Abyzov. CRAWDAD trace setdartmouth/campus/snmp (v. 2004-11-09). Downloaded fromhttp://crawdad.cs.dartmouth.edu/dartmouth/campus/snmp, Nov. 2004.
[14] A. Meka and A. K. Singh. Distributed Spatial Clustering in SensorNetworks. In EDBT, Munich, Germany, March 2006.
[15] N. Mishra, K. Chebrolu, B. Raman, and A. Pathak. Wake-on-WLAN. InACM WWW, Edinburgh, UK, May 2006.
[16] E. Pinheiro, R. Bianchini, and C. Dubnicki. Exploiting Redundancy toConserve Energy in Storage Systems. In Sigmetrics, Saint Malo, France,June 2006.
[17] I. Ramani and S. Savage. SyncScan: Practical Fast Handoff for 802.11Infrastructure Networks. In Proceedings of IEEE Infocom, Miami, FL,March 2005.
[18] C. Reis, R. Mahajan, M. Rodrig, D. Wetherall, and J. Zahorjan.Measurement-Based Models of Delivery and Interference in StaticWireless Networks. In ACM Sigcomm, Pisa, Italy, September 2006.
[19] M. Rodrig, C. Reis, R. Mahajan, D. Wetherall, and J. Zahorjan.Measurement-based Characterization of 802.11 in a Hotspot Setting. InProceedings of EWIND, Philadelphia, PA, August 2005.
14