Green Valley Sand Quarry - RW CORKERY€¦ · Green Valley Sand Quarry TRAFFIC ASSESSMENT Prepared...
38
Green Valley Sand Quarry T TRAFFIC A ASSESSMENT Prepared by: Transport and Urban Planning September 2010 Specialist Consultant Studies Compendium: Volume 2, Part 6 Pty Limited ABN: 31 000 032 191
Transcript of Green Valley Sand Quarry - RW CORKERY€¦ · Green Valley Sand Quarry TRAFFIC ASSESSMENT Prepared...

Green Valley Sand Quarry
TTRRAAFFFFIICC AASSSSEESSSSMMEENNTT
Prepared by:
Transport and Urban Planning
September 2010
Specialist Consultant Studies Compendium: Volume 2, Part 6
Pty Limited ABN: 31 000 032 191

This page has intentionally been left blank

Transport and Urban Planning
TTRRAAFFFFIICC AASSSSEESSSSMMEENNTT
of the
Green Valley Sand Quarry
Prepared for: R.W. Corkery & Co. Pty Limited 1st Floor, 12 Dangar Road PO Box 239 BROOKLYN NSW 2083
Tel: (02) 9985 8511 Fax: (02) 9985 8208 Email: [email protected]
On behalf of: Rocla Pty Ltd 72 Orchardleigh Street PO Box 36 GUILDFORD NSW 2161
Tel: (02) 9632 0122 Fax: (02) 9632 7471 Email: [email protected]
Prepared by: Transport and Urban Planning PO Box 533 SUTHERLAND NSW 2232
Tel: (02) 9545 1411 Fax: (02) 9545 1556 Email: [email protected]
September 2010
Pty Limited ABN: 31 000 032 191

ROCLA PTY LTD 6-2 SPECIALIST CONSULTANT STUDIES Green Valley Sand Quarry Part 6 - Traffic Assessment Report No. 765/03
Transport and Urban Planning
COPYRIGHT
© Transport and Urban Planning, 2010
and
© Rocla Pty Ltd, 2010
All intellectual property and copyright reserved.
Apart from any fair dealing for the purpose of private study, research, criticism or review, as permitted under the Copyright Act, 1968, no part of this report may be reproduced, transmitted, stored in a retrieval system or adapted in any form or by any means (electronic, mechanical, photocopying, recording or otherwise) without written permission. Enquiries should be addressed to Transport and Urban Planning.

SPECIALIST CONSULTANT STUDIES 6-3 ROCLA PTY LTD Part 6 - Traffic Assessment Green Valley Sand Quarry Report No. 765/03
CONTENTS Page
Transport and Urban Planning
EXECUTIVE SUMMARY ......................................................................................................................................... 6-5
1. INTRODUCTION........................................................................................................................................... 6-7
1.1 BACKGROUND ............................................................................................................................. 6-7
1.2 AUTHORITY REQUIREMENTS ..................................................................................................... 6-9
1.3 STRUCTURE OF THIS REPORT ................................................................................................ 6-10
2. THE PROJECT ........................................................................................................................................... 6-11
2.1 THE PROJECT SITE ................................................................................................................... 6-11
2.2 PROJECT OVERVIEW ................................................................................................................ 6-11
2.3 PROPOSED VEHICLE ACCESS ................................................................................................. 6-12
2.4 INTERNAL ROADS ...................................................................................................................... 6-12
2.5 ACCESS TO “FREESTONE” HILL AND COMMUNICATION CABLES ....................................... 6-12
2.6 HOURS OF OPERATION AND PROJECT LIFE ......................................................................... 6-14 2.6.1 Hours of Operation .......................................................................................................... 6-17 2.6.2 Project Life ...................................................................................................................... 6-17
2.7 TRAFFIC GENERATION AND TRANSPORT ROUTES FOR SITE ESTABLISHMENT (CONSTRUCTION) PHASE ......................................................................................................... 6-17
2.8 TRAFFIC GENERATION AND TRANSPORT ROUTES DURING OPERATIONAL PHASE ....... 6-18 2.8.1 Product Transport Routes ............................................................................................... 6-18 2.8.2 Hours of Operation – Product Transportation ................................................................. 6-18 2.8.3 Product Truck Types and Traffic Generation .................................................................. 6-18
2.9 TYPE AND TRAFFIC GENERATION OF OTHER VEHICLES .................................................... 6-19
3. EXISTING TRAFFIC CONDITIONS............................................................................................................ 6-19
3.1 PRINCIPAL ROAD NETWORK.................................................................................................... 6-19
3.2 DESCRIPTION OF EXISTING ROADS ....................................................................................... 6-20 3.2.1 Hume Highway ................................................................................................................ 6-20 3.2.2 Local Roads Near the Project Site .................................................................................. 6-21
3.3 EXISTING TRAFFIC CONDITIONS ON THE ROAD NETWORK ................................................ 6-21 3.3.1 Traffic Volumes ............................................................................................................... 6-21 3.3.2 Daily Traffic Volumes ...................................................................................................... 6-21 3.3.3 Hourly Traffic Volumes and Traffic Conditions ................................................................ 6-22 3.3.4 Future Traffic Growth ...................................................................................................... 6-24
3.4 ROAD SAFETY ............................................................................................................................ 6-24
3.5 BUS ROUTES .............................................................................................................................. 6-24
4. ASSESSMENT OF TRAFFIC IMPACTS OF PROPOSAL ......................................................................... 6-25
4.1 PROPOSED TRAFFIC MANAGEMENT IN HUME HIGHWAY AT THE PROJECT SITE ............ 6-25
4.2 ASSESSMENT OF TRAFFIC IMPACTS ASSOCIATED WITH OPERATIONAL PHASE ............ 6-25
4.3 ROAD SAFETY ............................................................................................................................ 6-33
4.4 SCHOOL BUS ROUTES .............................................................................................................. 6-34
4.5 ASSESSMENT OF TRAFFIC IMPACTS ASSOCIATED WITH SITE ESTABLISHMENT (CONSTRUCTION) PHASE ......................................................................................................... 6-34
5. CONCLUSIONS.......................................................................................................................................... 6-35
ROCLA PTY LTD 6-4 SPECIALIST CONSULTANT STUDIES Green Valley Sand Quarry Part 6 - Traffic Assessment Report No. 765/03
CONTENTS Page
Transport and Urban Planning
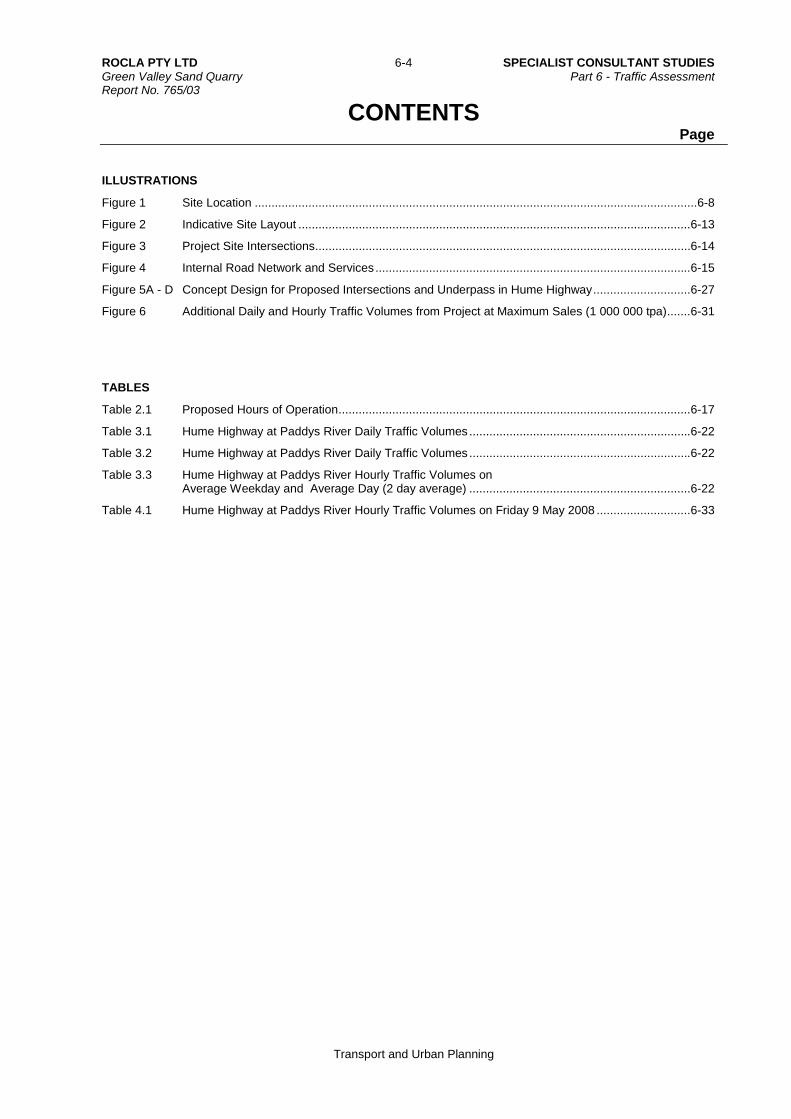
ILLUSTRATIONS
Figure 1 Site Location .................................................................................................................................... 6-8
Figure 2 Indicative Site Layout ..................................................................................................................... 6-13
Figure 3 Project Site Intersections ................................................................................................................ 6-14
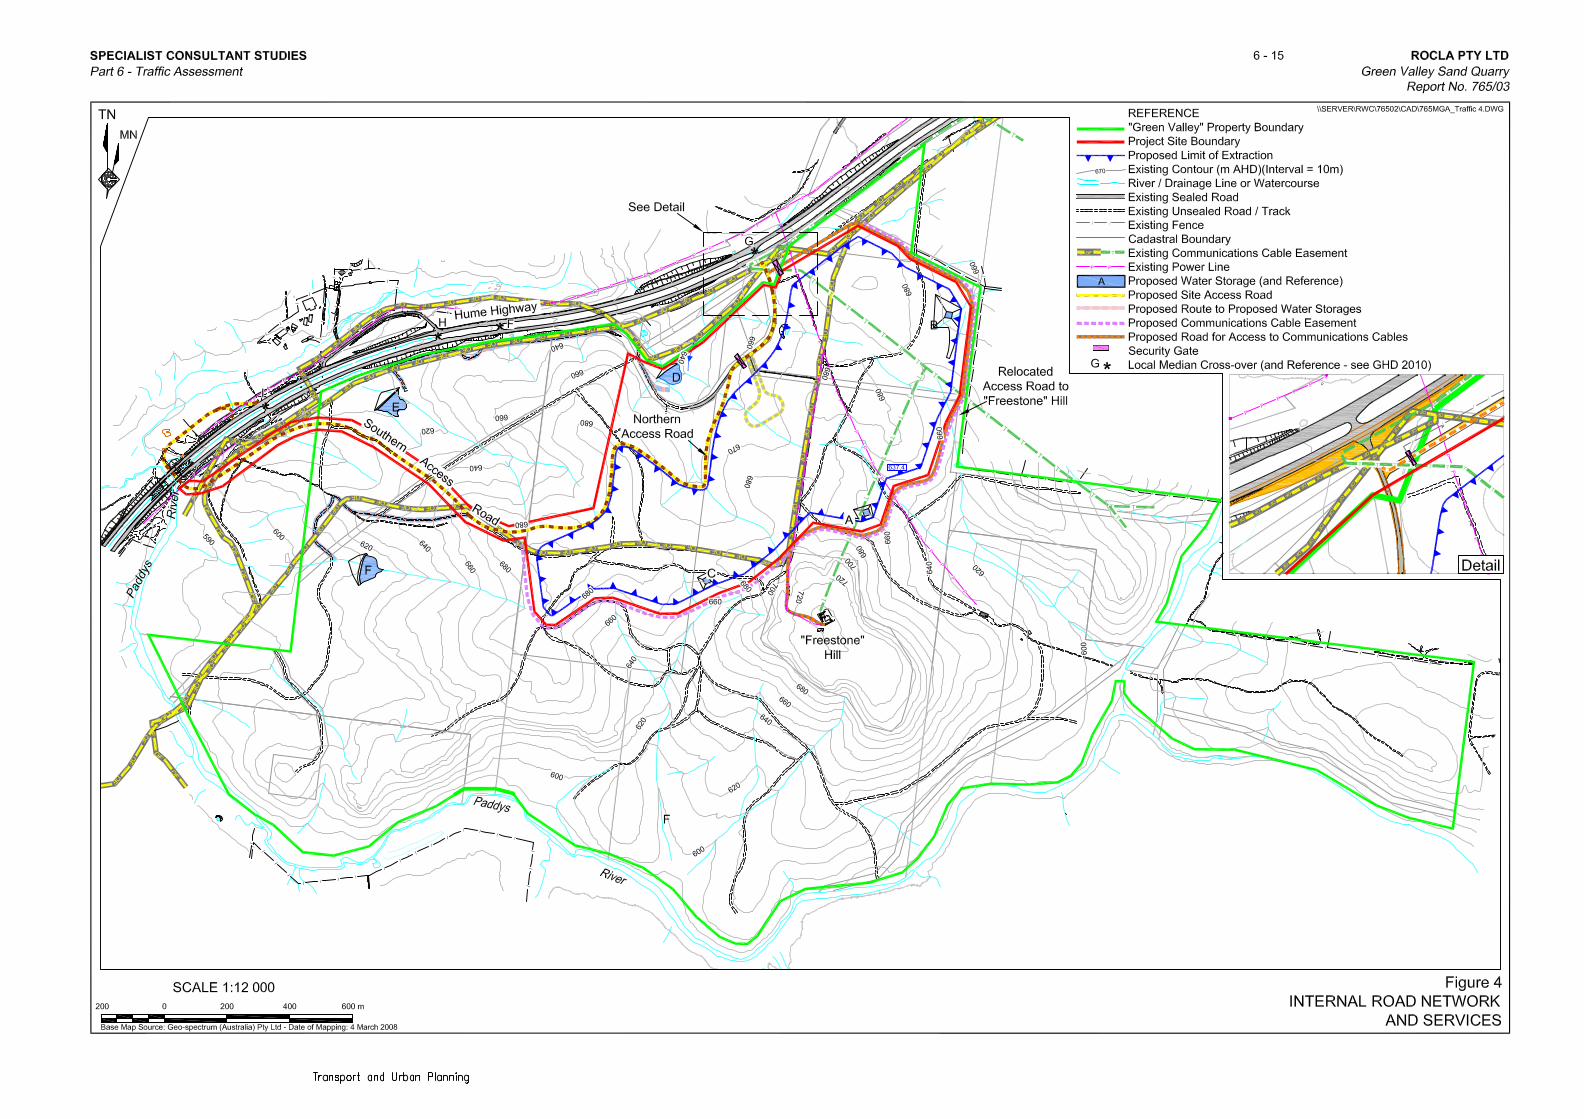
Figure 4 Internal Road Network and Services .............................................................................................. 6-15
Figure 5A - D Concept Design for Proposed Intersections and Underpass in Hume Highway ............................. 6-27
Figure 6 Additional Daily and Hourly Traffic Volumes from Project at Maximum Sales (1 000 000 tpa) ....... 6-31 TABLES
Table 2.1 Proposed Hours of Operation ......................................................................................................... 6-17
Table 3.1 Hume Highway at Paddys River Daily Traffic Volumes .................................................................. 6-22
Table 3.2 Hume Highway at Paddys River Daily Traffic Volumes .................................................................. 6-22
Table 3.3 Hume Highway at Paddys River Hourly Traffic Volumes on Average Weekday and Average Day (2 day average) .................................................................. 6-22
Table 4.1 Hume Highway at Paddys River Hourly Traffic Volumes on Friday 9 May 2008 ............................ 6-33

SPECIALIST CONSULTANT STUDIES 6-5 ROCLA PTY LTD Part 6 - Traffic Assessment Green Valley Sand Quarry Report No. 765/03
Transport and Urban Planning
EXECUTIVE SUMMARY
This report documents the assessments of traffic impacts of a project to operate a sand quarry on the “Green Valley” property, which is located adjacent to Paddys River.
The Project, when fully operational would produce and transport up to 1,000,000 tonnes of sand product per year.
As part of the Project, the Proponent, Rocla Pty Ltd, will construct two (2) new intersections with the Hume Highway together with a loop road underpass of the Hume Highway at Paddys River. The intersections will accommodate left in / left out movements only and deceleration and acceleration lanes at each intersection will be constructed to RTA standards, to facilitate safe exit and entry movements between the Project Site and the Hume Highway.
The proposed intersections will result in changes to the vehicle access for several properties that have direct access to the Hume Highway adjacent the Project Site and will rationalise the number of median openings (crossings) in the highway. Light vehicle access would remain for light vehicles entering and leaving the “Green Valley” property from the existing property entrance.
The existing road and traffic conditions along the Hume Highway adjacent the Project Site are good. The Hume Highway has separate 2 lane carriageways for each direction of travel and a high level of traffic management is provided. Traffic volumes and classification counts indicate that the Hume Highway has sufficient road capacity to accommodate the existing and future projected traffic volumes that will use the Hume Highway.
Currently there is one (1) school bus route that operates along the Hume Highway north of Paddys River and one (1) school bus service that operates south of Paddys River in the morning and afternoon on school days. These school bus services meet each other in Murrimba Road and transfer children at approximately 7.35am and 4.35pm on school days.
At full production of 1,000,000 tonnes per annum, the project would generate 240 truck movements on an average day and up to 284 truck movements on a busy (85th percentile) day. In addition, there would be an additional 80 light vehicle movements plus 2-4 truck movements associated with staff, visitors and fuel and maintenance. These traffic movements will be evenly split between arrivals and departures from / to the north and south along the Hume Highway. During a busy (85th percentile) hour, 12-13 trucks would arrive and 12-13 trucks depart the Project Site via both the northern and southern intersections.
The assessment has found that the Hume Highway has sufficient road capacity to easily absorb the additional traffic generated by the Project. The proposed traffic management at the Project Site’s northern and southern intersections will provide safe intersection facilities to enable these vehicles to safely exit and enter the Hume Highway, with minimal disruption and impact on other vehicles using the Hume Highway.
During the Site Establishment (construction) phase, the traffic generation is expected to be up to 106 traffic movements per day plus any additional vehicles associated with the construction of the northern and southern intersections. A detailed Traffic Management Plan will be prepared following approval of the Project to safely manage the traffic impacts during the Site Establishment period, including the construction of the northern and southern intersections.

ROCLA PTY LTD 6-6 SPECIALIST CONSULTANT STUDIES Green Valley Sand Quarry Part 6 - Traffic Assessment Report No. 765/03
Transport and Urban Planning
This page has intentionally been left blank

SPECIALIST CONSULTANT STUDIES 6-7 ROCLA PTY LTD Part 6 - Traffic Assessment Green Valley Sand Quarry Report No. 765/03
Transport and Urban Planning
1. I N T RO D U C TI ON
1.1 BACKGROUND
Rocla Pty Ltd (Rocla) propose to operate a sand quarry on the “Green Valley” property (Project Site) which is located at Paddys River.
The Project Site is owned by VSSV Pty Ltd and would be leased by Rocla.
The Project Site is located adjacent to the Hume Highway just north of the bridge over Paddys River. The Project Site is approximately 28 kilometres northwest of Berrima and 14 kilometres northeast of Marulan. (See Figure 1).
Vehicle access to the Project Site is proposed from the Hume Highway, via two new intersections. These intersections, the northern intersection and the southern intersection will be linked via a loop road under the Hume Highway at Paddys River. Suitable traffic management by way of deceleration and acceleration lanes would be provided to Roads and Traffic Authority’s standards and would provide safe vehicle access to the Project Site in the Hume Highway, for both directions of travel.
Rocla’s principal objectives for the Green Valley Sand Quarry are:
Securing access to sand resources that would ensure the continued provision of
a range of construction materials to the Sydney Metropolitan Area, Southern Highlands and South Coast construction markets at a reasonable price;
Maintaining the level of production from the Green Valley Sand Quarry between 800 000 tonnes per annum (tpa) and 1 million tpa to meet the supply demands of these markets particularly as production is reduced or ceases at other fine sand sources and at Penrith Lakes;
Progressively rehabilitating disturbed areas to provide for future agricultural pursuits and nature conservation or potentially other land uses at the completion of operations;
Increasing local employment levels;
Maximising the recovery of the natural resource;
Blending Virgin Excavated Natural Material (VENM), Excavated Natural Materials (ENM) and/or hard rock quarry products and by-products with washed sand produced on site for use in concrete production or other construction uses; and
Providing a repository for small quantities of VENM/ENM in the final landform within the area of disturbance.


SPECIALIST CONSULTANT STUDIES 6-9 ROCLA PTY LTD Part 6 - Traffic Assessment Green Valley Sand Quarry Report No. 765/03
Transport and Urban Planning
The sand produced would contribute significantly towards meeting the predicted shortages of this important construction material for the building and construction industry in the Sydney Metropolitan Area, Southern Highlands and the South Coast. These broad objectives would be achieved by:
Planning and removing the sand resource in a manner that maximises the quality and quantity of material removed.
Undertaking all activities in an environmentally responsible manner that enables compliance with all relevant statutory requirements;
Operating the quarry in consultation with surrounding residents and the wider community; and
Monitoring and reviewing the environmental performance of all activities.
1.2 AUTHORITY REQUIREMENTS
As part of the preparation of the Traffic Impact Assessment for the Green Valley Sand Quarry, consideration was given to the requirements of the Director-General (of the Department of Planning), Roads and Traffic Authority and Wingecarribee Shire Council and other authorities, as well as any key issues identified by these authorities.
Director-General’s Requirements
The Director-General’s requirements (DGR’s) indicated that the Traffic Assessment should include:
Accurate estimates of the likely traffic generation of the project;
An assessment of the impacts of this traffic on the safety and efficiency of the road network; and
The detailed design of proposed quarry access to and from the Hume Highway.
Roads and Traffic Authority
Consultation with the Roads and Traffic Authority (RTA) has been undertaken by R W Corkery and Co Pty Ltd and GHD concerning the proposed vehicle access to the Hume Highway via the proposed two intersections and the link road that passes under the bridge structures of the Hume Highway at Paddys River. GHD on behalf of Rocla has prepared a detailed report on the vehicle access to the Hume Highway and the proposed link road under the Hume Highway at Paddys River. The GHD report addresses issues raised by the Roads and Traffic Authority concerning the concept design of the intersections and the loop road and includes a flood study. The GHD report addresses the vertical clearance of the loop road to the underside of the bridge structures, (Hume Highway) that cross Paddys River, the intersection requirements including the length of deceleration and acceleration lanes at the northern and southern intersections with the Hume Highway, drainage, hydrology and flooding issues, median restrictions/closures and vehicle access changes to adjoining properties required as part of the proposed new intersections. The GHD report is included as Part 5 of the Specialist Consultant Studies Compendium for this Project.

ROCLA PTY LTD 6-10 SPECIALIST CONSULTANT STUDIES Green Valley Sand Quarry Part 6 - Traffic Assessment Report No. 765/03
Transport and Urban Planning
The RTA also advised that a traffic study would be required and indicated that Table 2.1 of the Authority’s Guide to Traffic Generating Developments outlines key issues that may be considered when preparing the traffic impact study.
Wingecarribee Shire Council and other Authorities
Wingecarribee Shire Council raised the issue of the impact on the riparian zone of the proposed loop road under the bridge at Paddys River, as did the Sydney Catchment Authority (SCA). This is not a traffic matter and is addressed in the Environmental Assessment report.
The Sydney Catchment Authority (SCA) also requires:
Details of the proposed practices to ensure materials transported from the site by road do not spill (as solid, liquid or dust);
Incident plans detailing procedures that would be followed in the event of an incident; and
Proposed access route maintenance including methods and frequency.
These matters are also addressed in the Environmental Assessment report.
1.3 STRUCTURE OF THIS REPORT
This report has been prepared to support an Environmental Assessment, to assess the traffic impacts associated with the project.
The assessment has been undertaken in accordance with the requirements of Roads and Traffic Authority’s Guide to Traffic Generating Developments, October 2002 and the Roads and Traffic Authority’s Road Design Guide.
Other technical standards / publications referenced in this assessment include:
Austroads Guide to Traffic Engineering Parts 1-15 (as appropriate)
The remaining sections of this report address the following:
Section 2 – describes the project;
Section 3 – examines the existing traffic conditions on the road network;
Section 4 – evaluates the traffic impacts of the project; and
Section 5 – presents conclusions

SPECIALIST CONSULTANT STUDIES 6-11 ROCLA PTY LTD Part 6 - Traffic Assessment Green Valley Sand Quarry Report No. 765/03
Transport and Urban Planning
2. T H E P RO JE C T
2.1 THE PROJECT SITE
The Project Site covers an area within the “Green Valley” property and is located on the eastern side of the Hume Highway just north of Paddys River Bridges at Paddys River. Murrimba Road is approximately 750 metres south of the Paddys River Bridges. Figure 1 shows the location.
The Project Site area is 105 hectares and will be leased by Rocla from VSSV Pty Ltd who are the owners.
2.2 PROJECT OVERVIEW
The proposed extraction, processing areas and ancillary areas are shown on Figure 2. An estimated 41 million tonnes of friable sandstone has been defined within the proposed extraction area capable of yielding approximately 30 million tonnes of high quality sand products.
A range of plant and equipment would be installed/constructed to process the extracted raw sand to produce quality sand products meeting nominated Australian standards and/or customers’ individual specifications. The principal products produced would be various grades of washed concrete sand and mortar sands.
The sand extraction and processing operations have been designed to optimise the recovery of sand whilst satisfying both site and surrounding environmental constraints and progressively creating a final landform suited to the proposed end uses.
Figure 2 displays the following principal components of the proposed project, which includes:
A seven stage extraction operation commencing adjacent to the processing area and advancing initially westwards and then northwards through the extraction area;
A fixed wash plant incorporating washing, screening, dewatering and product stockpiling beneath radial stackers. The plant would initially operate at approximately 150tph and ultimately be upgraded to produce 300tph. This plant would produce up to approximately 950 000tpa of various washed and blended sand products. This plant would be located within the processing area;
A mortar sand plant incorporating a vibrating screen would be used to remove oversize material from the mortar sand products. This plant would be mobile and located either within the processing area or near the active extraction area(s);
Access to the Project Site would be from the Hume Highway via two new intersections constructed to RTA’s requirements; (See Figure 3 and description below); and
The Project Site administration area (including the office/weighbridges, workshops and fuel storage) would be positioned adjacent to the processing plant for the life of the quarry.
The Project Site would be progressively rehabilitated in a manner that would provide long-term nature conservation and wildlife corridor values of the local area together with some agricultural/horticultural opportunities for the landowner.

ROCLA PTY LTD 6-12 SPECIALIST CONSULTANT STUDIES Green Valley Sand Quarry Part 6 - Traffic Assessment Report No. 765/03
Transport and Urban Planning
2.3 PROPOSED VEHICLE ACCESS
Two new intersections in the Hume Highway will be constructed to meet RTA requirements to provide safe vehicle access to and from the Project Site. These intersections will be linked by an internal road which is shown on Figure 2.
The proposed intersections are described below and shown on Figure 3.
Northern Intersection and Northern Access Road
The despatch of laden trucks from the Project Site to the south and arrival of trucks (laden and unladen) from the north is currently planned via an intersection constructed at the location at the existing “Green Valley” property entrance. It is intended that the intersection is strictly a left in/left out configuration for heavy vehicles. The northern access road from the intersection to the processing area would largely follow a section of the Old Hume Highway within the “Green Valley” property.
Southern Intersection and Southern Access Road
The despatch of laden trucks to the north and arrival of trucks (laden and unladen) from the south is currently planned via a new intersection near Paddys River. It is envisaged the southern access road to the southern intersection would generally follow the route of an existing track to Paddys River traversing both the “Green Valley” property and an area of Crown Land and then loop around under the bridges that cross over Paddys River to join the north-bound lanes of the Hume Highway.
2.4 INTERNAL ROADS
Rocla would construct and maintain two main internal roads between the product stockpiles, weighbridge and amenities areas and the northern and southern intersections, namely the northern and southern site access roads. These roads would be used principally by all road registered product trucks transporting materials to and from the quarry. A range of other tracks and roads would be constructed within the Project Site for internal access between operational areas by light vehicles, earthmoving machinery and internal haulage of raw materials.
2.5 ACCESS TO “FREESTONE” HILL AND COMMUNICATION CABLES
Rocla is negotiating with Telstra, Optus and the Department of Lands to relocate the reserve road network and access tracks currently used to gain access to “Freestone” Hill and the various communication cables that traverse the Project Site and the “Green Valley” property. Figure 4 shows the locations of the proposed replacement reserve roads.


This page has intentionally been left blank

SPECIALIST CONSULTANT STUDIES 6-17 ROCLA PTY LTD Part 6 - Traffic Assessment Green Valley Sand Quarry Report No. 765/03
Transport and Urban Planning
2.6 HOURS OF OPERATION AND PROJECT LIFE
2.6.1 Hours of Operation
The proposed operating hours would be as follows.
Table 2.1 Proposed Hours of Operation
Activity Monday to Friday Saturday Sunday
Site Establishment 7:00am to 10:00pm 7:00am to 6:00pm -
Extraction Operations 6:00am to 10:00pm 6:00am to 6:00pm -
Processing Operations 4:00am Monday to Midnight Friday
Midnight Friday to Midnight Saturday
-
Product Despatch 24 hours/day 24 hours/day 24 hours/day
Maintenance 24 hours/day 24 hours/day 24 hours/day
Maintenance activities undertaken beyond normal working hours would be confined to routine, low noise activities such as oil changes, minor welding and servicing of equipment.
2.6.2 Project Life
Based upon the planned production of approximately 30 million tonnes, with production levels from approximately 800 000tpa to 1 000 000tpa, the Green Valley Sand Quarry would operate for approximately 30 years.
2.7 TRAFFIC GENERATION AND TRANSPORT ROUTES FOR SITE ESTABLISHMENT (CONSTRUCTION) PHASE
The Site Establishment stage is expected to be approximately 9 months.
A range of vehicles will access the Project Site during this period and use the Hume Highway as the Principal Transport Route.
This will include the following vehicles:
Low loaders delivering earthmoving equipment and equipment. All low loaders would enter and depart from the northern intersection, i.e. left in/left out.
Semi-trailers/truck and dog vehicles delivering construction materials and equipment.
Concrete agitator trucks delivering concrete for equipment foundations, etc.
Occasional trucks delivering fuel for on-site earth moving equipment and temporary generators.
A range of light vehicles used by Rocla’s employees, contractors, couriers, visitors etc.

ROCLA PTY LTD 6-18 SPECIALIST CONSULTANT STUDIES Green Valley Sand Quarry Part 6 - Traffic Assessment Report No. 765/03
Transport and Urban Planning
Maximum traffic levels during the site establishment phase would be in the order of:
Low loaders – up to 3 per day (6 movements);
Semi-trailers/truck and dog trailers – up to 15 per day (30 movements);
Concrete agitators – up to 10 per day (20 movements); and
Light vehicles – up to 25 per day (50 movements).
The construction of both the northern and southern intersections would involve a range of additional traffic travelling to and from both construction sites. Rocla’s appointed contractor would establish an off-road parking area at each site for all earthmoving equipment in accordance with the Section 138 Permit issued by the RTA.
2.8 TRAFFIC GENERATION AND TRANSPORT ROUTES DURING OPERATIONAL PHASE
2.8.1 Product Transport Routes
Virtually all of Rocla’s products would be destined for either the Sydney or South Coast/Southern Highlands markets. This would require the trucks carrying the final product to travel northwards towards Sydney or southwards from the quarry entrance along the Hume Highway.
Minor quantities of sand products would be occasionally supplied to the Wingecarribee/Penrose area which would require product trucks to use local roads.
2.8.2 Hours of Operation – Product Transportation
It is proposed that products will be despatched 24 hours per day, 7 days per week.
In reality the bulk of the product trucks would travel to and from the Project Site between 4.00am and 4.00pm. On some occasions customers may require deliveries before and/or after this core period.
2.8.3 Product Truck Types and Traffic Generation
Truck Types and Average Loads
Typical product trucks will be typically rigid trucks with dog trailers or semi trailers usually of 25t to 33t capacity. B double vehicles may also be used from time to time. Smaller trucks of 12t to 18t capacity may also transport products from the quarry for local users.
For the purpose of calculating annual, daily or hourly truck movements, an average load of 30t has been assumed.
Traffic Generation
The Sand Quarry is expected to initially produce and sell some 200 000tpa of sand products building up to 800 000tpa and ultimately 1 000 000tpa.

SPECIALIST CONSULTANT STUDIES 6-19 ROCLA PTY LTD Part 6 - Traffic Assessment Green Valley Sand Quarry Report No. 765/03
Transport and Urban Planning
The daily traffic generation of product trucks at these levels are expected to be:
200,000tpa - 48 truck movements (24 loads) per day on an average day;
800,000tpa - 190 truck movements (95 loads) per day on an average day and 224 (112 loads) on a busy (85th percentile) day; and
1,000,000tpa - 240 truck movements (120 loads) per day on an average day and 284 truck movements (142 loads) on a busy (85th percentile) day.
The majority of truck movements would occur at times to avoid the Sydney peak periods and to meet the supply demands of customers in the Sydney, the South Coast and Southern Highlands. The busiest hourly period would be between 4.00am and 6.00am with up to 50 truck movements per hour on a busy day (85th percentile) when sales reach 1 000 000tpa. The number of truck movements outside the core hours may vary between 8 and 16 per hour. Deliveries during this period would be confined to those sites that are approved to receive raw materials during this period.
In order to import any aggregates and/or VENM/ENM, for blending and/or rehabilitation a small number of trucks would enter and then exit the Project Site, also laden. Whilst the frequency of these movements would depend on demand for the blended products or availability of VENM/ENM at any given time, it is unlikely that the maximum number of truck movements would be increased given the intended emphasis upon back-loading all trucks delivering the imported aggregates.
2.9 TYPE AND TRAFFIC GENERATION OF OTHER VEHICLES
In addition to the truck movements involved in product transportation, there would also be occasional trucks delivering fuel and larger items of equipment. Periodically, low loaders may be used to transport mobile equipment to and from the Project Site as the production level increases or decreases. There would also be a limited number of staff, visitor and supplier’s light vehicles. Approximately 12 vehicles or 24 movements per day would occur during the initial period when annual production is 200 000tpa. This would increase up to 40 light vehicles (80 movements) per day at the maximum production level of 1 000 000tpa.
3. E X I S T I NG T R AF F I C CO N DI T I O N S
3.1 PRINCIPAL ROAD NETWORK
The principal road that will provide access to Green Valley Sand Quarry and is the principal transport route for the quarry is the Hume Highway. The Hume Highway is a State Road and National Route under the control of the RTA.
Other minor roads that are in the vicinity of the Project Site include Murrimba Road and Inverary Road, which are located approximately 0.8km and 1.0km south of the Project Site. These are local Council roads.
ROCLA PTY LTD 6-20 SPECIALIST CONSULTANT STUDIES Green Valley Sand Quarry Part 6 - Traffic Assessment Report No. 765/03
Transport and Urban Planning
3.2 DESCRIPTION OF EXISTING ROADS
3.2.1 Hume Highway
The Hume Highway is a high standard 4 lane divided road with a dual carriageway. The Highway is the main road corridor between Sydney and Melbourne / the ACT, as well as servicing those towns/communities in south western NSW.
Adjacent the Project Site, the carriageways are separated by a wide median and storage/holding areas are provided at intersections and crossovers to queue/store turning traffic.
The speed limit on this section of the Hume Highway is 110km/h. A high level of traffic management is provided in the Hume Highway including wide shoulders, delineation and signage.
In the section adjacent the Project Site, the Hume Highway is constructed through a large radius curve with a downgrade towards Paddys River. Separate bridge structures are provided for each carriageway where the Highway crosses Paddys River.
The T junction intersections of Murrimba Road and Inverary Road are located in the Hume Highway, south of Paddys River. Inverary Road intersection has a right turn bay/deceleration lane and a standard basic (BAL) left turn treatment in the Hume Highway, although left turn vehicles can use the sealed shoulder to decelerate. Murrimba Road intersection has right and left turn bays/deceleration lanes in the Hume Highway. Give way control is provided in the minor roads at both intersections.
Sight distance at the Murrimba Road intersection is good and meets the RTA’s Austroad requirements for Safe Intersection Sight Distance for the posted speed limit in the Highway.
Sight distance at the Inverary Road intersection is generally satisfactory. However at the time of the inspection, maintenance was required to cut long grass on the southern approach of the intersection which restricted sight lines to the south for vehicles exiting Inverary Road.
Right turn movements to and from the Highway at these intersections are 2 stage movements with vehicles holding in the median area, if required, when crossing or joining the Hume Highway carriageways.
Between the northern boundary of the Project Site and Paddys River there are several property entrances including provision for crossovers (median openings) at 4 locations, including at a local access road. These are shown in Figure 4.

SPECIALIST CONSULTANT STUDIES 6-21 ROCLA PTY LTD Part 6 - Traffic Assessment Green Valley Sand Quarry Report No. 765/03
Transport and Urban Planning
These crossovers provide a sealed shoulder and a short right turn lane for right/u turn movements. The northern crossover provides the primary vehicle access to the Green Valley property (Project Site) which is located approximately 2050 metres north of Paddys River Bridge. Other crossovers are located approximately 370 and 1200 metres north of Paddys River Bridge.
The local access road intersection is located on the western side of the Hume Highway approximately 1000 metres north of Paddys River Bridge. Traffic management at this intersection includes, a short right turn lane in the south bound carriageway of the Hume Highway and Give Way control on the local access road. The available sight distance at the intersection is satisfactory.
3.2.2 Local Roads Near the Project Site
Local roads near the Project Site include Murrimba Road, Inverary Road and a local access road, north of Paddys River bridge.
Murrimba Road is a sealed 2 lane rural road that links between Paddys River and Wingello. Inverary Road is a 2 lane part sealed/unsealed rural road that links between Paddys River and Canyonleigh.
As noted above, both of these roads form T junctions, with the Hume Highway, south of Paddys River Bridge.
The local access road that provides property access to several properties adjacent the Project Site forms a T junction with the Hume Highway on its western side.
3.3 EXISTING TRAFFIC CONDITIONS ON THE ROAD NETWORK
3.3.1 Traffic Volumes
Traffic volumes using the Hume Highway at Paddys River were collected as part of this assessment. This included daily volume and vehicle classification counts on the Hume Highway north of Paddys River bridge. Traffic counts were not collected for the intersections on the Hume Highway near the site namely, Murrimba Road, Inverary Road and Bond Street, due to the low traffic volumes that use these roads and the spare intersection capacity that is available at these intersections.
3.3.2 Daily Traffic Volumes
The volume and classification counts were undertaken between 7 and 12 May 2008.
Tables 3.1 and 3.2 show the traffic volumes using the Hume Highway north of Paddys River bridge. Reference to Tables 3.1 and 3.2 shows that the Highway on a typical weekday (5 day average) carries two way traffic volumes of 16,306 vehicles, of which 33% are heavy vehicles (Austroad Classes 3-12). Friday and Sunday carry the highest traffic volumes (21,927 – 22,690vpd) resulting in a 7 day (AADT) average volume of 17,560 vehicles of which 25% are heavy vehicles.

ROCLA PTY LTD 6-22 SPECIALIST CONSULTANT STUDIES Green Valley Sand Quarry Part 6 - Traffic Assessment Report No. 765/03
Transport and Urban Planning
While traffic flows in each direction of the Highway are consistent throughout the day, traffic conditions are good with spare capacity.
Table 3.1 Hume Highway at Paddys River Daily Traffic Volumes
Direction of Travel
Mon Tue Wed Thur Fri Sat Sun 5 Day
Average (Weekday)
7 Day Average (AADT)
Northbound 6,913 6,893 7,271 7,937 12,011 9,526 11,325 8,205 8,839 Southbound 8,535 7,068 7,151 7,836 9,916 9,180 11,365 8,101 8,721
Total 15,448 13,961 14,392 15,773 21,927 18,706 22,690 16,306 17,560 Source: Traffic Counts 7-12 May 2008
Table 3.2 Hume Highway at Paddys River Daily Traffic Volumes
Direction of Travel 5 Day Average (Weekday) 7 Day Average (AADT)
Light1 Heavy2 Total Light1 Heavy2 TotalNorthbound 5,659 2,546 8,205 6,662 2,177 8,839 Southbound 5,319 2,782 8,101 6,430 2,291 8,721
Total 10,978 5,328 16,306 13,092 4,468 17,560 % 67% 33% 100% 75% 25% 100%
1Light Vehicles – Austroads 1 and 2 vehicle classification 2Heavy Vehicles – Austroads 3-12 vehicle classification Source: Traffic Counts 7-12 May 2008
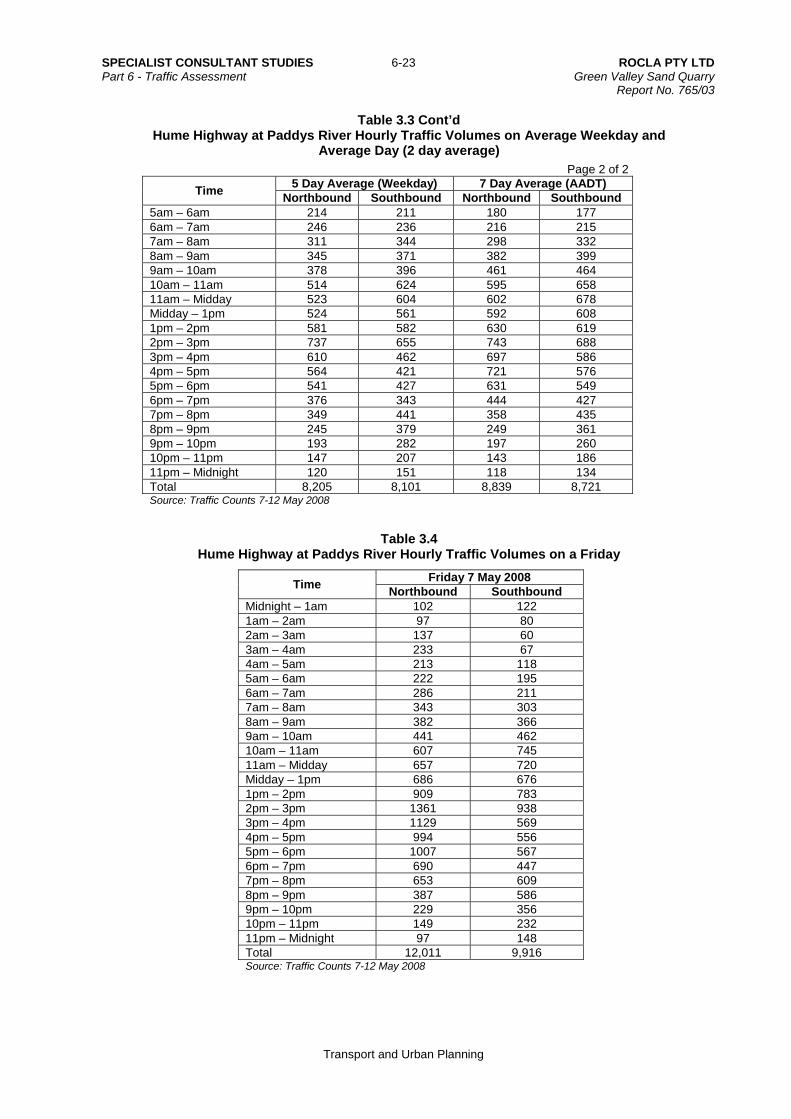
3.3.3 Hourly Traffic Volumes and Traffic Conditions
Tables 3.3 and 3.4 show the hourly volumes for both directions of travel in the Hume Highway on an average weekday (5 day average), an average day (7 day average) and on a Friday, which is the busiest weekday.
Reference to Tables 3.3 and 3.4 show that the busiest hours for traffic are typically between 10.00am and 5.00pm. Highest hourly volumes during these times are typically between 500-750vph except on Friday. Maximum hourly Friday volumes are in the order of 938vph southbound and 1361vph northbound. The Hume Highway provides 2 lanes for each direction of travel with a theoretical capacity of 3,600 passenger car units per hour in each direction.
A comparison of the highest hourly directional traffic volumes, even after allowing for the number of heavy vehicles, to the theoretical capacity of the northbound and southbound carriageways, indicates that the Hume Highway at Paddys River has considerable spare road capacity and that traffic conditions in this section of the Hume Highway are good.
Table 3.3 Hume Highway at Paddys River Hourly Traffic Volumes on Average Weekday and
Average Day (2 day average) Page 1 of 2
Time 5 Day Average (Weekday) 7 Day Average (AADT)
Northbound Southbound Northbound Southbound
Midnight – 1am 97 96 88 95 1am – 2am 93 67 79 65 2am – 3am 123 62 103 55 3am – 4am 180 67 150 59 4am – 5am 194 112 162 95
SPECIALIST CONSULTANT STUDIES 6-23 ROCLA PTY LTD Part 6 - Traffic Assessment Green Valley Sand Quarry Report No. 765/03
Transport and Urban Planning
Table 3.3 Cont’d Hume Highway at Paddys River Hourly Traffic Volumes on Average Weekday and
Average Day (2 day average) Page 2 of 2
Time 5 Day Average (Weekday) 7 Day Average (AADT)
Northbound Southbound Northbound Southbound
5am – 6am 214 211 180 177 6am – 7am 246 236 216 215 7am – 8am 311 344 298 332 8am – 9am 345 371 382 399 9am – 10am 378 396 461 464 10am – 11am 514 624 595 658 11am – Midday 523 604 602 678 Midday – 1pm 524 561 592 608 1pm – 2pm 581 582 630 619 2pm – 3pm 737 655 743 688 3pm – 4pm 610 462 697 586 4pm – 5pm 564 421 721 576 5pm – 6pm 541 427 631 549 6pm – 7pm 376 343 444 427 7pm – 8pm 349 441 358 435 8pm – 9pm 245 379 249 361 9pm – 10pm 193 282 197 260 10pm – 11pm 147 207 143 186 11pm – Midnight 120 151 118 134 Total 8,205 8,101 8,839 8,721 Source: Traffic Counts 7-12 May 2008
Table 3.4 Hume Highway at Paddys River Hourly Traffic Volumes on a Friday
Time Friday 7 May 2008
Northbound Southbound
Midnight – 1am 102 122 1am – 2am 97 80 2am – 3am 137 60 3am – 4am 233 67 4am – 5am 213 118 5am – 6am 222 195 6am – 7am 286 211 7am – 8am 343 303 8am – 9am 382 366 9am – 10am 441 462 10am – 11am 607 745 11am – Midday 657 720 Midday – 1pm 686 676 1pm – 2pm 909 783 2pm – 3pm 1361 938 3pm – 4pm 1129 569 4pm – 5pm 994 556 5pm – 6pm 1007 567 6pm – 7pm 690 447 7pm – 8pm 653 609 8pm – 9pm 387 586 9pm – 10pm 229 356 10pm – 11pm 149 232 11pm – Midnight 97 148 Total 12,011 9,916 Source: Traffic Counts 7-12 May 2008

ROCLA PTY LTD 6-24 SPECIALIST CONSULTANT STUDIES Green Valley Sand Quarry Part 6 - Traffic Assessment Report No. 765/03
Transport and Urban Planning
3.3.4 Future Traffic Growth
Reference to RTA’s publications, Traffic Volume Data for Southern Region 1994, 2000 and 2007 indicates that daily traffic volumes (AADT) in the Hume Highway south of Illawarra Highway at Penrose have increased from 11,610 vehicles to 20,235 vehicles between 1982 and 2006. (Count Station V07.352). This represents an increase of 74% over the 24 year period, or an average of 3.1% per year for the period.
Traffic growth on the Hume Highway in the next 10 years would be expected to be of the same order and is likely to be a lineal average of 3.1% per year, when averaged over the full 10 year period.
3.4 ROAD SAFETY
Three (3) year accident statistics from April 2006 to March 2009 for the Hume Highway near the Project Site were obtained from the RTA.
A review of this data indicates that there was a total of thirteen (13) accidents, two (2) of which were injury accidents on the Hume Highway between Murrimba Road and 3km north of Paddys River Bridge. Two (2) of the accidents occurred at the Hume Highway / Murrimba Road intersection. The remaining eleven (11) accidents were single vehicle accidents involving cars out of control and or running off the road. Nine (9) of the accidents occurred in rain and one (1) in fog/mist.
All of the accidents involved cars, vans, utes and four wheel drives (ie. light vehicles) and no accidents involved heavy vehicles. A review of the accident statistics in the Hume Highway north and south of the area examined, for the same period indicates that the accident levels for these areas are similar to the area examined near the Project Site. This indicates that the accidents levels in the Hume Highway adjacent the Project Site are consistent with other sections of the Hume Highway in the area, with no identified patterns that could be addressed through remedial engineering treatments.
The land owner of the “Green Valley” property advises there have been no accidents involving light vehicles entering or leaving the property since the dual lane Hume Highway was constructed.
3.5 BUS ROUTES
Berrima Bus Lines operates one (1) school bus service in the morning and afternoon along the Hume Highway between Illawarra Highway / Sallys Corner Road at Sutton Forest and Murrimba Road, Paddys River. The school bus travels along the Hume Highway with a detour via Hanging Rock Road to Murrimba Road, where it turns around, after meeting and transferring children to another school bus service. No children are set down/picked up in the Hume Highway in the vicinity of the Project Site.
PBS Goulburn also operates one (1) school bus service in the morning and afternoon along the Hume Highway between Marulan and Murrimba Road Paddys River. The school bus services meet each other in Murrimba Road near the Hume Highway intersection and transfer children at approximately 7.35am and 4.35pm on school days. Any set down/pick up of children in the Hume Highway are made in the sealed road shoulder area of the road, normally at a property entrance or near an intersection.

SPECIALIST CONSULTANT STUDIES 6-25 ROCLA PTY LTD Part 6 - Traffic Assessment Green Valley Sand Quarry Report No. 765/03
Transport and Urban Planning
4. AS S E S SM E N T O F T R AF F I C I M PAC T S OF P R OP OS AL
4.1 PROPOSED TRAFFIC MANAGEMENT IN HUME HIGHWAY AT THE PROJECT SITE
As noted in Section 2.3 two new intersections will be constructed within the Hume Highway to provide safe vehicle access to the northbound and southbound carriageways of the Hume Highway as follows:
Northern Intersection and Northern Access Road. This intersection will be left in / left out only and will provide access for vehicles arriving from the north and departing to the south in the Hume Highway (i.e. using the southbound carriageway). A left turn deceleration lane for inbound vehicles 225 metres long will be provided on the approach to the intersection and an acceleration lane 228 metres long will be provided for left turn vehicles departing the Project Site on the departure of the intersection. The length of the deceleration and acceleration lanes as well as the intersection will be designed and constructed to RTA standards. This intersection is located at the existing northern vehicle access to Green Valley which is approximately 2050 metres north of Paddys River Bridge. The sight distance at the intersection is good.
Southern Intersection and Southern Access Road. This intersection will be left in / left out and will provide access for vehicles arriving from the south and departing to the north in the Hume Highway (i.e. using the northbound carriageway). A left turn deceleration lane 185 metres for inbound vehicles will be provided on the approach to the intersection and an acceleration lane for departing left turn vehicles 732 metres long will also be provided. The intersection including the length of the deceleration and acceleration lanes, will be designed and constructed to RTA standards. The southern intersection is located some 300 metres north of Paddys River Bridge (left turn to exit the Hume Highway). Sight distance at the intersection is good.
The two intersections and access roads will be linked by an internal loop road that passes under Paddys River Bridge. GHD have prepared a concept design and detailed report for the loop road under Paddys River Bridge and the proposed two intersections with the Hume Highway.
As part of the proposed changes, one of the existing median crossovers (openings) in the Hume Highway adjacent the proposed southern intersections will be closed, with local property access incorporated into the proposed changes. Details of these changes are shown in the GHD concept plans and detailed in Part 5 of the Specialist Consultant Studies Compendium. Figures 5A –5E reproduce the GHD concept plans at A4 size.
4.2 ASSESSMENT OF TRAFFIC IMPACTS ASSOCIATED WITH OPERATIONAL PHASE
The Sand Quarry is expected to initially provide and sell some 200 000tpa of sand products building up to 800 000tpa to 1 000 000tpa.

ROCLA PTY LTD 6-26 SPECIALIST CONSULTANT STUDIES Green Valley Sand Quarry Part 6 - Traffic Assessment Report No. 765/03
Transport and Urban Planning
Daily traffic generation at 200 000tpa is estimated to be:
48 product truck movements (24 loads) per day on an average day;
24 light vehicle movements (12 light vehicles) per day associated with staff, visitors and suppliers; and
2 truck movements (1 truck) every 4-5 days associated with fuel, deliveries, equipment deliveries and maintenance.
Daily traffic generation at 1 000 000tpa is estimated to be:
– 240 product truck movements (120 loads) per day on an average day and 284 product truck movements (142 loads) on a busy (85th percentile) day;
– 80 light vehicle movements (40 light vehicles) per day associated with staff, visitors and supplies; and
– 2-4 truck movements (1-2 trucks) every 1-2 days associated with fuel and equipment deliveries and maintenance.
For the purpose of assessing the traffic impacts, the maximum sales and transportation at 1 000 000tpa has been adopted.
While the proposal is for transportation for 24 hours, 7 days a week, the majority of sales and transportation will occur between 4:00am and 4:00pm Monday to Saturday.
Average hourly product truck movements at 1 000 000tpa will be 20 product truck movements (10 in / 10 out). The 4:00am – 6:00am period is expected to be the busiest period as the majority of product truck movements would be scheduled to occur at times to avoid the Sydney peak periods. On a busy (85th percentile) day up to 50 product movements per hour would arrive and depart the Sand Quarry (25 in / 25 out).
It is expected that the assignment for vehicles arriving and departing the project site will be fairly evenly split between north and south (i.e. 50:50 split) for both light and heavy vehicle movements. While there will be periods when a higher number / proportion of product trucks will travel to and from Sydney, over the longer term Rocla expects that product truck trips between the north and south will even out.
Based on this, for the purpose of assessing the traffic impacts a 50:50 split to the north and south has been adopted for all vehicles arriving and departing the Project Site.
This will result in an additional:
162 vehicle trips including 122 heavy vehicles using the Hume Highway north and south of the Project Site on an average day (i.e. 162 vehicles north and 162 vehicles south of the Project Site);
184 vehicle trips including 144 heavy vehicles using the Hume Highway north and south of the Project Site on a busy (85th percentile) day (i.e. 184 vehicles north and 184 vehicles south of the Project Site); and
26 heavy vehicles per hour using the Hume Highway north of the Project Site and 24 heavy vehicles per hour using the Hume Highway south of the Project Site during a busy (85th percentile) hour.
Figure 6 shows the additional traffic using the Hume Highway adjacent the Project Site generated by the Green Valley Sand Quarry for an average and busy (85th percentile) day as well as for a busy (85th percentile) hour.

SPECIALIST CONSULTANT STUDIES 6-27 ROCLA PTY LTD Part 6 - Traffic Assessment Green Valley Sand Quarry Report No. 765/03
Transport and Urban Planning
Figure 5A Concept Design for Proposed Intersections and Underpass in Hume Highway

ROCLA PTY LTD 6-28 SPECIALIST CONSULTANT STUDIES Green Valley Sand Quarry Part 6 - Traffic Assessment Report No. 765/03
Transport and Urban Planning
Figure 5B Concept Design for Proposed Intersections and Underpass in Hume Highway

SPECIALIST CONSULTANT STUDIES 6-29 ROCLA PTY LTD Part 6 - Traffic Assessment Green Valley Sand Quarry Report No. 765/03
Transport and Urban Planning
Figure 5C Concept Design for Proposed Southern Intersection and Hume Highway

ROCLA PTY LTD 6-30 SPECIALIST CONSULTANT STUDIES Green Valley Sand Quarry Part 6 - Traffic Assessment Report No. 765/03
Transport and Urban Planning
Figure 5D Concept Design for Proposed Northern Intersections

SPECIALIST CONSULTANT STUDIES 6-31 ROCLA PTY LTD Part 6 - Traffic Assessment Green Valley Sand Quarry Report No. 765/03
Transport and Urban Planning
Figure 6 Additional Daily and Hourly Traffic Volumes from Project at Maximum Sales (1 000 000 tpa)
6

ROCLA PTY LTD 6-32 SPECIALIST CONSULTANT STUDIES Green Valley Sand Quarry Part 6 - Traffic Assessment Report No. 765/03
Transport and Urban Planning
As noted above, the Green Valley Sand Quarry will generate a total of 162 vpd in each direction on an average day of production / sales, of which 122 vehicle trips in each direction will be heavy vehicles.
In terms of traffic impacts on the Hume Highway, the additional traffic will have minimal impacts.
The Hume Highway at Paddys River carries some 16,306 vpd on an average weekday (5 day average), of which 5,328 are heavy vehicles. The sand quarry traffic (total of 162 vehicles with 122 heavy vehicles per day in each direction) will represent an increase of 1.0% in total vehicles using the Hume Highway north and south of the Project Site. The increase in heavy vehicles due to the proposal is 2.3% in each direction on an average weekday.
The increase in total traffic and heavy vehicles using the Hume Highway due to the proposal are small in real terms and the Highway has sufficient available capacity to absorb the traffic increases.
Table 4.1 shows the hourly volumes on each carriageway of the Hume Highway as recorded on Friday 9 May 2008. Friday is the heaviest weekday in terms of traffic volumes using the Hume Highway. Friday’s traffic volume on this particular day (9/5/2008) was a total of 21,927 vehicles, which was 35% higher than the average weekday volume (5 day average) and 25% higher than the 7 day average (AADT).
The Hume Highway has a theoretical capacity in each direction of travel (i.e. each carriageway) of 3,600 equivalent passenger car units (pcu’s) per hour.
As can be seen from Table 4.1, the Highway’s traffic volumes in each direction of travel are considerably less than 3,600 passenger car units per hour. For the period between 4am and 4pm northbound volumes number between 213 – 1361vph and southbound volumes number between 118vph – 938vph. Even after allowing for the number of heavy vehicles in the traffic stream, each carriageway has considerable spare capacity and can easily accommodate the 12 - 13 truck movements per hour (during a busy hour) using each carriageway associated with the Quarry, north and south of the Project Site.
As noted previously, the two intersections will be designed in accordance with RTA Standards with appropriate deceleration and acceleration lanes for vehicles to exit and enter the Hume Highway and movements at both intersections will be limited to left in / left out movements only.
During the 12 hour period of 4.00am – 4.00pm when most product truck movements associated with the Sand Quarry will occur, heavy vehicles using the Hume Highway number between 105-145 (trucks) per hour in the northbound direction and 78-203 (trucks) per hour in the southbound direction.
During a busy (85th percentile) hour 12-13 product trucks will enter and exit the Project Site at the northern and southern intersections via left turn movements using the deceleration and acceleration lanes in the northbound and southbound carriageway.
The proposed traffic management at the Project Site’s northern and southern intersections will provide appropriate safe intersection facilities to allow these vehicles to safely exit and enter the Hume Highway, with minimal disruption and impact on other vehicles using the Hume Highway.

SPECIALIST CONSULTANT STUDIES 6-33 ROCLA PTY LTD Part 6 - Traffic Assessment Green Valley Sand Quarry Report No. 765/03
Transport and Urban Planning
In concluding, the Hume Highway at Paddys River has sufficient spare capacity to easily and safely accommodate the future traffic associated with the Green Valley Sand Quarry, as well as the incremental traffic growth associated with other future growth that will occur along the Hume Highway corridor.
Table 4.1 Hume Highway at Paddys River Hourly Traffic Volumes on Friday 9 May 2008
Time Friday 9 May 2008
Northbound Southbound
Midnight – 1am 102 (75 ) 122 (75) 1am – 2am 97 (70) 80 (48) 2am – 3am 137 (107) 60 (36) 3am – 4am 233 (172) 67 (40) 4am – 5am 213 (151) 118 (78) 5am – 6am 222 (105) 195 (84) 6am – 7am 286 (144) 211 (99) 7am – 8am 343 (135) 303 (96) 8am – 9am 382 (133) 366 (112) 9am – 10am 441 (145) 462 (102) 10am – 11am 607 (141) 745 (106) 11am – Midday 657 (132) 720 (160) Midday – 1pm 686 (122) 676 (146) 1pm – 2pm 909 (125) 783 (166) 2pm – 3pm 1361 (144) 938 (203) 3pm – 4pm 1129 (121) 569 (156) 4pm – 5pm 994 (88) 556 (143) 5pm – 6pm 1007 (122) 567 (148) 6pm – 7pm 690 (76) 447 (120) 7pm – 8pm 653 (69) 609 (115) 8pm – 9pm 387 (69) 586 (123) 9pm – 10pm 229 (43) 356 (134) 10pm – 11pm 149 (51) 232 (107) 11pm – Midnight 97 (41) 148 (70) Total 12,011 (2581) 9,916 (2667) Source: Traffic Counts 7-12 May 2008 Where 102 – total vehicles (75) – heavy vehicles
4.3 ROAD SAFETY
The Project would increase the number of heavy vehicles in the vicinity of the Paddys River, accessing the Project Site, as well as using the Hume Highway.
The Hume Highway is engineered to current RTA standards and is designed to carry heavy vehicles.
The separated carriageways and good horizontal and vertical alignment of the highway provide a high standard road in terms of design and overall safety and as noted previously, the Hume Highway can easily accommodate the additional heavy vehicles associated with the Project in terms of capacity.
The proposed northern and southern intersections that will provide access to the Project Site will include appropriate traffic management measures by way of deceleration and acceleration lanes and left in / left out turn provisions that ensure road safety is maintained for all vehicles using the Hume Highway when vehicles are accessing the Project Site. These intersections will be designed and constructed to current RTA standards.

ROCLA PTY LTD 6-34 SPECIALIST CONSULTANT STUDIES Green Valley Sand Quarry Part 6 - Traffic Assessment Report No. 765/03
Transport and Urban Planning
The removal of one median crossover (openings) and the restricted use of one median crossover in the Hume Highway adjacent the Project Site will also improve potential road safety at this location by reducing vehicle conflicts associated with right turn movements crossing / joining one of the carriageways.
In addition, Rocla have a Code of Conduct for all its employees including truck drivers. Rocla requires each driver to sign the Code which, among other things, stipulates safe driving practices at all times, when making deliveries for Rocla.
Based on the above, it is considered that there should be no detrimental impact on road safety from the Project.
4.4 SCHOOL BUS ROUTES
The additional trucks using the Hume Highway associated with the Project which is estimated as a maximum of 12 – 13 trucks per hour using each carriageway of the Hume Highway, north and south of the Project Site should not have any detrimental impact on the one (1) school bus route that uses the Hume Highway, north and south of Murrimba Road in the morning and afternoon.
The dual lane carriageways of the Hume Highway also incorporate wide sealed shoulders adjacent the kerbside lane, which provides adequate room for any set down / pick up movements. In addition the adjacent two (2) travelling lanes provides the opportunity for other vehicles using the kerbside lane to change lanes, when buses are required to use the road shoulder for set down / pick up movements.
4.5 ASSESSMENT OF TRAFFIC IMPACTS ASSOCIATED WITH SITE ESTABLISHMENT (CONSTRUCTION) PHASE
The traffic generation during the site establishment would potentially be in the order of 106 movements per day, (ie. 53 vehicles in / 53 vehicles out) plus any additional vehicles associated with the construction of the northern and southern intersections. Other than the road construction personnel, all other vehicles entering and exiting the site during site establishment would use the northern intersection and access road from the Hume Highway. Some 50% of vehicles generated by the Project Site per day during the site establishment phase would be expected to be heavy vehicles.
Rocla’s appointed contractor undertaking the road construction including the intersections with the Hume Highway would establish an off road parking area at each site for all earth moving equipment in accordance with a Section 138 permit issued by the RTA.
Following approval of the Project, Rocla would prepare a detailed Traffic Management Plan to manage the traffic impacts during the site establishment phase, including the construction of the two (2) intersections in the Hume Highway. The Traffic Management Plan will include the construction routes, parking areas and any staging of road construction, as well as detailed traffic control plans to manage traffic access and provide safe traffic management during the site establishment period.

SPECIALIST CONSULTANT STUDIES 6-35 ROCLA PTY LTD Part 6 - Traffic Assessment Green Valley Sand Quarry Report No. 765/03
Transport and Urban Planning
5. C O N C L U S I O NS
This report documents the assessment of traffic impacts of a proposal to operate a sand quarry on the Green Valley property, which is located at Paddys River.
As part of the Project, the Proponent, Rocla will construct two (2) new intersections in the Hume Highway together with a loop road underpass of the Hume Highway at Paddys River. The intersections will accommodate left in / left out movements only and deceleration and acceleration lanes at each intersection will be constructed to RTA standards to facilitate safe exit and entry movements between the Project Site and the Hume Highway.
At full production of 1 000 000 tonnes per annum, the project would generate 240 truck movements on an average day and up to 284 truck movements on a busy (85th percentile) day. In addition, there would be an additional 80 light vehicle movements plus 2-4 truck movements associated with staff, visitors and fuel and maintenance. These traffic movements will be evenly split between arrivals and departures from / to the north and south along the Hume Highway. During a busy (85th percentile) hour, 12-13 trucks would arrive and 12-13 trucks depart the Project Site via both the northern and southern intersections.
The assessment has found that the Hume Highway which has two (2) lane separated carriageways with sealed road shoulders and a high level of traffic management has sufficient road capacity to easily absorb the additional traffic generated by the Project. The proposed traffic management at the Project Site’s northern and southern intersections will provide safe intersection facilities to enable these vehicles to safely exit and enter the Hume Highway, with minimal disruption and impact on other vehicles using the Hume Highway.
During the site establishment (construction) phase, the traffic generation is expected to be up to 106 traffic movements per day, plus any additional vehicles associated with the construction of the northern and southern intersections. A detailed Traffic Management Plan will be prepared following approval of the Project, to safely manage the traffic impacts during the site establishment period, including the construction of the proposed northern and southern intersections.

ROCLA PTY LTD 6-36 SPECIALIST CONSULTANT STUDIES Green Valley Sand Quarry Part 6 - Traffic Assessment Report No. 765/03
Transport and Urban Planning
References
1. Guide to Traffic Engineering – Parts 1 – 15 - Austroads
2. Guide to Traffic Generating Developments October 2002 – Roads and Traffic Authority of New South Wales
3. Road Design Guide – Roads and Traffic Authority of New South Wales
4. Traffic Volume Data for Southern Region 1994, 2000, 2006 – Roads and Traffic Authority of New South Wales
5. GHD Pty Ltd – Road Design Assessment – for the Green Valley Sand Quarry Part 5 of the Specialist Consultant Studies Compendium.