Green Mountain Coffee Roasters, Inc. April 30, 2013 Hada Jang Shicheng Tang Yijin (Iris) Zhang.
21
Green Mountain Coffee Green Mountain Coffee Roasters, Inc. Roasters, Inc. April 30, 2013 Hada Jang Shicheng Tang Yijin (Iris) Zhang
-
Upload
chester-wilkerson -
Category
Documents
-
view
219 -
download
0
Transcript of Green Mountain Coffee Roasters, Inc. April 30, 2013 Hada Jang Shicheng Tang Yijin (Iris) Zhang.

Green Mountain Coffee Roasters, Green Mountain Coffee Roasters, Inc.Inc.
April 30, 2013
Hada Jang Shicheng Tang Yijin (Iris) Zhang

Agenda
Introduction
Company Overview
Industry Overview
Stock Performance
Financial Analysis
Valuation
Recommendation
2

Company Profile
Headquartered in Waterbury, Vermont
One of the leading companies in the specialty coffee and coffee maker businesses.
Employed about 5,800 people as of Sep 29, 2012
Top four best-selling coffeemakers by dollar volume in the United States
3Source: GMRC Inc. 2012 Annual Report

Company History
4
1981: Green Mountain Coffee Roaster was established as a small café in Vermont
1993: GMCR started publicly trading on the NASDAQ national market
2006: GMCR acquired KEURIG, Incorporated, a manufacturer of single-cup brewing systems.
2010: Green Mountain Coffee acquired Diedrich Coffee for $305.3 million and bought coffee services company Van Houtte for $907.8M
1981 1993 2006 2010
2011: GMCR sold the "Filterfresh" US coffee service portion of Van Houtte's business to Aramark
2011
Source: GMRC Inc. 2012 Annual Report

Product Segments
The Company manages its operations through three operating segments, the Specialty Coffee business unit (“SCBU”), the KEURIG business unit (“KBU”) and the Canadian business unit (“CBU”).
SCBU sources, produces and sells coffee, hot cocoa, teas and other beverages, in a variety of packaging formats, to consumers in the United States.
KBU targets its premium patented single cup brewing systems for use both at-home (“AH”) and away-from-home (“AFH”), in the United States.
CBU sources, produces and sells coffees and teas and other beverages to Canadian consumers.
5Source: GMRC Inc. 2012 Annual Report

Sales Breakdown
6
Net sales for fiscal 2012 increased 46% to $3,859.2 million, up from $2,650.9 million reported in fiscal 2011. The primary drivers of the increase in the Company’s net sales were a 59%, or $1,004.9 million, increase in single serve pack net sales, and a 45%, or $235.1 million, increase in KEURIG Single Cup Brewer and accessories sales.
Source: GMRC Inc. 2012 Annual Report

Historical Financials
7
Source: Bloomberg Source: Bloomberg
Source: Bloomberg Source: Bloomberg

Competitive Strength – SWOT Analysis
8
Strengths Weaknesses• Leading market position built on strong
product portfolio• KEURIG unit contributes to strong revenue
growth• Corporate image built on sustainability
initiatives• Customer loyalty
• Reliance on a single manufacturer in China for single cup brewers
• Dependence on certain retailer for a substantial portion of revenues
Opportunities Threats
• Strategic agreements to bolster revenues• Entry into functional drinks market in the
US
• Competition in specialty coffee is intense • Increased demand for high-quality Arabica
coffee beans coupled with possible supply shortages
Source: Marketline

Porter’s Five Forces
9

Macroeconomic Indicators
10

Stock Performance
11
Equity SnapshotEquity Snapshot
• Price: $ 56.47 (April 29, 2013)• Beta: 0.31 (0.94 on 5yr avg.)• Trailing P/E: 24.39• Forward P/E: 17.54• PEG Ratio (5 yr. expected):
1.04 • P/B Ratio: 3.63• No divined
Source: Finance.yahoo.com
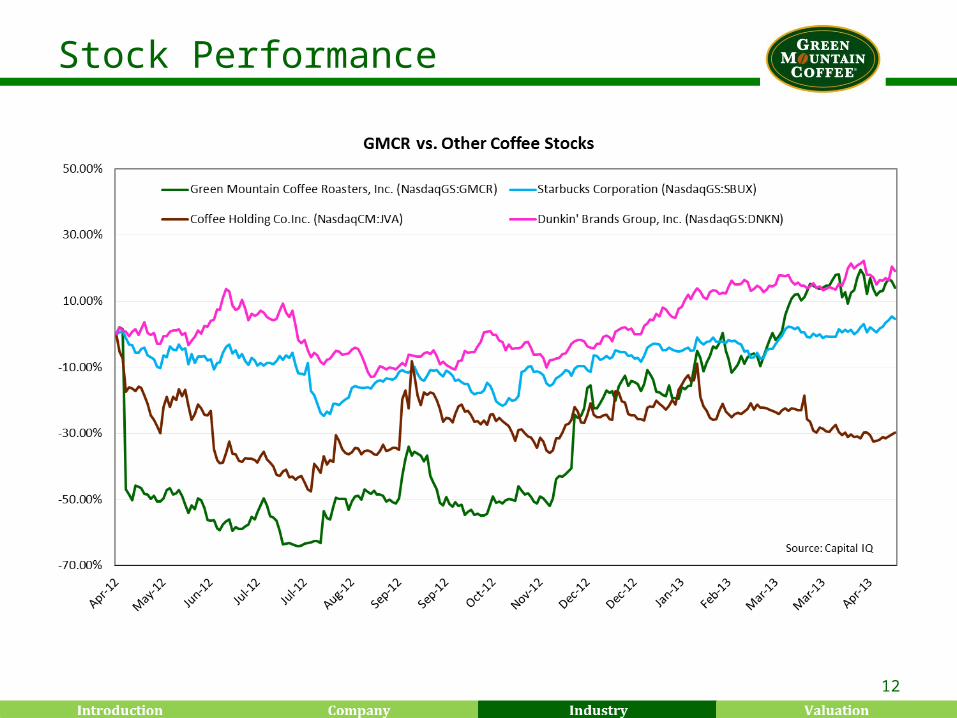
Stock Performance
12

Key Financial Ratios
13
SBUX DNKN JVAFor the Fiscal Period Ending 2008 2009 2010 2011 2012 2012 2012 2012Profitability Return on Assets % 9.0% 8.2% 9.0% 10.4% 10.4% 14.5% 4.9% 7.1% Return on Equity % 18.2% 15.0% 12.4% 15.3% 17.3% 21.2% 7.1% 11.4% Gross Margin % 35.3% 31.2% 31.4% 34.1% 32.9% 56.3% 78.8% 6.9% EBIT Margin % 9.1% 9.7% 11.6% 14.3% 14.7% 13.5% 38.4% 2.5% Net Income Margin % 4.4% 6.9% 5.9% 7.5% 9.4% 10.4% 16.5% 1.4%
Activity Fixed Asset Turnover 6.0x 6.7x 6.9x 6.3x 5.1x 5.3x 3.6x 88.6x Inventory Turnover 5.1x 5.0x 4.7x 3.7x 3.6x 5.3x NA 12.3x
Liquidity Current Ratio 2.1x 4.2x 2.1x 2.4x 2.5x 1.9x 1.2x 3.7x Quick Ratio 0.8x 3.0x 0.8x 0.7x 0.9x 1.1x 0.8x 2.3x Avg. Cash Convers ion Cycle 65.1 68.8 75.0 96.4 97.9 53.0 NA 35.5
Solvency Tota l Debt/Equity 89.0% 13.8% 51.1% 30.7% 23.8% 10.7% 531.6% 3.9%
GMCR
Source: Capital IQ
2008 2009 2010 2011 2012Net Income Margin % 4.4% 6.9% 5.9% 7.5% 9.4%
Total Asset Turnover 1.6x 1.3x 1.2x 1.2x 1.1x
Financial Leverage 2.61 1.61 1.70 1.75 1.62Return on Equity % 18.2% 15.0% 12.4% 15.3% 17.3%
DuPont Analysis

Valuation – Trading Comparables
14
Company Comp Set4/23/2013
Enterprise Value / Price NTM Enterprise Value
Company Name EBITDA EBIT EPSForward Total
Revenue Forward EBITDA NTM Forward P/E
Green Mountain Coffee Roasters, Inc. (NasdaqGS:GMCR) 10.6x 14.1x 23.8x 1.84x 9.0x 18.85x
Flowers Foods, Inc. (NYSE:FLO) 15.6x 22.5x 33.0x 1.41x 12.0x 23.95xGeneral Mills, Inc. (NYSE:GIS) 11.5x 13.7x 18.5x 2.26x 11.4x 17.91xHillshire Brands Company (NYSE:HSH) 8.9x 12.4x 60.5x 1.22x 10.0x 21.62xMcCormick & Company, Incorporated (NYSE:MKC) 15.1x 17.7x 23.4x 2.50x 14.3x 22.05xThe Hain Celestial Group, Inc. (NasdaqGS:HAIN) 18.0x 21.5x 26.6x 1.90x 13.9x 23.94xThe Hershey Company (NYSE:HSY) 15.3x 17.7x 31.3x 3.02x 13.7x 24.72xThe J. M. Smucker Company (NYSE:SJM) 10.5x 13.1x 21.9x 2.13x 10.1x 18.51xThe WhiteWave Foods Company (NYSE:WWAV) 14.6x 20.7x 23.5x 1.48x 13.2x 24.31xTreehouse Foods, Inc. (NYSE:THS) 10.7x 16.1x 27.1x 1.38x 9.8x 20.92x
High 18.0x 22.5x 60.5x 3.0x 14.3x 24.7xLow 8.9x 12.4x 18.5x 1.2x 9.8x 17.9xMean 13.4x 17.3x 29.5x 1.9x 12.0x 22.0xMedian 14.6x 17.7x 26.6x 1.9x 12.0x 22.1x
LTM EBITDA LTM EBIT LTM EPS NTM Revenue
/Share NTM EBITDA NTM EPS Green Mountain Coffee Roasters, Inc. (NasdaqGS:GMCR) 750,543 568,896 2.44 31.0 772,821 2.72
Implied Price_Mean $67.36 $66.01 $71.97 $59.61 $62.55 $59.83Implied Price_Median $73.64 $67.67 $64.82 $58.92 $62.32 $59.98
4/23/2013 Close Price
Shares Outstanding
Market Capitalizatio
Green Mountain Coffee Roasters, Inc. (NasdaqGS:GMCR) 56.55 148,809 8,888,799
Peers in Processed & Packaged Goods Industry
Equally Weighted Average Price
$64.56
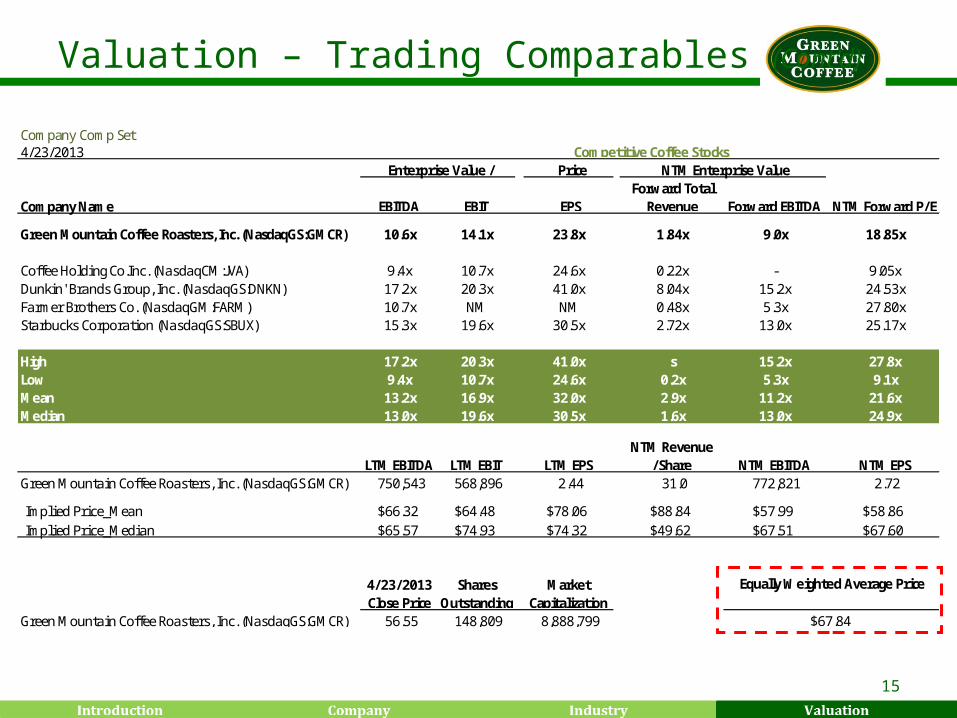
Valuation – Trading Comparables (Cont’d)
15
Company Comp Set4/23/2013
Enterprise Value / Price NTM Enterprise Value
Company Name EBITDA EBIT EPSForward Total
Revenue Forward EBITDA NTM Forward P/E
Green Mountain Coffee Roasters, Inc. (NasdaqGS:GMCR) 10.6x 14.1x 23.8x 1.84x 9.0x 18.85x
Coffee Holding Co.Inc. (NasdaqCM:JVA) 9.4x 10.7x 24.6x 0.22x - 9.05xDunkin' Brands Group, Inc. (NasdaqGS:DNKN) 17.2x 20.3x 41.0x 8.04x 15.2x 24.53xFarmer Brothers Co. (NasdaqGM:FARM) 10.7x NM NM 0.48x 5.3x 27.80xStarbucks Corporation (NasdaqGS:SBUX) 15.3x 19.6x 30.5x 2.72x 13.0x 25.17x
High 17.2x 20.3x 41.0x s 15.2x 27.8xLow 9.4x 10.7x 24.6x 0.2x 5.3x 9.1xMean 13.2x 16.9x 32.0x 2.9x 11.2x 21.6xMedian 13.0x 19.6x 30.5x 1.6x 13.0x 24.9x
LTM EBITDA LTM EBIT LTM EPS NTM Revenue
/Share NTM EBITDA NTM EPS Green Mountain Coffee Roasters, Inc. (NasdaqGS:GMCR) 750,543 568,896 2.44 31.0 772,821 2.72
Implied Price_Mean $66.32 $64.48 $78.06 $88.84 $57.99 $58.86Implied Price_Median $65.57 $74.93 $74.32 $49.62 $67.51 $67.60
4/23/2013 Close Price
Shares Outstanding
Market Capitalization
Green Mountain Coffee Roasters, Inc. (NasdaqGS:GMCR) 56.55 148,809 8,888,799
Competitive Coffee Stocks
Equally Weighted Average Price
$67.84

Valuation – WACC Analysis
16
Capital StructureTotal Market Value of Equity 8,415,124Total Debt 473,675Total Capitalization 8,888,799 Debt-to-Total Capitalization 5.33%Equity-to-Total Capitalization 94.67%
Beta 0.31Risk-Free Rate 1.67%Market Risk Premium 7.00%Cost of Equity (CAPM) 3.84%Cost of Equity 11.92%Weighted Cost of Equity 7.88%
Cost of Debt 5.50%Tax Rate 37%After-tax Cost of Debt 3.47%
WACC (only CAPM) 3.82%WACC 7.65%
WACC CalculationYear GMCR2008 -22.28%2009 129.56%2010 -50.43%2011 97.09%2012 -53.88%
5-Year Total Return 75.62%
Annual Compounded Return 11.92%
Realized Annual Return

Valuation – Revenue Projection
17
FY 2009: acquired the wholesale business and certain assets of Tully’s Coffee Corporation
FY 2010: acquired Timothy’s Coffee of the World Inc. (Nov 13, 2009); Diedrich Coffee, Inc. (May 11, 2010)
FY 2011: acquired LJVH Holdings, Inc. and Subsidiaries (“Van Houtte”) on December 17, 2010

Valuation – DCF
18

Risks & Drivers
19

Recommendation
20
Watch List

Questions?
Thank you
21