GREAT PEOPLE DOING GREAT THINGS. 2011 AnnuAl REpoRt …
157
©2011 Perrigo Company All rights reserved 515 Eastern Avenue Allegan, Michigan 49010 (269) 673-8451 www.perrigo.com Share Information Perrigo Company common stock is traded on The NASDAQ Global Select Market ® and the Tel Aviv Stock Exchange (TASE) under the symbol PRGO. Shares outstanding at June 25, 2011: 92,777,534 Annual Meeting The Annual Meeting of Shareholders will be held at the Allegan County Area Technical & Education Center, 2891 116th Avenue (M-222), Allegan, Michigan, on October 26, 2011, at 10:00 a.m. (EST) Independent Accountants Ernst & Young LLP Grand Rapids, Michigan Fiscal 2011 Cash Dividend Data Shareholder Account Information Shareholders with requests for information regarding their share position, stock certificates, address changes and other related matters should contact: Computershare P.O. Box 43078 Providence, RI 02940 (800) 622-6757 Financial Information Annual reports, news releases, earnings announcements, dividend announcements, Form 10-K, 10-Q and 8-K reports and other financial information may be obtained by visiting the investor relations section of our Web site: www.perrigo.com/investors. Investor Relations Contacts Arthur J. Shannon Vice President, Investor Relations and Global Communications (269) 686-1709 Bradley Joseph Senior Manager, Investor Relations and Communications (269) 686-3373 Creative services by Strategic Communication Advisors and Anderson Design Grand Rapids, Michigan GREAT PEOPLE DOING GREAT THINGS. 2011 ANNUAL REPORT 2011 ANNUAL REPORT Fiscal Quarter Record Date Payable Date Per Share Amount 1st 8/27/10 9/14/10 $0.0625 2nd 11/26/10 12/14/10 $0.0700 3rd 2/25/11 3/15/11 $0.0700 4th 5/27/11 6/14/11 $0.0700
Transcript of GREAT PEOPLE DOING GREAT THINGS. 2011 AnnuAl REpoRt …

©2011 Perrigo Company All rights reserved
515 Eastern AvenueAllegan, Michigan 49010(269) 673-8451www.perrigo.com
Share Information Perrigo Company common stock is traded on The NAsdAq Global select Market® and the Tel Aviv stock Exchange (TAsE) under the symbol PRGO. shares outstanding at June 25, 2011: 92,777,534
Annual Meeting The Annual Meeting of shareholders will be held at the Allegan County Area Technical & Education Center, 2891 116th Avenue (M-222), Allegan, Michigan, on October 26, 2011, at 10:00 a.m. (EsT)
Independent AccountantsErnst & Young LLPGrand Rapids, Michigan Fiscal 2011 Cash Dividend Data
Shareholder Account Information shareholders with requests for information regarding their share position, stock certificates, address changes and other related matters should contact:
ComputershareP.O. Box 43078Providence, RI 02940(800) 622-6757
Financial Information Annual reports, news releases, earnings announcements, dividend announcements, Form 10-K, 10-q and 8-K reports and other financial information may be obtained by visiting the investor relations section of our Web site: www.perrigo.com/investors.
Investor Relations Contacts Arthur J. shannonVice President, Investor Relations and Global Communications(269) 686-1709
Bradley Josephsenior Manager, Investor Relationsand Communications(269) 686-3373
Creative services by strategic Communication Advisors and Anderson designGrand Rapids, Michigan
GREAT PEOPLE DOING GREAT THINGS. 2011 AnnuAl REpoRt
2011
An
nu
Al REpo
Rt
Fiscal quarter
Recorddate
Payable date
Per shareAmount
1st 8/27/10 9/14/10 $0.0625
2nd 11/26/10 12/14/10 $0.0700
3rd 2/25/11 3/15/11 $0.0700
4th 5/27/11 6/14/11 $0.0700
creo

Shareholder InformationDirectors
John T. HendricksonExecutive Vice President, Global Operations and Supply Chain
Executive Officers
Laurie BrlasExecutive Vice President,Chief Financial Officer, Cliffs Natural Resources, Inc.Director since 2003
Refael LebelExecutive Vice President and President,Perrigo Israel
Ellen R. HoffingChief Operating Officer and Co-President, Neos TherapeuticsDirector since 2008
Gary K. Kunkle, Jr.Retired Chairman andChief Executive Officer,DENTSPLY International Inc.Director since 2002
Judy L. BrownExecutive Vice President and Chief Financial Officer
Jeffrey R. NeedhamExecutive Vice President,General Manager, Perrigo Consumer Healthcare
Moshe ArkinFormer Vice Chairman,Perrigo CompanyDirector since 2005
Michael J. JandernoaFormer Chairmanof the Board,Perrigo CompanyDirector since 1981
Todd W. KingmaExecutive Vice President,General Counsel and Secretary
David T. GibbonsFormer Chairmanof the Board,Perrigo CompanyDirector since 2000
Joseph C. PapaChairman, President and Chief Executive Officer, Perrigo CompanyDirector since 2006
Michael R. StewartSenior Vice President,Global Human Resources
Sharon KochanExecutive Vice President, General Manager, Perrigo R
x Pharmaceuticals
Ran GottfriedConsultant and Directorfor public and privatecompanies in IsraelDirector since 2006
Ben-Zion ZilberfarbProfessor of Economicsat Bar-lian Universityand consultantDirector since 2007
Dr. Louis W. YuSenior Vice President,Global Quality and Compliance
Thomas M. FarringtonSenior Vice President, Chief Information Officer
Gary M. CohenExecutive Vice President,Becton, Dickinson and CompanyDirector since 2003
Herman Morris, Jr.City Attorney of theCity of Memphis, Memphis, TennesseeDirector since 1999
Dr. Jatin ShahSenior Vice President,Chief Scientific Officer
Scott F. JamisonExecutive Vice President, General Manager, Perrigo Nutritionals
The World’s leading Producer of QualiTy, affordable oTc PharmaceuTicals.
creo

3 Financial Highlights
5 Shareholder Letter
12 2011 in Review
14 Great People Doing Great Things
20 Financial Reconciliation
Inside Back Cover Shareholder Information

2 Perrigo AnnuAl RepoRt 2011
perrigo Company is a leading global healthcare supplier that develops,
manufactures and distributes over-the-counter (otC) and generic
prescription (Rx) pharmaceuticals, infant formulas, nutritional products and
active pharmaceutical ingredients (ApI). the Company is the world’s largest
store brand manufacturer of otC pharmaceutical products and infant
formulas. the Company’s primary markets and locations of manufacturing
and logistics operations are the united States, Israel, Mexico,
the united Kingdom and Australia.
Corporate Profile

3Perrigo AnnuAl RepoRt 2011
(3) See reconciliation of non-GAAp financial measures on page 20. We have excluded certain items when monitoring and evaluating perrigo’s ongoing financial results because we believe this provides important insight into perrigo’s ongoing core business operations on a normalized basis.
Financial Highlights
Year ended
net Sales $ 2,268.2 $ 2,755.0 21.5
operating Income $ 335.9 $ 490.2 45.9
Income from Continuing operations $ 224.4 $ 340.6 51.7
Diluted earnings per Share from Continuing operations $ 2.42 $ 3.64 50.4
Average Diluted Shares outstanding (000s) 92,845 93,529 0.7
Financial Results –
Reported (GAAP) (1)
In millions, except shares
and per share amounts
June 26,
2010 (2)
June 25,
2011 (2)
%
Change
Year ended
net Sales $ 2,268.2 $ 2,755.0 21.5
operating Income $ 408.6 $ 541.3 32.5
Income from Continuing operations $ 281.1 $ 375.4 33.5
Diluted earnings per Share from Continuing operations $ 3.03 $ 4.01 32.3
Average Diluted Shares outstanding (000s) 92,845 93,529 0.7
Financial Results –
Adjusted (Non-GAAP) (1)
In millions, except shares
and per share amounts
(unaudited)
June 26,
2010 (3)
June 25,
2011 (3)
%
Change
Net Sales($ in millions)
2,268.2
2,755.0
2010 2011
Operating Income($ in millions)
408.6
541.3
2010 2011
Income FromContinuing Operations
($ in millions)
281.1
375.4
2010 2011
Diluted EarningsPer Share(in dollars)
3.03
4.01
2010 2011
(1) All information based on continuing operations.
(2) See Item 7 in the Form 10-K report for a discussion of results of operations.

4 Perrigo AnnuAl RepoRt 2011
Joseph C. Papa, Chairman, President and Chief Executive Officer

Fellow Shareholders,
By every measure, Perrigo had a very successful fiscal year 2011, achieving record sales, earnings and cash flow.
In addition, the financial markets recognized this performance, rewarding Perrigo shareholders with record stock
prices that even outpaced the increases in the major financial indices.
Yet, there is another measure by which we gauge our success: contributing to our wholesale and retail customers’
goal to help millions of people lead healthier lives by offering them quality, affordable healthcare products. In fiscal
2011, we estimate that we delivered more than $1.5 billion in healthcare savings to consumers; more than $5 billion
in the last five years.
These outstanding results were achieved through the extraordinary dedication of the 8,700 Perrigo employees
worldwide. Their efforts drove growth in all areas of our core business, helped fuel growing store brand acceptance
and further expanded market share in our key categories. The Perrigo team also introduced important new products to
market, and helped identify and complete strategic acquisitions that extended our geographic reach and provided us
entry into important new OTC and Rx categories.
Impressively, these results were produced at a time when we were intensively focused on resolving the issues
related to a warning letter we received in mid-fiscal year 2010 from the U.S. Food and Drug Administration (FDA).
That focus, along with the efforts of hundreds of people throughout Perrigo and the team at the FDA office in
Detroit, allowed us to address and resolve the issues brought up in the warning letter so quickly. Everyone involved
rose to the challenge and did an incredible job. Today, Perrigo is a better company for their efforts.
Shareholder Letter
5Perrigo AnnUAL REPORT 2011
PricePerformance
| | | | |June 07 June 08 June 09 June 10 June 11
S&P
NASDAQ
PERRIGO
DJIA
-100%
-50%
50%
100%
150%
200%
250%
0%
300%
350%
400%
450%Perrigo vs. S&P, DJIA, and nASDAQ

6 Perrigo AnnuAl RepoRt 2011
Continued Progress on Five Strategic Pillars
At the core of Perrigo’s record performance in fiscal 2011
was our unwavering focus on and execution of our five
strategic pillars -- Quality, Customer Service, Innovation,
Cost Management, and People -- the fundamentals that
we consider the foundation of our business. Continued
progress on these pillars contributed substantially to fiscal
2011’s record results.
Ensuring Sustainable High Quality – Our efforts to
successfully resolve the issues identified in the FDA
warning letter we received in April 2010 reinforced and
reinvigorated our emphasis on global quality. We believe
that doing so has made us a better company and
strengthens one of our key competitive advantages:
Perrigo’s reputation for quality. We also commend the
FDA for their ongoing efforts to raise the bar on
pharmaceutical quality requirements.
Delivering Superior Customer Service – Our focus on
making improvements to sustainable quality systems
during fiscal 2011, combined with unprecedented high
demand for our products, created significant challenges
to our ability to deliver the kind of superior customer
service levels we aim to provide. Yet, the Perrigo team
maintained its sharp focus on doing all that it could to
meet our customers’ service requirements.
Pursuing Industry Leading Innovation – In fiscal 2011,
we built upon our industry leading position by expanding
our global market reach through the introduction of new
products resulting from acquisitions, partnerships and
internal development. All told, we introduced more than
50 new products, which contributed $192 million to our
sales for the fiscal year.
Executing Effective Cost Management – Our continuous
drive to improve our economies of scale and efficiency
is critical to our ability to deliver affordable healthcare
products. Despite ever-present cost pressures, our skilled
and sophisticated manufacturing and global procurement
teams made significant progress in cost management
during fiscal 2011.
Building on Our Winning Culture – We continuously seek
highly talented and motivated people. During fiscal 2011,
we focused on programs that support employee career
development, such as performance management and
leadership development.
FDA Warning Letter Timeline
Task Name Start Finish2010 2011
Qtr 1 Qtr 2 Qtr 3 Qtr 4 Qtr 1 Qtr 2 Qtr 3 Qtr 4
1 Perrigo FDA Warning Letter Timeline Thu 4/29/10 Mon 5/9/11
2 FDA Warning Letter issued Thu 4/29/10 Thu 4/29/10
3 Interim controls identified and executed Thu 4/29/10 Wed 5/26/10
4 Face-to-face meetings with FDA District Office Tue 5/4/10 Thu 10/7/10
5Identified global/site team members to assist withsystem assessments
Mon 5/10/10 Wed 5/19/10
6 Submitted written Warning Letter response to FDA Wed 5/19/10 Wed 5/19/10
7Conducted quality, organizational & manufacturingsystem assessments
Mon 5/24/10 Thu 7/8/10
8 Developed detailed system enhancement plans Mon 5/28/10 Thu 7/8/10
9 Executed improvement plan Fri 6/28/10 Wed 10/27/10
10 Provided written update to FDA District Office Fri 7/9/10 Fri 7/9/10
11 Extended system learnings with Perrigo’s global sites Mon 9/13/10 Wed 11/17/10
12 FDA inspection & Warning Letter follow-up Tue 3/1/11 Fri 4/8/11
13Received favorable FDA feedback on Warning Letter remediations
Mon 4/11/11 Mon 4/11/11
14 Written Warning Letter closure received from FDA Mon 5/9/11 Mon 5/9/11
4/29
5/19
4/11
5/9
7/9

7Perrigo AnnuAl RepoRt 2011

8 Perrigo AnnuAl RepoRt 2011
Key Events
The Perrigo team also executed several key initiatives against
our strategic plans during fiscal 2011 that contributed to
our terrific results and will continue to drive growth.
Fexofenadine Launch
We successfully launched a store brand version of the
important allergy medication, Fexofenadine HCl 180 mg
tablets, the generic equivalent of Sanofi-Aventis’ Allegra®
180 mg products.
Our manufacturing partner for the OTC switch of
Fexofenadine tablets, Teva Pharmaceutical Industries Ltd.,
received final OTC approval to sell and distribute both
Fexofenadine HCl 60 mg and 180 mg tablets, and we
expect to launch the 60 mg version during fiscal 2012.
Entry into Blood Glucose Monitoring Market
We entered into an exclusive agreement with
AgaMatrix, Inc. to sell and distribute store brand blood
glucose monitors and test strips in the U.S. As part of
the agreement, Perrigo will sell and distribute certain
products in the current AgaMatrix portfolio as well as
certain future new products.
It is estimated that over $2.8 billion is spent annually
on glucose monitoring meters and test strips in the
U.S. alone. We are leveraging our existing store brand
retail channels to expand distribution of the new
blood glucose meters and testing strips to consumers.
In addition, we will continue to explore a full range
of diabetes care products that extends beyond blood
glucose monitoring.
Paddock Acquisition
During fiscal 2011, we continued our strategic review
of potential acquisitions that would extend our global
footprint and add important products to our Consumer
Healthcare and Rx portfolios.
In January 2011, we announced the signing of an
agreement to acquire the assets of Paddock Laboratories, Inc.,
a Minneapolis-based manufacturer and marketer of
generic pharmaceutical products. The Paddock acquisition
closed on July 26, 2011, subsequent to the end of
fiscal 2011, for approximately $547 million in cash. Net of
an anticipated tax benefit resulting from the acquisition of
an estimated $95 million, the total consideration will be
approximately $452 million.
The Paddock acquisition is an important step forward in
executing our strategy to expand our specialty generic
Rx product portfolio. It adds incremental scale as well as
excellent development and manufacturing capabilities
across a spectrum of niche dosage forms. It also solidifies
our leading position in the extended topical space and
strengthens our ability to offer new products. Importantly,
Paddock has a proven record for quality manufacturing
with great customer service. We welcome the members of
the Paddock team into the Perrigo family in fiscal 2012.

9Perrigo AnnuAl RepoRt 2011
Business Segment Review
Consumer Healthcare
Our Consumer Healthcare (CHC) segment consists of a
number of important over-the-counter pharmaceuticals
sold under retailer brands. These include analgesics,
cough and cold, gastrointestinal, and the recently added
blood glucose monitoring and diabetes management
categories. Our CHC business continues to benefit from
new products that the FDA has approved for “switch”
from prescription to over-the-counter availability.
The chart below highlights that consumers increasingly
recognize the value of store brands. Given our store brand
pharmaceutical expertise and strong retailer relationships,
Perrigo is well-positioned to benefit from the continuing
growth in store brand market share.
In the near-term, several key new products will drive our
growth in this segment. During fiscal 2012, we expect to
launch several important new products, including:
• Guaifenesin, the generic version of Mucinex®;
• Lansoprazole, the generic of the branded acid-reducer Prevacid®;
• Minoxidil Foam, the generic form of Rogaine® Foam; and
• Omeprazole Sodium Bicarbonate, the generic of the heartburn medication, Zegerid OTC™.
Longer-term, our strategy for growth in the CHC segment
includes continued expansion of our product portfolio
into adjacent categories such as ophthalmics and diabetes
care, and leveraging our presence in existing international
markets to expand into new regions and countries.
Nutritionals
Our Nutritionals business had a very strong fiscal 2011
with a full year of results from the fiscal 2010 acquisition
of PBM infant nutrition. Our strategy for future growth
will be driven not only by additions to our product
portfolio, but also by expanding our presence in
global markets with significant population growth.
For example, we are currently working to expand
distribution of our infant formula products in China.
-15 -10 -5 0 5 10 15 20 25
Total OTC & VMS*
Gastrointestinal
Total OTC
Analgesics
Cough, Cold, Allergy, Sinus
Smoking Cessation
Vitamins (VMS*)
Infant Formula
Store Brand National Brand Category
2.5%-0.9%
11.1%
1.8%-2.5%
12.9%
2.1%-2.2%
14.7%
2.9%-0.6%
11.8%
-0.7%-10.1%
20.6%
1.4%-4.9%
7.8%
4.9%5.4%
3.4%
-3.5%-3.9%
11.4%
Store Brand Growth vs. Last Year
* Vitamins, Minerals, and SupplementsSource: IRI FDMx 52 Week Data Ending July 3, 2011

10 Perrigo AnnuAl RepoRt 2011
Rx Pharmaceuticals
The Rx Pharmaceuticals segment continues to drive
strong sales growth through new products. In addition,
this segment’s profitability continues to improve as we
benefit from our efforts to increase operating efficiency
over the past two years. Going forward, our strategy for
growing this segment includes not only organic new
product launches that will result from the efforts of our
highly experienced marketing and regulatory teams,
but also expansion of our Rx portfolio through partnerships
and strategic acquisitions, such as the recently completed
deal with Paddock Laboratories, Inc.
API
The Active Pharmaceutical Ingredient (API) segment
recorded a double-digit sales increase on the strength
of new products. Operating income in this segment
also increased due to higher-margin new product sales,
decreased operating expenses and improved financial
operating leverage.
Growth Strategy: Be the Right Company, in the Right Place, at the Right Time
Some might say we are adept at being in the right place
at the right time. There’s no denying that Perrigo has
been well-positioned to take advantage of key trends
impacting our business. Among these have been the
growing concern over and focus on rising healthcare
costs, a weak global economy, and an aging population.
These ‘macro-trends’ have led to an increased emphasis
on the prescribing and use of OTC and generic Rx products,
and the growing acceptance of lower cost, high-value
store brand versions of well-known medications.
Our positioning of Perrigo to take advantage of these
major, long-term shifts is no accident. Meeting the
growing need for quality, affordable healthcare products
that we anticipated decades ago has always been at the
core of our strategic vision.
Positioning Perrigo to be in the ‘right “space” at the right
time’ also requires that we bring our products to market
quickly – ideally before anyone else. Doing so allows
us to gain valuable market share early and to profit
from the short-term exclusivity that being first-to-file for
certain new product approvals offers. The Perrigo team
has an outstanding first-to-market track record for new
products in key categories.
Our retail and wholesale customers also benefit from our
well-earned reputation for bringing the right products to
market at just the right time as it has a positive impact on
their brands’ market share and category profitability.
Leveraging the Strength in Our Numbers
Importantly, our focus is beyond our quarter-to-quarter
results. It is one thing to produce profits and cash flow,
but I believe that the measure of a successful company
should also be based on how its management team uses
those resources to create long-term value.
This philosophy is evident in how we use our financial
strength to make strategic acquisitions in key categories

11Perrigo AnnuAl RepoRt 2011
that expand our geographic footprint, add capacity and
capabilities, and enter new markets.
We use the following criteria to identify and vet each
acquisition opportunity:
• Does it support our long-term growth strategy by
expanding our product portfolio while maintaining
our strong balance sheet?
• Does it complement our commitment to quality?
• Will it expand the breadth of our product offering
and/or add a strong new product pipeline?
• Does it offer compelling value consistent with our
stated acquisition criteria of accretive return on
invested capital?
Even Greater Things to Come
Looking ahead to fiscal 2012 and beyond, I am confident
that no matter where proposed healthcare reform ends
up, Perrigo will be in a strong position. The global
healthcare landscape points to continued growth in
the need and demand for quality, affordable healthcare
products as a key element in the worldwide drive to
improve cost efficiency.
Simply stated, I have never been more energized about
the future of Perrigo. I believe no other company is better
positioned, more solidly supported by financial resources,
or better fueled by talented people than Perrigo. Our
strategic pillars, our proven ability to execute our strategy,
and an unrelenting commitment to quality will continue to
drive our growth as we expand our product portfolio and
global footprint.
In closing, I would once again like to thank and pay
tribute to the 8,700 great Perrigo people around the globe
who do such a great job meeting the need for quality,
affordable healthcare products.
Sincerely,
Joseph C. Papa
Chairman, President and
Chief Executive Officer
September 15, 2011

12 Perrigo AnnuAl RepoRt 201112 Perrigo AnnuAl RepoRt 2011
2011in ReviewJuly/August 2010
We announced that we were the first-to-file our Abbreviated new Drug Application (AnDA) for Clobetasol Propionate Emulsion Foam, 0.05%, the AB-rated equivalent to Stiefel laboratories’ olux® -e Foam, 0.05%, with the FDA.
We announced that we received final FDA approval to manufacture and market OTC Cetirizine Cherry Syrup, 1mg/ml, which is comparable to Mcneil Consumer Healthcare’s Zyrtec® Children’s Allergy Syrup.
We confirmed an FDA filing of our AnDA for Butoconazole Nitrate Vaginal Cream, 2%, a generic version of Glynazole-1® cream.
We confirmed that we filed our AnDA for Clobetasol Shampoo, substitutable to Galderma’s Clobex® Shampoo, 0.05%.
We announced that we received FDA clearance to manufacture and market certain new infant formula liquid concentrate and ready-to-use products through our partner Kerry proteins and nutritionals in Sainte Claire, Quebec.
September 2010
We announced that we received FDA approval to manufacture and market Imiquimod Cream, 5%, the generic equivalent to Aldara®, and that we would vertically integrate this product with our own active pharmaceutical ingredient.
We confirmed the filing of our AnDA for Omeprazole 20 mg/Sodium Bicarbonate 1,100 mg, the generic equivalent of Schering-plough HealthCare’s Zegerid otCtM.
November 2010
We announced the launch of Naproxen Sodium Soft Gels, the generic equivalent of Bayer HealthCare’s Aleve® liquid Gels, 220 mg, an otC analgesic.
We announced that our partner Synthon received final FDA approval for Levocetirizine Tablets, a generic
version of the allergy medicine Xyzal® tablets from uCB/Sepracor, and marketed in the u.S. by Sanofi-Aventis. We were granted exclusive rights from Synthon to sell and distribute the product in the u.S.
January 2011
We announced that we signed a definitive agreement to acquire substantially all of the assets of paddock laboratories, Inc., a privately held, Minneapolis-based manufacturer and marketer of generic pharmaceutical products for approximately $547 million in cash.
February 2011
We announced that we agreed to settle our Hatch-Waxman litigation relating to Minoxidil Foam brought by Stiefel Research Australia pty. ltd., a GSK Company. under the terms of the settlement, we expect to launch a generic version of Men’s Rogaine® Foam in the u.S. in fiscal 2012.

13Perrigo AnnuAl RepoRt 2011
We entered into an exclusive agreement with AgaMatrix, Inc. to sell and distribute blood glucose monitors and test strips in the u.S. store brand channel.
We began selling otC infant formula to Costco under their Kirkland SignaturetM brand in Canada.
We confirmed that we filed an AnDA for Calcipotriene 0.005% and Betamethasone Dipropionate 0.064% Ointment, a generic form of leo pharma, Inc.’s taclonex® ointment.
April 2011
We announced the FDA’s Detroit office had concluded its re-inspection of perrigo’s Allegan facility and that perrigo had been granted an acceptable regulatory status, such that any pending export license and AnDA applications from this facility will once again be eligible for review and approval.
our partner, teva pharmaceutical Industries ltd., received final otC approval to sell and distribute Fexofenadine HCl 60 mg and 180 mg Tablets, the generic equivalents
of Sanofi-Aventis’ Allegra® 60 mg and 180 mg products.
our pBM infant formula business won an appellate judgment against Mead Johnson affirming an earlier decision that Mead Johnson had engaged in false advertising resulting in an injunction prohibiting Mead Johnson from making similar claims and awarding damages in favor of pBM.
May 2011
We announced that we received final approval from the FDA for our AnDA for OTC Minoxidil Foam, a generic version of Men’s Rogaine® Foam.
We announced that we agreed to settle all Hatch-Waxman litigation relating to Fluticasone Lotion brought by nycomed uS Inc. by taking a license under all relevant patents. under the terms of the settlement, we can launch a generic version of Cutivate® lotion, 0.05% on September 22, 2012, or earlier under certain circumstances.
We announced that we received final approval from the FDA for our AnDA
for OTC Ranitidine 150 (regular and cool mint), a generic version of Zantac 150®. We expect to launch early in our fiscal 2012.
We announced that our partner Synthon received FDA tentative approval for its AnDA for Levocetirizine Solution, 2.5 mg/5 ml, a generic equivalent to uCB’s Xyzal® oral Solution.
June 2011
We announced the launch of Triamcinolone Acetonide Nasal Spray, the AB-rated generic equivalent to Sanofi’s nasacort® AQ through our partner teva pharmaceutical Industries ltd.
13Perrigo AnnuAl RepoRt 2011

Delivering on the Promise of Quality, Affordable Healthcare ProductsGREAT PEOPLE DOING GREAT THINGS.
Ron Janish, Senior Vice President of International Consumer Healthcare Market Development
Ron led the identification and acquisition of Orion Laboratories in Australia. He then agreed to relocate from Western Michigan to Western Australia to lead the integration and strategically important development of our Australian consumer healthcare business. Ron is Perrigo’s self-described global “value evangelist” and likes to refer to Perrigo as “the biggest pharmaceutical company you’ve never heard of.”
14

15Perrigo AnnuAl RepoRt 2011
Bart Shrode, Director of Quality, Perrigo Michigan
Bart has responsibility for driving overall quality and compliance improvement activities at our Michigan facilities. Bart was a key participant in the team that executed the remediation of our FDA warning letter. Bart also hosted and directed the recent successful FDA re-inspection, which led to the successful remediation and resolution of the FDA issues.
Ivory Wu, Quality Auditor, Perrigo Shanghai
Ivory’s commitment to honesty and integrity enable her to excel in working with a wide variety of key Perrigo supply chains, suppliers and materials. Ivory helps them adopt “win-win thinking” by promoting flexibility that leads to innovative approaches to achieving high quality and low cost in a large-scale production environment.

Vicki Dagan, Import-Export Specialist, Perrigo Israel
Vicki led a team that transferred and consolidated shipments of potentially dangerous materials from air to sea. That effort contributed to cost savings and to improved product quality, all without negatively affecting customer service levels. Vicki’s efforts earned her the Perrigo Award for Cost Saving Excellence in fiscal 2010.
16 Perrigo AnnuAl RepoRt 2011

Martin Berlanga, Human Resources Director, Perrigo Mexico
Martin has focused his considerable talents on building and maintaining critical relationships that are at the heart of our ability to deliver high quality, low cost healthcare products. He has also spearheaded numerous safety and training programs that have increased the security and safety for our employees, and reduced our insurance premiums.
17

18
Jason Parish, Senior Contract Sales Manager, Perrigo U.K.
During fiscal 2011, Jason helped us secure new business by demonstrating our service flexibility and creativity in production and logistics, which contribute to low cost and high quality, mutually benefiting Perrigo and our customers. Working cooperatively with internal and external team members, Jason was instrumental in Perrigo’s efforts at securing “preferred status” as a supplier within a major customer.
Julia Lingbeek, Continuous Improvement Engineer, Perrigo Michigan
By making quality her top priority, Julia provides leadership to teams that build quality into our processes. She views leading change, in collaboration with a variety of departments, sites, and suppliers, as a major part of our continuous drive to improve our processes. Perrigo people such as Julia help us maintain a consistently strong focus on quality throughout the company.

19
Stacy Berkshire, Senior Director of Global Quality Strategy and Programs, Perrigo Michigan
Despite rapidly changing global regulatory requirements and expectations, Stacy provides leadership to the Perrigo team in our mission to keep consumers safe by building quality and continuous improvement into every aspect of our operation, striving to raise our quality bar ever higher.
19Perrigo AnnuAl RePoRt 2011

Year Ended*
Reported Net Sales $ 2,268.2 $ 2,755.0
Reported Operating Income $ 335.9 $ 490.2
Expensing of Inventory Step-ups 10.9 -
Restructuring 9.5 1.0
Write-off of In-Process R&D 19.0 -
Acquisition Costs 8.2 3.3
Deal-related Amortization 25.1 46.8
Adjusted Operating Income $ 408.6 $ 541.3
Reported Income from Continuing Operations $ 224.4 $ 340.6
Expensing of Inventory Step-ups 6.9 -
Restructuring 9.3 0.7
Write-off of In-Process R&D 14.6 -
Acquisition Costs 7.8 2.0
Deal-related Amortization 18.1 32.1
Adjusted Income from Continuing Operations $ 281.1 $ 375.4
Diluted Earnings Per Share
from Continuing Operations
Reported $ 2.42 $ 3.64
Adjusted $ 3.03 $ 4.01
Average Diluted Shares Outstanding (000s) 92,845 93,529
* All information based on continuing operations.
Perrigo Company
Reconciliation of
Non-GAAP Measures
In millions, except shares
and per share amounts
(unaudited)
Perrigo excludes the expensing of the step-ups in the value of inventory acquired, restructuring costs, the write-off of in-process research and development, acquisition costs and deal-related amortization when monitoring and evaluating the ongoing financial results and trends of its business, and believes that presenting operating results excluding these items is also useful for investors, since it provides important insight into Perrigo’s ongoing core business operations on a normalized basis. Adjusted earnings is one of the primary indicators management uses for planning and forecasting in future periods, including trending and analyzing the core operating performance of Perrigo’s business from period to period without the effect of these non-core business items.
Financial Reconciliation
June 26,
2010
June 25,
2011
20 Perrigo ANNuAl REPORt 2011

PERRIGO COMPANYFORM 10–K
FISCAL YEAR ENDED JUNE 25, 2011 TABLE OF CONTENTS
Part I.Item 1.Item 1A.Item 1B.Item 2.Item 3.Item 4.AdditionalItem.
Part II.Item 5.
Item 6.Item 7.
Item 7A.Item 8.Item 9.
Item 9A.Item 9B.
Part III.Item 10.Item 11.Item 12.
Item 13.Item 14.
Part IV.Item 15.
Page No. Cautionary Note Regarding Forward-Looking Statements
BusinessRisk FactorsUnresolved Staff CommentsPropertiesLegal ProceedingsReservedExecutive Officers of the Registrant
Market for Registrant’s Common Equity, Related Stockholder Matters and Issuer Purchases of Equity SecuritiesSelected Financial DataManagement’s Discussion and Analysis of Financial Condition and Results of OperationsQuantitative and Qualitative Disclosures About Market RiskFinancial Statements and Supplementary DataChanges in and Disagreements With Accountants on Accounting and Financial DisclosureControls and ProceduresOther Information
Directors, Executive Officers and Corporate GovernanceExecutive CompensationSecurity Ownership of Certain Beneficial Owners and Management and Related Stockholder MattersCertain Relationships and Related Transactions, and Director IndependencePrincipal Accountant Fees and Services
Exhibits and Financial Statement Schedules
1
223737384040
41
4345
6366
122
123123
123124124
124124
125
1

UNITED STATESSECURITIES AND EXCHANGE COMMISSION
Washington, D.C. 20549
FORM 10-K[X] ANNUAL REPORT PURSUANT TO SECTION 13 OR 15(d) OF THE SECURITIES EXCHANGE ACT OF 1934
For the fiscal year ended June 25, 2011or
[ ] TRANSITION REPORT PURSUANT TO SECTION 13 OR 15(d) OF THE SECURITIES EXCHANGE ACT OF 1934For the transition period from to
Commission file number 0-19725Perrigo Company
(Exact name of registrant as specified in its charter)
Michigan(State or other jurisdiction of incorporation or organization)
515 Eastern AvenueAllegan, Michigan
(Address of principal executive offices)
38-2799573(I.R.S. Employer Identification No.)
49010(Zip Code)
Registrant’s telephone number, including area code: (269) 673-8451Securities registered pursuant to Section 12(b) of the Act:
Title of each classCommon Stock (without par value)
Name of each exchange on which registeredThe NASDAQ Global Select Market
Securities registered pursuant to Section 12(g) of the Act:None
(Title of Class)
Indicate by check mark if the registrant is a well-known seasoned issuer,as defined in Rule 405 of the Securities Act.YES [ ] NO [X]
Indicate by check mark if the registrant is not required to file reports pursuant to Section 13 of Section 15(d) of the Act.YES [ ] NO [X]
Indicate by check mark whether the registrant (1) has filed all reports required to be filed by Section 13 or 15(d) of the SecuritiesExchange Act of 1934 during the preceding 12 months (or for such shorter period that the registrant was required to file suchreports), and (2) has been subject to such filing requirements for the past 90 days. YES [X] NO [ ]Indicate by check mark whether the registrant has submitted electronically and posted on its corporate Web site, if any, everyInteractive Data File required to be submitted and posted pursuant to Rule 405 of Regulation S-T (§232.405 of this chapter) duringthe preceding 12 months (or for such shorter period that the registrant was required to submit and post such files). YES [X] NO [ ]Indicate by check mark if disclosure of delinquent filers pursuant to Item 405 of Regulation S-K is not contained herein, and will notbe contained, to the best of registrant’s knowledge, in definitive proxy or information statements incorporated by reference in Part IIIof this Form 10-K or any amendment to this Form 10-K. [ ]Indicate by check mark whether the registrant is a large accelerated filer, an accelerated filer, a non-accelerated filer, or a smallerreporting company. See the definitions of “large accelerated filer”, “accelerated filer” and “smaller reporting company” in Rule 12b-2of the Exchange Act.
Large accelerated filer [X]Non-accelerated filer [ ](Do not check if a smaller reporting company)
Accelerated filer [ ]Smaller reporting company [ ]
Indicate by check mark whether the registrant is a shell company (as defined in Rule 12b-2 of the Exchange Act). [ ] YES [X] NOThe aggregate market value of the voting stock held by non-affiliates of the registrant, based upon the closing sale price of thecommon stock on December 23, 2010 as reported on The NASDAQ Global Select Market, was $5,444,269,112. Shares of commonstock held by each director or executive officer have been excluded in that such persons may be deemed to be affiliates. Thisdetermination of affiliate status is not necessarily a conclusive determination for other purposes.As of August 9, 2011, the registrant had 92,797,375 outstanding shares of common stock.Documents incorporated by reference: Portions of the Registrant’s Proxy Statement for its Annual Meeting of Shareholders onOctober 26, 2011 are incorporated by reference into Part III of this Form 10-K.

CAUTIONARY NOTE REGARDING FORWARD-LOOKING STATEMENTS
Certain statements in this report are “forward-looking statements” within the meaning of Section 21E of the SecuritiesExchange Act of 1934, as amended, and are subject to the safe harbor created thereby. These statements relate tofuture events or the Company’s future financial performance and involve known and unknown risks, uncertainties andother factors that may cause the actual results, levels of activity, performance or achievements of the Company or itsindustry to be materially different from those expressed or implied by any forward-looking statements. In particular,statements about the Company’s expectations, beliefs, plans, objectives, assumptions, future events or futureperformance contained in this report, including certain statements contained in “Business,” “Risk Factors” and“Management’s Discussion and Analysis of Financial Condition and Results of Operations” are forward-lookingstatements. In some cases, forward-looking statements can be identified by terminology such as “may,” “will,” “could,”“would,” “should,” “expect,” “plan,” “anticipate,” “intend,” “believe,” “estimate,” “predict,” “potential” or the negative ofthose terms or other comparable terminology. The Company has based these forward-looking statements on its currentexpectations, assumptions, estimates and projections. While the Company believes these expectations, assumptions,estimates and projections are reasonable, such forward-looking statements are only predictions and involve knownand unknown risks and uncertainties, many of which are beyond the Company’s control. These and other importantfactors, including those discussed under “Risk Factors,” may cause actual results, performance or achievements todiffer materially from those expressed or implied by these forward-looking statements. The forward-looking statementsin this report are made only as of the date hereof, and unless otherwise required by applicable securities laws, theCompany disclaims any intention or obligation to update or revise any forward-looking statements, whether as a resultof new information, future events or otherwise.
PART I.
Item 1. Business. (Dollar amounts in thousands)
GENERAL
Perrigo Company, established in 1887, is a leading global healthcare supplier that develops, manufactures anddistributes over-the-counter (OTC) and generic prescription (Rx) pharmaceuticals, infant formulas, nutritional productsand active pharmaceutical ingredients (API). The Company is the world’s largest store brand manufacturer of OTCpharmaceutical products and infant formulas. The Company’s primary markets and locations of manufacturing andlogistics operations are the United States (U.S.), Israel, Mexico, the United Kingdom (U.K.) and Australia. See Note17 of the Notes to Consolidated Financial Statements for further information.
Perrigo Company operates through several wholly owned subsidiaries. In the U.S., its operations are conductedprimarily through L. Perrigo Company,Perrigo Company of South Carolina, Inc., Perrigo New York, Inc., Perrigo Holland,Inc. (formerly J.B. Laboratories, Inc.), Perrigo Florida, Inc. (formerly Unico Holdings, Inc.) and PBM Holdings, Inc.Outside the U.S., its operations are conducted primarily through Perrigo Israel Pharmaceuticals Ltd., Chemagis Ltd.,Quimica y Farmacia S.A. de C.V., Laboratorios Diba, S.A., Wrafton Laboratories Limited, Galpharm Healthcare Ltd.and Orion Laboratories Pty Ltd. As used herein, references to the “Company” means Perrigo Company, its subsidiariesand all predecessors of Perrigo Company and its subsidiaries.
The Company’s principal executive offices are located at 515 Eastern Avenue, Allegan, Michigan, 49010. Its telephonenumber is (269) 673-8451. The Company’s website address is http://www.perrigo.com, where the Company makesavailable free of charge the Company’s reports on Forms 10-K, 10-Q and 8-K, as well as any amendments to thesereports, as soon as reasonably practicable after they are electronically filed with or furnished to the Securities andExchange Commission (SEC). These filings are also available to the public at http://www.sec.gov and http://www.isa.gov.il.
The Company has four reportable segments, aligned primarily by type of product: Consumer Healthcare, Nutritionals,Rx Pharmaceuticals and API. In addition, the Company has an Other category that consists of the Israel Pharmaceuticaland Diagnostic Products operating segment, which does not individually meet the quantitative thresholds required tobe a separately reportable segment. On April 30, 2010, the Company acquired 100% of the shares of PBM Holdings,Inc. (PBM), the leading manufacturer and distributor of store brand infant formulas, pediatric nutritionals and babyfoods sold by leading retailers in the mass, club, grocery and drug channels in the U.S., Canada, Mexico and China.As a result of the acquisition of PBM, the Company began participating in new nutritional product lines. In the firstquarter of fiscal 2011, the Company realigned and expanded its operating segments to include a Nutritionals segment,representing infant formulas and other nutritional products. Accounting Standard Codification (ASC) 280-10-50 (ASC280-10-50) defines an operating segment as a component of a public entity that earns revenue and incurs expenses,
1

has discrete financial information available and is reviewed regularly by the chief decision maker for purposes ofallocating resources and assessing performance. Each of the segments meets the requirements of an operatingsegment. TheConsumer Healthcare, Nutritionals, Rx Pharmaceuticals and APIoperating segments are also consideredto be reportable segments by management. This segment structure is consistent with the way management makesoperating decisions, allocates resources and manages the growth and profitability of the Company’s business. As aresult of the change in segment reporting, all historical segment information has been adjusted to conform to the newpresentation.
Prior to June 27, 2010, the Company’s consolidated results of operations and financial position included the financialresults of its U.K., Mexico, Germany and Israel subsidiaries on a twelve-month period ending in May, resulting in aone-month reporting lag when compared to the remainder of the Company. Starting June 27, 2010, the reporting year-end of these foreign operations was changed from May to June. The previously existing one-month reporting lag waseliminated as it was no longer required to achieve a timely consolidation due to the Company’s investments intechnology, ERP systems and personnel to enhance its financial statement close process. The Company believes thischange is preferable because financial information of all operating units is now reported based on the same period-end, which improves overall financial reporting to investors by providing the most current information available. TheCompany’s financial statements for periods prior to fiscal 2011 have been adjusted to reflect the period-specific effectsof applying this change in accounting principle. This change resulted in a cumulative effect of an accounting changeof $1,602, net of income tax effect, to retained earnings as of June 29, 2008. The impact of this change in accountingprinciple to eliminate the one-month lag for foreign subsidiaries is summarized in Note 1 of the Notes to ConsolidatedFinancial Statements.
In March 2009, the Company committed to a plan to sell its Israel Consumer Products business. This business primarilysold consumer products to the Israeli market, including cosmetics, toiletries and detergents, and was previously reportedas part of the Company’s Other category. In the third quarter of fiscal 2009, the Israel Consumer Products businesshad met the criteria set forth in ASC 360-10 to be accounted for as discontinued operations. On February 26, 2010,the Company completed the sale of its Israel Consumer Products business to Emilia Group, a subsidiary of O. FellerHoldings Ltd., for approximately $47,000, of which approximately $11,000, subject to foreign currency fluctuationsbetween the Israeli shekel and the U.S. dollar, is contingent upon satisfaction of contingency factors specified in theagreement. After the finalization of post-closing working capital adjustments in the third quarter of fiscal 2011, the saleresulted in a pre-tax loss of $1,407. The Israel Consumer Products business is considered a discontinued operation,and as a result, all consolidated financial statements in this AnnualReport on Form 10-K have been adjusted accordinglyto reflect this financial statement presentation. See Note 3 of the Notes to Consolidated Financial Statements forinformation concerning the sale of Israel Consumer Products.
Information concerning sales and operating income attributable to each of the Company’s business segments andgeographic areas for the last three fiscal years ended on or around June 30 is set forth in Item 7 Management’sDiscussion and Analysis of Financial Condition and Results of Operations and in Note 17 of the Notes to ConsolidatedFinancial Statements. Information concerning identifiable assets of each of the Company’s reportable segments as ofthe last three fiscal years ended on or around June 30 is set forth in Note 17 of the Notes to Consolidated FinancialStatements.
CONSUMER HEALTHCARE
The Consumer Healthcare segment includes the Company’s U.S., U.K., Mexico and Australia operations supportingthe sale of OTC pharmaceutical products. This reportable segment markets a broad line of products that are comparablein quality and effectiveness to national brand products. Major product categories include analgesic, cough/cold/allergy/sinus, gastrointestinal and smoking cessation. The cost to the retailer of a store brand product is significantly lowerthan that of a comparable nationally advertised brand-name product. The retailer, therefore, can price a store brandproduct below the competing national brand product yet realize a greater profit margin on the store brand item. Generally,the retailers’ dollar profit per unit of store brand product sold is greater than the dollar profit per unit of the comparablenational brand product. The consumer benefits by receiving a high quality product at a price below the comparablenational brand product.
Significant Developments
On February 17, 2011, the Company announced that it entered into an exclusive agreement with AgaMatrix, Inc.(AgaMatrix) to sell and distribute blood glucose monitors and test strips in the U.S. store brand channel. Under theterms of the agreement, the Company paid $5,000 to AgaMatrix for a distribution and license agreement, which hasbeen accounted for as an intangible asset beginning in the third quarter of fiscal 2011 and is being amortized on an
2

accelerated basis over its eight-year useful life.
On March 8, 2010, the Company acquired 100% of the outstanding shares of privately held Orion Laboratories PtyLtd. (Orion). After taking into account final working capital adjustments, the ultimate cash paid for Orion was $48,012.Located near Perth, Western Australia, Orion was a leading supplier of OTC store brand pharmaceutical products inAustralia and New Zealand. In addition, Orion manufactured and distributed pharmaceutical products supplied tohospitals in Australia. The acquisition of Orion expanded the Company’s global presence and product portfolio intoAustralia and New Zealand. Orion’s results of operations were recorded in the Company’s Consumer Healthcaresegment beginning in the Company’s third quarter of fiscal 2010.
On November 13, 2008, the Company acquired 100% of the outstanding shares of privately held Unico Holdings, Inc.(Unico) for $51,853 in cash. Based in Lake Worth, Florida, Unico was the leading manufacturer of store brand pediatricelectrolytes, enemas and feminine hygiene products for retail customers in the U.S. The acquisition of Unico expandedthe Company’s OTC product portfolio in the U.S. Unico’s results of operations were recorded in the Company’sConsumer Healthcare segment beginning in the Company’s second quarter of fiscal 2009. As previously discussed,due to the realignment of the Company's operating segments in the first quarter of fiscal 2011, the store brand pediatricelectrolytes products are now being reported as part of the Company's Nutritionals operating segment.
On October 6, 2008, the Company acquired 100% of the outstanding shares of privately held Laboratorios Diba, S.A.(Diba) for $24,500 in cash. Based in Guadalajara, Mexico, Diba was a store brand manufacturer of OTC and prescriptionpharmaceuticals, including antibiotics, hormonals and ophthalmics. The acquisition of Diba expanded the Company’sglobal presence and product portfolio in Mexico. Diba’s results of operations were recorded in the Company’s ConsumerHealthcare segment beginning in the Company’s second quarter of fiscal 2009.
On September 16, 2008, the Company acquired J.B. Laboratories, Inc. (JBL), a privately held contract manufacturerof OTC and nutrition products for leading healthcare suppliers, for $42,962, including debt assumed. The acquisitionof JBL provided additional U.S. Food and Drug Administration (FDA)-compliant production capacity to help servicecurrent and future customer needs. JBL’s results of operations were recorded in the Company’s Consumer Healthcaresegment beginning in the Company’s second quarter of fiscal 2009. As previously discussed, due to the realignmentof the Company's operating segments in the first quarter of fiscal 2011, JBL's nutrition products are now being reportedas part of the Company's Nutritionals operating segment.
Consumer Healthcare Business
The Company is dedicated to being the leader in developing and marketing new store brand products and has aresearch and development staff that management believes is one of the most experienced in the industry at developingproducts comparable in formulation and quality to national brand products. This staff also responds to changes inexisting national brand products by reformulating existing Company products. In the OTC pharmaceutical market,certain new products are the result of changes in product status from “prescription only” (Rx) to OTC (non-prescription).These “Rx-to-OTC switches” require approval by the FDA, a process initiated by the drug innovator, through eitherthe FDA Abbreviated New Drug Application (ANDA) or its New Drug Application (NDA). As part of its strategy, theCompany relies on both internal development and strategic product development agreements with outside sources.In addition, the Company also engages in contract manufacturing which focuses on partnerships with majorpharmaceutical, multi-level marketing and direct-to-consumer companies by providing unique ANDA and monographproducts to its contract customers to maximize sales of proprietary formulas and to utilize available capacity.
The Company is committed to consistently providing its customers with high quality products that adhere to “CurrentGood Manufacturing Practices” (cGMP) regulations promulgated by the FDA and the health ministries of countrieswhere the Company has commercial and operational presence. Substantially all products are developed usingingredients and formulas comparable to those of national brand products. In most instances, packaging is designedto increase visibility of store brand products and to invite and reinforce comparison to national brand products in orderto communicate store brand value to the consumer.
The Company seeks to establish customer loyalty through superior customer service by providing a comprehensiveassortment of high quality, value priced products; timely processing, shipment and delivery of orders; assistance inmanaging customer inventories and support in managing and building the customer’s store brand business. TheCompany also seeks to establish customer loyalty by providing marketing support that is directed at developingcustomized marketing programs for the customers’ store brand products. The primary objective of this store brandmanagement approach is to enable customers to increase sales of their own store brand products by communicatingstore brand quality and value to the consumer. The Company’s sales and marketing personnel assist customers inthe development and introduction of new store brand products and the promotion of customers’ ongoing store brand
3

products by performing consumer research, providing market information and establishing individualized promotionsand marketing programs.
The Consumer Healthcare segment currently markets over 1,800 store brand products, with over 8,300 stock-keepingunits (SKUs), to over 700 customers. The Company considers every different combination of size, flavor, strength anddosage form (e.g., tablet, liquid, softgel, etc.) of a given item as a separate “product”. The Company also currentlymanufactures and markets certain products under its Good Sense® brand.
Listed below are major Consumer Healthcare product categories under which the Company markets products for storebrand labels; the annual retail market size for food, drug and mass merchandise retailers in the U.S., excluding Walmartand those classified as club stores and dollar stores (according to Information Resources, Inc.); and the names ofcertain national brands against which the Company’s products compete.
Product CategoriesCough/Cold/Allergy/Sinus
Gastrointestinal
AnalgesicsSmoking Cessation
RetailMarket Size
(Billions)$ 4.7
$ 2.6
$ 2.3$ 0.5
Comparable National BrandsAdvil® Cold & Sinus, Afrin®, Allegra®, Benadryl®, Claritin®, Dimetapp®,NyQuil®, DayQuil®, Robitussin®, Sudafed®, Tavist®, Theraflu®,Triaminic®, Tylenol®, Zaditor®, Zyrtec®
Imodium A-D®, Maalox®, MiraLAX®, Mylanta®, Pepcid® AC, PeptoBismol®, Phillips®, Prilosec OTC®, Tagamet HB®, Tums®, Zantac®
Advil®, Aleve®, Bayer®, Excedrin®, Motrin®, Tylenol®
Nicorette®
The Company’s U.S.-based customers are major national and regional retail drug, supermarket and mass merchandisechains, including Walmart, CVS, Walgreens, Kroger, Target, Dollar General, Sam’s Club and Costco, and majorwholesalers, including McKesson.
The Consumer Healthcare segment employs its own sales forces to service larger customers and uses industry brokersfor some retailers. Field sales employees, with support from marketing and customer service, are assigned to specificcustomers in order to understand and work most effectively with the customer. They assist customers in developingin-store marketing programs for consumers and optimize communication of customers’ needs to the rest of theCompany. Industry brokers provide a distribution channel for some products, primarily those marketed under the GoodSense® label.
In contrast to national brand manufacturers, which incur considerable advertising and marketing expenditures targeteddirectly to the end consumer, the Consumer Healthcare segment’s primary marketing efforts are channeled throughits customers, the retailers and wholesalers, and reach the consumer through its customers’ in-store marketingprograms. These programs are intended to communicate store brand value to the consumer by increasing visibility ofstore brand products and inviting comparison to national brand products. Merchandising vehicles such as floor displays,bonus sizes, coupons, rebates, store signs and promotional packs are incorporated into customers’programs. Becausethe retailer profit margin for store brand products is generally higher than for national brand products, retailers andwholesalers often commit funds for additional promotions. The Company’s marketing efforts are also directed at newproduct introductions and product conversions, as well as providing market data. Market analysis and research is usedto monitor trends for products and categories and develop category management recommendations.
New Product Introductions and Drug Application Approvals
The Company launched various new products in fiscal 2011, most notably fexofenadine 180 mg tablets and naproxensodium soft gels, which compete with the national brands Allegra® tablets and Aleve® liquid gels, respectively. Netsales related to new products were $54,200 for fiscal 2011, $65,700 for fiscal 2010 and $317,300 for fiscal 2009. Infiscal 2009, the Company considered a Consumer Healthcare product to be new if it was added to the Company’sproduct lines within 18 months prior to the end of the period for which net sales are being measured, unless otherwisenoted. Starting in fiscal 2010, the Company shortened this period to 12 months.
In fiscal 2011, the Company, on its own or in conjunction with partners, received approval from the FDA for three OTCdrug applications. The applications were for loperamide liquid, minoxidil foam and ranitidine 150 mg tablets in regularand mint.
4

As of June 25, 2011, the Company, on its own or in conjunction with partners, had 14 OTC drug applications pendingapproval with the FDA.
Collaboration Agreements
The Company actively partners with other pharmaceutical companies to collaboratively develop, manufacture andmarket certain products or groups of products. These types of agreements are not uncommon in the pharmaceuticalindustry. The Company may choose to enter into these types of agreements to, among other things, leverage its orothers’ scientific research and development expertise or utilize its extensive marketing and distribution resources. SeeNote 1 of the Notes to Consolidated Financial Statements for more information regarding the Company’s method forrecognizing revenue and expenses related to collaboration agreements, as well as Note 19 of the Notes to ConsolidatedFinancial Statements for more information regarding the Company’s current collaboration agreements.
Competition
The market for OTC pharmaceutical products is highly competitive. Competition is based on a variety of factors,including price, quality and assortment of products, customer service, marketing support and availability of andapprovals for new products. The Company believes it competes favorably in these areas.
The Company’s competition in store brand products consists of several publicly traded and privately owned companies,including brand-name pharmaceutical companies. The competition is highly fragmented in terms of both geographicmarket coverage and product categories, such that a competitor generally does not compete across all product lines.Some of the Company’s competitors are Dr. Reddy’s Laboratories, Ltd., Watson Pharmaceuticals, Actavis Group hf.,Aaron Industries, Inc., Ohm Laboratories, Inc. and LNK International, Inc. The Company’s store brand products alsocompete with nationally advertised brand-name products. Most of the national brand companies have financialresources substantially greater than those of the Company. National brand companies could in the future manufacturemore store brand products or lower prices of their national brand products. Additionally, the competitive landscapemight change if generic prescription drug manufacturers elect to pursue OTC marketing status for products that haveswitched or are switching from Rx to OTC status.
NUTRITIONALS
The Nutritionals segment manufactures, markets and distributes store brand infant formula products, infant and toddlerfoods, vitamin, mineral and dietary supplement (VMS) products, and oral electrolyte solution products to retailers,distributors and consumers primarily in the U.S., Canada, Mexico and China. Similar to the Consumer Healthcaresegment, this business markets store brand products that are comparable in quality and formulation to the nationalbrand products. The cost to the retailer of a store brand product is significantly lower than that of a comparable nationallyadvertised brand-name product. The retailer, therefore, can price a store brand product below the competing nationalbrand product yet realize a greater profit margin. All infant formulas sold in the U.S. are subject to the same regulationsgoverning manufacturing and ingredients under the Infant Formula Act. Store brands, which are value priced and offersubstantial savings to consumers, must meet the same FDA nutritional requirements as the national brands.
Nutritionals Business
The Company is dedicated to being the leader in developing and marketing new store brand products and has aresearch and development staff that management believes is one of the most experienced in the industry at developingproducts comparable in formulation and quality to national brand products. This staff also responds to changes innational brand products by reformulating existing Company products. As part of its strategy, the Company relies onboth internal development and strategic product development agreements with outside sources.
All infant formulas sold in the U.S. are subject to the same regulations governing manufacturing and ingredients underthe Infant Formula Act. Store brands, which are value priced and offer substantial savings to consumers, must meetthe same FDA nutritional requirements as the national brands. Substantially all products are developed usingingredients and formulas comparable to those of national brand products. In most instances, packaging is designedto increase visibility of store brand products and to invite and reinforce comparison to national brand products in orderto communicate store brand value to the consumer.
The Company seeks to establish customer loyalty through superior customer service by providing a comprehensiveassortment of high quality, value priced products; timely processing, shipment and delivery of orders; assistance inmanaging customer inventories and support in managing and building the customer’s store brand business. TheCompany also seeks to establish customer loyalty by providing marketing support that is directed at developing
5

customized marketing programs for the customers’ store brand products. The primary objective of this store brand management approach is to enable customers to increase sales of their own store brand products by communicating store brand quality and value to the consumer. The Company’s sales and marketing personnel assist customers in the development and introduction of new store brand products and the promotion of customers’ ongoing store brand products by performing consumer research, providing market information and establishing individualized promotions and marketing programs.
The Nutritionals segment currently markets over 400 store brand products, with over 2,500 SKUs, to over 150 customers. The Company considers every different combination of size, flavor, formulation (e.g., milk-based, soy-based, etc.), strength and form (e.g., tablet, liquid, softgel, etc.) of a given item as a separate “product”.
Listed below are major Nutritional product categories under which the Company markets products for store brand labels; the annual retail market size for food, drug and mass merchandise retailers in the U.S., excluding Walmart and those classified as club stores and dollar stores (according to Information Resources, Inc.); and the names of certain national brands against which the Company’s products compete.
Product CategoriesDietary Supplements
Infant FormulasBaby & Toddler Foods
RetailMarket Size
(Billions)$ 3.3
$ 2.5$ 0.9
(1)
Comparable National BrandsCentrum®, Flintstones®, One-A-Day®, Caltrate®, Pedialyte®, Osteo Bi-Flex®
Similac®, Enfamil®, Gerber Good Start®, Earth’s Best®
Gerber®, Beechnut®, Earth’s Best®
(1) Does not include Special Supplemental Nutrition Program for Women and Children (WIC) market.
The Company’s U.S.-based customers are major national and regional retail drug, supermarket and mass merchandise chains, including Walmart, CVS, Walgreens, Kroger, Target, Dollar General, Sam’s Club and Costco, as well as major wholesalers, including McKesson.
The Nutritionals segment employs its own sales force to service larger customers and uses industry brokers for some retailers. Field sales employees, with support from marketing and customer service, are assigned to specific customers in order to understand and work most effectively with the customer. They assist customers in developing in-store marketing programs for consumers and optimize communication of customers’ needs to the rest of the Company.
The Nutritionals segment’s primary marketing efforts are channeled through its customers, the retailers and wholesalers, and reach the consumer through its customers’ in-store marketing programs and other customer specific vehicles. These programs are intended to increase visibility of store brand products and to invite comparisons to national brand products in order to communicate store brand value to the consumer. Merchandising vehicles such as floor displays, bonus sizes, coupons, rebates, store signs and promotional packs are incorporated into customers’ programs. Other traditional consumer marketing vehicles such as print advertising, direct mail and on-line communications are also employed to a limited extent. Because the retailer profit margin for store brand products is generally higher than for national brand products, retailers and wholesalers often commit funds for additional promotions. In addition to in-store marketing programs, the Nutritionals segment markets directly to consumers and healthcare professionals in an effort to drive initiation.
New Product Introductions
Net sales related to new products were approximately $16,500 for fiscal 2011, $4,500 for fiscal 2010 and $10,800 for fiscal 2009. In fiscal 2009, the Company considered a Nutritionals' product to be new if it was added to the Company’s product lines within 18 months prior to the end of the period for which net sales are being measured, unless otherwise noted. Starting in fiscal 2010, the Company shortened this period to 12 months.
Competition
The market for infant formula and nutritional products is highly competitive. Competition is based on a variety of factors, including price, quality and assortment of products, customer service, marketing support and availability of and approvals for new products. The Company believes it competes favorably in these areas.
The Company’s competition in store brand products consists of several publicly traded and privately owned companies, 6

including brand-name pharmaceutical companies. Some of the Company’s competitors for infant formula are AbbottLaboratories, Mead Johnson Nutrition Co. and Nestle S.A. Most of the national brand companies have financialresources substantially greater than those of the Company. National brand companies could in the future manufacturemore store brand products or lower prices of their national brand products. The Company competes in the VMS areawith a number of publicly traded and privately owned companies, some of which have broader product lines and largernutrition category sales volumes than that of the Company.
PRESCRIPTION PHARMACEUTICALS
The Rx Pharmaceuticals segment develops, manufactures and markets a portfolio of generic prescription drugs forthe U.S. market. The Company defines this portfolio as predominantly “extended topical” as it encompasses a broadarray of topical dosage forms such as creams, ointments, lotions, gels, shampoos, foams, suppositories, sprays,liquids, suspensions and solutions. The portfolio also includes certain oral liquids and oral solid forms.
Significant Developments
Subsequent to the Company's fiscal year end, on July 26, 2011, the Company completed the acquisition of substantiallyall of the assets of privately-held Paddock Laboratories, Inc. (Paddock) for approximately $547,000 in cash. TheCompany funded the transaction using a new $250,000 five-year term loan, $212,000 of cash on hand and $85,000from its accounts receivable securitization program. As of the end of the fourth quarter of fiscal 2011, the Companyhad incurred $2,560 of acquisition costs, of which $1,315, $695 and $550 were expensed in operations in the second,third and fourth quarters of fiscal 2011, respectively. Headquartered in Minneapolis, Minnesota, Paddock is amanufacturer and marketer of generic Rx pharmaceutical products. As part of closing the acquisition, the Companydivested a small portfolio of generic pharmaceutical products in response to the Federal Trade Commission (FTC)review. The acquisition expanded the Company’s generic Rx product offering, pipeline and scale and is expected toadd over $200,000 in sales on an annual basis.
On May 26, 2010, the Company announced that it acquired the pending ANDAfor the generic therapeutic-like equivalentof HalfLytely® and Bisacodyl tablets bowel prep kit from Novel Laboratories, Inc. (Novel) for $3,000 in cash and a$2,000 milestone payment based on tentative approval of the ANDA by the FDA. The milestone payment and the fullamount of the purchase price, which related to acquired research and development, was capitalized and immediatelywritten off as in-process research and development in the fourth quarter of fiscal 2010.
On April 13, 2010, the Company entered into an agreement to settle all existing patent litigation regarding the Company’sANDA filing for generic imiquimod. As part of this agreement, the Company was named Graceway Pharmaceuticals,LLC’s authorized generic distributor for the Aldara® product through February 24, 2011 and, under certaincircumstances, was able to launch its own generic product after that date. The parties amended their distributionagreement in the second quarter of fiscal 2011, when the Company obtained final approval of its ANDA. The Companybegan shipping the authorized generic version of the product in the fourth quarter of fiscal 2010 and switched to itsown generic product in the second quarter of fiscal 2011.
On March 31, 2010, the FDAapproved one of the pipeline products contained in the Company’s agreement with CobrekPharmaceuticals (Cobrek), a generic to Evoclin® foam, which had been submitted to the FDA in August 2008 with aParagraph IV certification. Upon receipt of the FDA approval, the Company immediately commenced shipping of theproduct. In addition, the Company and Cobrek agreed to settle the underlying Hatch-Waxman litigation brought byStiefel Laboratories (Stiefel), a subsidiary of GlaxoSmithKline. In accordance with the terms of the settlement, theCompany and Cobrek continued to ship product until April 2,2010, which resulted in the Company recognizing increasedrevenue in the fourth quarter of fiscal 2010. According to the terms of the settlement, the Company has taken a royalty-bearing license under patents owned or controlled by Stiefel. The Company recommenced shipments of the producton October 1, 2010.
On September 21, 2009, the Company acquired the ANDA for clindamycin phosphate (1%) and benzoyl peroxide(5%) gel from KV Pharmaceutical for $14,000 in cash and a $2,000 milestone payment to be made upon the successfulcompletion of a contingency. Successful completion of the contingency is expected by early fiscal 2012. This productis the equivalent of Duac® gel, which is marketed by Stiefel, and is indicated for the topical treatment of inflammatoryacne vulgaris. Excluding the milestone payment, the full amount of the purchase price, which related to acquiredresearch and development, was capitalized and immediately written off as in-process research and development inthe first quarter of fiscal 2010 because the ANDA had not received final FDA approval at the date of acquisition.
In November 2008, the Company acknowledged the settlement of patent litigation relating to a generic to Nasacort®
AQ (triamcinolone acetonide nasal spray) product marketed by Sanofi-Aventis against Teva Pharmaceutical Industries7

Ltd. (Teva) (formerly Barr Laboratories, Inc.), a partner with the Company for this product and the holder of the ANDA.The Company completed certain milestones with respect to the development of this product in the second fiscal quarterof 2009 that resulted in the recognition of $2,500 in revenue. On July 31, 2009, Teva received FDA final approval forits ANDA. This event triggered additional milestone payments for the Company that resulted in the recognition of anadditional $11,500 and $9,000 of revenue in fiscal 2010 and 2011, respectively. The product, which is being suppliedby the Company, was launched by Teva in June 2011, at which time the Company began recording its share of thenet profits from Teva's product sales.
Rx Business
The Company develops, manufactures and markets primarily generic topical prescription pharmaceuticals. Topicalproducts are manufactured at the Company’s New York and Israel facilities and are also sourced from various FDA-approved third parties. The Company also manufactures certain generic non-topical products, oral solids and oralliquids at its Michigan facilities. The Company’s current development areas include other delivery systems such asnasal sprays, oral liquids and transdermal products. Other areas of expertise include the production capabilities forvarious dosage forms such as tablets, capsules and liquids. Pharmaceuticals are manufactured, labeled and packagedin facilities that comply with strict regulatory standards, as well as meeting customers’ stringent requirements.
In addition, the Rx Pharmaceuticals segment offers OTC products through the prescription channel (referred to as“ORx®” marketing). ORx® products are OTC products that are available for pharmacy fulfillment and healthcarereimbursement when prescribed by a physician. The Company offers over 200 ORx® products that are reimbursablethrough many health plans, Medicaid and Medicare programs. When prescribed by a doctor or other health careprofessional, ORx® products offer consumers safe and effective remedies that provide an affordable alternative tohigher out-of-pocket costs of traditional OTC products. The Company’s ORx® strategy is to register OTC products forreimbursement through public and private health plans, as well as leverage its portfolio and pipeline of OTC productsfor generic substitution when appropriate.
Excluding the impact of the Paddock acquisition, the Company currently markets approximately 300 generic prescriptionproducts, with over 760 SKUs, to approximately 120 customers. A SKU for a generic prescription product is a uniquecombination of the product’s package size, ingredient strength and dosage form (e.g., tablet, syrup, cream, foam,ointment, gel, etc.). The Company generally holds the ANDA or product application for the drugs that it manufacturesor enters into an arrangement with the application holder for the manufacture and/or marketing of certain products.
Listed below are the major generic prescription products, including ORx® products, that the Company manufacturesand/or distributes:
8

Generic NameAdapalene creamAmmonium lactate cream and lotionBenzoyl peroxide gelCetirizine tablets and syrupCiclopirox shampooClindamycin phosphate solutionClindamycin phosphate foamClobetasol foamEconazole nitrate creamErythromycin and benzoyl peroxide gelErythromycin padsFluticasone ointment and creamGriseofulvin oral suspensionHalobetasol ointment and creamHydroquinone creamIbuprofen oral suspensionImiquimod creamKetoconazole shampooLevocetirizine tabletsMesalamine rectal suspension enemaMometasone cream, ointment and lotionMupirocin ointmentOmeprazole tabletsPermethrin creamSalicylic acid shampooSelenium sulfide shampooSodium sulfacetamide washTerconazole suppositoriesTretinoin cream and gelTriamcinolone acetonide nasal spray
Competitive Brand-Name DrugDifferin®
Lac-Hydrin®
Benzac®
Zyrtec®
Loprox®
CleocinT®
Evoclin®
Olux®
Spectazole®
Benzamycin®
Erycette®, T-Stat®
Cutivate®
Grifulvin V®
Ultravate®
Epiquin®
Motrin®
Aldara®
Nizoral®
Xyzal®
Rowasa®
Elocon®
Bactroban®
Prilosec®
Elimite®
Salex®
Selsun®
Ovace ®
Terazol 3®
Retin-A®
Nasacort® AQ
The Company’s U.S.-based customers are major wholesalers, including Cardinal Health, McKesson andAmerisourceBergen, as well as national and regional retail drug, supermarket and mass merchandise chains, includingWalgreens, Walmart, CVS, Rite Aid, Kroger and Safeway. Generic prescription drugs are sold to the consumer throughthe pharmacy counter of predominantly the same retail outlets as OTC pharmaceuticals and nutritional products.
New Product Introductions and Drug Application Approvals
The Company recently launched several new generic or authorized generic prescription products, includinglevocetirizine tablets and adapalene cream, which contain the same active ingredients present in the same dosageforms as Xyzal® and Differin® of UCB and Galderma, respectively. Net sales related to new products were approximately$81,100 for fiscal 2011, $34,600 for fiscal 2010 and $17,000 for fiscal 2009. An Rx Pharmaceuticals product isconsidered new if it was added to the Company’s product lines within 12 months prior to the end of the period for whichnet sales are being measured.
In fiscal 2011, the Company, on its own or in conjunction with partners, received final approval from the FDA for threegeneric prescription drug applications. The applications were for levocetirizine tablets, levonorgestrel tablets andimiquimod cream, 5%. As of June 25, 2011, the Company, on its own or in conjunction with partners, had 24 generic Rx drug applications
9

pending approval with the FDA.
Collaboration Agreements
The Company actively partners with other pharmaceutical companies to collaboratively develop, manufacture andmarket certain products or groups of products. These types of agreements are not uncommon in the pharmaceuticalindustry. The Company may choose to enter into these types of agreements to, among other things, leverage its orothers’ scientific research and development expertise or utilize its extensive marketing and distribution resources. SeeNote 1 of the Notes to Consolidated Financial Statements for more information regarding the Company’s method forrecognizing revenue and expenses related to collaboration agreements, as well as Note 19 of the Notes to ConsolidatedFinancial Statements for more information regarding the Company’s current collaboration agreements.
Competition
The market for generic prescription drugs is subject to intense competition from other generic drug manufacturers,brand-name pharmaceutical companies launching their own generic version of a branded product (known as anauthorized generic), manufacturers of branded drug products that continue to produce those products after patentexpirations and manufacturers of therapeutically similar drugs. Among the Company’s competitors in the topicalgenerics market are Actavis U.S., Fougera, Glenmark Generics Inc., Sandoz, Taro Pharmaceutical, Teva, Tolmar andTriax Pharmaceuticals, as well as brand-name pharmaceutical companies where the Company offers a genericequivalent.
The Company believes that one of its primary competitive advantages is its ability to introduce difficult to develop and/or manufacture topical generic equivalents to brand-name drug products. Generally, these products are exposed toless competition due to the relatively longer development, clinical trial and approval processes. In addition, the Companybelieves it has a favorable competitive position due primarily to its efficient distribution systems, topical productioneconomies of scale, customer service and overall reputation.
Price competition from additional generic versions of the same product, as well as potential price competition from theoriginal branded or authorized generic products, may result in a significant and/or rapid decline in sales and profitmargins. In addition, competitors may also develop their products more rapidly or complete the regulatory approvalprocess sooner and market their products earlier than the Company. New drugs and future developments in improvedand/or advanced drug delivery technologies or other therapeutic techniques may provide therapeutic or cost advantagesto competing products.
Many brand-name competitors try to prevent, discourage or delay the use of generic equivalents through variousmeasures, including introduction of new branded products, legislative initiatives, changing dosage forms or dosingregimens just prior to introduction of a generic equivalent, regulatory processes, filing new patents or patent extensions,law suits, citizens’petitions and negative publicity. In addition, brand-name companies sometimes launch, either throughan affiliate or licensing arrangements with another company, an authorized generic at or near the time the first genericproduct is launched depriving the generic product marketed of exclusivity intended by the Hatch-Waxman Amendmentsto the Federal Food, Drug and Cosmetic Act (Hatch-Waxman). See Information Applicable to All Reported Segments– Government Regulation – U.S. Food and Drug Administration below.
Many of the Company’s customers, which include chain drug stores, wholesalers, distributors, hospital systems andgroup purchasing organizations, continue to merge or consolidate. In addition, a number of its customers have institutedsource programs limiting the number of suppliers of generic pharmaceutical products carried by that customer. As aresult of these developments, heightened competition exists among generic drug producers for business from thissmaller and more selective customer base.
ACTIVE PHARMACEUTICAL INGREDIENTS
The Company develops, manufactures and markets API used worldwide by the generic drug industry and brandedpharmaceutical companies. Certain of these ingredients are used in its own pharmaceutical products. Themanufacturing of these API occurs primarily in Israel. In addition, the Company is in the process of transitioning certainAPI products previously manufactured in Germany to its new facility in India, as discussed below.
Significant Developments
Over the past several years, the Company has been developing the API temozolomide for various finished dosepartners in several global markets. In the third quarter of fiscal 2010, the Company launched temozolomide into the
10

European market. On February 2, 2010, the Company announced that it would exclusively supply Teva with the APIfor the generic version of Temodar® (temozolomide) in the U.S. market. Teva will manufacture, market and distributethe product in the U.S., and the Company will share equally with Teva in the profitability of the product sold. Teva wasthe first company to file an ANDA that contained a Paragraph IV certification for Temodar® and is eligible to receive180-day Hatch-Waxman statutory exclusivity to market this product in the U.S. On January 26, 2010, the United StatesDistrict Court for the District of Delaware held that the patent protecting temozolomide was unenforceable. On March 1,2010, the FDAgranted final approval to the TevaANDA, but Tevadid not launch the product at that time. Merck appealedthe ruling and on November 9, 2010, the appeals court reversed the trial decision, preventing the launch of the Tevaproduct. Teva filed a petition for the entire appeals court to rehear the case, and on February 29, 2011 the court deniedthe motion. Teva is considering whether to appeal the appeals court ruling to the United States Supreme Court. Byagreement reached between Teva and Merck, Teva will not be able to launch the product until August 2013, except inlimited circumstances. The Company expects its share in the profits of the product could have a material positiveimpact on its operating results; however, the magnitude and timing of the profits the Company could realize are uncertainand are subject to factors beyond the Company's control, including, but not limited to, the timing of the product launchdate by Teva in the U.S.
In the fourth quarter of fiscal 2009, the Company evaluated the API business in the context of the expected futurecompetitive dynamics in API and the Company’s strategic focus on specialty molecules and vertical integration.Management determined that the German API facility was no longer competitive from a global cost position. At thattime, the Company did not anticipate that there would be a viable market for the sale of this facility and related operations,and accordingly, the Company planned to cease all operations at the facility during the first quarter of fiscal 2011.During the third quarter of fiscal 2010, however, the Company was approached by an external party who offered tobuy the German API facility and related operations from the Company. Subsequent to the third quarter of fiscal 2010,the Company signed an agreement and closed the transaction with the third-party buyer for the sale of the GermanAPI facility and related operations. As part of its German restructuring plan, the Company incurred net charges of$6,775 and $2,049 in the third and fourth quarters of fiscal 2010, respectively. See Note 18 of the Notes to ConsolidatedFinancial Statements for additional information regarding the sale of the German API facility and related operations.
To further improve the long-term cost position of its API business, on August 6, 2009, the Company acquired an 85%stake in Vedants Drug & Fine Chemicals Private Limited (Vedants), an API manufacturing facility in India, for $11,500in cash. The facility, located approximately 30 miles outside of Mumbai, is currently under construction and willmanufacture the Company’s current and future high-volume API products, as well as expand the Company’s verticalintegration of Rx and future candidate Rx-to-OTC switch products. Manufacturing of API at this facility is expected tobegin in the second half of fiscal 2012 and will include certain API products currently manufactured in Israel and thosethat had been manufactured in Germany.
The Company actively enters into exclusive marketing and sales agreements (dossier agreements) related to specificproduct formulations, for specific geographic areas, for specific periods of time. The Company recognized revenuerelated to certain dossier agreements of approximately $500, $9,100 and $600 in fiscal 2011, 2010 and 2009,respectively. The Company intends to continue pursuing similar types of agreements in the future.
API Business
The API business identifies APIs that will be critical to its pharmaceutical customers’ future product launches and thenworks closely with these customers on the development processes.
API development is focused on the synthesis of less common molecules for the U.S., European and other internationalmarkets. The Company is also focusing development activities on the synthesis of molecules for use in its own OTCand Rx pipeline products. This vertical integration may enable the Company to be more competitive on pricing of itsother product lines and to broaden its growth and profit opportunities. The Company believes it has a competitiveadvantage in its ability to produce difficult-to-develop products through its understanding of regulatory issues, patents,and chemistry. Because of the difficulty in developing these products and the related regulatory challenges, the leadtime to market a product can be long. The Company’s ability to continue to develop and market new products thathave lower levels of competition is key to driving profitability in the API business.
The API business sells to customers who face similar regulatory oversight as the Company’s Rx Pharmaceuticalsbusiness. As a result, the API business is dependent on these customers’ ability to obtain proper product approvalsand maintain regulatory compliance with the FDA, the FTC, and the U.S. Drug Enforcement Administration (DEA), aswell as several foreign, state and local agencies in localities in which the Company’s products are sold.
Because the Company’s API customers depend on high quality supply and regulatory support, the Company focuses11

on rigorous quality assurance, quality control and regulatory compliance as part of its strategic positioning. TheCompany’s quality system is designed to comply with the regulatory requirements of the FDA, the European MedicinesAgency and the AustralianTherapeuticGoods Administration.TheCompany is regularly inspected by various regulatoryauthorities and customers.
The Company places a high priority on responding to client needs and requirements from project initiation throughfinal production. It offers support throughout the development stage, preparation of Drug Master Files (DMF) andassistance throughout the approval process. The API segment is supported by sales offices in the U.S. and Israel andsales agents in various other countries.
The Company currently manufactures and markets to generic and branded pharmaceutical companies worldwide thefollowing API products:
Ammonium lactateAnastrozoleAzacitidineCetirizine dihydrochlorideCilostazolCisatracuriumDonepezil hydrochlorideExemestaneFenofibrateFlumazenilFluticasone propionateGemcitabineGranisetron hydrochlorideHalobetasolImiquimodLamotrigineLetrozole
Levocetirizine dihydrochlorideMidazolam baseMidazolam hydrochlorideMidazolam maleateModafinilMometasone furoateMontelukast sodiumMoxonidinePentoxifyllinePramipexole dihydrochlorideR-ModafinilRocuronium bromideTemozolomideTerbinafine hydrochlorideTramadol hydrochlorideZonisamide
New Product Introductions
Net sales related to new products were approximately $32,000 for fiscal 2011, $15,300 for fiscal 2010, and $4,900 forfiscal 2009. Fiscal 2011 new product sales primarily relate to sales of temozolomide to the European market, whichthe Company launched during the third quarter of fiscal 2010. An API product is considered new if it was added to theCompany’s product lines or sold to a new geographic area with different regulatory authorities within 12 months priorto the end of the period for which net sales are being measured.
Competition
The API segment operates in a highly competitive, price sensitive market in which the Company’s customers continueto consolidate and/or vertically integrate, thereby creating a smaller customer base. Since other manufacturers of APItypically do not offer all of the same product lines or serve all of the same markets as the Company’s API segment,the segment competes on a product-by-product basis with a number of different competitors. The Company’s APIbusiness is subject to increased price competition from other manufacturers of API located mostly in India, China andEurope. This competition may result in the loss of API clients and/or decreased profitability in this business segment.However, the Company believes that its regulatory position, market reputation, client relationships and ability tomanufacture difficult-to-develop API provide it with a favorable competitive position.
OTHER
The Company has an Other category comprised of Israel Pharmaceutical and Diagnostic Products, which does notmeet the quantitative threshold required to be a separately reportable segment. Israel Pharmaceutical and DiagnosticProducts includes the marketing and manufacturing of branded prescription drugs under long-term exclusive licenses
12

and the importation of pharmaceutical, diagnostics and other medical products into Israel based on exclusiveagreements with the manufacturers.
Asset Acquisitions
On July 1, 2009, the Company’s Israel Pharmaceutical and Diagnostic Products operating segment entered into adistribution agreement with a major global diagnostic company. In conjunction with this distribution agreement, theCompany acquired certain pharmaceutical diagnostic assets from a local pharmaceutical company for $4,610. Inaddition, on November 2, 2009, in connection with this same distribution agreement, the Company’s IsraelPharmaceutical and Diagnostic Products operating segment acquired certain pharmaceutical diagnostic assets fromanother local pharmaceutical company for $5,152. These acquisitions enhanced the Company’s product portfolio andstrengthened its position as the leader in the Israeli pharmaceutical diagnostic market. The assets acquired in thesetransactions consist primarily of intangible assets associated with customer supply contracts, machinery and equipmentand inventory.The assets acquired in connection with the July and November distribution agreements and the operatingresults generated therefrom were included in the Other category in the Company’s consolidated financial statementsbeginning in the first and second quarter of fiscal 2010, respectively.
Discontinued Operations
In March 2009, the Company committed to a plan to sell its Israel Consumer Products business. Israel ConsumerProducts consisted of cosmetics, toiletries, bar soaps and detergents generally sold under the Company’s brand namesCareline®, Neca® and Natural Formula®. The financial results of this business, which were previously reported as partof the Company’s Other category, have been classified as discontinued operations in the consolidated financialstatements for all periods presented. The assets and liabilities of this business are reflected as assets and liabilitiesof discontinued operations in the consolidated balance sheets for all periods presented. On February 26, 2010, theCompany completed the sale of its Israel Consumer Products business to Emilia Group, a subsidiary of O. FellerHoldings Ltd., for approximately $47,000, of which approximately $11,000 is contingent upon satisfaction of contingencyfactors specified in the agreement. After finalization of post-closing working capital adjustments in the third quarter offiscal 2011, the sale resulted in a pre-tax loss of $1,407. See Note 3 of the Notes to Consolidated Financial Statementsfor additional information regarding discontinued operations.
Competition
The Company’s Other category operates in competitive markets. These markets are based primarily in Israel but arealso subject to competition from large multi-national companies looking to expand their position in the local Israelimarket. In most instances, these companies are significantly larger than the Company on a global basis with greaterfinancial resources and product lines. The Company also has several significant product supply agreements withoutside vendors. As a result, the Company’s competitive position is largely dependent on its ability to maintain theseagreements. The Company believes that its competitive advantages consist of its historical knowledge of the localmarkets and strong local brand recognition.
INFORMATION APPLICABLE TO ALL REPORTABLE SEGMENTS
Research and Development
Research and development are key components of the Company’s business strategy and, while managed centrallyon a global basis, are performed in various locations in the U.S. and abroad. Development for both the ConsumerHealthcare and Nutritionals' markets focuses on products comparable in formulation, quality and effectiveness toexisting national brand OTC products, nutritional supplement products, infant formulas and Rx-to-OTC switch products.Development of generic prescription drugs, primarily for the U.S. market, focuses on complex formulations, many ofwhich require costly clinical endpoint trials. Development of API for the global market also focuses on complex productswith high barriers to entry. While the Company conducts a significant amount of its own research and development, italso enters into strategic alliance agreements to obtain the rights to manufacture and/or distribute new products.
Research and development spending was $89,250 for fiscal 2011, $83,515 for fiscal 2010 and $76,783 for fiscal 2009.In addition, fiscal 2010 included charges of $14,000 and $5,000 for the write-offs of in-process research anddevelopment related to the ANDAsacquired from KV Pharmaceuticals and Novel, respectively,and fiscal 2009 includeda $279 charge for the write-off of in-process research and development related to the Diba acquisition. The fiscal 2011and 2010 increases in research and development costs were both due to increased investment in the developmentof new drugs, primarily in the Consumer Healthcare segment, along with incremental research and developmentassociated with acquisitions in fiscal 2011 and 2010. The Company anticipates that research and development
13

expenditures, including legal costs associated with defending Paragraph IV patent litigation, will increase above fiscal 2011 levels in dollar terms but remain relatively flat as a percentage of sales in the foreseeable future as the Company continues to cultivate its presence in the generic pharmaceutical market and to develop its internal research and development capabilities.
Trademarks and Patents
The Company owns certain trademarks and patents; however, its business as a whole is not materially dependent upon its ownership of any one trademark or patent or group of trademarks or patents.
Significant Customers
The Company believes its primary customer base aligns with the concentration of large drug retailers in the current marketplace of the retail drug industry. Walmart accounted for 22% of consolidated net sales for fiscal 2011, 23% for fiscal 2010 and 23% for fiscal 2009. Should Walmart’s current relationship with the Company change adversely, the resulting loss of business would have a material adverse impact on the Company’s consolidated operating results and financial position. The Company does not anticipate such a change in the foreseeable future. In addition, while no other customer individually comprises more than 10% of total net sales, the Company does have other significant customers. If the Company’s relationship with one or more of these other customers, including the terms for doing business with the customers, changes significantly, it could have a material adverse impact on the Company’s financial position and results of operations.
Manufacturing and Distribution
The Company’s primary manufacturing facilities are located in the U.S. and Israel (see Item 1A. Risk Factors – Conditions in Israel for further information). The Company also has secondary manufacturing facilities located in the U.K., Mexico and Australia, along with joint ventures located in China and India. The Company supplements its production capabilities with the purchase of product from outside sources. During fiscal 2011, the approximate average capacity utilization was 85% and 87% for the Company’s facilities in the U.S. and Israel, respectively. The capacity of some facilities may be fully utilized at certain times due to various reasons, such as customer demand, the seasonality of the cough/cold/flu season and new product launches. The Company may utilize available capacity by contract manufacturing for other companies.
The Company has logistics facilities located in the U.S., Israel, the U.K., Mexico and Australia. Both contract freight and common carriers are used to deliver products.
Seasonality
Revenues in the Company’s Consumer Healthcare segment are generally subject to the seasonal demands for cough/cold/flu and allergy products in its second and third fiscal quarters. Historically, the Company’s sales of these products have varied from year to year based in large part on the severity and length of the cough/cold/flu season. While the Company believes that the severity and length of the cough/cold/flu season will continue to impact its sales of cough/cold/flu and allergy products, there can be no assurance that the Company’s future sales of these products will necessarily follow historical patterns. Revenues for the Nutritionals, Rx Pharmaceuticals and API segments, as well as the Other category, are generally not impacted significantly by seasonal conditions.
Materials Sourcing
High quality raw materials and packaging components are essential to all of the Company’s business units due to the nature of the products it manufactures. Raw materials and packaging components are generally available from multiple suppliers. While the Company has the ability to manufacture and supply certain API materials for the Consumer Healthcare and Rx Pharmaceuticals segments, certain components and finished goods are purchased rather than manufactured because of temporary production limitations, FDA restrictions or economic and other factors. Supplies of certain raw materials, bulk tablets and components are limited, or are available from one or only a few suppliers. Historically, the Company has been able to react to situations that require alternate sourcing. Should alternate sourcing be required, FDA requirements placed on products approved through the ANDA or NDA process could substantially lengthen the approval of an alternate source and adversely affect financial results. The Company has good, cooperative working relationships with substantially all of its suppliers and has historically been able to capitalize on economies of scale in the purchase of materials and supplies due to its volume of purchases.
Environmental
The Company is subject to various environmental laws and regulations. The Company believes that the costs for
14

complying with such laws and regulations will not be material to the business of the Company. The Company doesnot have any material remediation liabilities outstanding.
In March and June of 2007, lawsuits were filed by three separate groups against both the State of Israel and the Councilof Ramat Hovav in connection with waste disposal and pollution from several companies, including the Company, thathave operations in the Ramat Hovav region of Israel. These lawsuits were subsequently consolidated into a singleproceeding in the District Court of Beer-Sheva. The Council of Ramat Hovav in June 2008, and the State of Israel, inNovember 2008, asserted third party claims against several companies, including the Company. The pleadings allegea variety of personal injuries arising out of the alleged environmental pollution. Neither the plaintiffs nor the third partyclaimants were required to specify a maximum amount of damages, but the pleadings allege damages in excess of$72,500, subject to foreign currency fluctuations between the Israeli shekel and the U.S. dollar. While the Companyintends to vigorously defend against these claims, the Company cannot reasonably predict at this time the outcomeor the liability, if any, associated with these claims.
Government Regulation
The manufacturing, processing, formulation, packaging, labeling, testing, storing, distributing, advertising and sale ofthe Company’s products are subject to regulation by one or more U.S. agencies, including the FDA, the FTC, the DEAand the Consumer Product Safety Commission (CPSC), as well as several foreign, state and local agencies in localitiesin which the Company’s products are sold. In addition, the Company manufactures and markets certain of its productsin accordance with standards set by organizations, such as the United States Pharmacopeial Convention, Inc. (USP)and NSF International (NSF). The Company believes that its policies, operations and products comply in all materialrespects with existing regulations.
U.S. Food and Drug Administration
The FDA has jurisdiction over the Company’s ANDA, NDA and OTC monograph drug products, dietary supplements,infant formulas and medical food products. The FDA’s jurisdiction extends to the manufacturing, testing, labeling,packaging, storage and distribution of these products.
OTC and Generic Prescription Pharmaceuticals. Many of the Company’s OTC pharmaceutical products are regulatedunder the OTC monograph system and subject to certain FDA regulations. OTC monographs have been establishedthrough the FDA’s OTC Review utilizing the notice-and-comment rulemaking procedures. Under the OTC monographsystem, selected OTC drugs are generally recognized as safe and effective and do not require the submission andapproval of an ANDAor NDAprior to marketing. The FDAOTC monographs include well-known ingredients and specifyrequirements for permitted indications, required warnings and precautions, allowable combinations of ingredients anddosage levels. Drug products marketed under the OTC monograph system must conform to specific quality, formulaand labeling requirements; however, these products generally can be developed with fewer regulatory hurdles thanthose products that require the filing of an ANDA or NDA. It is, in general, less costly to develop and bring to marketa product produced under the OTC monograph system. From time to time, adequate information may become availableto the FDA regarding certain ANDA or NDA drug products that will allow the reclassification of those products as nolonger requiring the approval of an ANDAor NDAprior to marketing. For this reason, there may be increased competitionand lower profitability related to a particular product should it be reclassified to the OTC monograph system. In addition,regulations may change from time to time, requiring formulation, packaging or labeling changes for certain products.The Company cannot predict whether new legislation regulating the Company’s activities will be enacted or what effectany legislation would have on the Company’s business.
The Company also markets generic prescription drugs and other products that have switched from prescription to OTCstatus through an application process initiated by the innovator company that holds the original clinical trial data. Theseproducts require approval by the FDAthrough its ANDAor NDAprocesses prior to commercialization. Based on currentFDA regulations, ANDAs and NDAs provide information on chemistry, manufacturing and change control,bioequivalence, packaging and labeling. The development process for a generic drug generally requires less timeand expense than the development process for a new drug. For approval of an ANDA, the Company must demonstratethat the product is bioequivalent to a marketed product that has previously been approved by the FDA and that theCompany’s manufacturing process meets FDA standards. The approval process for an ANDA may require thatbioequivalence studies be performed using a small number of subjects in a controlled clinical environment, and forcertain topical generic products, demonstration of efficacy in comparative full end-point clinical studies. Depending onthe specific product, other types of studies may be required by the FDA. Approval time for the industry currentlyaverages 31 months from the date an ANDA is submitted, an increase from 26.7 months a year ago. Changes to aproduct marketed under an ANDA or NDA are governed by specific FDA regulations and guidelines that define when
15

proposed changes can be implemented and whether prior FDA notice and/or approval is required.
Under the Drug Price Competition and Patent Term Restoration Act of 1984 (the Hatch-Waxman Amendments to the Federal Food, Drug and Cosmetic Act), a company submitting an NDA can obtain a three-year period of marketing exclusivity for an Rx product or an Rx to OTC switch product if the company performs a clinical study that is essential to FDA approval of the NDA. Longer periods of exclusivity are possible for new chemical entities and orphan drugs. These exclusivity periods prevent other companies from obtaining approval of any ANDAs for a similar or equivalent generic product. Where three years of exclusivity is granted to the initiating company, the Company will be unable to market the product unless the Company establishes a relationship with the company having exclusive marketing rights. There can be no assurance that, in the event the Company applies for FDA approvals, the Company will obtain the approvals to market Rx, Rx to OTC switch products or OTC ANDA products or, alternatively, that the Company will be able to obtain these products from other manufacturers.
Under the Federal Food, Drug and Cosmetic Act (FFDCA), a manufacturer may obtain an additional six months (which, under certain circumstances, may be extended to one year) of exclusivity if the innovator conducts pediatric studies requested by the FDA on the product. This exclusivity will, in certain instances, delay FDA approval and the sales by the Company of certain ANDA and other products.
If the Company is first to file its ANDA and meets certain requirements relating to the patents owned or licensed by the brand company, the Company may be entitled to a 180-day generic exclusivity period for that product. When a company submits an ANDA, the company is required to include a patent certification to certain patents that are identified with the innovator product. If the ANDA applicant challenges the validity of the innovator’s patent or certifies that its product does not infringe the patent, the product innovator may sue for infringement. The legal action would not ordinarily result in material damages but could prevent the Company from introducing the product if it is not successful in the legal action. The Company would, however, incur the cost of defending the legal action and that action could have the effect of triggering a statutorily mandated delay in FDA approval of the ANDA for a period of up to 30 months from when the innovator was notified of the patent challenge. In addition, if exclusivity is granted to the Company, there can be no assurance that the Company will be able to market the product at the beginning of the exclusivity period or that the exclusivity will not be shared with other generic companies, including authorized generics. It is possible that more than one applicant files the first ANDA on the same day and exclusivity is shared. This may happen by chance, but more likely when there is a certain type of innovator exclusivity that prevents the filing of all ANDAs until a specific date. As a result of events that are outside of the Company’s control, the Company may forfeit its exclusivity. Finally, if the Company is not first to file its ANDA, the FDA may grant 180-day exclusivity to another company, thereby effectively delaying the launch of the Company’s product.
The Company’s prescription drug products that are marketed without approved applications must meet certain manufacturing and labeling standards established by the FDA. The FDA’s policy with respect to the continued marketing of unapproved products is stated in the FDA’s June 2006 compliance policy guide, titled “Marketed New Drugs without Approved NDAs or ANDAs.” Under this policy, the FDA has stated that it will follow a risk-based approach with regard to enforcement against such unapproved products. The FDA evaluates whether to initiate enforcement action on a case-by-case basis, but gives higher priority to enforcement action against products in certain categories, such as those marketed as unapproved drugs with potential safety risks or that lack evidence of effectiveness. The FDA recognizes that certain unapproved products, based on the introduction date of their active ingredients and the lack of safety concerns, among other things, have been marketed for many years and, at this time, might not be subject to immediate enforcement action. See further information in Item 1A. Risk Factors.
All facilities where Rx and OTC drugs are manufactured, tested, packaged, stored or distributed must comply with FDA cGMPs and regulations promulgated by competent authorities in the countries where the facilities are located. All of the Company’s drug products are manufactured, tested, packaged, stored and distributed according to cGMP regulations. The FDA performs periodic audits to ensure that the Company’s facilities remain in compliance with all appropriate regulations. The failure of a facility to be in compliance may lead to a breach of representations made to store brand customers or to regulatory action against the Company related to the products made in that facility, including suspension of or delay in ANDA approvals, seizure, injunction or recall. Serious product quality concerns could also result in governmental actions against the Company that, among other things, could result in the suspension of production or distribution of the Company’s products, product seizures, loss of certain licenses or other governmental penalties, and could have a material adverse effect on the Company’s financial condition or operating results. In addition, several bills have been introduced in Congress that could, if enacted, affect the manufacture and marketing of Rx and OTC drugs. The Company cannot predict whether new legislation regulating the Company’s activities will be enacted or what effect any legislation would have on the Company’s business.
The Company submits a DMF for active pharmaceutical ingredients to be commercialized in the U.S. The DMF filings
16

provide an efficient mechanism for FDA review while protecting the Company’s proprietary information related to themanufacturing process. The manufacturing facilities are inspected by the FDA to assess cGMP compliance. Themanufacturing facilities and production procedures utilized at the manufacturing facilities must meet current FDA GoodManufacturing Practice (GMP) standards before products may be exported to the U.S. For European markets, theCompany submits a European DMF and, where applicable, obtains a certificate of suitability from the EuropeanDirectorate for the Quality of Medicines. The manufacturing facilities and production procedures for API marketed inEurope must meet EU-GMP and European Pharmacopeia standards.
Infant Formula. The FDA’s Center for Food Safety and Applied Nutrition is responsible for the regulation of infantformula. The Office of Nutritional Products, Labeling and Dietary Supplements (ONPLDS) has program responsibilityfor infant formula, while the Office of Food Additive Safety (OFAS) has program responsibility for food ingredients andpackaging. The ONPLDS evaluates whether the infant formula manufacturer has met the requirements under theFFDCA and consults with the OFAS regarding the safety of ingredients in infant formula and of packaging materialsfor infant formula.
All manufacturers of pediatric nutrition products must begin with safe food ingredients, which are either generallyrecognized as safe or approved as food additives. The specific requirements for infant formula are governed by theInfant Formula Act of 1980, as amended (Formula Act). The purpose of the Formula Act is to ensure the safety andnutrition of infant formulas, including minimum, and in some cases, maximum levels of specified nutrients.
Once an infant formula product is formulated, the manufacturer must provide regulatory agencies assurance of thenutritional quality of that particular formulation before marketing the infant formula. The FDA has establishedrequirements for certain labeling, nutrient content, manufacturer quality control procedures (to assure the nutrientcontent of infant formulas), as well as for company records and reports. A manufacturer must notify the FDA 90 daysbefore the first processing of any infant formula that differs fundamentally in processing or in composition from anyprevious formulation produced by the manufacturer. The FDA currently is finalizing incremental good manufacturingpractices, quality control procedures, quality factors, notification requirements, and reports and records, for theproduction of infant formulas. The Company is monitoring the situation and will make appropriate adjustments to remainin compliance.
In addition, as part of its responsibility to implement the provisions of the FFDCA, the FDA continuously monitors infantformula products. The FFDCA requires infant formula manufacturers to test product composition during productionand shelf-life, to keep records on production, testing and distribution of each batch of infant formula and to use goodmanufacturing practices and quality control procedures. In addition, the FFDCA requires infant formula manufacturersto maintain records of all complaints, some of which are reviewed to reveal the possible existence of a hazard to health.The FDA conducts yearly inspections of all facilities that manufacture infant formula. The FDA also inspects newfacilities during early production runs. As part of the inspection, the FDAcollects and analyzes samples of infant formula.
Dietary Supplements. The Dietary Supplement Health and Education Act of 1994 (DSHEA) amended the FFDCA to,among other things: (1) define dietary supplements and dietary ingredients, (2) require ingredient and nutrition labelingfor dietary supplements, (3) permit “structure/function” statements for dietary supplements, (4) permit the display ofcertain published literature where supplements are sold, (5) authorize the FDAto establish GMPs specifically for dietarysupplements, and (6) require the submission of New Dietary Ingredient notification to the FDA.
The DSHEA provides specific nutrition labeling requirements for dietary supplements that are slightly different thanthose for conventional foods. All supplements must bear a “Supplement Facts” box, which must list all of thesupplement’s dietary ingredients using nomenclature as specified in FDA regulations. DSHEA also permits dietarysupplements to bear statements (1) claiming a benefit related to a classical nutrient deficiency disease, provided theprevalence of the disease in the U.S. is disclosed, (2) describing the role of a nutrient or dietary ingredient intendedto affect the structure or function in humans, (3) characterizing the documented mechanism by which a nutrient ordietary ingredient acts to maintain such structure or function, and (4) describing general well-being from consumptionof a nutrient or dietary ingredient. The Company is subject to regulations published by the FDA clarifying the types of“structure function” statements permissible in dietary supplement labeling. Such statements cannot expressly orimplicitly state that a dietary supplement has any effect on a “disease.”
As with foods in general, dietary supplement labeling may include a “health claim,” which characterizes the role of anutrient to a disease or health-related condition. There are two types of health claims: (1) health claims authorized byFDA regulations based on significant scientific agreement among qualified scientific experts, and (2) “qualified healthclaims,” which may be made with a lower level of substantiation, provided that the FDA does not object to the claims.In each case, the health claim must be reviewed and approved by the FDA before it may be used.
17
On June 25, 2007, the FDA issued Final GMP Regulations specific to Dietary Supplements, which became effectiveas they relate to the Company on June 25, 2008. The Company continues to invest in its Dietary Supplement operationsto ensure compliance with the regulations. The FDA began inspecting the industry after the June 25, 2008 compliancedate. The Company continuously monitors FDA activities, including publicly available inspection reports of othercompanies’ inspections, to ensure that its operations and quality systems are maintained in a state of compliancebased on the current interpretation of the regulations. The Company has not yet been inspected and cannot determinewith certainty what effects the FDA’s future interpretations of the regulations will have on its business. The GMPregulations and FDA’s future interpretations of these regulations could, among other things, require expandeddocumentation of the manufacturing processes for certain products or additional analytical testing for certainingredients. In addition, several bills have been introduced in Congress that could, if enacted, affect the manufactureand marketing of dietary supplements. The Company cannot predict whether new legislation regulating the Company’sactivities will be enacted or what effect any legislation would have on the Company’s business.
The DSHEA requires that the FDA be notified at least 75 days in advance of the introduction of a dietary supplementthat contains a dietary ingredient that was introduced to market after October 15, 1994 or was present in the foodsupply in a form where the food had not been chemically altered. The notification must provide information establishingthat the dietary supplement containing the dietary ingredient will reasonably be expected to be safe.
U.S. Drug Enforcement Administration
The DEA regulates certain drug products containing controlled substances, such as testosterone, and List I chemicals,such as pseudoephedrine, pursuant to the federal Controlled Substances Act (CSA). The CSA and DEA regulationsimpose specific requirements on manufacturers and other entities that handle these substances including registration,recordkeeping, reporting, storage, security and distribution. Recordkeeping requirements include accounting for theamount of product received, manufactured, stored and distributed. Companies handling either controlled substancesor List I chemicals are also required to maintain adequate security and to report suspicious orders, thefts and significantlosses. The DEA periodically inspects facilities for compliance with the CSA and its regulations. Failure to comply withcurrent and future regulations of the DEA could lead to a variety of sanctions, including revocation or denial of renewalof DEA registrations, injunctions, or civil or criminal penalties.
The Company is subject to the requirements of the CSAand DEAregulations in the handling of any controlled substancesin schedules II – V or any of the List I chemicals identified in the CSA. Specifically, the Company is subject to regulationin the current manufacture and distribution of products containing pseudoephedrine, a List I chemical. As a result ofa series of amendments to the CSA, the DEA has imposed increased restrictions on the manufacture and distributionof pseudoephedrine products. For example, the Comprehensive Methamphetamine Control Act of 1996 was enactedto authorize the DEA to monitor transactions involving chemicals that may be used illegally in the production ofmethamphetamine. The Comprehensive Methamphetamine Control Act of 1996 establishes certain registration andrecordkeeping requirements for manufacturers of OTC cold, allergy, asthma and diet medicines that contain ephedrine,pseudoephedrine or phenylpropanolamine (PPA). While certain of the Company’s OTC drug products containpseudoephedrine, which is a common ingredient in decongestant products, the Company’s U.S. products containneither ephedrine nor PPA.
In addition, the Reauthorization Act of 2005, signed into law on March 9, 2006, prevented the existing provisions ofthe Patriot Act from expiring and also included the Combat Methamphetamine Epidemic Act. This law further amendedthe CSA and provided additional requirements on the manufacture, distribution and sale of pseudoephedrine products.Among the various provisions, this national legislation places certain restrictions on the purchase and sale of all productsthat contain ephedrine, pseudoephedrine or PPA (List I chemical products). The CSA also imposed import andprocurement quotas for List I chemicals, including pseudoephedrine.
The CSA, as amended, also imposed daily restrictions on the amount of List I chemical products a retailer may sell toa consumer (3.6 grams per day) and limitations on the amount of List I chemical products a consumer may purchase(9.0 grams) over a 30-day period. Further, effective September 30, 2006, the Act requires that (a) retail sellers maintaina logbook that tracks the sales of List I chemical products to individuals, and (b) purchasers provide valid identificationin order to purchase List I chemical products. Many states have also enacted legislation regulating the manufactureand distribution of pseudoephedrine products. The Company is subject to these state requirements as well.
Medicaid Drug Rebate Program and Other Drug Pricing Programs
Federal law requires that a pharmaceutical manufacturer, as a condition of having federal funds being made availableto the states for the manufacturer’s drugs under Medicaid and Medicare Part B, must enter into a rebate agreementto pay rebates to state Medicaid programs for the manufacturer’s covered outpatient drugs that are dispensed to
18

Medicaid beneficiaries and paid for by a state Medicaid program under a fee-for-service arrangement. The Centersfor Medicare and Medicaid Services (CMS) is responsible for administering the Medicaid rebate agreements betweenthe federal government and pharmaceutical manufacturers. Rebates are also due on the utilization of Medicaidmanaged care organizations.
Drug manufacturers’ Medicaid rebate agreements, which are between each manufacturer and the Secretary of Healthand Human Services, provide that the drug manufacturer will remit rebates to each state Medicaid agency on a quarterlybasis. Those rebates are based on pricing data reported by manufacturers to CMS on both a monthly and a quarterlybasis, including Average Manufacturer Price (AMP) and Best Price. Recently enacted health reform legislation changedthe definition of AMP effective the fourth quarter of calendar 2010. Pursuant to the same legislation, effective for rebateperiods beginning with the first quarter of calendar 2010, the rebate formulas used to determine the rebate amountsdue are as follows: for noninnovator products, in general generic drugs marketed under ANDAs, the rebate amount is13% of the AMP for the quarter; for innovator products, in general brand-name products marketed under NDAs, therebate amount is the greater of 23.1% of the AMP for the quarter or the difference between such AMP and the BestPrice for that same quarter.
The Company has a Medicaid rebate agreement in effectwith the federal government. Federal and/or state governmentshave and are expected to continue to enact measures aimed at reducing the cost of drugs to such governmental payersas well as the public, including the enactment in December 2003 of Medicare legislation that expanded the scope ofMedicare coverage to include outpatient drugs (Part D), starting in January 2006, as well as recently enacted healthreform legislation. Management cannot predict the nature of such measures or their impact on the Company’sprofitability. Various states have in recent years also adopted supplemental drug rebate programs that are intendedto provide the individual states with additional manufacturer rebates on Medicaid utilization over and above thoserequired under a manufacturer’s federal Medicaid agreement. States also have created drug coverage andcorresponding manufacturer rebate programs for non-Medicaid populations, known as state pharmaceutical assistanceprograms. These rebate programs are generally designed to mimic the federal drug rebate program in terms of howthe manufacturer rebates are calculated. Although there are a number of supplemental and state pharmacy assistancerebate programs, for the Company they are insignificant in the aggregate compared to quarterly Medicaid drug rebateobligations.
CMS rules require pharmaceutical companies to calculate and report the AMP to CMS. CMS uses this calculation tohelp determine reimbursements to pharmacies that dispense medicines to Medicaid beneficiaries. Prior to theenactment of this legal requirement in July 2007, CMS typically used the Average Wholesaler Price (AWP)or WholesalerAcquisition Cost (WAC) in the calculation of federal upper limits. The final rule also rejected requests to postpone thepublic availability of AMP data. In mid-December 2007, a preliminary injunction was granted, resulting in postponementof the actual implementation of the rule. On December 15, 2010, by agreement of the parties, the injunction wasdissolved and the case was dismissed. Further, the Patient Protection and Affordable Care Act, Pub. L. No. 111-148,124 Stat. 119, §2503 (2010), amended the statutory definitions of the terms “average manufacturer price” and “multiplesource drug” in a manner that materially affects the regulatory definitions of those terms, and changed the manner inwhich defendants calculate federal upper limits (FULs). On November 15, 2010, CMS issued a final rule that withdrewthe regulations defining “average manufacturer price” and “multiple source drug” and the regulation pursuant to whichit would have established FULs for multiple source drugs. That final rule became effective December 15, 2010. TheCompany does not know how the new methodology for calculating FULs, will affect the Company's pharmacy customersor to what extent these customers will seek to pass on any decrease in Medicaid reimbursements to the Company.The Company cannot predict how the sharing of weighted average monthly AMP data and retail survey prices mayimpact competition in the marketplace.
Manufacturers also must participate in the 340B drug pricing program for federal funds to be available to pay for theirdrugs under Medicaid and Medicare Part B. Participating manufacturers must agree to charge statutorily-definedcovered entities no more than the 340B ceiling price for the manufacturer’s covered outpatient drugs. Sales made bythe Company pursuant to the 340B program are not material to the Company as a whole.
Additional Federal and State Regulation
The federal health care program anti-kickback statute prohibits, among other things, knowingly and willfully offering,paying, soliciting, or receiving remuneration to induce or in return for purchasing, ordering, or arranging for the purchaseor order of any health care item or service reimbursable under Medicare, Medicaid, or other federally financed healthcareprograms. This statute has been interpreted to apply to arrangements between pharmaceutical manufacturers on theone hand and prescribers, purchasers, and formulary managers on the other. Although there are a number of statutoryexemptions and regulatory safe harbors protecting certain common manufacturer business arrangements and activities
19

from prosecution, the exemptions and safe harbors are drawn narrowly, and practices that involve remuneration intended to induce prescribing, purchases, or recommendations of the Company’s products may be subject to scrutiny if they do not qualify for an exemption or safe harbor.
Federal false claims laws prohibit any person from knowingly presenting, or causing to be presented, a false claim for payment to the federal government, or knowingly making, or causing to be made, a false statement to get a false claim paid. Recently, several pharmaceutical and other health care companies have been investigated and have reached substantial financial settlements with the federal government under these laws for a variety of activities that have been alleged to have caused the submission of false claims to federal health care programs, including providing free product to customers with the expectation that the customers would bill federal programs for the product and marketing of products for unapproved, and thus non-reimbursable, uses. The Company’s activities relating to the sale and marketing of its products may be subject to scrutiny under these laws.
The majority of states also have statutes or regulations similar to the federal anti-kickback law and false claims laws, which apply to items and services reimbursed under Medicaid and other state programs, or, in several states, that apply regardless of the payor. Sanctions under these federal and state laws may include civil monetary penalties, exclusion of a manufacturer’s products from reimbursement under government programs, criminal fines, and imprisonment.
Consumer Product Safety Commission
Under the Poison Prevention Packaging Act (PPPA), the CPSC has authority to designate that dietary supplements and certain pharmaceuticals require child-resistant packaging to help reduce the incidence of accidental poisonings. The CPSC has published regulations requiring iron-containing dietary supplements and various pharmaceuticals to have child resistant packaging, and has established rules for testing the effectiveness of child-resistant packaging and for ensuring senior adult effectiveness.
The Consumer Product Safety Improvement Act of 2008 (CPSIA) amended the Consumer Product Safety Act (CPSA) to require that the manufacturer of any product that is subject to any CPSC rule, ban, standard or regulation certify that based on a reasonable testing program the product complies with CPSC requirements. This certification applies to pharmaceuticals and dietary supplements that require child-resistant packaging under the PPPA. The CPSC lifted the stay of enforcement of the certification requirement and the regulation has been in effect since February 9, 2010.
Federal Trade Commission
The FTC exercises primary jurisdiction over the advertising and other promotional practices of marketers of dietary supplements and OTC pharmaceuticals and often works with the FDA regarding these practices. The FTC considers whether a product’s claims are substantiated, truthful and not misleading. The FTC is also responsible for reviewing mergers between and acquisitions of pharmaceutical companies exceeding specified thresholds and investigating certain business practices relevant to the healthcare industry. The FTC could challenge these business practices in administrative or judicial proceedings. For example, in accordance with the Medicare Prescription Drug Improvement and Modernization Act of 2003, agreements between NDA and ANDA holders relating to settlements of patent litigation involving paragraph IV certifications under the Hatch-Waxman Act, as well as agreements between generic applicants that have submitted ANDAs containing paragraph IV certifications where the agreement concerns either company’s 180-day exclusivity, must be submitted to the FTC (and the United States Department of Justice) for review.
State Regulation
Most states regulate foods and drugs under laws that generally parallel federal statutes. The Company is also subject to other state consumer health and safety regulations that could have a potential impact on the Company’s business if the Company is ever found to be non-compliant. Additionally, logistics facilities that distribute generic prescription drugs are required to be registered with certain states. License requirements and fees vary by state.
United States Pharmacopeial Convention
The USP is a non-governmental, standard-setting organization. By reference, the Federal Food, Drug and Cosmetic Act incorporates the USP quality and testing standards and monographs as the standards that must be met for the listed drugs, unless compliance with those standards is specifically disclaimed on the product’s labeling. USP standards exist for most Rx and OTC pharmaceuticals and many nutritional supplements. The FDA typically requires USP compliance as part of cGMP compliance.
20

NSF is an independent, not-for-profit, non-governmental organization providing risk management services for public health and safety. Its services include standards development, product certification, safety audits, management systems registration and education programs. NSF is accredited by the American National Standards Institute (ANSI), the Occupational Safety and Health Administration and the Standards Council of Canada. These accreditations attest to the competency of services provided by NSF and compliance with established national and international standards for third-party certification.
The NSF Dietary Supplement Certification Program enables manufacturers to become independently registered by NSF as conforming to voluntary standards that provide a system of processes, procedures and documentation to assure the product produced has the strength, composition, quality and purity represented on the product label. The Company’s facilities manufacturing dietary supplements have earned NSF GMP registration. The Company also has approximately 60 store brand products certified under NSF/ANSI Standard 173 for dietary supplement products.
Foreign Regulation
The Company, through its affiliates located in the U.K., manufactures, packages and distributes OTC pharmaceuticals and provides contract manufacturing and packaging services for major pharmaceutical and healthcare companies in the U.K. and for export to markets outside the U.K. The manufacturing, processing, formulation, packaging, testing, labeling, advertising and sale of these products are subject to regulation by one or more U.K. agencies, including the Medicines and Healthcare Products Regulatory Agency, the Department of Health, the Department of the Environment, Her Majesty’s Customs and Excise, the Department of Trade and Industry, the Health and Safety Executive and the Department of Transport.
The Company manufactures, packages and distributes Rx pharmaceutical, OTC pharmaceutical and nutritional products in Mexico. The manufacturing, processing, formulation, packaging, labeling, testing, advertising and sale of these products are subject to regulation by one or more Mexican agencies, including the Health Ministry, the Commercial and Industrial Secretariat, the Federal Work’s Secretariat, the Environmental Natural Resources and Fishing Secretariat, the Federal Environmental Protection Ministry, and the Treasury and Public Credit Secretariat and its Customs Government department.
The Company manufacturers, packages and distributes hospital supplies and Rx pharmaceutical, OTC pharmaceutical and nutritional products in Australia. The manufacturing, processing, formulation, packaging, labeling, testing, advertising and sales of these products are subject to regulation by one or more Australian agencies, including the Therapeutic Goods Administration (TGA).
The Company exports OTC pharmaceutical and nutritional products and infant formula to foreign countries. Exporting requirements are regulated by the FDA and, where appropriate, DEA laws, as well as each individual country’s requirements for importation of such products. Each country requires approval of these products through a registration process by that country’s regulatory agencies. Registration requirements include the process, formula, packaging, testing, labeling, advertising and marketing of the products. Each country regulates what is required and may be represented to the public on labeling and promotional material. Approval for the sale of the Company’s products by foreign regulatory agencies may be subject to delays.
In Europe and Israel, the manufacture and sale of pharmaceutical products are regulated in a manner similar in many respects to NDA and ANDAs in the U.S. Legal requirements generally prohibit the handling, manufacture, marketing and importation of any pharmaceutical product unless it is properly registered in accordance with applicable law. The registration file relating to any particular product must contain medical data related to product efficacy and safety, including results of clinical testing and references to medical publications, as well as detailed information regarding production methods and quality control. Health ministries are authorized to cancel the registration of a product if it is found to be harmful or ineffective or manufactured and marketed other than in accordance with registration conditions. Data exclusivity provisions exist in many countries, including in the European Union, where these provisions were recently extended, although the application is not uniform. Similar provisions may be adopted by additional countries, including Israel, where legislation has been proposed. In general, these exclusivity provisions prevent the approval and/or submission of generic drug applications to the health authorities for a fixed period of time following the first approval of the brand-name product in that country. As these exclusivity provisions operate independently of patent exclusivity, they may prevent the submission of generic drug applications for some products even after the patent protection has expired.
Conditions in Israel
The Company’s Israeli operations, which include manufacturing and research and development, are subject to Israeli 21
NSF International

law. Political, economic and military conditions in Israel directly affect the Company’s operations and the Companycould be adversely affected by hostilities involving Israel or a significant recession or downturn in the economic orfinancial condition of Israel. See Item 1A. Risk Factors – Conditions in Israel for further information.
Employees
As of August 9, 2011, the Company had approximately 8,700 full-time and temporary employees worldwide, includingemployees from the acquisition of Paddock which was completed on July 26, 2011, who were located as follows:
CountryU.S.IsraelMexicoU.K.ChinaAustraliaRest of the world
Total Number ofEmployees
5,9001,000
890500140130100
Number of Employees Covered byCollective Bargaining Agreements
350400530
———10
Item 1A. Risk Factors.
The Company operates in a highly regulated industry. An inability to meet current or future regulatory requirementscould have a material adverse effect on the Company’s business, financial position and operating results.
Several U.S. and foreign agencies regulate the manufacturing, processing, formulation, packaging, labeling, testing,storing, distribution, advertising and sale of the Company’s products. Various state and local agencies also regulatethese activities. In addition, the Company manufactures and markets certain of its products in accordance with theguidelines established by voluntary standards organizations. Should the Company or one of its third party serviceproviders used in the development or commercialization of product fail to adequately conform to these regulations andguidelines, there may be a material adverse impact on the operating results of the Company. In particular, packaging,labeling or marketing changes mandated by the FDA or state and local agencies can have a material adverse impacton the results of operations of the Company. Required changes could be related to safety or efficacy issues. Similarly,the failure by the Company or one of its suppliers to comply with manufacturing, quality and testing guidelines andregulations could have a significant adverse impact on the Company’s operating results. There is also the risk that theFDA could require the Company to audit or repeat prior bioequivalence or clinical studies or the FDA could change orwithdraw the approval governing such products, which could have a material adverse impact on the results of theCompany’s operations. The Company believes that it generally has a good relationship with the FDA, which it intendsto maintain. If these relationships should deteriorate, however, the Company’s ability to bring new and current productsto market could be impeded. See Item 1. Business – Government Regulation.
All facilities where Rx and OTC drugs are manufactured, tested, packaged, stored or distributed must comply withFDA cGMPs. All of the Company’s ANDA, NDA and OTC drug products are manufactured, tested, packaged, storedand distributed according to cGMP regulations. All facilities where dietary supplements are manufactured, tested,packaged, stored or distributed must comply with the GMP regulations for dietary supplements. The FDA performsperiodic audits to ensure that the Company’s facilities remain in compliance with all applicable regulations. Typically,after the FDA completes its inspection, it may or may not issue the Company a report on Form 483, containing theFDA’s observations of possible violations of cGMP. These violations can range from minor to severe in nature. Thedegree of severity of the violation is generally determined by the time necessary to remediate the cGMP violation, andany adverse consequences for the consumer of the Company’s drug products. If the deficiency observations aredetermined to be severe, the FDA may elect to issue a warning letter to the Company. FDA guidelines specify that awarning letter be issued only for violations of “regulatory significance” for which the failure to adequately and promptlyachieve correction may be expected to result in further enforcement action. In addition to making its concerns public,the FDAcould impose sanctions including, among others, fines, product recalls, total or partial suspension of productionand/or distribution, suspension of the FDA’s review of product applications, injunctions and civil or criminal prosecution.These enforcement actions, if imposed, could have a material adverse effect on the Company’s operating results andfinancial condition. Under certain circumstances, the FDA also has the authority to revoke previously granted drugapprovals. Although the Company has internal compliance programs in place that it believes are adequate, the FDA
22

may conclude that these programs do not meet regulatory standards. If compliance is deemed deficient in any significantway, it could have a material adverse effect on the Company’s business.
On April 30, 2010, the Company received a warning letter dated April 29, 2010 from the FDA related to the FDA'sNovember 2009 inspection of the Company's Allegan manufacturing facilities. The Company provided the FDA witha written response to the warning letter, which was accepted by the FDA. In addition, the Company developed acomprehensive plan to review and augment the quality systems and manufacturing operations at the Allegan facilitiesand implemented the measures outlined in that plan. On March 1, 2011, the Company announced that, as part of theanticipated follow up to the warning letter received on April 30, 2010, the FDA had arrived at its Allegan facilities forre-inspection. On April 12, 2011, the Company announced that the FDA had concluded its re-inspection of the Alleganfacilities and had informed the Company that, effective immediately, the Company had an acceptable regulatory status,such that any pending export license and ANDA applications from these facilities will once again be eligible for reviewand approval. On May 9, 2011, the FDA sent a letter to the Company closing out the warning letter issued to theCompany in April 2010, and later posted the closeout date on the FDA Enforcement Website. On July 21, 2011, theCompany received the Establishment Report for the March 2011 re-inspection from the FDA, which officially closedthe FDA's re-inspection of the Company's Allegan manufacturing facilities.
The FDA’s policy regarding the award of a 180-day market exclusivity period to generic manufacturers who successfullychallenge patents relating to specific products continues to be the subject of extensive litigation in the U.S. The FDA’scurrent interpretation of Hatch-Waxman is to award 180 days of exclusivity to the first generic manufacturer who filesa successful Paragraph IV certification under Hatch-Waxman challenging the patent(s) of the branded product,regardless of whether the manufacturer was sued for patent infringement. Although the FDA’s interpretation may benefitsome of the products in the Company’s pipeline, it may adversely affect others. The Medicare Prescription DrugImprovement and Modernization Act of 2003 provides that the 180-day market exclusivity period provided under Hatch-Waxman is triggered by the commercial marketing of the product. However, the Medicare Prescription Drug Act alsocontains forfeiture provisions which, if met, will deprive the first Paragraph IV filer of exclusivity. Additionally, themanufacturer of the branded product may launch a generic version of its own drug, known as an authorized generic.Under certain circumstances, the Company may not be able to fully exploit its 180-day exclusivity period resulting fromit being the first filer.
Under the Food and Drug Administration Amendments Act of 2007, the FDA has the power to restrict medications thatraise serious safety concerns. This law requires, and provides funding for, the FDA to monitor drugs after they go onthe market. In addition, this law requires companies to make public the results of many of their studies. Under this law,the FDA has the authority to require new studies, limit distribution or order label changes. Because of this law, theCompany’s ability to bring new and current products to market could be impeded, which could have a negative materialimpact on the Company’s financial position or results of operations.
The Company’s prescription drug products that are marketed without approved applications must meet certainmanufacturing and labeling standards established by the FDA. The FDA’s policy with respect to the continued marketingof unapproved products is stated in the FDA’s June 2006 compliance policy guide, titled “Marketed New Drugs withoutApproved NDAs or ANDAs.” Under this policy, the FDA has stated that it will follow a risk-based approach with regardto enforcement against such unapproved products. The FDA evaluates whether to initiate enforcement action on acase-by-case basis, but gives higher priority to enforcement action against products in certain categories, such asthose marketed as unapproved drugs with potential safety risks or that lack evidence of effectiveness. The FDArecognizes that certain unapproved products, based on the introduction date of their active ingredients and the lackof safety concerns, among other things, have been marketed for many years and, at this time, might not be subject toimmediate enforcement action. The Company believes that so long as it complies with applicable manufacturing andlabeling standards, it will be in compliance with the FDA’s current enforcement policy. There can be no assurance thatthe FDA will continue this policy or not take a contrary position with any individual product or group of products. If theFDA were to take a contrary position, the Company may be required to seek FDA approval for these products orwithdraw such products from the market. For fiscal 2011, the Company’s annual sales for such unapproved productswere approximately $18,000.
In October 2007, the FDA convened a joint meeting of the Pediatric and Nonprescription Drugs Advisory committeesto discuss the safety and efficacy of OTC cough and cold products for use in children. The advisory committeesrecommended that these products no longer be used in children under the age of six. On October 8, 2008, the FDAissued a statement supporting the voluntary action of the Consumer Healthcare Product Association (CHPA), of whichthe Company is a member, to modify product labels for consumers of OTC cough and cold medicines to state “do notuse” in children under four years of age. The Company completed the CHPArecommended revisions to all OTC cough
23

and cold products in April 2010. The FDA has not issued any further guidance about the labeling of OTC cough andcold medicines in children two years of age and older. Sales of the Company’s pediatric cough and cold products couldbe adversely affected by recommendations resulting from this review.
The Company’s activities with respect to its infant formula products also may be subject to barriers or sanctions imposedby countries or international organizations limiting international trade and dictating the specific content of infant formulaproducts. In addition, regulatory changes or decisions that restrict the manufacture, labeling and availability of theCompany’s infant formula products could affect the Company’s results of operations. For example, certain governmentalagencies, non-governmental organizations and consumer advocates have lobbied against the marketing and sale ofsome infant formula products. These efforts could result in increased regulatory restrictions or enforcement. A 2008melamine incident in China has resulted in increased global scrutiny of the infant formula industry, which may resultin increased costs and may reduce the Company’s margins and profitability. The U.S. government will likely continueto enhance its regulations on the industry aimed to ensure the safety and quality of dairy products, including, but notlimited to, compulsory batch-by-batch inspection and testing for additional safety and quality issues. Such inspectionsand testing may increase the Company’s operating costs related to its infant formula products.
The Company manufactures products that are safe and effective when used in accordance with label directions;however, certain products contain ingredients that can be used for improper purposes. Additional legislation orregulation may be enacted to mitigate improper uses of these ingredients, which could have an adverse impact on theCompany’s sales of such products and resulting income.
Acetaminophen – The Company manufactures several products that contain the active ingredient acetaminophen,which is indicated as an analgesic. In June 2009, the FDA held a public advisory committee meeting to discuss howto address the potential for liver injury related to the risk of overdose of acetaminophen in both OTC and Rx products.The FDA expressly stated that the risk of developing liver injury to the individual patient who uses the drug accordingto directions is extremely low and that it is not seeking to remove acetaminophen from the market. However, due tothe extensive use of acetaminophen-containing products, the FDA sought guidance from several advisory committeesregarding measures to reduce the potential for liver injury associated with acetaminophen use. Measures discussedinclude, but were not limited to, reducing the maximum single-dose and daily-dose, reducing packaging sizes, andincreasing consumer educational efforts regarding such products. At a May 2011 meeting of the FDA's NonprescriptionDrugs Advisory Committee and Pediatric Advisory Committee to review efforts to reduce medication errors around theuse of single-ingredient pediatric acetaminophen, the FDA joint committees unanimously voted: (1) in support of theaddition to the label of weight-based dosing for children ages two to twelve; (2) that the pharmacokinetic (PK), safetyand efficacy data would be required to support the addition of new label directions for children six months to two yearsof age; and (3) that the new labeling for children six months to two years of age include the indication for fever reduction.The committees did not support an indication in labeling for children six months to two years of age for relief of pain;this indication is currently included for children over two years of age. The FDA is reviewing the input it received fromthe advisory committees and additional comments submitted through the docket. In fiscal 2011, products containingacetaminophen generated revenues of approximately $206,000 for the Company.TheCompany cannot predict whetherthe FDA will adopt any recommendations of the advisory committees regarding the sale and use of acetaminophenor whether any such recommendations, if adopted by the FDA, would impact future revenues attributable to theseproducts.
Pseudoephedrine – The Company produces a number of products that contain the active ingredient pseudoephedrine(PSE), which is indicated as a nasal decongestant. PSE has been under scrutiny as an ingredient illegally used toproduce methamphetamine. To address this concern, legislation has been enacted at the federal level restricting thesales of PSE products (i.e., Combat Methamphetamine Epidemic Act) and authorizing the DEA to place quotas on theamounts of PSE raw material that can be procured (i.e., the Controlled Substances Act). At the state level, a numberof states have introduced or passed legislation placing additional restrictions on the sale of PSE products. In addition,the states of Oregon and Mississippi have moved PSE products to Rx status; many localities have passed similarlegislation and a few other states have considered moving PSE products to Rx status. Sales of PSE products by theCompany in fiscal 2011 were approximately $59,000. Sales of PSE products could be adversely affected by action atthe state or federal level to place additional restrictions on the sale of PSE products.
Phenylephrine – The Nonprescription Drug Advisory Committee met in December 2007 to discuss the efficacy ofphenylephrine, an active ingredient used in various cough and cold products as a nasal decongestant. The advisorycommittee vote recommended that available data “is supportive” of the efficacy of phenylephrine at 10 milligrams. Inaddition, the advisory committee recommended additional evidence to support the efficacy of a 10 milligram dose ofphenylephrine. The recommendations by the advisory committee are not binding on the FDA. It is not known at thistime what, if any, further action the FDA or industry will take in response to recommendations of the advisory
24

committee. In fiscal 2011, products containing phenylephrine generated revenues of approximately $67,000. Certainactions by the FDA, such as mandating label and packaging changes, could have an adverse effect on the operatingresults of the Company.
Dextromethorphan – The Company manufactures several products that contain the active ingredientdextromethorphan, which is indicated for cough suppression. Dextromethorphan has come under scrutiny becauseof its potential to be abused. Some states have introduced legislation that, if passed, could require restricted accessto dextromethorphan in finished dosage forms. Such legislation placing age restrictions on the purchase of OTCproducts containing dextromethorphan was passed at the local level by Suffolk County, New York,Westchester County,New York and by the City of Jerseyville, Illinois. At least one state has passed legislation restricting the bulk sale ofdextromethorphan.
Legislation has been unsuccessfully introduced at the federal level over the past few sessions of Congress that wouldhave, if enacted, generally prohibited the bulk sale of dextromethorphan and also imposed a federal age limit of 18years old in order to purchase finished products containing dextromethorphan. It is possible that any of the states orthe federal government could introduce and pass legislation imposing additional or different restrictions on the sale ofdextromethorphan in finished dosage form, such as requiring a minimum age to purchase product. In fiscal 2011,products containing dextromethorphan generated revenues of approximately $95,000. The Company cannot predictwhether any of the proposed legislation will be passed or, if it is passed, its impact on future revenues attributable tothese products.
The FDA held a meeting of the Drug Safety and Risk Management Advisory Committee on September 14, 2010 todiscuss the potential abuse of the drug dextromethorphan and the public health benefits and risks of dextromethorphanuse as a cough suppressant in prescription and nonprescription drug products. In a 15-9 vote, an FDA advisory panelvoted not to restrict dextromethorphan cough medications to prescription-only. It is possible that the FDA could stillrecommend in the future that dextromethorphan containing products be considered a scheduled substance, whichwould remove their status as an OTC product. The Company cannot predict the likelihood of such activity by the FDAand any adverse impact such activity it may have on the Company’s results of operations.
The Company’s products are safe and effective when used in accordance with label directions. However, certainproducts contain ingredients that can be, and in some cases are, used for improper purposes. As previously discussed,pseudoephedrine and dextromethorphan are two of these ingredients, but others may exist. Increasingly,various effortsare employed by federal and state governments in an effort to curb this misuse, including the consideration of additionallegislation or regulation that may result in further restrictive requirements for the manufacture or sale of productscontaining these ingredients. The Company cannot predict if or when any additional legislation or regulation will bepassed and any adverse impact it may have on the Company’s results of operations.
Unfavorable publicity or consumer perception of the Company’s products and any similar products distributed by othercompanies could have a material adverse impact on the Company’s business.
The Company is dependent upon consumers’ perception of the safety and quality of its products. Negative consumerperception may arise from media reports, product liability claims, regulatory investigations or recalls, regardless ofwhether such media reports, claims, investigations or recalls involve the Company or its products. The mere publicationof information asserting defects in products or ingredients could have a material adverse effect on the Company,regardless of whether such information is scientifically supported or concerns the Company’s products or the rawmaterials used in the Company’s products. For example, any major outbreak of any illness or disease in cows couldlead to a serious loss of consumer confidence in, and demand for, dairy products, including the Company’s infantformula products. Adverse publicity about these types of concerns, whether valid or not, may negatively impactconsumer perceptions and discourage consumers from buying one or more of the Company’s products, such that theCompany’s sales may decline and the Company may suffer losses in its business.
The Company may incur liabilities or experience negative reputational effects as a result of any real or perceivedquality issues with the Company’s products. The Company’s products involve risks such as product contamination,spoilage, mislabeling and tampering that could require the Company to recall one or more of its products. Seriousproduct quality concerns could also result in governmental actions against the Company that, among other things,could result in the suspension of production or distribution of the Company’s products, product seizures, loss of certainlicenses, delays in the issuance of governmental approvals for new products or other governmental penalties. Adversepublicity or negative public perception regarding the quality of the Company’s products, particular ingredients, or theindustries in which the Company competes could result in a substantial decrease in demand for the Company’sproducts.
The Company cannot guarantee that counterfeiting, imitation, or other tampering with its products will not occur or that25

the Company will be able to detect and resolve it if it happens. Any occurrence of counterfeiting or contamination couldnegatively impact sales of the Company’s products, particularly if counterfeit or imitation products cause death or injuryto consumers of those products.
Additionally, powdered infant formula products are not sterile. A substantial portion of the Company’s infant formulaproducts must be prepared and maintained according to label instruction to retain their flavor and nutritional value andavoid contamination or deterioration. Depending on the product, a risk of contamination or deterioration may exist ateach stage of the production cycle, including the purchase and delivery of raw materials, the processing and packagingof food products, and the use and handling by consumers, hospital personnel and health care professionals. In theevent that certain of the Company’s infant formula products are found or alleged to have suffered contamination ordeterioration, whether or not such products are under the Company’s control, the Company’s reputation and its infantformula product category could be materially adversely affected.
The Company’s infant formula product category is subject to changing consumer preferences and health and nutritional-related concerns. TheCompany’s results of operations depend, in part, on consumer preferences and choices, includingthe number of mothers who choose to use infant formula products rather than breastfeed their babies. To the extentthat private, public and government sources may promote the benefits of breastfeeding over the use of infant formula,there could be a reduced demand for infant formula products, and the Company’s infant formula products businesscould be adversely affected. The Company’s infant formula product category may also be affected by medical researchrelating to the healthfulness of cow’s milk in the human diet. For example, adverse research may raise concerns aboutthe fat, cholesterol, calorie, sodium and lactose content or contamination of dairy products, including infant formula.Any significant shift in consumer preference away from the use of infant formula may materially and adversely affectthe results of operations of the Company’s infant formula product category. Additionally, the Company’s infant formulaproduct category could be adversely impacted by an increase in the number of families that are provided with infantformula by the federal government through the WIC program, as the Company does not participate in this program.
The Company believes that growth in the nutritional products business is based largely on national media attentionregarding scientific research suggesting potential health benefits from regular consumption of certain vitamin and othernutritional products. There can be no assurance of future favorable scientific results and media attention, or the absenceof unfavorable or inconsistent findings. In the event of future unfavorable scientific results or media attention, theCompany’s sales of nutritional products could be materially adversely impacted.
Federal and state health care reform may have an adverse effect on the Company’s financial condition and results ofoperations.
Increasing expenditures for health care have been the subject of considerable public attention in North America, Israeland many European countries. Both private and governmental entities are seeking ways to reduce or contain healthcare costs. In many countries where the Company currently operates, pharmaceutical prices are subject to regulation.In the U.S., numerous proposals that would effect changes in the U.S. health care system and the pharmaceuticalindustry have been introduced or proposed in Congress and in some state legislatures that could include, but not belimited to, intellectual property, regulatory, antitrust, drug pricing and product liability issues. Similar activities are takingplace throughout Europe. As a result of governmental budgetary constraints, the Israel Ministry of Health and the majorIsraeli health funds have sought to further reduce healthcare costs by,among other things, applying continuous pressureto reduce pharmaceutical prices and inventory levels. The Company cannot predict the nature of the measures thatmay be adopted, how they will be interpreted by the courts or the administrative agencies charged with enforcing themor their impact on the marketing, pricing and demand for its products.
Federal law requires that a pharmaceutical manufacturer, as a condition of having federal funds being made availableto the states for the manufacturer’s drugs under Medicaid and Medicare Part B, must enter into a rebate agreementto pay rebates to state Medicaid programs for the manufacturer’s covered outpatient drugs that are dispensed toMedicaid beneficiaries and paid for by a state Medicaid program under a fee-for-service arrangement. The CMS isresponsible for administering the Medicaid rebate agreements between the federal government and pharmaceuticalmanufacturers. Rebates are also due on the utilization of Medicaid managed care organizations.
The Company has a Medicaid rebate agreement in effectwith the federal government. Federal and/or state governmentshave enacted and are expected to continue to enact measures aimed at reducing the cost of drugs to such governmentalpayers as well as the public, including the enactment in December 2003 of Medicare legislation that expanded thescope of Medicare coverage to include outpatient drugs (Part D), starting in January 2006, as well as health reformlegislation enacted in 2010. Management cannot predict the nature of such measures or their impact on the Company’sprofitability. Various states have in recent years also adopted supplemental drug rebate programs that are intended
26
to provide the individual states with additional manufacturer rebates on Medicaid utilization over and above thoserequired under a manufacturer’s federal Medicaid agreement. States also have created drug coverage andcorresponding manufacturer rebate programs for non-Medicaid populations, known as state pharmaceutical assistanceprograms. These rebate programs are generally designed to mimic the federal drug rebate program in terms of howthe manufacturer rebates are calculated. Although there are a number of supplemental and state pharmacy assistancerebate programs, for the Company they are insignificant in the aggregate compared to quarterly Medicaid drug rebateobligations.
CMS rules require pharmaceutical companies to calculate and report the AMP to CMS. CMS uses this calculation tohelp determine reimbursements to pharmacies that dispense medicines to Medicaid beneficiaries. Prior to theenactment of this legal requirement in July 2007, CMS typically used the AWP or WAC in the calculation of federalupper limits. The final rule also rejected requests to postpone the public availability of AMP data. In mid-December2007, a preliminary injunction was granted, resulting in postponement of the actual implementation of the rule. OnDecember 15, 2010, by agreement of the parties, the injunction was dissolved and the case was dismissed. Further,the Patient Protection and Affordable Care Act, Pub. L. No. 111-148, 124 Stat. 119, § 2503 (2010), amended thestatutory definitions of the terms “average manufacturer price” and “multiple source drug” in a manner that materiallyaffects the regulatory definitions of those terms, and changed the manner in which defendants calculate FULs. OnNovember 15, 2010, CMS issued a final rule that withdrew the regulations defining “average manufacturer price” and“multiple source drug” and the regulation pursuant to which it would have established FULs for multiple source drugs.That final rule became effective December 15, 2010. The Company does not know how the new methodology forcalculating FULs, will affect the Company's pharmacy customers or to what extent these customers will seek to passon any decrease in Medicaid reimbursements to the Company. The Company cannot predict how the sharing ofweighted average monthly AMP data and retail survey prices may impact competition in the marketplace.
On November 7, 2009, the House of Representatives passed the “Affordable Health Care for America Act” (H.R. 3962),originally introduced on July 14, 2009, by Rep. Dingell as “America’s Affordable Health Choices Act” (H.R. 3200). Thislegislation eliminates the ability of American families to use funds from flexible spending accounts (FSAs) to purchaseOTC medicines. The Company cannot predict how the elimination of allowing families to use FSAs to purchase OTCmedicines will affect the market for OTC products.
If the Company is unable to maintain adequately high levels of customer service over time, it may lose market share,and its business and operating results may be materially adversely affected.
The Company understands that maintaining high levels of customer service requires the Company to be able to deliverhigh quality products to its customers on a timely basis. From time to time, the Company may experience interruptionsand challenges to its customer service levels due to a variety of factors that may arise. Recently, as some of theCompany's competitors have experienced production problems or have suspended production altogether, the Companyhas experienced significant increases in the volume of customer orders in certain product categories. Additionally,recent enhancements to the Company's quality assurance systems constrained the pace of some of the Company'sproduction output for a limited period of time. If the Company is unable to maintain adequately high levels of customerservice over time, due to these factors or otherwise, the Company may lose market share, and its business andoperating results may be materially adversely affected.
If the Company cannot continue to rapidly develop, manufacture and market innovative products that meet customerrequirements for performance, safety and cost effectiveness, it may lose market share and its revenues may suffer.
The Company’s future results of operations depend, to a significant degree, upon its ability to successfully commercializeadditional OTC and generic prescription drugs and/or innovative pharmaceuticals, infant formulas and API. Allpharmaceutical products must meet regulatory standards and/or receive regulatory approvals. The Company mustprove that the OTC ANDA and generic prescription products are bioequivalent to their branded counterparts, whichtypically requires bioequivalency studies or even more extensive clinical trials in the case of topical products. Thedevelopment and commercialization process, particularly with respect to innovative products, is both time consumingand costly and involves a high degree of business risk. Products currently under development, if and when fullydeveloped and tested, may not perform as expected, may not pass required bioequivalence studies, may be the subjectof intellectual property challenges, necessary regulatory approvals may not be obtained in a timely manner, if at all,and the Company may not be able to successfully and profitably produce and market such products. Delays in anypart of the process or the Company’s inability to obtain regulatory approval of its products (including products developedby others to which the Company has exclusive marketing rights) could adversely affect operating results by restrictingor delaying its introduction of new products. Even upon the successful development of a product, the Company’scustomer’s failure to launch a product could adversely affect operating results. The FDAcould impose higher standards
27

and additional requirements, such as requiring more supporting data and clinical data than previously required, inorder to gain FDA clearance to launch new formulations in to the market. Continuous introductions of new productsand product categories are critical to the Company’s business. Product margins may decline over time due to theproducts’ aging life cycles, changes in consumer choice or developments in drug delivery technology. Therefore, newproduct introductions are necessary for maintenance of the Company’s current financial condition, and if the Companyfails to introduce and market new products, the effect on its financial results could be materially adverse.
The Company’s investment in research and development is expected to increase above recent levels in dollar termsbut remain relatively flat as a percentage of sales due to the Company’s ongoing broadening of its OTC ANDA, genericprescription and specialty API product portfolio, as well as several opportunities for new products that are switchingfrom Rx to OTC status. The ability to attract scientists proficient in emerging delivery forms and/or contracting with athird party in order to generate new products of this type is a critical element of the Company’s long-term plans. Shouldthe Company fail to attract qualified employees, successfully develop products in a timely manner, or enter intoreasonable agreements with third parties, long-term sales growth and profit would be adversely impacted.
The price of shares of Company common stock is volatile and, therefore, investors cannot rely on historical trends topredict future stock prices.
The market price of the Company’s common stock has been, and could be, subject to wide fluctuations in responseto, among other things, quarterly fluctuations in operating results, adverse circumstances affecting the introduction ormarket acceptance of new products, product recalls, failure to meet published estimates of or changes in earningsestimates and stock ratings by securities analysts, announcements of new products or enhancements by competitors,receipt of regulatory approvals by competitors, sales of common stock by existing holders, loss of key personnel,market conditions in the industry, shortages of key product inventory components and general economic conditions.
The Company’s quarterly results are impacted by a number of factors, some of which are beyond the control ofmanagement, that may result in significant quarter-to-quarter fluctuations in operating results.
The Company’s quarterly operating results depend on a variety of factors including, but not limited to, the severity,length and timing of the cough/cold/flu season, the timing of new product approvals and introductions by the Companyand its competitors, price competition, changes in the regulatory environment, the magnitude and timing of researchand development investments, changes in the levels of inventories maintained by the Company’s customers and thetiming of retailer promotional programs. Accordingly, the Company may be subject to significant and unanticipatedquarter-to-quarter fluctuations in its operating results.
The competitive markets the Company operates in could lead to reduced demand for its products in favor of itscompetitors’ products, which could negatively impact its sales, gross margin, and prospects.
The markets for OTC pharmaceutical, nutritional, infant formula, generic pharmaceutical and API products are highlycompetitive. Competition is based primarily on price, quality and assortment of products, customer service, marketingsupport and availability of new products. Competition also comes from national brand companies and brandedpharmaceutical companies. That competition could be intensified should those companies lower prices or manufacturetheir own store brand or generic equivalent products. Due to the high degree of price competition, the Company hasnot always been able to fully pass on cost increases to its customers. The inability to pass on future cost increases,the impact of store brand competitors and the impact of national brand companies lowering prices of their products oroperating in the store brand market could have a material adverse impact on financial results. In addition, since theCompany sells its nutritional products through retail drug, supermarket and mass merchandise chains, it may experienceincreased competition in its nutritional products business through alternative channels such as health food stores,direct mail and direct sales as more consumers obtain products through these channels. The Company has evaluated,and will continue to evaluate, the products and product categories in which it does business. Future product lineextensions, or deletions, could have a material impact on the Company’s financial position or results of operations.
Selling prices of generic drugs typically decline, sometimes dramatically, as competition intensifies due to additionalcompanies receiving approvals for a given product or brands launching authorized generics. To the extent that theCompany succeeds in being the first to market a generic version of a significant product, the Company’s sales andprofit can be substantially increased in the period following the introduction of such product and prior to a competitor’sintroduction of an equivalent product. The Company’s ability to sustain its sales and profitability on any product overtime is dependent on both the number of new competitors for such product, some of whom may be significantly largerthan the Company, and the timing of their approvals.
Certain competitors are choosing to consolidate in the generic pharmaceutical and nutritional industries. These
28

consolidations may create larger companies with which the Company must compete and provide further pressure onprices, development activities or customer retention. The impact of future consolidation in the industry could have amaterial impact on the Company’s financial position or results of operations.
The Company’s API business is subject to increased competition from other manufacturers of API located in Europeand developing countries, such as India and China. Such competition may result in loss of API customers and/ordecreased profitability in this business segment.
The Company’s success is dependent, in large part, on continued store brand growth, which is influenced by factorsoutside management’s control. There can be no assurance that store brand products will continue to grow and failureto achieve continued growth may adversely impact the Company’s sales and resulting financial condition.
The future growth of domestic store brand products will be influenced, in part, by general economic conditions, whichcan influence consumers to switch to and from store brand products, consumer perception and acceptance of thequality of the products available, the development of new products and/or product delivery forms, the market exclusivityperiods awarded on Rx to OTC switch products and the ongoing or growing strength of the retailers’ brands in themarket. The Company does not advertise like the national brand companies and thus is largely dependent on retailerpromotional activities to drive sales volume and increase market share. Growth opportunities for the products in whichthe Company currently has a significant store brand market share (cough/cold/flu/allergy, analgesic, smoking cessationand gastrointestinal products) will be driven by the ability to offer new products to existing domestic customers. Brandedpharmaceutical companies may use state and federal regulatory and legislative means to limit the availability of brandequivalent products. Should store brand growth be limited by any of these factors, there could be a significant adverseimpact on the operating results of the Company.
Lack of availability of, or significant increases in the cost of, raw materials used in manufacturing the Company’sproducts could adversely impact its profit margins and operating results.
Affordable high quality raw materials and packaging components are essential to all of the Company’s business unitsdue to the nature of the products the Company manufactures. Raw materials and packaging components are generallyavailable from multiple suppliers. Supplies of certain raw materials, bulk tablets and finished goods purchased by theCompany are limited, or are available from one or only a few suppliers. In these situations, increased prices, rationingand shortages can occur. In response to these problems the Company tries to identify alternative materials or suppliersfor such raw materials, bulk tablets and finished goods. FDA requirements for products approved through the ANDAor NDA process could substantially lengthen the approval of an alternate material source. Certain material shortagesand approval of alternate sources could adversely affect financial results. The rapid increase in cost of many rawmaterials from inflationary forces, such as increased energy costs, and the Company’s ability or inability to pass onthese increases to its customers, could have a material impact on the Company’s financial results.
The Company maintains several single-source supplier relationships, either because alternative sources are notavailable or the relationship is advantageous due to regulatory, performance, quality, support, or price considerations.Unavailability or delivery delays of single-source components or products could adversely affect the Company’s abilityto ship the related product in a timely manner. The effect of unavailability or delivery delays would be more severe ifassociated with the Company’s higher volume and more profitable products. Even where alternative sources of supplyare available, qualifying the alternate suppliers and establishing reliable supplies could cost more or could result indelays and a loss of revenues. As a result, the loss of a single-source supplier could have a material adverse effecton the Company’s results of operations.
In addition, raw materials purchased from third parties, including those from foreign countries, may contain counterfeitingredients or other adulterants. The Company maintains a strict program of verification and product testing throughoutthe ingredient sourcing and manufacturing process to identify potential counterfeit ingredients, adulterants and toxicsubstances. Nevertheless, discovery of previously unknown problems with the raw materials or product manufacturingprocesses or new data suggesting an unacceptable safety risk associated therewith, could result in a voluntary ormandatory withdrawal of the contaminated product from the marketplace, either temporarily or permanently. Any futurerecall or removal would result in additional costs to the Company, and may give rise to product liability litigation, eitherof which could have a material adverse effect on the operating results of the Company.
The Company’s infant formula products require certain key raw ingredients that are derived from raw milk, such asskim milk powder, whey protein powder and lactose. The Company’s supply of raw milk may be limited by the abilityof individual dairy farmers and cooperatives to provide raw milk in the amount and quality to meet the needs of theCompany’s infant formula product category.Raw milk production is influenced by factors beyond the Company’s control,including: (1) seasonal factors, such as dairy cows producing more milk in temperate weather than hot or cold weather,
29

and extended unseasonably hot or cold weather potentially leading to lower than expected supplies; (2) environmentalfactors, such as the volume and quality of milk produced by dairy cows being linked closely to the quality of nourishmentprovided by the surrounding environment; and (3) governmental agricultural and environmental policy, such asgovernment grants, subsidies, land provisions, technical assistance, and other agricultural and environmental policieshaving a direct effect on the viability of individual dairy farmers and dairy farmer cooperatives and the number of dairycows and quantities of milk they are able to produce. The Company cannot guarantee that there will be sufficientsupplies of these key ingredients derived from raw milk. Any disruption in the supply of these key ingredients derivedfrom raw milk could adversely and materially impact the Company’s infant formula product category.
The Company’s products, and the raw materials used to make those products, generally have limited shelf lives. TheCompany’s inventory levels are based, in part, on expectations regarding future sales. The Company may experiencebuild-ups in inventory if sales slow. Any significant shortfall in sales may result in higher inventory levels of raw materialsand finished products, thereby increasing the risk of inventory spoilage and corresponding inventory write-downs andwrite-offs, which may materially and adversely affect the Company’s results of operations. Additionally, the FDA isbeginning to scrutinize claims on infant formula labels. Labeling changes required for regulatory compliance couldrender packaging inventories obsolete. Cargo thefts and/or diversions and economically or maliciously motivatedproduct tampering in store shelves may be experienced from time to time, causing unexpected shortages.
The costs, both financially and in regard to management attention, of combating legal proceedings could have anadverse impact on the Company’s business, financial condition and results of operations.
From time to time, the Company and/or its subsidiaries become involved in lawsuits arising from various commercialmatters, including, but not limited to, competitive issues, contract issues, intellectual property matters, workers’compensation, product liability, environmental remediation issues and state or federal regulatory issues. See Item 3Legal Proceedings. Litigation is unpredictable and can be costly. No assurance can be made that litigation will nothave a material adverse effect on the Company’s financial position or results of operations in the future. Similarly,judicial decisions in proceedings to which the Company is not a party may result in the setting of legal precedent thatcould affect the future operation of the Company’s business. In addition, the Company may face environmentalexposures including, for example, those relating to discharges from and materials handled as part of its operations,the remediation of soil and groundwater contaminated hazardous substances or wastes, and the health and safety ofits employees. While the Company does not have any material remediation liabilities currently outstanding, theCompany may in the future face liability for the costs of investigation, removal or remediation of certain hazardoussubstances or petroleum products on, under, or in its currently or formerly owned property, or from a third party disposalfacility that it may have used, without regard to whether the Company knew of, or caused, the presence of thecontaminants. The actual or alleged presence of, or failure to remediate properly, these substances could have adverseeffects, including, for example, substantial investigative or remedial obligations and limitations on the ability to sell orrent affected property or to borrow funds using affected property as collateral. There can be no assurance thatenvironmental liabilities and costs will not have a material adverse effect on the Company’s financial position, resultsof operations or cash flows.
The Company may also be subject to liability if its products violate or are alleged to violate applicable laws or regulationsin the jurisdictions where such products are distributed or in the event that its products cause or are alleged to causeinjury, illness, or death. Thesuccessful assertion of product liability claims against the Company could result in potentiallysignificant monetary damages and diversion of management resources, and require the Company to make significantpayments and incur substantial legal expenses. Even if a product liability or consumer fraud claim is unsuccessful,not merited, or not fully pursued, the Company may still incur substantial legal expenses defending against such aclaim, and the Company’s reputation may suffer.
Recent court rulings limiting the application of Federal preemption may have an adverse effect on the Company'soperations as a result of a potential increase in litigation exposure.
On January 24, 2011, the U.S. Court of Appeals for the Ninth Circuit issued a decision in Gaeta v. Perrigo, reversinga lower court decision that the plaintiff's state law causes of action were preempted by the FFDCA to the extent thatthey were based on an alleged lack of adequate warning. In its decision, the Ninth Circuit stated that it joined the Fifthand Eighth Circuits in concluding that the U.S. Supreme Court's decision in Wyeth v. Levine, 129 S. Ct 1187(2009) (concluding that the federal regulatory regime governing pharmaceuticals does not preempt state law failure-to-warn claims against brand name manufacturers) “extends with equal force to claims against generic manufacturers.”On June 10, 2011, the Company filed a Writ of Certioriari with the United States Supreme Court seeking an appeal ofthe Ninth Circuit's ruling in the Gaeta case. The U.S. Supreme Court recently addressed the issue of whether statelaw failure-to-warn claims against generic prescription drug manufacturers - for failing to modify their labeling to include
30

warnings that differ from the name-brand equivalent - are automatically preempted by the FDCA's requirement thatthe label for a generic drug be the “same as” the label for the brand name counterpart in the following three casesfrom the Fifth and Eighth Circuits: Pliva v. Mensing, 09-993; Actavis v. Mensing, 09-1039; and Actavis v. DeMahy,09-1501 (collectively, referred to as Pliva v. Mensing). These cases were consolidated for review. On June 23, 2011,in a 5-4 reversal of the decisions of the Fifth and Eighth Circuits, the U.S. Supreme Court issued its decision in Plivav. Mensing and ruled that state-law tort claims against generic manufacturers were preempted because the federalstatutes and federal regulations required the same warning label as that approved by the FDA for the brand-namedrug. With the reversal of the decisions of the Fifth and Eighth Circuits, the Company and other manufacturers ofgeneric pharmaceutical products (OTC and Rx) retain their ability to dismiss certain failure-to-warn claims based onfederal preemption. At this time, since the Writ for Certiorari in the Gaeta case is still pending, the Company cannotpredict the impact of that case on its results of operations.
Changes in tax laws or income tax rates could have a material adverse effect on the Company’s results of operationsand the ability to utilize cash in tax efficient manner.
Income tax rate changes by governments and changes in the tax jurisdictions in which the Company operates couldinfluence the effective tax rates for future years. Entry into new tax jurisdictions, whether domestic or international,increases the likelihood of fluctuation. The mix of income between tax jurisdictions in any given quarter can alsosignificantly change the effective tax rate across quarters and years. Also, changes in tax laws could have a materialadverse effect on the Company’s ability to utilize cash in a tax efficient manner.
Because the Company depends upon Walmart for a significant portion of its sales, the Company’s sales and incomewould be adversely affected by an disruption of its relationship with Walmartor any material adverse change in Walmart’sbusiness.
Sales to the Company’s largest customer, Walmart, comprised approximately 22% of fiscal 2011 net sales. ShouldWalmart’s current relationship with the Company change adversely, the resulting loss of business could have a materialadverse impact on the Company’s financial position and results of operations. In addition, while no other customerindividually comprises more than 10% of total net sales, the Company does have other significant customers. If theCompany’s relationship with one or more of these other customers changes significantly, it could have a materialadverse impact on the Company’s financial position and results of operations.
Changes in supply relationships with the Company’s customers, such as alternate sources for products, withholdingnew product introductions and/or development of customer store brand programs, could have a material adverseimpact on the Company’s financial position and results of operations.
Maintaining the supply relationships with the Company’s customers is critical to its success. If the Company is unableto deliver to expected customer service levels, customers may choose to assess penalties, obtain alternate sourcesfor products, withhold new product introductions and/or end the relationship with the Company. The success in recentyears of private label marketing programs has increased large retailers’ attention to the importance of their store brandprograms and as a result, many are dedicating significant resources to auditing supplier compliance with their quality,ethical and service standards. Customers may limit the level of product sourcing with the Company in protection ofthe customer’s own interests. Any or all of these factors could have a material adverse impact on the Company’sfinancial position and results of operations.
Retailer consolidation can increase the Company’s credit risk, which may adversely affect the Company’s financialposition or results of operations.
Retailer consolidation continues to inherently increase the size of the Company’s customers. If a large customer shouldencounter financial difficulties, the Company’s exposure with respect to uncollectible receivables and unusableinventory, as well as the potential loss of future sales, could result in a material adverse impact on the Company’sfinancial position or results of operations.
Conditions in Israel affect the Company’s operations and may limit its ability to produce and sell its products.
The Company has significant manufacturing and research and development facilities in Israel. Political, economic andmilitary conditions in Israel directly affect the Company’s operations, and the Company could be adversely affectedby current or future hostilities involving Israel or a significant recession or downturn in the economic or financial conditionof Israel.
Since the establishment of the State of Israel in 1948, a number of armed conflicts have taken place between Israel
31

and its neighboring countries. A state of hostility, varying in degree and intensity, has led to security and economicproblems for Israel in recent years. These hostilities can adversely affect Israel’s relationship with a number of countriesin the region and elsewhere, as well as its relationship with international organizations.
While none of the Company’s facilities in Israel have been directly affected by hostile operations, there can be noassurance that a further escalation of hostilities will not impact the Company’s facilities. Furthermore, the Company’semployees in Israel include members of the Israeli military reserves, some of whom have been called up for activeduty. If a significant number of the Company’s employees in Israel are called up for active duty in the military, theCompany’s operations in Israel may be materially adversely affected.
Escalations of hostilities have disruptive effects on Israel’s economy, and any international economic sanctions againstIsrael could further harm Israel’s economy. These economic developments could have an adverse effect on theCompany’s Israel Pharmaceutical and Diagnostic Products business.
Furthermore, certain parties with whom the Company does business may decline to travel to Israel, which would forcethe Company to make alternative arrangements where necessary. The United States Department of State has at timesissued an advisory regarding travel to various sections of Israel. As a result of the State Department’s advisories, theFDA has at various times curtailed or prohibited its inspectors from traveling to Israel to inspect the facilities of Israelicompanies, and should this occur with respect to the Company’s Israeli facilities, the FDA could withhold approval fornew products intended to be produced at those facilities.
Although it has not yet occurred, the political and security situation in Israel may result in certain parties with whomthe Company has contracts claiming that they are not obligated to perform their commitments pursuant to force majeureprovisions of those contracts.
The Company could experience disruption of its manufacturing and research and development facilities due to terroristacts or military actions. If terrorist acts or military actions were to result in substantial damage to the Company’s facilities,business activities would be disrupted since, with respect to most products, the Company would need to obtain priorFDA approval for a change in manufacturing site. The Company’s insurance may not adequately compensate it forlosses that may occur and any losses or damages incurred by the Company could have a material adverse effect onits business.
Some neighboring countries, as well as certain companies and organizations, continue to participate in a boycott ofIsraeli firms and others doing business with Israel or with Israeli companies. The Company is also precluded frommarketing its products to certain of these countries due to U.S. and Israeli regulatory restrictions. Because an immaterialamount of the Company’s revenue is currently derived from sales to these countries, the Company believes that theboycott has not had a material adverse effect on its current operations. However, continuation or extension of theboycott or implementation of additional restrictive laws, policies or practices directed towards Israel or Israeli businessescould have an adverse impact on the expansion of the Company’s business.
The current economic conditions may adversely impact the Company’s liquidity and financial condition.
The economies of the United States and the other countries in which the Company produces and markets its productscontinue to be affected by the economic conditions that began with the financial and credit liquidity crisis in late 2008.Although economic conditions began to improve during fiscal 2011, there continues to be significant uncertainty as towhether this improvement is sustainable. Furthermore, energy costs, geopolitical issues, sovereign debt issues, andthe depressed state of global real estate markets have contributed to increased market volatility. Continued marketvolatility could adversely affect the Company’s stock price, liquidity and overall financial condition.
The Company’s customers and suppliers may be adversely affected by a worsening of the current economic conditions.Although the Company actively reviews the credit worthiness of its customers and suppliers, the Company cannot fullypredict to what extent its customers and suppliers may be negatively impacted and thus to what extent the Company’soperations would be affected.
The Company invests cash and cash equivalents primarily in demand deposits and other short-term instruments withmaturities of three months or less at the date of purchase. Since the advent of the global financial crisis in the firstcalendar quarter of 2008, the Company has maintained a balance between objectives of safety of principal, liquidityand return by investing primarily in U.S., federal, state and local government obligations, direct obligations of localsovereign governments and in bank obligations of the Company’s credit banks meeting a minimum third party creditrating standard. The value of the Company’s assets, including securities held for investment, may be adversely affectedby a worsening of the current economic conditions.
32

Although the Company’s lenders have made commitments to make funds available to the Company in a timely fashion,if the current economic conditions worsen (or new information becomes publicly available impacting these lenders’credit ratings or capital ratios), the Company’s lenders may be unable or unwilling to lend money pursuant to theCompany’s existing credit facilities. In addition, if the Company determines that it is appropriate or necessary to raisecapital in the future, the cost of raising funds through the debt or equity markets may be more expensive or thosemarkets may be unavailable. If the Company is unable to use its existing credit facilities or raise funds through debtor equity markets, the Company’s liquidity or ability to follow its key growth strategies could be materially and adverselyaffected.
Additionally, decreases in personal incomes may have caused consumers to look for and purchase lower pricedproducts, such as generic store brand products manufactured by the Company, as an alternative to higher pricedbrand-name products. To the extent that this trend has occurred, the Company’s sales could be negatively affected ifeconomic conditions improve and if consumers were enticed to go back to purchasing higher-priced brand-nameproducts.
Although the Company only enters into business acquisitions and divestitures that it expects will result in benefits tothe Company, the Company may not realize those benefits because of integration and other challenges.
As part of the Company’s strategy, it evaluates potential acquisitions in the ordinary course of business, some of whichcould be and have been material. Acquisitions involve a number of risks and present financial, managerial andoperational challenges. Integration activities may place substantial demands on the Company’s management,operational resources and financial and internal control systems. Customer dissatisfaction or performance problemswith an acquired business, technology, service or product could also have a material adverse effect on the Company’sreputation and business. The Company’s failure to successfully integrate acquisitions could have a negative effect onits operations. In addition, the lack of performance of acquisitions could cause financial difficulties.
The Company expects to achieve certain cost savings and synergies from the Paddock acquisition, which wascompleted subsequent to the Company's fiscal year end on July 26, 2011,when the two companies have fully integratedtheir portfolios. The realization of certain benefits anticipated as a result of the Paddock acquisition, however, willdepend in part on the successful integration of Paddock's business portfolio with the Company's business portfolio.There can be no assurance that Paddock's business can be operated profitably or integrated successfully into theCompany's operations in a timely fashion, or at all. The dedication of management resources to such integration maydetract attention from the Company's day-to-day business, and there can be no assurance that there will not besubstantial costs associated with the transition process or other material adverse effects as a result of these integrationefforts.
The Company also evaluates the performance of all operating business units against a “return on investedcapital” (ROIC) threshold. Underperforming assets typically have a specific period to improve performance beforeother strategic alternatives are considered. The Company’s inability to successfully divest or sell assets in a timelymanner could have a negative effect on its operations. In addition, the process of divestitures could cause strains onthe ongoing operations of the Company.
Third party patents and other intellectual property rights may limit the Company’s ability to bring new products to marketand may subject the Company to potential legal liability. The failure to bring new products to market in a timely mannerwithout incurring legal liability could cause the Company to lose market share and its operating results may suffer.
The Company’s ability to bring new products to market is limited by certain patent, trademark and trade dress factorsincluding, but not limited to, the existence of patents protecting brand products for all business segments and theregulatory exclusivity periods awarded on products. The cost and time to develop these prescription and switch productsis significantly greater than the rest of the new products that the Company seeks to introduce. Moreover, themanufacture, use and sale of new products that are the subject of conflicting patent rights have been the subject ofsubstantial litigation in the pharmaceutical industry. These lawsuits relate to the validity and infringement of patentsor proprietary rights of third parties. The Company may have to defend against charges that it violated patents orproprietary rights of third parties. The Company’s defense against charges that it infringed third party patents orproprietary rights could require the Company to incur substantial expense and to divert significant effort of its technicaland management personnel. If the Company is found to have infringed on the rights of others, it could lose its right todevelop or manufacture some products or could be required to pay monetary damages or royalties to license proprietaryrights from third parties.
Although the parties to patent and intellectual property disputes in the pharmaceutical industry have often settled their
33

disputes through licensing or similar arrangements, the costs associated with these arrangements may be substantialand could include ongoing royalties. Furthermore, the Company cannot be certain that the necessary licenses wouldbe available to it on terms it believes to be acceptable. Asa result, an adverse determination in a judicial or administrativeproceeding or failure to obtain necessary licenses could prevent the Company from manufacturing and selling a numberof its products.
At times, the Company may seek approval to market NDA or ANDA products before the expiration of patents for thoseproducts, based upon its belief that such patents are invalid, unenforceable or would not be infringed by its products.As a result, the Company may face significant patent litigation. Depending upon a complex analysis of a variety oflegal and commercial factors, the Company may, in certain circumstances, elect to market a generic pharmaceuticalproduct while litigation is pending, before any court decision or while an appeal of a lower court decision is pending.This is referred to in the pharmaceutical industry as an “at risk” launch. The risk involved in an “at risk” launch can besubstantial because, if a patent holder ultimately prevails, the remedies available to the patent holder may include,among other things, damages measured by the profits lost by the holder, which are often significantly higher than theprofits the Company makes from selling the generic version of the product. By electing to proceed in this manner, theCompany could face substantial damages if a final court decision is adverse to the Company. In the case where apatent holder is able to prove that the Company's infringement was “willful” or “exceptional”, the definition of which issubjective, the patent holder may be awarded up to three times the amount of its actual damages. During the secondquarter of fiscal 2011, the Company, and its partner Synthon, launched levocetirizine tablets, a generic version ofXyzal® tablets from UCB/Sepracor prior to the expiration of the relevant patent. Synthon and the Company share boththe risks and the benefits associated with the at risk launch. During the third quarter of fiscal 2011, two additionalcompetitors received FDA approval and launched generic versions of Xyzal® tablets. Synthon settled its litigation withthe brand in the fourth quarter of fiscal 2011, removing the uncertain nature of potential "at risk" damages.
The government programs in Israel in which the Company participates and the tax benefits the Company receivesrequire the Company to meet several conditions and may be terminated or reduced in the future, which would increasethe Company’s costs and tax expenses.
The Company has received grants for research and development from the Office of the Chief Scientist in Israel’sMinistry of Industry and Trade. To continue to be eligible for these grants, the Company’s development projects mustbe approved by the Chief Scientist on a case-by-case basis. If the Company’s development projects are not approvedby the Chief Scientist, the Company will not receive grants to fund these projects, which would increase research anddevelopment costs. The receipt of such grants subjects the Company to certain restrictions and pre-approvalrequirements, which may be conditioned on additional royalty payments with rights to transfer intellectual propertyand/or production abroad. The Company also receives tax benefits, in particular exemptions and reductions, as aresult of the approved enterprise status of certain existing operations in Israel. To be eligible for these tax benefits, theCompany must maintain its approved enterprise status by meeting conditions, including making specified investmentsin fixed assets located in Israel and investing additional equity in itself and its Israeli subsidiaries and by meetingprojections provided to the regulatory agencies. If the Company fails to meet these conditions in the future, the taxbenefits would be canceled, and the Company could be required to refund the tax benefits already received. Thesetax benefits may not be continued in the future at their current levels or at any level. If such benefits are reduced oreliminated in the future, the Company’s results of operations will be adversely impacted.
In the third quarter of fiscal 2011, Israel enacted new tax legislation. This legislation reduced the effective tax rate forqualifying entities to 10% for 2011 and 2012, 7% for 2013 and 2014, and 6% thereafter. Two of the Company's entitieswill be eligible for this benefit and management currently anticipates electing the new legislation for years beginningafter fiscal 2011. If this election is made as anticipated, the above risk will no longer be applicable for the Companyfor years beginning after fiscal 2011, as the approved enterprise status would no longer be available to the Company.
A significant disruption at any of the Company’s main manufacturing facilities could materially and adversely affect theCompany’s business, financial position and results of operations.
The Company’s U.S. operations are concentrated in Michigan, South Carolina, New York, Vermont, Ohio and Florida.Approximately 79% of the Company’s revenues are related to these manufacturing facilities. The Company hasconcentrated manufacturing facilities in Israel, which comprise approximately 14% of the Company’s revenues. Asignificant disruption resulting from, but not limited to, fire, tornado, storm, flood, cyber attacks, material supply,insufficient quality, or pandemic at any of the Company’s facilities could impair its ability to develop, produce and/orship products on a timely basis, which could have a material adverse effect on the Company’s business, financialposition and operating results.
The success of certain of the Company’s products depends on the effectiveness of its patents and other measures it34
takes to protect its intellectual property rights.
The Company’s success with certain of its products depends, in part, on its ability to protect and defend its intellectualproperty rights. If the Company fails to adequately protect its intellectual property, competitors may manufacture andmarket similar products. The Company has been issued patents covering certain of its products, and has filed, andexpects to continue to file, patent applications seeking to protect newly developed technologies and products in variouscountries, including the U.S. Any existing or future patents issued to or licensed by the Company may not provide itwith any significant competitive advantages for its products or may even be challenged, invalidated or circumventedby competitors. In addition, such patent rights may not prevent the Company’s competitors from developing, using orcommercializing non-infringing products that are similar or functionally equivalent to its products.
The Company also relies on trade secrets, unpatented proprietary know-how and continuing technological innovationthat it seeks to protect, in part by confidentiality agreements with licensees, suppliers, employees and consultants. Ifthese agreements are breached, the Company may not have adequate remedies for any such breach. Disputes mayarise concerning the ownership of intellectual property or the applicability of confidentiality agreements. Furthermore,trade secrets and proprietary technology may otherwise become known or be independently developed by competitorsor, if patents are not issued with respect to products arising from research, the Company may not be able to maintainthe value of such intellectual property rights. The Company is also increasing its research and development effortsin countries where risks of improper disclosure of trade secrets and proprietary technology are higher than in the UnitedStates and Israel.
A substantial portion of the sources of raw materials and an increasing volume of sales of the Company are outsidethe United States. Additional legislation or regulation concerning importing/exporting may be enacted, which couldhave an adverse impact on the Company’s net sales of such products and resulting income.
The Company imports and exports products and raw materials from/to several jurisdictions around the world. Thisprocess involves Company subsidiaries and third parties operating in a number of jurisdictions with different customsand import/export regulations. The regulations are subject to change from time to time and the Company cannot predictthe nature, scope or impact of these changes upon the Company’s operations. The Company is subject to periodicreviews and audits by U.S. and foreign authorities responsible for administering these regulations. To the extent thatthe Company is unable to successfully defend itself against an audit or review, the Company may be required to payassessments, penalties and increased duties, which may, individually or in the aggregate, negatively impact theCompany’s gross margins and operating results. Certain of the Company’s facilities operate in a special purposesubzone established by the U.S. Department of Commerce Foreign Trade Zone Board, which allows the Companycertain tax advantages on products and raw materials shipped through these facilities. If the U.S. Department ofCommerce Foreign Trade Zone Board were to revoke the subzone designation or limit its use by the Company, theCompany could be subject to increased duties, which may negatively impact the Company’s gross margins andoperating results.
Conducting business in international markets involves risks and uncertainties such as foreign exchange rate exposureand social, political and economic instability that could lead to increased prices for raw materials, reduced internationalsales and reduced profitability associated with such sales, which could reduce the Company’s net sales and income.
The Company sources certain key raw materials and finished products from foreign suppliers in countries that include,but are not limited to, Australia, Canada, China, Denmark, India and Mexico. The Company continues to increase itsrevenues outside the U.S. The Company’s primary markets for the sale of its products outside the U.S. are Canada,Germany, Israel, Mexico, the U.K., China and Australia. The Company may have difficulty in international markets due,for example, to regulatory barriers, the necessity of adapting to new regulatory systems and problems related to marketswith different cultural bases and political systems and strict adherence to all anti-corruption laws including the UnitedStates Foreign Corrupt Practices Act.Violenceand crime in Mexico could adversely affect the Company’smanufacturingactivities and ability to recruit and retain employees there. Sales to customers outside the U.S. and foreign raw materialpurchases expose the Company to a number of risks, including unexpected changes in regulatory requirements,possible difficulties in enforcing agreements, longer payment cycles, longer shipping lead-times, inefficient portoperations, exchange rate fluctuations, difficulties obtaining export or import licenses, the imposition of withholding orother taxes, economic or political instability, embargoes, military hostilities or exchange controls. Should any of theserisks occur, they may have a material adverse impact on the operating results of the Company.
The Company is dependent on the services of certain key executive and scientific employees. The failure to attractand retain such employees may have a material adverse impact on the Company’s results of operations.
The Company’s future success will depend in large part upon its ability to attract and retain highly skilled employees.35

Key functions for the Company include executive managers, operational managers, research and developmentscientists, information technology specialists, financial and legal specialists, regulatory professionals, qualitycompliance specialists and sales/marketing personnel. Should the Company be unable to attract or retain key qualifiedemployees, future operating results may be adversely impacted.
Changes in estimates regarding fair value of goodwill or intangible assets may result in an adverse impact on theCompany’s results of operations.
The Company tests goodwill for impairment annually or more frequently if changes in circumstances or the occurrenceof events suggest impairment exists. The test for impairment requires the Company to make several estimates aboutfair value, most of which are based on projected future cash flows. Changes in these estimates may result in therecognition of an impairment loss. The Company’s testing in the 2011 fiscal year resulted in no impairment chargesrelated to goodwill and indefinite-lived intangible assets.
Other intangible assets consist of a portfolio of individual developed product technology/formulation and product rights,distribution and license agreements, customer relationships, non-compete agreements and trade names andtrademarks. For intangible assets subject to amortization, an impairment analysis is performed whenever events orchanges in circumstances indicate that the carrying amount of any individual asset may not be recoverable. Animpairment loss is recognized if the carrying amount of the asset is not recoverable and its carrying amount exceedsits fair value. Any significant change in market conditions, estimates or judgments used to determine expected futurecash flows that indicate a reduction in carrying value may give rise to impairment in the period that the change becomesknown. See Note 7 of the Notes to Consolidated Financial Statements for further information regarding impairment ofintangible assets.
To protect itself against various potential liabilities, the Company maintains a variety of insurance programs. Significantincreases in the cost or decreases in the availability of such insurance could adversely impact the Company’s financialcondition.
The Company maintains insurance, including property, general and product liability, and directors’ and officers’ liability,to protect itself against potential loss exposures. To the extent that losses occur, there could be an adverse effect onthe Company’s financial results depending on the nature of the loss and the level of insurance coverage maintainedby the Company. The Company cannot predict whether deductible or retention amounts will increase or whethercoverage will be reduced in the future. From time to time, the Company may reevaluate and change the types andlevels of insurance coverage that it purchases.
The Company, like retailers and other distributors and manufacturers of products that are ingested, is exposed toproduct liability claims in the event that, among other things, the use of its products results in injury. There is noassurance that product liability insurance will continue to be available to the Company at an economically reasonablecost (or at all for certain products) or that the Company’s insurance will be adequate to cover liability that the Companyincurs in connection with product liability claims. See Item 3. Legal Proceedings.
The Company’s business is capital intensive and there can be no assurance that financial capital will always be availableon favorable terms or at all. In some instances, the Company may determine to issue additional shares of capital stockin order to meet its capital needs, which would dilute existing shareholders.
The Company maintains a broad product line to function as a primary supplier for its customers. Capital investmentsare driven by growth, technological advancements, cost improvement and the need for manufacturing flexibility.Estimation of future capital expenditures could vary materially due to the uncertainty of these factors. If the Companyfails to stay current with the latest manufacturing, information and packaging technology, it may be unable tocompetitively support the launch of new product introductions.
The Company anticipates that cash, cash equivalents, investment securities, cash flows fromoperations and borrowingsavailable under its credit facilities will substantially fund working capital and capital expenditures. The Company hashistorically evaluated acquisition opportunities and anticipates that acquisition opportunities will continue to be identifiedand evaluated in the future. The historical growth of sales and profits has been positively influenced by acquisitions.There is no assurance that future sales and profits will, or will not, be impacted by acquisition activities. The Company’scurrent capital structure, results of operations and cash flow needs could be materially impacted by acquisitions.
The Company’s senior credit facilities, the agreements governing its senior notes and agreements governing its otherindebtedness contain a number of restrictions and covenants that limit the Company’s ability to make distributions orother payments to its investors and creditors unless certain financial tests or other criteria are satisfied. The Company
36

also must comply with certain specified financial ratios and tests. These restrictions could affect the Company’s abilitytooperate itsbusiness and may limit itsability to takeadvantage of potential business opportunities, suchas acquisitions.If the Company does not comply with the covenants and restrictions contained in its senior credit facilities, agreementsgoverning its senior notes and agreements governing its other indebtedness, the Company could be in default underthose agreements, and the debt, together with accrued interest, could then be declared immediately due and payable.Any default under the Company’s senior credit facilities or agreements governing its senior notes or other indebtednesscould lead to an acceleration of debt under other debt instruments that contain cross-acceleration or cross-defaultprovisions. If the Company’s indebtedness is accelerated, there can be no assurance that it would be able to repayor refinance its debt or obtain sufficient new financing.
The Company has various maturity dates associated with its credit facilities, senior notes and other debt facilities.There is no assurance that cash, future borrowings or equity financing will be available for the payment or refinancingof its indebtedness. Further, there is no assurance that future refinancings or renegotiations of the Company’s seniorcredit facilities, senior notes or other debt facilities, or additional agreements will not have materially different or morestringent terms.
If the Company decides to seek additional capital through the issuance of additional shares of common stock, existingshareholders may be diluted.
Item 1B. Unresolved Staff Comments.
Not applicable.
Item 2. Properties.
The following is a list of the primary facilities owned or leased by the Company and the segment(s) that are generallysupported by the facility as of August 9, 2011:
37

LocationMichigan
New YorkSouth CarolinaOhioVermontFloridaVirginiaMinnesotaBarnsley, U.K.Braunton, U.K.Ramos Arizpe, MexicoGuadalajara Jalisco,MexicoShanghai, ChinaBalcatta, WesternAustraliaCastle Hill, New SouthWalesMaharashtra, IndiaHyderabad, IndiaYeruham, IsraelB’nei-Brak, Israel
Ramat Hovav, IsraelTel Aviv, IsraelPetach Tikva, Israel
Ambernath, India
No. ofFacilities
23
33132
1031144
31
1
1113
111
1
Approx. SquareFootage
Owned 2,060,000
—200,00095,000
220,000——
202,000—
223,000198,00083,000
—28,000
—
240,000—
203,000—
750,000—
110,000
240,000
Leased 460,000
267,000260,000
—76,400
118,00040,000
105,000100,000
—30,00070,000
14,000—
5,000
—8,000
—130,000
—10,000
—
—
SegmentsConsumer Healthcare, Nutritionals,Rx PharmaceuticalsConsumer Healthcare, Rx PharmaceuticalsNutritionalsNutritionalsNutritionalsConsumer Healthcare, NutritionalsNutritionalsRx PharmaceuticalsConsumer HealthcareConsumer HealthcareConsumer HealthcareConsumer Healthcare
NutritionalsConsumer Healthcare
Consumer Healthcare
APIPerrigo India Private Ltd.Rx PharmaceuticalsRx Pharmaceuticals, Israel Pharmaceuticals and Diagnostic Products(1), APIAPIAPIIsrael Pharmaceuticals and Diagnostic Products(1)
API(1) Represents operating segment in Other category
All of the facilities above provide manufacturing, logistics and offices to support the respective segment and/orlocation. The Company leases other minor properties for logistics and offices in the U.S., Israel, Mexico, India andChina. The Company considers all of its properties to be well-maintained and suitable for the intended purpose ofthe facility.
Item 3. Legal Proceedings.
On March 11, 2009, a purported shareholder of the Company named Michael L. Warner filed a lawsuit in the UnitedStates District Court for the Southern District of New York against the Company and certain of its officers and directors,including Joseph Papa and Judy Brown, among others. The plaintiff sought to represent a class of purchasers of theCompany's common stock during the period between November 6, 2008 and February 2, 2009. The complaint allegedviolations of Sections 10(b) and 20(a) of the Securities Exchange Act of 1934 (the Exchange Act). The plaintiff generallyalleged that the Company misled investors by failing to disclose, prior to February 3, 2009, that certain auction ratesecurities held by the Company, totaling approximately $18,000 in par value (the ARS), had been purchased fromLehman Brothers Holdings, Inc. (Lehman). The plaintiff asserted that omission of the identity of Lehman as the sellerof the ARS was material because after Lehman's bankruptcy filing, on September 15, 2008, the Company allegedlybecame unable to look to Lehman to repurchase the ARS at a price near par value. The complaint sought unspecifieddamages and unspecified equitable or injunctive relief, along with costs and attorneys' fees.
On June 15, 2009, the Court appointed several purported shareholders of the Company,namely CLALFinance Batucha38

Investment Management, Ltd., The Phoenix Insurance Company, Ltd., Excellence Nessuah Mutual Funds Management, Ltd. and Excellence Nessuah Gemel & Pension, Ltd., as Co-Lead Plaintiffs. On July 31, 2009, these Co-Lead Plaintiffs filed an amended complaint. The amended complaint dropped all claims against the individual defendants other than Joseph Papa and Judy Brown, and added a “control person” claim under Section 20(a) of the Exchange Act against the members of the Company's Audit Committee. The amended complaint asserts many of the same claims and allegations as the original pleading. It also alleges that the Company should have disclosed, prior to February 3, 2009, that Lehman had sold the ARS to the Company and had provided the allegedly inflated valuation of the ARS that the Company adopted in its Form 10-Q filing for the first quarter of fiscal 2009, which was filed with the SEC on November 6, 2008. The amended complaint also alleges that some portion of the write-down of the value of the ARS that the Company recognized in the second quarter of fiscal 2009 should have been taken in the prior quarter, immediately following Lehman's bankruptcy filing. On September 28, 2009, the defendants filed a motion to dismiss all claims against all defendants. On September 30, 2010, the Court granted in part and denied in part the motion to dismiss. The Court dismissed the “control person” claims against the members of the Company's Audit Committee, but denied the motion to dismiss as to the remaining claims and defendants. On October 29, 2010, the defendants filed a new motion to dismiss the amended complaint on the grounds that the Co-Lead Plaintiffs (who are the only plaintiffs named in the amended complaint) lack standing to sue under the U.S. securities laws following a recent decision of the United States Supreme Court holding that Section 10(b) of the Exchange Act does not apply extraterritorially to the claims of foreign investors who purchased or sold securities on foreign stock exchanges. The motion to dismiss is pending. On December 23, 2010, a shareholder named Harel Insurance, Ltd. (Harel) filed a motion to intervene as an additional named plaintiff. Although Harel is a non-U.S. investor, it claims to have purchased the Company's common stock on a U.S. exchange. On January 10, 2011, the original plaintiff, Warner, filed a motion renewing his previously withdrawn motion to be appointed as Lead Plaintiff to replace the Co-Lead Plaintiffs. These motions are pending. On June 2, 2009, a purported shareholder of the Company named Bill Drinkwine filed a purported shareholder derivative complaint in the Circuit Court of Allegan County, Michigan against a number of officers and directors of the Company, including certain of the officers and directors named as defendants in the federal securities suit described above, as well as others. Like the federal securities suit, the state court complaint alleged that the Company misled investors by failing to disclose, prior to February 3, 2009, that the ARS had been purchased from Lehman and allegedly “became worthless” when Lehman filed for bankruptcy. The complaint asserted that the officer and director defendants violated their fiduciary duties to the Company by selling shares of their personally-held Perrigo stock during the five-month period between Lehman's bankruptcy filing and the Company's February 3, 2009 disclosure of the write-down of the value of the ARS. The complaint sought to “recover” for Perrigo the proceeds received by the officer and director defendants from such stock sales. Prior to filing the suit, on March 3, 2009, Mr. Drinkwine made a demand on the Company's Board of Directors that Perrigo bring the suit directly against the accused officers and directors. In response to that demand, the Perrigo Board appointed a committee of all independent, disinterested directors (as defined by the Michigan Business Corporation Act) to investigate Mr. Drinkwine's allegations. The committee retained independent counsel to assist it in that investigation. The committee and its counsel conducted an investigation and concluded that Mr. Drinkwine's allegations were without merit and, consequently, that it would not be in Perrigo's best interests for the suit to go forward. Based on the findings of that investigation, on August 24, 2009, the Company filed a motion to dismiss the complaint pursuant to Section 495 of the Michigan Business Corporation Act, which provides that when a committee of all independent, disinterested directors makes a good faith determination, based upon a reasonable investigation, that the maintenance of a derivative suit would not be in the best interests of the corporation, the court shall dismiss the derivative proceeding. On November 3, 2010, the Court granted the Company's dismissal motion and terminated the case. Mr. Drinkwine did not appeal that ruling. In March and June of 2007, lawsuits were filed by three separate groups against both the State of Israel and the Council of Ramat Hovav in connection with waste disposal and pollution from several companies, including the Company, that have operations in the Ramat Hovav region of Israel. These lawsuits were subsequently consolidated into a single proceeding in the District Court of Beer-Sheva. The Council of Ramat Hovav in June 2008, and the State of Israel, in November 2008, asserted third party claims against several companies, including the Company. The pleadings allege a variety of personal injuries arising out of the alleged environmental pollution. Neither the plaintiffs nor the third party claimants were required to specify a maximum amount of damages, but the pleadings allege damages in excess of $72,500, subject to foreign currency fluctuations between the Israeli shekel and the U.S. dollar. While the Company intends to vigorously defend against these claims, the Company cannot reasonably predict at this time, the outcome or the liability, if any, associated with these claims.
In addition to the foregoing discussion, the Company has pending certain other legal actions and claims incurred in
39

the normal course of business. The Company believes that it has meritorious defenses to these lawsuits and/or iscovered by insurance and is actively pursuing the defense thereof. The Company believes the resolution of all of thesematters will not have a material adverse effect on its financial condition and results of operations as reported in theaccompanying consolidated financial statements. However, depending on the amount and timing of an unfavorableresolution of these lawsuits, the Company’s future results of operations or cash flow could be materially impacted ina particular period. Item 4. Reserved.
Additional Item. Executive Officers of the Registrant.
The executive officers of the Company and their ages and positions as of August 9, 2011 were:
NameJudy L. BrownThomas M. FarringtonJohn T. HendricksonScott F. JamisonTodd W. KingmaSharon KochanRefael LebelJeffrey R. NeedhamJoseph C. PapaJatin Shah, Ph.D.Michael R. StewartLouis W. Yu, Ph.D.
Age435448555143545555585961
PositionExecutive Vice President and Chief Financial OfficerSenior Vice President and Chief Information OfficerExecutive Vice President, Global Operations and Supply ChainExecutive Vice President, General Manager of NutritionalsExecutive Vice President, General Counsel and SecretaryExecutive Vice President, General Manager of Rx PharmaceuticalsExecutive Vice President and President, Perrigo IsraelExecutive Vice President, General Manager Consumer HealthcareChairman, President and Chief Executive OfficerSenior Vice President and Chief Scientific OfficerSenior Vice President, Global Human ResourcesSenior Vice President, Global Quality and Compliance
Ms. Brown was named Executive Vice President and Chief Financial Officer in July 2006. She served as Vice Presidentand Corporate Controller from September 2004 to July 2006. Previously, Ms. Brown held various senior positions infinance and operations at Whirlpool Corporation from 1998 to August 2004. Ms. Brown is a director of BeldenCorporation, an NYSE traded company, that designs, manufactures and markets cable, connectivity and networkingproducts in markets including industrial automation, enterprise, transportation, infrastructure and consumer electronics.
Mr. Farrington was named Senior Vice President and Chief Information Officer in October 2006. He formerly servedas Chief Information Officer for F. Dohmen Co. in addition to serving as a division President for JASCORP LLC fromMarch 2003 to October 2006. Prior to that position, Mr. Farringtonheld various senior positions in information technologyand finance at Dell, Inc. from 1999 to 2003.
Mr. Hendrickson was named Executive Vice President, Global Operations and Supply Chain in March 2007. He servedas Executive Vice President and General Manager, Perrigo Consumer Healthcare from August 2003 to March 2007.He served as Executive Vice President of Operations from October 1999 to August 2003.
Mr. Jamison was named Executive Vice President, General Manager of Nutritionals in January 2011. Before theCompany acquired PBM in fiscal 2010, Mr. Jamison had served as PBM's Executive Vice President and GeneralCounsel since the formation of PBM in 1997 and was a key member of the executive team throughout the evolutionand growth of PBM. In addition to his legal responsibilities, Mr. Jamison has held senior leadership responsibilities inoperations and sales, as well as in new business and product development.
Mr. Kingma was named Executive Vice President in May 2006. He served as Vice President, General Counsel andSecretary from August 2003 to May 2006. Previously, Mr. Kingma held various positions at Pharmacia Corporationfrom 1991 through August 2003. His last position with Pharmacia Corporation was Vice President and AssociateGeneral Counsel, Global Specialty Operations.
Mr. Kochan was named Executive Vice President, General Manager of Rx Pharmaceuticals in March 2007. He servedas Senior Vice President of Business Development and Strategy from March 2005 to March 2007. Mr. Kochan wasVice President, Business Development of Agis Industries (1983) Ltd. from July 2001 until the acquisition of Agis bythe Company in March 2005.
40

Mr. Lebel was named Executive Vice President and President, Perrigo Israel in March 2005. He served as Agis’ ChiefExecutive Officer from August 2003 to March 2005 and was its Vice President and Chief Financial Officer from January2001 to August 2003 and Finance Manager and Controller from October 1988 to December 2000.
Mr. Needham was named Executive Vice President, General Manager Consumer Healthcare in October 2009. Heserved as Senior Vice President of Commercial Business Development from March 2005 through October 2009.Previously, he served as Senior Vice President of International from November 2004 to March 2005. He served asManaging Director of Perrigo’s U.K. operations from May 2002 to November 2004 and as Vice President of Marketingfrom 1993 to 2002.
Mr. Papa joined the Company in October 2006 as President and Chief Executive Officer. Mr. Papa was elected as adirector in November 2006 and, subsequently, was appointed as Chairman of the Board of Directors in October 2007.Previously, Mr. Papa served from December 2004 to October 2006 as Chairman and Chief Executive Officer of thePharmaceutical and Technologies Services segment of Cardinal Health, Inc. Prior to that position, he served asPresident and Chief Operating Officer of Watson Pharmaceuticals, Inc. from November 2001 to November 2004.Additionally, Mr. Papa has held management positions at DuPont Pharmaceuticals, Pharmacia Corporation, G.D.Searle & Company and Novartis AG. Mr. Papa is a director of Smith & Nephew, a developer of advanced orthopedicmedical devices.
Dr. Shah was named Senior Vice President and Chief Scientific Officer in June 2005. He served as Vice President ofResearch and Development for Rx products from February 2004 to June 2005. Previously, Dr. Shah held varioussenior positions in Research and Development at Mayne Pharma (known previously as Faulding Pharmaceuticals)from June 1996 to January 2004.
Mr. Stewart was named Senior Vice President, Global Human Resources in September 2004. He served as VicePresident, Human Resources from July 1993 to September 2004. Mr. Stewart began his employment with Perrigo inAugust 1981.
Dr. Yu joined the Company in November 2006 as Senior Vice President, Global Quality and Compliance. Previously,Dr. Yu served from October 2005 to October 2006 as Vice President, Quality at CV Therapeutics Inc. Prior to thatposition, he served as Global Head of Quality & Compliance for Forest Laboratories, Inc. from April 1999 to October2005. He served as the Vice President, Quality & Compliance for Solvay Pharmaceuticals between October 1996 andMarch 1999. Currently, he is associated with the University of Wisconsin, serving as Adjunct Professor, ExtensionServices in Pharmacy, School of Pharmacy.
PART II.(Dollar and share amounts in thousands, except per share amounts)
Item 5. Market for Registrant's Common Equity Related Stockholder Matters and Issuer Purchases of Equity
Securities.
The Company’s common stock was first quoted and began trading on the NASDAQ Stock Market on December 17,1991, and now trades on the NASDAQ Global Select Market (NASDAQ) under the symbol PRGO. In association withthe acquisition of Agis Industries (1983) Ltd. (Agis), the Company’s common stock also began trading on the Tel AvivStock Exchange (TASE) on March 16, 2005.
Set forth below are the high and low prices for the Company’s common stock as reported on NASDAQ for the lasteight quarters:
NASDAQFirst QuarterSecond QuarterThird QuarterFourth Quarter
Fiscal Year2011
High$ 67.49$ 68.38$ 77.96$ 92.30
Low$ 54.58$ 58.25$ 62.31$ 76.10
2010High
$ 32.94$ 40.94$ 58.67$ 64.66
Low$ 25.91$ 31.69$ 37.46$ 53.10
The number of record holders of the Company’s common stock as of August 9, 2011 was 857.
41

The graph below shows a five-year comparison of cumulative total return for the Company with the cumulative total returns for the NASDAQ Composite Index and the NASDAQ Pharmaceutical Index. Data points are, for the Company, the last day of each fiscal year and, for the indices, June 30 of each year. The last day of the Company’s fiscal year for fiscal years 2006 through 2011 is noted in each of the columns below. The graph assumes an investment of $100 at the beginning of the period and the reinvestment of any dividends.
Perrigo CompanyNASDAQ CompositeNASDAQPharmaceutical
7/1/2006$100$100
$100
6/30/2007$123$122
$105
6/28/2008$206$108
$101
6/27/2009$177$87
$96
6/26/2010$379$100
$96
6/25/2011$552$133
$127
* $100 invested on July 1, 2006 in stock or index - including reinvestment of dividendsIndexes calculated on month-end basis.
In January 2003, the Board of Directors adopted a policy of paying regular quarterly dividends. The Company paid dividends of $25,303, $22,329 and $19,957 or $0.2725, $0.2425 and $0.2150 per share during fiscal 2011, 2010 and 2009, respectively. The declaration and payment of dividends and the amount paid, if any, are subject to the discretion of the Board of Directors and will depend on the earnings, financial condition, capital and surplus requirements of the Company and other factors the Board of Directors may consider relevant.
On February 1, 2008, the Board of Directors approved a plan to repurchase shares of common stock with a value of up to $150,000. The Company completed purchases under this plan on December 16, 2009. In accordance with the Michigan Business Corporation Act, under which the Company is incorporated, all common stock repurchased by the Company becomes authorized but unissued stock and is available for reissuance in the future for general corporate purposes.
42
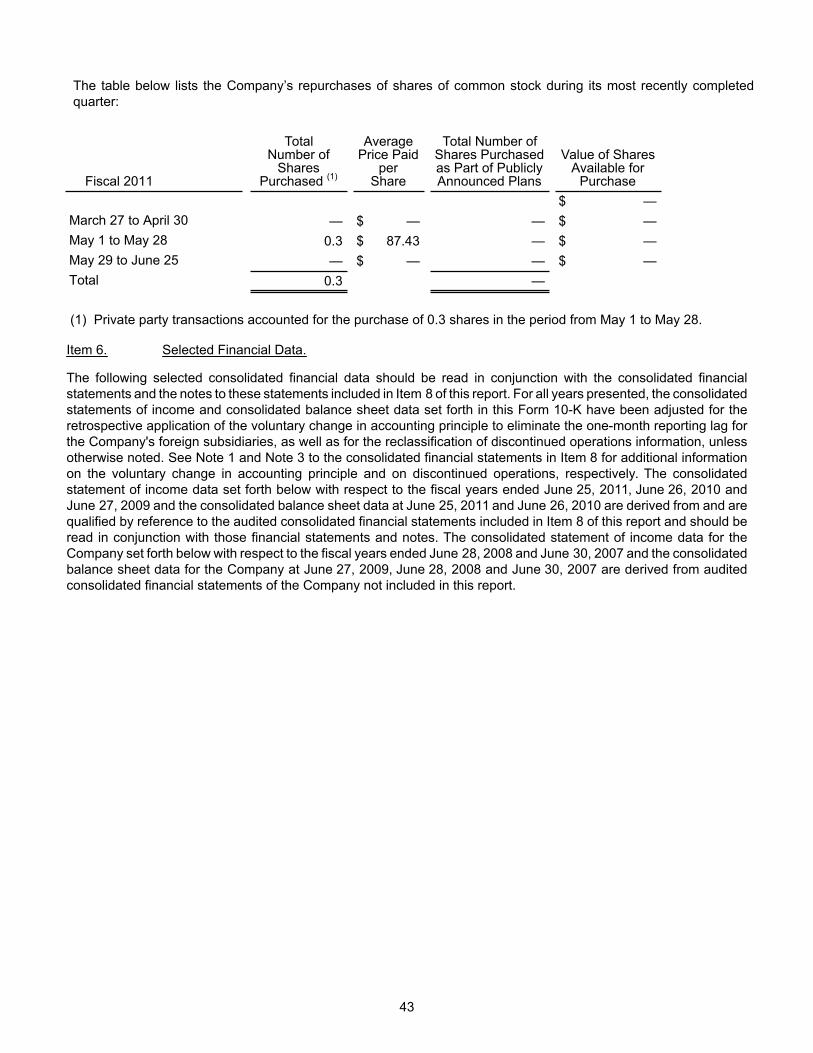
Fiscal 2011
March 27 to April 30May 1 to May 28May 29 to June 25Total
TotalNumber of
SharesPurchased (1)
—0.3—
0.3
AveragePrice Paid
perShare
$ —$ 87.43$ —
Total Number ofShares Purchasedas Part of PubliclyAnnounced Plans
————
Value of SharesAvailable for
Purchase$ —$ —$ —$ —
(1) Private party transactions accounted for the purchase of 0.3 shares in the period from May 1 to May 28.
Item 6. Selected Financial Data.
The following selected consolidated financial data should be read in conjunction with the consolidated financial statements and the notes to these statements included in Item 8 of this report. For all years presented, the consolidated statements of income and consolidated balance sheet data set forth in this Form 10-K have been adjusted for the retrospective application of the voluntary change in accounting principle to eliminate the one-month reporting lag for the Company's foreign subsidiaries, as well as for the reclassification of discontinued operations information, unless otherwise noted. See Note 1 and Note 3 to the consolidated financial statements in Item 8 for additional information on the voluntary change in accounting principle and on discontinued operations, respectively. The consolidated statement of income data set forth below with respect to the fiscal years ended June 25, 2011, June 26, 2010 and June 27, 2009 and the consolidated balance sheet data at June 25, 2011 and June 26, 2010 are derived from and are qualified by reference to the audited consolidated financial statements included in Item 8 of this report and should be read in conjunction with those financial statements and notes. The consolidated statement of income data for the Company set forth below with respect to the fiscal years ended June 28, 2008 and June 30, 2007 and the consolidated balance sheet data for the Company at June 27, 2009, June 28, 2008 and June 30, 2007 are derived from audited consolidated financial statements of the Company not included in this report.
43
The table below lists the Company’s repurchases of shares of common stock during its most recently completed quarter:

Statement of Income DataNet salesCost of salesGross profitOperating expenses
DistributionResearch and developmentSelling and administration
SubtotalWrite-off of in-process research anddevelopmentRestructuring
Total
Operating incomeInterest, netOther expense (income), netInvestment impairmentIncome from continuing operationsbefore income taxesIncome tax expenseIncome from continuing operationsIncome (loss) from discontinuedoperations, net of taxNet incomeBasic earnings from continuingoperations per shareDiluted earnings from continuingoperations per shareBasic earnings per shareDiluted earnings per shareWeighted average shares outstanding:
BasicDiluted
Dividends declared per share
Fiscal Year2011(1)
$ 2,755,0291,810,159
944,870
34,68489,250
329,698453,632
—1,033
454,665
490,20542,312(2,661)
—
450,554109,996340,558
(1,361)$ 339,197
$ 3.69
$ 3.64$ 3.67$ 3.63
92,31393,529
$ 0.2725
2010(1)(2)(3)
$ 2,268,1501,521,917
746,233
28,32283,515
269,974381,811
19,0009,523
410,334
335,89928,415(1,165)
—
308,64984,215
224,434
(635)$ 223,799
$ 2.46
$ 2.42$ 2.45$ 2.41
91,39992,845
$ 0.2425
2009(1)(2)(4)
$ 2,005,5901,408,490
597,100
24,09076,783
231,813332,686
27914,647
347,612
249,48826,9951,108
15,104
206,28163,452
142,829
2,704$ 145,533
$ 1.55
$ 1.53$ 1.58$ 1.55
92,18393,629
$ 0.215
2008(2)(5)
$ 1,727,4801,211,983
515,497
25,27672,788
219,576317,640
2,7862,312
322,738
192,75918,134(1,562)
—
176,18737,376
138,811
(4,561)$ 134,250
$ 1.49
$ 1.46$ 1.44$ 1.41
93,12495,210
$ 0.195
2007(2)(6)
$ 1,367,7171,003,459
364,258
23,54366,154
171,571261,268
8,252879
270,399
93,85915,383(4,146)
—
82,62213,55869,064
1,188$ 70,252
$ 0.75
$ 0.74$ 0.76$ 0.75
92,23093,807
$ 0.178(1) See Item 7 for management's discussion of results of operations.(2) Financial data has been retrospectively adjusted due to the voluntary change in accounting principle to eliminate the
one-month reporting lag for the Company's foreign subsidiaries. See Note 1 of the Notes to Consolidated Financial Statements for additional information regarding the voluntary change in accounting principle.
(3) Includes the results of operations for Orion and PBM for the four and two months ended June 26, 2010, respectively.(4) Includes the results of operations for JBL and Unico for the nine and eight months ended June 27, 2009, respectively,
as well as the results of operations for Diba for the nine months ended June 27, 2009.(5) Includes the results of operations for Galpharm for the six months ended June 28, 2008.(6) Includes the results of operations for Glades for the three months ended June 30, 2007.
44

Balance Sheet DataCash and current portion of investmentsecuritiesRestricted cashWorking capital, excluding cash andcurrent portion of investment securitiesProperty and equipment, netGoodwill and other indefinite-livedintangible assetsOther intangible assets, netTotal assetsLong-term debt, less current portionShareholders’ equity
June 25,2011
$ 310,104—
462,679507,308
644,902567,573
3,189,221875,000
1,530,987
June 26, 2010(1)
$ 110,324400,000
367,863448,583
618,042587,000
3,109,003935,000
1,093,940
June 27, 2009(1)
$ 317,640400,000
303,905352,342
267,458210,544
2,422,053875,000916,656
June 28, 2008(1)
$ 337,424400,000
302,273333,507
275,954219,599
2,542,402894,511914,365
June 30,2007(1)
$ 65,643422,000
245,993310,821
189,158148,983
1,895,587649,198732,762
(1) Financial data has been retrospectively adjusted due to the voluntary change in accounting principle to eliminate the one-month reporting lag for the Company's foreign subsidiaries. See Note 1 of the Notes to Consolidated Financial Statements for additional information regarding the voluntary change in accounting principle.
Item 7. Management's Discussion and Analysis of Financial Condition and Results of Operations.
OVERVIEW
Perrigo Company (the Company) traces its history back to 1887. What was started as a small local proprietor selling medicinals to regional grocers has evolved into a leading global pharmaceutical company that manufactures and distributes more than 40 billion oral solid doses and several hundred million liquid doses, as well as dozens of other product forms, each year. The Company’s mission is to offer uncompromised “quality, affordable healthcare products”, and it does so across a wide variety of product categories primarily in the U.S., U.K., Mexico, Israel and Australia, as well as certain other markets throughout the world, including Canada, China and Latin America.
Segments – The Company has four reportable segments, aligned primarily by type of product: Consumer Healthcare, Nutritionals, Rx Pharmaceuticals and API. In addition, the Company has an Other category that consists of the Israel Pharmaceutical and Diagnostic Products operating segment, which does not individually meet the quantitative thresholds required to be a separately reportable segment.
The Consumer Healthcare segment is the world’s largest store brand manufacturer of over-the-counter (OTC) pharmaceutical products. This business markets products that are comparable in quality and effectiveness to national brand products. The cost to the retailer of a store brand product is significantly lower than that of a comparable nationally advertised brand-name product. The retailer, therefore, can price a store brand product below the competing national brand product yet realize a greater profit margin. Generally the retailers’ dollar profit per unit of store brand product is greater than the dollar profit per unit of the comparable national brand product. The consumer benefits by receiving a high quality product at a price below the comparable national brand product. Therefore, the Company's business model saves consumers on their annual healthcare spending. The Company, one of the original architects of private label pharmaceuticals, is the market leader for consumer healthcare products in many of the geographies where it currently competes – the U.S., U.K., and Mexico. The Company's market share of store brand private label OTC products has grown in recent years as new products, retailer efforts and economic events have directed consumers to the value of store brand product offerings.
In the first quarter of fiscal 2011, the Company realigned and expanded its reportable segments to include its Nutritionals segment, representing infant formulas and other nutritional products. This realignment followed the Company’s acquisition, in the fourth quarter of fiscal 2010, of PBM Holdings, Inc. (PBM), the leading manufacturer and distributor of store brand infant formulas, pediatric nutritionals and baby foods sold by leading retailers in the mass, club, grocery and drug channels in the U.S., Canada, Mexico and China. This segment structure is consistent with the way management makes operating decisions and manages the growth and profitability of the Company’s business. As a result of the change in segment reporting, all historical information has been adjusted to conform to the new presentation.
The Nutritionals segment manufactures, markets and distributes infant formula products, infant and toddler foods, vitamin, mineral and dietary supplement (VMS) products, and oral electrolyte solution products to retailers and
45

consumers in the U.S., Canada, Mexico and China. Similar to the Consumer Healthcare segment, this business marketsproducts that are comparable in quality and effectiveness to the national brand products. The cost to the retailer of astore brand product is significantly lower than that of a comparable nationally advertised brand-name product. Theretailer, therefore, can price a store brand product below the competing national brand product yet realize a greaterprofit margin. All infant formulas sold in the U.S. are subject to the same regulations governing manufacturing andingredients under the Infant Formula Act. Store brands, which are value priced and offer substantial savings toconsumers, must meet the same U.S. Food and Drug Administration (FDA) nutritional requirements as the nationalbrands.
The Rx Pharmaceuticals segment develops, manufactures and markets a portfolio of generic prescription (Rx) drugsin the U.S. The Company defines this portfolio as predominantly “extended topical” in nature as it encompasses abroad array of topicals including creams, ointments, lotions, gels, shampoos, foams, suppositories, sprays, liquids,suspensions and solutions. The strategy in the Rx Pharmaceuticals segment is to be the first to market with those newproducts that are exposed to less competition because they have more difficult to develop formulations and cost muchmore to complete. In addition, the Rx Pharmaceuticals segment offers OTC products through the prescription channel(referred to as “ORx®” marketing). ORx® products are OTC products that are available for pharmacy fulfillment andhealthcare reimbursement when prescribed by a physician. The Company offers over 200 ORx® products that arereimbursable through many health plans and Medicaid and Medicare programs. When prescribed by a doctor or otherhealthcare professional, ORx® products offer consumers safe and effective remedies that provide an affordablealternative to the higher out-of-pocket costs of traditional OTC products. The Company’s ORx® strategy is to registerOTC products for reimbursement through public and private health plans, as well as leverage its portfolio and pipelineof OTC products for generic substitution when appropriate. The recent acquisition of Paddock Laboratories, Inc.(Paddock), which closed subsequent to the Company's fiscal year end on July 26, 2011, expanded the Company’sgeneric Rx product offering, pipeline and scale.
The API segment develops, manufactures and markets active pharmaceutical ingredients (API) used worldwide bythe generic drug industry and branded pharmaceutical companies. The strategy of the API segment is to focusdevelopment efforts on the synthesis of less common molecules for its customers, as well as for the more complexproducts within the Consumer Healthcare and Rx Pharmaceuticals development pipelines. This segment is undergoinga strategic platform transformation, moving certain production from Israel to the acquired API manufacturing facility inIndia to allow for lower cost production and to create space for other, more complex production in Israel. The fiscal2010 sale of the Company’s facility in Germany also supports this footprint change.
In addition to general management and strategic leadership, each business segment has its own sales and marketingteams focused on servicing the specific requirements of its customer base. All of these business segments shareResearch & Development (R&D), Supply Chain, Information Technology, Finance, Human Resources, Legal andQuality services, all of which are directed out of the Company’s headquarters in Allegan, Michigan.
Over recent years, the Company has been executing a strategy designed to expand its product offering through bothadvanced R&D and acquisitions and to reach new healthcare consumers through entry into new markets. This strategyis accomplished by investing in and continually improving all aspects of its five strategic pillars: high quality, superiorcustomer service, leading innovation, best cost and empowered people. The concentration of common shared serviceactivities around the world and development of centers of excellence in R&D have played an important role in ensuringthe consistency and quality of the Company’s five strategic pillars.
Principles of Consolidation – The consolidated financial statements include the accounts of the Company and allmajority owned subsidiaries. All intercompany transactions and balances have been eliminated in consolidation. Priorto June 27, 2010, the Company’s consolidated results of operations and financial position included the financial resultsof its U.K., Mexico, Germany and Israel subsidiaries on a twelve-month period ending in May, resulting in a one-monthreporting lag when compared to the remainder of the Company.
Starting June 27, 2010, the reporting year-end of these foreign operations was changed from May to June. Thepreviously existing one-month reporting lag was eliminated as it was no longer required to achieve a timely consolidationdue to the Company’s investments in technology, ERP systems and personnel to enhance its financial statement closeprocess. The Company believes this change is preferable because financial information of all operating units is nowreported based on the same period-end, which improves overall financial reporting to investors by providing the mostcurrent information available. The Company’s financial statements for periods prior to fiscal 2011 have been adjustedto reflect the period-specific effects of applying this change in accounting principle. This change resulted in a cumulativeeffect of an accounting change of $1,602, net of income tax effect, to retained earnings as of June 29, 2008. Theimpact of this change in accounting principle to eliminate the one-month lag for foreign subsidiaries is summarized in
46

Note 1 of the Notes to Consolidated Financial Statements.
The Company’s fiscal year is a 52 or 53 week period, which ends the Saturday on or about June 30. Fiscal years 2011,2010 and 2009 were comprised of 52 weeks and ended June 25, 2011, June 26, 2010 and June 27, 2009, respectively.Fiscal 2012 will be comprised of 53 weeks ending June 30, 2012. As a result, the Company's operating results forfiscal 2012 will include results related to this additional week.
Current Year Results – Net sales from continuing operations for fiscal 2011 were $2,755,029, an increase of 21% overfiscal 2010. The increase was driven primarily by approximately $304,000 of net sales attributable to the acquisitionsof PBM and Orion Laboratories Pty., Ltd. (Orion) and new product sales of approximately $192,000. Gross profit of$944,870 was an increase of 27% over fiscal 2010. The gross profit percentage in fiscal 2011 was 34.3%, which ishigher than the fiscal 2010 gross profit percentage of 32.9% due primarily to new products and the acquisition of PBMin fiscal 2011. Operating expenses were $454,665, an increase of 11% over fiscal 2010, due primarily to the impactof acquisitions. As a percentage of net sales, operating expenses were 16.5%, down from 18.1% in fiscal 2010. Incomefrom continuing operations was $340,558, an increase of 52% over fiscal 2010. Net income was $339,197, an increaseof 52% over fiscal 2010. New products, strong demand for the Company’s OTC products, strategic acquisitions andstrict cost management all contributed to the record growth in fiscal 2011.
Cash flow from operations of $373,961 was also an historic record as a result of the Company's growth of net income.
Further details related to current year results are included below under Results of Continuing Operations.
Growth Strategy and Strategic Transactions
Management expects to continue to grow the Company both organically and inorganically. The Company continuallyreinvests in its own R&D pipeline and at the same time also works with partners as necessary to strive to be first tomarket with new products. Recent years have seen strong organic growth as a series of very successful new productshave been launched in Consumer Healthcare. Inorganic growth is expected to be achieved through continued expansioninto adjacent products, product categories and channels, as well as new geographic markets. While ever-consciousof the challenges associated with the current economic environment, the Company continues to identify opportunitiesto grow and at the same time positions itself to address the uncertainties that lie ahead. In fiscal 2011, the Companycontinued its strategic growth in adjacent product categories with the announcement of the Paddock acquisition inJanuary 2011 and entered into an exclusive agreement with AgaMatrix in February 2011 to sell and distribute bloodglucose monitors and test strips in the U.S. store brand channel. The Paddock acquisition, which was completedsubsequent to fiscal 2011, expanded the Company’s generic Rx product offering, pipeline and scale. Fiscal 2011geographic expansion included the commencement of OTC infant formula sales to Costco in Canada, along withcontinued regulatory progress related to the Company's recent acquisition of Orion Laboratories in Australia, wherethe Company received, in various forms, over 100 product approvals from the TGA with another 75 pending.
Strategic Evaluations and Transformations
The Company’s management evaluates business performance using a Return on Invested Capital (ROIC) metric. Thisincludes evaluating the performance of business segments, manufacturing locations, product categories and capitalprojects. Business segments' performance is expected to meet or exceed the Company’s weighted average cost ofcapital (WACC) each year. All potential acquisition targets are evaluated on whether they have the capacity to deliveran ROIC in excess of 2 to 2.5 percentage points over the Company's WACC within three years. Capital expendituresand large projects are required to demonstrate that they will contribute positively on ROIC in excess of the Company’sWACC.
As part of this annual strategic review of consolidated ROIC, in March 2009, the Company committed to a plan to sellits Israel Consumer Products business. The financial results of this business, which were previously reported as partof the Company's Other category, have been classified as discontinued operations in the consolidated financialstatements for all periods presented. The sale was completed in the third quarter of fiscal 2010. After the finalizationof post-closing working capital adjustments in the third quarter of fiscal 2011, the sale resulted in a pre-tax loss of$1,407. Unless otherwise noted, amounts and disclosures throughout Management's Discussion and Analysis relateto the Company’s continuing operations. See Note 3 of the the Notes to Consolidated Financial Statements foradditional information regarding discontinued operations.
Also, in the fourth quarter of fiscal 2009, the Company evaluated the API business in the context of the expected futurecompetitive dynamics in API and the Company’s strategic focus on specialty molecules and vertical integration.Management determined that the German API facility was no longer competitive from a global cost position. At that
47

time, the Company did not anticipate that there would be a viable market for the sale of this facility and related operations,and accordingly, the Company planned to cease all operations at the facility during the first quarter of fiscal 2011.During the third quarter of fiscal 2010, however, the Company was approached by an external party who offered tobuy the German API facility and related operations from the Company. Subsequent to the third quarter of fiscal 2010,the Company signed an agreement and closed the transaction with the third-party buyer for the sale of the GermanAPI facility and related operations. As part of its German restructuring plan, the Company incurred net charges of$6,775 and $2,049 in the third and fourth quarters of fiscal 2010, respectively. See Note 18 of the Notes to ConsolidatedFinancial Statements for additional information regarding the sale of the German API facility and related operations.
To further improve the long-term cost position of its API business, on August 6, 2009, the Company acquired an 85%stake in Vedants Drug & Fine Chemicals Private Limited, an API manufacturing facility in India, for $11,500 in cash.The facility, located approximately 30 miles outside of Mumbai, is currently under construction and will manufacturethe Company’s current and future high-volume API products, as well as expand the Company’s vertical integration ofRx and future candidate Rx-to-OTC switch products. Manufacturing of API at this facility is expected to begin in thesecond half of fiscal 2012 and will include certain API products currently manufactured in Israel and those that hadbeen manufactured in Germany.
Refer to Item 1. – Business for additional information regarding each of these strategic transactions.
Capital and Liquidity
The Company’s goal in managing its capital structure is to provide sufficient liquidity to enable it to pursue its businessgoals and objectives while optimizing long-term flexibility. Over its recent history, the Company has placed increasedfocus on the importance of funding a majority of its core objectives through cash flows from operations. Managementis incented to achieve improved cash flows from operations through individual segment operating income and workingcapital targets and strives to achieve annual cash flows from operations greater than net income. Historically, theCompany has targeted capital expenditures at a level to approximate annual depreciation expense. Capitalexpenditures for fiscal 2011 were at higher levels to allow for capacity expansion, quality and technology investments,API strategic transformations and integration of acquisitions. Capital expenditures for fiscal 2012 are expected to beat or slightly above fiscal 2011 levels to allow for continued manufacturing productivity and capacity projects, qualityand technology investments, investments at newly acquired entities, market driven packaging changes and the APIexpansion into India. The Company has historically provided shareholder return of capital through its dividend policy,payments under which have increased steadily over recent years. Share repurchases authorized by the Company’sBoard of Directors are evaluated against alternative uses of cash, such as acquisitions and debt repayments, andwhen approved are typically made at levels to help offset the dilutive effects of share-based compensation awards.Refer to the Financial Condition, Liquidity and Capital Resources and Results of Operations sections below for a moredetailed discussion of the Company’s capital and liquidity.
Events that May Impact Future Results
Subsequent to the Company's fiscal year end, on July 26, 2011, the Company completed the acquisition of substantiallyall of the assets of privately-held Paddock for approximately $547,000 in cash. The Company funded the transactionusing a new $250,000 five-year term loan, $212,000 of cash on hand and $85,000 from its accounts receivablesecuritization program. As of the end of the fourth quarters of fiscal 2011, the Company had incurred $2,560 ofacquisition costs, of which $1,315, $695 and $550 were expensed in operations in the second, third and fourth quarterof fiscal 2011, respectively. Headquartered in Minneapolis, Minnesota, Paddock is a manufacturer and marketer ofgeneric Rx pharmaceutical products. As part of closing the acquisition, the Company divested a small portfolio ofgeneric pharmaceutical products in response to the Federal TradeCommission (FTC) review. Theacquisition expandedthe Company’s generic Rx product offering, pipeline and scale and is expected to add over $200,000 in sales on anannual basis.
On June 29, 2010, the Company announced that it had acquired the exclusive sales and distribution rights to certainOTC store brand products that are generic equivalents of Allegra® and Allegra D-12® from Teva PharmaceuticalIndustries Ltd. (Teva). Teva had previously settled its patent litigation with the brand (Sanofi-Aventis) and obtained alicense to market these products. On January 25, 2011, Sanofi-Aventis announced that the FDA had approved theswitch of its Allegra® line of products from an Rx to OTC marketing authorization. The Company’s partner, Teva, wasresponsible for seeking the necessary OTC approvals from the FDA to enable the launch of fexofenadine 60 mg and180 mg tablets, and the fexofenadine/pseudoephedrine 12-hour product. In April 2011, Teva obtained approval forboth dosages and the Company launched store brand fexofenadine 180 mg tablets. The Company currently expectsto launch store brand fexofenadine 60 mg tablets during first quarter of fiscal 2012. The Company expects that the
48

launch of store brand fexofenadine products will have a positive impact to both sales and gross margin in the Consumer Healthcare segment for fiscal 2012.
Over the past several years, the Company has been developing the API temozolomide for various finished dose partners in several global markets. In the third quarter of fiscal 2010, the Company launched temozolomide into the European market. On February 2, 2010, the Company announced that it would exclusively supply Teva with the API for the generic version of Temodar® (temozolomide) in the U.S. market. Teva will manufacture, market and distribute the product in the U.S., and the Company will share equally with Teva in the profitability of the product sold. Teva was the first company to file an Abbreviated New Drug Application (ANDA) that contained a Paragraph IV certification for Temodar® and is eligible to receive 180-day Hatch-Waxman statutory exclusivity to market this product in the U.S. On January 26, 2010, the United States District Court for the District of Delaware held that the patent protecting temozolomide was unenforceable. On March 1, 2010, the FDA granted final approval to the Teva ANDA, but Teva did not launch the product at that time. Merck appealed the ruling and on November 9, 2010, the appeals court reversed the trial decision, preventing the launch of the Teva product. Teva filed a petition for the entire appeals court to rehear the case, and on February 29, 2011 the court denied the motion. Teva is considering whether to appeal the appeals court ruling to the United States Supreme Court. By agreement reached between Teva and Merck, Teva will not be able to launch the product until August 2013, except in limited circumstances. The Company expects its share in the profits of the product could have a material positive impact on its operating results; however, the magnitude and timing of the profits the Company could realize are uncertain and are subject to factors beyond the Company’s control, including, but not limited to, the timing of the product launch date by Teva in the U.S.
Beginning in the third quarter of fiscal 2010, a branded competitor in the OTC market began to experience periodic interruptions of distribution of certain of their products in the adult and pediatric analgesic categories. These interruptions have included periods of time where supply of certain products has been suspended altogether. Due to this situation, which has continued through the fourth quarter of fiscal 2011, the Company experienced an increase in demand for certain adult and pediatric analgesic products. This increased demand has generally had a positive impact on the Consumer Healthcare segment’s sales. To the extent that products from this key competitor remain absent from the market in fiscal 2012, this could continue to benefit the Company’s Consumer Healthcare sales and results of operations. At this time, the Company cannot predict when products from this competitor will make a full return to the market.
49

Net salesCost of salesGross profitOperating expenses
DistributionResearch and developmentSelling and administration
SubtotalWrite-off of in-process research and developmentRestructuring
TotalOperating incomeInterest and other, netInvestment impairmentIncome from continuing operations before income taxesIncome tax expenseIncome from continuing operationsIncome (loss) from discontinued operations, net of taxNet income
Fiscal Year 2011(1)
%100.065.734.3
1.33.2
12.016.5
—0.0
16.517.81.4—
16.44.0
12.4(0.0)12.3
2010(1) %
100.067.132.9
1.23.7
11.916.80.80.4
18.114.81.2—
13.63.79.9
(0.0)9.9
2009(1) %
100.070.229.8
1.23.8
11.616.60.00.7
17.312.41.40.8
10.33.27.10.17.3
(1) The sum of individual percentages may not equal due to rounding.
Consumer Healthcare
Net salesGross profitGross profit %Operating expensesOperating expenses %Operating incomeOperating income %
Fiscal Year2011
$ 1,684,938$ 531,390
31.5%$ 238,293
14.1%$ 293,097
17.4%
2010$ 1,573,749$ 523,409
33.3%$ 219,732
14.0%$ 303,677
19.3%
2009$ 1,412,550$ 443,697
31.4%$ 203,649
14.4%$ 240,048
17.0%
Net Sales
Net sales for fiscal 2011 increased 7% or $111,189 compared to fiscal 2010. The increase was due primarily to an increase in sales of existing products of approximately $51,000, primarily in the analgesics and cough/cold categories, along with new product sales of approximately $54,200, primarily in the analgesics, gastrointestinal, feminine hygiene, smoking cessation and cough/cold categories. In addition, incremental net sales attributable to the acquisition of Orion were approximately $21,700. These combined increases were partially offset by a decline of $22,000 in sales of existing products, primarily in the contract manufacturing and gastrointestinal categories. International sales of existing products in the U.K. and Mexico increased approximately $6,000. The changes discussed above also reflect the impact of favorable changes in foreign currency exchange rates, which increased net sales by approximately $6,900.
Net sales for fiscal 2010 increased 11% or $161,199 compared to fiscal 2009. The increase was comprised of
50
RESULTS OF OPERATIONS
The Company’s consolidated statements of income, expressed as a percent of net sales, are presented below:
approximately $160,000 of domestic sales and $1,500 in international sales. The domestic increase resulted fromapproximately $46,400 in incremental sales from the acquisitions of Orion, J.B. Laboratories (JBL) and Unico Holdings,Inc. (Unico), new product sales of approximately $61,000, along with higher unit sales of existing products in thegastrointestinal, cough/cold and analgesics categories of approximately $60,200. These combined domestic increaseswere partially offset by a decline of $7,700 in sales of existing products primarily in the feminine hygiene and smokingcessation categories. The slight increase in international sales was driven primarily by new product sales of $4,700and incremental sales of $1,900 from the acquisition of Laboratorios Diba, S.A. (Diba). These increases were partiallyoffset by unfavorable changes in foreign currency exchange rates, which reduced net sales by approximately $4,400.
Gross Profit
Gross profit for fiscal 2011 increased 2% or $7,981 compared to fiscal 2010. The increase was due primarily to grossprofit attributable to the increase in sales of existing products of approximately $9,000, gross profit contribution on newproduct sales and incremental gross profit of approximately $9,500 attributable to the Orion acquisition. These increaseswere partially offset by higher manufacturing and inventory costs related to ongoing continuous improvement initiativesat the Michigan facilities, which resulted in a 180 basis point decrease in the fiscal 2011 gross profit percentage.
Gross profit for fiscal 2010 increased 18% or $79,712 compared to fiscal 2009. The increase resulted from a favorablemix of products sold domestically within the gastrointestinal, analgesics and cough/cold categories, which addedapproximately $42,200 of gross profit, higher gross profit contributions from new product sales, $10,000 of lowerinventory costs and incremental gross profit of $11,900 from the acquisitions of Orion, JBL, Unico and Diba. Fiscal2009 gross profit was unfavorably impacted by a $2,923 charge to cost of sales related to the step-up in value ofinventory acquired in the JBL, Unico and Diba acquisitions and a $1,600 fixed asset impairment charge.
Operating Expenses
Operating expenses for fiscal 2011 increased 8% or $18,561 compared to fiscal 2010. The increase, which included$12,600 of incremental operating expenses from the acquisition of Orion, was related primarily to increases in sellingexpenses of $10,000, administrative expenses of $2,900 and research and development expenses of $2,300. Sellingexpenses increased due primarily to higher spending on sales and marketing promotions, along with the incrementalselling expenses of Orion. The increase in administrative expenses was driven primarily by the incrementaladministrative expenses of Orion and an increase in bad debt expenses. Research and development expensesincreased primarily as a result of the timing of clinical trials and incremental expenses of Orion. Fiscal 2011 includedrestructuring costs of $1,033 related to the Company's Florida production facility.
Operating expenses for fiscal 2010 increased 8% or $16,083 compared to fiscal 2009. The increase was relatedprimarily to higher administrative expenses of $5,600 and research and development costs of $5,300. In addition,distribution and selling expenses increased a combined $5,100. The majority of the increase in administrative costswas attributable to the Orion acquisition and an increase in variable incentive and profit sharing-based compensationrelated to the Company’s performance, offset slightly by a decrease in bad debt expense. The increase in researchand development costs was driven primarily by higher material purchases, litigation expenses and the inclusion of theOrion acquisition. Selling and distribution expenses increased due primarily to the inclusion of expenses related toOrion, JBL, Unico and Diba, higher promotional and marketing spending and higher variable expenses due to increasedsales volumes. As a percentage of net sales, fiscal 2010 operating expenses decreased 40 basis points compared tofiscal 2009.
51

Nutritionals
Net salesGross profitGross profit %Operating expensesOperating expenses %Operating income (loss)Operating income (loss) %
Fiscal Year2011
$ 503,349$ 159,352
31.7%$ 91,312
18.1%$ 68,040
13.5%
2010$ 259,275$ 38,604
14.9%$ 36,347
14.0%$ 2,257
0.9%
2009$ 226,436$ 16,696
7.4 %$ 23,281
10.3 %$ (6,585)
(2.9)%
Net Sales
Net sales for fiscal 2011 increased 94% or $244,074 compared to fiscal 2010. The increase was due primarily toincremental sales attributable to the PBM acquisition of approximately $282,600, of which $8,800 related to new productsales. In addition, new product sales in the VMS category were approximately $7,700. These combined increaseswere partially offset by a decline of $46,000 in sales from existing products due primarily to the continued efforts aroundstock-keeping units (SKU) rationalization within the VMS category.
Net sales for fiscal 2010 increased 15% or $32,839 compared to fiscal 2009. The increase was due primarily toadditional sales of approximately $39,600 attributable to the fiscal 2010 acquisition of PBM, along with new productsales of approximately $4,500 in the VMS category. These increases were partially offset by a decrease in sales ofexisting products of approximately $11,500 in the VMS category.
Gross Profit
Gross profit for fiscal 2011 increased 313% or $120,748 compared to fiscal 2010. The substantial increase resultedprimarily from the incremental gross profit attributable to the fourth quarter fiscal 2010 acquisition of PBM. Fiscal 2010included a charge to cost of sales of $9,402 related to the step-up in value of inventory acquired in the PBM acquisition.In addition, gross profit from the VMS category improved by approximately $2,000 as a result of improvements inoperational efficiencies and lower material costs. The large increase in the fiscal 2011gross profit percentage comparedto fiscal 2010 was due primarily to the acquisition of PBM, along with the operational improvements within the VMScategory.
Gross profit for fiscal 2010 increased 131% or $21,908 compared to fiscal 2009. The increase was due primarily toimproved gross profit in the existing VMS category through pricing improvements on select products and improvedoperational efficiency, along with the incremental gross profit attributable to the fourth quarter fiscal 2010 acquisitionof PBM. Fiscal 2010 included a charge to cost of sales of $9,402 related to the step-up in value of inventory acquiredin the PBM acquisition.
Operating Expenses
Fiscal 2011 operating expenses increased 151% or $54,965 compared to fiscal 2010 due primarily to the operatingexpenses attributable to the fourth quarter fiscal 2010 acquisition of PBM, offset slightly by a decrease in administrativeand selling expenses associated with the VMS product category.
Fiscal 2010 operating expenses increased 56% or $13,066 compared to fiscal 2009 due primarily to the operatingexpenses attributable to the fourth quarter fiscal 2010 acquisition of PBM, along with and increased administrative andselling expenses associated with the VMS product category.
52
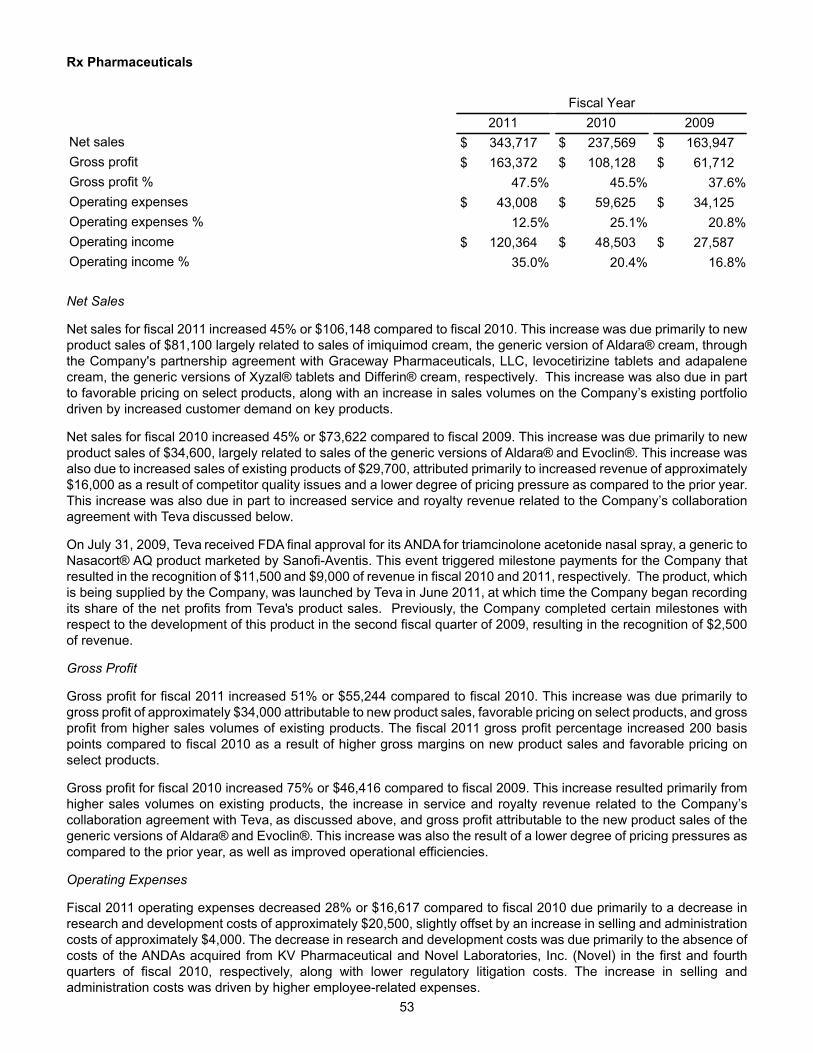
Rx Pharmaceuticals
Net salesGross profitGross profit %Operating expensesOperating expenses %Operating incomeOperating income %
Fiscal Year2011
$ 343,717$ 163,372
47.5%$ 43,008
12.5%$ 120,364
35.0%
2010$ 237,569$ 108,128
45.5%$ 59,625
25.1%$ 48,503
20.4%
2009$ 163,947$ 61,712
37.6%$ 34,125
20.8%$ 27,587
16.8%
Net Sales
Net sales for fiscal 2011 increased 45% or $106,148 compared to fiscal 2010. This increase was due primarily to newproduct sales of $81,100 largely related to sales of imiquimod cream, the generic version of Aldara® cream, throughthe Company's partnership agreement with Graceway Pharmaceuticals, LLC, levocetirizine tablets and adapalenecream, the generic versions of Xyzal® tablets and Differin® cream, respectively. This increase was also due in partto favorable pricing on select products, along with an increase in sales volumes on the Company’s existing portfoliodriven by increased customer demand on key products.
Net sales for fiscal 2010 increased 45% or $73,622 compared to fiscal 2009. This increase was due primarily to newproduct sales of $34,600, largely related to sales of the generic versions of Aldara® and Evoclin®. This increase wasalso due to increased sales of existing products of $29,700, attributed primarily to increased revenue of approximately$16,000 as a result of competitor quality issues and a lower degree of pricing pressure as compared to the prior year.This increase was also due in part to increased service and royalty revenue related to the Company’s collaborationagreement with Teva discussed below.
On July 31, 2009, Teva received FDA final approval for its ANDA for triamcinolone acetonide nasal spray, a generic toNasacort® AQ product marketed by Sanofi-Aventis. This event triggered milestone payments for the Company thatresulted in the recognition of $11,500 and $9,000 of revenue in fiscal 2010 and 2011, respectively. The product, whichis being supplied by the Company, was launched by Teva in June 2011, at which time the Company began recordingits share of the net profits from Teva's product sales. Previously, the Company completed certain milestones withrespect to the development of this product in the second fiscal quarter of 2009, resulting in the recognition of $2,500of revenue.
Gross Profit
Gross profit for fiscal 2011 increased 51% or $55,244 compared to fiscal 2010. This increase was due primarily togross profit of approximately $34,000 attributable to new product sales, favorable pricing on select products, and grossprofit from higher sales volumes of existing products. The fiscal 2011 gross profit percentage increased 200 basispoints compared to fiscal 2010 as a result of higher gross margins on new product sales and favorable pricing onselect products.
Gross profit for fiscal 2010 increased 75% or $46,416 compared to fiscal 2009. This increase resulted primarily fromhigher sales volumes on existing products, the increase in service and royalty revenue related to the Company’scollaboration agreement with Teva, as discussed above, and gross profit attributable to the new product sales of thegeneric versions of Aldara® and Evoclin®. This increase was also the result of a lower degree of pricing pressures ascompared to the prior year, as well as improved operational efficiencies.
Operating Expenses
Fiscal 2011 operating expenses decreased 28% or $16,617 compared to fiscal 2010 due primarily to a decrease inresearch and development costs of approximately $20,500, slightly offset by an increase in selling and administrationcosts of approximately $4,000. The decrease in research and development costs was due primarily to the absence ofcosts of the ANDAs acquired from KV Pharmaceutical and Novel Laboratories, Inc. (Novel) in the first and fourthquarters of fiscal 2010, respectively, along with lower regulatory litigation costs. The increase in selling andadministration costs was driven by higher employee-related expenses.
53

Fiscal 2010 operating expenses increased 75% or $25,500 compared to fiscal 2009 due primarily to increased researchand development costs of $19,000 due to the ANDAs acquired from KV Pharmaceutical and Novel in the first andfourth quarters of fiscal 2010, respectively. This increase was also the result of increased selling and administrativeexpenses of $2,500 due to higher variable incentive-related wages and benefits.
API
Net salesGross profitGross profit %Operating expensesOperating expenses %Operating incomeOperating income %
Fiscal Year2011
$ 155,717$ 68,400
43.9%$ 30,581
19.6%$ 37,819
24.3%
2010$ 139,980$ 55,481
39.6%$ 40,169
28.7%$ 15,312
10.9%
2009$ 135,731$ 50,571
37.3%$ 46,532
34.3%$ 4,039
3.0%
Net Sales
Net sales for fiscal 2011 increased 11% or $15,737 compared to fiscal 2010. This increase was due primarily to newproduct sales of $32,000, driven mainly by temozolomide sales to the European market. These increases were partiallyoffset by decreased sales volumes of existing products of $9,300, a decline of approximately $8,600 in revenuesrelated to the sale of dossier agreements and unfavorable changes in foreign currency exchange rates, which decreasedsales by approximately $2,200. The net sales of API are highly dependent on the level of competition in the marketplacefor a specific material and the ordering patterns of customers on a quarter-over-quarter basis.
Net sales for fiscal 2010 increased 3% or $4,249 compared to fiscal 2009. This increase was due primarily to newproduct sales of $15,300, including dossier agreements as discussed below and temozolomide. In the third quarter offiscal 2010, the Company launched temozolomide into the European market. Net sales also increased due to favorablechanges in foreign currency exchange rates, which increased sales by approximately $2,300. These increases werepartially offset by a decrease in sales volumes of existing products of $13,300.
The Company actively enters into exclusive marketing and sales agreements (dossier agreements) related to specificproduct formulations, for specific geographic areas, for specific periods of time. In fiscal 2010, the Company recognizedapproximately $9,100 in revenue in the API segment related to dossier agreements.
Gross Profit
Gross profit for fiscal 2011 increased 23% or $12,919 compared to fiscal 2010. This increase was due primarily to thegross profit attributable to new product sales, along with an increase of approximately $1,200 resulting from favorablechanges in foreign currency exchange rates, partially offset by a decrease in sales volumes of existing products. Thefiscal 2011 gross profit percentage increased 430 basis points compared to fiscal 2010 due primarily to the favorablecontribution of new product sales.
Gross profit for fiscal 2010 increased 10% or $4,910 compared to fiscal 2009. This increase was due primarily to highervolumes and gross profit attributable to new product sales, including temozolomide and product developmentagreements, as discussed above.
Operating Expenses
Operating expenses for fiscal 2011 decreased 24% or $9,588 compared to fiscal 2010. This decrease was due primarilyto the absence of the $8,824 restructuring charge related to the sale of the Company's facility in Germany in fiscal2010.
Operating expenses for fiscal 2010 decreased 14% or $6,363 compared to fiscal 2009. This decrease was due primarilyto an additional $5,800 of restructuring costs related to the planned closure of the Company’s German API facilityrecorded in fiscal 2009 compared to the amount recorded in fiscal 2010 related to the sale of that facility. This decreasewas also due to a decrease in research and development costs of $3,300, partially offset by increased employee-
54

related expenses of $2,400.
Other
The Other category consists of the Company’s Israel Pharmaceutical and Diagnostic Products operating segment,which does not individually meet the quantitative thresholds required to be a reportable segment.
Net salesGross profitGross profit %Operating expensesOperating expenses %Operating incomeOperating income %
Fiscal Year2011
$ 67,308$ 22,356
33.2%$ 21,090
31.3%$ 1,266
1.9%
2010$ 57,577$ 20,611
35.8%$ 18,410
32.0%$ 2,201
3.8%
2009$ 66,926$ 24,424
36.5%$ 16,482
24.6%$ 7,942
11.9%
Net Sales
Net sales for fiscal 2011 increased 17% or $9,731 compared to fiscal 2010. This increase was driven primarily by newproduct sales of approximately $8,400, along with favorable changes in foreign currency exchange rates.
Net sales for fiscal 2010 decreased 14% or $9,349 compared to fiscal 2009. This decrease was driven primarily bythe loss of approximately $21,600 of sales related to the loss of a customer contract. This decrease was partially offsetby $4,900 in new product sales, as well as an increase of $7,800 in sales related to diagnostic asset acquisitions madein fiscal 2009.
A change in a customer contract in fiscal 2009 resulted in a change to the Company’s relationship with a customerwhereby the Company is now a distributor to the customer rather than a supplier. As a result of this change and inaccordance with ASC Subtopic 605-45, “Revenue Recognition – Principal Agent Considerations”, the Company beganrecognizing sales related to this customer contract on a net basis during fiscal 2009.
Gross Profit
Gross profit for fiscal 2011 increased 8% or $1,745 compared to fiscal 2010. This increase was due primarily to theabsence of a $1,000 charge to cost of sales related to the step-ups in value of inventory acquired in the diagnosticasset acquisitions.
Gross profit for fiscal 2010 decreased 16% or $3,813 compared to fiscal 2009. This decrease was due primarily to theloss of the customer contract discussed above, as well as a charge of approximately $1,000 to cost of sales relatedto the step-ups in value of inventory acquired in the diagnostic asset acquisitions.
Operating Expenses
Fiscal 2011 operating expenses increased 15% or $2,680 compared to fiscal 2010 due primarily to higher employee-related expenses.
Fiscal 2010 operating expenses increased 12% or $1,928 compared to fiscal 2009 due primarily to higher employee,advertising and promotion expenses.
Unallocated Expenses
Operating expenses
Fiscal Year2011
$ 30,3812010
$ 36,0512009
$ 23,543
Unallocated expenses were comprised of certain corporate services that were not allocated to the segments. Fiscal2011 unallocated expenses decreased 16% or $5,670 compared to fiscal 2010. This decrease was due primarily to
55

the absence of acquisition expenses of $8,200 related to PBM and Orion, partially offset by acquisition expenses of$2,500 related to Paddock.
Fiscal 2010 unallocated expenses increased 53% or $12,508 compared to fiscal 2009. This increase was due toincreased variable incentive and profit sharing-based compensation of $5,400, a performance-related increase of$3,000 in share-based compensation and acquisition expenses of $8,200 related to PBM and Orion. These increaseswere partially offset by a decrease in corporate expenses of $4,100.
Interest and Other (Consolidated)
Fiscal 2011 interest expense was $45,548 compared to $49,734 for fiscal 2010. The decrease in interest expense wasdue to the prepayment of the $400,000 letter of undertaking during the first quarter of fiscal 2011, partially offset bythe increased borrowings related to the PBM acquisition. Fiscal 2011 interest income was $3,236 compared to $21,319for fiscal 2010. The decrease in interest income was due to the use of the restricted cash balance of $400,000 toprepay the letter of undertaking during the first quarter of fiscal 2011.
The Paddock acquisition closed during the Company's first quarter of fiscal 2012. With the expected increase inborrowings under the Company's existing credit facilities and the expected issuance of long-term debt associated withthis acquisition, interest expense is expected to increase beginning in the first quarter of fiscal 2012 by approximately$10,000 on an annual basis.
Fiscal 2010 interest expense was $49,734 compared to $51,133 for fiscal 2009. Fiscal 2010 interest expense includedapproximately $7,300 of interest expense related to the private placement of senior notes, the proceeds of which wereused to finance a portion of the acquisition of PBM as discussed below. Excluding this increase, interest expense waslower in fiscal 2010 than in fiscal 2009 due to lower borrowings during the majority of fiscal 2010. Fiscal 2010 interestincome was $21,319 compared to $24,138 for fiscal 2009.
For fiscal 2009, other expense includes $15,104 of an other-than-temporary impairment loss associated with auctionrate securities (ARS).
Income Taxes (Consolidated)
During the past several years, the impact of international operations has had a more significant effect on the Company'soverall effective tax rate. The Company's foreign source income is generally derived from jurisdictions with a lowereffective tax rate than the U.S. statutory rate, resulting in a lower consolidated effective tax rate compared to what theCompany had historically experienced. The relative share of foreign income was 33.6%, 38.4% and 33.2% of totalincome for fiscal 2011, 2010 and 2009, respectively.
The effective tax rate on continuing operations was 24.4%, 27.3% and 30.8% for fiscal 2011, 2010 and 2009,respectively, largely impacted by the relative share of foreign income in each year. In the third quarter of fiscal 2011Israel enacted new tax legislation. This legislation reduces the effective tax rate for qualifying entities to 10% for 2011and 2012, 7% for 2013 and 2014, and 6% thereafter. Two of the Company's entities will be eligible for this benefit andmanagement currently anticipates electing to be taxed under the new legislation for years after fiscal 2011. The impactof this legislative change in the statutory rate is $8,500 or 1.9% on the Company's fiscal 2011 tax rate. The recordedeffective tax rate was reduced by $4,600 or 1.5% during the first quarter of fiscal 2010 due to prior statutory tax ratechanges in Israel.
Financial Condition, Liquidity and Capital Resources
Cash, cash equivalents and the current portion of investment securities increased $199,780 to $310,104 at June 25,2011 from $110,324 at June 26, 2010. Working capital from continuing operations, including cash, increased $294,596to $772,783 at June 25, 2011 from $478,187 at June 26, 2010.
In addition to the cash and cash equivalents balance of $310,104 at June 25, 2011, the Company had an additional$350,000 available under its revolving loan commitments and $184,000 available under its accounts receivablesecuritization program described below, as well as $4,730 available under its Indian credit facilities. Cash, cashequivalents, cash flows from operations and borrowings available under the Company’s credit facilities, including thenew five-year term loan financing commitment described below, are expected to be sufficient to finance the knownand/or foreseeable liquidity, capital expenditures, dividends acquisitions and, to the extent authorized, sharerepurchases of the Company. Although the Company’s lenders have made commitments to make funds available toit in a timely fashion, if the current economic conditions worsen (or new information becomes publicly available impacting
56

the institutions’ credit rating or capital ratios), these lenders may be unable or unwilling to lend money pursuant to theCompany’s existing credit facilities.
Net cash provided from operating activities increased $41,598 or 13% to $373,961 for fiscal 2011compared to $332,363for fiscal 2010, due primarily to increased net income in fiscal 2011.
Net cash used for investing activities decreased $809,333 to $110,567 for fiscal 2011 compared to $919,900 for fiscal2010, due primarily to the absence of the funding used for the PBM acquisition in fiscal 2010.
Capital expenditures for facilities and equipment for fiscal 2011 of $99,443, were for normal replacement, productivityenhancements and quality improvements. Capital expenditures for fiscal 2012 are anticipated to be between $95,000to $105,000 related primarily to manufacturing productivity and capacity projects, quality investment projects,investments at newly acquired entities, technology infrastructures, market driven packaging changes, system upgradesand the API expansion into India. Capital expenditures for fiscal 2010 were $57,816.
Net cash used for financing activities was $58,790 for fiscal 2011compared to net cash provided from financing activitiesof $383,303 for fiscal 2010. The fiscal 2010 cash provided from financing activities was due primarily to the borrowingsof long-term debt related to the PBM acquisition.
The Company has had a common stock repurchase program. Purchases were made on the open market, subject tomarket conditions and were funded by available cash or borrowings. On February 1, 2008, the Board of Directorsapproved a plan to repurchase shares of common stock with a value of up to $150,000. The Company completedpurchases under this plan on December 16, 2009. All common stock repurchased by the Company becomes authorizedbut unissued stock and is available for reissuance in the future for general corporate purposes. The Companyrepurchased 142 shares of common stock for $8,308 during fiscal 2011. The Company repurchased 2,062 and 1,836shares of common stock for $71,088 and $62,489 during fiscal 2010 and 2009, respectively. Private party transactionsaccounted for 142, 85, and 42 shares in fiscal 2011, 2010, and 2009, respectively.
The Company paid dividends of $25,303, $22,329 and $19,957, or $0.2725, $0.2425 and $0.215 per share, duringfiscal 2011, 2010 and 2009, respectively. The declaration and payment of dividends and the amount paid, if any, aresubject to the discretion of the Board of Directors and depend on the earnings, financial condition, capital and surplusrequirements of the Company and other factors the Board of Directors may consider relevant.
Dividends paid for the years ended June 25, 2011 and June 26, 2010 were as follows:
Declaration Date
Fiscal 2011April 28, 2011January 26, 2011October 27, 2010August 11, 2010
Fiscal 2010April 28, 2010January 27, 2010October 29, 2009August 13, 2009
Record Date
May 27, 2011February 25, 2011
November 26, 2010August 27, 2010
May 28, 2010February 26, 2010
November 27, 2009August 28, 2009
Payable
June 14, 2011March 15, 2011
December 14, 2010September 14, 2010
June 15, 2010March 16, 2010
December 15, 2009September 15, 2009
Dividend Declared
$ 0.0700$ 0.0700$ 0.0700$ 0.0625
$ 0.0625$ 0.0625$ 0.0625$ 0.0550
Accounts Receivable Securitization
On July 23, 2009, the Company entered into an accounts receivable securitization program (the Securitization Program)with several of its wholly owned subsidiaries and Bank of America Securities, LLC (Bank of America). The Companyrenewed the Securitization Program on July 22, 2010 and, most recently, on June 13, 2011 with Bank of America, asAgent, and Wells Fargo Bank, National Association (Wells Fargo) and PNC Bank, National Association (PNC) asManaging Agents (together, the Committed Investors).
57

The Securitization Program is a three-year program and under the terms of the Securitization Program, the subsidiariessell certain eligible trade accounts receivables to a wholly owned bankruptcy remote special purpose entity (SPE),Perrigo Receivables, LLC. The Company has retained servicing responsibility for those receivables. The SPE will thentransfer an interest in the receivables to the Committed Investors. Under the terms of the Securitization Program, Bankof America, Wells Fargo and PNC have committed $101,750, $55,500 and $27,750, respectively, effectively allowingthe Company to borrow up to a total amount of $185,000, subject to a Maximum Net Investment calculation as definedin the agreement. At June 25, 2011, $184,000 was available under this calculation. The interest rate on any borrowingsis based on the thirty-day London Interbank Offered Rate (LIBOR) plus 0.45%. In addition, a facility fee of 0.45% isapplied to the $185,000 commitment. Under the terms of the Securitization Program, the Company may elect to havethe entire amount or any portion of the facility unutilized.
Any borrowing made pursuant to the Securitization Program will be classified as debt in the Company’s consolidatedbalance sheet. The amount of the eligible receivables will vary during the year based on seasonality of the businessand could, at times, limit the amount available to the Company from the sale of these interests. As of June 25, 2011,there were no borrowings outstanding under the Securitization Program. As discussed below, concurrent with theclosing of the Paddock acquisition on July 26, 2011, the Company borrowed $85,000 under its Securitization Programto partially fund the acquisition.
Investment Securities
The Company currently maintains a portfolio of auction rate securities (ARS) with a total par value of $18,000 and anestimated fair value of $7,503 at June 25, 2011. As a result of the tightening of the credit markets beginning in calendar2008, there has been no liquid market for these securities for an extended period of time. While there are some recentindications that a market is starting to materialize for these securities, though at a much reduced level than the pre-2008period, the Company cannot predict if or when liquidity will return for these securities. The Company has reclassifiedthe securities from current assets to other non-current assets due to the unpredictable nature and the illiquidity of themarket for the securities. Although the Company continues to earn and collect interest on these investments at themaximum contractual rate, the estimated fair value of ARS cannot be determined by the auction process until liquidityis restored to these markets.The Company currently engages the services of an independent third-party valuation firmto assist the Company in estimating the current fair value of the ARS, using a discounted cash flow analysis and anassessment of secondary markets, as well as other factors. During the second and fourth quarters of fiscal 2011, theCompany received updated estimates of the current fair value of these securities from the valuation firm and basedon these estimates and other factors, the Company determined that the fair value of the securities was $5,435 and$7,503 in the second and fourth quarters of fiscal 2011, respectively. Accordingly, the Company recorded an unrealizedgain of $1,042 and $2,068, net of tax, in other comprehensive income in the second and fourth quarters of fiscal 2011,respectively. The Company will continue to monitor the credit worthiness of the companies that issued these securitiesand other appropriate factors and make such adjustments as it deems necessary to reflect the fair value of thesesecurities. See Note 5 of the Notes to Consolidated Financial Statements for additional information.
Indebtedness
As of June 25, 2011, the Company had long-term debt, less current maturities, of $875,000.
On January 20, 2011, the Company announced that it had signed a definitive agreement to acquire substantially allof the assets of Paddock, and on July 26, 2011 the Company announced that the acquisition was completed forapproximately $547,000 in cash. The Company funded the transaction using the new $250,000 five-year term loandiscussed below, $212,000 of cash on hand and $85,000 from its Securitization Program. Concurrent with the signingof the agreement, the Company entered into a Term Loan Agreement (Agreement). Under the terms of the Agreement,the term loan commitment was $250,000, which was fully funded on July 26, 2011, in conjunction with the closing ofthe Paddock acquisition. The final maturity date of the term loan is July 26, 2016; however, the term loan will be subjectto mandatory partial repayments of $25,000 on each of the first four annual anniversary dates of the funding. The termloan will bear interest, at the election of the Company, at either the Annual Base Rate or the Adjusted LIBO rate plusan Applicable Margin, as specified in the Agreement. As of June 25, 2011, there was no outstanding debt related tothis commitment.
On December 29, 2010, the Company's India subsidiary executed a long-term facility with certain persons who areminority owners of Perrigo India as lenders. Funds are available for capital expenditures in one or more draws in anaggregate amount not to exceed $3,000. The facility is payable in a series of installments starting in fiscal 2017 withthe final installment due August 30, 2019. Terms and conditions of the line are normal and customary for similar linesin India. The interest rate on this facility as of June 25, 2011 was 14%. The Company's India subsidiary had no amounts
58

outstanding on this line as of the end of its fiscal 2011.
On October 8, 2010, the Company entered into a credit agreement with a group of banks (the 2010 Credit Agreement),which provides an initial revolving loan commitment of $350,000 and an initial term loan commitment of $150,000,each subject to increase or decrease as specified in the 2010 Credit Agreement. Both loans bear interest, at the electionof the Company, at either the Annual Base Rate plus an Applicable Margin or the Adjusted LIBOR plus an ApplicableMargin, as specified and defined in the 2010 Credit Agreement. The obligations under the 2010 Credit Agreement areguaranteed by certain subsidiaries of the Company, and in some instances, the obligations may be secured by a pledgeof 65% of the stock of certain foreign subsidiaries. The final maturity date of the term and revolving loans under the2010 Credit Agreement is October 8, 2015; however, the term loan is subject to mandatory partial repayments of$15,000 on each of the first four annual anniversary dates of the agreement. The Company used the proceeds fromthe term loan and revolving loan for general corporate purposes and to repay certain other outstanding debt, includingthe $100,000 term loan made pursuant to the Company’s prior credit agreement.
In connection with the execution of the 2010 Credit Agreement, the Company terminated its prior credit agreement,dated as of March 16, 2005, and amended its existing term loan agreement, dated as of April 22, 2008, to conformcertain covenants in that term loan agreement to the covenants contained in the 2010 Credit Agreement and to makecertain other conforming changes.
On May 26, 2010, the Company’s India subsidiary executed a short-term credit line with The Hong Kong and ShanghaiBanking Corporation Ltd. Funds are available for working capital and general business purposes in one or more drawsunder the line in an aggregate amount not to exceed approximately $4,500. Terms and conditions of the line are normaland customary for similar lines in India. The interest rate on this facility was 10.5% and 9.5% as of June 25, 2011 andJune 26, 2010, respectively. The credit line expires after 180 days but can be extended by mutual agreement of theparties. The Company’s India subsidiary had $2,770 outstanding on this line of credit as of the end of its fiscal 2011.
On May 29, 2008, the Company entered into a Master Note Purchase Agreement (Note Agreement) with variousinstitutional investors providing for the private placement of senior notes consisting of $75,000, 5.97% Series 2008-Asenior notes, due May 29, 2015, and $125,000, 6.37% Series 2008-B senior notes, due May 29, 2018 (collectively,the Series 2008 Notes). Contemporaneously with the acquisition of PBM, on April 30, 2010, the Company entered intoa First Supplement to the Note Agreement with various institutional investors providing for the private placement ofsenior notes consisting of $115,000, 4.91% Series 2010-A senior notes, due April 30, 2017, $150,000, 5.45% Series2010-B senior notes, due April 30, 2020, and $150,000, 5.55% Series 2010-C senior notes, due April 30, 2022(collectively, the Series 2010 Notes). The Series 2010 Notes, together with the Series 2008 Notes, are collectivelyreferred to herein as the Notes. The obligations under the Notes are guaranteed by certain of the Company’ssubsidiaries, and the Notes are secured, on a ratable basis with the Company’s bank debt, by a lien on certain assetsof the Company and the subsidiary guarantors. Interest on the Notes is payable semi-annually. The Company may atany time prepay, at a cost, all or any part of the Notes subject to the terms specified in the Note Agreement and mustoffer to prepay the Notes upon a change of control (as defined in the Note Agreement). Restrictive covenants applyto, among other things, minimum levels of interest coverage and debt to Earnings before Interest, Taxes, Depreciationand Amortization (EBITDA) ratios, additional liens, mergers or consolidations, and sales of assets. The Company wasin compliance with all Note Agreement covenants as of June 25, 2011. As of June 25, 2011, the estimated fair valueof the Notes was $650,812. As of June 26, 2010, the estimated fair value of the Notes was $644,016. Fair values werecalculated by discounting the future cash flows of the financial instruments to their present value, using interest ratescurrently offered for borrowings and deposits of similar nature and remaining maturities.
On April 22, 2008, the Company entered into a Term Loan Agreement (Loan Agreement) to provide for additional termloan borrowings. Under the terms of the Loan Agreement, the initial term loan commitment is $125,000, subject toincrease by mutual agreement of the Company and the lenders as specified in the Loan Agreement. The applicableinterest rate is determined by the type of loan requested by the Company, with Eurodollar loans bearing interest atLIBOR plus an applicable borrowing margin determined by the Company’s leverage ratio over the trailing four quartersand Alternative Base Rate (ABR) loans bearing interest at the highest of the JP Morgan Chase Bank N.A. Prime Rate,the Base CD Rate plus 100 basis points and the Federal Funds Effective Rate plus 50 basis points. All of the Company’sloans outstanding under the Loan Agreement were Eurodollar loans, and the interest rate was 1.1875% and 1.1875%as of June 25, 2011 and June 26, 2010, respectively. Actual rates ranged from 1.1875% to 1.3125% and 1.0625% to1.875% for fiscal 2011 and 2010, respectively. The obligations under the Loan Agreement are guaranteed by certainsubsidiaries of the Company and are secured by a pledge of 65% of the stock of certain foreign subsidiaries. The LoanAgreement is subject to certain debt level limitations, as specified in the Loan Agreement, as well as restrictivecovenants, which are the same as those in the 2005 credit agreement discussed below. The maturity date of the term
59

loans is April 22, 2013. The Company used the proceeds of the term loans for general corporate purposes and toenhance liquidity.
On March 16, 2005, the Company and certain foreign subsidiaries entered into a credit agreement with a group ofbanks (Credit Agreement) which provided an initial revolving loan commitment of $250,000 and an initial term loancommitment of $100,000, each subject to increase or decrease as specified in the Credit Agreement. As noted above,in connection with the execution of the 2010 Credit Agreement, the Company terminated this credit agreement in fiscal2011. Both loans bore an interest rate of ABR or LIBOR plus an applicable margin determined by the Company’sleverage ratio over the trailing four quarters. The interest rate on the revolving loan was 0.7487% as of June 26, 2010.The interest rate on the term loan was 0.9375% as of June 26, 2010. Actual rates for the revolving loan ranged from0.7125% to 1.565% for fiscal 2010. Actual rates for the term loan ranged from 0.8625% to 1.675% for fiscal 2010.Additionally, the Credit Agreement provided for short term swingline loans at negotiable rates of interest subject to amaximum amount of $25,000 drawn at any time. As of June 26, 2010 the interest rate on the swingline loans was1.5%. As of June 26, 2010, borrowings under the swingline loans and revolving loan commitment were $9,000 and$95,000, respectively.
The Company was in compliance with all Credit Agreement and Loan Agreement covenants as of June 25, 2011.
On March 16, 2005, the Company’s Israeli holding company subsidiary entered into a letter of undertaking and obtaineda loan in the sum of $400,000. Subsequent to the end of fiscal 2010, the Company elected to prepay the entire loanbalance of $400,000. The loan had a ten-year term with a fixed annual interest rate of 5.025%. The Company couldprepay the loan upon 30 days written notice. The lender could demand prepayment or the Company could prepay theloan in whole or in part upon 90 days written notice on the interest payment date that was 24 months after the loandate and every 12 months subsequent to that date. The terms required the Company to maintain a deposit of $400,000in an uninsured account with the lender as security for the loan. This deposit had a fixed 4.9% yield. The Companydid not have the right to withdraw any amounts from the deposit account, including any interest earned, until the loanhad been paid in full or unless it received consent from the lender. Earned interest was released to the Company oneach interest payment date so long as all interest due on the loan had been paid by the Company. The loan wasrepaid using the restricted cash deposit discussed above. The prepayment was completed on July 19, 2010. As aresult, the fair values of both the letter of undertaking and the restricted cash deposit approximated their carrying valuesand have been classified in current liabilities and current assets, respectively, on the balance sheet as of June 26,2010. Fair values were calculated by discounting the future cash flows of the financial instruments to their presentvalue, using interest rates currently offered for borrowings and deposits of similar nature and remaining maturities.
The Company’s Israeli subsidiary paid the third and final annual installment of its debenture in the second quarter offiscal 2010 for $17,771. The debenture, which was guaranteed by the Company, had a fixed interest rate of 5.6%, andthe principal of the loan was linked to the increase in the Israel Consumer Price Index.
Contractual Obligations
The Company’s enforceable and legally binding obligations as of June 25, 2011 are set forth in the following table.Some of the amounts included in this table are based on management’s estimates and assumptions about theseobligations, including the duration, the possibility of renewal, anticipated actions by third parties and other factors.Because these estimates and assumptions are necessarily subjective, the enforceable and legally binding obligationsactually paid in future periods may vary from the amounts reflected in the table. In addition, it does not include anycontractual obligations or commercial commitments the Company incurred as a result of the recently completedacquisition of Paddock.
60

Operating leases(1)
Purchase obligations(2)
Short and long-term debt(3)
Other non-current contractual liabilitiesreflected on the consolidated balancesheet:
Deferred compensation and benefits(4)
OtherTotal
Payment Due by Period2012
$ 18,295474,80056,661
——
$ 549,756
2013-2014$ 25,449
553235,562
——
$ 261,564
2015-2016$ 11,142
—249,960
——
$ 261,102
After 2016$ 2,850
—640,386
35,35014,700
$ 693,286
Total$ 57,736
475,3531,182,569
35,35014,700
$ 1,765,708
(1) Used in normal course of business, principally for warehouse facilities and computer equipment.(2) Consists of commitments for both materials and services.(3) Short and long-term debt includes interest payments, which were calculated using the effective interest rate at June 25, 2011.(4) Includes amounts associated with non-qualified plans related to deferred compensation, executive retention and post employment benefits.
Of this amount, $29,358 has been funded by the Company and is recorded in other non-current assets on the balance sheet. Theseamounts are assumed payable after five years, although certain circumstances, such as termination, would require earlier payment.
The Company funds its U.S. qualified profit-sharing and investment plan in accordance with the Employee RetirementIncome Security Act of 1974 regulations for the minimum annual required contribution and Internal Revenue Serviceregulations for the maximum annual allowable tax deduction. The Company is committed to making the requiredminimum contributions, which the Company expects to be approximately $8,700 during fiscal 2012. Future contributionsare dependent upon various factors including employees’ eligible compensation, plan participation and changes, ifany, to current funding requirements. Therefore, no amounts were included in the Contractual Obligations table above.The Company generally expects to fund all future contributions with cash flows from operating activities.
As of June 25, 2011, the Company had approximately $117,922 of liabilities for uncertain tax positions. Theseunrecognized tax benefits have been excluded from the Contractual Obligations table above due to uncertainty as tothe amounts and timing of settlement with taxing authorities.
Net deferred income tax liabilities were $30,404 as of June 25, 2011. This amount is not included in the ContractualObligations table above because the Company believes this presentation would not be meaningful. Net deferredincome tax liabilities are calculated based on temporary differences between the tax basis of assets and liabilities andtheir book basis, which will result in taxable amounts in future years when the book basis is settled. The results ofthese calculations do not have a direct connection with the amount of cash taxes to be paid in any future periods. Asa result, scheduling net deferred income tax liabilities as payments due by period could be misleading, because thisscheduling would not relate to liquidity needs.
Critical Accounting Estimates
Determination of certain amounts in the Company’s financial statements requires the use of estimates. These estimatesare based upon the Company’s historical experiences combined with management’s understanding of current factsand circumstances. Although the estimates are considered reasonable, actual results could differ from the estimates.The accounting estimates, discussed below, are considered by management to require the most judgment and arecritical in the preparation of the financial statements. These estimates are reviewed by the Audit Committee.
Revenue Recognition and Customer-Related Accruals and Allowances –The Company records revenues from productsales when the goods are shipped to the customer. For customers with Free on Board (FOB) destination terms, aprovision is recorded to exclude shipments estimated to be in-transit to these customers at the end of the reportingperiod. A provision is recorded and accounts receivable are reduced as revenues are recognized for estimated losseson credit sales due to customer claims for discounts, price discrepancies, returned goods and other items. A liabilityis recorded as revenues are recognized for estimated customer program liabilities, as discussed below.
The Company maintains customer-related accruals and allowances that consist primarily of chargebacks, rebates andshelf stock adjustments. Certain of these accruals and allowances are recorded in the balance sheet as current liabilitiesand others are recorded as a reduction in accounts receivable.
A chargeback relates to an agreement the Company has with a wholesaler, pharmaceutical buying group or retail
61
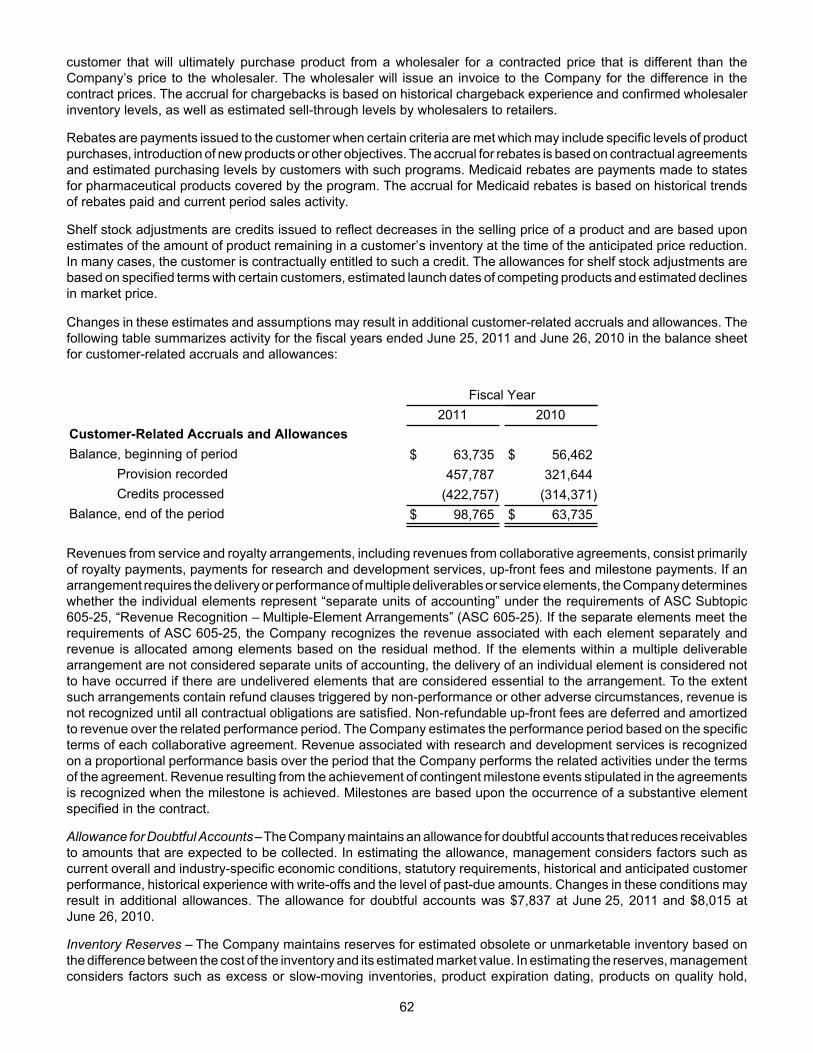
customer that will ultimately purchase product from a wholesaler for a contracted price that is different than theCompany’s price to the wholesaler. The wholesaler will issue an invoice to the Company for the difference in thecontract prices. The accrual for chargebacks is based on historical chargeback experience and confirmed wholesalerinventory levels, as well as estimated sell-through levels by wholesalers to retailers.
Rebates are payments issued to the customer when certain criteria are met which may include specific levels of productpurchases, introduction of new products or other objectives. The accrual for rebates is based on contractual agreementsand estimated purchasing levels by customers with such programs. Medicaid rebates are payments made to statesfor pharmaceutical products covered by the program. The accrual for Medicaid rebates is based on historical trendsof rebates paid and current period sales activity.
Shelf stock adjustments are credits issued to reflect decreases in the selling price of a product and are based uponestimates of the amount of product remaining in a customer’s inventory at the time of the anticipated price reduction.In many cases, the customer is contractually entitled to such a credit. The allowances for shelf stock adjustments arebased on specified terms with certain customers, estimated launch dates of competing products and estimated declinesin market price.
Changes in these estimates and assumptions may result in additional customer-related accruals and allowances. Thefollowing table summarizes activity for the fiscal years ended June 25, 2011 and June 26, 2010 in the balance sheetfor customer-related accruals and allowances:
Customer-Related Accruals and AllowancesBalance, beginning of period
Provision recordedCredits processed
Balance, end of the period
Fiscal Year2011
$ 63,735457,787
(422,757)$ 98,765
2010
$ 56,462321,644
(314,371)$ 63,735
Revenues from service and royalty arrangements, including revenues from collaborative agreements, consist primarilyof royalty payments, payments for research and development services, up-front fees and milestone payments. If anarrangement requires the delivery or performance of multiple deliverables or service elements, the Company determineswhether the individual elements represent “separate units of accounting” under the requirements of ASC Subtopic605-25, “Revenue Recognition – Multiple-Element Arrangements” (ASC 605-25). If the separate elements meet therequirements of ASC 605-25, the Company recognizes the revenue associated with each element separately andrevenue is allocated among elements based on the residual method. If the elements within a multiple deliverablearrangement are not considered separate units of accounting, the delivery of an individual element is considered notto have occurred if there are undelivered elements that are considered essential to the arrangement. To the extentsuch arrangements contain refund clauses triggered by non-performance or other adverse circumstances, revenue isnot recognized until all contractual obligations are satisfied. Non-refundable up-front fees are deferred and amortizedto revenue over the related performance period. The Company estimates the performance period based on the specificterms of each collaborative agreement. Revenue associated with research and development services is recognizedon a proportional performance basis over the period that the Company performs the related activities under the termsof the agreement. Revenue resulting from the achievement of contingent milestone events stipulated in the agreementsis recognized when the milestone is achieved. Milestones are based upon the occurrence of a substantive elementspecified in the contract.
Allowance for Doubtful Accounts–The Company maintains an allowance for doubtful accounts that reduces receivablesto amounts that are expected to be collected. In estimating the allowance, management considers factors such ascurrent overall and industry-specific economic conditions, statutory requirements, historical and anticipated customerperformance, historical experience with write-offs and the level of past-due amounts. Changes in these conditions mayresult in additional allowances. The allowance for doubtful accounts was $7,837 at June 25, 2011 and $8,015 atJune 26, 2010.
Inventory Reserves – The Company maintains reserves for estimated obsolete or unmarketable inventory based onthe difference between the cost of the inventory and its estimated market value. In estimating the reserves, managementconsiders factors such as excess or slow-moving inventories, product expiration dating, products on quality hold,
62

current and future customer demand and market conditions. Changes in these conditions may result in additionalreserves.
Income Taxes – The Company's effective income tax rate is based on income, statutory tax rates, special tax benefitsand tax planning opportunities available to the Company in the various jurisdictions in which it operates. Tax laws arecomplex and subject to different interpretations by the taxpayer and respective governmental taxing authorities.Significant judgment is required in determining the Company's tax expense and in evaluating tax positions. Taxpositionsare reviewed quarterly and balances are adjusted as new information becomes available.
The Company has established valuation allowances against a portion of the non-U.S. net operating losses, non-U.S.capital losses, U.S. state-related net operating losses and U.S. capital losses to reflect the uncertainty of its ability tofully utilize these benefits given the limited carryforward periods permitted by the various jurisdictions. The evaluationof the Company's ability to realize net operating and capital losses requires the use of considerable managementjudgment to estimate the future taxable income for the various jurisdictions, for which the ultimate amounts and timingof such realization may differ. The valuation allowances can also be impacted by changes in the tax regulations.
Significant judgment is required in determining the Company's liabilities for uncertain tax positions. The Company hasestablished such tax liabilities using management's best judgment and adjusts these liabilities as warranted by changingfacts and circumstances. Achange in tax liabilities in any given period could have a significant impact on the Company'sresults of operations and cash flows for that period.
Goodwill – Goodwill is tested for impairment annually or more frequently if changes in circumstances or the occurrenceof events suggest impairment exists. The test for impairment requires the Company to make several estimates aboutfair value, most of which are based on projected future cash flows and market valuation multiples. The estimatesassociated with the goodwill impairment tests are considered critical due to the judgments required in determining fairvalue amounts, including projected future cash flows. Changes in these estimates may result in the recognition of animpairment loss. The Company performs its annual goodwill and indefinite-lived intangible assets impairment testingfor all of its reporting units in the fourth quarter of the fiscal year. The Company’s Rx and API businesses are heavilydependent on new products currently under development. The termination of certain key product development projectscould have a materially adverse impact on the future results of the Rx Pharmaceuticals or API segment, which mayinclude a charge for goodwill impairment. A change in market dynamics or failure of operational execution for theCompany’s Consumer Healthcare U.K., Mexico and Australia operations could result in a materially adverse impacton its future results, which could result in a charge for goodwill impairment. Goodwill was $638,045 at June 25, 2011and $611,467 at June 26, 2010.
Other Intangible Assets – Other intangible assets consist of a portfolio of individual developed product technology/formulation and product rights, distribution and license agreements, customer relationships, non-compete agreementsand trade names and trademarks. The assets categorized as developed product technology/formulation and productrights, certain distribution and license agreements and non-compete agreements are amortized over their estimateduseful economic lives using the straight-line method. An accelerated method of amortization is used for customerrelationships and certain distribution agreements. Certain trade names and trademarks are determined to have anindefinite useful life and are not subject to amortization. The Company, however, reviews them for impairment on anannual basis, or more frequently if events or changes in circumstances indicate that any individual asset might beimpaired, and adjusts the carrying value of the asset as necessary. For intangible assets subject to amortization, animpairment analysis is performed whenever events or changes in circumstances indicate that the carrying amount ofany individual asset may not be recoverable. The carrying amount of an intangible asset is not recoverable if it exceedsthe sum of the undiscounted cash flows expected to result from the use and eventual disposition of the asset. Animpairment loss is recognized if the carrying amount of the asset is not recoverable and its carrying amount exceedsits fair value. Other intangible assets had a net carrying value of $574,430 at June 25, 2011 and $593,575 at June 26,2010.
Recently Issued Accounting Standards
See Note 1 of the Notes to Consolidated Financial Statements for information regarding recently issued accountingstandards.
Item 7A. Quantitative and Qualitative Disclosures About Market Risks.
The Company is exposed to market risks due to changes in interest rates, the liquidity of the securities markets andcurrency exchange rates.
63

Interest Rate Risk – The Company is exposed to interest rate changes primarily as a result of interest income earnedon its investment of cash on hand and interest expense on borrowings used to finance acquisitions and working capitalrequirements.
The Company enters into certain derivative financial instruments, when available on a cost-effective basis, to hedgeits underlying economic exposure, related to the management of interest rate risk. See Note 10 of the Notes toConsolidated Financial Statements for further information regarding the Company’s derivative and hedging activities.Because of the use of certain derivative financial instruments and the significant amount of fixed rate debt, the Companybelieves that a fluctuation in interest rates in the near future will not have a material impact on the Company’sconsolidated financial statements. These instruments are managed on a consolidated basis to efficiently net exposuresand thus take advantage of any natural offsets. Derivative financial instruments are not used for speculative purposes.Gains and losses on hedging transactions are offset by gains and losses on the underlying exposures being hedged.
Market Risk – The Company’s investment securities include ARS totaling $18,000 in par value. ARS are privatelyplaced variable rate debt instruments whose interest rates are reset within a contractual range, approximately every7 to 35 days. With the tightening of the credit markets beginning in calendar 2008, ARS have failed to settle at auctionresulting in an illiquid market for these types of securities. Although the Company continues to earn and collect intereston these investments at the maximum contractual rate, the estimated fair value of ARS cannot be determined by theauction process until liquidity is restored to these markets. While there are some recent indications that a market isstarting to materialize for these securities, though at a much reduced level than the pre-2008 period, the Companycannot predict when liquidity will return for these securities. The Company has reclassified the securities from currentassets to other non-current assets due to the unpredictable nature and the illiquidity of the market for the securities.
The Company currently engages the services of an independent third-party valuation firm to assist it in estimating thecurrent fair value of the ARS, using a discounted cash flow analysis and an assessment of secondary markets, as wellas other factors. During the second and fourth quarters of fiscal 2011, the Company received updated estimates ofthe current fair value of these securities from the valuation firm and based on these estimations and other factors, theCompany recorded an unrealized gain of $1,042 and $2,068, net of tax, in other comprehensive income in the secondand fourth quarters of fiscal 2011, respectively. The Company will continue to monitor the credit worthiness of thecompanies that issued these securities and other appropriate factors and make such adjustments as it deems necessaryto reflect the fair value of these securities.
Foreign Exchange Risk – The Company has operations in the U.K., Israel, Mexico and Australia. These operationstransact business in their local currency and foreign currencies, thereby creating exposures to changes in exchangerates. A large portion of the sales of the Company’s Israeli operations is in foreign currencies, primarily U.S. dollarsand euros, while these operations incur costs in their local currency. In addition, the Company's U.S. operations continueto expand its export business, primarily in Canada, China and Europe and is subject to fluctuations in the respectivecurrency exchange rates relative to the U.S. dollar. Due to sales and cost structures, certain segments experience anegative impact as a result of the changes in exchange rates while other segments experience a positive impact relatedto foreign currency exchange. The Company estimates an additional ten percent devaluation of the U.S. dollar relativeto the other foreign currencies it transacts business in would have decreased operating income of its foreign operatingunits by approximately $8,700 for fiscal 2011. This sensitivity analysis has inherent limitations. The analysis disregardsthe possibility that rates of multiple foreign currencies will not always move in the same direction relative to the valueof the U.S. dollar over time.
In addition, the Company enters into certain purchase commitments for materials which, although denominated in U.S.dollars, are linked to foreign currency valuations. These commitments generally contain a range for which the price ofmaterials may fluctuate over time given the value of a foreign currency.
The translation of the assets and liabilities of the Company’s international operations is made using their foreignexchange rates as of the end of the year. Translation adjustments are not included in determining net income but aredisclosed in accumulated other comprehensive income within shareholders’equity on the Consolidated Balance Sheetsuntil a sale or substantially complete liquidation of the net investment in the international subsidiary takes place. Incertain markets, the Company could recognize a significant gain or loss related to unrealized cumulative translationadjustments if it were to exit the market and liquidate its net investment. As of June 25, 2011, the cumulative netcurrency translation adjustments increased shareholders’ equity by $130,379.
Foreign currency transaction gains and losses arise from monetary assets and liabilities denominated in currenciesother than an operating unit’s functional currency. For fiscal 2011, net transaction losses were $324.
The Company monitors and strives to manage risk related to foreign currency exchange rates. Exposures that cannot64

be naturally offset within a local entity to an immaterial amount are often hedged with foreign currency derivatives ornetted with offsetting exposures at other entities. See Note 10 of the Notes to Consolidated Financial Statements forfurther information regarding the Company’s derivative and hedging activities. The Company cannot predict futurechanges in foreign currency exposure. Unfavorable fluctuations could adversely impact earnings.
65

Item 8. Financial Statements and Supplementary Data.
INDEX TO CONSOLIDATED FINANCIAL STATEMENTS PAGE NO.
66
Management’s Report on Internal Control over Financial Reporting
Report of Independent Registered Public Accounting Firm on Internal Control over Financial Reporting
Report of Independent Registered Public Accounting Firm on Financial Statements
Consolidated Statements of Income for Fiscal 2011, 2010, and 2009
Consolidated Balance Sheets as of June 25, 2011 and June 26, 2010
Consolidated Statements of Shareholders’ Equity and Comprehensive Income for Fiscal 2011,2010 and 2009
Consolidated Statements of Cash Flows for Fiscal 2011, 2010 and 2009
Notes to Consolidated Financial Statements
67
68
69
70
71
72
73
74

MANAGEMENT’S REPORT ON INTERNAL CONTROL OVER FINANCIAL REPORTING
The management of Perrigo Company is responsible for establishing and maintaining adequate internal control overfinancial reporting. Internal control over financial reporting is defined in Rules 13a-15(f) or 15d-15(f) promulgated underthe Securities Exchange Act of 1934 as a process designed by, or under the supervision of, the Company’s principalexecutive and principal financial officers and effected by the Company’s Board of Directors, management and otherpersonnel, to provide reasonable assurance regarding the reliability of financial reporting and the preparation of financialstatements for external purposes in accordance with U.S. generally accepted accounting principles and includes thosepolicies and procedures that:
• Pertain to the maintenance of records that in reasonable detail accurately and fairly reflect the transactionsand dispositions of the assets of the Company;
• Provide reasonable assurance that transactions are recorded as necessary to permit preparation of financialstatements in accordance with U.S. generally accepted accounting principles and that receipts andexpenditures of the Company are being made only in accordance with authorizations of management anddirectors of the Company; and
• Provide reasonable assurance regarding prevention or timely detection of unauthorized acquisition, use ordisposition of the Company’s assets that could have a material effect on the financial statements.
Because of its inherent limitations, the Company’s internal control over financial reporting may not prevent or detectmisstatements. Also, projections of any evaluation of effectiveness to future periods are subject to the risk that controlsmay become inadequate because of changes in conditions or that the degree of compliance with the policies orprocedures may deteriorate.
The Company acquired PBM Holdings, Inc (PBM) on April 30, 2010. During fiscal 2011, the Company evaluated andcompleted its integration of PBM's operations, policies and processes into the Company's overall system of internalcontrol over financial reporting.
The Company’s management assessed the effectiveness of the Company’s internal control over financial reportingas of June 25, 2011. The framework used in carrying out our evaluation was the Internal Control –Integrated Frameworkpublished by the Committee of Sponsoring Organizations (COSO) of the Treadway Commission. In evaluating ourinformation technology controls, we also used components of the framework contained in the Control Objectives forInformation and related Technology (COBIT), which was developed by the Information Systems Audit and ControlAssociation’s (ISACA) IT Governance Institute, as a complement to the COSO internal control framework.
Based on the evaluation under these frameworks, management has concluded that internal controls over financialreporting were effective as of June 25, 2011. The results of management’s assessment have been reviewed with theCompany’s Audit Committee.
Ernst & Young LLP, the independent registered certified public accounting firm that audited the Company’s financialstatements included in this Annual Report on Form 10-K, also audited the effectiveness of the Company's internalcontrol over financial reporting, as stated in their report which is included herein.
67

REPORT OF INDEPENDENT REGISTERED PUBLIC ACCOUNTING FIRM ON INTERNALCONTROL OVER FINANCIAL REPORTING
Board of Directors and ShareholdersPerrigo Company
We have audited Perrigo Company’s internal control over financial reporting as of June 25, 2011, based on criteriaestablished in Internal Control – Integrated Framework issued by the Committee of Sponsoring Organizations of theTreadway Commission (the COSO criteria). Perrigo Company’s management is responsible for maintaining effectiveinternal control over financial reporting, and for its assessment of the effectiveness of internal control over financialreporting included in the accompanying Management’s Report on Internal Control over Financial Reporting. Ourresponsibility is to express an opinion on the company’s internal control over financial reporting based on our audit.
We conducted our audit in accordance with the standards of the Public Company Accounting Oversight Board (UnitedStates). Those standards require that we plan and perform the audit to obtain reasonable assurance about whethereffective internal control over financial reporting was maintained in all material respects. Our audit included obtainingan understanding of internal control over financial reporting, assessing the risk that a material weakness exists, testingand evaluating the design and operating effectiveness of internal control based on the assessed risk, and performingsuch other procedures as we considered necessary in the circumstances. We believe that our audit provides areasonable basis for our opinion.
A company’s internal control over financial reporting is a process designed to provide reasonable assurance regardingthe reliability of financial reporting and the preparation of financial statements for external purposes in accordance withgenerally accepted accounting principles. A company’s internal control over financial reporting includes those policiesand procedures that (1) pertain to the maintenance of records that, in reasonable detail, accurately and fairly reflectthe transactions and dispositions of the assets of the company; (2) provide reasonable assurance that transactionsare recorded as necessary to permit preparation of financial statements in accordance with generally acceptedaccounting principles, and that receipts and expenditures of the company are being made only in accordance withauthorizations of management and directors of the company; and (3) provide reasonable assurance regardingprevention or timely detection of unauthorized acquisition, use, or disposition of the company’s assets that could havea material effect on the financial statements.
Because of its inherent limitations, internal control over financial reporting may not prevent or detect misstatements.Also, projections of any evaluation of effectiveness to future periods are subject to the risk that controls may becomeinadequate because of changes in conditions, or that the degree of compliance with the policies or procedures maydeteriorate.
In our opinion, Perrigo Company maintained, in all material respects, effective internal control over financial reportingas of June 25, 2011, based on the COSO criteria.
We also have audited, in accordance with the standards of the Public Company Accounting Oversight Board (UnitedStates), the consolidated balance sheets of Perrigo Company as of June 25, 2011 and June 26, 2010, and the relatedconsolidated statements of income, shareholder’s equity and comprehensive income, and cash flows for each of thethree fiscal years in the period ended June 25, 2011 of Perrigo Company, and our report dated August 16, 2011expressed an unqualified opinion thereon.
/s/ Ernst & Young LLP
Grand Rapids, MichiganAugust 16, 2011
68

REPORT OF INDEPENDENT REGISTERED PUBLIC ACCOUNTING FIRM ON FINANCIAL STATEMENTS
Board of Directors and ShareholdersPerrigo Company
We have audited the accompanying consolidated balance sheets of Perrigo Company as of June 25, 2011and June 26,2010, and the related consolidated statements of income, shareholders’ equity and comprehensive income, and cashflows for each of the three fiscal years in the period ended June 25, 2011. Our audits also included the financialstatement schedule listed in Item 15(a). These financial statements and schedule are the responsibility of theCompany’s management. Our responsibility is to express an opinion on these financial statements and schedule basedon our audits.
We conducted our audits in accordance with the standards of the Public Company Accounting Oversight Board (UnitedStates). Those standards require that we plan and perform the audit to obtain reasonable assurance about whetherthe financial statements are free of material misstatement. An audit includes examining, on a test basis, evidencesupporting the amounts and disclosures in the financial statements. An audit also includes assessing the accountingprinciples used and significant estimates made by management, as well as evaluating the overall financial statementpresentation. We believe that our audits provide a reasonable basis for our opinion.
In our opinion, the financial statements referred to above present fairly, in all material respects, the consolidatedfinancial position of Perrigo Company at June 25, 2011and June 26, 2010, and the consolidated results of its operationsand its cash flows for each of the three fiscal years in the period ended June 25, 2011, in conformity with U.S. generallyaccepted accounting principles. Also, in our opinion, the related financial statement schedule, when considered inrelation to the basic consolidated financial statements taken as a whole, presents fairly, in all material respects, theinformation set forth therein.
We also have audited, in accordance with the standards of the Public Company Accounting Oversight Board (UnitedStates), Perrigo Company’s internal control over financial reporting as of June 25, 2011, based on criteria establishedin Internal Control – Integrated Framework issued by the Committee of Sponsoring Organizations of the TreadwayCommission and our report dated August 16, 2011 expressed an unqualified opinion thereon.
/s/ Ernst & Young LLP
Grand Rapids, MichiganAugust 16, 2011
69

PERRIGO COMPANYCONSOLIDATED STATEMENTS OF INCOME
(in thousands, except per share amounts)
Net salesCost of salesGross profitOperating expenses
DistributionResearch and developmentSelling and administration
SubtotalWrite-off of in-process research and developmentRestructuring
TotalOperating incomeInterest, netOther (income) expense, netInvestment impairmentIncome from continuing operations before income taxesIncome tax expenseIncome from continuing operationsIncome (loss) from discontinued operations, net of taxNet incomeEarnings (loss) per share(1)
BasicContinuing operationsDiscontinued operationsBasic earnings per share
DilutedContinuing operationsDiscontinued operationsDiluted earnings per share
Weighted average shares outstandingBasicDiluted
Dividends declared per share
Fiscal Year
2011$ 2,755,029
1,810,159944,870
34,68489,250
329,698453,632
—1,033
454,665490,20542,312(2,661)
—450,554109,996340,558
(1,361)$ 339,197
$ 3.69(0.01)
$ 3.67
$ 3.64(0.01)
$ 3.63
92,31393,529
$ 0.2725
2010As Adjusted
(Note 1)$ 2,268,150
1,521,917746,233
28,32283,515
269,974381,81119,0009,523
410,334335,89928,415(1,165)
—308,64984,215
224,434(635)
$ 223,799
$ 2.46(0.01)
$ 2.45
$ 2.42(0.01)
$ 2.41
91,39992,845
$ 0.2425
2009As Adjusted
(Note 1)$ 2,005,590
1,408,490597,100
24,09076,783
231,813332,686
27914,647
347,612249,48826,9951,108
15,104206,28163,452
142,8292,704
$ 145,533
$ 1.550.03
$ 1.58
$ 1.530.03
$ 1.55
92,18393,629
$ 0.2150
(1) The sum of individual per share amounts may not equal due to rounding.
See accompanying notes to consolidated financial statements.
70

PERRIGO COMPANYCONSOLIDATED BALANCE SHEETS
(in thousands)
AssetsCurrent assets
Cash and cash equivalentsRestricted cashInvestment securitiesAccounts receivable, netInventoriesCurrent deferred income taxesIncome taxes refundable
Prepaid expenses and other current assetsCurrent assets of discontinued operations
Total current assetsProperty and equipment
LandBuildingsMachinery and equipment
Less accumulated depreciation
Goodwill and other indefinite-lived intangible assetsOther intangible assets, netNon-current deferred income taxesOther non-current assets
Liabilities and Shareholders’ EquityCurrent liabilities
Accounts payableShort-term debtPayroll and related taxesAccrued customer programsAccrued liabilitiesAccrued income taxesCurrent portion of long-term debtCurrent liabilities of discontinued operations
Total current liabilitiesNon-current liabilities
Long-term debt, less current portionNon-current deferred income taxesOther non-current liabilities
Total non-current liabilitiesShareholders’ Equity
Controlling interest shareholders’ equity:Preferred stock, without par value, 10,000 shares authorizedCommon stock, without par value, 200,000 shares authorizedAccumulated other comprehensive incomeRetained earnings
Noncontrolling interestTotal shareholders’ equity
Supplemental Disclosures of Balance Sheet InformationRelated to Continuing Operations
Allowance for doubtful accountsWorking capitalPreferred stock, shares issued and outstandingCommon stock, shares issued and outstanding
June 25, 2011
$ 310,104——
477,851505,576
30,474370
50,3502,568
1,377,293
39,868324,773641,157
1,005,798(498,490)507,308
644,902567,573
10,53181,614
$ 3,189,221
$ 343,2782,770
81,45591,37457,51410,55115,0004,093
606,035
875,00010,601
166,5981,052,199
—467,661127,050934,333
1,529,0441,943
1,530,987$ 3,189,221
$ 7,837$ 772,783
—92,778
June 26, 2010
As Adjusted(Note 1)
$ 109,765400,000
559359,809452,980
27,22514,43930,549
7,3751,402,701
37,215306,995540,959885,169
(436,586)448,583
618,042587,000
—52,677
$ 3,109,003
$ 267,3119,000
79,21959,89890,04611,665
400,0005,370
922,509
935,00049,346
108,2081,092,554
—428,457
43,200620,439
1,092,0961,844
1,093,940$ 3,109,003
$ 8,015$ 478,187
—91,694
See accompanying notes to consolidated financial statements.
71

PERRIGO COMPANYCONSOLIDATED STATEMENTS OF SHAREHOLDERS’ EQUITY AND COMPREHENSIVE INCOME
(in thousands, except per share amounts)
Balance at June 28, 2008
Net income
Accumulated other comprehensive income (loss):
Change in fair value of derivative financial instruments, net of$162 tax
Foreign currency translation adjustments
Change in fair value of investment securities
Adjustment to adopt ASC 320-10-65
Post-retirement liability adjustments, net of $214 tax
Issuance of common stock under:
Stock options
Restricted stock plan
Compensation for stock options
Compensation for restricted stock
Cash dividends, $0.215 per share
Tax effect from stock transactions
Repurchases of common stock
Balance at June 27, 2009
Net income
Accumulated other comprehensive income (loss):
Change in fair value of derivative financial instruments, net of$898 tax
Foreign currency translation adjustments
Change in fair value of investment securities
Post-retirement liability adjustments, net of $233 tax
Issuance of common stock under:
Stock options
Restricted stock plan
Compensation for stock options
Compensation for restricted stock
Cash dividends, $0.2425 per share
Tax effect from stock transactions
Repurchases of common stock
Balance at June 26, 2010
Net income
Accumulated other comprehensive income (loss):
Change in fair value of derivative financial instruments, net of$425 tax
Foreign currency translation adjustments
Change in fair value of investment securities
Post-retirement liability adjustments, net of $87 tax
Issuance of common stock under:
Stock options
Restricted stock plan
Compensation for stock options
Compensation for restricted stock
Cash dividends, $0.2725 per share
Tax effect from stock transactions
Repurchases of common stock
Balance at June 25, 2011
Common StockIssued
Shares
93,311
—
—
—
—
—
—
720
14
—
—
—
—
(1,836)
92,209
—
—
—
—
—
1,347
200
—
—
—
—
(2,062)
91,694
—
—
—
—
—
781
445
—
—
—
—
(142)
92,778
Amount
$ 488,537
—
—
—
—
—
—
10,062
—
3,313
7,040
—
5,780
(62,489)
452,243
—
—
—
—
—
21,444
—
3,854
10,842
—
11,162
(71,088)
428,457
—
—
—
—
—
14,341
—
3,794
11,561
—
17,816
(8,308)
$ 467,661
AccumulatedOther
ComprehensiveIncome (loss)
$ 137,435
—
300
(91,399)
3,956
(5,000)
(398)
—
—
—
—
—
—
—
44,894
—
1,668
(2,362)
(568)
(432)
—
—
—
—
—
—
—
43,200
—
(790)
81,691
3,110
(161)
—
—
—
—
—
—
—
$ 127,050
ComprehensiveIncome (loss)
$ 236,638
145,533
300
(91,399)
3,956
(5,000)
(398)
—
—
—
—
—
—
—
52,992
223,799
1,668
(2,362)
(568)
(432)
—
—
—
—
—
—
—
222,105
339,197
(790)
81,691
3,110
(161)
—
—
—
—
—
—
—
$ 423,047
RetainedEarnings
$ 288,393
145,533
—
—
—
5,000
—
—
—
—
—
(19,957)
—
—
418,969
223,799
—
—
—
—
—
—
—
—
(22,329)
—
—
620,439
339,197
—
—
—
—
—
—
—
—
(25,303)
—
—
$ 934,333
See accompanying notes to consolidated financial statements.
72

PERRIGO COMPANYCONSOLIDATED STATEMENTS OF CASH FLOWS
(in thousands)
Cash Flows From (For) Operating ActivitiesNet incomeAdjustments to derive cash flows
Write-off of in-process research and developmentDepreciation and amortizationRestructuring and asset impairmentLoss (gain) on sale of businessShare-based compensationIncome tax benefit from exercise of stock optionsExcess tax benefit of stock transactionsDeferred income taxes
SubtotalChanges in operating assets and liabilities, net of asset and business acquisitions and disposition
Accounts receivableInventoriesAccounts payablePayroll and related taxesAccrued customer programsAccrued liabilitiesAccrued income taxesOther
SubtotalNet cash from operating activities
Cash Flows (For) From Investing ActivitiesProceeds from sales of securitiesAcquired research and developmentAdditions to property and equipment(Return of) proceeds from sale of businessAcquisitions of assetsAcquisitions of businesses, net of cash acquired
Net cash for investing activitiesCash Flows (For) From Financing Activities
Repayments of short-term debt, netBorrowings of long-term debtRepayments of long-term debtDeferred financing feesExcess tax benefit of stock transactionsIssuance of common stockRepurchase of common stockCash dividends
Net cash (for) from financing activitiesEffect of exchange rate changes on cash
Net increase (decrease) in cash and cash equivalentsCash and cash equivalents of continuing operations, beginning of periodCash balance of discontinued operations, beginning of periodCash and cash equivalents, end of period
Less cash balance of discontinued operations, end of periodCash and cash equivalents of continuing operations, end of periodSupplemental Disclosures of Cash Flow Information
Cash paid/received during the year for:Interest paidInterest receivedIncome taxes paidIncome taxes refunded
Fiscal Year
2011
$ 339,197
—102,941
1,0332,151
15,355(623)
(17,193)(57,904)384,957
(107,235)(30,416)57,804
61631,440
(32,335)56,21612,914
(10,996)373,961
560—
(99,443)(3,558)
(10,750)2,624
(110,567)
(6,230)150,000
(195,000)(5,483)17,19314,341(8,308)
(25,303)(58,790)(4,265)
200,339109,765
—310,104
—$ 310,104
$ 47,455$ 3,726$ 115,627$ 1,440
2010As Adjusted
(Note 1)
$ 223,799
19,00074,104
9,523(750)
14,696(1,302)(9,860)
(12,585)316,625
(21,766)(32,217)
(1,558)30,917
5,1427,451
26,3101,459
15,738332,363
—(19,000)(57,816)35,980
(10,262)(868,802)(919,900)
(8,771)625,000
(165,000)(5,813)9,860
21,444(71,088)(22,329)383,303
(3,643)(207,877)317,638
4109,765
—$ 109,765
$ 53,557$ 21,392$ 77,420$ 1,433
2009As Adjusted
(Note 1)
$ 145,533
27971,29731,351
—10,353(3,490)(2,290)(1,185)
251,848
5,7476,7764,444
(20,351)1,124
(12,371)7,553
(5,013)(12,091)239,757
——
(57,431)—
(1,000)(88,248)
(146,679)
(13,736)—
(31,380)—
2,29010,062
(62,489)(19,957)
(115,210)2,361
(19,771)337,405
8317,642
(4)$ 317,638
$ 48,202$ 24,258$ 73,276$ 11,283
See accompanying notes to consolidated financial statements.
73

PERRIGO COMPANYNOTES TO CONSOLIDATED FINANCIAL STATEMENTS
(in thousands, except per share amounts)
NOTE 1 – SUMMARY OF SIGNIFICANT ACCOUNTING POLICIES AND CHANGE IN ACCOUNTING PRINCIPLES
The Company
The Company, through several wholly owned subsidiaries, develops, manufactures and distributes consumerhealthcare products, generic prescription (Rx) drugs, infant formulas, nutritional products and active pharmaceuticalingredients (API) primarily in the U.S., Israel, Europe, Mexico and Australia. In the U.S., these subsidiaries consistprimarily of L. Perrigo Company, Perrigo Company of South Carolina, Inc., Perrigo New York, Inc., Perrigo Holland,Inc. (formerly J.B. Laboratories, Inc.), Perrigo Florida, Inc. (formerly Unico Holdings, Inc.) and PBM Holdings, Inc.Outside the U.S., these subsidiaries consist primarily of Perrigo Israel Pharmaceuticals Ltd., Chemagis Ltd., Quimicay Farmacia S.A. de C.V., Laboratorios Diba, S.A., Wrafton Laboratories Limited, Galpharm Healthcare Ltd. and OrionLaboratories Pty Ltd. As used herein, the “Company” means Perrigo Company, its subsidiaries and all predecessorsof Perrigo Company and its subsidiaries.
Basis of Presentation
The Company’s fiscal year is a 52 or 53 week period, which ends the Saturday on or about June 30. Fiscal years2011, 2010 and 2009 were comprised of 52 weeks and ended June 25, 2011, June 26, 2010 and June 27, 2009,respectively. In the event that the Company has discontinued operations or changes to purchase accounting duringthe measurement period for business combinations, prior year financial statements are adjusted accordingly to conformwith current financial reporting requirements.
The Company has four reportable segments, aligned primarily by type of product: Consumer Healthcare, Nutritionals,Rx Pharmaceuticals and API. In addition, the Company has an Other category that consists of the Israel Pharmaceuticaland Diagnostic Products operating segment, which does not individually meet the quantitative thresholds required tobe a separately reportable segment. On April 30, 2010, the Company acquired 100% of the shares of PBM Holdings,Inc. (PBM), the leading manufacturer and distributor of store brand infant formulas, pediatric nutritionals and babyfoods sold by leading retailers in the mass, club, grocery and drug channels in the U.S., Canada, Mexico and China.As a result of the acquisition of PBM, the Company began participating in new nutritional product lines. In the firstquarter of fiscal 2011, the Company realigned and expanded its operating segments to include a Nutritionals segment,representing infant formulas and other nutritional products. Accounting Standard Codification (ASC) 280-10-50 definesan operating segment as a component of a public entity that earns revenue and incurs expenses, has discrete financialinformation available and is reviewed regularly by the chief decision maker for purposes of allocating resources andassessing performance. Each of the segments meets the requirements of an operating segment. The ConsumerHealthcare, Nutritionals, Rx Pharmaceuticals and API operating segments are also considered to be reportablesegments by management. This segment structure is consistent with the way management makes operating decisions,allocates resources and manages the growth and profitability of the Company’s business. As a result of the changein segment reporting, all historical segment information has been adjusted to conform to the new presentation.
Discontinued Operations
In March 2009, the Company committed to a plan to sell its Israel Consumer Products business. The financial resultsof this business have been classified as discontinued operations in the consolidated financial statements for all periodspresented. The sale was completed in the third quarter of fiscal 2010. After the finalization of post-closing workingcapital adjustments in the third quarter of fiscal 2011, the sale resulted in a pre-tax loss of $1,407. See Note 3 foradditional information regarding discontinued operations. Unless otherwise noted, amounts and disclosures throughoutthe Notes to Consolidated Financial Statements relate to the Company’s continuing operations.
Principles of Consolidation
The consolidated financial statements include the accounts of the Company and all majority owned subsidiaries. Allintercompany transactions and balances have been eliminated in consolidation. Prior to June 27, 2010, the Company’sconsolidated results of operations and financial position included the financial results of its U.K., Mexico, Germanyand Israel subsidiaries on a twelve-month period ending in May, resulting in a one-month reporting lag when comparedto the remainder of the Company.
74

Starting June 27, 2010, the reporting year-end of these foreign operations was changed from May to June. Thepreviously existing one-month reporting lag was eliminated as it was no longer required to achieve a timely consolidationdue to the Company’s investments in technology, ERP systems and personnel to enhance its financial statement closeprocess. The Company believes this change is preferable because the financial information of all operating units isnow reported based on the same period-end, which improves overall financial reporting to investors by providing themost current information available. In accordance with ASC 850-10-50-2, “A Change in the Difference Between Parentand Subsidiary Fiscal Year-Ends,” the elimination of this previously existing reporting lag is considered a voluntarychange in accounting principle in accordance with ASC 250-10-50 “Change in Accounting Principle.” Voluntary changesin accounting principles are to be reported through retrospective application of the new principle to all prior financialstatement periods presented. Accordingly, the Company’s financial statements for periods prior to fiscal 2011 havebeen adjusted to reflect the period-specific effects of applying this accounting principle. This change resulted in acumulative effect of an accounting change of $1,602, net of income tax effect, to retained earnings as of June 29,2008. The impact of this change in accounting principle to eliminate the one-month lag for foreign subsidiaries issummarized below for the Company’s consolidated statements of income for the twelve months ended June 26, 2010and June 27, 2009, the consolidated balance sheet as of June 26, 2010, and the consolidated statements of cashflows for the twelve months ended June 26, 2010 and June 27, 2009.
75

PERRIGO COMPANYNOTES TO CONSOLIDATED STATEMENTS OF INCOME
(in thousands, except per share amounts)
Net salesCost of salesGross profitOperating expenses
DistributionResearch and developmentSelling and administration
SubtotalWrite-off of in-process research anddevelopment
RestructuringTotal
Operating incomeInterest, netOther income, netIncome from continuing operationsbefore income taxes
Income tax expenseIncome from continuing operationsIncome (loss) from discontinuedoperations, net of tax
Net income
Earnings (loss) per share(1)
BasicContinuing operationsDiscontinued operationsBasic earnings per share
DilutedContinuing operationsDiscontinued operationsDiluted earnings per share
Fiscal Year Ended June 26, 2010
As Reported$ 2,268,870
1,522,854746,016
28,38882,509
270,701381,598
19,0009,523
410,121335,89528,778(1,069)
308,18684,089
224,097
(1,551)$ 222,546
$ 2.45(0.02)
$ 2.43
$ 2.41(0.02)
$ 2.40
Adjustments$ (720)
(937)217
(66)1,006(727)213
——
2134
(363)(96)
463126337
916$ 1,253
$ 0.000.01
$ 0.01
$ 0.000.01
$ 0.01
After VoluntaryChange in
Accounting Principle$ 2,268,150
1,521,917746,233
28,32283,515
269,974381,811
19,0009,523
410,334335,89928,415(1,165)
308,64984,215
224,434
(635)$ 223,799
$ 2.46(0.01)
$ 2.45
$ 2.42(0.01)
$ 2.41
(1) The sum of individual per share amounts may not equal due to rounding.
76

PERRIGO COMPANYNOTES TO CONSOLIDATED STATEMENTS OF INCOME
(in thousands, except per share amounts)
Net salesCost of salesGross profitOperating expenses
DistributionResearch and developmentSelling and administration
SubtotalWrite-off of in-process research anddevelopment
RestructuringTotal
Operating incomeInterest, netOther expense (income), netInvestment impairmentIncome from continuing operationsbefore income taxes
Income tax expenseIncome from continuing operationsIncome (loss) from discontinuedoperations, net of tax
Net income
Earnings (loss) per share(1)
BasicContinuing operationsDiscontinued operationsBasic earnings per share
DilutedContinuing operationsDiscontinued operationsDiluted earnings per share
Fiscal Year Ended June 27, 2009
As Reported$ 2,006,862
1,410,865595,997
24,20377,922
231,639333,764
27914,647
348,690247,30727,1541,269
15,104
203,78062,682
141,098
2,951$ 144,049
$ 1.530.03
$ 1.56
$ 1.510.03
$ 1.54
Adjustments$ (1,272)
(2,375)1,103
(113)(1,139)
174(1,078)
——
(1,078)2,181(159)(161)
—
2,501770
1,731
(247)$ 1,484
$ 0.02(0.00)
$ 0.02
$ 0.02(0.00)
$ 0.02
After VoluntaryChange in
Accounting Principle$ 2,005,590
1,408,490597,100
24,09076,783
231,813332,686
27914,647
347,612249,48826,9951,108
15,104
206,28163,452
142,829
2,704$ 145,533
$ 1.550.03
$ 1.58
$ 1.530.03
$ 1.55
(1) The sum of individual per share amounts may not equal due to rounding.
77

PERRIGO COMPANYNOTES TO CONSOLIDATED BALANCE SHEETS
(in thousands)
June 26, 2010AssetsCurrent assets
Cash and cash equivalentsRestricted cashInvestment securitiesAccounts receivable, netInventoriesCurrent deferred income taxesIncome taxes refundablePrepaid expenses and other current assetsCurrent assets of discontinued operations
Total current assetsProperty and equipment
LandBuildingsMachinery and equipment
Less accumulated depreciation
Goodwill and other indefinite-lived intangibleassetsOther intangible assets, netOther non-current assets
Liabilities and Shareholders’ EquityCurrent liabilities
Accounts payableShort-term debtPayroll and related taxesAccrued customer programsAccrued liabilitiesAccrued income taxesCurrent portion of long-term debtCurrent liabilities of discontinued operations
Total current liabilitiesNon-current liabilities
Long-term debt, less current portionNon-current deferred income taxesOther non-current liabilities
Total non-current liabilitiesShareholders’ Equity
Controlling interest shareholders’ equity:Preferred stock, without par value, 10,000shares authorizedCommon stock, without par value, 200,000shares authorizedAccumulated other comprehensive incomeRetained earnings
Noncontrolling interestTotal shareholders’ equity
As Reported
$ 97,568400,000
557358,500448,87126,64813,86428,0717,214
1,381,293
37,189306,322542,442885,953
(437,037)448,916
622,745587,09452,688
$ 3,092,736
$ 258,4939,000
82,08859,89888,7503,048
400,0005,428
906,705
935,00055,333
107,0431,097,376
—
428,45739,048
619,3031,086,808
1,8471,088,655
$ 3,092,736
Adjustments
$ 12,197—2
1,3094,109
577575
2,478161
21,408
26673
(1,483)(784)451
(333)
(4,703)(94)(11)
$ 16,267
$ 8,818—
(2,869)—
1,2968,617
—(58)
15,804
—(5,987)1,165
(4,822)
—
—4,1521,1365,288
(3)5,285
$ 16,267
After VoluntaryChange in Accounting
Principle
$ 109,765400,000
559359,809452,980
27,22514,43930,5497,375
1,402,701
37,215306,995540,959885,169
(436,586)448,583
618,042587,000
52,677$ 3,109,003
$ 267,3119,000
79,21959,89890,04611,665
400,0005,370
922,509
935,00049,346
108,2081,092,554
—
428,45743,200
620,4391,092,096
1,8441,093,940
$ 3,109,003
78

PERRIGO COMPANYNOTES TO CONSOLIDATED STATEMENTS OF CASH FLOWS
(in thousands)
Cash Flows From (For) Operating Activities
Net income
Adjustments to derive cash flows
Write-off of in-process research and development
Depreciation and amortization
Restructuring and asset impairment
Gain on sale of business
Share-based compensation
Income tax benefit from exercise of stock options
Excess tax benefit of stock transactions
Deferred income taxes
Subtotal
Changes in operating assets and liabilities, net of asset and businessacquisitions and disposition
Accounts receivable
Inventories
Accounts payable
Payroll and related taxes
Accrued customer programs
Accrued liabilities
Accrued income taxes
Other
Subtotal
Net cash from operating activities
Cash Flows (For) From Investing Activities
Acquired research and development
Additions to property and equipment
Proceeds from sale of business
Acquisitions of assets
Acquisitions of businesses, net of cash acquired
Net cash for investing activities
Cash Flows (For) From Financing Activities
Repayments of short-term debt, net
Borrowings of long-term debt
Repayments of long-term debt
Deferred financing fees
Excess tax benefit of stock transactions
Issuance of common stock
Repurchase of common stock
Cash dividends
Net cash from financing activities
Effect of exchange rate changes on cash
Net increase (decrease) in cash and cash equivalents
Cash and cash equivalents of continuing operations, beginning of period
Cash balance of discontinued operations, beginning of period
Cash and cash equivalents, end of period
Less cash balance of discontinued operations, end of period
Cash and cash equivalents of continuing operations, end of period
Fiscal Year Ended June 26, 2010
As Reported
$ 222,546
19,000
76,133
9,523
(750)
14,696
(1,302)
(9,860)
(10,347)
319,639
(6,886)
(30,199)
(21,166)
30,523
5,142
4,716
13,213
(809)
(5,466)
314,173
(19,000)
(55,892)
35,980
(10,262)
(868,802)
(917,976)
(8,771)
625,000
(165,000)
(5,813)
9,860
21,444
(71,088)
(22,329)
383,303
1,931
(218,569)
316,133
4
97,568
—
$ 97,568
Adjustments
$ 1,253
—
(2,029)
—
—
—
—
—
(2,238)
(3,014)
(14,880)
(2,018)
19,608
394
—
2,735
13,097
2,268
21,204
18,190
—
(1,924)
—
—
—
(1,924)
—
—
—
—
—
—
—
—
—
(5,574)
10,692
1,505
—
12,197
—
$ 12,197
After VoluntaryChange in Accounting
Principle
$ 223,799
19,000
74,104
9,523
(750)
14,696
(1,302)
(9,860)
(12,585)
316,625
(21,766)
(32,217)
(1,558)
30,917
5,142
7,451
26,310
1,459
15,738
332,363
(19,000)
(57,816)
35,980
(10,262)
(868,802)
(919,900)
(8,771)
625,000
(165,000)
(5,813)
9,860
21,444
(71,088)
(22,329)
383,303
(3,643)
(207,877)
317,638
4
109,765
—
$ 109,765
79

PERRIGO COMPANYNOTES TO CONSOLIDATED STATEMENTS OF CASH FLOWS
(in thousands)
Cash Flows From (For) Operating Activities
Net income
Adjustments to derive cash flows
Write-off of in-process research and development
Depreciation and amortization
Restructuring and asset impairment
Share-based compensation
Income tax benefit from exercise of stock options
Excess tax benefit of stock transactions
Deferred income taxes
Subtotal
Changes in operating assets and liabilities, net of asset and businessacquisitions and disposition
Accounts receivable
Inventories
Accounts payable
Payroll and related taxes
Accrued customer programs
Accrued liabilities
Accrued income taxes
Other
Subtotal
Net cash from operating activities
Cash Flows (For) From Investing Activities
Additions to property and equipment
Cash acquired in asset exchange
Acquisitions of assets
Acquisitions of businesses, net of cash acquired
Net cash for investing activities
Cash Flows (For) From Financing Activities
Repayments of short-term debt, net
Repayments of long-term debt
Excess tax benefit of stock transactions
Issuance of common stock
Repurchase of common stock
Cash dividends
Net cash for financing activities
Effect of exchange rate changes on cash
Net decrease in cash and cash equivalents
Cash and cash equivalents of continuing operations, beginning of period
Cash balance of discontinued operations, beginning of period
Cash and cash equivalents, end of period
Less cash balance of discontinued operations, end of period
Cash and cash equivalents of continuing operations, end of period
Fiscal Year Ended June 27, 2009
As Reported
$ 144,049
279
70,142
31,351
10,353
(3,490)
(2,290)
(1,422)
248,972
6,446
341
24,821
(20,621)
1,124
(13,483)
12,135
(1,390)
9,373
258,345
(59,238)
2,115
(1,000)
(88,248)
(146,371)
(13,736)
(31,380)
2,290
10,062
(62,489)
(19,957)
(115,210)
769
(2,467)
318,599
5
316,137
(4)
$ 316,133
Adjustments
$ 1,484
—
1,155
—
—
—
—
237
2,876
(699)
6,435
(20,377)
270
—
1,112
(4,582)
(3,623)
(21,464)
(18,588)
1,807
(2,115)
—
—
(308)
—
—
—
—
—
—
—
1,592
(17,304)
18,806
3
1,505
—
$ 1,505
After VoluntaryChange in Accounting
Principle
$ 145,533
279
71,297
31,351
10,353
(3,490)
(2,290)
(1,185)
251,848
5,747
6,776
4,444
(20,351)
1,124
(12,371)
7,553
(5,013)
(12,091)
239,757
(57,431)
—
(1,000)
(88,248)
(146,679)
(13,736)
(31,380)
2,290
10,062
(62,489)
(19,957)
(115,210)
2,361
(19,771)
337,405
8
317,642
(4)
$ 317,638
80

Use of Estimates
The preparation of financial statements in conformity with U.S. generally accepted accounting principles (GAAP)requires management to make estimates and assumptions, which affect the reported earnings, financial position andvarious disclosures. Although the estimates are considered reasonable, actual results could differ from the estimates.
International
The Company translates its foreign operations’ assets and liabilities denominated in foreign currencies into U.S. dollarsat current rates of exchange as of the balance sheet date and income and expense items at the average exchangerate for the reporting period. Translation adjustments resulting from exchange rate fluctuations are recorded in thecumulative translation account, a component of accumulated other comprehensive income. Gains or losses fromforeign currency transactions are included in other expense (income), net.
Revenues
Revenues from product sales are recognized when the goods are shipped to the customer. When title and risk passto the customer is dependent on the customer’s shipping terms. If the customer has shipping terms of free on board(FOB) shipping point, title and risk pass to the customer as soon as the freight carrier leaves the Company’s shippinglocation. If the customer has shipping terms of FOB destination, title and risk pass to the customer upon receipt of theorder at the customer’s location. A provision is recorded to exclude shipments estimated to be in-transit to customersat the end of the reporting period. Aprovision is recorded and accounts receivable is reduced as revenues are recognizedfor estimated losses on credit sales due to customer claims for discounts, price discrepancies, returned goods andother items.
The Company maintains customer-related accruals and allowances that consist primarily of chargebacks, rebates andshelf stock adjustments, which are recorded as revenues are recognized. Certain of these customer-related accrualsand allowances are recorded in the balance sheet as current liabilities, and others are recorded as a reduction inaccounts receivable. The accrual or allowance is generally estimated based on contractual requirements and historicalperformance of the customers involved in the program. Changes in these estimates and assumptions related tocustomer programs may result in additional accruals or allowances. Customer-related accruals and allowances were$98,765 at June 25, 2011 and $63,735 at June 26, 2010.
Revenues from service and royalty arrangements, including revenues from collaborative agreements, consist primarilyof royalty payments, payments for research and developmental services, up-front fees and milestone payments. If anarrangement requires the delivery or performance of multiple deliverables or service elements, the Company determineswhether the individual elements represent “separate units of accounting” under the requirements of ASC Subtopic605-25, “Revenue Recognition – Multiple-Element Arrangements” (ASC 605-25). If the separate elements meet therequirements of ASC 605-25, the Company recognizes the revenue associated with each element separately andrevenue is allocated among elements based on the residual method. If the elements within a multiple deliverablearrangement are not considered separate units of accounting, the delivery of an individual element is considered notto have occurred if there are undelivered elements that are considered essential to the arrangement. To the extentsuch arrangements contain refund clauses triggered by non-performance or other adverse circumstances, revenue isnot recognized until all contractual obligations are satisfied. Non-refundable up-front fees are deferred and amortizedto revenue over the related performance period. The Company estimates the performance period based on the specificterms of each collaborative agreement. Revenue associated with research and development services is recognizedon a proportional performance basis over the period that the Company performs the related activities under the termsof the agreement. Revenue resulting from the achievement of contingent milestone events stipulated in the agreementsis recognized when the milestone is achieved. Milestones are based upon the occurrence of a substantive elementspecified in the contract. See Note 19 regarding the Company’s current collaboration agreements.
Shipping and handling costs billed to customers are included in net sales. Conversely, shipping and handling expensesincurred by the Company are included in cost of sales.
Financial Instruments
The carrying amount of the Company’s financial instruments, consisting of cash and cash equivalents, investmentsecurities, accounts receivable, accounts payable, short-term debt and variable rate long-term debt, approximate theirfair value. See Note 5 for the fair value disclosure of the Company’s fixed rate long-term debt.
The Company applies the provisions of ASC Topic 820, “Fair Value Measurements and Disclosures” (ASC 820), for
81

financial and nonfinancial assets and liabilities. ASC 820 applies to all assets and liabilities that are being measured and reported on a fair value basis, establishes a framework for measuring fair value of assets and liabilities and expands disclosures about fair value measurements.
Derivative Instruments
The Company enters into certain derivative financial instruments, when available on a cost-effective basis, to mitigate its risk associated with changes in interest rates and foreign currency exchange rates. The Company accounts for derivatives in accordance with ASC Topic 815, “Derivatives and Hedging”, which establishes accounting and reporting standards requiring that derivative instruments (including certain derivative instruments embedded in other contracts) be recorded on the balance sheet as either an asset or liability measured at fair value. Additionally, changes in the derivative's fair value are recognized currently in earnings unless specific hedge accounting criteria are met. If hedge accounting criteria are met for cash flow hedges, the changes in a derivative’s fair value are recorded in shareholders’ equity as a component of other comprehensive income (OCI), net of tax. These deferred gains and losses are recognized in income in the period in which the hedged item and hedging instrument affect earnings. All of the Company’s designated hedging instruments are classified as cash flow hedges.
All derivative instruments are managed on a consolidated basis to efficiently net exposures and thus take advantage of any natural offsets. The absolute value of the notional amounts of derivative contracts for the Company approximates $378,800. Gains and losses related to the derivative instruments are expected to be largely offset by gains and losses on the original underlying asset or liability. The Company does not use derivative financial instruments for speculative purposes.
The Company is exposed to credit loss in the event of nonperformance by the counterparties on derivative contracts. It is the Company’s policy to manage its credit risk on these transactions by dealing only with financial institutions having a long-term credit rating of “A” or better and by distributing the contracts among several financial institutions to diversify credit concentration risk.
Cash and Cash Equivalents
Cash and cash equivalents consist primarily of demand deposits and other short-term investments with maturities of three months or less at the date of purchase.
Investment Securities
The Company determines the appropriate classification of all investment securities as held-to-maturity, available-for-sale or trading at the time of purchase and re-evaluates such classification as of each balance sheet date in accordance with ASC Topic 320, “Investments – Debt and Equity Securities”. Investments in equity securities that have readily determinable fair values are classified and accounted for as available-for-sale. The Company assesses whether temporary or other-than-temporary gains or losses on its investment securities have occurred due to increases or declines in fair value or other market conditions. If losses are considered temporary, they are reported on a net of tax basis within OCI. If losses are considered other-than-temporary, the credit loss portion is charged to operations and the non-credit loss portion is charged to OCI. Because the Company has determined that all of its investment securities are available-for-sale, unrealized gains and losses are reported, net of tax, as a component of accumulated OCI in shareholders’ equity. Realized gains and losses on investment securities are determined using the specific identification method. Amortization of premiums and discounts are included in interest income.
Accounts Receivable
The Company maintains an allowance for doubtful accounts that reduces receivables to amounts that are expected to be collected. In estimating the allowance, management considers factors such as current overall and industry-specific economic conditions, statutory requirements, historical and anticipated customer performance, historical experience with write-offs and the level of past-due amounts. Changes in these conditions may result in additional allowances. After all attempts to collect a receivable have failed, the receivable is written off against the allowance. The allowance for doubtful accounts was $7,837 at June 25, 2011 and $8,015 at June 26, 2010.
Inventories
Inventories are stated at the lower of cost or market. Cost is determined using the first-in first-out (FIFO) method. Inventory related to research and development is expensed at the point when it is determined the materials have no alternative future use.
The Company maintains reserves for estimated obsolete or unmarketable inventory based on the difference between
82

the cost of the inventory and its estimated net realizable value. In estimating the reserves, management considersfactors such as excess or slow-moving inventories, product expiration dating, products on quality hold, current andfuture customer demand and market conditions. Changes in these conditions may result in additional reserves.
Long-Lived Assets
Property and equipment are recorded at cost and are depreciated primarily using the straight-line method for financialreporting and accelerated methods for tax reporting. Useful lives for financial reporting range from 5 to 15 years formachinery and equipment and 10 to 45 years for buildings. Maintenance and repair costs are charged to earnings,while expenditures that increase asset lives are capitalized.
Goodwill is tested for impairment annually or more frequently if changes in circumstances or the occurrence of eventssuggest impairment exists. The test for impairment requires the Company to make several estimates about fair value,most of which are based on projected future cash flows and market valuation multiples. The estimates associated withthe goodwill impairment tests are considered critical due to the judgments required in determining fair value amounts,including projected future cash flows. Changes in these estimates may result in the recognition of an impairment loss.For fiscal 2011, 2010 and 2009, the required annual testing resulted in no impairment charge. Goodwill was $638,045at June 25, 2011 and $611,467 at June 26, 2010. See Note 7 for further information.
Other intangible assets consist of a portfolio of individual developed product technology/formulation and product rights,distribution and license agreements, customer relationships, non-compete agreements and trade names andtrademarks. These assets include those obtained in the acquisitions of Agis Industries (1983) Ltd. (Agis) in fiscal 2005;Glades Pharmaceuticals, LLC (Glades) in fiscal 2007; Qualis, Inc. and Galpharm Healthcare Ltd. (Galpharm) in fiscal2008; J.B. Laboratories, Inc. (JBL), Laboratorios Diba, S.A. (Diba) and Unico Holdings, Inc. (Unico) in fiscal 2009; andOrion Laboratories Pty Ltd. (Orion) and PBM Holdings, Inc. (PBM) in fiscal 2010. The assets categorized as developedproduct technology/formulation and product rights, certain distribution and license agreements and non-competeagreements are amortized over their estimated useful economic lives using the straight-line method. An acceleratedmethod of amortization is used for customer relationships and certain distribution agreements. Certain trade namesand trademarks are determined to have an indefinite useful life and are not subject to amortization. The Company,however, reviews them for impairment on an annual basis, or more frequently if events or changes in circumstancesindicate that any individual asset might be impaired, and adjusts the carrying value of the asset as necessary. Forintangible assets subject to amortization, an impairment analysis is performed whenever events or changes incircumstances indicate that the carrying amount of any individual asset may not be recoverable. The carrying amountof an intangible asset is not recoverable if it exceeds the sum of the undiscounted cash flows expected to result fromthe use and eventual disposition of the asset. An impairment loss is recognized if the carrying amount of the asset isnot recoverable and its carrying amount exceeds its fair value. Other intangible assets had a net carrying value of$574,430 at June 25, 2011 and $593,575 at June 26, 2010. See Note 7 for further information.
The Company periodically reviews all other long-lived assets that have finite lives and that are not held for sale forimpairment by comparing the carrying value of the assets to their estimated future undiscounted cash flows.
Share-Based Awards
Share-based compensation awards are recognized at fair value in accordance with ASC Topic 718 “Compensation –Stock Compensation”.
Income Taxes
Deferred income tax assets and liabilities are recorded based upon the difference between the financial reporting andthe tax reporting basis of assets and liabilities using the enacted tax rates. To the extent that available evidence raisesdoubt about the realization of a deferred tax asset, a valuation allowance is established.
Provision has not been made for U.S. or additional foreign taxes on undistributed post-acquisition earnings of foreignsubsidiaries because those earnings are considered permanently reinvested in the operations of those subsidiaries.
The Company adopted the provisions of ASC Subtopic 740-10 (ASC 740-10) on July 1, 2007. In accordance with ASC740-10, the Company records reserves for uncertain tax positions to the extent it is more likely than not that the taxposition will be sustained on audit, based on the technical merits of the position. Periodic changes in reserves foruncertain tax positions are reflected in the provision for income taxes. The Company has elected to retain its existingaccounting policy with respect to the treatment of interest and penalties attributable to income taxes, and continues
83
to reflect any change in such, to the extent it arises, as a component of its income tax provision or benefit.
Research and Development
All research and development costs, including payments related to products under development and researchconsulting agreements, are expensed as incurred. The Company may continue to make non-refundable paymentsto third parties for new technologies and for research and development work that has been completed. These paymentsmay be expensed at the time of payment depending on the nature of the payment made. Research and developmentspending was $89,250 for fiscal 2011, $83,515 for fiscal 2010, and $76,783 for fiscal 2009. In addition, fiscal 2010included charges of $14,000 and $5,000 for the write-offs of in-process research and development related to theAbbreviated New Drug Applications (ANDAs) acquired from KV Pharmaceuticals (KV) and Novel Laboratories, Inc.(Novel), respectively, and fiscal 2009 included a $279 charge for the write-off of in-process research and developmentrelated to the Diba acquisition. While the Company conducts a significant amount of its own research and development,it also enters into strategic alliance agreements to obtain the rights to manufacture and/or distribute new products.
The Company actively partners with other pharmaceutical companies to collaboratively develop, manufacture andmarket certain products or groups of products. These types of agreements are not uncommon in the pharmaceuticalindustry. The Company may choose to enter into these types of agreements to, among other things, leverage its orothers’ scientific research and development expertise or utilize its extensive marketing and distribution resources. TheCompany's policy on accounting for costs of strategic collaborations determines the timing of the recognition of certaindevelopment costs. In addition, this policy determines whether the cost is classified as development expense orcapitalized as an asset. Management is required to form judgments with respect to the commercial status of suchproducts in determining whether development costs meet the criteria for immediate expense or capitalization. Forexample, when the Company acquires certain products for which there is already an ANDA or a New Drug Application(NDA) approval directly related to the product, and there is net realizable value based on projected sales for theseproducts, the Company capitalizes the amount paid as an intangible asset. If the Company acquires product rightsthat are in the development phase and as to which the Company has no assurance that the third party will successfullycomplete its development milestones, the Company expenses the amount paid. See Note 19 regarding the Company’scurrent collaboration agreements.
Earnings per Share (EPS)
Basic EPS is calculated using the weighted average number of shares of common stock outstanding during eachperiod. It excludes both the dilutive effects of additional common shares that would have been outstanding if the sharesissued under stock incentive plans had been exercised and the dilutive effect of restricted shares and restricted shareunits, to the extent those shares and units have not vested. Diluted EPS is calculated including the effects of sharesand potential shares issued under stock incentive plans, following the treasury stock method.
Recently Issued Accounting Standards
In June 2011, the Financial Accounting Standards Board (FASB) issued Accounting Standards Update (ASU) 2011-05,“Comprehensive Income (ASC Topic 220): Presentation of Comprehensive Income.” The amendments in this ASUimprove the prominence of other comprehensive income items and align the presentation of OCI with InternationalFinancial Reporting Standards (IFRS). These changes allow an entity to present the total of comprehensive income,the components of net income, and the components of other comprehensive income either in a single statement ofcomprehensive income or in two separate and consecutive statements. Both methods must still report each componentof net income with total income, each component of other comprehensive income with a total amount of othercomprehensive income, and a total amount of comprehensive income. The amendments in this ASU are effective forpublic entities for fiscal years, and interim periods within those years, beginning after December 15, 2011. Earlyadoption is permitted and the amendments should be applied retrospectively. This guidance will be effective for theCompany in the first quarter of fiscal 2013.
In May 2011, the FASB issued ASU 2011-04, “Fair Value Measurement (ASC Topic 820): Amendments to AchieveCommon Fair Value Measurement and Disclosure Requirements in U.S. GAAP and IFRSs.” This ASU amended ASC820, to converge the fair value measurements guidance in U.S. GAAP and IFRSs. Some of the amendments clarifythe application of existing fair value measurement requirements, while other amendments change a particular principlein ASC 820. In addition, this ASU requires additional fair value disclosures. The amendments to this ASU are to beapplied prospectively, and will be effective for public companies for fiscal years and quarters beginning after December15, 2011. Early adoption is not permitted. This guidance will be effective for the Company in the first quarter of fiscal2013. The Company does not expect this ASU to have a material impact on its consolidated financial statements.
84

In December 2010, the FASB issued ASU 2010-29, “Business Combinations (ASC Topic 805): Disclosure ofSupplementary Pro Forma Information for Business Combinations.” The amendments in this ASU affect any publicentity as defined by ASCTopic805 that enters into business combinations that are material on an individual or aggregatebasis. The amendments in this ASU specify that if a public entity presents comparative financial statements, the entityshould disclose revenue and earnings of the combined entity as if the business combinations that occurred during thecurrent year had occurred as of the beginning of the comparable prior annual reporting period only. The amendmentsalso expand the supplemental pro forma disclosures to include a description of the nature and amount of material,nonrecurring pro forma adjustments directly attributable to the business combination included in the reported pro formarevenue and earnings. The amendments are effective prospectively for business combinations for which the acquisitiondate is on or after the beginning of the first annual reporting period beginning on or after December 15, 2010. Earlyadoption is permitted. This guidance will be effective for the Company in the first quarter of fiscal 2012. Accordingly,the effects of the Company’s adoption of this guidance will depend upon the extent and magnitude of businesscombinations the Company enters into after June 25, 2011.
In December 2010, the FASB issued ASU 2010-28, “Intangibles - Goodwill and Other (ASC Topic 350): When toPerform Step 2 of the Goodwill Impairment Test for Reporting Units with Zero or Negative Carrying Amounts.” Theamendments in this ASU modify Step 1 of the goodwill impairment test for reporting units with zero or negative carryingamounts. For those reporting units, an entity is required to perform Step 2 of the goodwill impairment test if it is morelikely than not that a goodwill impairment exists. In determining whether it is more likely than not that a goodwillimpairment exists, an entity should consider whether there are any adverse qualitative factors indicating that animpairment may exist. The qualitative factors are consistent with the existing guidance and examples, which requirethat goodwill of a reporting unit be tested for impairment between annual tests if an event occurs or circumstanceschange that would more likely than not reduce the fair value of a reporting unit below its carrying amount. For publicentities, the amendments in this ASU are effective for fiscal years, and interim periods within those years, beginningafter December 15, 2010. Early adoption is not permitted. This guidance will be effective for the Company in the firstquarter of fiscal 2012. The Company does not expect this ASU to have a material impact on its consolidated financialstatements.
In December 2010, the FASB issued ASU 2010-27, “Other Expenses (ASC Topic 720): Fees Paid to the FederalGovernment by Pharmaceutical Manufacturers.” This ASU provides guidance on how pharmaceutical manufacturersshould recognize and classify in their income statements fees mandated by the Patient Protection and Affordable CareAct as amended by the Health Care and Education Reconciliation Act (the Acts). The Acts impose an annual fee onthe pharmaceutical manufacturing industry for each calendar year beginning on or after January 1, 2011. An entity’sportion of the annual fee is payable no later than September 30 of the applicable calendar year and is not tax deductible.A portion of the annual fee will be allocated to individual entities on the basis of the amount of their branded prescriptiondrug sales for the preceding year as a percentage of the industry’s branded prescription drug sales for the same period.An entity’s portion of the annual fee becomes payable to the U.S. Treasury once a pharmaceutical manufacturing entityhas a gross receipt from branded prescription drug sales to any specified government program or in accordance withcoverage under any government program for each calendar year beginning on or after January 1, 2011. Theamendments in this ASU specify that the liability for the fee should be estimated and recorded in full upon the firstqualifying sale with a corresponding deferred cost that is amortized to expense using a straight-line method of allocationunless another method better allocates the fee over the calendar year that it is payable. The amendments in this ASUwere effective for calendar years beginning after December 31, 2010, when the fee initially became effective. Giventhe small number of branded drugs in the Company’s portfolio, this ASUdid not have a material impact on the Company'sconsolidated financial statements.
In April 2010, the FASB issued ASU 2010-17, “Revenue Recognition – Milestone Method (ASC Topic 605): MilestoneMethod of Revenue Recognition.” The amendments in the ASU provide guidance on defining a milestone anddetermining when it may be appropriate to apply the milestone method of revenue recognition for research ordevelopment transactions. Consideration that is contingent on achievement of a milestone in its entirety may berecognized as revenue in the period in which the milestone is achieved only if the milestone is judged to meet certaincriteria to be considered substantive. The amendments in the ASU are effective on a prospective basis for milestonesachieved in fiscal years, and interim periods within those years, beginning on or after June 15, 2010. Early adoptionwas permitted. Vendors may also elect to adopt the amendments in the ASU retrospectively for all prior periods. Theguidance in this ASU was effective for the Company in the first quarter of fiscal 2011 and did not have any impact onthe Company's consolidated financial statements upon adoption.
In April 2010, the FASB issued ASU 2010-13, “Compensation – Stock Compensation (ASC Topic 718): Effect of
85

Denominating the Exercise Price of a Share-Based Payment Award in the Currency of the Market in Which theUnderlying Equity Security Trades.” This ASU codifies the consensus reached in Emerging Issues Task Force IssueNo. 09-J, “Effect of Denominating the Exercise Price of a Share-Based Payment Award in the Currency of the Marketin Which the Underlying Equity Security Trades.” The amendments to the Codification clarify that an employee share-based payment award with an exercise price denominated in the currency of a market in which a substantial portionof the entity’s equity shares trades should not be considered to contain a condition that is not a market, performance,or service condition. Therefore, an entity would not classify such an award as a liability if it otherwise qualifies as equity.The amendments in this ASU are effective for fiscal years, and interim periods within those fiscal years, beginning onor after December 15, 2010. Early adoption is permitted. The amendments are to be applied by recording a cumulative-effect adjustment to beginning retained earnings. The Company does not expect this ASU to have a material impacton its consolidated financial statements.
In January 2010, the FASB issued ASU 2010-06, “Fair Value Measurements and Disclosures (ASC Topic 820):Improving Disclosures about Fair Value Measurements” (ASU 2010-06). This ASU amends ASC Topic 820 to requirean entity to: 1) disclose separately the amounts of significant transfers in and out of Level 1 and Level 2 fair valuemeasurements and describe the reasons for the transfers; and 2) present separate information for Level 3 activitypertaining to gross purchases, sales, issuances, and settlements. The Company adopted the new disclosurerequirements in the third quarter of fiscal 2010, except for the disclosures about purchases, sales, issuances andsettlements in the Level 3 reconciliation, which will be effective for fiscal years beginning after December 15, 2010,and for interim periods within those fiscal years, which will be the Company's first quarter of fiscal 2012. The adopteddisclosures have been provided in Note 5.
In December 2009, the FASBissued ASU2009-16, “Transfersand Servicing (ASC Topic860) –Accounting for Transfersof Financial Assets” (ASU 2009-16). ASU 2009-16 revises previous authoritative guidance related to accounting fortransfers of financial assets, and will require more disclosures about transfers of financial assets, including securitizationtransactions, and where entities have continuing exposure to the risks related to transferred financial assets. Amongother things, ASU 2009-16 eliminates the concept of a “qualifying special-purpose entity”, changes the requirementsfor derecognizing financial assets and enhances information reported to users of financial statements by providinggreater transparency about transfers of financial assets and an entity’s continuing involvement in transferred financialassets. ASU 2009-16 was effective at the start of a reporting entity’s first fiscal year beginning after November 15,2009. Early application was not permitted. This guidance was effective for the Company in the first quarter of fiscal2011 and did not have any impact on the Company's consolidated results of operations or its financial position uponadoption.
In October 2009, the FASB issued ASU 2009-13, “Revenue Recognition (ASC Topic 605) – Multiple-DeliverableRevenue Arrangements” (ASU 2009-13). ASU 2009-13 amends the criteria in ASC Subtopic 605-25, “RevenueRecognition – Multiple-Element Arrangements”, for separating consideration in multiple-deliverable arrangements.This Update addresses the accounting for multiple-deliverable arrangements to enable vendors to account for productsor services (deliverables) separately rather than as a combined unit. ASU 2009-13 modifies the requirements fordetermining whether a deliverable can be treated as a separate unit of accounting by removing the criteria that verifiableand objective evidence of fair value exists for the undelivered elements. This guidance eliminates the residual methodof allocation and requires that arrangement consideration be allocated at the inception of the arrangement to alldeliverables using the relative selling price method. This guidance establishes a selling price hierarchy for determiningthe selling price of a deliverable, which is based on: a) vendor-specific objective evidence; b) third-party evidence; orc) estimates. In addition, this guidance significantly expands required disclosures related to a vendor’s multiple-deliverable revenue arrangements. ASU 2009-13 is effective prospectively for revenue arrangements entered into ormaterially modified in fiscal years beginning on or after June 15, 2010, with early adoption permitted. This guidancewas effective for the Company in the first quarter of fiscal 2011 and did not have any impact on the Company'sconsolidated results of operations or its financial position upon adoption.
NOTE 2 – ACQUISITIONS
Acquired Research and Development
On May 26, 2010, the Company acquired the pending ANDA for the generic therapeutical equivalent of HalfLytely®
and Bisacodyl tablets bowel prep kit from Novel for $3,000 in cash and a $2,000 milestone payment based on tentativeapproval of the ANDA by the U.S. Food and Drug Administration (FDA). The milestone payment and the full amountof the purchase price, which related to acquired research and development, was capitalized and immediately writtenoff as in-process research and development in the fourth quarter of fiscal 2010 in the Company’s Rx Pharmaceuticalssegment.
86

On September 21, 2009, the Company acquired the ANDA for clindamycin phosphate (1%) and benzoyl peroxide(5%) gel from KV for $14,000 in cash and a $2,000 milestone payment to be made upon the successful completionof a contingency. Successful completion of the contingency is expected by early fiscal 2012. This product is theequivalent of Duac® gel which is indicated for the topical treatment of inflammatory acne vulgaris. Duac® gel is marketedby Stiefel Laboratories’ (Stiefel), a subsidiary of GlaxoSmithKline. Excluding the milestone payment, the full amountof the purchase price, which related to acquired research and development, was capitalized and immediately writtenoff as in-process research and development in the first quarter of fiscal 2010 in the Company’s Rx Pharmaceuticalssegment, because the ANDA had not received final FDA approval at the date of acquisition.
Asset Acquisitions
During fiscal 2011, the Company acquired a total of $10,750 of intangible assets associated with certain distributionand license agreements, most notably an agreement with AgaMatrix, Inc. (AgaMatrix). On February 17, 2011, theCompany announced that it entered into an exclusive agreement with AgaMatrix to sell and distribute blood glucosemonitors and test strips in the U.S. store brand channel. Under the terms of the agreement, the Company paid $5,000to AgaMatrix for a distribution and license agreement, which has been accounted for as an intangible asset beginningin the third quarter of fiscal 2011 and is being amortized on an accelerated basis over its eight-year useful life.
On July 1, 2009, the Company’s Israel Pharmaceutical and Diagnostic Products operating segment entered into adistribution agreement with a major global diagnostic company. In conjunction with this distribution agreement, theCompany acquired certain pharmaceutical diagnostic assets from a local pharmaceutical company for $4,610. Theacquisition enhanced the Company’s product portfolio and strengthened its position as the leader in the Israelipharmaceutical diagnostic market. The assets acquired in this transaction consisted primarily of intangible assetsassociated with customer supply contracts, machinery and equipment and inventory. The assets acquired and therelated operating results from the acquisition date were included in the Other category in the Company’s consolidatedfinancial statements beginning in the first quarter of fiscal 2010.
The purchase price of $4,610 was allocated as follows:
InventoryProperty and equipmentIntangible assets – Customer contracts
Total assets acquired
$ 1,3461,2622,002
$ 4,610
Management assigned fair value to the identifiable intangible assets by estimating the discounted forecasted cashflows related to the customer contracts. The average estimated useful lives of the contracts are six years and areamortized on a straight-line basis. Assumptions used in the valuation included a discount rate of 11%.
At the time of the acquisition, a step-up in the value of inventory of $606 was recorded in the allocation of the purchaseprice based on valuation estimates, of which $320 was charged to cost of sales in the first quarter of fiscal 2010 asthe inventory was sold. The remainder of the step-up in value was charged to cost of sales in the second quarter offiscal 2010 as the inventory was sold.
On November 2, 2009, in connection with this same distribution agreement, the Company’s Israel Pharmaceutical andDiagnostic Products operating segment acquired certain pharmaceutical diagnostic assets from another localpharmaceutical company for $5,152. This acquisition enhanced the Company’s product portfolio and strengthened itsposition as the leader in the Israeli pharmaceutical diagnostic market. The assets acquired in this transaction consistedprimarily of intangible assets associated with customer supply contracts, machinery and equipment and inventory. Theassets and the related operating results from the acquisition date were included in the Other category in the Company’sconsolidated financial statements beginning in the second quarter of fiscal 2010.
The purchase price of $5,152 was allocated as follows:
InventoryProperty and equipmentIntangible assets – Customer contracts
Total assets acquired
$ 869600
3,683$ 5,152
87
Management assigned fair value to the identifiable intangible assets by estimating the discounted forecasted cashflows related to the customer contracts. The average estimated useful lives of the contracts are six years and areamortized on a straight-line basis. Assumptions used in the valuation included a discount rate of 11%.
At the time of the acquisition, a step-up in the value of inventory of $417 was recorded in the allocation of the purchaseprice based on valuation estimates, of which $325 was charged to cost of sales in the second quarter of fiscal 2010as the inventory was sold. The remainder of the step-up in value was charged to cost of sales in the third quarter offiscal 2010 as the inventory was sold.
Subsequent Business Acquisition
Paddock Laboratories, Inc. – On July 26, 2011, the Company completed the acquisition of substantially all of the assetsof privately-held Paddock Laboratories, Inc. (Paddock) for approximately $547,000 in cash. The Company funded thetransaction using the new $250,000 five-year term loan, as discussed in Note 8, $212,000 of cash on hand and $85,000from its accounts receivable securitization program. As of the end of the fourth quarter of fiscal 2011, the Companyhad incurred $2,560 of acquisition costs, of which $1,315, $695 and $550 were expensed in operations in the second,third and fourth quarters of fiscal 2011, respectively. Headquartered in Minneapolis, Minnesota, Paddock is amanufacturer and marketer of generic Rx pharmaceutical products. The acquisition expanded the Company’s genericRx product offering, pipeline and scale.
The purchase price allocation is in the preliminary stages of the valuations process. The purchase price will be allocatedto the underlying assets acquired and liabilities assumed based upon their estimated fair values at the date of acquisition.To the extent the purchase price exceeds the estimated fair value of the net identifiable tangible and intangible assetsacquired, such excess will be allocated to goodwill. The Company expects the majority of the purchase price to beallocated between identifiable intangible assets and goodwill.
Business Acquisitions
The Company completed various business acquisitions during fiscal 2010 and 2009 as summarized below.
Fiscal 2010
PBM Holdings, Inc. – On April 30, 2010, the Company acquired 100% of the shares of PBM. The ultimate cash paidfor the shares was $839,369, which included cash acquired as of the transaction date of $30,591, after taking intoaccount final working capital adjustments. As of the end of the fourth quarter of fiscal 2010, the Company incurredapproximately $11,100 of acquisitions costs, of which approximately $3,200 and $7,900 were expensed in operationsin the third and fourth quarter of fiscal 2010, respectively. Headquartered in Gordonsville, Virginia, PBM was the leadingmanufacturer and distributor of store brand infant formulas, pediatric nutritionals and baby foods sold by leading retailersin the mass, club, grocery and drug channels in the U.S., Canada, Mexico and China. The acquisition was accountedfor under the acquisition method of accounting, and the related assets acquired and liabilities assumed were recordedat fair value. The operating results for PBM were included in the Nutritionals segment of the Company’s consolidatedresults of operations beginning May 1, 2010.
During the measurement period, which ended April 29, 2011, the Company finalized the post-closing working capitaladjustment and certain pre-acquisition tax-related contingencies, which resulted in recording net adjustments of $1,998.The balance sheet at June 26, 2010 has been retrospectively adjusted to reflect these adjustments as required by thebusiness combinations accounting guidance. The following table summarizes the final fair values of the assets acquiredand the liabilities assumed related to the PBM acquisition:
88

CashAccounts receivableInventoryProperty and equipmentOther assetsDeferred income tax assetsGoodwillIntangible assets
Total assets acquiredAccounts payableOther current liabilitiesDeferred income tax liabilitiesAccrued expenses
Total liabilities assumedNet assets acquired
InitialValuation
$ 30,59120,89138,41962,0841,6632,153
329,578382,500867,87910,046
125185
16,15626,512
$ 841,367
MeasurementPeriod
Adjustments$ —
(1,998)——
2,1461,090
721—
1,959—
2,540—
1,4173,957
$ (1,998)
FinalValuation
$ 30,59118,89338,41962,0843,8093,243
330,299382,500869,83810,0462,665
18517,57330,469
$ 839,369
The excess of the purchase price over the fair value of net assets acquired, amounting to $330,299, was recorded asgoodwill in the consolidated balance sheet and was assigned to the Company’s Nutritionals segment. Goodwill is notamortized for financial reporting purposes, but is amortized for tax purposes. See Note 7 regarding the timing of theCompany’s annual goodwill impairment testing.
Intangible assets acquired in the acquisition were valued as follows:
Product formulationsDeveloped product technologyTrade names and trademarksDistribution agreementsCustomer relationshipsNon-compete agreement
Total intangible assets acquired
$ 107,0004,2001,900
18,000250,000
1,400$ 382,500
Management assigned fair values to the identifiable intangible assets through a combination of the relief from royaltymethod, the discounted cash flow method and the lost income method. Developed product technology and productformulations are based on a 15- and 10-year useful life, respectively, and amortized on a straight-line basis. Tradenames and trademarks were considered to have an indefinite life. Distribution agreements and customer relationshipsare based on a 20-year useful life and amortized on an accelerated basis. The non-compete agreement is based ona five-year life and amortized on a straight-line basis.
At the time of the acquisition, a step-up in the value of inventory of $9,402 was recorded in the allocation of the purchaseprice based on valuation estimates, all of which was charged to cost of sales in the fourth quarter of fiscal 2010 as theinventory was sold. In addition, fixed assets were written up by $5,002 to their estimated fair market value based ona valuation method that included both the cost and market approaches. This additional step-up in value is beingdepreciated over the estimated useful lives of the assets.
Orion Laboratories Pty Ltd. – On March 8, 2010, the Company acquired 100% of the outstanding shares of privately-held Orion. After taking into account final working capital adjustments, the ultimate cash paid for Orion was $48,012.The Company incurred approximately $600 of acquisition costs, all of which were expensed in operations in the thirdquarter of fiscal 2010. Located near Perth, Western Australia, Orion was a leading supplier of OTC store brandpharmaceutical products in Australiaand New Zealand. In addition, Orion manufactured and distributed pharmaceutical
89

products supplied to hospitals in Australia. The acquisition of Orion expanded the Company’s global presence andproduct portfolio into Australia and New Zealand. The acquisition was accounted for under the acquisition method ofaccounting, and the related assets acquired and liabilities assumed were recorded at fair value. The operating resultsfor Orion were included in the Consumer Healthcare segment of the Company’s consolidated results of operationsbeginning March 8, 2010.
During the measurement period, which ended March 7, 2011, the Company finalized the post-closing working capitaladjustment and the book/tax basis adjustments, which resulted in recording net adjustments of $1,485. The balancesheet at June 26, 2010 has been retrospectively adjusted to reflect these adjustments as required by the businesscombinations accounting guidance. The following table summarizes the final fair values of the assets acquired andthe liabilities assumed related to the Orion acquisition:
CashAccounts receivableInventoryProperty and equipmentOther assetsDeferred income tax assetsGoodwillIntangible assets
Total assets acquiredAccounts payableOther current liabilitiesDeferred income tax liabilitiesTaxes payable
Total liabilities assumedNet assets acquired
InitialValuation
$ 6714,6314,484
11,490110322
16,56615,60053,8742,247
9543
1,1734,377
$ 49,497
MeasurementPeriod
Adjustments$ —
(1,485)———
1,602(104)
—13——
1,48810
1,498$ (1,485)
FinalValuation
$ 6713,1464,484
11,490110
1,92416,46215,60053,8872,247
9541,4911,1835,875
$ 48,012
The excess of the purchase price over the fair value of net assets acquired, amounting to $16,462, was recorded asgoodwill in the consolidated balance sheet and was assigned to the Company’s Consumer Healthcare segment.Goodwill is not amortized for financial reporting or tax purposes. See Note 7 regarding the timing of the Company’sannual goodwill impairment testing.
Intangible assets acquired in the acquisition were valued as follows:
Product formulationsCustomer relationshipsNon-compete agreements
Total intangible assets acquired
$ 1,18212,0002,418
$ 15,600
Management assigned fair values to the identifiable intangible assets through a combination of the relief from royaltymethod, the discounted cash flow method and the lost income method. Product formulations are based on a 10-yearuseful life and amortized on a straight-line basis. Customer relationships are based on 15- or 10-year useful livesbased on the type of relationship and are amortized on an accelerated basis consistent with projected revenues overthe lives of the relationships. There are three non-compete agreements, each based on a five-year life and amortizedon a straight-line basis.
At the time of the acquisition, a step-up in the value of inventory of $495 was recorded in the allocation of the purchaseprice based on valuation estimates, all of which was charged to cost of sales in the fourth quarter of fiscal 2010 as theinventory was sold. In addition, fixed assets were written up by $1,132 to their estimated fair market value based on
90
a valuation method that included both thecost and marketapproach. Thisadditional step-up in value is being depreciatedover the estimated useful lives of the assets.
Vedants Drug & Fine Chemicals Private Ltd. – To further improve the long-term cost position of its API business, onAugust 6, 2009, the Company acquired an 85% stake in Vedants Drug & Fine Chemicals Private Limited (Vedants),an API manufacturing facility in India, for $11,500 in cash. The facility, located approximately 30 miles outside ofMumbai, is currently under construction and will manufacture the Company’s current and future high-volume APIproducts, as well as expand the Company’s vertical integration of Rx and future candidate Rx-to-OTC switch products.Manufacturing of API at this facility is expected to begin in the second half of fiscal 2012 and will include certain APIproducts currently manufactured in Israel and that had been manufactured in Germany. The acquisition was accountedfor using the acquisition method, and the related assets acquired and liabilities assumed were recorded at fair value.The operating results for Vedantswere included in the APIsegment of the Company’s consolidated results of operationsbeginning August 6, 2009. Operations related to the noncontrolling interest are currently immaterial.
The purchase price of $11,500 was allocated as follows:
CashAccounts receivableInventoryProperty and equipmentGoodwill
Total assets acquiredAccounts payableOther liabilitiesNoncontrolling interest
Total liabilities and equity assumedNet assets acquired
$ 1,441168
28,4364,183
14,230171
1,2891,2702,730
$ 11,500
Fiscal 2009
Unico Holdings, Inc. – On November 13, 2008, the Company acquired 100% of the outstanding shares of privately-held Unico for $51,853 in cash, including $164 of acquisition costs. Based in Lake Worth, Florida, Unico was theleading manufacturer of store brand pediatric electrolytes, enemas and feminine hygiene products for retail customersin the U.S. The acquisition of Unico expanded the Company’s global presence and product portfolio in the U.S. Theacquisition was accounted for under the purchase method of accounting. The operating results for Unico are includedin the Consumer Healthcare segment of the Company’s consolidated results of operations beginning in the secondquarter of fiscal 2009. As previously discussed, due to the realignment of the Company's operating segments in thefirst quarter of fiscal 2011, the store brand pediatric electrolytes products are now being reported as part of theCompany's Nutritionals operating segment.
91

The purchase price of $51,853 was allocated as follows:
CashAccounts receivableInventoryProperty and equipmentOther assetsGoodwillIntangible assets
Total assets acquiredAccounts payableOther current liabilitiesDeferred tax liabilities
Total liabilities assumedNet assets acquired
$ 1,4144,2755,3444,6502,056
23,55926,19167,4893,293
91411,42915,636
$ 51,853
The purchase agreement allowed for a post-closing working capital adjustment to determine a final purchase price.During the third quarter of fiscal 2009, the working capital adjustment was settled, resulting in a minor adjustment tothe purchase price.
The excess of the purchase price over the fair value of net assets acquired, amounting to $23,559, was recorded asgoodwill in the consolidated balance sheet and has been assigned to the Company’s Consumer Healthcare segment.Goodwill is not amortized for financial reporting or tax purposes. See Note 7 regarding the timing of the Company’sannual goodwill impairment testing.
Intangible assets acquired in the acquisition were valued as follows:
Customer relationshipsNon-compete agreements
Total intangible assets acquired
$ 24,8001,391
$ 26,191
Management assigned fair values to the customer relationships and non-compete agreements through the discountedcash flow method and the lost income method, respectively. Customer relationships are based on 20-year useful livesand are amortized on an accelerated basis consistent with projected revenues over the lives of the relationships. Thereare three non-compete agreements; two agreements are based on a five-year useful life and the other agreement isbased on a two-year useful life. All non-compete agreements are amortized on a straight-line basis.
At the time of the acquisition, a step-up in the value of inventory of $1,062 was recorded in the allocation of the purchaseprice based on valuation estimates, all of which was charged to cost of sales in the second quarter of fiscal 2009 asthe inventory was sold. In addition, fixed assets were written up by $946 to their estimated fair market value based ona valuation method that included both thecost and marketapproach. Thisadditional step-up in value is being depreciatedover the estimated useful lives of the assets.
Laboratorios Diba, S.A. – On October 6, 2008, the Company announced that it acquired 100% of the outstandingshares of privately-held Diba for $24,500 in cash, including $1,000 of acquisition costs. Based in Guadalajara, Mexico,Diba was a store brand manufacturer of OTC and prescription pharmaceuticals, including antibiotics, hormonals andophthalmics. The acquisition of Diba expanded the Company’s global presence and product portfolio in Mexico. Theacquisition was accounted for under the purchase method of accounting. The operating results for Diba are includedin the Consumer Healthcare segment of the Company’s consolidated results of operations beginning in the secondquarter of fiscal 2009.
92

The purchase price of $24,500 was allocated as follows:
CashAccounts receivableInventoryProperty and equipmentOther assetsGoodwillIntangible assets
Total assets acquiredAccounts payableOther liabilitiesDeferred tax liabilities
Total liabilities assumedNet assets acquired
$ 1,5302,7153,8785,639
7468,1815,047
27,736529
1,5271,1803,236
$ 24,500
The excess of the purchase price over the fair value of net assets acquired, amounting to $8,181, was recorded asgoodwill in the consolidated balance sheet and has been assigned to the Company’s Consumer Healthcare segment.Goodwill is not amortized for financial reporting or tax purposes. See Note 7 regarding the timing of the Company’sannual goodwill impairment testing.
Intangible assets acquired in the acquisition were valued as follows:
Customer relationshipsDeveloped product technologyTrade name and trademarksNon-compete agreementsIn-process research and development
Total intangible assets acquired
$ 1,7171,2761,204
571279
$ 5,047
Management assigned fair values to the identifiable intangible assets through a combination of the relief from royaltymethod, discounted cash flow method and lost income method. Customer relationships are based on eight-year usefullives and are amortized on an accelerated basis consistent with projected revenues over the lives of the relationships.The average estimated useful life of the developed product technology is eight years. Trade name and trademarkswere considered to have indefinite useful lives. Accordingly, no amortization has been recorded for these intangibleassets. The Company, however, reviews them for impairment on an annual basis, or more frequently if events orchanges in circumstances indicate that the assets might be impaired, and adjusts them as necessary. There are twonon-compete agreements, each based on a five-year useful life and amortized on a straight-line basis. The amountallocated to in-process research and development was charged to operations as of the acquisition date. Managementassigned fair values to in-process research and development related to ongoing projects using a relief from royaltymethod on forecasted revenues directly related to the products expected to result from the subject research anddevelopment. Assumptions used in the in-process research and development valuation included a required rate ofreturn of 16% and commencement of net cash inflows that varied between one and two years, depending on theproject. As of the date of acquisition, the technological feasibility of the acquired in-process technology had not yetbeen established and the technology had no future alternative uses and, therefore, was required to be expensed asof the acquisition date. The Company estimates that the amount it will incur in additional costs related to the effortsnecessary to develop the acquired, incomplete technology into commercially viable products will be immaterial.
At the time of the acquisition, a step-up in the value of inventory of $1,806 was recorded in the allocation of the purchaseprice based on valuation estimates. As of March 28, 2009, the total step-up in inventory value had been charged tocost of sales as the inventory was sold. In addition, fixed assets were written up by $663 to their fair market valuebased on a valuation method that included both the cost and market approach. This additional step-up in value is beingdepreciated over the estimated useful lives of the assets.
93

J.B. Laboratories, Inc. – On September 16, 2008, the Company acquired 100% of the outstanding shares of JBL, a privately-held contract manufacturer of OTC and nutrition products for leading healthcare suppliers, for $42,962, including debt assumed. The Company acquired JBL to obtain additional FDA-compliant production capacity to help service current and future customer needs. The Company paid $14,939 in cash, including acquisition costs of $436, and assumed $28,023 of existing debt, of which $25,293 was repaid immediately and the remaining $2,730 was repaid in the second quarter of fiscal 2009. The acquisition was accounted for under the purchase method of accounting. The operating results for JBL are included in the Consumer Healthcare segment of the Company’s consolidated results of operations beginning in the second quarter of fiscal 2009. As previously discussed, due to the realignment of the Company's operating segments in the first quarter of fiscal 2011, JBL's nutrition products are now being reported as part of the Company's Nutritionals operating segment.
The purchase price of $42,962 was allocated as follows:
CashAccounts receivableInventoryProperty and equipmentOther assetsGoodwillIntangible assets
Total assets acquiredAccounts payableOther current liabilitiesNotes payableLong-term debtDeferred tax liabilities
Total liabilities assumedNet assets acquired
JBL debt assumed on the closing dateTotal purchase consideration
$ 7435,989
11,74734,444
9235,0181,575
60,43910,2072,075
11,00617,0175,195
45,50014,93928,023
$ 42,962
In connection with the acquisition, the Company accrued $795 for estimated restructuring costs that were included in the allocation of the purchase price. During the third quarter of fiscal 2009, the Company finalized the restructuring plan, which resulted in an adjustment to the restructuring accrual. The restructuring costs consisted of employee termination benefits for 12 employees, all of which had been paid as of December 26, 2009. The activity related to the employee termination benefits is as follows:
Balance at September 27, 2008PaymentsAdjustmentsBalance at June 27, 2009PaymentsBalance at December 26, 2009
Fiscal 2009 RestructuringEmployee Termination
$ 795(447)(264)
84(84)
$ —
The excess of the purchase price over the fair value of net assets acquired, amounting to $5,018, was recorded as goodwill in the consolidated balance sheet and has been assigned to the Company’s Consumer Healthcare segment. Goodwill is not amortized for financial reporting or tax purposes. See Note 7 regarding the timing of the Company’s annual goodwill impairment testing.
Intangible assets acquired in the acquisition were valued as follows:
94

Customer relationshipsNon-compete agreements
Total intangible assets acquired
$ 1,300275
$ 1,575
Management assigned fair value to the customer relationships and non-compete agreements through the discountedcash flow method and the lost income method, respectively. Customer relationships are based on 15-year useful livesand are amortized on an accelerated basis consistent with projected revenues over the lives of the relationships. Thereare two non-compete agreements; one agreement is based on a five-year useful life and the other agreement is basedon a two-year useful life. Both non-compete agreements are amortized on a straight-line basis.
At the time of the acquisition, a step-up in the value of inventory of $358 was recorded in the allocation of the purchaseprice based on valuation estimates, all of which was charged to cost of sales in the second quarter of fiscal 2009 asthe inventory was sold. In addition, fixed assets were written up by approximately $4,200 to their fair market valuebased on a valuation method that included both the cost and market approaches. This additional step-up in value isbeing depreciated over the estimated useful lives of the assets.
NOTE 3 – DISCONTINUED OPERATIONS
In March 2009, the Company committed to a plan to sell its Israel Consumer Products business. This business primarilysold consumer products to the Israeli market, including cosmetics, toiletries and detergents, and was previously reportedas part of the Company’s Other category. Based on management’s strategic review of its portfolio of businesses, theCompany decided to sell the Israel Consumer Products business to a third party. In the third quarter of fiscal 2009,the Israel Consumer Products business had met the criteria set forth in ASC Subtopic 360-10 to be accounted for asdiscontinued operations.
On November 2, 2009, the Company announced that it had signed a definitive agreement to sell the Israel ConsumerProducts business to Emilia Group. On February 26, 2010, the sale to Emilia Group was completed for approximately$47,000, of which approximately $11,000, subject to foreign currency fluctuations between the Israeli shekel and theU.S. dollar, is contingent upon satisfaction of contingency factors specified in the agreement. The sale was completedin the third quarter of fiscal 2010 resulting in a preliminary pre-tax gain on the sale of $750, excluding the contingentconsideration. The sales price was subject to post-closing working capital adjustments as defined by the agreement.During the third quarter of fiscal 2011, as part of an arbitration ruling, the Company made a $3,558 payment to EmiliaGroup settling the final post-closing working capital adjustment. Of this amount, $2,151 was charged to earnings andincluded in discontinued operations in the third quarter of fiscal 2011. Including this charge, the pre-tax loss on thesale of the Israel Consumer Products business was $1,407. Under the terms of the agreement, the Company provideddistribution and support services for the importation of private label cosmetics from this business into the U.S. marketfor 12 months after the close of the transaction. These services were fully transferred to Emilia Group during the thirdquarter of fiscal 2011.
The Company has reflected the results of this business as discontinued operations in the consolidated statements ofincome for all periods presented. The assets and liabilities of this business are reflected as assets and liabilities ofdiscontinued operations in the consolidated balance sheets for all periods presented. The cash flows related to thesupport and distribution services that the Company provided were immaterial and limited in duration, and therefore,the Israel Consumer Products business was classified as discontinued operations.
Results of discontinued operations were as follows:
Net sales(Loss) gain on sale
Income (loss) before income taxesIncome tax benefit (expense)Income (loss) from discontinued operations, net of tax
Fiscal Year2011
$ 17,499$ (2,151)
$ 91(1,452)
$ (1,361)
2010$ 67,985$ 750
$ 486(1,121)
$ (635)
2009$ 88,198$ —
$ (217)2,921
$ 2,704
95

The assets and liabilities classified as discontinued operations as of June 25, 2011 and June 26, 2010 were as follows:
Accounts receivable, netInventoriesPrepaid expenses and other current assets
Current assets of discontinued operations
Accounts payableAccrued payroll and other accrued liabilitiesDeferred income tax liabilities
Current liabilities of discontinued operations
June 25,2011
$ 2,568——
$ 2,568
$ 2,6541,439
—$ 4,093
June 26,2010
$ 1,7005,482
193$ 7,375
$ 3,482976912
$ 5,370
As of June 25, 2011, the remaining assets and liabilities recorded in discontinued operations related to distributionservices that ceased by the end of the third quarter of fiscal 2011, as specified in the sale agreement.
NOTE 4 – EARNINGS (LOSS) PER SHARE
A reconciliation of the numerators and denominators used in the basic and diluted EPS calculation follows:
Numerator:Income from continuing operationsIncome (loss) from discontinued operations, net of taxNet income used for both basic and diluted EPSDenominator:Weighted average shares outstanding for basic EPSDilutive effect of share-based awardsWeighted average shares outstanding for diluted EPS
Fiscal Year2011
$ 340,558(1,361)
$ 339,197
92,3131,216
93,529
2010
$ 224,434(635)
$ 223,799
91,3991,446
92,845
2009
$ 142,8292,704
$ 145,533
92,1831,446
93,629
Share-based awards outstanding that were anti-dilutive totaled 127, 24 and 225 for fiscal 2011, 2010 and 2009,respectively. Share-based awards that were anti-dilutive were excluded from the diluted EPS calculation.
NOTE 5 – FINANCIAL INSTRUMENTS
ASC 820 provides a consistent definition of fair value, which focuses on exit price, prioritizes the use of market-basedinputs over entity-specific inputs for measuring fair value and establishes a three-level hierarchy for fair valuemeasurements. ASC 820 requires fair value measurements to be classified and disclosed in one of the following threecategories:
Level 1: Quoted prices (unadjusted) in active markets for identical assets and liabilities.
Level 2: Either direct or indirect inputs, other than quoted prices included within Level 1, which areobservable for similar assets or liabilities.
Level 3: Valuations derived from valuation techniques in which one or more significant inputs areunobservable.
The following tables summarize the valuation of the Company’s financial instruments by the above pricing categoriesas of June 25, 2011 and June 26, 2010:
96

Assets:Cash equivalentsInvestment securitiesFunds associated with Israeli postemployment benefitsForeign currency forward contracts, netTotal
Liabilities:Interest rate swap agreementsTotal
Fair Value Measurements as of June 25, 2011 Using:
Total as ofJune 25, 2011
$ 267,2217,503
17,1703,353
$ 295,247
$ 7,283$ 7,283
QuotedPrices In
ActiveMarkets(Level 1)
$ 267,221—
——
$ 267,221
$ —$ —
Prices WithOther
ObservableInputs
(Level 2)
$ ——
17,1703,353
$ 20,523
$ 7,283$ 7,283
Prices WithUnobservable
Inputs(Level 3)
$ —7,503
——
$ 7,503
$ —$ —
Assets:Cash equivalentsInvestment securitiesFunds associated with Israeli postemployment benefitsTotal
Liabilities:Foreign currency forward contracts, netTotal
Fair Value Measurements as of June 26, 2010 Using:
Total as ofJune 26,
2010
$ 68,1874,950
14,977$ 88,114
$ 4,526$ 4,526
QuotedPrices In
ActiveMarkets(Level 1)
$ 68,187—
—$ 68,187
$ —$ —
Prices WithOther
ObservableInputs
(Level 2)
$ ——
14,977$ 14,977
$ 4,526$ 4,526
Prices WithUnobservable
Inputs(Level 3)
$ —4,950
—$ 4,950
$ —$ —
The carrying amounts of the Company’s financial instruments, consisting of cash and cash equivalents, investmentsecurities, accounts receivable, accounts payable and variable rate long-term debt, approximate their fair value. Asof June 25, 2011, the carrying value and fair value of the Company's fixed rate long-term debt were $615,000 and$650,812, respectively. As of June 26, 2010, the carrying value and fair value of the Company's fixed rate long-termdebt were $615,000 and $644,016, respectively. As a result of the prepayment of the letter of undertaking on July 19,2010, asdiscussed inNote8, the fair valuesof both the letterofundertaking and the restricted cashdeposit approximatedtheir carrying values as of June 26, 2010. Fair values were calculated by discounting the future cash flows of thefinancial instruments to their present value, using interest rates currently offered for borrowings and deposits of similarnature and remaining maturities. There were no transfers between Level 1 and Level 2 during the fiscal year endedJune 25, 2011. The Company’s policy regarding the recording of transfers between levels is to record any such transfersat the end of the reporting period.
As of June 25, 2011, the Company had $17,170 deposited in funds managed by financial institutions that are designatedby management to cover post employment benefits for its Israeli employees. Israeli law generally requires paymentof severance upon dismissal of an employee or upon termination of employment in certain other circumstances. Thesefunds are included in the Company’s long-term investments reported in other non-current assets.The Company’s Level2 securities values are determined using prices for recently traded financial instruments with similar underlying terms,as well as directly or indirectly observable inputs, such as interest rates and yield curves that are observable atcommonly quoted intervals.
The Company’s investment securities include auction rate securities (ARS) totaling $18,000 in par value. ARS areprivately placed variable rate debt instruments whose interest rates are reset within a contractual range, approximatelyevery 7 to 35 days. Historically, the carrying value of ARS approximated their fair value due to the frequent resetting
97

of the interest rates at auction. With the tightening of the credit markets beginning in calendar 2008, ARS have failedto settle at auction resulting in an illiquid market for these types of securities for an extended period of time. Whilethere are some recent indications that a market is starting to materialize for these securities, though at a much reducedlevel than the pre-2008 period, the Company cannot predict when liquidity will return for these securities. The Companyhas reclassified the securities from current assets to other non-current assets due to the unpredictable nature and theilliquidity of the market for the securities.
In the absence of a liquid trading market, the Company based its estimates of the fair market value of the ARS it heldon, among other things, estimates provided by Lehman Brothers, the firm that managed these investments for theCompany. During the third quarter of fiscal 2008, the Company recorded an unrealized loss of $3,453, net of tax, inother comprehensive income. The amount of the write-down was based on, among other things, estimates providedby Lehman Brothers. At that time, the companies that issued these securities continued to maintain their AAAcounterparty credit ratings and pay the maximum interest contractually required. In addition, beginning in the thirdquarter of fiscal 2008, the Company reclassified the securities from current assets to other non-current assets due tothe unpredictable nature and the illiquidity of the market for the securities.
In the second quarter of fiscal 2009, after Lehman Brothers filed for bankruptcy and ceased to provide estimates tothe Company of the value of the ARS, the Company hired an independent third-party valuation firm to assist theCompany in estimating the fair value of these securities using a discounted cash flow analysis and an assessment ofsecondary markets. Based on this estimation and other factors, the Company concluded that an other-than-temporaryimpairment loss had occurred. The primary drivers of this conclusion were the magnitude of the calculated impairmentand the fact that the credit ratings of the companies that had issued these securities had declined since the third quarterof fiscal 2008. Accordingly, the Company recorded an other-than-temporary impairment loss of $15,104 within otherexpense in its consolidated statement of income for the second quarter of fiscal 2009. Of this loss, $13,542 wasattributable to a decline in market value while $1,562 was due to a foreign currency transaction loss as these U.S.dollar-denominated securities are held by the Company’s Israeli subsidiary, which has a shekel functional currency.
During the fourth quarter of fiscal 2009, the Company received an updated estimate for the current fair value of thesesecurities from an independent third-party valuation firm, using a discounted cash flow analysis and an assessmentof secondary markets. Based on this estimation and other factors, the Company recorded an unrealized gain of $503,net of tax, in other comprehensive income.
Also during the fourth quarter of fiscal 2009, the Company engaged the services of an independent third-party valuationfirm to assist the Company in determining the noncredit component of the previously recognized other-than-temporaryimpairment related to its ARS. As in accordance with ASC 320-10-65, the Company recorded a $5,000 adjustmentfrom retained earnings to accumulated other comprehensive income to reclassify the noncredit component of the$15,104 other-than-temporary impairment charge it recognized in the second quarter of fiscal 2009.
The Company engaged the services of an independent third-party valuation firm in the second and fourth quarters offiscal 2010 to assist the Company in updating the estimates of the current fair value of these securities. Based onupdated estimates of the current fair value of these securities from the valuation firm, using a discounted cash flowanalysis and an assessment of secondary markets, as well as other factors, the Company determined that the fairvalue of the securities remained consistent with the prior period at the recorded value of $4,961 and $4,393 in thesecond and fourth quarters of fiscal 2010, respectively. Accordingly, the Company recorded an unrealized loss of $568,net of tax, in other comprehensive income in the fourth quarter of 2010.
The Company also engaged the services of an independent third-party valuation firm in the second and fourth quartersof fiscal 2011. Taking into account updated estimates of the current fair value of these securities from the valuationfirm, which used a discounted cash flow analysis and an assessment of secondary markets, as well as other factors,the Company determined that the fair value of the securities was $5,435 and $7,503 in the second and fourth quartersof fiscal 2011, respectively. Accordingly, the Company recorded an unrealized gain of $1,042 and $2,068, net of tax,in other comprehensive income in the second and fourth quarters of fiscal 2011, respectively. The Company continuedto earn and collect interest on these investments at the maximum contractual rate. The Company will continue tomonitor the credit worthiness of the companies that issued these securities and other appropriate factors and makesuch adjustments as it deems necessary to reflect the fair value of these securities. All of the ARS investments havea contractual maturity of more than five years as of June 25, 2011. The gross realized gains and losses on the saleof ARS are determined using the specific identification method.
In the second quarter of fiscal 2011, the Company sold its collateralized debt obligations backed primarily by U.S.Treasury obligations for proceeds of $560. As of December 25, 2010, the Company no longer held any collateralized
98
debt obligations.
The following table presents a rollforward of the assets measured at fair value using unobservable inputs (Level 3) atJune 25, 2011:
Balance as of June 27, 2009Transfers into Level 3Unrealized loss on ARSForeign currency translationBalance as of June 26, 2010Transfers into Level 3Sale of collateralized debt obligationsUnrealized gain on ARSForeign currency translationTotal as of June 25, 2011
InvestmentSecurities(Level 3)
$ 5,528—
(568)(10)
4,950—
(560)3,110
3$ 7,503
At June 25, 2011, all of the Company’s investments in debt securities were classified as available-for-sale, and, as aresult, were reported at fair value. The following is a summary of the Company’s available-for-sale securities:
Corporate debt securities (ARS)Other debt securities
Total
June 25,2011
$ 7,503—
$ 7,503
June 26,2010
$ 4,393557
$ 4,950
Excluding corporate debt securities, the fair value of available-for-sale investment securities approximated amortizedcost as of June 25, 2011 and June 26, 2010. Unrealized gains and losses for investment securities other than corporatedebt securities were not material and were included in other comprehensive income, net of tax. The gross realizedgains and losses on the sale of these securities are determined using the specific identification method.
NOTE 6 – INVENTORIES
Inventories are stated at the lower of cost or market and are summarized as follows:
Finished goodsWork in processRaw materials
Total inventories
June 25,2011
$ 244,758119,732141,086
$ 505,576
June 26,2010
$ 213,068116,618123,294
$ 452,980
NOTE 7 – GOODWILL AND OTHER INTANGIBLE ASSETS
In the third quarter of fiscal 2010 the Company changed the annual testing date for evaluating goodwill and indefinite-lived intangible asset impairment from the end of the second (Consumer Healthcare reporting units) and third quarters(Rx Pharmaceuticals and API reporting units) to the beginning of the fourth quarter of the fiscal year for all reportingunits. This voluntary change in accounting method was implemented and considered preferable because (1) the useof a common testing date enables the Company to make valuation assumptions as of a consistent date for all reporting
99

units; (2) it better aligned with the Company’s annual budgeting process and allows the most recent projected financialinformation to be used when developing discounted cash flows in the reporting unit valuation models; and (3) it allowedthe Company more time in a given fiscal reporting period to accurately assess the recoverability of goodwill andindefinite-lived intangible assets, and thus, would improve its overall financial reporting. To accommodate this changeand meet the one-year testing window requirement of ASC 350, “Intangibles–Goodwill and Other”, the Companyevaluated goodwill and indefinite-lived intangible assets for impairment at the end of the second quarter (ConsumerHealthcare reporting units), the end of the third quarter (Rx Pharmaceuticals and API reporting units) and the beginningof the fourth quarter (all reporting units) during fiscal 2010. The current and prior year testing resulted in no impairmentcharges being recorded.
There were no additions to goodwill in fiscal 2011. In fiscal 2010 there were additions to goodwill in the ConsumerHealthcare and Nutritionals segments related to the acquisitions of Orion and PBM, respectively, as well as an additionin the API segment related to the acquisition of Vedants. Changes in the carrying amount of goodwill, by reportablesegment, were as follows:
Balance as of June 27, 2009Business acquisitionsPurchase price allocationadjustmentCurrency translation adjustmentBalance as of June 26, 2010Currency translation adjustmentBalance as of June 25, 2011
ConsumerHealthcare$ 108,785
16,462
(1,732)
(4,528)118,987
7,322$ 126,309
Nutritionals$ 1,445
330,299
—
—331,744
—$ 331,744
Rx Pharma-ceuticals
$ 70,835—
—
1,89072,7258,906
$ 81,631
API$ 81,435
4,183
—
2,39388,01110,350
$ 98,361
Total$ 262,500
350,944
(1,732)
(245)611,46726,578
$ 638,045
During fiscal 2011, goodwill related to the acquisitions of PBM and Orion increased $721 and decreased $104,respectively, for net adjustments made during the measurement period to the fair values of the assets acquired andliabilities assumed. In the table above, the retrospective adjustments for PBM and Orion are reflected in the goodwillbalances of the Nutritionals and Consumer Healthcare segments, respectively, at June 26, 2010, in accordance withthe accounting guidance for business combinations.
Other intangible assets and related accumulated amortization consisted of the following:
Amortizable intangibles:Developed product technology/ formulationand product rightsDistribution and license agreementsCustomer relationshipsTrademarksNon-compete agreements
TotalNon-amortizable intangibles:
Trade names and trademarksTotal other intangible assets
June 25, 2011
Gross
$ 328,46152,790
331,0815,3786,391
724,101
6,857$ 730,958
AccumulatedAmortization
$ 101,49419,84432,029
7302,431
156,528
—$ 156,528
June 26, 2010
Gross
$ 311,31941,123
326,4044,6915,895
689,432
6,575$ 696,007
AccumulatedAmortization
$ 69,12816,04815,414
7161,126
102,432
—$ 102,432
Certain intangible assets, including developed product technology/formulation and product rights, are denominated incurrencies other than the U.S. dollar; therefore, their gross and net carrying values are subject to foreign currencymovements.
The Company recorded a charge for amortization expense of $46,778, $25,127 and $23,596 for fiscal 2011, 2010 and
100

2009, respectively, for intangible assets subject to amortization. The increase in amortization expense in fiscal 2011was due primarily to the incremental amortization expense incurred on the intangible assets acquired as part of thePBM acquisition.Estimated future amortization expense includes the additional amortization related to recently acquired intangibleassets subject to amortization. No estimate of future amortization expense related to the recent Paddock acquisitionhas been included in the table below. The estimated amortization expense for each of the following five years is asfollows:
Fiscal Year20122013201420152016
Amount $ 51,200
52,40051,90050,90048,800
NOTE 8 – INDEBTEDNESS
Total borrowings outstanding were $892,770 at June 25, 2011 and $1,344,000 at June 26, 2010. Total borrowings arepresented on the balance sheet as follows:
Short-term debt:Swingline loanLine of credit - India subsidiaryCurrent portion of long-term debt:
Letter of undertaking - Israeli subsidiaryTerm loan
TotalLong-term debt, less current maturities:
Revolving line of creditTerm loansSenior notes
TotalTotal debt
June 25, 2011
$ —2,770
—15,00017,770
—260,000615,000875,000
$ 892,770
June 26, 2010
$ 9,000—
400,000—
409,000
95,000225,000615,000935,000
$ 1,344,000
On January 20, 2011, the Company announced that it had signed a definitive agreement to acquire substantially allof the assets of Paddock, and on July 26, 2011 the Company announced that the acquisition was completed forapproximately $547,000 in cash. The Company funded the transaction using the new $250,000 five-year term loandiscussed below, $212,000 of cash on hand and $85,000 from its accounts receivable securitization program.Concurrent with the signing of the agreement, the Company entered into a Term Loan Agreement (Agreement). Underthe terms of the Agreement, the term loan commitment was $250,000, which was fully funded on July 26, 2011 inconjunction with the closing of the Paddock acq uisition. The final maturity date of the term loan is July 26, 2016;however, the term loan will be subject to mandatory partial repayments of $25,000 on each of the first four annualanniversary dates of the funding. The term loan will bear interest, at the election of the Company, at either the AnnualBase Rate or the Adjusted LIBO rate plus an Applicable Margin, as specified in the Agreement. As of June 25, 2011,there was no outstanding debt related to this commitment.
On December 29, 2010, the Company's India subsidiary executed a long-term facility with certain persons who areminority owners of Perrigo India as lenders. Funds are available for capital expenditures in one or more draws in anaggregate amount not to exceed $3,000. The facility is payable in a series of installments starting in fiscal 2017 withthe final installment due August 30, 2019. Terms and conditions of the line are normal and customary for similar linesin India. The interest rate on this facility as of June 25, 2011 was 14%. The Company's India subsidiary had no amounts
101
outstanding on this line as of the end of its fiscal 2011.
On October 8, 2010, the Company entered into a credit agreement with a group of banks (the 2010 Credit Agreement),which provides an initial revolving loan commitment of $350,000 and an initial term loan commitment of $150,000,each subject to increase or decrease as specified in the 2010 Credit Agreement. Both loans bear interest, at the electionof the Company, at either the Annual Base Rate plus an Applicable Margin or the Adjusted LIBOR plus an ApplicableMargin, as specified and defined in the 2010 Credit Agreement. The obligations under the 2010 Credit Agreement areguaranteed by certain subsidiaries of the Company, and in some instances, the obligations may be secured by a pledgeof 65% of the stock of certain foreign subsidiaries.
The final maturity date of the term and revolving loans under the 2010 Credit Agreement is October 8, 2015; however,the term loan is subject to mandatory partial repayments of $15,000 on each of the first four annual anniversary datesof the agreement. The Company used the proceeds from the term loan and revolving loan for general corporatepurposes and to repay certain other outstanding debt, including the $100,000 term loan made pursuant to the Company’sprior credit agreement.
In connection with the execution of the 2010 Credit Agreement, the Company terminated its prior credit agreement,dated as of March 16, 2005, and amended its existing term loan agreement, dated as of April 22, 2008, to conformcertain covenants in that term loan agreement to the covenants contained in the 2010 Credit Agreement and to makecertain other conforming changes.
On May 26, 2010, the Company’s India subsidiary executed a short-term credit line with The Hong Kong and ShanghaiBanking Corporation Ltd. Funds are available for working capital and general business purposes in one or more drawsunder the line in an aggregate amount not to exceed approximately $4,500. Terms and conditions of the line are normaland customary for similar lines in India. The interest rate on this facility was 10.5% and 9.5% as of June 25, 2011 andJune 26, 2010, respectively. The credit line expires after 180 days but can be extended by mutual agreement of theparties. The Company’s India subsidiary had $2,770 outstanding on this line of credit as of the end of its fiscal 2011.
On May 29, 2008, the Company entered into a Master Note Purchase Agreement (Note Agreement) with variousinstitutional investors providing for the private placement of senior notes consisting of $75,000, 5.97% Series 2008-Asenior notes, due May 29, 2015, and $125,000, 6.37% Series 2008-B senior notes, due May 29, 2018 (collectively,the Series 2008 Notes). Contemporaneously with the acquisition of PBM, on April 30, 2010, the Company entered intoa First Supplement to the Note Agreement with various institutional investors providing for the private placement ofsenior notes consisting of $115,000, 4.91% Series 2010-A senior notes, due April 30, 2017, $150,000, 5.45% Series2010-B senior notes, due April 30, 2020, and $150,000, 5.55% Series 2010-C senior notes, due April 30, 2022(collectively, the Series 2010 Notes). The Series 2010 Notes, together with the Series 2008 Notes, are collectivelyreferred to herein as the Notes. The obligations under the Notes are guaranteed by certain of the Company’ssubsidiaries, and the Notes are secured, on a ratable basis with the Company’s bank debt, by a lien on certain assetsof the Company and the subsidiary guarantors. Interest on the Notes is payable semi-annually. The Company may atany time prepay, at a cost, all or any part of the Notes subject to the terms specified in the Note Agreement and mustoffer to prepay the Notes upon a change of control (as defined in the Note Agreement). Restrictive covenants applyto, among other things, minimum levels of interest coverage and debt to Earnings before Interest, Taxes, Depreciationand Amortization (EBITDA) ratios, additional liens, mergers or consolidations, and sales of assets. The Company wasin compliance with all Note Agreement covenants as of June 25, 2011.
On April 22, 2008, the Company entered into a Term Loan Agreement (Loan Agreement) to provide for additional termloan borrowings. Under the terms of the Loan Agreement, the initial term loan commitment is $125,000, subject toincrease by mutual agreement of the Company and the lenders as specified in the Loan Agreement. The applicableinterest rate is determined by the type of loan requested by the Company, with Eurodollar loans bearing interest at theLondon Interbank Offered Rate (LIBOR) plus an applicable borrowing margin determined by the Company’s leverageratio over the trailing four quarters and Alternative Base Rate (ABR) loans bearing interest at the highest of the JPMorgan Chase Bank N.A. Prime Rate, the Base CD Rate plus 100 basis points and the Federal Funds Effective Rateplus 50 basis points. All of the Company’s loans outstanding under the Loan Agreement were Eurodollar loans, andthe interest rate was 1.1875% and 1.1875% as of June 25, 2011 and June 26, 2010, respectively. Actual rates rangedfrom 1.1875% to 1.3125% and 1.0625% to 1.875% for fiscal 2011 and 2010, respectively. The obligations under theLoan Agreement are guaranteed by certain subsidiaries of the Company and are secured by a pledge of 65% of thestock of certain foreign subsidiaries. The Loan Agreement is subject to certain debt level limitations, as specified inthe Loan Agreement, as well as restrictive covenants, which are the same as those in the 2005 credit agreementdiscussed below. The maturity date of the term loans is April 22, 2013. The Company intends to use the proceeds of
102

the term loans for general corporate purposes and to enhance liquidity.
On March 16, 2005, the Company and certain foreign subsidiaries entered into a credit agreement with a group ofbanks (Credit Agreement) which provided an initial revolving loan commitment of $250,000 and an initial term loancommitment of $100,000, each subject to increase or decrease as specified in the Credit Agreement. As noted above,in connection with the execution of the 2010 Credit Agreement, the Company terminated this credit agreement in fiscal2011. Both loans bore an interest rate of ABR or LIBOR plus an applicable margin determined by the Company’sleverage ratio over the trailing four quarters. The interest rate on the revolving loan was 0.7487% as of June 26, 2010.The interest rate on the term loan was 0.9375% as of June 26, 2010. Actual rates for the revolving loan ranged from0.7125% to 1.565% for fiscal 2010. Actual rates for the term loan ranged from 0.8625% to 1.675% for fiscal 2010.Additionally, the Credit Agreement provided for short term swingline loans at negotiable rates of interest subject to amaximum amount of $25,000 drawn at any time. As of June 26, 2010, the interest rate on the swingline loans was1.5%. As of June 26, 2010, borrowings under the swingline loans and revolving loan commitment were $9,000 and$95,000, respectively.
The Company was in compliance with all Credit Agreement and Loan Agreement covenants as of June 25, 2011.
On March 16, 2005, the Company’s Israeli holding company subsidiary entered into a letter of undertaking and obtaineda loan in the sum of $400,000. Subsequent to the end of fiscal 2010, the Company elected to prepay the entire loanbalance of $400,000. The loan had a ten-year term with a fixed annual interest rate of 5.025%. The Company couldprepay the loan upon 30 days written notice. The lender could demand prepayment or the Company could prepay theloan in whole or in part upon 90 days written notice on the interest payment date that was 24 months after the loandate and every 12 months subsequent to that date. The terms required the Company to maintain a deposit of $400,000in an uninsured account with the lender as security for the loan. This deposit had a fixed 4.9% yield. The Companydid not have the right to withdraw any amounts from the deposit account, including any interest earned, until the loanhad been paid in full or unless it received consent from the lender. Earned interest was released to the Company oneach interest payment date so long as all interest due on the loan had been paid by the Company. The loan wasrepaid using the restricted cash deposit discussed above. The prepayment was completed on July 19, 2010.
The Company’s Israeli subsidiary paid the third and final annual installment of its debenture in the second quarter offiscal 2010 for $17,771. The debenture, which was guaranteed by the Company, had a fixed interest rate of 5.6%, andthe principal of the loan was linked to the increase in the Israel Consumer Price Index.
Excluding the subsequent funding used to acquire Paddock, the annual maturities of short-term and long-term debtare as follows:
20122013201420152016Thereafter
$ 17,770140,00015,00090,00090,000
540,000
NOTE 9 – ACCOUNTS RECEIVABLE SECURITIZATION
On July 23, 2009, the Company entered into an accounts receivable securitization program (the Securitization Program)with several of its wholly owned subsidiaries and Bank of America Securities, LLC (Bank of America). The Companyrenewed the Securitization Program on July 22, 2010 and, most recently, on June 13, 2011 with Bank of America, asAgent, and Wells Fargo Bank, National Association (Wells Fargo) and PNC Bank, National Association (PNC) asManaging Agents (together, the Committed Investors).
The Securitization Program is a three-year program and under the terms of the Securitization Program, the subsidiariessell certain eligible trade accounts receivables to a wholly owned bankruptcy remote special purpose entity (SPE),Perrigo Receivables, LLC. The Company has retained servicing responsibility for those receivables. The SPE will thentransfer an interest in the receivables to the Committed Investors. Under the terms of the Securitization Program, Bankof America, Wells Fargo and PNC have committed $101,750, $55,500 and $27,750, respectively, effectively allowingthe Company to borrow up to a total amount of $185,000, subject to a Maximum Net Investment calculation as definedin the agreement. At June 25, 2011, $184,000 was available under this calculation. The interest rate on any borrowings
103

is based on a thirty-day LIBOR plus 0.45%. In addition, a facility fee of 0.45% is applied to the $185,000 commitment.Under the terms of the Securitization Program, the Company may elect to have the entire amount or any portion ofthe facility unutilized.
Any borrowing made pursuant to the Securitization Program will be classified as debt in the Company’s consolidatedbalance sheet. The amount of the eligible receivables will vary during the year based on seasonality of the businessand could, at times, limit the amount available to the Company from the sale of these interests. At June 25, 2011 andJune 26, 2010, there were no borrowings outstanding under the Securitization Program. As discussed in Note 8,concurrent with the closing of the Paddock acquisition on July 26, 2011, the Company borrowed $85,000 under itsSecuritization Program to partially fund the acquisition.
NOTE 10 – DERIVATIVE INSTRUMENTS AND HEDGING ACTIVITIES
The Company accounts for derivatives in accordance with ASC 815, which establishes accounting and reportingstandards requiring that derivative instruments (including certain derivative instruments embedded in other contracts)be recorded on the balance sheet as either an asset or liability measured at fair value. Additionally, changes in thederivative’s fair value shall be recognized currently in earnings unless specific hedge accounting criteria are met. Ifhedge accounting criteria are met for cash flow hedges, the changes in a derivative’s fair value are recorded inshareholders’ equity as a component of OCI, net of tax. These deferred gains and losses are recognized in income inthe period in which the hedged item and hedging instrument affect earnings. All of the Company’s designated hedginginstruments are classified as cash flow hedges.
The Company is exposed to credit loss in the event of nonperformance by the counterparties on derivative contracts.It is the Company’s policy to manage its credit risk on these transactions by dealing only with financial institutionshaving a long-term credit rating of “A” or better and by distributing the contracts among several financial institutionsto diversify credit concentration risk.
Interest Rate Hedging
The Company executes treasury-lock agreements (T-Locks)and interest rate swap agreements to manage its exposureto changes in interest rates related to its long-term borrowings. For derivative instruments designated as cash flowhedges, changes in the fair value, net of tax, are reported as a component of OCI.
In the fourth quarter of fiscal 2011, the Company entered into interest rate swap agreements to reduce the impact offluctuations in interest rates on the new Agreement, as discussed in Note 8. The interest rate swap agreements arecontracts to exchange floating rate for fixed rate interest payments over the life of the agreements without the exchangeof the underlying notional amounts. The notional amounts of the interest rate swap agreements are used to measureinterest to be paid or received and do not represent the amount of exposure to credit loss. The differential paid orreceived on the interest rate swap agreements is recognized as an adjustment to interest expense. The interest rateswap agreements fix the interest rate at 2.5775% on an initial notional amount of principal of $150,000 on the Agreement.The interest rate swap agreements have a start date of August 3, 2011 and will expire on May 3, 2016.
In conjunction with the Company’s 2010 Credit Agreement, in the second quarter of fiscal 2011, the Company enteredinto interest rate swap agreements to reduce the impact of fluctuations in interest rates on the term loan under the2010 Credit Agreement. The interest rate swap agreements are contracts to exchange floating rate for fixed rate interestpayments over the life of the agreements without the exchange of the underlying notional amounts. The notionalamounts of the interest rate swap agreements are used to measure interest to be paid or received and do not representthe amount of exposure to credit loss. The differential paid or received on the interest rate swap agreements isrecognized as an adjustment to interest expense. The interest rate swap agreements fix the interest rate at 1.545%on an initial notional amount of principal of $90,000 on the 2010 term loan. The interest rate swap agreements willexpire on October 8, 2015.
In the third quarter of fiscal 2010, with the expected issuance of long-term debt to partially fund the PBM acquisition,the Company entered into T-Locks with a notional value of $230,000 to hedge the exposure to the possible rise in thebenchmark interest rate prior to the issuance of the Series 2010 Notes discussed in Note 8. The T-Locks, which theCompany designated as cash flow hedges, were settled in the fourth quarter of fiscal 2010 upon the issuance of anaggregate of $415,000 principal amount of the Series 2010 Notes for a cumulative after-tax gain of $2,253, which wasrecorded in OCI and is being amortized to earnings as a reduction to interest expense over the life of the Series 2010Notes. Approximately $225 after-tax is expected to be recognized in earnings in fiscal 2012.
In conjunction with the Company's prior credit agreement, during the fourth quarter of fiscal 2005, the Company entered
104

into two interest rate swap agreements to reduce the impact of fluctuations in interest rates on the term and revolvingcommitments thereunder. These interest rate swap agreements were contracts to exchange floating rate for fixed rateinterest payments over the life of the agreements without the exchange of the underlying notional amounts. The notionalamounts of interest rate swap agreements were used to measure interest to be paid or received and did not representthe amount of exposure to credit loss. The differential paid or received on interest rate swap agreements was recognizedas an adjustment to interest expense.
The interest rate swap agreements fixed the interest rate at 4.77% on an initial notional amount of principal of $50,000on the revolving loan and $100,000 on the term loan. During the first quarter of fiscal 2010, the Company repaid its$50,000 revolving loan commitment. Due to the repayment of the loan, the Company recorded an additional $1,000in Other expense related to the termination and ultimate cash settlement of the interest rate swap agreement. Theremaining interest rate swap agreement on the $100,000 term loan expired on March 16, 2010.
In accordance with ASC 815, the Company designated the above interest rate swaps as cash flow hedges and formallydocumented the relationship between the interest rate swaps and the variable rate borrowings, as well as its riskmanagement objective and strategy for undertaking the hedge transaction. This process included linking the derivativeto the specific liability or asset on the balance sheet. The Company also assessed, both at the hedge’s inception andon an ongoing basis, whether the derivative used in the hedging transaction was highly effective in offsetting changesin the cash flows of the hedged item. The effective portion of unrealized gains (losses) was deferred as a componentof accumulated OCI and was recognized in earnings at the time the hedged item affected earnings. Any ineffectiveportion of the change in fair value was immediately recognized in earnings.
Foreign Currency Contracts
The Company is exposed to foreign currency exchange rate fluctuations in the normal course of its business, whichthe Company manages through the use of foreign currency put, call and forward contracts. For foreign currencycontracts designated as cash flow hedges, changes in the fair value of the foreign currency contracts, net of tax, arereported as a component of OCI. For foreign currency contracts not designated as hedges, changes in fair value arerecorded in current period earnings.
The Company’s foreign currency hedging program consists of cash flow hedges. The Company enters into foreigncurrency forward contracts in order to hedge the impact of fluctuations of foreign exchange on expected future purchasesand related payables denominated in a foreign currency. These forward contracts have a maximum maturity date oftwelve months. In addition, the Company enters into foreign currency forward contracts in order to hedge the impactof fluctuations of foreign exchange on expected future sales and related receivables denominated in a foreign currency.These forward contracts also have a maximum maturity date of twelve months. The Company did not have any foreigncurrency put or call contracts as of June 25, 2011.
In accordance with ASC 815, the Company has designated certain forward contracts as cash flow hedges and hasformally documented the relationships between the forward contracts and the hedged items, as well as its riskmanagement objective and strategy for undertaking the hedge transactions. This process includes linking the derivativeto the specific liability or asset on the balance sheet. The Company also assesses, both at the inception of the hedgeand on an ongoing basis, whether the derivative used in the hedging transaction is highly effective in offsetting changesin the cash flows of the hedged item. The effective portion of unrealized gains (losses) is deferred as a component ofaccumulated OCI and is recognized in earnings at the time the hedged item affects earnings. Any ineffective portionof the change in fair value is immediately recognized in earnings.
The effects of derivative instruments on the Company’s consolidated financial statements were as follows as of June 25,2011 and June 26, 2010 and for the twelve months ended June 25, 2011 and June 26, 2010 (amounts presentedexclude any income tax effects):
105

Fair Values of Derivative Instruments in Consolidated Balance Sheet(Designated as (non)hedging instruments under ASC 815)
Hedging derivatives:
Foreign currency forward contractsTotal hedging derivativesNon-hedging derivatives:
Foreign currency forward contractsTotal non-hedging derivatives
Asset DerivativesBalance Sheet Location
Other current assets
Other current assets
Fair ValueJune 25, 2011
$ 4,178$ 4,178
$ 206$ 206
June 26, 2010
$ 51$ 51
$ 351$ 351
Hedging derivatives:
Foreign currency forward contractsInterest rate swap agreements
Total hedging derivativesNon-hedging derivatives:
Foreign currency forward contractsTotal non-hedging derivatives
Liability DerivativesBalance Sheet Location
Accrued liabilitiesOther non-current liabilities
Accrued liabilities
Fair ValueJune 25, 2011
$ 9527,283
$ 8,235
$ 79$ 79
June 26, 2010
$ 4,827—
$ 4,827
$ 101$ 101
106

Effects of Derivative Instruments on Income and OCI for the twelve months ended June 25, 2011 and June 26, 2010
Derivatives inASC 815
CashFlow HedgingRelationships
T-LocksInterest rateswapagreementsForeigncurrencyforwardcontracts
Total
Amount of Gain/(Loss) Recognized
in OCI on Derivative
(Effective Portion)June 25,
2011
$ —
(7,225)
9,132
$ 1,907
June 26,2010
$ 2,700
1,767
(6,245)
$ (1,778)
Location and Amount of Gain/(Loss)Reclassified from Accumulated OCI
into Income(Effective Portion)
Interest, net
Interest, net
Net salesCost of salesInterest, netOther income(expense), net
June 25,2011
$ 363
844
(1,239)91535
2,930$ 3,848
June 26,2010
$ —
(3,569)
(1,080)2,036
55
(1,858)$ (4,416)
Location and Amount of Gain/(Loss) Recognized in Income on Derivative
(Ineffective Portion and AmountExcluded from Effectiveness
Testing)
Interest, net
Otherexpense
Net salesCost of sales
June 25,2011
$ —
—
20(683)
$ (663)
June 26,2010
$ —
(1,100)
—(33)
$ (1,133)
Derivatives Not Designated asHedging Instruments under
ASC 815
Foreign currency forward contracts(1)
Location of Gain/(Loss)Recognized in Income on
Derivative
Other income, net
Amount of Gain/(Loss) Recognized inIncome on Derivative
June 25,2011
$ 1,201
June 26,2010
$ 2,377(1) The net hedge result offsets the revaluation of the underlying balance sheet exposure, which is also recorded in Other expense.
NOTE 11 – POST EMPLOYMENT PLANS
Qualified Profit-Sharing and Investment Plans
The Company has a qualified profit-sharing and investment plan under Section 401(k) of the Internal Revenue Code(IRC), which covers substantially all domestic employees in Michigan, South Carolina, New York, Florida, Vermont,Virginia and Ohio. The Company’s contributions to the plan include an annual nondiscretionary contribution of 3% ofan employee’s eligible compensation and a discretionary contribution at the option of the Board of Directors. Additionally,the Company matches a portion of employees’ contributions. The Company’s contributions to the plan were $20,220,$25,545 and $12,908 in fiscal 2011, 2010 and 2009, respectively.
As a result of the acquisition of PBM, the Company had an additional qualified investment plan under Section 401(k)of the IRC, covering employees at PBM. The Company's contribution to the plan was $235 for fiscal 2011. The Companymerged this plan with the Company’s plan described above effective January 1, 2011.
As a result of the acquisition of JBL, the Company had an additional qualified investment plan under Section 401(k)of the IRC, which covered employees at Perrigo Holland, Inc. (formerly J.B. Laboratories, Inc.). The Company’scontribution to the plan was $713 for fiscal 2009. This plan was merged with the Company’s plan described above asof January 1, 2009.
Israeli Post Employment Benefits
Israeli labor laws and agreements require the Company to pay benefits to employees dismissed or retiring undercertain circumstances. Severance pay is calculated on the basis of the most recent employee salary levels and thelength of employee service. The Company’s Israeli subsidiaries also provide retirement bonuses to certain managerialemployees. The Company makes regular deposits to retirement funds and purchases insurance policies to partially
107

fund these liabilities. The deposited funds may be withdrawn only upon the fulfillment of requirements pursuant toIsraeli labor laws. The liability related to these post employment benefits, which is recorded in other non-currentliabilities, was $21,456 at June 25, 2011. The Company funded $17,170 of this amount, which is recorded in othernon-current assets, as of June 25, 2011. As of June 26, 2010, the liability and corresponding asset related to thesepost employment benefits were $18,766 and $14,977, respectively. The Company’s contributions to the above planswere $1,372, $1,029 and $1,830 for fiscal 2011, 2010 and 2009, respectively.
Deferred Compensation Plans
The Company has non-qualified plans related to deferred compensation and executive retention that allow certainemployees and directors to defer compensation subject to specific requirements. Although the plans are not formallyfunded, the Company owns insurance policies with a cash surrender value of $12,188 at June 25, 2011 and $8,948at June 26, 2010 that are intended as a long-term funding source for these plans. The assets, which are recorded inother non-current assets, are not a committed funding source and may, under certain circumstances, be subject toclaims from creditors. The deferred compensation liability,which is recorded in other non-current liabilities, was $13,894at June 25, 2011 and $9,295 at June 26, 2010.
Postretirement Medical Benefits
The Company provides certain healthcare benefits to eligible U.S. employees and their dependents who meet certainage and service requirements when they retire. Generally, benefits are provided to eligible retirees after age 65 andto their dependents. Increases in the Company contribution for benefits are limited to increases in the CPI. Additionalhealthcare cost increases are paid through participant contributions. The Company accrues the expected costs ofsuch benefits during a portion of the employees’ years of service. The plan is not funded. Under current plan provisions,the plan is not eligible for any federal subsidy related to the Medicare Modernization Act of 2003 Part D Subsidy. Theunfunded accumulated projected benefit obligation was $2,936 at June 25, 2011 and $2,667 at June 26, 2010. Inaccordance with ASC 715-30-35, which became effective for the Company in the fourth quarter of fiscal 2007, theCompany records unrecognized actuarial gains and losses as a component of accumulated other comprehensiveincome. As of June 25, 2011 and June 26, 2010, an unrecognized actuarial loss of $161 and $432, respectively, wasincluded in accumulated other comprehensive income on a net of tax basis – see Note 13. Net periodic benefit gainwas $252, $309 and $344 in fiscal 2011, 2010 and 2009, respectively.
NOTE 12 – SHAREHOLDERS’ EQUITY
In January 2003, the Board of Directors adopted a policy of paying regular quarterly dividends. The Company paiddividends of $25,303, $22,329 and $19,957 or $0.2725, $0.2425 and $0.2150 per share, during fiscal 2011, 2010 and2009, respectively. The declaration and payment of dividends and the amount paid, if any, are subject to the discretionof the Board of Directors and will depend on the earnings, financial condition, capital and surplus requirements of theCompany and other factors the Board of Directors may consider relevant.
The Company has had a common stock repurchase program. Purchases were made on the open market, subject tomarket conditions and were funded by available cash or borrowings. On February 1, 2008, the Board of Directorsapproved a plan to repurchase shares of common stock with a value of up to $150,000 The Company completedpurchases under this plan on December 16, 2009. All common stock repurchased by the Company becomes authorizedbut unissued stock and is available for reissuance in the future for general corporate purposes. The Companyrepurchased 142 shares of common stock for $8,308 during fiscal 2011. The Company repurchased 2,062 and 1,836shares of common stock for $71,088 and $62,489 during fiscal 2010 and 2009, respectively. Private party transactionsaccounted for 142, 85 and 42 shares in fiscal 2011, 2010 and 2009, respectively.
Share-Based Compensation Plans
All share-based compensation for employees and directors is granted under the 2008 Long-Term Incentive Plan, asamended. The plan has been approved by the Company’s shareholders and provides for the granting of awards to itsemployees and directors. As of June 25, 2011, there were 6,370 shares available to be granted. The purpose of theplan is to attract and retain individuals of exceptional managerial talent and encourage these individuals to acquire avested interest in the Company’s success and prosperity. The awards that are granted under this program primarilyinclude non-qualified stock options, restricted shares and restricted share units. Restricted shares are generally service-based, requiring a certain length of service before vesting occurs, while restricted share units can be either service-based or performance-based. Performance-based restricted share units require a certain length of service until vesting;however, they contain an additional performance feature, which can vary the amount of shares ultimately paid out
108

based on certain performance criteria specified in the plan. Awards granted under the plan vest and may be exercisedand/or sold from one to ten years after the date of grant based on a vesting schedule.
Share-based compensation expense was $15,355 for fiscal 2011, $14,696 for fiscal 2010 and $10,353 for fiscal 2009.The income tax benefit recognized was $23,124 for fiscal 2011, $15,355 for fiscal 2010 and $4,982 for fiscal 2009. Asof June 25, 2011, unrecognized share-based compensation expense was $14,692 and will be recognized withinapproximately three years. Proceeds from the exercise of stock options and excess income tax benefits attributableto stock options exercised are credited to common stock.
A summary of activity related to stock options is presented below:
Beginning options outstandingGrantedExercisedForfeited or expiredEnding options outstanding
Options exercisableOptions expected to vest
For the year ended June 25, 2011
Number ofOptions
1,972182
(781)(5)
1,368
640713
WeightedAverageExercise
Price$21.33$58.93$18.37$24.55$28.00
$21.99$33.17
WeightedAverage
RemainingTerm inYears
6.29
5.127.31
AggregateIntrinsicValue
$79,153
$40,856$37,557
The aggregate intrinsic value for options exercised during the year was $40,485 for fiscal 2011, $41,127 for fiscal 2010and $13,700 for fiscal 2009. The weighted average fair value per share at the grant date for options granted duringthe year was $18.46 for fiscal 2011, $10.29 for fiscal 2010 and $10.43 for fiscal 2009. The fair values were estimatedusing the Black-Scholes option pricing model with the following weighted average assumptions:
Dividend yieldVolatility, as a percentRisk-free interest rateExpected life in years after vest date
Fiscal Year2011
0.6%33.6%1.5%2.5
20100.7%
33.6%2.7%2.6
20090.7%
29.9%2.9%2.0
Volatility used in the valuation model was based on historical volatility. The risk-free interest rate was based on theyield of U.S. government securities with a maturity date that coincides with the expected term of the option. Theexpected life in years after vest date was estimated based on past exercise behavior of employees.
A summary of activity related to nonvested restricted shares is presented below:
109
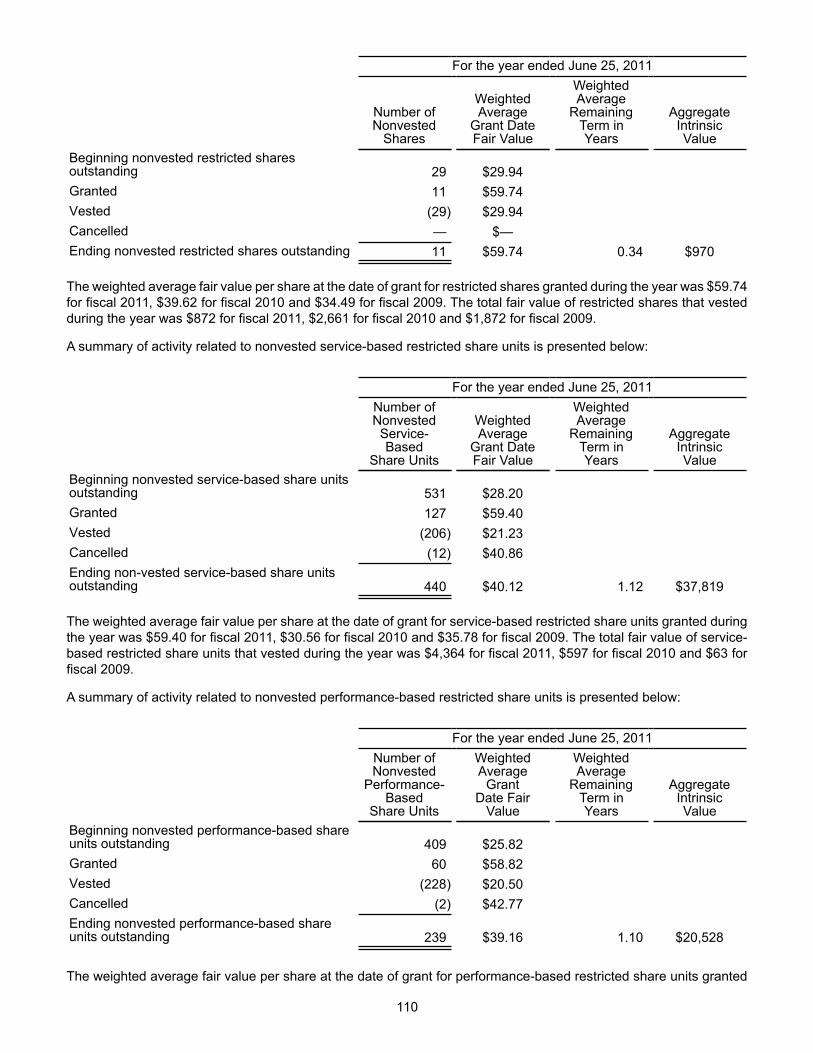
Beginning nonvested restricted sharesoutstandingGrantedVestedCancelledEnding nonvested restricted shares outstanding
For the year ended June 25, 2011
Number ofNonvested
Shares
2911
(29)—11
WeightedAverage
Grant DateFair Value
$29.94$59.74$29.94
$—$59.74
WeightedAverage
RemainingTerm inYears
0.34
AggregateIntrinsicValue
$970
The weighted average fair value per share at the date of grant for restricted shares granted during the year was $59.74for fiscal 2011, $39.62 for fiscal 2010 and $34.49 for fiscal 2009. The total fair value of restricted shares that vestedduring the year was $872 for fiscal 2011, $2,661 for fiscal 2010 and $1,872 for fiscal 2009.
A summary of activity related to nonvested service-based restricted share units is presented below:
Beginning nonvested service-based share unitsoutstandingGrantedVestedCancelledEnding non-vested service-based share unitsoutstanding
For the year ended June 25, 2011Number ofNonvested
Service-Based
Share Units
531127
(206)(12)
440
WeightedAverage
Grant DateFair Value
$28.20$59.40$21.23$40.86
$40.12
WeightedAverage
RemainingTerm inYears
1.12
AggregateIntrinsicValue
$37,819
The weighted average fair value per share at the date of grant for service-based restricted share units granted duringthe year was $59.40 for fiscal 2011, $30.56 for fiscal 2010 and $35.78 for fiscal 2009. The total fair value of service-based restricted share units that vested during the year was $4,364 for fiscal 2011, $597 for fiscal 2010 and $63 forfiscal 2009.
A summary of activity related to nonvested performance-based restricted share units is presented below:
Beginning nonvested performance-based shareunits outstandingGrantedVestedCancelledEnding nonvested performance-based shareunits outstanding
For the year ended June 25, 2011Number ofNonvested
Performance-Based
Share Units
40960
(228)(2)
239
WeightedAverage
GrantDate Fair
Value
$25.82$58.82$20.50$42.77
$39.16
WeightedAverage
RemainingTerm inYears
1.10
AggregateIntrinsicValue
$20,528
The weighted average fair value per share at the date of grant for performance-based restricted share units granted
110

during the year was $58.82 for fiscal 2011, $39.98 for fiscal 2010 and $35.85 for fiscal 2009. The weighted averagefair value of performance-based restricted share units can fluctuate depending upon the success or failure of theachievement of performance criteria as set forth in the plan. The total fair value of performance-based restricted shareunits that vested during the year was $4,671 and $3,372 for fiscal 2011 and 2010, respectively.
NOTE 13 – ACCUMULATED OTHER COMPREHENSIVE INCOME
Comprehensive income (loss) is comprised of all changes in shareholders’ equity during the period other than fromtransactions with shareholders. Accumulated other comprehensive income and fiscal year activity consisted of thefollowing:
Balance as of June 27, 2009Other comprehensive income(loss)Balance as of June 26, 2010Other comprehensive income(loss)Balance as of June 25, 2011
Fair valueof derivative
financialinstruments,
net of tax$ (1,934)
1,668(266)
(790)$ (1,056)
Foreigncurrency
translationadjustments
$ 51,050
(2,362)48,688
81,691$ 130,379
Fair value ofinvestmentsecurities,net of tax
$ (5,949)
(568)(6,517)
3,110$ (3,407)
Post-retirement
liabilityadjustments,
net of tax$ 1,727
(432)1,295
(161)$ 1,134
Accumulatedother
comprehensiveincome
$ 44,894
(1,694)43,200
83,850$ 127,050
At June 27, 2009, upon adoption of ASC320-10-65, the Company recorded a $5,000 adjustment from retained earningsto accumulated other comprehensive income to reclassify the noncredit component of the $15,104 other-than-temporary impairment charge it recognized in the third quarter of fiscal 2009 related to its ARS.
NOTE 14 – INCOME TAXES
Pre-tax income and the provision for income taxes from continuing operations are summarized as follows:
Pre-tax income:U.S.Foreign
TotalProvision for income taxes:Current:
FederalStateForeign
SubtotalDeferred:
FederalStateForeign
SubtotalTotal
Fiscal Year2011
$ 299,343151,211
$ 450,554
$ 108,64411,30946,183
166,136
(11,479)(1,363)
(43,298)(56,140)
$ 109,996
2010
$ 190,104118,545
$ 308,649
$ 63,9927,042
29,254100,288
261(554)
(15,780)(16,073)
$ 84,215
2009
$ 137,83968,442
$ 206,281
$ 49,6924,892
12,18566,769
(4,474)488669
(3,317)$ 63,452
A reconciliation of the provision based on the Federal statutory income tax rate to the Company’s effective income tax
111

rate is as follows:
Provision at Federal statutory rateState income taxes, net of Federal benefitForeign tax rate differencesExpenses not deductible for tax purposes/deductions notexpensed for book, netApproved enterprise benefitIsraeli statutory tax rate changeInternational capital lossAPI restructuring – GermanyForeign tax creditResearch and development creditOtherEffective income tax rate
Fiscal Year2011
%35.02.2
(2.5)
(0.9)(3.9)(1.9)
——
(6.2)(0.7)3.3
24.4
2010%
35.02.1
(4.1)
(1.7)(3.3)(1.5)
—0.4
(1.6)(0.3)2.3
27.3
2009%
35.02.7
(5.9)
(0.7)(2.4)
—2.01.1—
(1.4)0.4
30.8
Provision has not been made for U.S. or additional foreign taxes on undistributed earnings of foreign subsidiaries,except for Israel taxes on pre-acquisition approved enterprise earnings, because those earnings are consideredpermanently reinvested in the operations of those subsidiaries. There is approximately $376,000 of foreign earningsand profits for which taxes have not been provided.
Deferred income taxes arise from temporary differences between the financial reporting and the tax reporting basisof assets and liabilities and operating loss and tax credit carry forwards for tax purposes. The components of the netdeferred income tax asset (liability) are as follows:
Deferred income tax asset (liability):Property and equipmentInventory basis differencesAccrued liabilitiesAllowance for doubtful accountsResearch and developmentState operating loss carry forwardsState credit carry forwardsInternational operating loss carry forwardsInternational capital loss carry forwardsDomestic capital loss carry forwardsUnearned revenueShare-based compensationForeign tax creditPre-acquisition approved enterprise earningsOther, net
SubtotalValuation allowance for carry forwards
Net deferred income tax asset (liability):
Fiscal Year2011
$ (52,512)17,74820,3672,6095,7041,1213,3593,3293,0143,5371,9388,573
25,811—
(1,810)42,788
(12,384)$ 30,404
2010
$ (55,050)16,96617,8702,3105,0241,3402,8061,0907,9306,0262,4587,9491,697
(28,210)4,817
(4,977)(17,144)
$ (22,121)
112

The above amounts are classified in the consolidated balance sheet as follows:
AssetsLiabilities
Net deferred income tax asset (liability)
June 25,2011
$ 41,00510,601
$ 30,404
June 26,2010
$ 27,22549,346
$ (22,121)
At June 25, 2011, the Company had gross carry forwards as follows: state net operating losses of $77,410, state creditsof $9,176, international net operating losses of $14,982, domestic capital losses of $9,661 and international capitallosses of $22,793. At June 25, 2011, gross valuation allowances had been provided for state net operating loss carryforwards in the amount of $51,514, $7,869 for state credit carry forwards, $9,032 for international net operating losscarry forwards, $9,661 for domestic capital loss carry forwards and $22,220 for international capital carry loss forwardsas utilization of such carry forwards within the applicable statutory periods is uncertain. The domestic capital loss carryforward expires through 2016; the state net operating loss carry forwards expire through 2031. A portion of theinternational net operating loss carry forwards expire through 2015, the balance and international capital loss carryforwards have no expiration. The valuation allowances for these net operating loss carry forwards are adjusted annually,as necessary. After application of the valuation allowances described above, the Company anticipates no limitationswill apply with respect to utilization of the net deferred income tax assets described above.
The following table summarizes the activity related to amounts recorded for uncertain tax positions, excluding interestand penalties, for the years ended June 25, 2011 and June 26, 2010:
Balance at June 27, 2009Additions:
Positions related to the current yearPositions of prior years
Reductions:Positions related to the current yearPositions of prior yearsSettlements with taxing authoritiesLapse of statutes of limitation
Balance at June 26, 2010Additions:
Positions related to the current yearPositions of prior years
Reductions:Positions related to the current yearPositions of prior yearsSettlements with taxing authoritiesLapse of statutes of limitation
Balance at June 25, 2011
UnrecognizedTax Benefits
$ 47,697
16,7274,479
—(231)(40)
(3,234)65,398
32,3819,358
—(60)—
(2,045)$ 105,032
During fiscal 2010, the total liability, including interest and penalties, for uncertain tax positions increased by $18,115,of which $127 was accounted for as an increase to goodwill, bringing the Company's total unrecognized tax benefitsto $72,296 as of June 26, 2010.
During fiscal 2011, the total liability, including interest and penalties, for uncertain tax positions increased by $45,626of which $1,279 was accounted for as an increase to goodwill and $18,333 was accounted for as an increase to prepaid
113

expense. This brought the Company's total unrecognized tax benefits to $117,922 as of June 25, 2011.
Included in the liability for uncertain tax positions at June 25, 2011 and June 26, 2010 were $98,182 and $72,169,respectively, of unrecognized tax benefits that, if recognized, would impact the effective tax rate in future periods.
The Company recognizes interest and penalties related to uncertain tax positions as a component of income taxexpense. The impact related to interest and penalties on the effective tax rate for fiscal 2011 amounted to a $7,816unfavorable impact. For fiscal 2010, the Company recognized a $2,203 unfavorable impact. The total amount accruedfor interest and penalties in the liability for uncertain tax positions was $22,310 and $14,494 as of June 25, 2011 andJune 26, 2010, respectively.
The Company files income tax returns in the U.S., various state and local jurisdictions, and multiple foreign jurisdictions,and is therefore subject to periodic audits by domestic and foreign tax authorities. Its primary income tax jurisdictionsare the U.S. and Israel. The Internal Revenue Service is currently auditing the Company for years ending June 2007and June 2008 and has notified the Company of audit for years ending June 2009 and June 2010. The Israeli TaxAuthority is auditing the Company for years ending May 2006, May 2007, May 2008 and May 2009. There are numerousother income tax jurisdictions for which tax returns are not yet settled, none of which are individually significant.
Based on the final resolution of tax examinations, judicial or administrative proceedings, changes in facts or law,expirations of statute of limitations in specific jurisdictions or other resolutions of, or changes in, tax positions, it isreasonably possible that unrecognized tax benefits for certain tax positions taken on previously filed tax returns maychange materially from those presented on the financial statements as of June 25, 2011. During the next twelve months,it is reasonably possible that such circumstances may occur that would have a material effect on previouslyunrecognized tax benefits. As a result, the total net amount of unrecognized tax benefits may decrease, which wouldreduce the provision for taxes on earnings by a range estimated at $4,000 to $38,000.
Tax Rate Reductions
In the third quarter of fiscal 2011, Israel enacted new tax legislation to reduce the effective tax rate for qualifying entitiesto 10% for 2011 and 2012, 7% for 2013 and 2014, and 6% thereafter. Two of the Company's entities will be eligiblefor this benefit and currently anticipate electing to be taxed under the new legislation for years after fiscal 2011.Previously, in July 2009, Israel enacted a new law change to lower its statutory corporate tax rate as follows: 24% for2010, 23% for 2011, 22% for 2012, 21% for 2013, 20% for 2014 and 18% for 2015 and thereafter.
Tax Exemptions in Israel
Certain of the Company's Israel subsidiaries have been granted approved enterprise status under the Law for theEncouragement of Capital Investments (1959). Income derived from such entities is entitled to various tax benefitsbeginning in the year the subsidiary first generates taxable income. These benefits apply to an entity depending oncertain elections. Certain subsidiaries have elected alternative tax benefits and are entitled to tax exemption for tenyears. The period of benefits for these subsidiaries expires through 2016.
These benefits are generally granted with the understanding that cash dividends will not be distributed from the affectedincome. Should dividends be distributed out of tax exempt income, the subsidiary would be required to pay a 10% to25% tax on the distribution. The Company does not currently intend to cause distribution of a dividend, which wouldinvolve additional tax liability in the foreseeable future; therefore, no provision has been made for such tax on post-acquisition earnings.
Certain other conditions apply to maintain entitlement to these tax benefits. The grants are received from the Officeof the Chief Scientist in Israel's Ministry of Industry and Trade. Tocontinue to be eligible for these grants, the Company'sdevelopment projects must be approved by the Chief Scientist on a case-by-case basis. If the Company's developmentprojects are not approved by the Chief Scientist, the Company will not receive grants to fund these projects, whichwould increase research and development costs. The receipt of such grants subjects the Company to certain restrictionsand pre-approval requirements, which may be conditioned on additional royalty payments with rights to transferintellectual property and/or production abroad. The Company also receives tax benefits, in particular exemptions andreductions, as a result of the approved enterprise status of certain existing operations in Israel. To be eligible for thesetax benefits, the Company must maintain its approved enterprise status by meeting conditions, including makingspecified investments in fixed assets located in Israel and investing additional equity in itself and its Israeli subsidiariesand by meeting projections provided to the regulatory agencies. If the Company fails to meet these conditions in the
114

future, the tax benefits would be cancelled, and the Company could be required to refund the tax benefits alreadyreceived. These tax benefits may not be continued in the future at their current levels or at any level. If such benefitsare reduced or eliminated in the future, the Company's result of operations will be adversely impacted. All affectedsubsidiaries are currently in compliance with these conditions.
NOTE 15 – COMMITMENTS AND CONTINGENCIES
The Company leases certain assets, principally warehouse facilities and computer equipment, under agreements thatexpire at various dates through calendar 2014. Certain leases contain provisions for renewal and purchase optionsand require the Company to pay various related expenses. Future non-cancelable minimum operating leasecommitments are as follows: 2012 – $18,295; 2013– $14,662; 2014– $10,787; 2015 – $7,282; 2016 – $3,860 andthereafter – $2,850. Rent expense under all leases was $21,099, $17,585 and $16,134 for fiscal 2011, 2010 and 2009,respectively.
On March 11, 2009, a purported shareholder of the Company named Michael L. Warner (“Warner”) filed a lawsuit inthe United States District Court for the Southern District of New York against the Company and certain of its officersand directors, including the President and Chief Executive Officer, Joseph Papa, and the Chief Financial Officer, JudyBrown, among others. The plaintiff sought to represent a class of purchasers of the Company’s common stock duringthe period between November 6, 2008 and February 2, 2009. The complaint alleged violations of Sections 10(b) and20(a) of the Securities Exchange Act of 1934 (the Exchange Act). The plaintiff generally alleged that the Companymisled investors by failing to disclose, prior to February 3, 2009, that certain auction rate securities held by the Company,totaling approximately $18,000 in par value (the ARS), had been purchased from Lehman Brothers Holdings, Inc.(Lehman). The plaintiff asserted that omission of the identity of Lehman as the seller of the ARS was material becauseafter Lehman’s bankruptcy filing, on September 15, 2008, the Company allegedly became unable to look to Lehmanto repurchase the ARS at a price near par value. The complaint sought unspecified damages and unspecified equitableor injunctive relief, along with costs and attorneys’ fees.
On June 15, 2009, the Court appointed several purported shareholders of the Company,namely CLALFinance BatuchaInvestment Management, Ltd., The Phoenix Insurance Company, Ltd., Excellence Nessuah Mutual FundsManagement, Ltd. and Excellence Nessuah Gemel & Pension, Ltd., as Co-Lead Plaintiffs. On July 31, 2009, theseCo-Lead Plaintiffs filed an amended complaint. The amended complaint dropped all claims against the individualdefendants other than Joseph Papa and Judy Brown, and added a “control person” claim under Section 20(a) of theExchange Act against the members of the Company’s Audit Committee. The amended complaint asserts many of thesame claims and allegations as the original proceeding. It also alleges that the Company should have disclosed, priorto February 3, 2009, that Lehman had sold the ARS to the Company and had provided the allegedly inflated valuationof the ARS that the Company adopted in its Form 10-Q filing for the first quarter of fiscal 2009, which was filed withthe SEC on November 6, 2008. The amended complaint also alleges that some portion of the write-down of the valueof the ARS that the Company recognized in the second quarter of fiscal 2009 should have been taken in the priorquarter, immediately following Lehman’s bankruptcy filing. On September 28, 2009, the defendants filed a motion todismiss all claims against all defendants. On September 30, 2010, the Court granted in part and denied in part themotion to dismiss. The Court dismissed the “control person” claims against the members of the Company’s AuditCommittee, but denied the motion to dismiss as to the remaining claims and defendants. On October 29, 2010, thedefendants filed a new motion to dismiss the amended complaint on the grounds that the Co-Lead Plaintiffs (who arethe only plaintiffs named in the amended complaint) lack standing to sue under the U.S. securities laws following arecent decision of the United States Supreme Court holding that Section 10(b) of the Exchange Act does not applyextraterritorially to the claims of foreign investors who purchased or sold securities on foreign stock exchanges. Themotion to dismiss is pending. On December 23, 2010, a shareholder named Harel Insurance, Ltd. (Harel) filed a motionto intervene as an additional named plaintiff. Although Harel is a non-U.S. investor, it claims to have purchased theCompany’s common stock on a U.S. exchange. On January 10, 2011, the original plaintiff, Warner, filed a motionrenewing his previously withdrawn motion to be appointed as Lead Plaintiff to replace the Co-Lead Plaintiffs. Thesemotions are pending.
On June 2, 2009, a purported shareholder of the Company named Bill Drinkwine filed a purported shareholder derivativecomplaint in the Circuit Court of Allegan County, Michigan against a number of officers and directors of the Company,including certain of the officers and directors named as defendants in the federal securities suit described above, aswell as others. Like the federal securities suit, the state court complaint alleges that the Company misled investors byfailing to disclose, prior to February 3, 2009, that the ARS had been purchased from Lehman and allegedly “becameworthless” when Lehman filed for bankruptcy. The complaint asserted that the officer and director defendants violatedtheir fiduciary duties to the Company by selling shares of their personally-held Perrigo stock during the five-month
115

period between Lehman’s bankruptcy filing and the Company’s February 3, 2009 disclosure of the write-down of thevalue of the ARS. The complaint sought to “recover” for Perrigo the proceeds received by the officer and directordefendants from such stock sales.
Prior to filing the suit, on March 3, 2009, Mr. Drinkwine made a demand on the Company’s Board of Directors thatPerrigo bring the suit directly against the accused officers and directors. In response to that demand, the Perrigo Boardappointed a committee of all independent, disinterested directors (as defined by the Michigan Business CorporationAct) to investigate Mr. Drinkwine’s allegations. The committee retained independent counsel to assist it in thatinvestigation. The committee and its counsel conducted an investigation and concluded that Mr. Drinkwine’s allegationswere without merit and, consequently, that it would not be in Perrigo’s best interests for the suit to go forward. Basedon the findings of that investigation, on August 24, 2009, the Company filed a motion to dismiss the complaint pursuantto Section 495 of the Michigan Business Corporation Act, which provides that when a committee of all independent,disinterested directors makes a good faith determination, based upon a reasonable investigation, that the maintenanceof a derivative suit would not be in the best interests of the corporation, the court shall dismiss the derivative proceeding.On November 3, 2010, the Court granted the Company’s dismissal motion and terminated the case. Mr. Drinkwine didnot appeal that ruling.
In March and June of 2007, lawsuits were filed by three separate groups against both the State of Israel and the Councilof Ramat Hovav in connection with waste disposal and pollution from several companies, including the Company, thathave operations in the Ramat Hovav region of Israel. These lawsuits were subsequently consolidated into a singleproceeding in the District Court of Beer-Sheva. The Council of Ramat Hovav, in June 2008, and the State of Israel, inNovember 2008, asserted third party claims against several companies, including the Company. The pleadings allegea variety of personal injuries arising out of the alleged environmental pollution. Neither the plaintiffs nor the third partyclaimants were required to specify a maximum amount of damages, but the pleadings allege damages in excess of$72,500, subject to foreign currency fluctuations between the Israeli shekel and the U.S. dollar. While the Companyintends to vigorously defend against these claims, the Company cannot reasonably predict at this time the outcomeor the liability, if any, associated with these claims.
In addition to the foregoing discussion, the Company has pending certain other legal actions and claims incurred inthe normal course of business. The Company believes that it has meritorious defenses to these lawsuits and/or iscovered by insurance and is actively pursuing the defense thereof. The Company believes the resolution of all of thesematters will not have a material adverse effect on its financial condition and results of operations as reported in theaccompanying consolidated financial statements. However, depending on the amount and timing of an unfavorableresolution of these lawsuits, the Company’s future results of operations or cash flow could be materially impacted ina particular period.
NOTE 16 – QUARTERLY FINANCIAL DATA (unaudited)The following table presents unaudited quarterly consolidated operating results for each of the Company’s last eightfiscal quarters. This information below has been prepared on a basis consistent with the Company’s auditedconsolidated financial statements.
116

Fiscal 2011Net salesGross profitIncome from continuing operationsIncome (loss) from discontinued operations, net
of taxNet incomeEarnings (loss) per share(1):
BasicContinuing operationsDiscontinued operationsBasic earnings per share
DilutedContinuing operationsDiscontinued operationsDiluted earnings per share
Weighted average shares outstandingBasicDiluted
FirstQuarter
$ 641,322$ 213,954$ 73,678
697$ 74,375
$ 0.800.01
$ 0.81
$ 0.790.01
$ 0.80
91,82493,269
SecondQuarter
$ 717,515$ 249,500$ 89,779
388$ 90,167
$ 0.970.00
$ 0.98
$ 0.960.00
$ 0.97
92,23293,363
ThirdQuarter
$ 691,563$ 239,082$ 91,531
(2,446)$ 89,085
$ 0.99(0.03)
$ 0.96
$ 0.98(0.03)
$ 0.95
92,45993,549
FourthQuarter(2)
$ 704,629$ 242,334$ 85,570
—$ 85,570
$ 0.92—
$ 0.92
$ 0.91—
$ 0.91
92,72493,853
Fiscal 2010Net salesGross profitIncome from continuing operationsIncome (loss) from discontinued operations, net
of taxNet incomeEarnings (loss) per share(1):
BasicContinuing operationsDiscontinued operationsBasic earnings per share
DilutedContinuing operationsDiscontinued operationsDiluted earnings per share
Weighted average shares outstandingBasicDiluted
FirstQuarter(3)(4)
$ 528,333$ 163,212$ 51,100
761$ 51,861
$ 0.560.01
$ 0.56
$ 0.550.01
$ 0.56
92,04493,396
SecondQuarter(3)(5)
$ 582,425$ 197,625$ 62,791
(1,978)$ 60,813
$ 0.69(0.02)
$ 0.66
$ 0.68(0.02)
$ 0.65
91,63492,999
ThirdQuarter(3)(6)
$ 537,632$ 187,395$ 61,541
640$ 62,181
$ 0.670.01
$ 0.68
$ 0.660.01
$ 0.67
91,17992,589
FourthQuarter(3)(7)
$ 619,760$ 198,001$ 49,002
(58)$ 48,944
$ 0.54(0.00)
$ 0.53
$ 0.53(0.00)
$ 0.53
91,49692,948
(1) The sum of quarterly financial data may vary from the annual data due to rounding. The sum of individual per share amounts may notequal due to rounding.
(2) Includes restructuring costs of $1,033 associated with exiting one of the Company's product lines manufactured at its Florida facility.(3) As discussed in Note 1, financial data has been retrospectively adjusted due to the voluntary change in accounting principle to eliminate
the one-month reporting lag for the Company's foreign subsidiaries.(4) Includes a pre-tax charge to cost of sales of $320 associated with the step-up in value of inventory related to the distribution agreement
entered into by the Company’s Israeli subsidiary with a major global diagnostic company and a $14,000 write-off of in-process researchand development costs related to the acquisition of the ANDA from KV.
(5) Includes a pre-tax charge to cost of sales of $617 associated with the step-up in value of inventory related to the distribution agreemententered into by the Company’s Israeli subsidiary with a major global diagnostic company.
117

(6) Includes a pre-tax charge to cost of sales of $94 associated with the step-up in value of inventory related to the distribution agreemententered into by the Company’s Israeli subsidiary with a major global diagnostic company, pre-tax charges for restructuring costs of $7,474associated with facility closure costs in Florida and the sale of the German API facility and acquisition charges of $3,052 related to theacquisitions of PBM and Orion.
(7) Includes a $5,000 write-off of in-process research and development costs related to the acquisition of the ANDA from Novel, a pre-taxcharge to cost of sales for $495 and $9,402 associated with the step-up in value of inventory related to the acquisition of Orion and PBM,respectively, $7,900 of acquisition costs associated with the acquisition of PBM and pre-tax charges of $2,049 associated with the saleof the German API facility.
NOTE 17 – SEGMENT AND GEOGRAPHIC INFORMATION
The Company has four reportable segments, aligned primarily by type of product: Consumer Healthcare, Nutritionals,Rx Pharmaceuticals and API, along with an Other category. As discussed in Note 1, following the purchase of PBM,in the first quarter of fiscal 2011, the Company realigned and expanded its reportable segments to include its Nutritionalssegment, representing infant formulas and other nutritional products. As discussed in Note 3, beginning in the thirdquarter of fiscal 2009, the operating results of the Company's former Israel Consumer Products operating segmentare reported as discontinued operations in the Company’s consolidated statements of income and are not included inthe table below for any period presented. The accounting policies of each segment are the same as those describedin the summary of significant accounting policies set forth in Note 1.
The majority of corporate expenses, which generally represent shared services, are charged to operating segmentsas part of a corporate allocation. Unallocated expenses relate to certain corporate services that are not allocated tothe segments. Unallocated expenses included one-time acquisition costs of $8,189 related to the acquisitions of PBMand Orion and a write-off of in-process research and development of $279 related to the assets acquired from Dibafor fiscal 2010 and 2009, respectively. The Consumer Healthcare segment incurred restructuring charges of $1,033,inventory step-up charges of $495 and asset impairment charges of $1,600 in fiscal 2011, 2010 and 2009, respectively.In fiscal 2010, the Nutritionals segment incurred inventory step-up charges of $9,402 and restructuring charges of$699. In fiscal 2010, the Rx Pharmaceuticals segment recognized a write-off of in-process research and developmentof $19,000. In fiscal 2010, the Other category incurred $1,031 in inventory step-up charges. The API segment incurredrestructuring charges of $8,824 and $14,647 for fiscal 2010 and 2009, respectively, which are further discussed inNote 18.
Revenues generated outside the U.S. for fiscal 2011, 2010 and 2009 were $585,648, $469,639 and $437,738,respectively, primarily in Israel, the U.K., Mexico and Australia. The Company attributes revenues to countries outsideof the U.S. based on the location of its customers. As of June 25, 2011 and June 26, 2010, the net book value ofproperty and equipment located outside the U.S. was approximately $180,000 and $154,000, respectively.Approximately $105,000 of property and equipment was located in Israel as of June 25, 2011. One customer in theConsumer Healthcare and Nutritionals segments accounted for 22% of net sales in fiscal 2011, 23% in fiscal 2010and 23% in fiscal 2009.
118

Fiscal 2011
Net sales
Operating income (loss)
Operating income %Total assets
Capital expenditures
Property and equip, netDepreciation/amortization
Fiscal 2010
Net sales
Operating income (loss)
Operating income %
Total assets
Capital expendituresProperty and equip, netDepreciation/amortization
Fiscal 2009
Net sales
Operating income (loss)
Operating income (loss) %Total assets
Capital expenditures
Property and equip, netDepreciation/amortization
ConsumerHealthcare
$1,684,938
$ 293,09717.4%
$1,333,392
$ 59,629$ 286,850$ 37,655
$1,573,749
$ 303,67719.3%
$1,362,366$ 35,670$ 258,619$ 32,881
$1,412,550
$ 240,04817.0%
$1,466,209
$ 41,418$ 231,960$ 33,379
Nutritionals
$ 503,349
$ 68,04013.5 %
$ 992,967
$ 16,186$ 96,098$ 33,480
$ 259,275
$ 2,257
0.9 %
$ 971,879$ 7,770$ 90,489$ 9,337
$ 226,436
$ (6,585)(2.9)%
$ 165,450
$ 4,738$ 24,890$ 4,015
Rx Pharma-ceuticals
$ 343,717
$ 120,36435.0%
$ 448,634
$ 15,329$ 35,510$ 17,686
$ 237,569
$ 48,503
20.4%
$ 429,599$ 6,239$ 21,374$ 17,299
$ 163,947
$ 27,58716.8%
$ 396,786
$ 3,723$ 20,758$ 17,631
API
$ 155,717
$ 37,81924.3%
$ 282,515
$ 4,230$ 75,059$ 10,065
$ 139,980
$ 15,312
10.9%
$ 229,566$ 5,336$ 67,240$ 9,588
$ 135,731
$ 4,0393.0%
$ 234,168
$ 4,348$ 61,587$ 10,366
Other
$ 67,308
$ 1,2661.9%
$ 129,145
$ 4,069$ 13,791$ 4,055
$ 57,577
$ 2,201
3.8%
$ 108,218$ 2,801$ 10,861$ 3,616
$ 66,926
$ 7,94211.9%
$ 89,287
$ 2,722$ 13,147$ 3,846
Unallocatedexpenses
$ —
$ (30,381)—
$ —
$ —$ —$ —
$ —
$ (36,051)—
$ —$ —$ —$ —
$ —
$ (23,543)—
$ —
$ —$ —$ —
Total
$2,755,029
$ 490,20517.8%
$3,186,653
$ 99,443$ 507,308$ 102,941
$2,268,150
$ 335,899
14.8%
$3,101,628$ 57,816$ 448,583$ 72,721
$2,005,590
$ 249,48812.4%
$2,351,900
$ 56,949$ 352,342$ 69,237
The following is a summary of the Company's net sales by major product category:
Consumer Healthcare (CHC) Analgesics Cough/Cold Gastrointestinal Other CHC (1)
Total CHCNutritionalsGeneric prescription drugsActive pharmaceutical ingredientsPharmaceutical and medical diagnostic productsTotal Net Sales
Fiscal 2011
$ 454,679345,992410,940473,327
1,684,938503,349343,717155,71767,308
$ 2,755,029
Fiscal 2010
$ 396,308311,457420,943445,041
1,573,749259,275237,569139,98057,577
$ 2,268,150
Fiscal 2009
$ 351,886285,811376,283398,570
1,412,550226,436163,947135,73166,926
$ 2,005,590
(1) Other CHC consists primarily of smoking cessation, feminine hygiene and miscellaneous or otherwise uncategorized product lines and markets.
NOTE 18 – RESTRUCTURING CHARGES
Florida
In the fourth quarter of fiscal 2011, due to decreased profitability caused by increased competition, the Company made
119

the decision to exit one of the product lines manufactured in its Florida facility. As a result of this restructuring plan, the Company determined that the carrying value of certain fixed assets utilized for this product line was not fully recoverable. Accordingly, the Company incurred a non-cash impairment charge of $693 in its Consumer Healthcare segment in the fourth quarter of fiscal 2011 to reflect the difference between carrying value and the estimated fair value of the affected assets. In addition, the Company incurred charges of $340 for inventory writedowns. Additional charges related to this restructuring plan, if any, are not expected to be material. The charges for asset impairment and inventory writedowns are included in the restructuring line of the consolidated statement of income for fiscal 2011.
In the third quarter of fiscal 2010, due to an evaluation of the current capacity utilization of its U.S. warehousing facilities, the Company made the decision to close its Florida warehousing facility. In connection with this closure, it was determined that the carrying value of certain fixed assets at the location was not fully recoverable. As a result, the Company incurred a non-cash impairment charge of $155 in its Nutritionals segment in the third quarter of fiscal 2010 to reflect the difference between carrying value and the estimated fair value of the affected assets. In addition, the Company incurred charges of $544 related to lease termination costs. The Company does not expect to incur any additional charges related to this restructuring plan. The charges for asset impairment and lease termination costs are included in the restructuring line of the consolidated statement of income for fiscal 2010. The activity of the lease termination costs is detailed in the following table:
Balance at March 27, 2010PaymentsBalance at June 26, 2010PaymentsBalance as of June 25, 2011
Fiscal 2010 RestructuringLease Termination
$ 544(159)
$ 385$ (385)$ —
Germany
In the fourth quarter of fiscal 2009, the Company determined that its German API facility was no longer competitive from a global cost position. At that time, the Company did not anticipate that there would be a viable market for the sale of this facility and related operations, and accordingly, the Company planned to cease all operations at the facility during the first quarter of fiscal 2011. In connection with the planned closure of this facility, it was determined that the carrying value of certain fixed assets at the location was not fully recoverable. As a result, the Company incurred a non-cash impairment charge in its API segment of $5,735 in the fourth quarter of fiscal 2009 to reflect the difference between carrying value and the estimated fair value, based on quoted market prices, of the affected assets. An additional charge of $2,160 was recorded in the fourth quarter of fiscal 2009 related to the removal of fixed assets from the facility for transfer and sale. The Company also recorded a charge of $6,752 related to employee termination benefits for 73 employees.
During the third quarter of fiscal 2010, however, the Company was approached by an external party who offered to buy the German API facility and related operations from the Company. As a result of the third-party offer, subsequent to the third quarter of fiscal 2010, the Company signed an agreement and closed the transaction with the third-party buyer for the sale of the German API facility and related operations.
Due to the change in its original restructuring plan, in the third quarter of fiscal 2010, the Company reversed $6,013 of certain charges it had recognized in the fourth quarter of fiscal 2009 when the restructuring plan was initially put in place. The Company reversed the $2,160 charge related to the removal of fixed assets from the facility, as well as the $3,852 charge related to employee termination benefits, because these items became the responsibility of the buyer. These reversals resulted in a remaining charge of $2,900 related to employee termination benefits, all of which had been paid as of June 26, 2010. In addition, given that as of the end of the third quarter of fiscal 2010 the German API facility and its related operations had not yet been sold but met the held for sale criteria, in accordance with ASC 360, the Company recorded the assets at fair value less the cost to sell. As a result, the Company incurred a $12,788 charge in its API segment in the third quarter of fiscal 2010. In the fourth quarter of fiscal 2010, the Company incurred an additional $2,049 restructuring charge. The net activity of $8,824 discussed above related to the Company’s German restructuring plan is included in the restructuring line of the consolidated statement of income for fiscal 2010.
NOTE 19 – COLLABORATION AGREEMENTS
The Company actively partners with other pharmaceutical companies to collaboratively develop, manufacture and
120

market certain products or groups of products. These types of agreements are not uncommon in the pharmaceuticalindustry. The Company may choose to enter into these types of agreements to, among other things, leverage its orothers’ scientific research and development expertise or utilize its extensive marketing and distribution resources.
In February 2011, the Company announced that it entered into an exclusive agreement with AgaMatrix to sell anddistribute blood glucose monitors and test strips in the U.S. store brand channel. As part of the agreement, the Companywill sell and distribute certain products in the current AgaMatrix portfolio, as well as certain future new products. Underthe terms of the agreement, the Company paid $5,000 to AgaMatrix for a distribution and license agreement, whichhas been accounted for as an intangible asset beginning in the third quarter of fiscal 2011 and is being amortized onan accelerated basis over its eight-year useful life. At the onset of the agreement, AgaMatrix continued to market anddistribute the products during a transition and paid the Company royalty revenue of $524 in fiscal 2011. As of the endof fiscal 2011, the transition period was now over and the Company will begin to market and distribute the productsand in conjunction, will pay AgaMatrix a royalty on its sales. All future royalties will be recorded in costs of goods sold.
In August2010, the Company entered into a royalty-bearing license agreement with Galderma Laboratories (Galderma)to be the authorized generic distributor of Differin®. Under the terms of the agreement, the Company paid a $2,000license fee to Galderma in the second quarter of fiscal 2011, which was capitalized and is being amortized over theexpected life of the agreement. In addition, according to the terms of the agreement, the Company is required to payGalderma a royalty on its sales of the authorized generic version of Differin®, which amounted to $4,519 in fiscal 2011and was recorded in costs of goods sold.
In June 2010, the Company announced it had acquired, through an agreement with Teva, the exclusive U.S. storebrand rights to sell and distribute OTC versions of fexofenadine HCI 180 mg and 60 mg tablets, plus the combinedfexofenadine HCI 60mg and pseudoephedrine 120 mg 12-hour tablets, the generic versions of Sanofi-Aventis' Allegra®
and Allegra D-12® products. Teva Pharmaceutical Industries Ltd. (Teva) had previously settled its patent litigation withthe brand (Sanofi-Aventis) and obtained a license to market these products. Under the terms of the agreement, Tevawill manufacture the products with the Company responsible for marketing and distribution. On January 25, 2011,Sanofi-Aventis announced that the FDA had approved the switch of its Allegra® line of products from an Rx to OTCmarketing authorization. The Company's partner, Teva, was responsible for seeking the necessary OTC approvalsfrom the FDA to enable the launch of fexofenadine 60 mg and 180 mg tablets, and the fexofenadine/pseudoephedrine12-hour product. In April 2011, Teva obtained approval for fexofenadine 60 mg and 180 mg tablets and the Companylaunched store brand fexofenadine 180 mg tablets. According to the terms of the agreement, the Company is requiredto pay Teva a royalty on its sales of fexofenadine 180 mg, which amounted to $1,781 in fiscal 2011 and was recordedin costs of goods sold. The Company will also be required to pay a royalty on sales of the fexofenadine 60 mg andfexofenadine/pseudoephedrine 12-hour should they be launched by the Company.
In May 2010, the Company announced that it has acquired rights to Novel's pending ANDA for the generic version ofHalfLytely® and Bisacodyl Tablets Bowel Prep Kit (PEG-3350, sodium chloride, sodium bicarbonate and potassiumchloride for oral solution and bisacodyl delayed-release tablets) for $5,000, which was expensed as research anddevelopment in the fourth quarter of fiscal 2010. Under the terms of the agreement, Novel will manufacture the productexclusively for the Company and the Company will be responsible for marketing and distribution. Novel receivedtentative approval from the FDA for the generic version of HalfLytely® on May 27, 2010. Under the terms of theagreement, the Company could be required to pay Novel additional development milestones of up to $2,500, pendingfinal approval and successful commercialization, along with royalty payments based on any future sales of the productby the Company.
In April 2010, the Company announced it entered into an agreement with Graceway Pharmaceuticals, LLC (Graceway)to settle all existing patent litigation regarding the Company's ANDAfiling for generic imiquimod cream, 5%, the genericversion of Aldara®. As part of the settlement agreement, the Company was named Graceway's authorized genericdistributor of Aldara® through February of 2011. In September 2010, the Company announced it received FDAapprovalto manufacture and market its own version of imiquimod cream, 5%, which the Company has begun to verticallyintegrate into its API business. According to the terms of the settlement agreement, the Company is required to payGraceway a royalty on its sales of imiquimod cream, which amounted to $31,300 and $12,588 in fiscal 2011 and 2010,respectively, and was recorded in costs of goods sold.
In April 2009, the Company entered into a joint development agreement with Medicis Pharmaceutical Corporation(Medicis). The agreement allows the Company to use its research and development know-how rights to develop anovel proprietary product. The Company recognized $3,345 in revenue during fiscal 2010 and $840 during fiscal 2009related to the agreement. No revenue was recognized in fiscal 2011 related to this agreement. The Company mayrecognize additional revenue related to the same agreement in the future if certain performance criteria are achieved.
121

Further, the Company is entitled to receive royalty payments should Medicis begin selling the product being developed.
In November 2008, the Company acknowledged the settlement of patent litigation relating to a generic to Nasacort®
AQ (triamcinolone acetonide nasal spray) product brought by Sanofi-Aventis against Teva (formerly Barr Laboratories,Inc.), a partner with the Company for this product and the holder of the ANDA. The Company completed certainmilestones with respect to the development of this product in the second fiscal quarter of 2009 that resulted in therecognition of $2,500 in revenue. On July 31, 2009, Teva received FDA final approval for its ANDA. This event triggeredadditional milestone payments to the Company that resulted in the recognition of an additional $11,500 and $9,000 ofrevenue in fiscal 2010 and 2011, respectively. The product, which is being supplied by the Company, was launchedby Teva in June 2011, at which time the Company began recording revenue from its share of the net profits from Teva'sproduct sales.
In October 2008, the Company entered into a licensing, manufacturing and supply agreement with MedimetriksPharmaceuticals (Medimetriks). The Company owns certain intellectual property and know-how rights related to thefollowing dermatology products: mupirocin ointment 2% (Centany®), urea 20% and ammonium lactate 12% foam(combination foam), urea 20% and ammonium lactate 12% medicated soap/wash (combination soap). Medimetrikshas experience in selling and marketing dermatology products. The Company recognized $500 and $2,000 in revenueduring fiscal 2010 and 2009, respectively, related to the agreement with Medimetriks. The Company may recognizeadditional revenue related to the same agreement in the future if certain performance criteria are achieved. Further,the Company is entitled to receive royalty payments on sales of the products by Medimetriks. The Company recognizedroyalty revenue in the amount of $260 in fiscal 2011.
In September 2008, the Company announced that it had acquired the exclusive U.S. rights to sell and distributelevocetirizine tablets, the generic version of UCB's Xyzal® tablets. In addition, in October 2008, the Company enteredinto a separate agreement to acquire the exclusive U.S. rights to sell and distribute levocetirizine solution 2.5 mg/5ml,the generic version of UCB's Xyzal® solution 2.5 mg/5ml. Under the terms of the agreements, in exchange for thesales and marketing rights on Synthon's levocetirizine products, the Company has paid a total of $2,500 in licensefees of which $1,000, $500 and $1,000 were paid in fiscal 2011, 2010 and 2009, respectively. In November 2010,Synthon received final FDA approval on its generic version of levocetirizine tablets and the Company launched theproduct. Under the terms of the agreement, the Company is required to pay Synthon a royalty on its sales of levocetirizinetablets, which amounted to $5,111 in fiscal 2011 and was recorded in costs of goods sold. In May 2011, the Companyannounced that Synthon had received tentative approval from the FDA for its ANDA for levocetirizine solution 2.5mg/5ml. Once launched, the Company will pay a royalty to Synthon based on the Company's sales of the product.
In May 2008, the Company entered into a collaborative agreement with Cobrek Pharmaceuticals (Cobrek), a newlyformed entity of Pentech Pharmaceuticals Inc. (Pentech), a privately owned company that specializes in the researchand development of niche generic dosage forms. Pentech contributed its ANDAfiling for a generic equivalent to Luxiq®
foam, a $34,000 branded pharmaceutical product, to the agreement. The Company contributed two of its early stagegeneric topical pipeline products. Thiscollaborative agreement was amended during fiscal 2009 to include two additionalproducts. The Company recognized revenue of $750 during fiscal 2010 and $1,450 during fiscal 2009 related to thejoint development of these two additional products. No revenue was recognized related to the agreement in fiscal2011. The parties will share the development costs and profits generated by these products, with the Company beingthe exclusive distributor of the collaboration products. In fiscal 2008, the Company invested $12,500 in cash in Cobrek,accounted for on the cost method, in exchange for a minority, noncontrolling ownership position in the company.
On March 31, 2010, the FDA approved one of the pipeline products contained in the Company’s agreement withCobrek, a generic to Evoclin® foam, which had been submitted to the FDA in August 2008 with a Paragraph IVcertification. Upon receipt of the FDA approval, the Company immediately commenced shipping of the product. Inaddition, the Company and Cobrek have reached an agreement in principle to settle the underlying Hatch-Waxmanlitigation brought by Stiefel. In accordance with the terms of the agreement, the Company and Cobrek each paid Stiefela settlement fee of $1,250 and continued to ship product until April 2, 2010. The Company expensed this fee in thefourth quarter of fiscal 2010. Additionally, according to the terms of the settlement, during fiscal 2011 the Companyand Cobrek shared equally in the payment of a$5,500 fee to Stiefel in exchange for a royalty-bearing license underpatents owned or controlled by Stiefel, which allowed the Company to recommence shipments of the product onOctober 1, 2010. The Company's portion of this payment was capitalized and is being amortized over the life of thelicense. Royalty payments to Stiefel amounted to $2,994 in fiscal 2011 and were recorded in costs of goods sold.
Item 9. Changes in and Disagreements With Accountants on Accounting and Financial Disclosure.
Not applicable.
122

Item 9A. Controls and Procedures.
(a) Conclusion Regarding the Effectiveness of Disclosure Controls and Procedures
As of June 25, 2011, the Company’s management, including its Chief Executive Officer and its Chief Financial Officer,carried out an evaluation of the effectiveness of the Company’s disclosure controls and procedures pursuant to Rule13a-15(b) of the Securities Exchange Act of 1934. Based on that evaluation, the Chief Executive Officer and the ChiefFinancial Officer concluded that the Company’s disclosure controls and procedures are effective in ensuring that allmaterial information relating to the Company and its consolidated subsidiaries required to be included in the Company’speriodic SEC filings would be made known to them by others within those entities in a timely manner and that nochanges are required at this time.
(b) Management’s Annual Report on Internal Control Over Financial Reporting
Pursuant to Section 404 of the Sarbanes-Oxley Act of 2002, the Company has included a report of management’sassessment of the design and effectiveness of its internal control as part of this Form 10-K. The independent registeredpublic accounting firm of Ernst & Young LLP also attested to, and reported on, the effectiveness of the Company’sinternal control over financial reporting. Management’s report and the independent registered public accounting firm’sattestation report are included in this Form 10-K under the captions entitled “Management’s Report on Internal Controlover Financial Reporting” and “Report of Independent Registered Public Accounting Firm” and are incorporated hereinby reference.
In connection with the evaluation by the Company’s management, including its Chief Executive Officer and ChiefFinancial Officer, of the Company’s internal control over financial reporting pursuant to Rule 13a-15(d) of the SecuritiesExchange Act of 1934, no changes during the quarter ended June 25, 2011were identified that have materially affected,or are reasonably likely to materially affect, the Company’s internal control over financial reporting except as notedbelow:
Changes in Internal Control Over Financial Reporting
The Company acquired PBM Holdings, Inc (PBM) on April 30, 2010. During fiscal 2011, the Company evaluated andcompleted its integration of PBM's operations, policies and processes into its overall system of internal control overfinancial reporting.
Item 9B. Other Information.
Not applicable.
PART III. Item 10. Directors, Executive Officers and Corporate Governance.
(a) Directors of the Company.This information is incorporated by reference to the Company’s Proxy Statement for the 2011 Annual Meeting
under the heading “Proposal 1 – Election of Directors”.
(b) Executive Officers of the Company.See Part I, Additional Item of this Form 10-K.
(c) Audit Committee Financial Expert.
This information is incorporated by reference to the Company’s Proxy Statement for the 2011 Annual Meetingunder the heading “Board of Directors and Committees”.
(d) Identification and Composition of the Audit Committee.This information is incorporated by reference to the Company’s Proxy Statement for the 2011 Annual Meeting
under the heading “Board of Directors and Committees”.
(e) Compliance with Section 16(a) of the Exchange Act.This information is incorporated by reference to the Company’s Proxy Statement for the 2011 Annual Meeting
under the heading “Section 16(a) Beneficial Ownership Reporting Compliance”.123

(f) Code of Ethics.
This information is incorporated by reference to the Company’s Proxy Statement for the 2011 Annual Meetingunder the heading “Corporate Governance”.
Item 11. Executive Compensation.
This information is incorporated by reference to the Company’s Proxy Statement for the 2011 Annual Meeting underthe headings “Executive Compensation”, “Compensation Committee Report”, “Potential Payments Upon Terminationor Change in Control” and “Director Compensation”. Item 12. Security Ownership of Certain Beneficial Owners and Management and Related Stockholder Matters.
This information is incorporated by reference to the Company’s Proxy Statement for the 2011 Annual Meeting underthe heading “Ownership of Perrigo Common Stock”. Information concerning equity compensation plans is incorporatedby reference to the Company’s Proxy Statement for the 2011 Annual Meeting under the heading “Equity CompensationPlan Information”. Item 13. Certain Relationships and Related Transactions, and Director Independence.
This information is incorporated by reference to the Company’s Proxy Statement for the 2011 Annual Meeting underthe heading “Certain Relationships and Related Party Transactions” and “Corporate Governance”. Item 14. Principal Accountant Fees and Services.
This information is incorporated by reference to the Company’s Proxy Statement for the 2011 Annual Meeting underthe heading “Proposal 4 – Ratification of Our Independent Registered Public Accounting Firm”.
124

PART IV. Item 15. Exhibits and Financial Statement Schedules. (a) The following documents are filed or incorporated by reference as part of this Form 10-K:
1. All financial statements. See Index to Consolidated Financial Statements.
2. Financial Schedules.Schedule II – Valuation and Qualifying Accounts.
Schedules other than the one listed are omitted because the required information is included in the footnotes, immaterial or not applicable.
3. Exhibits:
2.1
2.2
2.3
3.1
3.2
4.1
10.1*
10.2*
10.3*
10.4*
10.5*
Agreement and Plan of Merger, dated as of November 14, 2004, among Perrigo Company, Agis Industries(1983) Ltd. and Perrigo Israel Opportunities Ltd., incorporated by reference from Appendix A to theRegistrant’s Proxy Statement/Prospectus included in the Registrant’s Registration Statement on FormS-4 (No. 333-121574) filed and declared effective on February 14, 2005.
Merger Agreement, dated as of March 22, 2010, by and among PBM Holdings, Inc., PBM Nutritionals,LLC, Perrigo Company, Pine Holdings Merger Sub, Inc., Pine Nutritionals Merger Sub, Inc., and PBMStakeholders, LLC, as the Stakeholders’ Representative, incorporated by reference from Exhibit 2.1 tothe Registrant’s Current Report on Form 8-K filed on March 24, 2010.
Purchase Agreement, dated as of January 20, 2011, among Perrigo Company, Paddock Laboratories,Inc., Paddock Properties Limited Partnership, and, solely for the purposes of Section 11.15, certainGuarantors listed on Exhibit A, incorporated by reference from Exhibit 2.1 to the Registrant’s CurrentReport on Form 8-K filed on January 26, 2011.
Amended and Restated Articles of Incorporation of Perrigo Company, as amended, incorporated byreference from Exhibit 3(a) to the Registrant’s Quarterly Report on Form 10-Q (No. 000-19725) filed onFebruary 2, 2005.
Restated Bylaws of Perrigo Company, as amended through June 1, 2009, incorporated by reference fromExhibit 3.1 to the Registrant’s Current Report on Form 8-K (No. 000-19725) filed on June 2, 2009.
Registration Rights Agreement, dated as of November 14, 2004, between Perrigo Company and MosheArkin, incorporated by reference from AppendixH to the Registrant’s Proxy Statement/Prospectus includedin the Registrant’s Registration Statement on Form S-4 (No. 333-121574) filed on February 11, 2005.
Registrant’s 2003 Long-Term Incentive Plan, effective October 29, 2003, as amended, incorporated byreference from the Appendix to the Registrant’s Proxy Statement (No. 000-19725) for its 2003 AnnualMeeting of Shareholders filed on September 26, 2003.
Registrant’s Employee Stock Option Plan, as amended, incorporated by reference from Exhibit 10(b) tothe Registrant’s Annual Report on Form 10-K (No. 000-19725) filed on September 18, 2002.
Registrant’s 1989 Non-Qualified Stock Option Plan for Directors, as amended, incorporated by referencefrom Exhibit B to the Registrant’s Proxy Statement (No. 000-19725) for its 1997 Annual Meeting ofShareholders, as amended at the Annual Meeting of Shareholders on October 31, 2000.
Registrant’s Nonqualified Deferred Compensation Plan, dated December 31, 2001, as amended,incorporated by reference from Exhibit 10(m) to the Registrant’s Quarterly Report on Form 10-Q (No.000-19725) filed on January 24, 2002.
Employment Agreement, dated as of November 14, 2004, among Perrigo Company,Agis Industries (1983)Ltd. and Refael Lebel, incorporated by reference from Exhibit 10.2 to the Registrant’s Current Report onForm 8-K (No. 000-19725) filed on March 22, 2005.
125

10.6
10.7
10.8
10.9
10.10
10.11*
10.12
10.13
10.14
10.15
10.16
10.17*
10.18*
10.19*
Credit Agreement, dated as of March 16, 2005, among Perrigo Company, the Foreign SubsidiaryBorrowers, JPMorgan Chase Bank, N.A., as administrative agent, Bank Leumi USA, as syndication agent,and Bank of America, N.A., Standard Federal Bank N.A. and National City Bank of the Midwest, asdocumentation agents, incorporated by reference from Exhibit 10(b) to the Registrant’s Quarterly Reporton Form 10-Q (No. 000-19725) filed on May 5, 2005.
Letter of Undertaking of Perrigo Israel Holdings Ltd., dated March 16, 2005, incorporated by referencefrom the Registrant’s Quarterly Report on Form 10-Q (No. 000-19725) filed on May 5, 2005.
Cash Collateral Pledge Agreement, dated as of March 16, 2005, between Perrigo International, Inc., asPledgor, and Bank Hapoalim B.M, incorporated by reference from the Registrant’s Quarterly Report onForm 10-Q (No. 000-19725) filed on May 5, 2005.
Guaranty of Perrigo International, Inc., dated March 16, 2005, incorporated by reference from theRegistrant’s Quarterly Report on Form 10-Q (No. 000-19725) filed on May 5, 2005.
Contract, dated as of December 19, 2001, between Arkin Real Estate Holdings (1961) Ltd. and AgisIndustries (1983) Ltd., incorporated by reference from Exhibit 10(f) to the Registrant’s Quarterly Reporton Form 10-Q (No. 000-19725) filed on May 5, 2005.
Form of Non-Qualified Stock Option Agreement, incorporated by reference from Exhibit 10(a) to theRegistrant’s Quarterly Report on Form 10-Q (No. 000-19725) filed on February 2, 2005.
Nominating Agreement, dated as of November 14, 2004, between Perrigo Company and Moshe Arkin,incorporated by reference from Appendix F to the Registrant’s Proxy Statement/Prospectus included inthe Registrant’s Registration Statement on Form S-4 (No. 333-121574) filed and declared effective onFebruary 14, 2005.
Amendment to Nominating Agreement, dated as of July 12, 2005, between Perrigo Company and MosheArkin, incorporated by reference from Exhibit 10.2 to the Registrant’s Current Report on Form 8-K (No.000-19725) filed on July 18, 2005.
Amendment No. 2 to Nominating Agreement, dated as of September 10, 2005, between Perrigo Companyand Moshe Arkin, incorporated by reference from Exhibit 10.1 to the Registrant’s Current Report on Form8-K (No. 000-19725) filed on September 14, 2005.
First Amendment, dated as of September 30, 2005, to Credit Agreement, dated as of March 16, 2005,among Perrigo Company, the Foreign Subsidiary Borrowers, JPMorgan Chase Bank, N.A., asAdministrative Agent for the Lenders, Bank Leumi USA, as Syndication Agent, and Bank of America, N.A.,Standard Federal Bank N.A. and National City Bank of the Midwest, as Documentation Agents,incorporated by reference from Exhibit 10(a) to the Registrant’s Quarterly Report on Form 10-Q (No.000-19725) filed on October 27, 2005.
Foreign Subsidiary Borrower Agreement, dated as of September 26, 2005, among Chemagis (Germany)GmbH, Perrigo Company and JPMorgan Chase Bank, N.A., as Administrative Agent, pursuant to theCredit Agreement, dated as of March 16, 2005, among Perrigo Company, the Foreign SubsidiaryBorrowers, JPMorgan Chase Bank, N.A., as AdministrativeAgent,Bank Leumi USA, as Syndication Agent,and Bank of America, N.A., Standard Federal Bank N.A. and National City Bank of the Midwest, asDocumentation Agents, incorporated by reference from Exhibit 10(b) to the Registrant’s Quarterly Reporton Form 10-Q (No. 000-19725) filed on October 27, 2005.
Amendment to the 2003 Long-Term Incentive Plan, effective as of October 28, 2005, incorporated byreference from Exhibit 10(a) to the Registrant’s Current Report on Form 8-K (No. 000-19725) filed onNovember 3, 2005.
Form of Long-Term Incentive Award Agreement, incorporated by reference from Exhibit 10.1 to theRegistrant’s Current Report on Form 8-K (No. 000-19725) filed on August 22, 2006.
Employment Agreement, dated as of September 8, 2006, by and between Perrigo Company and JosephC. Papa, incorporated by reference from Exhibit 10.1 to the Registrant’s Current Report on Form 8-K (No.000-19725) filed on September 12, 2006.
126

10.20
10.21*
10.22*
10.23*
10.24*
10.25*
10.26*
10.27*
10.28*
10.29*
10.30
10.31
10.32
Second Amendment, dated as of October 30, 2006, to Credit Agreement, dated as of March 16, 2005,among Perrigo Company, the Foreign Subsidiary Borrowers, JPMorgan Chase Bank, N.A., asAdministrative Agent for the Lenders, Bank Leumi USA, as Syndication Agent, and Bank of America, N.A.,LaSalle Bank Midwest National Association, formerly known as Standard Federal Bank N.A. and NationalCity Bank of the Midwest, as Documentation Agents, incorporated by reference from Exhibit 10.1 to theRegistrant’s Current Report on Form 8-K (No. 000-19725) filed on November 2, 2006.
Form of Indemnity Agreement, incorporated by reference from Exhibit 10(d) to the Registrant’s QuarterlyReport on Form 10-Q (No. 000-19725) filed on November 9, 2006.
Form of Long-Term Incentive Award Agreement, incorporated by reference from Exhibit 10(a) to theRegistrant’s Quarterly Report on Form 10-Q (No. 000-19725) filed on February 1, 2007.
Registrant’s 2003 Long-Term Incentive Plan, as amended as of February 7, 2007, incorporated byreference from Exhibit 10(a) to the Registrant’s Quarterly Report on Form 10-Q (No. 000-19725) filed onMay 8, 2007.
Form of Restricted Stock Agreement (Under the Registrant’s2003 Long-TermIncentive Plan), incorporatedby reference from Exhibit 10(c) to the Registrant’s Quarterly Report on Form 10-Q (No. 000-19725) filedon May 8, 2007.
Form of Long-Term Incentive Award Agreement (Under the Registrant’s 2003 Long-Term Incentive Plan),incorporated by reference from Exhibit 10(d) to the Registrant’s Quarterly Report on Form 10-Q (No.000-19725) filed on May 8, 2007.
Form of Restricted Stock Agreement (For Approved Section 102 Awards), incorporated by reference fromExhibit 10(e) to the Registrant’s Quarterly Report on Form 10-Q (No. 000-19725) filed on May 8, 2007.
Form of 2006 Long-Term Incentive Award Agreement, For Approved Section 102 Awards (Under theRegistrant’s 2003 Long-Term Incentive Plan), incorporated by reference from Exhibit 10(f) to theRegistrant’s Quarterly Report on Form 10-Q (No. 000-19725) filed on May 8, 2007.
Form of 2006 Long-Term Incentive Award Agreement (Under the Registrant’s 2003 Long-Term IncentivePlan), incorporated by reference from Exhibit 10(g) to the Registrant’s Quarterly Report on Form 10-Q(No. 000-19725) filed on May 8, 2007.
Registrant’s Nonqualified Deferred Compensation Plan, as amended as of October 10, 2007 and effectiveJanuary 1, 2007, incorporated by reference from Exhibit 10.1 to the Registrant’s Current Report on Form8-K (No. 000-19725) filed on October 11, 2007.
Third Amendment, dated as of July 31, 2007, to Credit Agreement, dated as of March 16, 2005, amongPerrigo Company, the Foreign Subsidiary Borrowers named therein, the Lenders party thereto, JPMorganChase Bank, N.A., as Administrative Agent for the Lenders, Bank Leumi USA, as Syndication Agent, andBank of America, N.A., LaSalle Bank Midwest National Association and National City Bank of the Midwest,as Documentation Agents, incorporated by reference from Exhibit 10.1 to the Registrant’s Quarterly Reporton Form 10-Q (No. 000-19725) filed on May 6, 2008.
Fourth Amendment, dated as of January 8, 2008, to Credit Agreement, dated as of March 16, 2005, amongPerrigo Company, the Foreign Subsidiary Borrowers named therein, the Lenders party thereto, JPMorganChase Bank, N.A., as Administrative Agent for the Lenders, Bank Leumi USA, as Syndication Agent, andBank of America, N.A., LaSalle Bank Midwest National Association and National City Bank of the Midwest,as Documentation Agents, incorporated by reference from Exhibit 10.2 to the Registrant’s Quarterly Reporton Form 10-Q (No. 000-19725) filed on May 6, 2008.
Fifth Amendment, dated as of April 22, 2008, to Credit Agreement, dated as of March 16, 2005, amongPerrigo Company, the Foreign Subsidiary Borrowers named therein, the Lenders party thereto, JPMorganChase Bank, N.A., as Administrative Agent for the Lenders, Bank Leumi USA, as Syndication Agent, andBank of America, N.A., LaSalle Bank Midwest National Association and National City Bank of the Midwest,as Documentation Agents, incorporated by reference from Exhibit 10.1 to the Registrant’s Current Reporton Form 8-K (No. 000-19725) filed on April 25, 2008.
127

10.33
10.34*
10.35*
10.36*
10.37
10.38*
10.39*
10.40*
10.41*
10.42*
10.43*
10.44*
10.45*
10.46*
10.47
Term Loan Agreement, dated as of April 22, 2008, with JPMorgan Chase Bank, N.A., as administrativeagent, RBS Citizens, N.A., as syndication agent, and the Lenders party thereto, incorporated by referencefrom Exhibit 10.2 to the Registrant’s Current Report on Form 8-K (No. 000-19725) filed on April 25, 2008.
Amendment to Employment Agreement, dated as of May 1, 2008, by and between Perrigo Company,Perrigo Israel Pharmaceuticals, Ltd., and Refael Lebel, incorporated by reference from Exhibit 10.3 to theRegistrant’s Quarterly Report on Form 10-Q (No. 000-19725) filed on May 6, 2008.
Noncompetition and Nondisclosure Agreement, dated as of May 1, 2008, by and between PerrigoCompany, Perrigo Israel Pharmaceuticals, Ltd., and Refael Lebel, incorporated by reference from Exhibit10.4 to the Registrant’s Quarterly Report on Form 10-Q (No. 000-19725) filed on May 6, 2008.
Consulting Agreement, dated as of May 1, 2008, by and between Perrigo Company, Moshe Arkin, and M.Arkin Ltd., incorporated by reference from Exhibit 10.5 to the Registrant’s Quarterly Report on Form 10-Q (No. 000-19725) filed on May 6, 2008.
Master Note Purchase Agreement,dated as of May 29, 2008, among Perrigo Company and the Purchaserslisted therein, incorporated by reference from Exhibit 10.1 to the Registrant’s Current Report on Form 8-K (No. 000-19725) filed on May 30, 2008.
Employment Agreement, dated as of November 14, 2004, by and between Perrigo Company, AgisIndustries (1983) Ltd. and Sharon Kochan, incorporated by reference from Exhibit 10(xx) to the Registrant’sAnnual Report on Form 10-K filed on August 18, 2008.
Amendment to Employment Agreement, dated as of March 17, 2005, by and between Perrigo Company,Agis Industries (1983) Ltd. and Sharon Kochan, incorporated by reference from Exhibit 10(yy) to theRegistrant’s Annual Report on Form 10-K filed on August 18, 2008.
Addendum to Employment Agreement between Sharon Kochan, Perrigo Company and Agis Industries(1983) Ltd., dated as of July 16, 2007, by and between Perrigo Company and Sharon Kochan, incorporatedby reference from Exhibit 10(zz) to the Registrant’s Annual Report on Form 10-K filed on August 18, 2008.
Registrant’s Annual Incentive Plan, adopted November 4, 2008, incorporated by reference from theRegistrant’s Proxy Statement (No. 000-19725) for its 2008 Annual Meeting of Shareholders filed onOctober 1, 2008.
Registrant’s 2008 Long-Term Incentive Plan, adopted November 4, 2008, incorporated by reference fromExhibit 10(b) to the Registrant’s Quarterly Report on Form 10-Q (No. 000-19725) filed on February 3,2009.
Forms of Non-Qualified Stock Option Agreement pursuant to Registrant’s 2008 Long-Term Incentive Plan,incorporated by reference from Exhibit 10(c) to the Registrant’s Quarterly Report on Form 10-Q (No. 000-19725) filed on February 3, 2009.
Forms of Restricted Stock Agreement pursuant to Registrant’s 2008 Long-Term Incentive Plan,incorporated by reference from Exhibit 10(d) to the Registrant’s Quarterly Report on Form 10-Q (No.000-19725) filed on February 3, 2009.
Forms of Non-Qualified Stock Option Agreement pursuant to Registrant’s 2008 Long-Term Incentive Plan,incorporated by reference from Exhibit 10.49 to the Registrant’s Annual Report on Form 10-K filed onAugust 18, 2009.
Forms of Restricted Stock Unit Award Agreement pursuant to Registrant’s 2008 Long-TermIncentive Plan,incorporated by reference from Exhibit 10.50 to the Registrant’s Annual Report on Form 10-K filed onAugust 18, 2009.
Annex to Lease, dated January 19, 2008, between Arkin Real Estate Holdings (1961) Ltd. and AgisIndustries (1983) Ltd., incorporated by reference from Exhibit 10.51 to the Registrant’s Quarterly Reporton Form 10-Q filed on April 29, 2010.
128

10.48
10.49
10.50
10.51
10.52*
18.1
18.2
21
23
24
31
32
101.INS
101.SCH
101.CAL
101.DEF
101.LAB
101.PRE
First Supplement to Master Note Purchase Agreement, dated as of April 30, 2010, by and between PerrigoCompany and the Purchasers listed therein, incorporated by reference from Exhibit 10.4 to the Registrant’sCurrent Report on Form 8-K filed on May 5, 2010.
First Amendment, dated as of October 8, 2010, to Term Loan Agreement, dated as of April 22, 2008,among Perrigo Company, JPMorgan Chase Bank, N.A., as Administrative Agent; RBS Citizens, N.A., asSyndication Agent; and the lender parties therein listed, incorporated by reference from Exhibit 10.1 tothe Registrant’s Current Report on Form 8-K filed on October 14, 2010.
Credit Agreement, dated as of October 8, 2010, among Perrigo Company and certain of its subsidiaries,JPMorgan Chase Bank, N.A., as Administrative Agent; Bank of America, N.A. and Wells Fargo Bank,National Association, as Syndication Agents; HSBC Bank USA, National Association, Fifth Third Bankand Bank Leumi USA, as Documentation Agents; and the lender parties therein listed, incorporated byreference from Exhibit 10.2 to the Registrant’s Current Report on Form 8-K filed on October 14, 2010.
Term Loan Agreement, dated as of January 20, 2011, among Perrigo Company; JPMorgan Chase Bank,N.A., as Administrative Agent; Morgan Stanley Senior Funding, Inc. and Bank of America, N.A., asSyndication Agents; and the lender parties therein listed, incorporated by reference from Exhibit 10.1 tothe Registrant’s Current Report on Form 8-K filed on January 26, 2011.
Forms of Restricted Stock Unit Award Agreement pursuant to Registrant’s 2008 Long-TermIncentive Plan.
Preferability letter from Ernst & Young LLP on change in date of annual goodwill and indefinite-livedintangible assets impairment testing performed by the Company, incorporated by reference fromExhibit 18.1 to the Registrant’s Quarterly Report on Form 10-Q filed on April 29, 2010.
Preferability letter from Ernst & Young LLP on elimination of one-month reporting lag for the Company'sforeign subsidiaries, incorporated by reference from Exhibit 18.1 to the Registrant’s Quarterly Report onForm 10-Q filed on November 2, 2010.
Subsidiaries of the Registrant.
Consent of Ernst & Young LLP.
Power of Attorney (see signature page).
Rule 13a-14(a) Certifications.
Section 1350 Certifications.
XBRL Instance Document.
XBRL Taxonomy Extension Schema Document.
XBRL Taxonomy Extension Calculation Linkbase Document.
XBRL Taxonomy Extension Definition Linkbase Document.
XBRL Taxonomy Extension Label Linkbase Document.
XBRL Taxonomy Extension Presentation Linkbase Document.* Denotes management contract or compensatory plan or arrangement.
(b) Exhibits.The response to this portion of Item 15 is submitted as a separate section of this Report. See Item 15(a)(3) above.
(c) Financial Statement Schedules.
The response to this portion of Item 15 is submitted as a separate section of this Report. See Item 15(a)(2) above.
129

SCHEDULE II – VALUATION AND QUALIFYING ACCOUNTS
PERRIGO COMPANY(in thousands)
DescriptionYear Ended June 27, 2009:Allowances deducted from asset accounts:
Allowances for doubtful accountsYear Ended June 26, 2010:Allowances deducted from asset accounts:
Allowances for doubtful accountsYear Ended June, 25, 2011:Allowances deducted from asset accounts:
Allowances for doubtful accounts
Balance atBeginning of
Period
$ 7,537
$ 12,757
$ 8,015
Net Bad DebtExpenses
$ 3,842
$ (3,955)
$ (935)
Deductions(1)
$ (1,378)
$ 787
$ 757
Balance atEnd ofPeriod
$ 12,757
$ 8,015
$ 7,837
(1) Uncollectible accounts charged off, net of recoveries. Includes effects of changes in foreign exchange rates.
130

SIGNATURES
Pursuant to the requirements of Section 13 or 15(d) of the Securities Exchange Act of 1934, the Registrant has dulycaused this Annual Report on Form 10-K for the fiscal year ended June 25, 2011 to be signed on its behalf by theundersigned, thereunto duly authorized in the City of Allegan, State of Michigan on the 16th of August 2011.
PERRIGO COMPANY
By: /s/ Joseph C. PapaJoseph C. PapaChairman, President andChief Executive Officer
POWER OF ATTORNEY
Each person whose signature appears below hereby appoints Joseph C. Papa, Judy L. Brown and Todd W. Kingmaand each of them severally, acting alone and without the other, his true and lawful attorney-in-fact with authority toexecute in the name of each such person, and to file with the Securities and Exchange Commission, together withany exhibits thereto and other documents therewith, any and all amendments to this Annual Report on Form 10-K forthe fiscal year ended June 25, 2011 necessary or advisable to enable Perrigo Company to comply with the SecuritiesExchange Act of 1934, any rules, regulations and requirements of the Securities and Exchange Commission in respectthereof, which amendments may make such other changes in the report as the aforesaid attorney-in-fact executingthe same deems appropriate.
Pursuant to the requirements of the Securities Exchange Act of 1934, this Annual Report on Form 10-K for the fiscalyear ended June 25, 2011 has been signed below by the following persons on behalf of the Registrant and in thecapacities indicated on August 16, 2011.
131

Signature
/s/ Joseph C. PapaJoseph C. Papa
/s/ Judy L. BrownJudy L. Brown
/s/ Moshe ArkinMoshe Arkin
/s/ Laurie BrlasLaurie Brlas
/s/ Gary M. CohenGary M. Cohen
/s/ David T. GibbonsDavid T. Gibbons
/s/ Ran GottfriedRan Gottfried
/s/ Ellen R. HoffingEllen R. Hoffing
/s/ Michael J. JandernoaMichael J. Jandernoa
/s/ Gary K. Kunkle, Jr.Gary K. Kunkle, Jr.
/s/ Herman Morris, Jr.Herman Morris, Jr.
/s/ Ben-Zion ZilberfarbBen-Zion Zilberfarb
Title
President and Chief Executive Officer(Principal Executive Officer and Chairman of the Board)
Executive Vice President and Chief Financial Officer(Principal Accounting and Financial Officer)
Director
Director
Director
Director
Director
Director
Director
Director
Director
Director
132

EXHIBIT INDEX
Exhibit
10.52
21
23
31
32
101.INS
101.SCH
101.CAL
101.DEF
101.LAB
101.PRE
Document
Forms of Restricted Stock Unit Award Agreement pursuant to Registrant's 2008 Long-Term IncentivePlan.
Subsidiaries of the Registrant.
Consent of Ernst & Young LLP.
Rule 13a-14(a) Certifications.
Section 1350 Certifications.
XBRL Instance Document.
XBRL Taxonomy Extension Schema Document.
XBRL Taxonomy Extension Calculation Linkbase Document.
XBRL Taxonomy Extension Definition Linkbase Document.
XBRL Taxonomy Extension Label Linkbase Document.
XBRL Taxonomy Extension Presentation Linkbase Document.
133