
Grand Traverse County - Networks Northwest
126
Grand Traverse County Growth & Investment Area Study And Commercial Corridor Inventory 2014 Edition Release Date: 10/22/2014
Transcript of Grand Traverse County - Networks Northwest

Grand Traverse County Growth & Investment Area Study And Commercial Corridor Inventory
2014 Edition Release Date: 10/22/2014

Acknowledgements
Networks Northwest would like to thank all of the people who gave their time and resources towards the devel-opment of the Growth & Investment Area Study and Commercial Corridor Inventory project.
Prepared by:
PO Box 506 Traverse City, MI 49685-0506 www.networksnorthwest.org
With funding from:
Financial assistance for this project was provided, in part, by the State of Michigan’s Regional Prosperity Initia-tive.
The State of Michigan’s Regional Prosperity Initiative was enacted to encourage local private, public and non-profit partners to create vibrant regional economies. Included in the Governor’s FY 2014 Executive Budget Recommendation, the legislature approved the recommended process and the Regional Prosperity Initiative was signed into law as a part of the FY 2014 budget (PA 59 2013).
2014

Table of Contents
Introduction i Map of Growth & Investment Areas in Northwest Michigan ii
Growth &Investment Areas Elements of Identification iii Commercial Corridor Inventory Interviews iii Focus for Growth & Investment Study iv
Growth & Investment Readiness Assessments Original Selection Criteria v Census Data Criteria v Zoning Policy Criteria vi Placemaking Criteria vi Opportunity Criteria vii Infrastructure Criteria vii
Map Legends Growth & Investment Area Maps Legend ix Commercial Corridor Maps Legend x
Growth & Investment Area & Commercial Corridor Datasheets Fife Lake 1
23 Fife Lake US131 Corridor 9 24 Fife Lake State Street Corridor 11
Interlochen 13 22 Green Lake Interlochen Gateway 21
Kingsley 23 25 Kingsley Downtown CBD 31 26 Kingsley M113 Corridor 33
Traverse City 35 27 Traverse City CBD Union Street Corridor 43 28 Traverse City CBD Front/State Street Corridor 45 29 Traverse City CBD Cass Street Corridor 47 30 Traverse City CBD Eighth Street Corridor 49 31 Traverse City CBD Boardman Ave. Corridor 51 32 Traverse City CBD Woodmere Ave Corridor 53 33 Traverse City CBD Warehouse District 55 34 Traverse City Division Street Neighborhood Commercial Corridor 57 35 Traverse City 14th Street Corridor 59 36 Traverse City 8th Street Corridor 61 37 Traverse City Garfield Avenue Corridor 63 38 Traverse City East Front Street 65 39 Traverse City West Front Street 67 40 Traverse City US 31 Corridor 69 41 Traverse City M22/M72 Corridor 71

Table of Contents
Traverse City (cont.) 42 Traverse CIty Munson Ave Corridor 73 21 Blair Chums Corner/Grawn Corridor 75 43 Acme US31/M72 Acme Shores Corridor 77 44 East Bay Miracle Mile Corridor 79 45 East Bay 3 Mile & Hammond Corridor 81 46 Elmwood Cherry Bend Corridor 83 47 Garfield South Airport Corridor 85 48 Garfield Barlow Park Corridor 87 49 Garfield Cass Road Corridor 89
Methodology Growth & Investment Area Study
Summary Info 91 Population & Housing Trends 97 Commercial Corridors 97 Housing Data 98 Personal Income 99 Policy 99 Zoning 99 Infrastructure 100 Placemaking Elements 100 Talent Jobshed 101 Retail Activity 103
Commercial Corridor Datasheets Summary Info 104 Corridor Overview 105 Corridor Segment and Surrounding 1/4 Mile Study Area Map 106 Economic Development 106 Study Area Summary for 1/4 Mile Area Surrounding the Corridor 106 Zoning 107 Infrastructure 107 Policy 107 Traffic Counts 107 Placemaking Elements 108
References 109
Release Notes 111

Introduction page i
Introduction The vitality of our villages and cities and their central business districts and commercial corridors is a critical part of what determines our standard of living in Northwest Michigan. Without economically via-ble and vibrant commercial areas our ability to earn a living, purchase goods and services, and learn of new opportunities would fail to meet our expectations and needs. Lending support to the self-evident importance of our Northwest Michigan villages’ and cities’, is a wealth of economic studies that demon-strate the positive impacts that concentrating people and economic activity can have for lifting real wages and elevating our quality of life. To provide the best foundation for our citizens to maximize their individual potentials it is essential that these areas attract growth and investment as the area grows.
The disciplines of planning and economic development imply the ability to analyze a situation and gauge the effectiveness of policy choices. The complexity of our interactions has always been a difficult mountain to climb for discovering which policies lead to successful outcomes. However, we gain better tools to help us sort through the complexities every year. Today’s Apple iPad has the computing power of a super computer from 20 years ago. Increasingly we have the ability to make use of large amounts of data to help make better decisions. Not taking advantage of these tools, can potentially lead to the waste of the public and private wealth that Northwest Michigan works so hard to build.
To insure economically healthy and vibrant communities in Northwest Michigan, we need to study how our various communities are preparing themselves to leverage growth and investment forces to assist in achieving their community’s goals. The first step is the identification of communities or areas that are preparing for growth and investment. Are they maximizing the benefits, while minimizing the impacts to our predominately rural setting and natural landscapes?
In addition to learning which locally implemented policies are successful, it is useful to measure key components of growth and investment, as identified by experts in the field of community economic de-velopment. Understanding where our Northwest Michigan communities fall on the scale of a group of select factors will provide potential goals for communities interested in maximizing their potential out-comes for their citizens. Studying these areas and learning what policies are working and which ones are not, will ultimately help to maintain and improve life in Northwest Michigan.
In order to gauge how our communities are growing, attracting economic activity, and putting in place policies that maximize potentials, Networks Northwest has conducted studies of Growth & Investment Areas (G&I Areas) and their associated Commercial Corridors, with the assistance of the State of Mich-igan Regional Prosperity Initiative (RPI) and the Partnership for Sustainable Communities, a coopera-tive program of the U.S. Department of Housing and Urban Development (HUD), the U.S. Department of Transportation (DOT), and the U.S. Environmental Protection Agency (EPA). This companion docu-ment to the Regional Prosperity Plan collected data from a variety of public and commercial providers, as well as conducted interviews of public officials, which were synthesized into this report.

page ii Map of Growth & Investment Areas in NW Michigan
.

Growth & Investment Areas page iii
Growth &Investment Areas Elements of Identification A community asset inventory survey was conducted in 2010 by the Northwest Michigan Council of Governments in conjunction with the Growth & Investment Network, which was initially formed during the community engagement portion of The Grand Vision. The survey collected responses from cities, incorporated and unincorporated villages, townships, and planned growth areas in Antrim, Benzie, Charlevoix, Emmet, Grand Traverse, Kalkaska, Leelanau, Manistee, Missaukee, and Wexford counties. The results of the survey were used to develop criteria for selecting areas from the region that were best positioned to accommodate future growth patterns anticipated for northern Michigan over the next 25 years. Initially, five criteria were chosen to select areas for additional analysis regarding their Growth & Investment readiness, trends, and capabilities. The five criteria are:
1. Operational Municipal Water System
2. Operational Municipal Sewer System
3. Approved Master Plan that recommends a defined higher density downtown core for development & in-vestment
4. A Zoning Ordinance in place that codifies higher density development in the downtown core
5. Available Governmental Staff to process requests and permits
The community asset inventory was updated in 2012 with respect to these five criteria and then used to select the initial Growth & Investment areas for additional study. This resulted in 31 areas being select-ed. In those 31 initially identified Growth & Investment Areas, there are 42 individual units of govern-ment comprising the core commercial development areas. These 42 units of government were contact-ed by the Networks Northwest and asked to assist this study by providing time with staff or elected offi-cials to conduct the Commercial Corridor Inventory Interviews.
Commercial Corridor Inventory Interviews As a central component of this project, units of government in the initial selection of G&I Areas were in-terviewed to collect their responses to questions regarding master planning, land use, capital improve-ment, transportation, infrastructure, and community marketing policies. The communities were asked to select their best qualified personal and/or elected official(s) to participate. Additionally, these interviews asked the local units of government to self-identify their commercial corridors of significance. The inter-views were conducted from December 2012 to March 2014.
The interviews were conducted using a checklist tool called the Commercial Corridor Inventory. This in-ventory was designed to be objective and focused on current attributes, not future plans. Most of the Inventory’s questions required a simple “Yes/No” answer; however they also contained an “Additional Comments” space to expand upon the answers or in many cases indicate policy areas that are current-ly in the development stage. Many of the policy questions relate to a sampling of best practices from the Michigan Economic Development Corporation’s (MEDC) Redevelopment Ready Communities (RRC) program.
The commercial corridors were identified by the units of government based on their own criteria for sig-nificance to their community after receiving a brief introduction to the goals for the study. The corridor identification information from the interview was then entered in a Geographic Information System and place database for the mapping and analysis contained in this report.
page iv Growth & Investment Areas
Focus for Growth & Investment Study The wealth of economic studies that demonstrate the positive impacts that concentrating people and economic activity can have for lifting real wages and elevating our quality of life was used as a guide in the development of the analysis components for Northwest Michigan Growth & Investment Area Stud-ies and Commercial Corridor Inventories. This study is not intended as a one size fits all yard stick for Northwest Michigan communities to measure their status with respect to growth and investment. Some communities may choose to focus on areas that can assist in maintaining the viability of their communi-ty’s existing business establishments and others may choose to focus their attention on areas that can grow their local economies and population. One of the study’s components that contains a mix of eval-uation tools is a Growth Readiness Assessment. The mix of included criteria contain some that apply to all communities regardless of size and some that are designed primarily for larger communities. Com-munities should evaluate which study criteria are of value in gauging progress on the individual growth and investment goals they have set for their communities.

Growth & Investment Area Assessments page v
Growth & Investment Readiness Assessments
Original Selection Criteria Municipal Water & Sewer Determining the density limit for individual residential septic systems is a complex issue and is based on an un-derstanding of the site specific hydrology and water quality impacts. Michigan is the only state without specific state enabling legislation related to on-site wastewater treatment systems. Regulatory control over conventional septic tank and drain field siting, design, and construction is under the jurisdiction of local health departments. (Michigan Department of Environmental Quality 2004) The commonly accepted housing density standards before Municipal Water or Sewer are required may be summarized as follows: (American Society of Planning Officials 1952)
• Two families to the acre where both water and sewage systems are lacking. • Four families to the acre where either water or sewer systems are lacking. • Greater density where both facilities are provided.
As a caveat to these standards, studies have indicated that depending on the site conditions, even one family to the acre may not be sufficient to protect water quality and guard against conditions that could lead to premature failure of Onsite Sewage Disposal Systems.
Thus for the greater density made possible by community water and sewer service together with the greater envi-ronmental protections that properly maintained and updated municipal systems can achieve, This study focused on communities that had municipal systems in place or were trending towards implementing them.
Government Staff In order to process development requests as well as having the capacity to analyze the successes and failures of land use application reviews, this study focused on communities that had sufficient staff resources.
Master Plan Includes Higher Density Center The previous Community Asset Inventory reviewed community master plans to determine if they contained goals for the establishment of a higher density core or downtown. This was determined as a key predictor of the com-munity’s capability to accommodate future growth.
Zoning Ordinance Supporting Master Plan Density Center As with the master plan high density center criterion, the previous Community Asset Inventory reviewed communi-ty zoning ordinances to determine if they codified the master plan goals for the establishment of a higher density core or downtown.
Census Data Criteria Core Place Population Increasing One of the effects of Northwest Michigan’s vacation market, is declining year round population for some of the communities with high rates of second home ownership. This can lead to year round cash flow challenges for the local retail sector. As a result this study chose to track changes in Core Place population as a potential indicator for the sustainability of retail business activity.
Housing Growth Rate Over 15% (2000-2010 Census) The criterion of a 15% housing growth rate for the period between the 2000 and 2010 Censuses assists in deter-mining which communities presently are experiencing significant development activity.
Core Place Housing Growth Increasing Faster than Surrounding Area This criterion is utilized as a measure of how our rural quality is being preserved by minimizing sprawl. It is meas-ured by the percentage change of housing in the Core Place over the Growth & Investment Area as a whole from the 2000 to 2010 decadal Census. Other techniques for measuring of sprawl, such as satellite spectral analysis for changes in impervious surface, could be employed in the future provided sufficient budget availability.

page vi Growth & Investment Area Assessments
Census Class (Rural, Urban Cluster, Urbanized Area, MSA) The US Census provides a classification of rural and urban areas that is helpful in determining growth and con-centrations of population (see: 2010 Census Urban and Rural Classification and Urban Area Criteria, page 91)
Job Density Over 75 Jobs per Acre in Commercial Corridors A study on density as it relates to the reduction of Single Occupant Vehicle (SOV) trips and transit use found that SOV travel decreases at employment densities of 20 to 50 jobs per acre, and transit use increases dramatically at densities over 75 jobs per acre. (Frank and Pivo 1994) The Growth & Investment study chose to measure Job Densities over 75 jobs per acre to indicate corridors with strong demand for fixed route transit. In addition to trans-it benefits, workers support nearby retail and food service business. On average, an office worker can support 7 square feet of restaurant space and 23 square feet of retail space. (Gibbs 2012)
50% of Workers Living within 5 miles The criterion of determining whether 50% or more of the workers are living within a 5 mile commute of jobs locat-ed in Growth & Investment Core Places was selected to measure potential positive agglomeration effects for real wage growth as supported by the economic studies cited previously in this report.
Zoning Policy Criteria Zoned Densities Greater Than 30 Dwellings/Acre in Commercial Corridors The criterion of 30 dwellings per acre was selected for study based on studies of density thresholds required for high quality walkable communities. This density is also supportive of transit operations.
Zoning Allows Mixed-Use by Right in Commercial Corridors Walkable communities require a mix of uses to be successful in providing transportation options demanded by market shifts in housing preferences. Requiring a “Special Use” process for mixed use land use applicants can lead to constraints on the supply of mixed use development over the less cumbersome “By Right” zoning and thus hamper the success of establishing vibrant walkable communities.
Zoning Allows Multi-Family Residential by Right in Commercial Corridors Multi-Family housing is increasingly in demand as the housing market shifts to smaller households looking for walkable communities. This criterion evaluates a communities policy restrictions on the supply of multi-family housing development.
Building Height Limits Greater than 35 feet in Commercial Corridors Allowing Building Height limits greater than 35 feet gives greater flexibility for both creating density in Core Places and allocating public space to critical placemaking efforts that help build vibrant communities.
No On-Site Parking Requirement in Central Business District Many traditional Northwest Michigan downtowns development patterns were established before the establishment of auto parking requirements. Many existing historic downtowns can’t meet the typical auto centric parking re-quirements without utilizing premium downtown real estate for large surface parking. Additionally, trends as out-lined in this document are reducing vehicle ownership rates and thus parking requirements. This criterion helps to assess a Growth & Investment Area’s flexibility to accommodate new market trends.
Density Bonuses Offered for Contributions towards Public Policy Goals The lack of supply of affordable housing has been identified as an issue for Northwest Michigan’s economic com-petitiveness. This fact together with the need to create vibrant communities while protecting the areas natural re-sources can be partially addressed with policies such as density bonuses. This study is tracking community incen-tive policies for addressing these regionally important goals.
Placemaking Criteria Placemaking Elements in Support of Walkable Corridors Placemaking elements that support walkable mixed-use corridors were selected as criterion for the assessment. These elements include the presence of theaters and entertainment venues, grocery stores, parks and pocket parks, and the abundance of pedestrian connections. This selection is not intended to diminish the importance of

Growth & Investment Area Assessments page vii
other placemaking elements supportive of walkable corridors, but the ability to seek entertainment, purchase food, and recreate within a pedestrian friendly environment where considered important factors to measure.
Retail Hub This criterion evaluates whether a communities retail sector acts as a local or regional hub. (see: Retail Classifica-tion: page 94)
Educational Institutions (Trade Schools, Community Colleges, Universities) In studying the performance of economic clusters, educational institutions play an important role in concentrating entrepreneurial activity and fostering growth and investment.
Contain Medical Centers With the high concentration of senior demographics in Northwest Michigan’s population, this study gave signifi-cance to medical infrastructure as a predictor/indicator of growth.
Walkable Density CBD or Commercial Corridors (20-30 Dwellings per Acre) While the Zoning Policy Criteria is looking at zoning densities sufficient to create viable walkable communities, this criterion tracks actual densities as determined by the 2010 Census.
Opportunity Criteria Community Identified Development Opportunities The presence of community identified development opportunities demonstrates that the community is proactive about development and has devoted resources towards potential future growth and investment.
Marketing Redevelopment & Infill Sites Potential development sites are abundant, especially in the current post-recession economic recovery period. The existence of a marketing effort by communities of redevelopment and infill sites can lead to a greater probability of attracting development activity.
Fixed Route Transit (Headways 15 mins or less) According to The Transit Cooperative Research Program headways of 15 minutes or less is an acceptable threshold for employment commuting transit use, with 10 minutes or less being ideal.
Commercial Corridors with High Traffic Count AADT (Over 10k, Over 25k) Traffic Counts are a determinate of the retail site viability. Average Annual Daily Counts of 10,000 can augment a neighborhood or village store’s business, making it sustainable for market areas with less than the required 800 to 1,000 households that are need to support them. Larger retailer site selection criteria typically require traffic counts from 20,000 to 40,000 depending on the specifics of the capture rate.
Infrastructure Criteria Additional Water & Sewer Capacity Municipal water and sewer expansions take a significant time to permit and build. If the municipal water and sew-er capabilities are at their limits, businesses looking to expand or relocate to a new facility may not be in a position to wait for the completion of an expansion project. It is important that communities plan for sufficient capacity re-serve to accommodate new service and provide for time to properly plan additional expansions.
Broadband Service over 1 Gbps Available The next-generation of broadband service is providing speeds over 1 Gigabit per Second (Gbps) These speeds rely on fiber optic wires that run all the way to the premises referred to Fiber To The Home (FTTH) or Fiber To The Premises (FTTP). FTTH Consumers consistently rate it as the fastest and most reliable broadband technolo-gy. They also appreciate that fiber networks can deliver many unique broadband services for medicine, education, home-based businesses, home automation and entertainment. “There’s growing evidence among economic de-velopment officials that fiber connectivity encourages businesses to stay, helps businesses grow and become more productive, and attracts new businesses, particularly in high-tech industries.” (Broadband Communities 2013) In the United States, one of every five households is within reach of fiber, and nearly 10 million households are using FTTH services now.

page viii Growth & Investment Area Assessments
Municipal WiFi Wireless services are important public amenities, especially for younger population demographics, and are highly desirable in targeted areas such as pedestrian friendly commercial corridors and public areas. The existence of Municipal WiFi is an indicator of support for new infrastructure development important for growth and investment.

Master Maps Legend page ix
Growth & Investment Area Maps Legend
North Directional
Mileage Scale
Corridor Identification
Commercial Corridor Identification Number Graphic
Community Defined Commercial Corridors
Map Area Key
Land
Bordering County
Bodies of Water
Municipal Boundary
Urban Cluster (as defined by the 2010 Census)
Municipal/Urban Cluster Overlap Area
Census Designated Place (CDP)

page x Master Maps Legend
Commercial Corridor Maps Legend
Points of Interest
Public Use Airport
College
Cultural Site
Grocery Store
Hospital
Library
School
Theater/Entertainment Venue
Transit
North Directional
Mileage Scale
Study Area Outline
The Study Area is delineated by the area within .25 miles of the community defined commercial corridor (red line) and is shaded in a transparent red. Area calculations are derived from the land area only. For the purposes of pulling Census information, any 2010 Cen-sus block that is fully or partially contained with the study area was utilized in the data summaries.
Map Area Key
Land
Bodies of Water
Municipal Boundary
Urban Cluster (as defined by the 2010 Census)

G&I 16 page 1
Growth & Investment Area Unit(s) of Government:
Core Place Census Areas:
Village of Fife Lake
County Census Class Land Area
Grand Traverse Rural G&I Area
Core Place
Aerial Map with Commercial Corridors
2 Commercial Corridors Identified
Highest Corridor Traffic Count (Annual Average Daily Traffic) 2013 Data Year
Population Density Range of G&I Area Corridors (per acre)
Gross Neighborhood Density Range of G&I Area Corridors (per acre)
Job Density Range of G&I Area Corridors (per acre)
Worker Density Range of G&I Area Corridors (per acre)
Retail
Total Sales Classification: Retail Potential ExporterPotential Sales
Leakage Seasonal Housing: 21.4% of G&I Area Housing
Sprawl
Percentage of Housing in the Core Place is Declining by -1.9%
Population
2000-2010: Growing at 5.0% with the Core Place Declining at -4.9%Average Age:
Demographic Shifts: Generation X had the largest % gain (up 167.9%); Silent Generation had the largest % loss (down -12.4%)
Jobshed
0.2 - 0.70.3 - 1.20.0 - 0.10.1 - 0.6
$3,776,423$13,261,241
$9,484,818
Worker Exporter – Resident Worker population exceeds the number of Jobs by 95%
5,741
Village of Fife Lake, Fife Lake Township
Fife Lake
Density calculations a derived from the area within a 1/4 mile of Corridor (Corridor Study Area)
34.60 sq. miles
39.2 [ +5.9% change from 2000 Census ]
0.75 sq. miles

page 2 16 G&I
Population & Housing Trends
Total Population (2010)
Percentage Change from 2000People per AcrePeople per Square MileAverage Age [% Change from 2000]
Total Housing (2010)
Percentage Change from 2000Gross Neighborhood Density (per acre)
Total Households (2010)Percentage of Households without Children (under 18)
Study Area Size (Land Cover)
AcresSquare Miles
480.00
0.04
Housing in Core Place as a Percentage
of Total Growth & Investment AreaHousing Units in G&I Area and Core Place
34.60
443 1,462
0.92 0.07591 42
265 855
Village of Fife Lake Village of Fife Lake, Fife Lake Township
40.0 [ +15.7% ] 39.2 [ +5.9% ]
Fife Lake
0.55
Census DataCore Place G&I Area
0.7522,144.00
68% 67%189 604
-4.9% +5.0%
3.5% 9.8%
Percentage Change in Population in
G&I Area and Core Place
Percentage Change in Housing Units in
G&I Area and Core Place
44%
37%
32% 33% 31%
0%
20%
40%
60%
80%
100%
1970 1980 1990 2000 2010Average (all G&I Areas in Grand Traverse County)Average (all G&I Areas)Fife Lake
468
648
698
779
855
206
242
225
256
265
-
1,000
1970 1980 1990 2000 2010G&I Area Housing G&I Core Place Housing
17.5%
-7.0%
13.8%
3.5%
38.5%
7.7% 11.6% 9.8%
-20%
0%
20%
40%
60%
80%
100%
120%
1980 1990 2000 2010
G&I Core Housing G&I Housing
Average For Core Areas Average For G&I Areas
46.7%
-2.0%
18.3%
-4.9%
65.5%
27.3%
3.6% 5.0%
-40%
-20%
0%
20%
40%
60%
80%
100%
120%
1980 1990 2000 2010
G&I Core Population G&I Population
Average For Core Areas Average For G&I Areas

G&I 16 page 3
Growth & Investment Readiness Assessment
1 Municipal Water
2 Municipal Sewer
3 Government Staff
4 Master Plan Includes Higher Density Center
5 Zoning Ordinance Supporting Master Plan Density Center
6 Core Place Population Increasing
7 Housing Growth Rate Over 15% (2000-2010 Census)
8 Core Place Housing Growth Increasing Faster than Surrounding Area
9 Census Class (Rural, Urban Cluster, Urbanized Area, MSA)
10 Job Density Over 75 Jobs Per Acre in Commercial Corridors
11 50% of Workers Living within 5 miles
12 Zoned Densities Greater Than 30 Dwellings/Acre in Commercial Corridors
13 Zoning Allows Mixed-Use by Right in Commercial Corridors
14 Zoning Allows Multi-Family Residential by Right in Commercial Corridors
15 Building Height Limits Greater than 35 feet in Commercial Corridors
16 No On Site Parking Requirement in Central Business District
17 Density Bonuses Offered for Contributions Towards Public Policy Goals
18 4 Key Placemaking Elements in Corridors
19 Retail Hub
20 Educational Institutions (Trade Schools, Community Colleges, Universities)
21 Contain Medical Centers
23 Walkable Density CBD or Commercial Corridors (20-30 Dwellings per Acre)
24 Community Identified Development Opportunities
25 Marketing Redevelopment & Infill Sites
22 Fixed Route Transit (Headways 15 mins or less)
30 Commercial Corridors with High Traffic Count AADT (Over 10k, Over 25k)
26 Additional Water Capacity
27 Additional Sewer Capacity
28 Broadband Service over 1 Gbps Available
29 Municipal WiFi
Zo
nin
g P
olicy
Pla
cem
akin
gIn
frastr
uctu
reO
pp
ort
un
ity
Init
ial S
ele
cti
on
Cri
teri
aC
en
su
s D
ata
Fife Lake
Yes
No
No
Criteria Status
No
No
No
No
Yes
No
No
No
No
No
No
Yes
Yes
Yes
No
No
No
No
No
Yes
Yes
Yes
Yes
No
No
No
Rural

page 4 16 G&I
Commercial Corridors
ID
23
24
Growth & Investment Core Place Map with Commercial Corridors
Population
Density
(People per
acre)
Housing
Density
(Dwellings per
acre)
Corridor
Length (feet)
6,185 Fife Lake State Street Corridor 1.2
Name
0.1 0.7 0.6 Fife Lake US131 Corridor
Job Density
(Jobs per acre)
Worker
Density
(Workers per
acre)
0.2 0.0 0.1 17,026 0.3
Fife Lake
G&I 16 page 5
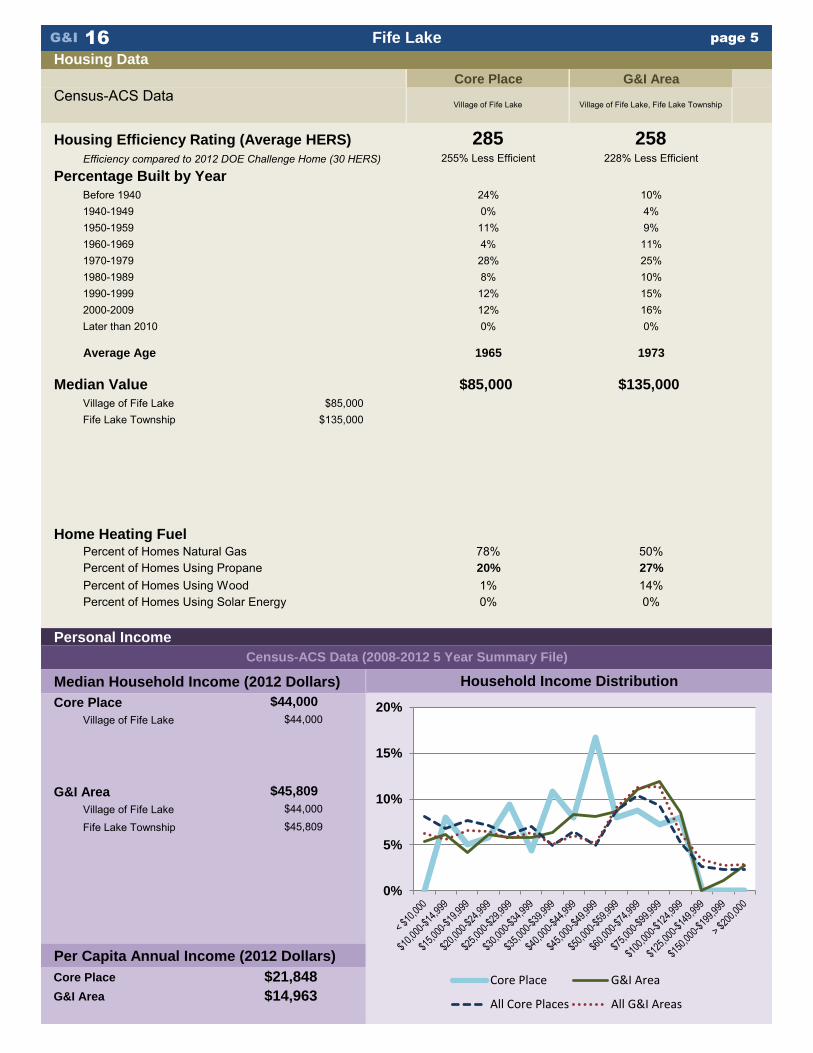
Housing Data
Housing Efficiency Rating (Average HERS)
Efficiency compared to 2012 DOE Challenge Home (30 HERS)
Percentage Built by Year
Before 19401940-19491950-19591960-19691970-19791980-19891990-19992000-2009Later than 2010
Average Age
Median Value
Village of Fife LakeFife Lake Township
Home Heating FuelPercent of Homes Natural GasPercent of Homes Using PropanePercent of Homes Using WoodPercent of Homes Using Solar Energy
Personal Income
Median Household Income (2012 Dollars)
Core Place
Village of Fife Lake
G&I Area
Village of Fife Lake
Fife Lake Township
Per Capita Annual Income (2012 Dollars)
Core Place
G&I Area
20%
78%
1%
1965
0%11%4%28%8%12%12%0%
$14,963
Household Income Distribution
$44,000
$85,000
Census-ACS Data (2008-2012 5 Year Summary File)
$21,848
4%9%
285255% Less Efficient
24%
$44,000$44,000
$45,809
$45,809
0%
$85,000$135,000
G&I Area
Village of Fife Lake, Fife Lake TownshipCensus-ACS Data
11%25%10%15%16%0%
14%
10%
0%
$135,000
1973
27%
50%
Core Place
Village of Fife Lake
258228% Less Efficient
Fife Lake
0%
5%
10%
15%
20%
Core Place G&I Area
All Core Places All G&I Areas

page 6 16 G&I
Policy
Year of Master Plan Approval
Master Plan Update
Community Economic Strategy
Economic Strategy Coordinates with Regional Strategy
Growth & Investment Strategy
Identify Areas of Focus for Growth & Investment Strategy
Active G&I Strategy Development Discussions
Planning Zoning Benchmarks
Development Opportunities on Corridor
Redevelopment Priorities Identified
Redevelopment Resources Identified
Market Potential Development Sites
Guides and Resources
Publish Development Guide
Zoning Orientation Package Provided to Staff & Committees
Zoning Training Funding
Community Marketing Strategy
Area Plans
Downtown PlanDowntown Development Authority
Corridor Improvement PlanCorridor Improvement Authority
Zoning
Yes
Yes
Yes
NA
Yes
No
% of Districts in Corridors where
Multi-Family Use is allowed by Right
25%
0%47
Yes
No
DDA Established 1993
Yes
No
No
No
Yes
38
Max Dwelling Density for Districts in Corridors
Districts in Identified Commercial
Corridors
NA
NA
Zoning Authority
with Identified Commercial Corridors
Village of Fife Lake
Fife Lake Township
No
Core Place Units of Government Interviewed
Village of Fife Lake
2011
Data Source: Commercial Corridor Inventory Interview
NA
R-2 | FR | C-1 | I-1
% of Districts in Corridors where
Mixed Use is allowed by Right
30 ft
25%R-1 | R-2 | C-1 | C-2
0%
Max Building Height Allowed
in Corridors
35 ft
Fife Lake

G&I 16 page 7
Infrastructure
Municipal Water Service
Additional CapacityWater Reliability StudyWellhead Protection Plan
Municipal Sewer Service
Additional CapacityWaste Water Master Plan
Broadband
Available TechnologiesFiber (non FTTH)CableDSL4G WirelessMunicipal WiFiFixed Wireless Broadband
Available SpeedsUltra - Greater that 1 Gigabit Per Second (Gbps)High - 100 Mbps to less than 1 Gbps
EnergyNatural GasUnderground Electric ServiceRenewable Energy Generation
Commercial Corridor Placemaking Elements
23
24
Available In Core Place
YesYesYesYesNoYes
NoYes
Yes
Yes
NANA
No
No
Village of Fife Lake
Data Source: Commercial Corridor Inventory Interviews
Units of Government Interviewed
NA
Theaters &
Entertainment
Venues
Grocery StoresParks & Pocket
Parks
Pedestrian
Connections
Fife Lake US131 Corridor No YesYesNo No Yes 0.048Fife Lake State Street Corridor
Job /
Population
Ratio
0.064
ID Name
Placemaking Elements Supporting Walkability
Yes Yes
YesNoNo
Available In Core Place
Fife Lake

page 8 16 G&I
Talent Jobshed
Workers Living within Study AreaWorker Density (per acre)
Worker's Earnings% with earnings $1250/month or less% with earnings $1251/month to $3333/month% with earnings greater than $3333/month
Jobs Located in AreaJob Density (per acre)
Commute Data for Workers Employed in Core PlaceCommuting data for workers residing from 2 - 175 miles from G&I Area
Commuting Workers 5% Commuting 5 Miles or Less
Total Daily One Way Commute for all Commuters
Route Distance (Miles)Commute Time (Minutes)
Total Annual Commute for all Commuters
Distance (Miles)Time (Hours)
Annual Commuting Costs
Total Fuel CostTotal Cost (IRS 2014 Standard Mileage Rate)
Average Per Worker Commute
Distance (Miles)Time (Hours)Cost (IRS Standard Mileage Rate)
Retail Activity
Total Retail Sales
Total Potential Retail Sales
Leakage
Classification: Retail Potential Exporter
Sales by Retail Store Type
Food & Beverage StoresHealth/Personal Care StoresClothing & Accessories StoresSport/Hobby/Book/Music StoresGeneral Merchandise StoresFood & Beverage EstablishmentsE-Shopping/Mail-Order
17
448 580
$131,703
30%39%
Village of Fife Lake, Fife Lake Township
0.00
0.44 0.04
31%
Village of Fife Lake
212 957
47200.04
53 1.1
$30
Core Place SalesPotential G&I Area
Sales
County ActivityG&I Area ActivityCore Place Activity
235,184 5,073
35,789
30%
28%42%
Census DataCore Place G&I Area
$0 $1,660,519
$0 $2,762,221 0%$356,645 $1,155,142 31%
$1,174,416,760$874,196,195
($300,220,565)
$3,776,423
$13,261,241
$9,484,818
$1,164,784$4,100,017$2,935,233
0%
Core Place Sales /
Potential G&I Sales
Residents of the Fife Lake Growth & Investment Area are making 72% of their purchases at businesses located outside the area.
$0 $672,221 0%
$521,857 $1,097,889 48%$0 $597,738 0%
$58,597 $307,885 19%
298 $7,747
AnnualDaily (2-Way)
13,834
Fife Lake

CC page 9
Central Business District, Commercial/Industrial, Commercial
Corridor Overview
Corridor Segment and Surrounding 1/4 Mile Study Area Map
Economic DevelopmentCommunity policies or activities assisting economic development (Fife Lake Township or Village of Fife Lake)
Growth & Investment Strategy Community Economic Strategy
Identify Areas of Focus for G&I Community Marketing Strategy
Development Opportunities Market Potential Development Sites
Publish Development Guide Capital Improvement Plan
Fife Lake US131 Corridor23
NoNoNoNo
Unit(s) of Government:
US131 from County Line Road to Village Limits; US131 from M186 to Railroad Crossing; US131 from N Village Limits to M186; M186 from Kennie's Lane to US131
Yes
Bike Lane:
5,741 Source: MDOT
2, Bi-Directional Traffic with Turn/Passing Lanes
No Street Parking
BATA - Dial-A-Ride
No
None
15
Pedestrian Amenities:
Corridor Street Name(s):
Corridor Classification:
Length:
Street Classification:
2013 Traffic Volume(AADT):
Number of Traffic Lanes:
Walk Score
No
3.22 miles
Principal Arterial - Other, Major Collector
Fife Lake Township, Village of Fife Lake
Parking
Transit Service:
Entertainment Venues:
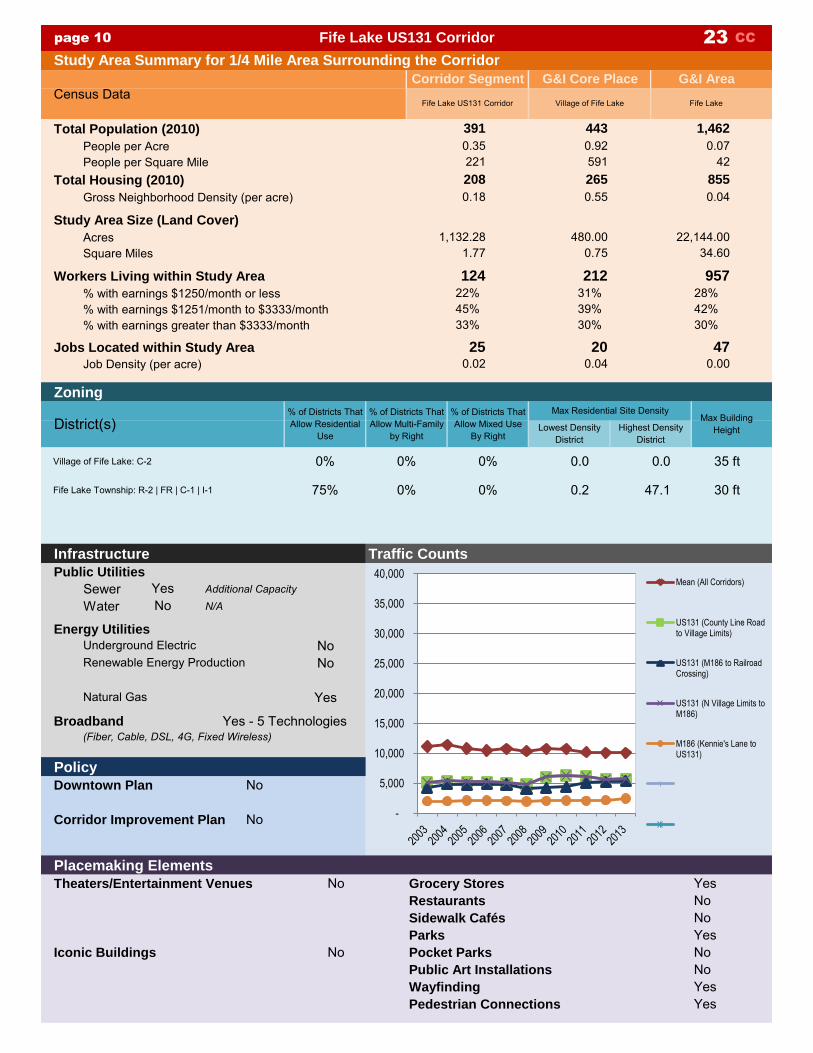
This corridor’s development recognizes the reality of the coming growth of Grand Traverse County with the improvement of the US-131 corridor north of Cadillac. In addition, as the southern portion of the County continues to grow, commercial services for retail, recreation and repair shall be required by the expanding population including the needs of the vacation traveler. This corridor accommodates industrial activity and is intended to provide economic development and jobs for the community. The area shall include industrial and office use suited for a small, relatively rural community. Because of the relative proximity of this area to residentially developed areas, sites that adjoin residential areas shall include vegetative buffers and larger building set backs shall be promoted to control such off-site impacts as odors, noise, lighting, transportation and vibration.
YesYesYes
page 10 CC
Study Area Summary for 1/4 Mile Area Surrounding the Corridor
Total Population (2010)
People per AcrePeople per Square Mile
Total Housing (2010)
Gross Neighborhood Density (per acre)
Study Area Size (Land Cover)
AcresSquare Miles
Workers Living within Study Area
% with earnings $1250/month or less% with earnings $1251/month to $3333/month% with earnings greater than $3333/month
Jobs Located within Study Area
Job Density (per acre)
Zoning
Infrastructure Traffic Counts
Public Utilities
Sewer Additional Capacity
Water N/A
Energy Utilities
Underground ElectricRenewable Energy Production
Natural Gas
Broadband
Policy
Downtown Plan No
Corridor Improvement Plan No
Placemaking Elements
Theaters/Entertainment Venues No Grocery Stores YesRestaurants NoSidewalk Cafés NoParks Yes
Iconic Buildings No Pocket Parks NoPublic Art Installations NoWayfinding YesPedestrian Connections Yes
YesNo
Yes
NoNo
(Fiber, Cable, DSL, 4G, Fixed Wireless)Yes - 5 Technologies
Highest Density District
% of Districts That Allow Multi-Family
by Right
30%
Lowest Density District
Max Residential Site DensityMax Building
Height
31%39%
47.1 30 ftFife Lake Township: R-2 | FR | C-1 | I-1 75% 0% 0% 0.2
G&I Area
1,462
265 855
957
0.92
% of Districts That Allow Residential
Use
Fife Lake
28%42%30%
124
0.18
0.0
Fife Lake US131 Corridor 23
Fife Lake US131 Corridor
Corridor Segment
0.0 35 ft0%
480.00 22,144.000.75 34.60
0.040.55
% of Districts That Allow Mixed Use
By Right
0.0225
33%
22%45%
47
212
200.04 0.00
0.0742
1,132.281.77
391
208
0.35
0%Village of Fife Lake: C-2
District(s)
0%
G&I Core Place
443
Village of Fife Lake
221
Census Data
591
-
5,000
10,000
15,000
20,000
25,000
30,000
35,000
40,000Mean (All Corridors)
US131 (County Line Roadto Village Limits)
US131 (M186 to RailroadCrossing)
US131 (N Village Limits toM186)
M186 (Kennie's Lane toUS131)

CC page 11
Central Business District
Corridor Overview
Corridor Segment and Surrounding 1/4 Mile Study Area Map
Economic DevelopmentCommunity policies or activities assisting economic development (Village of Fife Lake)
Growth & Investment Strategy Community Economic Strategy
Identify Areas of Focus for G&I Community Marketing Strategy
Development Opportunities Market Potential Development Sites
Publish Development Guide Capital Improvement Plan
Fife Lake State Street Corridor24
NoNoNoNo
Unit(s) of Government:
State Street from US131 to Anthony Street
Yes
Bike Lane:
NA
2, Bi-Directional Traffic
Parallel
BATA - Dial-A-Ride
No
Sidewalks
48
Pedestrian Amenities:
Corridor Street Name(s):
Corridor Classification:
Length:
Street Classification:
2013 Traffic Volume(AADT):
Number of Traffic Lanes:
Walk Score
No
1.17 miles
Major Collector
Village of Fife Lake
Parking
Transit Service:
Entertainment Venues:
Fife Lake was established in 1872, the Village of Fife Lake was incorporated in 1889. Since its establishment the downtown business district has served the village and the surrounding area including Fife Lake, Springfield, Boardman and Union townships. Fife Lake's Downtown Development Authority was established in 1993 to enhance and revitalize our downtown business district.
YesYesYes

page 12 CC
Study Area Summary for 1/4 Mile Area Surrounding the Corridor
Total Population (2010)
People per AcrePeople per Square Mile
Total Housing (2010)
Gross Neighborhood Density (per acre)
Study Area Size (Land Cover)
AcresSquare Miles
Workers Living within Study Area
% with earnings $1250/month or less% with earnings $1251/month to $3333/month% with earnings greater than $3333/month
Jobs Located within Study Area
Job Density (per acre)
Zoning
Infrastructure Traffic Counts (Data Unavailable for Corridor)
Public Utilities
Sewer Additional Capacity
Water N/A
Energy Utilities
Underground ElectricRenewable Energy Production
Natural Gas
Broadband
Policy
Downtown Plan Yes
Corridor Improvement Plan No
Placemaking Elements
Theaters/Entertainment Venues No Grocery Stores NoRestaurants YesSidewalk Cafés YesParks Yes
Iconic Buildings Yes Pocket Parks YesPublic Art Installations YesWayfinding YesPedestrian Connections Yes
YesNo
Fife Lake Public Library
Yes
NoNo
(Fiber, Cable, DSL, 4G, Fixed Wireless)Yes - 5 Technologies
Highest Density District
% of Districts That Allow Multi-Family
by Right
30%
Lowest Density District
Max Residential Site DensityMax Building
Height
31%39%
G&I Area
1,462
265 855
957
0.92
% of Districts That Allow Residential
Use
Fife Lake
28%42%30%
225
0.75
5.8
Fife Lake State Street Corridor 24
Fife Lake State Street Corridor
Corridor Segment
38.2 35 ft25%
480.00 22,144.000.75 34.60
0.040.55
% of Districts That Allow Mixed Use
By Right
0.0623
31%
28%41%
47
212
200.04 0.00
0.0742
399.600.62
484
299
1.21
25%R-1 | R-2 | C-1 | C-2
District(s)
75%
G&I Core Place
443
Village of Fife Lake
775
Census Data
591
-
5,000
10,000
15,000
20,000
25,000
30,000
35,000
40,000Mean (All Corridors)
State Street (US131 toAnthony Street)

G&I 17 page 13
Growth & Investment Area Unit(s) of Government:
Core Place Census Areas:
Interlochen CDP
County Census Class Land Area
Grand Traverse Rural G&I Area
Core Place
Aerial Map with Commercial Corridors
1 Commercial Corridor Identified
Highest Corridor Traffic Count (Annual Average Daily Traffic) 2013 Data Year
Population Density of Corridor (per acre)
Gross Neighborhood Density of Corridor (per acre)
Job Density of Corridor (per acre)
Worker Density of Corridor (per acre)
Retail
Total Sales Classification: Retail Potential ExporterPotential Sales
Leakage Seasonal Housing: 16.4% of G&I Area Housing
Sprawl
Percentage of Housing in the Core Place is Growing by 0.8%
Population
2000-2010: Growing at 15.5% with the Core Place Growing at 30.4%Average Age:
Demographic Shifts: Generation X had the largest % gain (up 26.4%); Silent Generation had the largest % loss (down -15.2%)
Jobshed
0.81.80.30.7
$19,108,487$53,397,505$34,289,018
Worker Exporter – Resident Worker population exceeds the number of Jobs by 50%
14,480
Green Lake Township
Interlochen
Density calculations a derived from the area within a 1/4 mile of Corridor (Corridor Study Area)
29.18 sq. miles
38.3 [ +6.2% change from 2000 Census ]
1.24 sq. miles

page 14 17 G&I
Population & Housing Trends
Total Population (2010)
Percentage Change from 2000People per AcrePeople per Square MileAverage Age [% Change from 2000]
Total Housing (2010)
Percentage Change from 2000Gross Neighborhood Density (per acre)
Total Households (2010)Percentage of Households without Children (under 18)
Study Area Size (Land Cover)
AcresSquare Miles
793.60
0.16
Housing in Core Place as a Percentage
of Total Growth & Investment AreaHousing Units in G&I Area and Core Place
29.18
583 5,784
0.73 0.31470 198
277 2,958
Interlochen CDP Green Lake Township
NA 38.3 [ +6.2% ]
Interlochen
0.35
Census DataCore Place G&I Area
1.2418,675.20
62% 63%240 2,289
+30.4% +15.5%
31.6% 20.4%
Percentage Change in Population in
G&I Area and Core Place
Percentage Change in Housing Units in
G&I Area and Core Place
9% 9%
0%
20%
40%
60%
80%
100%
1970 1980 1990 2000 2010Average (all G&I Areas in Grand Traverse County)Average (all G&I Areas)Interlochen
902
1,5
84 2
,107
2,4
57 2
,958
-
-
-
210
277
-
1,000
2,000
3,000
4,000
1970 1980 1990 2000 2010G&I Area Housing G&I Core Place Housing
31.6%
75.6%
33.0%
16.6% 20.4%
-20%
0%
20%
40%
60%
80%
100%
120%
1980 1990 2000 2010
G&I Core Housing G&I Housing
Average For Core Areas Average For G&I Areas
30.4%
22.7%
36.2%
15.5%
-40%
-20%
0%
20%
40%
60%
80%
100%
120%
1980 1990 2000 2010
G&I Core Population G&I Population
Average For Core Areas Average For G&I Areas

G&I 17 page 15
Growth & Investment Readiness Assessment
1 Municipal Water
2 Municipal Sewer
3 Government Staff
4 Master Plan Includes Higher Density Center
5 Zoning Ordinance Supporting Master Plan Density Center
6 Core Place Population Increasing
7 Housing Growth Rate Over 15% (2000-2010 Census)
8 Core Place Housing Growth Increasing Faster than Surrounding Area
9 Census Class (Rural, Urban Cluster, Urbanized Area, MSA)
10 Job Density Over 75 Jobs Per Acre in Commercial Corridors
11 50% of Workers Living within 5 miles
12 Zoned Densities Greater Than 30 Dwellings/Acre in Commercial Corridors
13 Zoning Allows Mixed-Use by Right in Commercial Corridors
14 Zoning Allows Multi-Family Residential by Right in Commercial Corridors
15 Building Height Limits Greater than 35 feet in Commercial Corridors
16 No On Site Parking Requirement in Central Business District
17 Density Bonuses Offered for Contributions Towards Public Policy Goals
18 4 Key Placemaking Elements in Corridors
19 Retail Hub
20 Educational Institutions (Trade Schools, Community Colleges, Universities)
21 Contain Medical Centers
23 Walkable Density CBD or Commercial Corridors (20-30 Dwellings per Acre)
24 Community Identified Development Opportunities
25 Marketing Redevelopment & Infill Sites
22 Fixed Route Transit (Headways 15 mins or less)
30 Commercial Corridors with High Traffic Count AADT (Over 10k, Over 25k)
26 Additional Water Capacity
27 Additional Sewer Capacity
28 Broadband Service over 1 Gbps Available
29 Municipal WiFi
Zo
nin
g P
olicy
Pla
cem
akin
gIn
frastr
uctu
reO
pp
ort
un
ity
Init
ial S
ele
cti
on
Cri
teri
aC
en
su
s D
ata
Interlochen
No
No
No
Criteria Status
No
No
No
No
Yes
No
No
Yes > 10,000
No
No
No
No
Yes
Yes
No
No
No
No
Yes
No
Yes
Yes
Yes
Yes
Yes
Yes
Rural

page 16 17 G&I
Commercial Corridors
ID
22
Growth & Investment Core Place Map with Commercial Corridors
Population
Density
(People per
acre)
Housing
Density
(Dwellings per
acre)
Corridor
Length (feet)Name
Green Lake Interlochen Gateway
Job Density
(Jobs per acre)
Worker
Density
(Workers per
acre)
0.8 0.3 0.7 9,444 1.8
Interlochen

G&I 17 page 17
Housing Data
Housing Efficiency Rating (Average HERS)
Efficiency compared to 2012 DOE Challenge Home (30 HERS)
Percentage Built by Year
Before 19401940-19491950-19591960-19691970-19791980-19891990-19992000-2009Later than 2010
Average Age
Median Value
Green Lake Township
Home Heating FuelPercent of Homes Natural GasPercent of Homes Using PropanePercent of Homes Using WoodPercent of Homes Using Solar Energy
Personal Income
Median Household Income (2012 Dollars)
Core Place
Interlochen CDP
G&I Area
Green Lake Township
Per Capita Annual Income (2012 Dollars)
Core Place
G&I Area
13%
72%
0%
1993
0%0%5%17%7%29%41%0%
$20,844
Household Income Distribution
$55,021
$108,600
Census-ACS Data (2008-2012 5 Year Summary File)
$19,263
3%10%
180150% Less Efficient
1%
$32,500$32,500
$55,021
0%
$138,800
G&I Area
Green Lake TownshipCensus-ACS Data
6%15%10%32%21%0%
5%
2%
0%
$138,800
1984
12%
70%
Core Place
Interlochen CDP
212182% Less Efficient
Interlochen
0%
5%
10%
15%
20%
25%
30%
35%
Core Place G&I Area
All Core Places All G&I Areas

page 18 17 G&I
Policy
Year of Master Plan Approval
Master Plan Update
Community Economic Strategy
Economic Strategy Coordinates with Regional Strategy
Growth & Investment Strategy
Identify Areas of Focus for Growth & Investment Strategy
Active G&I Strategy Development Discussions
Planning Zoning Benchmarks
Development Opportunities on Corridor
Redevelopment Priorities Identified
Redevelopment Resources Identified
Market Potential Development Sites
Guides and Resources
Publish Development Guide
Zoning Orientation Package Provided to Staff & Committees
Zoning Training Funding
Community Marketing Strategy
Area Plans
Downtown PlanDowntown Development Authority
Corridor Improvement PlanCorridor Improvement Authority
Zoning
Yes
Yes
Yes
NA
No
No
% of Districts in Corridors where
Multi-Family Use is allowed by Right
25%
No
No
DDA Established 2007
Yes
No
Yes
No
No
18
Max Dwelling Density for Districts in Corridors
Districts in Identified Commercial
Corridors
NA
NA
Zoning Authority
with Identified Commercial Corridors
Green Lake Township
Yes
Core Place Units of Government Interviewed
Green Lake Township
2010
Data Source: Commercial Corridor Inventory Interview
No
% of Districts in Corridors where
Mixed Use is allowed by Right
25%R-1 | VR | VC | C
Max Building Height Allowed
in Corridors
35 ft
Interlochen

G&I 17 page 19
Infrastructure
Municipal Water Service
Additional CapacityWater Reliability StudyWellhead Protection Plan
Municipal Sewer Service
Additional CapacityWaste Water Master Plan
Broadband
Available TechnologiesFiber (non FTTH)CableDSL4G WirelessMunicipal WiFiFixed Wireless Broadband
Available SpeedsUltra - Greater that 1 Gigabit Per Second (Gbps)High - 100 Mbps to less than 1 Gbps
EnergyNatural GasUnderground Electric ServiceRenewable Energy Generation
Commercial Corridor Placemaking Elements
22
Available In Core Place
YesYesYesYesNoYes
NoYes
No
NA
NoNA
Yes
Yes
Green Lake Township
Data Source: Commercial Corridor Inventory Interviews
Units of Government Interviewed
Limited
Theaters &
Entertainment
Venues
Grocery StoresParks & Pocket
Parks
Pedestrian
Connections
Green Lake Interlochen Gateway No Yes
Job /
Population
Ratio
0.139
ID Name
Placemaking Elements Supporting Walkability
Yes No
YesNoNo
Available In Core Place
Interlochen

page 20 17 G&I
Talent Jobshed
Workers Living within Study AreaWorker Density (per acre)
Worker's Earnings% with earnings $1250/month or less% with earnings $1251/month to $3333/month% with earnings greater than $3333/month
Jobs Located in AreaJob Density (per acre)
Commute Data for Workers Employed in Core PlaceCommuting data for workers residing from 2 - 175 miles from G&I Area
Commuting Workers 20% Commuting 5 Miles or Less
Total Daily One Way Commute for all Commuters
Route Distance (Miles)Commute Time (Minutes)
Total Annual Commute for all Commuters
Distance (Miles)Time (Hours)
Annual Commuting Costs
Total Fuel CostTotal Cost (IRS 2014 Standard Mileage Rate)
Average Per Worker Commute
Distance (Miles)Time (Hours)Cost (IRS Standard Mileage Rate)
Retail Activity
Total Retail Sales
Total Potential Retail Sales
Leakage
Classification: Retail Potential Exporter
Sales by Retail Store Type
Food & Beverage StoresHealth/Personal Care StoresClothing & Accessories StoresSport/Hobby/Book/Music StoresGeneral Merchandise StoresFood & Beverage EstablishmentsE-Shopping/Mail-Order
119
2,415 3,131
$710,072
26%47%
Green Lake Township
0.07
0.30 0.14
27%
Interlochen CDP
235 2,574
1,2981270.16
41 0.9
$23
Core Place SalesPotential G&I Area
Sales
County ActivityG&I Area ActivityCore Place Activity
1,267,986 27,398
192,954
32%
25%44%
Census DataCore Place G&I Area
$1,996,388 $6,619,932
$0 $11,116,194 0%$281,169 $4,858,462 6%
$1,174,416,760$874,196,195
($300,220,565)
$19,108,487
$53,397,505
$34,289,018
$2,711,331$5,459,286$2,747,955
30%
Core Place Sales /
Potential G&I Sales
Residents of the Interlochen Growth & Investment Area are making 64% of their purchases at businesses located outside the area.
$0 $2,676,688 0%
$0 $4,272,947 0%$35,769 $2,558,864 1%
$0 $1,254,472 0%
230 $5,967
AnnualDaily (2-Way)
10,655
Interlochen

CC page 21
Central Business District
Corridor Overview
Corridor Segment and Surrounding 1/4 Mile Study Area Map
Economic DevelopmentCommunity policies or activities assisting economic development (Green Lake Township)
Growth & Investment Strategy Community Economic Strategy
Identify Areas of Focus for G&I Community Marketing Strategy
Development Opportunities Market Potential Development Sites
Publish Development Guide Capital Improvement Plan
Green Lake Interlochen Gateway22
YesNoNoNo
Unit(s) of Government:
M137 from US31 to 11th Street; US31 from Griner Parkway to White Oak Lane
No
Bike Lane:
14,480 Source: MDOT
2, Bi-Directional Traffic with Turn/Passing Lanes
No Street Parking
BATA - Fixed Route
No
None
15
Pedestrian Amenities:
Corridor Street Name(s):
Corridor Classification:
Length:
Street Classification:
2013 Traffic Volume(AADT):
Number of Traffic Lanes:
Walk Score
No
1.79 miles
Major Collector, Principal Arterial - Other
Green Lake Township
Parking
Transit Service:
Entertainment Venues:
The Interlochen Gateway Commercial area (the intersection of US 31 and M 137) is planned to provide a mix of commercial and office uses serving the needs of Township and area residents, to enhance and not compete with the Village Commercial area along the southern portion of the corridor. The site design for this area should be carefully planned to promote easy pedestrian and vehicle access to the village area while providing a logical transition from the highway. The Village Commercial district is planned along the frontage of M-137 within the platted Village area. The Village Commercial area provides a mix of commercial and office uses serving the needs of the year round resident population, seasonal visitors and tourists.
YesYesYes

page 22 CC
Study Area Summary for 1/4 Mile Area Surrounding the Corridor
Total Population (2010)
People per AcrePeople per Square Mile
Total Housing (2010)
Gross Neighborhood Density (per acre)
Study Area Size (Land Cover)
AcresSquare Miles
Workers Living within Study Area
% with earnings $1250/month or less% with earnings $1251/month to $3333/month% with earnings greater than $3333/month
Jobs Located within Study Area
Job Density (per acre)
Zoning
Infrastructure Traffic Counts
Public Utilities
Sewer N/A
Water Limited Additional Capacity
Energy Utilities
Underground ElectricRenewable Energy Production
Natural Gas
Broadband
Policy
Downtown Plan Yes
Corridor Improvement Plan No
Placemaking Elements
Theaters/Entertainment Venues No Grocery Stores YesRestaurants YesSidewalk Cafés YesParks Yes
Iconic Buildings No Pocket Parks NoPublic Art Installations NoWayfinding NoPedestrian Connections No
NoLimited
Yes
NoNo
(Fiber, Cable, DSL, 4G, Fixed Wireless)Yes - 5 Technologies
Highest Density District
% of Districts That Allow Multi-Family
by Right
26%
Lowest Density District
Max Residential Site DensityMax Building
Height
27%47%
G&I Area
5,784
277 2,958
2,574
0.73
% of Districts That Allow Residential
Use
Interlochen
25%44%32%
475
0.80
1.0
Green Lake Interlochen Gateway 22
Green Lake Interlochen Gateway
Corridor Segment
18.2 35 ft25%
793.60 18,675.201.24 29.18
0.160.35
% of Districts That Allow Mixed Use
By Right
0.25171
30%
25%45%
1,298
235
1270.16 0.07
0.31198
677.391.06
1,230
541
1.82
25%R-1 | VR | VC | C
District(s)
75%
G&I Core Place
583
Interlochen CDP
1,162
Census Data
470
-
5,000
10,000
15,000
20,000
25,000
30,000
35,000
40,000Mean (All Corridors)
M137 (US31 to 11th Street)
US31 (Griner Parkway toWhite Oak Lane)

G&I 18 page 23
Growth & Investment Area Unit(s) of Government:
Core Place Census Areas:
Village of Kingsley
County Census Class Land Area
Grand Traverse Rural G&I Area
Core Place
Aerial Map with Commercial Corridors
2 Commercial Corridors Identified
Highest Corridor Traffic Count (Annual Average Daily Traffic) 2013 Data Year
Population Density Range of G&I Area Corridors (per acre)
Gross Neighborhood Density Range of G&I Area Corridors (per acre)
Job Density Range of G&I Area Corridors (per acre)
Worker Density Range of G&I Area Corridors (per acre)
Retail
Total Sales Classification: Retail Potential ExporterPotential Sales
Leakage Seasonal Housing: 3.0% of G&I Area Housing
Sprawl
Percentage of Housing in the Core Place is Declining by -3.8%
Population
2000-2010: Growing at 12.5% with the Core Place Growing at 0.7%Average Age:
Demographic Shifts: Generation X had the largest % gain (up 12.6%); Silent Generation had the largest % loss (down -13.9%)
Jobshed
1.2 - 1.53.2 - 4.00.3 - 0.31.0 - 1.3
$8,238,207$38,080,625$29,842,418
Worker Exporter – Resident Worker population exceeds the number of Jobs by 39%
7,686
Village of Kingsley, Paradise Township
Kingsley
Density calculations a derived from the area within a 1/4 mile of Corridor (Corridor Study Area)
52.87 sq. miles
35.2 [ +11.5% change from 2000 Census ]
1.42 sq. miles

page 24 18 G&I
Population & Housing Trends
Total Population (2010)
Percentage Change from 2000People per AcrePeople per Square MileAverage Age [% Change from 2000]
Total Housing (2010)
Percentage Change from 2000Gross Neighborhood Density (per acre)
Total Households (2010)Percentage of Households without Children (under 18)
Study Area Size (Land Cover)
AcresSquare Miles
908.80
0.05
Housing in Core Place as a Percentage
of Total Growth & Investment AreaHousing Units in G&I Area and Core Place
52.87
1,480 4,713
1.63 0.141,042 89
568 1,796
Village of Kingsley Village of Kingsley, Paradise Township
33.6 [ +10.9% ] 35.2 [ +11.5% ]
Kingsley
0.63
Census DataCore Place G&I Area
1.4233,836.80
51% 56%519 1,624
+0.7% +12.5%
8.4% 21.3%
Percentage Change in Population in
G&I Area and Core Place
Percentage Change in Housing Units in
G&I Area and Core Place
43%
33% 29%
35% 32%
0%
20%
40%
60%
80%
100%
1970 1980 1990 2000 2010Average (all G&I Areas in Grand Traverse County)Average (all G&I Areas)Kingsley
505
763
912
1,4
81 1
,796
218
248
269
524
568
-
1,000
2,000
1970 1980 1990 2000 2010G&I Area Housing G&I Core Place Housing
13.8% 8.5%
94.8%
8.4%
51.1%
19.5%
62.4%
21.3%
-20%
0%
20%
40%
60%
80%
100%
120%
1980 1990 2000 2010
G&I Core Housing G&I Housing
Average For Core Areas Average For G&I Areas
5.1% 11.1%
99.1%
0.7%
47.6%
18.5%
67.1%
12.5%
-40%
-20%
0%
20%
40%
60%
80%
100%
120%
1980 1990 2000 2010
G&I Core Population G&I Population
Average For Core Areas Average For G&I Areas

G&I 18 page 25
Growth & Investment Readiness Assessment
1 Municipal Water
2 Municipal Sewer
3 Government Staff
4 Master Plan Includes Higher Density Center
5 Zoning Ordinance Supporting Master Plan Density Center
6 Core Place Population Increasing
7 Housing Growth Rate Over 15% (2000-2010 Census)
8 Core Place Housing Growth Increasing Faster than Surrounding Area
9 Census Class (Rural, Urban Cluster, Urbanized Area, MSA)
10 Job Density Over 75 Jobs Per Acre in Commercial Corridors
11 50% of Workers Living within 5 miles
12 Zoned Densities Greater Than 30 Dwellings/Acre in Commercial Corridors
13 Zoning Allows Mixed-Use by Right in Commercial Corridors
14 Zoning Allows Multi-Family Residential by Right in Commercial Corridors
15 Building Height Limits Greater than 35 feet in Commercial Corridors
16 No On Site Parking Requirement in Central Business District
17 Density Bonuses Offered for Contributions Towards Public Policy Goals
18 4 Key Placemaking Elements in Corridors
19 Retail Hub
20 Educational Institutions (Trade Schools, Community Colleges, Universities)
21 Contain Medical Centers
23 Walkable Density CBD or Commercial Corridors (20-30 Dwellings per Acre)
24 Community Identified Development Opportunities
25 Marketing Redevelopment & Infill Sites
22 Fixed Route Transit (Headways 15 mins or less)
30 Commercial Corridors with High Traffic Count AADT (Over 10k, Over 25k)
26 Additional Water Capacity
27 Additional Sewer Capacity
28 Broadband Service over 1 Gbps Available
29 Municipal WiFi
Zo
nin
g P
olicy
Pla
cem
akin
gIn
frastr
uctu
reO
pp
ort
un
ity
Init
ial S
ele
cti
on
Cri
teri
aC
en
su
s D
ata
Kingsley
Yes
No
No
Criteria Status
No
No
No
No
Yes
Yes
No
No
Yes
No
No
Yes
Yes
Yes
Yes
No
No
No
Yes
Yes
Yes
Yes
Yes
Yes
Yes
No
Rural

page 26 18 G&I
Commercial Corridors
ID
25
26
Growth & Investment Core Place Map with Commercial Corridors
Population
Density
(People per
acre)
Housing
Density
(Dwellings per
acre)
Corridor
Length (feet)
4,939 Kingsley M113 Corridor 3.2
Name
0.3 1.2 1.0 Kingsley Downtown CBD
Job Density
(Jobs per acre)
Worker
Density
(Workers per
acre)
1.5 0.3 1.3 3,367 4.0
Kingsley

G&I 18 page 27
Housing Data
Housing Efficiency Rating (Average HERS)
Efficiency compared to 2012 DOE Challenge Home (30 HERS)
Percentage Built by Year
Before 19401940-19491950-19591960-19691970-19791980-19891990-19992000-2009Later than 2010
Average Age
Median Value
Village of KingsleyParadise Township
Home Heating FuelPercent of Homes Natural GasPercent of Homes Using PropanePercent of Homes Using WoodPercent of Homes Using Solar Energy
Personal Income
Median Household Income (2012 Dollars)
Core Place
Village of Kingsley
G&I Area
Village of Kingsley
Paradise Township
Per Capita Annual Income (2012 Dollars)
Core Place
G&I Area
5%
86%
4%
1980
4%9%7%7%5%37%21%0%
$20,037
Household Income Distribution
$42,933
$130,600
Census-ACS Data (2008-2012 5 Year Summary File)
$20,059
3%3%
217187% Less Efficient
10%
$42,933$42,933
$47,964
$47,964
0%
$130,600$155,000
G&I Area
Village of Kingsley, Paradise TownshipCensus-ACS Data
4%13%14%32%22%0%
16%
9%
0%
$155,000
1982
39%
32%
Core Place
Village of Kingsley
211181% Less Efficient
Kingsley
0%
5%
10%
15%
Core Place G&I Area
All Core Places All G&I Areas

page 28 18 G&I
Policy
Year of Master Plan Approval
Master Plan Update
Community Economic Strategy
Economic Strategy Coordinates with Regional Strategy
Growth & Investment Strategy
Identify Areas of Focus for Growth & Investment Strategy
Active G&I Strategy Development Discussions
Planning Zoning Benchmarks
Development Opportunities on Corridor
Redevelopment Priorities Identified
Redevelopment Resources Identified
Market Potential Development Sites
Guides and Resources
Publish Development Guide
Zoning Orientation Package Provided to Staff & Committees
Zoning Training Funding
Community Marketing Strategy
Area Plans
Downtown PlanDowntown Development Authority
Corridor Improvement PlanCorridor Improvement Authority
Zoning
Yes
Yes
Yes
NA
Yes
No
% of Districts in Corridors where
Multi-Family Use is allowed by Right
17%
Yes
Yes
DDA Established 2005
Yes
Yes
Yes
Yes
Yes
40
Max Dwelling Density for Districts in Corridors
Districts in Identified Commercial
Corridors
NA
NA
Zoning Authority
with Identified Commercial Corridors
Village of Kingsley
Yes
Core Place Units of Government Interviewed
Village of Kingsley
2007
Data Source: Commercial Corridor Inventory Interview
Yes
% of Districts in Corridors where
Mixed Use is allowed by Right
17%R-1 | VR | F/P/RD | C-1 | C-2 | I
Max Building Height Allowed
in Corridors
55 ft
Kingsley

G&I 18 page 29
Infrastructure
Municipal Water Service
Additional CapacityWater Reliability StudyWellhead Protection Plan
Municipal Sewer Service
Additional CapacityWaste Water Master Plan
Broadband
Available TechnologiesFiber (non FTTH)CableDSL4G WirelessMunicipal WiFiFixed Wireless Broadband
Available SpeedsUltra - Greater that 1 Gigabit Per Second (Gbps)High - 100 Mbps to less than 1 Gbps
EnergyNatural GasUnderground Electric ServiceRenewable Energy Generation
Commercial Corridor Placemaking Elements
25
26
Available In Core Place
YesYesYesYesNoYes
NoYes
Yes
Yes
YesYes
Yes
Yes
Village of KingsleyData Source: Commercial Corridor Inventory Interviews
Units of Government Interviewed
Yes
Theaters &
Entertainment
Venues
Grocery StoresParks & Pocket
Parks
Pedestrian
Connections
Kingsley Downtown CBD No NoYesNo Yes Yes 0.102Kingsley M113 Corridor
Job /
Population
Ratio
0.080
ID Name
Placemaking Elements Supporting Walkability
Yes Yes
YesNoNo
Available In Core Place
Kingsley

page 30 18 G&I
Talent Jobshed
Workers Living within Study AreaWorker Density (per acre)
Worker's Earnings% with earnings $1250/month or less% with earnings $1251/month to $3333/month% with earnings greater than $3333/month
Jobs Located in AreaJob Density (per acre)
Commute Data for Workers Employed in Core PlaceCommuting data for workers residing from 2 - 175 miles from G&I Area
Commuting Workers 8% Commuting 5 Miles or Less
Total Daily One Way Commute for all Commuters
Route Distance (Miles)Commute Time (Minutes)
Total Annual Commute for all Commuters
Distance (Miles)Time (Hours)
Annual Commuting Costs
Total Fuel CostTotal Cost (IRS 2014 Standard Mileage Rate)
Average Per Worker Commute
Distance (Miles)Time (Hours)Cost (IRS Standard Mileage Rate)
Retail Activity
Total Retail Sales
Total Potential Retail Sales
Leakage
Classification: Retail Potential Exporter
Sales by Retail Store Type
Food & Beverage StoresHealth/Personal Care StoresClothing & Accessories StoresSport/Hobby/Book/Music StoresGeneral Merchandise StoresFood & Beverage EstablishmentsE-Shopping/Mail-Order
91
3,134 3,524
$921,458
32%42%
Village of Kingsley, Paradise Township
0.03
0.53 0.04
26%
Village of Kingsley
483 1,498
921960.11
69 1.3
$39
Core Place SalesPotential G&I Area
Sales
County ActivityG&I Area ActivityCore Place Activity
1,645,461 30,833
250,396
34%
27%39%
Census DataCore Place G&I Area
$0 $4,688,953
$421,715 $7,936,921 5%$131,663 $3,571,415 4%
$1,174,416,760$874,196,195
($300,220,565)
$8,238,207
$38,080,625
$29,842,418
$1,449,068$12,112,316$10,663,248
0%
Core Place Sales /
Potential G&I Sales
Residents of the Kingsley Growth & Investment Area are making 78% of their purchases at businesses located outside the area.
$0 $1,885,411 0%
$727,059 $2,975,457 24%$0 $1,887,699 0%$0 $893,463 0%
339 $10,126
AnnualDaily (2-Way)
18,082
Kingsley

CC page 31
Central Business District
Corridor Overview
Corridor Segment and Surrounding 1/4 Mile Study Area Map
Economic DevelopmentCommunity policies or activities assisting economic development (Village of Kingsley)
Growth & Investment Strategy Community Economic Strategy
Identify Areas of Focus for G&I Community Marketing Strategy
Development Opportunities Market Potential Development Sites
Publish Development Guide Capital Improvement Plan
Kingsley Downtown CBD25
YesYesYesYes
Unit(s) of Government:
Brownson Avenue from Cottage Street to Fenton Street; Main Street (M113) from Clark Street to Kingsley Ridge Drive
Yes
Bike Lane:
7,686 Source: N/A, MDOT
2, Bi-Directional Traffic with Turn/Passing Lanes
Parallel
BATA - Fixed Route
No
Sidewalks, Crosswalks, Mid-Block Crosswalks
63
Pedestrian Amenities:
Corridor Street Name(s):
Corridor Classification:
Length:
Street Classification:
2013 Traffic Volume(AADT):
Number of Traffic Lanes:
Walk Score
No
0.64 miles
Major Collector, Minor Arterial
Village of Kingsley
Parking
Transit Service:
Entertainment Venues:
The Village of Kingsley’s goal for this corridor is to promote an active, vibrant commercial downtown by accommodating small businesses primarily serving adjacent neighborhoods with day-to-day retail goods and services. The desired development pattern is one that mimics an historical downtown.
YesYesYes

page 32 CC
Study Area Summary for 1/4 Mile Area Surrounding the Corridor
Total Population (2010)
People per AcrePeople per Square Mile
Total Housing (2010)
Gross Neighborhood Density (per acre)
Study Area Size (Land Cover)
AcresSquare Miles
Workers Living within Study Area
% with earnings $1250/month or less% with earnings $1251/month to $3333/month% with earnings greater than $3333/month
Jobs Located within Study Area
Job Density (per acre)
Zoning
Infrastructure Traffic Counts
Public Utilities
Sewer Additional Capacity
Water Additional Capacity
Energy Utilities
Underground ElectricRenewable Energy Production
Natural Gas
Broadband
Policy
Downtown Plan Yes
Corridor Improvement Plan No
Placemaking Elements
Theaters/Entertainment Venues No Grocery Stores NoRestaurants YesSidewalk Cafés NoParks Yes
Iconic Buildings Yes Pocket Parks YesPublic Art Installations YesWayfinding NoPedestrian Connections Yes
YesYes
Kingsley Public Library
Yes
NoNo
(Fiber, Cable, DSL, 4G, Fixed Wireless)Yes - 5 Technologies
Highest Density District
% of Districts That Allow Multi-Family
by Right
32%
Lowest Density District
Max Residential Site DensityMax Building
Height
26%42%
G&I Area
4,713
568 1,796
1,498
1.63
% of Districts That Allow Residential
Use
Kingsley
27%39%34%
394
1.54
7.3
Kingsley Downtown CBD 25
Kingsley Downtown CBD
Corridor Segment
40.4 45 ft33%
908.80 33,836.801.42 52.87
0.050.63
% of Districts That Allow Mixed Use
By Right
0.3296
31%
26%43%
921
483
960.11 0.03
0.1489
304.060.48
1,204
467
3.96
33%VR | F/P/RD | C-1
District(s)
67%
G&I Core Place
1,480
Village of Kingsley
2,534
Census Data
1,042
-
5,000
10,000
15,000
20,000
25,000
30,000
35,000
40,000 Mean (All Corridors)
Brownson Avenue (CottageStreet to Fenton Street)
Main Street (M113) (ClarkStreet to Kingsley RidgeDrive)

CC page 33
Commercial/Industrial
Corridor Overview
Corridor Segment and Surrounding 1/4 Mile Study Area Map
Economic DevelopmentCommunity policies or activities assisting economic development (Village of Kingsley)
Growth & Investment Strategy Community Economic Strategy
Identify Areas of Focus for G&I Community Marketing Strategy
Development Opportunities Market Potential Development Sites
Publish Development Guide Capital Improvement Plan
Kingsley M113 Corridor26
YesYesYesYes
Unit(s) of Government:
M113 from Kingsley Ridge Drive to Summit City Road
Yes
Bike Lane:
7,686 Source: MDOT
2, Bi-Directional Traffic with Turn/Passing Lanes
Parallel
BATA - Fixed Route
No
Sidewalks
43
Pedestrian Amenities:
Corridor Street Name(s):
Corridor Classification:
Length:
Street Classification:
2013 Traffic Volume(AADT):
Number of Traffic Lanes:
Walk Score
No
0.94 miles
Minor Arterial
Village of Kingsley
Parking
Transit Service:
Entertainment Venues:
This Corridor provide areas exclusive of residential use and primarily dedicated to a wide variety of commercial business, professional and other services commonly associated with commercial truck movements, of the nuisance of smoke, dust, fumes, gas, heat, glare, noise, and/or vibration.
YesYesYes

page 34 CC
Study Area Summary for 1/4 Mile Area Surrounding the Corridor
Total Population (2010)
People per AcrePeople per Square Mile
Total Housing (2010)
Gross Neighborhood Density (per acre)
Study Area Size (Land Cover)
AcresSquare Miles
Workers Living within Study Area
% with earnings $1250/month or less% with earnings $1251/month to $3333/month% with earnings greater than $3333/month
Jobs Located within Study Area
Job Density (per acre)
Zoning
Infrastructure Traffic Counts
Public Utilities
Sewer Additional Capacity
Water Additional Capacity
Energy Utilities
Underground ElectricRenewable Energy Production
Natural Gas
Broadband
Policy
Downtown Plan Yes
Corridor Improvement Plan No
Placemaking Elements
Theaters/Entertainment Venues No Grocery Stores YesRestaurants NoSidewalk Cafés NoParks Yes
Iconic Buildings No Pocket Parks NoPublic Art Installations NoWayfinding NoPedestrian Connections Yes
YesYes
Yes
NoNo
(Fiber, Cable, DSL, 4G, Fixed Wireless)Yes - 5 Technologies
Highest Density District
% of Districts That Allow Multi-Family
by Right
32%
Lowest Density District
Max Residential Site DensityMax Building
Height
26%42%
G&I Area
4,713
568 1,796
1,498
1.63
% of Districts That Allow Residential
Use
Kingsley
27%39%34%
442
1.18
4.4
Kingsley M113 Corridor 26
Kingsley M113 Corridor
Corridor Segment
40.4 55 ft25%
908.80 33,836.801.42 52.87
0.050.63
% of Districts That Allow Mixed Use
By Right
0.33138
32%
28%40%
921
483
960.11 0.03
0.1489
423.350.66
1,347
498
3.18
25%R-1 | C-1 | C-2 | I
District(s)
50%
G&I Core Place
1,480
Village of Kingsley
2,036
Census Data
1,042
-
5,000
10,000
15,000
20,000
25,000
30,000
35,000
40,000Mean (All Corridors)
M113 (Kingsley Ridge Driveto Summit City Road)

G&I 19 page 35
Growth & Investment Area Unit(s) of Government:
Core Place Census Areas:
City of Traverse City, East Bay Charter Township, Charter Township of Garfield, Greilickville CDP
Counties Census Class Land Area
Grand Traverse & Leelanau Urban Cluster G&I Area
Core Place
Aerial Map with Commercial Corridors
24 Commercial Corridors Identified
Highest Corridor Traffic Count (Annual Average Daily Traffic) 2013 Data Year
Population Density Range of G&I Area Corridors (per acre)
Gross Neighborhood Density Range of G&I Area Corridors (per acre)
Job Density Range of G&I Area Corridors (per acre)
Worker Density Range of G&I Area Corridors (per acre)
Retail
Total Sales Classification: Regional Retail HubPotential Sales
Leakage Seasonal Housing: 7.3% of G&I Area Housing
Sprawl
Percentage of Housing in the Core Place is Growing by 0.2%
Population
2000-2010: Growing at 10.1% with the Core Place Growing at 8.6%Average Age:
Demographic Shifts: Generation X had the largest % gain (up 9.9%); Silent Generation had the largest % loss (down -5.5%)
Jobshed
0.6 - 4.61.5 - 8.6
0.3 - 25.00.6 - 4.5
$1,143,674,558$741,795,009
($401,879,549)
Worker Importer – Number of Jobs exceeds Resident Worker population by 51%
34,178
City of Traverse City, East Bay Charter Township, Charter Township of Garfield, Elmwood Charter Township, Acme Township, Blair Township, Long Lake Township, Peninsula Township
Traverse City & Surrounding Townships
Density calculations a derived from the area within a 1/4 mile of Corridor (Corridor Study Area)
197.78 sq. miles
41.1 [ +7.9% change from 2000 Census ]
79.37 sq. miles

page 36 19 G&I
Population & Housing Trends
Total Population (2010)
Percentage Change from 2000People per AcrePeople per Square MileAverage Age [% Change from 2000]
Total Housing (2010)
Percentage Change from 2000Gross Neighborhood Density (per acre)
Total Households (2010)Percentage of Households without Children (under 18)
Study Area Size (Land Cover)
AcresSquare Miles
50,796.80
0.27
Housing in Core Place as a Percentage
of Total Growth & Investment AreaHousing Units in G&I Area and Core Place
197.78
43,123 69,802
0.85 0.55543 353
21,631 34,164
City of Traverse City, Garfield, East Bay, Greilickville CDP
City of Traverse City, Greilickville CDP, Garfield Township, East
Bay Township, Acme Township, Blair Township
41.8 [ +6.6% ] 41.1 [ +7.9% ]
Traverse City & Surrounding Townships
0.43
Census DataCore Place G&I Area
79.37126,579.20
71% 69%19,071 29,475
+8.6% +10.1%
20.1% 19.8%
Percentage Change in Population in
G&I Area and Core Place
Percentage Change in Housing Units in
G&I Area and Core Place
69% 65% 65% 63% 63%
0%
20%
40%
60%
80%
100%
1970 1980 1990 2000 2010Average (all G&I Areas in Grand Traverse County)Average (all G&I Areas)Traverse City & Surrounding Townships
12,
559
18,
978
23,
714
28,
528
34,
164
8,6
07
12,
409
15,
344
18,
008
21,
631
-
5,000
10,000
15,000
20,000
25,000
30,000
35,000
40,000
1970 1980 1990 2000 2010G&I Area Housing G&I Core Place Housing
44.2%
23.7%
17.4% 20.1%
51.1%
25.0% 20.3% 19.8%
-20%
0%
20%
40%
60%
80%
100%
120%
1980 1990 2000 2010
G&I Core Housing G&I Housing
Average For Core Areas Average For G&I Areas
15.8% 15.3% 13.0% 8.6%
34.7%
18.6% 17.1%
10.1%
-40%
-20%
0%
20%
40%
60%
80%
100%
120%
1980 1990 2000 2010
G&I Core Population G&I Population
Average For Core Areas Average For G&I Areas

G&I 19 page 37
Growth & Investment Readiness Assessment
1 Municipal Water
2 Municipal Sewer
3 Government Staff
4 Master Plan Includes Higher Density Center
5 Zoning Ordinance Supporting Master Plan Density Center
6 Core Place Population Increasing
7 Housing Growth Rate Over 15% (2000-2010 Census)
8 Core Place Housing Growth Increasing Faster than Surrounding Area
9 Census Class (Rural, Urban Cluster, Urbanized Area, MSA)
10 Job Density Over 75 Jobs Per Acre in Commercial Corridors
11 50% of Workers Living within 5 miles
12 Zoned Densities Greater Than 30 Dwellings/Acre in Commercial Corridors
13 Zoning Allows Mixed-Use by Right in Commercial Corridors
14 Zoning Allows Multi-Family Residential by Right in Commercial Corridors
15 Building Height Limits Greater than 35 feet in Commercial Corridors
16 No On Site Parking Requirement in Central Business District
17 Density Bonuses Offered for Contributions Towards Public Policy Goals
18 4 Key Placemaking Elements in Corridors
19 Retail Hub
20 Educational Institutions (Trade Schools, Community Colleges, Universities)
21 Contain Medical Centers
23 Walkable Density CBD or Commercial Corridors (20-30 Dwellings per Acre)
24 Community Identified Development Opportunities
25 Marketing Redevelopment & Infill Sites
22 Fixed Route Transit (Headways 15 mins or less)
30 Commercial Corridors with High Traffic Count AADT (Over 10k, Over 25k)
26 Additional Water Capacity
27 Additional Sewer Capacity
28 Broadband Service over 1 Gbps Available
29 Municipal WiFi
Zo
nin
g P
olicy
Pla
cem
akin
gIn
frastr
uctu
reO
pp
ort
un
ity
Init
ial S
ele
cti
on
Cri
teri
aC
en
su
s D
ata
Traverse City & Surrounding Townships
Yes
Limited
Yes
Criteria Status
Yes - Regional
Yes
Yes
No
Yes
Yes
Yes
Yes > 25,000
Yes
No
No
Yes
Yes
Yes
Yes
Yes
Yes
Yes
Yes
Yes
Yes
Yes
Yes
Yes
Yes
Yes
Urban Cluster

page 38 19 G&I
Commercial Corridors
ID
27
28
29
30
31
32
33
34
35
36
37
38
39
40
41
42
21
43
44
45
46
47
48
49
Growth & Investment Core Place Map with Commercial Corridors
Traverse City West Front Street
4.8 Traverse City M22/M72 Corridor
2.0 1.5
Population
Density
(People per
acre)
Housing
Density
(Dwellings per
acre)
Corridor
Length (feet)
Traverse City CBD Eighth Street Corridor
2.0
7,061
5,024
1,360
1,901
4,350
6,452
13,355
Traverse City CBD Front/State Street CorridorTraverse City CBD Cass Street Corridor
7.6
6.6 6.8 8.6 7.2 Traverse City CBD Boardman Ave. Corridor
2,123
1,724
1,618
4,551
20,592
4,506
8,570
27,243
12,090
4,050
10,199
25,079
Name
3.8 4.6 3.9 3.8 2.8
4.1
14.4 17.1 8.7 9.6 2.0
21.7 5.5 2.1
3.9
3.8 3.5 2.5 4.1 2.6 2.5 4.1
6.5 6.2 2.7 3.2
1.9
3.9 4.0 5.5
1.9
4.2 1.0
0.6 1.0
1.2
0.6 1.5
3.1
3.1 3.2 1.4 1.6 2.4 0.8
Traverse City US 31 Corridor
Traverse City East Front Street
Traverse City Munson Ave CorridorBlair Chums Corner/Grawn Corridor
1.9 1.3 2.1 3.4 1.1 2.3 1.6 0.7 0.7
Garfield Cass Road Corridor
0.9 1.2
2.9
0.7
Garfield Barlow Park Corridor
Traverse City Garfield Avenue Corridor 3.7
25.0 2.9 2.6
Traverse City CBD Warehouse DistrictTraverse City Division Street Neighborhood Commercial CorridorTraverse City 14th Street CorridorTraverse City 8th Street Corridor
Traverse City CBD Union Street Corridor
Job Density
(Jobs per acre)
Worker
Density
(Workers per
acre)
0.6
4.8 0.4 1.0 5.3 3.6 4.9
3.7
4.0 14.5 4.5
3.3
4.8 7.8 7.7 5.9
2,730 7.9
3.6 0.3
East Bay Miracle Mile CorridorEast Bay 3 Mile & Hammond CorridorElmwood Cherry Bend CorridorGarfield South Airport Corridor 22,685
Traverse City CBD Woodmere Ave Corridor
2.9 7.6 1.7
5,364
26,154
7,795
Acme US31/M72 Acme Shores Corridor2.5 1.5 3.7
Traverse City & Surrounding Townships

G&I 19 page 39
Housing Data
Housing Efficiency Rating (Average HERS)
Efficiency compared to 2012 DOE Challenge Home (30 HERS)
Percentage Built by Year
Before 19401940-19491950-19591960-19691970-19791980-19891990-19992000-2009Later than 2010
Average Age
Median Value
City of Traverse CityEast Bay Charter TownshipCharter Township of GarfieldElmwood Charter TownshipAcme TownshipBlair TownshipLong Lake TownshipPeninsula Township
Home Heating FuelPercent of Homes Natural GasPercent of Homes Using PropanePercent of Homes Using WoodPercent of Homes Using Solar Energy
Personal Income
Median Household Income (2012 Dollars)
Core Place
City of Traverse City
East Bay Charter Township
Charter Township of Garfield
Greilickville CDP
G&I Area
City of Traverse City
East Bay Charter Township
Charter Township of Garfield
Elmwood Charter Township
Acme Township
Blair Township
Long Lake Township
Peninsula Township
Per Capita Annual Income (2012 Dollars)
Core Place
G&I Area
5%
82%
2%
1974
4%7%7%19%16%15%18%0%
$121,000$178,900$341,200
$29,334
$41,712
Household Income Distribution
$44,542
Census-ACS Data (2008-2012 5 Year Summary File)
$28,051
3%6%
246216% Less Efficient
13%
$157,000$223,200$197,200
$44,542
$59,817
$56,778
$59,817
0%
$41,712
$66,036
$77,654
$44,521
$174,500$165,000
G&I AreaCity of Traverse City, Greilickville CDP, Garfield Township, East Bay Township,
Acme Township, Blair Township
Census-ACS Data
6%20%17%17%19%0%
3%
11%
0%
1977
8%
79%
$61,782
$76,466
Core Place
City of Traverse City, Garfield, East Bay, Greilickville CDP
238208% Less Efficient
Traverse City & Surrounding Townships
0%
5%
10%
15%
Core Place G&I Area
All Core Places All G&I Areas

page 40 19 G&I
Policy
Year of Master Plan Approval
Master Plan Update
Community Economic Strategy
Economic Strategy Coordinates with Regional Strategy
Growth & Investment Strategy
Identify Areas of Focus for Growth & Investment Strategy
Active G&I Strategy Development Discussions
Planning Zoning Benchmarks
Development Opportunities on Corridor
Redevelopment Priorities Identified
Redevelopment Resources Identified
Market Potential Development Sites
Guides and Resources
Publish Development Guide
Zoning Orientation Package Provided to Staff & Committees
Zoning Training Funding
Community Marketing Strategy
Area Plans
Downtown PlanDowntown Development Authority
Corridor Improvement PlanCorridor Improvement Authority
Zoning
Yes No Yes Yes
Yes Yes Yes Yes
Yes No Yes Yes
NA Yes NA NA
Yes No
No No
Yes No No
7
33%
0%
% of Districts in Corridors where
Multi-Family Use is allowed by Right
8%
83%
8%
0%
33%41
25
Yes No
Yes Yes Yes No
Yes
55 ft
50 ft
No Yes No
DDA Established 1978
Yes No
Yes No No No
Yes Yes
Yes Yes Yes
Yes No
Yes Yes
Yes
Yes
90
Max Dwelling Density for Districts in Corridors
Districts in Identified Commercial
Corridors
NA 39853
Yes
Yes NA
Zoning Authority
with Identified Commercial Corridors
City of Traverse City
Acme Township
Blair Township
R-1A | R-1B | R-1C | R-1M | R-1MH | C-1 | C-1-O | C-2 | C-3 | C-4 | MUIBD-G | MUIBD-L | A-1
2012
Yes No No
Yes
No
Core Place Units of Government Interviewed
City of Traverse City
East Bay Charter Township
Charter Township of Garfield
Elmwood Charter Township
2009 1999 2007
Yes
Data Source: Commercial Corridor Inventory Interview
1905
NA NAYes NA
B-1P | B-1S | B-2 | B-3 | R-2 | R-3
RN | CM | RC | V | BV | IS
76
LDR | MDR | RB | VC | PO | IND
R-1 | NC | GC | SC
33%
0%
% of Districts in Corridors where
Mixed Use is allowed by Right
NA
40 ft
67%
Elmwood Township
Charter Township of Garfield
East Bay Township
Yes
33%
R-1b | R-2 | R-9 | R-15 | R-29 | HR | C-1 | C-2 | C-3 | C-4a | C-4b | C-4c | I | D-1 | D-2 | D-3 | H-1 | H-2
17%
40 ft
Max Building Height Allowed
in Corridors
85 ft
50
35 ft
Traverse City & Surrounding Townships

G&I 19 page 41
Infrastructure
Municipal Water Service
Additional CapacityWater Reliability StudyWellhead Protection Plan
Municipal Sewer Service
Additional CapacityWaste Water Master Plan
Broadband
Available TechnologiesFiber (non FTTH)CableDSL4G WirelessMunicipal WiFiFixed Wireless Broadband
Available SpeedsUltra - Greater that 1 Gigabit Per Second (Gbps)High - 100 Mbps to less than 1 Gbps
EnergyNatural GasUnderground Electric ServiceRenewable Energy Generation
Commercial Corridor Placemaking Elements
27
28
29
30
31
32
33
34
35
36
37
38
39
40
41
42
21
43
44
45
46
47
48
49
Available In Core Place
YesYesYesYesYesYes
LimitedYes
Yes Yes Yes Yes
Yes Yes Yes Yes
NA
0.4742.844
1.9070.2370.2591.847
Yes
LimitedYes Yes Yes Yes
Yes
Yes
Yes Yes Yes Yes
Yes No No
City of Traverse City
East Bay Charter Township
Data Source: Commercial Corridor Inventory Interviews
Units of Government Interviewed
Yes Yes
Yes Yes
Theaters &
Entertainment
Venues
Grocery StoresParks & Pocket
Parks
Pedestrian
Connections
Yes
Charter Township of Garfield
Elmwood Charter Township
Yes
Traverse City CBD Union Street Corridor No Yes
Yes
1.3310.264
YesTraverse City CBD Cass Street Corridor Yes No Yes YesTraverse City CBD Eighth Street Corridor Yes No
Yes No Yes 2.1702.5261.015
Traverse City CBD Boardman Ave. Corridor No No Yes Yes
Traverse City CBD Front/State Street Corridor
No
4.5100.698
Traverse City 14th Street Corridor No Yes No YesTraverse City 8th Street Corridor No Yes No Yes
0.2650.652
Traverse City CBD Warehouse District No No Yes YesTraverse City Division Street Neighborhood Commercial Corridor No No Yes
Garfield Barlow Park Corridor No Yes Yes No
East Bay Miracle Mile Corridor No No Yes YesEast Bay 3 Mile & Hammond Corridor No Yes No YesElmwood Cherry Bend Corridor No No
Job /
Population
Ratio
1.836
Blair Chums Corner/Grawn Corridor
1.0860.853
Traverse City West Front Street No Yes No YesTraverse City US 31 Corridor Yes Yes Yes Yes
4.0401.082
Traverse City Garfield Avenue Corridor No YesNo
Traverse City Munson Ave Corridor No Yes
ID Name
Placemaking Elements Supporting Walkability
No Yes Yes
Traverse City CBD Woodmere Ave Corridor No No Yes Yes
Yes Yes
Yes YesTraverse City East Front Street
Garfield Cass Road Corridor No No Yes No
YesYesYes
Available In Core Place
Yes YesGarfield South Airport Corridor Yes Yes Yes Yes
0.8100.7530.1600.382
Yes Yes YesYes
No Yes Yes No
Traverse City & Surrounding Townships
Traverse City M22/M72 Corridor Yes
Acme US31/M72 Acme Shores Corridor No Yes Yes Yes

page 42 19 G&I
Talent Jobshed
Workers Living within Study AreaWorker Density (per acre)
Worker's Earnings% with earnings $1250/month or less% with earnings $1251/month to $3333/month% with earnings greater than $3333/month
Jobs Located in AreaJob Density (per acre)
Commute Data for Workers Employed in Core PlaceCommuting data for workers residing from 2 - 175 miles from G&I Area
Commuting Workers 21% Commuting 5 Miles or Less
Total Daily One Way Commute for all Commuters
Route Distance (Miles)Commute Time (Minutes)
Total Annual Commute for all Commuters
Distance (Miles)Time (Hours)
Annual Commuting Costs
Total Fuel CostTotal Cost (IRS 2014 Standard Mileage Rate)
Average Per Worker Commute
Distance (Miles)Time (Hours)Cost (IRS Standard Mileage Rate)
Retail Activity
Total Retail Sales
Total Potential Retail Sales
Leakage
Classification: Regional Retail Hub
Sales by Retail Store Type
Food & Beverage StoresHealth/Personal Care StoresClothing & Accessories StoresSport/Hobby/Book/Music StoresGeneral Merchandise StoresFood & Beverage EstablishmentsE-Shopping/Mail-Order
33,411
931,020 1,164,167
$273,719,976
31%41%
City of Traverse City, Greilickville CDP, Garfield Township, East
Bay Township, Acme Township, Blair Township
0.34
0.35 0.22
28%
City of Traverse City, Garfield, East Bay, Greilickville CDP
17,788 28,068
42,47736,9800.73
56 1.2
$31
Core Place SalesPotential G&I Area
Sales
County ActivityG&I Area ActivityCore Place Activity
488,785,671 10,186,461
74,380,428
32%
28%40%
Census DataCore Place G&I Area
$79,869,635 $92,579,299
$291,251,270 $154,829,800 188%$103,356,766 $69,753,375 148%
$1,174,416,760$874,196,195
($300,220,565)
$1,143,674,558
$741,795,009
($401,879,549)
$998,850,352$441,843,288
($557,007,064)
86%
Core Place Sales /
Potential G&I Sales
Traverse City & Surrounding Townships area businesses are capturing sales from the residents of Traverse City & Surrounding Townships area as well as areas inside and outside Grand Traverse County.
$3,796,778 $37,169,546 10%
$66,187,168 $58,220,755 114%$58,030,635 $37,272,875 156%$46,178,613 $17,915,748 258%
305 $8,193
AnnualDaily (2-Way)
14,629
Traverse City & Surrounding Townships

CC page 43
Central Business District
Corridor Overview
Corridor Segment and Surrounding 1/4 Mile Study Area Map
Economic DevelopmentCommunity policies or activities assisting economic development (City of Traverse City)
Growth & Investment Strategy Community Economic Strategy
Identify Areas of Focus for G&I Community Marketing Strategy
Development Opportunities Market Potential Development Sites
Publish Development Guide Capital Improvement Plan
Traverse City CBD Union Street Corridor27
YesYesYesYes
Unit(s) of Government:
Union Street from Grandview Parkway to 9th Street
Yes
Bike Lane:
6,885 Source: City of Traverse City
2, Bi-Directional Traffic
Parallel, Parking Structure(s)
BATA - Fixed Route
No
Sidewalks, Crosswalks
94
Pedestrian Amenities:
Corridor Street Name(s):
Corridor Classification:
Length:
Street Classification:
2013 Traffic Volume(AADT):
Number of Traffic Lanes:
Walk Score
No
0.52 miles
Major Collector
City of Traverse City
Parking
Transit Service:
Entertainment Venues:
The Union Street Commercial Corridor is located in Traverse City’s Downtown Neighborhood and is in the most formally and intensely developed of the city’s two types of commercial neighborhoods. The focus is on high intensity, regional, commercial activity. The overall level of intensity generated within the confines of each district in this class of neighborhood tends to be the highest of commercial uses.
YesYesYes

page 44 CC
Study Area Summary for 1/4 Mile Area Surrounding the Corridor
Total Population (2010)
People per AcrePeople per Square Mile
Total Housing (2010)
Gross Neighborhood Density (per acre)
Study Area Size (Land Cover)
AcresSquare Miles
Workers Living within Study Area
% with earnings $1250/month or less% with earnings $1251/month to $3333/month% with earnings greater than $3333/month
Jobs Located within Study Area
Job Density (per acre)
Zoning
Infrastructure Traffic Counts
Public Utilities
Sewer Additional Capacity
Water Additional Capacity
Energy Utilities
Underground ElectricRenewable Energy Production
Natural Gas
Broadband
Policy
Downtown Plan Yes
Corridor Improvement Plan Yes
Placemaking Elements
Theaters/Entertainment Venues No Grocery Stores YesRestaurants YesSidewalk Cafés YesParks Yes
Iconic Buildings Yes Pocket Parks YesPublic Art Installations YesWayfinding YesPedestrian Connections Yes
YesYes
Lars Hockstad Auditorium
US Post Office, Hannah & Lay Mercantile Building, Boardman River Bridge, Perry Hannah House, Traverse City State Bank Building
Yes
YesYes
(Fiber, Cable, DSL, WiFi, 4G, Fixed Wireless)
(Solar)
Yes - 6 Technologies
Highest Density District
% of Districts That Allow Multi-Family
by Right
31%
Lowest Density District
Max Residential Site DensityMax Building
Height
28%41%
G&I Area
69,802
21,631 34,164
28,068
0.85
% of Districts That Allow Residential
Use
Traverse City & Surrounding Townships
28%40%32%
1,160
4.01
55.4
Traverse City CBD Union Street Corridor 27
Traverse City CBD Union Street Corridor
Corridor Segment
89.7 85 ft100%
50,796.80 126,579.2079.37 197.78
0.270.43
% of Districts That Allow Mixed Use
By Right
14.523,761
30%
31%39%
42,477
17,788
36,9800.73 0.34
DDA Established 1978
0.55353
259.060.40
2,048
1,040
7.91
100%C-2 | C-4a | C-4b | C-4c
District(s)
100%
G&I Core Place
43,123
City of Traverse City, Garfield, East Bay, Greilickville CDP
5,059
Census Data
543
-
5,000
10,000
15,000
20,000
25,000
30,000
35,000
40,000Mean (All Corridors)
Union Street (GrandviewParkway to 9th Street)

CC page 45
Central Business District
Corridor Overview
Corridor Segment and Surrounding 1/4 Mile Study Area Map
Economic DevelopmentCommunity policies or activities assisting economic development (City of Traverse City)
Growth & Investment Strategy Community Economic Strategy
Identify Areas of Focus for G&I Community Marketing Strategy
Development Opportunities Market Potential Development Sites
Publish Development Guide Capital Improvement Plan
Traverse City CBD Front/State Street Corridor28
YesYesYesYes
Unit(s) of Government:
Front Street from Boardman River to Wellington; State Street from Front Street to Boardman
Yes
Bike Lane:
8,498 Source: City of Traverse City
2, Sections with Bi-Directional or One Way Traffic
Parallel, Parking Structure(s)
BATA - Fixed Route
Yes
Sidewalks, Crosswalks, Mid-Block Crosswalks
98
Pedestrian Amenities:
Corridor Street Name(s):
Corridor Classification:
Length:
Street Classification:
2013 Traffic Volume(AADT):
Number of Traffic Lanes:
Walk Score
Yes
1.34 miles
Major Collector
City of Traverse City
Parking
Transit Service:
Entertainment Venues:
The E. Front Street Commercial Corridor is located in Traverse City’s Downtown Neighborhood and is the most formally and intensely developed of the city’s two types of commercial neighborhoods. The focus is on high intensity, regional, commercial activity. The overall level of intensity generated within the confines of each district in this class of neighborhood tends to be the highest of commercial uses.
YesYesYes

page 46 CC
Study Area Summary for 1/4 Mile Area Surrounding the Corridor
Total Population (2010)
People per AcrePeople per Square Mile
Total Housing (2010)
Gross Neighborhood Density (per acre)
Study Area Size (Land Cover)
AcresSquare Miles
Workers Living within Study Area
% with earnings $1250/month or less% with earnings $1251/month to $3333/month% with earnings greater than $3333/month
Jobs Located within Study Area
Job Density (per acre)
Zoning
Infrastructure Traffic Counts
Public Utilities
Sewer Additional Capacity
Water Additional Capacity
Energy Utilities
Underground ElectricRenewable Energy Production
Natural Gas
Broadband
Policy
Downtown Plan Yes
Corridor Improvement Plan Yes
Placemaking Elements
Theaters/Entertainment Venues Yes Grocery Stores NoRestaurants YesSidewalk Cafés YesParks Yes
Iconic Buildings Yes Pocket Parks YesPublic Art Installations YesWayfinding YesPedestrian Connections Yes
YesYes
Opera House, State Theater, Bijou, Park Place
Opera House, US Post Office, Park Place, Hannah & Lay Mercantile Building, Beadle Building, Traverse City State Bank Building
Yes
YesYes
(Fiber, Cable, DSL, WiFi, 4G, Fixed Wireless)
(Wind, Solar)
Yes - 6 Technologies
Highest Density District
% of Districts That Allow Multi-Family
by Right
31%
Lowest Density District
Max Residential Site DensityMax Building
Height
28%41%
G&I Area
69,802
21,631 34,164
28,068
0.85
% of Districts That Allow Residential
Use
Traverse City & Surrounding Townships
28%40%32%
1,212
3.76
79.2
Traverse City CBD Front/State Street Corridor 28
Traverse City CBD Front/State Street Corridor
Corridor Segment
89.7 85 ft100%
50,796.80 126,579.2079.37 197.78
0.270.43
% of Districts That Allow Mixed Use
By Right
14.424,989
29%
31%40%
42,477
17,788
36,9800.73 0.34
DDA Established 1978
0.55353
345.910.54
2,299
1,301
6.65
100%C-4a | C-4b | C-4c
District(s)
100%
G&I Core Place
43,123
City of Traverse City, Garfield, East Bay, Greilickville CDP
4,254
Census Data
543
-
5,000
10,000
15,000
20,000
25,000
30,000
35,000
40,000Mean (All Corridors)
Front Street (BoardmanRiver to Wellington)
State Street (Front Street toBoardman)
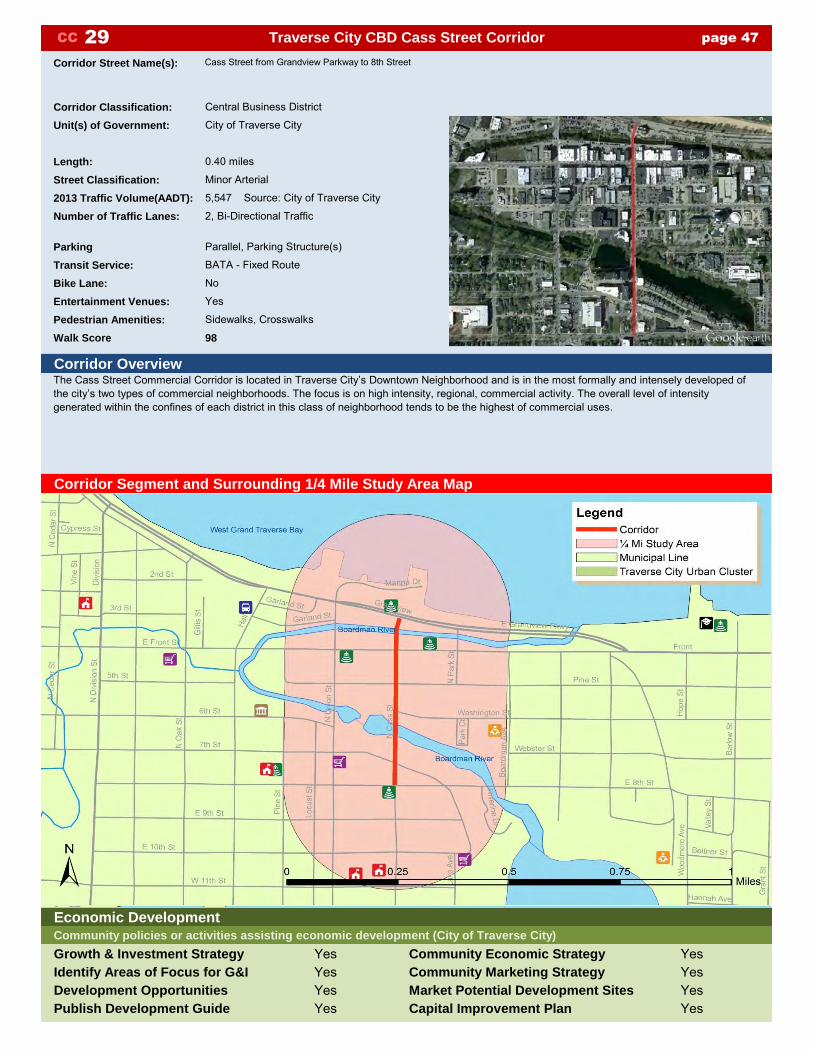
CC page 47
Central Business District
Corridor Overview
Corridor Segment and Surrounding 1/4 Mile Study Area Map
Economic DevelopmentCommunity policies or activities assisting economic development (City of Traverse City)
Growth & Investment Strategy Community Economic Strategy
Identify Areas of Focus for G&I Community Marketing Strategy
Development Opportunities Market Potential Development Sites
Publish Development Guide Capital Improvement Plan
Traverse City CBD Cass Street Corridor29
YesYesYesYes
Unit(s) of Government:
Cass Street from Grandview Parkway to 8th Street
Yes
Bike Lane:
5,547 Source: City of Traverse City
2, Bi-Directional Traffic
Parallel, Parking Structure(s)
BATA - Fixed Route
Yes
Sidewalks, Crosswalks
98
Pedestrian Amenities:
Corridor Street Name(s):
Corridor Classification:
Length:
Street Classification:
2013 Traffic Volume(AADT):
Number of Traffic Lanes:
Walk Score
No
0.40 miles
Minor Arterial
City of Traverse City
Parking
Transit Service:
Entertainment Venues:
The Cass Street Commercial Corridor is located in Traverse City’s Downtown Neighborhood and is in the most formally and intensely developed of the city’s two types of commercial neighborhoods. The focus is on high intensity, regional, commercial activity. The overall level of intensity generated within the confines of each district in this class of neighborhood tends to be the highest of commercial uses.
YesYesYes
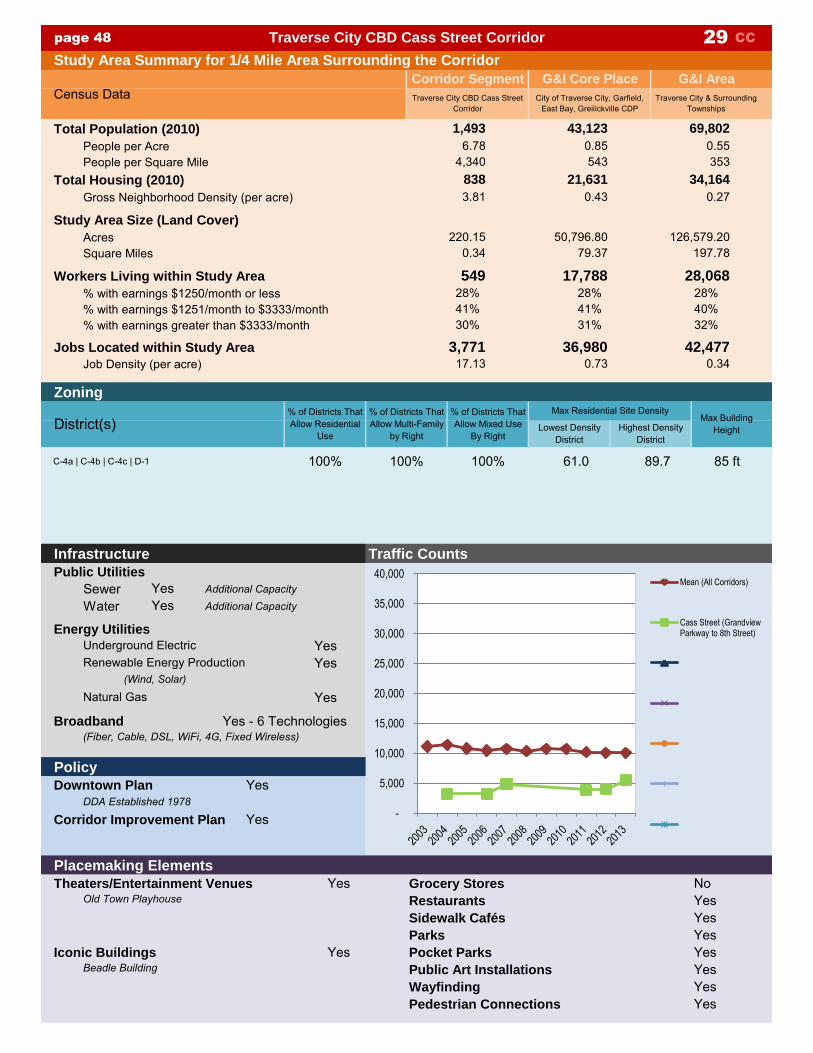
page 48 CC
Study Area Summary for 1/4 Mile Area Surrounding the Corridor
Total Population (2010)
People per AcrePeople per Square Mile
Total Housing (2010)
Gross Neighborhood Density (per acre)
Study Area Size (Land Cover)
AcresSquare Miles
Workers Living within Study Area
% with earnings $1250/month or less% with earnings $1251/month to $3333/month% with earnings greater than $3333/month
Jobs Located within Study Area
Job Density (per acre)
Zoning
Infrastructure Traffic Counts
Public Utilities
Sewer Additional Capacity
Water Additional Capacity
Energy Utilities
Underground ElectricRenewable Energy Production
Natural Gas
Broadband
Policy
Downtown Plan Yes
Corridor Improvement Plan Yes
Placemaking Elements
Theaters/Entertainment Venues Yes Grocery Stores NoRestaurants YesSidewalk Cafés YesParks Yes
Iconic Buildings Yes Pocket Parks YesPublic Art Installations YesWayfinding YesPedestrian Connections Yes
YesYes
Old Town Playhouse
Beadle Building
Yes
YesYes
(Fiber, Cable, DSL, WiFi, 4G, Fixed Wireless)
(Wind, Solar)
Yes - 6 Technologies
Highest Density District
% of Districts That Allow Multi-Family
by Right
31%
Lowest Density District
Max Residential Site DensityMax Building
Height
28%41%
G&I Area
69,802
21,631 34,164
28,068
0.85
% of Districts That Allow Residential
Use
Traverse City & Surrounding Townships
28%40%32%
549
3.81
61.0
Traverse City CBD Cass Street Corridor 29
Traverse City CBD Cass Street Corridor
Corridor Segment
89.7 85 ft100%
50,796.80 126,579.2079.37 197.78
0.270.43
% of Districts That Allow Mixed Use
By Right
17.133,771
30%
28%41%
42,477
17,788
36,9800.73 0.34
DDA Established 1978
0.55353
220.150.34
1,493
838
6.78
100%C-4a | C-4b | C-4c | D-1
District(s)
100%
G&I Core Place
43,123
City of Traverse City, Garfield, East Bay, Greilickville CDP
4,340
Census Data
543
-
5,000
10,000
15,000
20,000
25,000
30,000
35,000
40,000Mean (All Corridors)
Cass Street (GrandviewParkway to 8th Street)

CC page 49
Central Business District
Corridor Overview
Corridor Segment and Surrounding 1/4 Mile Study Area Map
Economic DevelopmentCommunity policies or activities assisting economic development (City of Traverse City)
Growth & Investment Strategy Community Economic Strategy
Identify Areas of Focus for G&I Community Marketing Strategy
Development Opportunities Market Potential Development Sites
Publish Development Guide Capital Improvement Plan
Traverse City CBD Eighth Street Corridor30
YesYesYesYes
Unit(s) of Government:
Eigth Street from Locust Street to Barlow Street
Yes
Bike Lane:
12,081 Source: City of Traverse City
2-4, Bi-Directional Traffic with Turn/Passing Lanes
Parallel, Parking Structure(s)
BATA - Fixed Route
Yes
Sidewalks, Crosswalks
89
Pedestrian Amenities:
Corridor Street Name(s):
Corridor Classification:
Length:
Street Classification:
2013 Traffic Volume(AADT):
Number of Traffic Lanes:
Walk Score
No
0.95 miles
Minor Arterial
City of Traverse City
Parking
Transit Service:
Entertainment Venues:
The Eighth Street Corridor divides Traverse City's Downtown from the largely residential areas to the south. As the most southerly east/west route across town, portions of Eighth Street average more than 20,000 vehicles per day making it one of the busiest streets in the City. Along its length, Eighth Street has several different “character areas,” each influenced by traffic volumes, existing land uses, proximity to Downtown, and other factors that will increase each area's potential.
YesYesYes

page 50 CC
Study Area Summary for 1/4 Mile Area Surrounding the Corridor
Total Population (2010)
People per AcrePeople per Square Mile
Total Housing (2010)
Gross Neighborhood Density (per acre)
Study Area Size (Land Cover)
AcresSquare Miles
Workers Living within Study Area
% with earnings $1250/month or less% with earnings $1251/month to $3333/month% with earnings greater than $3333/month
Jobs Located within Study Area
Job Density (per acre)
Zoning
Infrastructure Traffic Counts
Public Utilities
Sewer Additional Capacity
Water Additional Capacity
Energy Utilities
Underground ElectricRenewable Energy Production
Natural Gas
Broadband
Policy
Downtown Plan Yes
Corridor Improvement Plan Yes
Placemaking Elements
Theaters/Entertainment Venues Yes Grocery Stores NoRestaurants YesSidewalk Cafés YesParks Yes
Iconic Buildings Yes Pocket Parks YesPublic Art Installations YesWayfinding YesPedestrian Connections Yes
YesYes
Lars Hockstad Auditorium, Old Town Playhouse
Traverse City Train Depot
Yes
NoYes
(Fiber, Cable, DSL, WiFi, 4G, Fixed Wireless)
(Other)
Yes - 6 Technologies
Highest Density District
% of Districts That Allow Multi-Family
by Right
31%
Lowest Density District
Max Residential Site DensityMax Building
Height
28%41%
G&I Area
69,802
21,631 34,164
28,068
0.85
% of Districts That Allow Residential
Use
Traverse City & Surrounding Townships
28%40%32%
1,686
4.64
29.0
Traverse City CBD Eighth Street Corridor 30
Traverse City CBD Eighth Street Corridor
Corridor Segment
69.7 45 ft100%
50,796.80 126,579.2079.37 197.78
0.270.43
% of Districts That Allow Mixed Use
By Right
8.713,617
29%
30%41%
42,477
17,788
36,9800.73 0.34
DDA Established 1978
0.55353
415.170.65
3,565
1,925
8.59
83%R-29 | C-1 | C-2 | C-3 | D-1 | D-2
District(s)
100%
G&I Core Place
43,123
City of Traverse City, Garfield, East Bay, Greilickville CDP
5,496
Census Data
543
-
5,000
10,000
15,000
20,000
25,000
30,000
35,000
40,000Mean (All Corridors)
Eigth Street (Locust Streetto Barlow Street)

CC page 51
Central Business District
Corridor Overview
Corridor Segment and Surrounding 1/4 Mile Study Area Map
Economic DevelopmentCommunity policies or activities assisting economic development (City of Traverse City)
Growth & Investment Strategy Community Economic Strategy
Identify Areas of Focus for G&I Community Marketing Strategy
Development Opportunities Market Potential Development Sites
Publish Development Guide Capital Improvement Plan
Traverse City CBD Boardman Ave. Corridor31
YesYesYesYes
Unit(s) of Government:
Boardman Avenue from Front Street to 8th Street
Yes
Bike Lane:
6,629 Source: City of Traverse City
2, Bi-Directional Traffic
Parallel
BATA - Fixed Route
No
Sidewalks, Crosswalks
92
Pedestrian Amenities:
Corridor Street Name(s):
Corridor Classification:
Length:
Street Classification:
2013 Traffic Volume(AADT):
Number of Traffic Lanes:
Walk Score
No
0.33 miles
Major Collector
City of Traverse City
Parking
Transit Service:
Entertainment Venues:
The Boardman Avenue Corridor divides Traverse City's Downtown from the largely residential areas to the east. The corridor is largely defined by city and county governmental offices as well as administration offices for the Traverse City Area Public Schools.
YesYesYes

page 52 CC
Study Area Summary for 1/4 Mile Area Surrounding the Corridor
Total Population (2010)
People per AcrePeople per Square Mile
Total Housing (2010)
Gross Neighborhood Density (per acre)
Study Area Size (Land Cover)
AcresSquare Miles
Workers Living within Study Area
% with earnings $1250/month or less% with earnings $1251/month to $3333/month% with earnings greater than $3333/month
Jobs Located within Study Area
Job Density (per acre)
Zoning
Infrastructure Traffic Counts
Public Utilities
Sewer Additional Capacity
Water Additional Capacity
Energy Utilities
Underground ElectricRenewable Energy Production
Natural Gas
Broadband
Policy
Downtown Plan Yes
Corridor Improvement Plan Yes
Placemaking Elements
Theaters/Entertainment Venues No Grocery Stores NoRestaurants NoSidewalk Cafés YesParks Yes
Iconic Buildings Yes Pocket Parks YesPublic Art Installations YesWayfinding YesPedestrian Connections Yes
YesYes
Traverse City Courthouse
Yes
NoNo
(Fiber, Cable, DSL, WiFi, 4G, Fixed Wireless)Yes - 6 Technologies
Highest Density District
% of Districts That Allow Multi-Family
by Right
31%
Lowest Density District
Max Residential Site DensityMax Building
Height
28%41%
G&I Area
69,802
21,631 34,164
28,068
0.85
% of Districts That Allow Residential
Use
Traverse City & Surrounding Townships
28%40%32%
508
3.92
15.0
Traverse City CBD Boardman Ave. Corridor 31
Traverse City CBD Boardman Ave. Corridor
Corridor Segment
83.8 60 ft80%
50,796.80 126,579.2079.37 197.78
0.270.43
% of Districts That Allow Mixed Use
By Right
9.571,855
27%
31%42%
42,477
17,788
36,9800.73 0.34
DDA Established 1978
0.55353
193.760.30
1,394
760
7.19
60%R-2 | R-15 | C-2 | C-4a | C-4b
District(s)
100%
G&I Core Place
43,123
City of Traverse City, Garfield, East Bay, Greilickville CDP
4,604
Census Data
543
-
5,000
10,000
15,000
20,000
25,000
30,000
35,000
40,000Mean (All Corridors)
Boardman Avenue (FrontStreet to 8th Street)

CC page 53
Central Business District
Corridor Overview
Corridor Segment and Surrounding 1/4 Mile Study Area Map
Economic DevelopmentCommunity policies or activities assisting economic development (City of Traverse City)
Growth & Investment Strategy Community Economic Strategy
Identify Areas of Focus for G&I Community Marketing Strategy
Development Opportunities Market Potential Development Sites
Publish Development Guide Capital Improvement Plan
Traverse City CBD Woodmere Ave Corridor32
YesYesYesYes
Unit(s) of Government:
Woodmere Avenue from 8th Street to Hannah Avenue
Yes
Bike Lane:
16,052 Source: City of Traverse City
2, Bi-Directional Traffic with Turn/Passing Lanes
No Street Parking
BATA - Fixed Route
No
Sidewalks, Crosswalks
68
Pedestrian Amenities:
Corridor Street Name(s):
Corridor Classification:
Length:
Street Classification:
2013 Traffic Volume(AADT):
Number of Traffic Lanes:
Walk Score
Yes
0.26 miles
Major Collector
City of Traverse City
Parking
Transit Service:
Entertainment Venues:
The Woodmere Avenue Corridor contains a mix of residential, commercial, industrial, and governmental activity. The corridor provides for north/south traffic flows between the major east/west Eight Street and South Airport Road corridors.
YesYesYes

page 54 CC
Study Area Summary for 1/4 Mile Area Surrounding the Corridor
Total Population (2010)
People per AcrePeople per Square Mile
Total Housing (2010)
Gross Neighborhood Density (per acre)
Study Area Size (Land Cover)
AcresSquare Miles
Workers Living within Study Area
% with earnings $1250/month or less% with earnings $1251/month to $3333/month% with earnings greater than $3333/month
Jobs Located within Study Area
Job Density (per acre)
Zoning
Infrastructure Traffic Counts
Public Utilities
Sewer Additional Capacity
Water Additional Capacity
Energy Utilities
Underground ElectricRenewable Energy Production
Natural Gas
Broadband
Policy
Downtown Plan Yes
Corridor Improvement Plan Yes
Placemaking Elements
Theaters/Entertainment Venues No Grocery Stores NoRestaurants YesSidewalk Cafés YesParks Yes
Iconic Buildings Yes Pocket Parks YesPublic Art Installations YesWayfinding YesPedestrian Connections Yes
YesYes
Traverse City District Library, Traverse City Train Depot
Yes
NoNo
(Fiber, Cable, DSL, WiFi, 4G, Fixed Wireless)Yes - 6 Technologies
Highest Density District
% of Districts That Allow Multi-Family
by Right
31%
Lowest Density District
Max Residential Site DensityMax Building
Height
28%41%
G&I Area
69,802
21,631 34,164
28,068
0.85
% of Districts That Allow Residential
Use
Traverse City & Surrounding Townships
28%40%32%
458
3.79
55.4
Traverse City CBD Woodmere Ave Corridor 32
Traverse City CBD Woodmere Ave Corridor
Corridor Segment
69.7 60 ft75%
50,796.80 126,579.2079.37 197.78
0.270.43
% of Districts That Allow Mixed Use
By Right
2.01367
27%
28%45%
42,477
17,788
36,9800.73 0.34
DDA Established 1978
0.55353
182.230.28
1,391
691
7.63
75%C-2 | C-3 | I | D-2
District(s)
75%
G&I Core Place
43,123
City of Traverse City, Garfield, East Bay, Greilickville CDP
4,885
Census Data
543
-
5,000
10,000
15,000
20,000
25,000
30,000
35,000
40,000Mean (All Corridors)
Woodmere Avenue (8thStreet to Hannah Avenue)

CC page 55
Central Business District
Corridor Overview
Corridor Segment and Surrounding 1/4 Mile Study Area Map
Economic DevelopmentCommunity policies or activities assisting economic development (City of Traverse City)
Growth & Investment Strategy Community Economic Strategy
Identify Areas of Focus for G&I Community Marketing Strategy
Development Opportunities Market Potential Development Sites
Publish Development Guide Capital Improvement Plan
Traverse City CBD Warehouse District33
YesYesYesYes
Unit(s) of Government:
Hall Street from Grandview Parkway to Front Street; Garland Street from Grandview Parkway to Hall Street
Yes
Bike Lane:
3,531 Source: City of Traverse City
2, Bi-Directional Traffic
Parallel, Diagonal
BATA - Fixed Route
No
Sidewalks, Crosswalks
92
Pedestrian Amenities:
Corridor Street Name(s):
Corridor Classification:
Length:
Street Classification:
2013 Traffic Volume(AADT):
Number of Traffic Lanes:
Walk Score
No
0.31 miles
Major Collector, Local
City of Traverse City
Parking
Transit Service:
Entertainment Venues:
The Warehouse District location between Traverse City's waterfront and its downtown is driving the conversion from the historically industrial/warehouse/service land uses to retail/office/lodging/residential based redevelopment. This corridor contains the Bay Area Transportation Authority's Hall Street Transfer Station providing regional transit connections to the Traverse City fix route system.
YesYesYes

page 56 CC
Study Area Summary for 1/4 Mile Area Surrounding the Corridor
Total Population (2010)
People per AcrePeople per Square Mile
Total Housing (2010)
Gross Neighborhood Density (per acre)
Study Area Size (Land Cover)
AcresSquare Miles
Workers Living within Study Area
% with earnings $1250/month or less% with earnings $1251/month to $3333/month% with earnings greater than $3333/month
Jobs Located within Study Area
Job Density (per acre)
Zoning
Infrastructure Traffic Counts
Public Utilities
Sewer Additional Capacity
Water Additional Capacity
Energy Utilities
Underground ElectricRenewable Energy Production
Natural Gas
Broadband
Policy
Downtown Plan Yes
Corridor Improvement Plan Yes
Placemaking Elements
Theaters/Entertainment Venues No Grocery Stores NoRestaurants YesSidewalk Cafés YesParks Yes
Iconic Buildings Yes Pocket Parks YesPublic Art Installations YesWayfinding YesPedestrian Connections Yes
YesYes
Candle Factory, BATA Transfer Station, Big Daylight Candy Factory
Yes
NoNo
(Fiber, Cable, DSL, WiFi, 4G, Fixed Wireless)Yes - 6 Technologies
Highest Density District
% of Districts That Allow Multi-Family
by Right
31%
Lowest Density District
Max Residential Site DensityMax Building
Height
28%41%
G&I Area
69,802
21,631 34,164
28,068
0.85
% of Districts That Allow Residential
Use
Traverse City & Surrounding Townships
28%40%32%
694
2.76
69.7
Traverse City CBD Warehouse District 33
Traverse City CBD Warehouse District
Corridor Segment
79.2 45 ft100%
50,796.80 126,579.2079.37 197.78
0.270.43
% of Districts That Allow Mixed Use
By Right
21.743,716
30%
32%38%
42,477
17,788
36,9800.73 0.34
DDA Established 1978
0.55353
170.910.27
824
472
4.82
100%C-4a | D-3
District(s)
100%
G&I Core Place
43,123
City of Traverse City, Garfield, East Bay, Greilickville CDP
3,086
Census Data
543
-
5,000
10,000
15,000
20,000
25,000
30,000
35,000
40,000Mean (All Corridors)
Hall Street (GrandviewParkway to Front Street)
Garland Street (GrandviewParkway to Hall Street)

CC page 57
Commercial
Corridor Overview
Corridor Segment and Surrounding 1/4 Mile Study Area Map
Economic DevelopmentCommunity policies or activities assisting economic development (City of Traverse City)
Growth & Investment Strategy Community Economic Strategy
Identify Areas of Focus for G&I Community Marketing Strategy
Development Opportunities Market Potential Development Sites
Publish Development Guide Capital Improvement Plan
Traverse City Division Street Neighborhood Commercial Corridor34
YesYesYesYes
Unit(s) of Government:
Division Street from Grandview Parkway to north of 5th Street
Yes
Bike Lane:
21,233 Source: MDOT
4, Bi-Directional Traffic with Turn/Passing Lanes
No Street Parking
BATA - Dial-A-Ride
No
Sidewalks, Crosswalks
78
Pedestrian Amenities:
Corridor Street Name(s):
Corridor Classification:
Length:
Street Classification:
2013 Traffic Volume(AADT):
Number of Traffic Lanes:
Walk Score
No
0.36 miles
Principal Arterial - Other
City of Traverse City
Parking
Transit Service:
Entertainment Venues:
The Division Street Commercial Corridor is located to west of Traverse City’s Downtown and provides for a major north/south traffic route through the city. The City of Traverse City has been working with MDOT and the Division Street Steering Committee on recommended improvements to the Division Street/US-31/M-37 corridor.
YesYesYes

page 58 CC
Study Area Summary for 1/4 Mile Area Surrounding the Corridor
Total Population (2010)
People per AcrePeople per Square Mile
Total Housing (2010)
Gross Neighborhood Density (per acre)
Study Area Size (Land Cover)
AcresSquare Miles
Workers Living within Study Area
% with earnings $1250/month or less% with earnings $1251/month to $3333/month% with earnings greater than $3333/month
Jobs Located within Study Area
Job Density (per acre)
Zoning
Infrastructure Traffic Counts
Public Utilities
Sewer Additional Capacity
Water Additional Capacity
Energy Utilities
Underground ElectricRenewable Energy Production
Natural Gas
Broadband
Policy
Downtown Plan Yes
Corridor Improvement Plan Yes
Placemaking Elements
Theaters/Entertainment Venues No Grocery Stores NoRestaurants YesSidewalk Cafés NoParks Yes
Iconic Buildings No Pocket Parks NoPublic Art Installations NoWayfinding NoPedestrian Connections Yes
YesYes
Yes
NoNo
(Fiber, Cable, DSL, 4G, Fixed Wireless)Yes - 5 Technologies
Highest Density District
% of Districts That Allow Multi-Family
by Right
31%
Lowest Density District
Max Residential Site DensityMax Building
Height
28%41%
G&I Area
69,802
21,631 34,164
28,068
0.85
% of Districts That Allow Residential
Use
Traverse City & Surrounding Townships
28%40%32%
766
3.93
8.7
Traverse City Division Street Neighborhood Commercial Corridor 34
Traverse City Division Street Neighborhood Commercial
Corridor
Corridor Segment
55.4 35 ft67%
50,796.80 126,579.2079.37 197.78
0.270.43
% of Districts That Allow Mixed Use
By Right
5.461,127
35%
30%35%
42,477
17,788
36,9800.73 0.34
0.55353
206.370.32
1,615
812
7.83
67%R-1b | C-1 | C-2
District(s)
100%
G&I Core Place
43,123
City of Traverse City, Garfield, East Bay, Greilickville CDP
5,009
Census Data
543
-
5,000
10,000
15,000
20,000
25,000
30,000
35,000
40,000 Mean (All Corridors)
Division Street (GrandviewParkway to north of 5thStreet)

CC page 59
Commercial
Corridor Overview
Corridor Segment and Surrounding 1/4 Mile Study Area Map
Economic DevelopmentCommunity policies or activities assisting economic development (City of Traverse City)
Growth & Investment Strategy Community Economic Strategy
Identify Areas of Focus for G&I Community Marketing Strategy
Development Opportunities Market Potential Development Sites
Publish Development Guide Capital Improvement Plan
Traverse City 14th Street Corridor35
YesYesYesYes
Unit(s) of Government:
Fourteenth Street from Division Street to Lake Ridge Drive
Yes
Bike Lane:
15,155 Source: City of Traverse City
2, Bi-Directional Traffic with Turn/Passing Lanes
Parallel
BATA - Fixed Route
No
Sidewalks, Crosswalks
68
Pedestrian Amenities:
Corridor Street Name(s):
Corridor Classification:
Length:
Street Classification:
2013 Traffic Volume(AADT):
Number of Traffic Lanes:
Walk Score
No
0.86 miles
Minor Arterial
City of Traverse City
Parking
Transit Service:
Entertainment Venues:
The Fourteenth Street Corridor extends from Division Street on the west to Boardman Lake on the east and serves as an important transportation link in the City. Along its length, Fourteenth Street has several different "character areas," each Influenced by traffic volumes, existing land uses, proximity to Boardman Lake, traffic volumes at key Intersections and other factors that will increase each area's potential.
YesYesYes

page 60 CC
Study Area Summary for 1/4 Mile Area Surrounding the Corridor
Total Population (2010)
People per AcrePeople per Square Mile
Total Housing (2010)
Gross Neighborhood Density (per acre)
Study Area Size (Land Cover)
AcresSquare Miles
Workers Living within Study Area
% with earnings $1250/month or less% with earnings $1251/month to $3333/month% with earnings greater than $3333/month
Jobs Located within Study Area
Job Density (per acre)
Zoning
Infrastructure Traffic Counts
Public Utilities
Sewer Additional Capacity
Water Additional Capacity
Energy Utilities
Underground ElectricRenewable Energy Production
Natural Gas
Broadband
Policy
Downtown Plan Yes
Corridor Improvement Plan Yes
Placemaking Elements
Theaters/Entertainment Venues No Grocery Stores YesRestaurants YesSidewalk Cafés NoParks No
Iconic Buildings Yes Pocket Parks NoPublic Art Installations NoWayfinding NoPedestrian Connections Yes
YesYes
Thirlby Field
Yes
NoNo
(Fiber, Cable, DSL, 4G, Fixed Wireless)Yes - 5 Technologies
Highest Density District
% of Districts That Allow Multi-Family
by Right
31%
Lowest Density District
Max Residential Site DensityMax Building
Height
28%41%
G&I Area
69,802
21,631 34,164
28,068
0.85
% of Districts That Allow Residential
Use
Traverse City & Surrounding Townships
28%40%32%
1,170
4.08
9.0
Traverse City 14th Street Corridor 35
Traverse City 14th Street Corridor
Corridor Segment
63.4 60 ft71%
50,796.80 126,579.2079.37 197.78
0.270.43
% of Districts That Allow Mixed Use
By Right
2.05735
30%
28%41%
42,477
17,788
36,9800.73 0.34
2013 Corridors Master Plan
0.55353
358.120.56
2,775
1,460
7.75
43%R-2 | R-9 | R-29 | C-1 | C-2 | C-3 | I
District(s)
86%
G&I Core Place
43,123
City of Traverse City, Garfield, East Bay, Greilickville CDP
4,959
Census Data
543
-
5,000
10,000
15,000
20,000
25,000
30,000
35,000
40,000Mean (All Corridors)
Fourteenth Street (DivisionStreet to Lake Ridge Drive)

CC page 61
Commercial
Corridor Overview
Corridor Segment and Surrounding 1/4 Mile Study Area Map
Economic DevelopmentCommunity policies or activities assisting economic development (City of Traverse City)
Growth & Investment Strategy Community Economic Strategy
Identify Areas of Focus for G&I Community Marketing Strategy
Development Opportunities Market Potential Development Sites
Publish Development Guide Capital Improvement Plan
Traverse City 8th Street Corridor36
YesYesYesYes
Unit(s) of Government:
Eight Street from Barlow Street to Fair Street
Yes
Bike Lane:
21,612 Source: City of Traverse City
2, Bi-Directional Traffic with Turn/Passing Lanes
No Street Parking
BATA - Dial-A-Ride
No
Sidewalks, Crosswalks
58
Pedestrian Amenities:
Corridor Street Name(s):
Corridor Classification:
Length:
Street Classification:
2013 Traffic Volume(AADT):
Number of Traffic Lanes:
Walk Score
Yes
0.82 miles
Minor Arterial
City of Traverse City
Parking
Transit Service:
Entertainment Venues:
The Eighth Street Corridor extends from Union Street on the west to Fair Street on the east. As the most southerly east/west route across town, portions of Eighth Street average more than 20,000 vehicles per day making it one of the busiest streets in the City. Along its length, Eighth Street has several different “character areas,” each influenced by traffic volumes, existing land uses, proximity to Downtown, and other factors that will increase each area's potential.
YesYesYes

page 62 CC
Study Area Summary for 1/4 Mile Area Surrounding the Corridor
Total Population (2010)
People per AcrePeople per Square Mile
Total Housing (2010)
Gross Neighborhood Density (per acre)
Study Area Size (Land Cover)
AcresSquare Miles
Workers Living within Study Area
% with earnings $1250/month or less% with earnings $1251/month to $3333/month% with earnings greater than $3333/month
Jobs Located within Study Area
Job Density (per acre)
Zoning
Infrastructure Traffic Counts
Public Utilities
Sewer Additional Capacity
Water Additional Capacity
Energy Utilities
Underground ElectricRenewable Energy Production
Natural Gas
Broadband
Policy
Downtown Plan Yes
Corridor Improvement Plan Yes
Placemaking Elements
Theaters/Entertainment Venues No Grocery Stores YesRestaurants YesSidewalk Cafés NoParks No
Iconic Buildings No Pocket Parks NoPublic Art Installations NoWayfinding NoPedestrian Connections Yes
YesYes
Yes
NoNo
(Fiber, Cable, DSL, 4G, Fixed Wireless)Yes - 5 Technologies
Highest Density District
% of Districts That Allow Multi-Family
by Right
31%
Lowest Density District
Max Residential Site DensityMax Building
Height
28%41%
G&I Area
69,802
21,631 34,164
28,068
0.85
% of Districts That Allow Residential
Use
Traverse City & Surrounding Townships
28%40%32%
740
3.06
21.8
Traverse City 8th Street Corridor 36
Traverse City 8th Street Corridor
Corridor Segment
63.4 45 ft75%
50,796.80 126,579.2079.37 197.78
0.270.43
% of Districts That Allow Mixed Use
By Right
3.861,498
28%
31%41%
42,477
17,788
36,9800.73 0.34
2013 Corridors Master Plan
0.55353
387.860.61
2,296
1,188
5.92
75%R-2 | C-1 | C-2 | C-3
District(s)
100%
G&I Core Place
43,123
City of Traverse City, Garfield, East Bay, Greilickville CDP
3,789
Census Data
543
-
5,000
10,000
15,000
20,000
25,000
30,000
35,000
40,000Mean (All Corridors)
Eight Street (Barlow Streetto Fair Street)

CC page 63
Commercial
Corridor Overview
Corridor Segment and Surrounding 1/4 Mile Study Area Map
Economic DevelopmentCommunity policies or activities assisting economic development (City of Traverse City or Charter Township of Garfield)
Growth & Investment Strategy Community Economic Strategy
Identify Areas of Focus for G&I Community Marketing Strategy
Development Opportunities Market Potential Development Sites
Publish Development Guide Capital Improvement Plan
Traverse City Garfield Avenue Corridor37
YesYesYesYes
Unit(s) of Government:
Garfield Avenue from E. Front Street to Boon; Garfield Avenue/Road from Boon Street to Brimley Road
Yes
Bike Lane:
16,463 Source: City of Traverse City, N/A
2-4, Bi-Directional Traffic with Turn/Passing Lanes
No Street Parking
BATA - Fixed Route
No
Sidewalks, Crosswalks
55
Pedestrian Amenities:
Corridor Street Name(s):
Corridor Classification:
Length:
Street Classification:
2013 Traffic Volume(AADT):
Number of Traffic Lanes:
Walk Score
No
3.90 miles
Minor Arterial
City of Traverse City, Charter Township of Garfield
Parking
Transit Service:
Entertainment Venues:
Garfield Avenue Corridor provides a non-trunk line alternative for north-south movement, connecting the Village of Kingsley with US-31 just east of the core population center. Garfield Avenue Is a key north/south route through the City. Along its length, Garfield Avenue has several different "character areas,” each influenced by traffic volumes, existing land uses, proximity to the Civic Center, Cherry Capital Airport (TVC), proximity to the bay front, and other factors that will Increase each area's potential.
YesYesYes

page 64 CC
Study Area Summary for 1/4 Mile Area Surrounding the Corridor
Total Population (2010)
People per AcrePeople per Square Mile
Total Housing (2010)
Gross Neighborhood Density (per acre)
Study Area Size (Land Cover)
AcresSquare Miles
Workers Living within Study Area
% with earnings $1250/month or less% with earnings $1251/month to $3333/month% with earnings greater than $3333/month
Jobs Located within Study Area
Job Density (per acre)
Zoning
Infrastructure Traffic Counts
Public Utilities
Sewer Additional Capacity
Water Additional Capacity
Energy Utilities
Underground ElectricRenewable Energy Production
Natural Gas
Broadband
Policy
Downtown Plan Yes
Corridor Improvement Plan Yes
Placemaking Elements
Theaters/Entertainment Venues No Grocery Stores YesRestaurants YesSidewalk Cafés NoParks Yes
Iconic Buildings No Pocket Parks NoPublic Art Installations NoWayfinding NoPedestrian Connections Yes
YesYes
Yes
NoNo
(Fiber, Cable, DSL, 4G, Fixed Wireless)Yes - 5 Technologies
Highest Density District
% of Districts That Allow Multi-Family
by Right
31%
Lowest Density District
Max Residential Site DensityMax Building
Height
28%41%
76.4 40 ftCharter Township of Garfield: R-1B | R-1M | C-1 | C-1-O | C-2 | C-4 | MUIBD-G | MUIBD-L | A-1 78% 11% 11% 1.0
G&I Area
69,802
21,631 34,164
28,068
0.85
% of Districts That Allow Residential
Use
Traverse City & Surrounding Townships
28%40%32%
1,704
1.87
15.0
Traverse City Garfield Avenue Corridor 37
Traverse City Garfield Avenue Corridor
Corridor Segment
63.4 45 ft100%
50,796.80 126,579.2079.37 197.78
0.270.43
% of Districts That Allow Mixed Use
By Right
4.015,461
26%
32%43%
42,477
17,788
36,9800.73 0.34
2013 Corridors Master Plan
0.55353
1,363.132.13
5,028
2,551
3.69
67%City of Traverse City: R-15 | C-1 | C-3
District(s)
100%
G&I Core Place
43,123
City of Traverse City, Garfield, East Bay, Greilickville CDP
2,361
Census Data
543
-
5,000
10,000
15,000
20,000
25,000
30,000
35,000
40,000 Mean (All Corridors)
Garfield Avenue (E. FrontStreet to Boon)
Garfield Avenue/Road(Boon Street to BrimleyRoad)

CC page 65
Commercial
Corridor Overview
Corridor Segment and Surrounding 1/4 Mile Study Area Map
Economic DevelopmentCommunity policies or activities assisting economic development (City of Traverse City)
Growth & Investment Strategy Community Economic Strategy
Identify Areas of Focus for G&I Community Marketing Strategy
Development Opportunities Market Potential Development Sites
Publish Development Guide Capital Improvement Plan
Traverse City East Front Street38
YesYesYesYes
Unit(s) of Government:
East Front Street from between Wellington & Franklin to just east of College Drive
Yes
Bike Lane:
34,178 Source: MDOT
2-4, Bi-Directional Traffic with Turn/Passing Lanes
Parking Structure(s)
BATA - Fixed Route
No
Sidewalks, Crosswalks
46
Pedestrian Amenities:
Corridor Street Name(s):
Corridor Classification:
Length:
Street Classification:
2013 Traffic Volume(AADT):
Number of Traffic Lanes:
Walk Score
No
1.22 miles
Principal Arterial - Other
City of Traverse City
Parking
Transit Service:
Entertainment Venues:
The East Front Street (US 31, M-37, and M72) Corridor extends from Grandview Parkway on the west to Fair Street/College Drive on the east. Front Street is a key east/west route through the City and the eastern segment presented in this section serves as an important east gateway. Along its length, East Front Street has several different "character areas," each influenced by traffic volumes, existing land uses, proximity to Downtown, proximity to the West Arm of Grand Traverse Bay, and other factors that will increase each area's potential.
YesYesYes

page 66 CC
Study Area Summary for 1/4 Mile Area Surrounding the Corridor
Total Population (2010)
People per AcrePeople per Square Mile
Total Housing (2010)
Gross Neighborhood Density (per acre)
Study Area Size (Land Cover)
AcresSquare Miles
Workers Living within Study Area
% with earnings $1250/month or less% with earnings $1251/month to $3333/month% with earnings greater than $3333/month
Jobs Located within Study Area
Job Density (per acre)
Zoning
Infrastructure Traffic Counts
Public Utilities
Sewer Additional Capacity
Water Additional Capacity
Energy Utilities
Underground ElectricRenewable Energy Production
Natural Gas
Broadband
Policy
Downtown Plan Yes
Corridor Improvement Plan Yes
Placemaking Elements
Theaters/Entertainment Venues No Grocery Stores NoRestaurants YesSidewalk Cafés NoParks Yes
Iconic Buildings Yes Pocket Parks YesPublic Art Installations NoWayfinding YesPedestrian Connections Yes
YesYes
Great Lake Maritime Academy/Hagerty Center
Yes
NoNo
(Fiber, Cable, DSL, 4G, Fixed Wireless)Yes - 5 Technologies
Highest Density District
% of Districts That Allow Multi-Family
by Right
31%
Lowest Density District
Max Residential Site DensityMax Building
Height
28%41%
G&I Area
69,802
21,631 34,164
28,068
0.85
% of Districts That Allow Residential
Use
Traverse City & Surrounding Townships
28%40%32%
909
3.08
15.0
Traverse City East Front Street 38
Traverse City East Front Street
Corridor Segment
79.2 45 ft100%
50,796.80 126,579.2079.37 197.78
0.270.43
% of Districts That Allow Mixed Use
By Right
5.532,422
34%
29%37%
42,477
17,788
36,9800.73 0.34
2013 Corridors Master Plan
0.55353
437.620.68
2,840
1,350
6.49
80%R-15 | HR | C-2 | C-3 | C-4a
District(s)
100%
G&I Core Place
43,123
City of Traverse City, Garfield, East Bay, Greilickville CDP
4,153
Census Data
543
-
5,000
10,000
15,000
20,000
25,000
30,000
35,000
40,000 Mean (All Corridors)
East Front Street (betweenWellington & Franklin to justeast of College Drive)

CC page 67
Commercial
Corridor Overview
Corridor Segment and Surrounding 1/4 Mile Study Area Map
Economic DevelopmentCommunity policies or activities assisting economic development (City of Traverse City)
Growth & Investment Strategy Community Economic Strategy
Identify Areas of Focus for G&I Community Marketing Strategy
Development Opportunities Market Potential Development Sites
Publish Development Guide Capital Improvement Plan
Traverse City West Front Street39
YesYesYesYes
Unit(s) of Government:
West Front Street from Madison Street to Boardman River
Yes
Bike Lane:
15,391 Source: City of Traverse City
2, Bi-Directional Traffic
Parallel
BATA - Fixed Route
No
Sidewalks, Crosswalks
74
Pedestrian Amenities:
Corridor Street Name(s):
Corridor Classification:
Length:
Street Classification:
2013 Traffic Volume(AADT):
Number of Traffic Lanes:
Walk Score
Yes
0.85 miles
Minor Arterial
City of Traverse City
Parking
Transit Service:
Entertainment Venues:
The West Front Street Corridor extends from the City municipal limits/Madison Street on the west to the Front Street Bridge on the east. Front Street is a key east/west route through the City, and the West Front Street is a key gateway and connection between the City's western neighborhoods and neighboring communities and Downtown. Along its length, West Front Street has several different "character areas," each influenced by traffic volumes, existing land uses, proximity to Downtown, Munson Medical Center, Kids Creek, and other factors that will increase each area's potential.
YesYesYes

page 68 CC
Study Area Summary for 1/4 Mile Area Surrounding the Corridor
Total Population (2010)
People per AcrePeople per Square Mile
Total Housing (2010)
Gross Neighborhood Density (per acre)
Study Area Size (Land Cover)
AcresSquare Miles
Workers Living within Study Area
% with earnings $1250/month or less% with earnings $1251/month to $3333/month% with earnings greater than $3333/month
Jobs Located within Study Area
Job Density (per acre)
Zoning
Infrastructure Traffic Counts
Public Utilities
Sewer Additional Capacity
Water Additional Capacity
Energy Utilities
Underground ElectricRenewable Energy Production
Natural Gas
Broadband
Policy
Downtown Plan Yes
Corridor Improvement Plan Yes
Placemaking Elements
Theaters/Entertainment Venues No Grocery Stores YesRestaurants YesSidewalk Cafés YesParks No
Iconic Buildings No Pocket Parks NoPublic Art Installations NoWayfinding YesPedestrian Connections Yes
YesYes
Yes
NoNo
(Fiber, Cable, DSL, 4G, Fixed Wireless)Yes - 5 Technologies
Highest Density District
% of Districts That Allow Multi-Family
by Right
31%
Lowest Density District
Max Residential Site DensityMax Building
Height
28%41%
G&I Area
69,802
21,631 34,164
28,068
0.85
% of Districts That Allow Residential
Use
Traverse City & Surrounding Townships
28%40%32%
1,334
3.22
8.7
Traverse City West Front Street 39
Traverse City West Front Street
Corridor Segment
69.7 45 ft80%
50,796.80 126,579.2079.37 197.78
0.270.43
% of Districts That Allow Mixed Use
By Right
24.969,895
34%
30%36%
42,477
17,788
36,9800.73 0.34
2013 Corridors Master Plan
0.55353
396.370.62
2,449
1,275
6.18
80%R-1b | C-1 | C-2 | D-3 | H-1
District(s)
100%
G&I Core Place
43,123
City of Traverse City, Garfield, East Bay, Greilickville CDP
3,954
Census Data
543
-
5,000
10,000
15,000
20,000
25,000
30,000
35,000
40,000Mean (All Corridors)
West Front Street (MadisonStreet to Boardman River)

CC page 69
Commercial
Corridor Overview
Corridor Segment and Surrounding 1/4 Mile Study Area Map
Economic DevelopmentCommunity policies or activities assisting economic development (City of Traverse City or Charter Township of Garfield)
Growth & Investment Strategy Community Economic Strategy
Identify Areas of Focus for G&I Community Marketing Strategy
Development Opportunities Market Potential Development Sites
Publish Development Guide Capital Improvement Plan
Traverse City US 31 Corridor40
YesYesYesYes
Unit(s) of Government:
US 31 from 14th Street to City Limits; Division Street (US31) from N Township Limits to Rennie School Road
Yes
Bike Lane:
26,921 Source: MDOT
4, Bi-Directional Traffic with Turn/Passing Lanes
No Street Parking
BATA - Fixed Route
Yes
Sidewalks, Crosswalks
62
Pedestrian Amenities:
Corridor Street Name(s):
Corridor Classification:
Length:
Street Classification:
2013 Traffic Volume(AADT):
Number of Traffic Lanes:
Walk Score
Yes
4.75 miles
Principal Arterial - Other
City of Traverse City, Charter Township of Garfield
Parking
Transit Service:
Entertainment Venues:
The US-31 corridor provides the most direct north-south movement through the core of the Traverse City area. It also provides a critical connection to points south, north and west of the region with downtown Traverse City. The corridor provides access to other significant regional activity centers including the Grand Traverse Commons, the Grand Traverse Mall, Chum’s Corners. The corridor is significant because it provides a primary connection beyond the regional limits, a primary north-south route to the regional core, and access to a significant portion of the areas big box retail. Because of these three significant functions, the corridor exhibits high traffic volumes.
YesYesYes

page 70 CC
Study Area Summary for 1/4 Mile Area Surrounding the Corridor
Total Population (2010)
People per AcrePeople per Square Mile
Total Housing (2010)
Gross Neighborhood Density (per acre)
Study Area Size (Land Cover)
AcresSquare Miles
Workers Living within Study Area
% with earnings $1250/month or less% with earnings $1251/month to $3333/month% with earnings greater than $3333/month
Jobs Located within Study Area
Job Density (per acre)
Zoning
Infrastructure Traffic Counts
Public Utilities
Sewer Additional Capacity
Water Additional Capacity
Energy Utilities
Underground ElectricRenewable Energy Production
Natural Gas
Broadband
Policy
Downtown Plan Yes
Corridor Improvement Plan Yes
Placemaking Elements
Theaters/Entertainment Venues Yes Grocery Stores YesRestaurants YesSidewalk Cafés NoParks Yes
Iconic Buildings No Pocket Parks NoPublic Art Installations NoWayfinding YesPedestrian Connections Yes
YesYes
Grand Traverse Cinema, Horizon Cinema
Yes
NoNo
(Fiber, Cable, DSL, 4G, Fixed Wireless)Yes - 5 Technologies
Highest Density District
% of Districts That Allow Multi-Family
by Right
31%
Lowest Density District
Max Residential Site DensityMax Building
Height
28%41%
76.4 40 ftCharter Township of Garfield: R-1B | R-1C | C-1 | C-1-O | C-2 | C-3 | C-4 | MUIBD-G | A-1 78% 11% 11% 1.0
G&I Area
69,802
21,631 34,164
28,068
0.85
% of Districts That Allow Residential
Use
Traverse City & Surrounding Townships
28%40%32%
1,766
1.45
15.0
Traverse City US 31 Corridor 40
Traverse City US 31 Corridor
Corridor Segment
63.4 45 ft100%
50,796.80 126,579.2079.37 197.78
0.270.43
% of Districts That Allow Mixed Use
By Right
2.934,798
28%
30%42%
42,477
17,788
36,9800.73 0.34
0.55353
1,638.312.56
4,435
2,370
2.71
50%City of Traverse City: R-15 | C-3
District(s)
100%
G&I Core Place
43,123
City of Traverse City, Garfield, East Bay, Greilickville CDP
1,733
Census Data
543
-
5,000
10,000
15,000
20,000
25,000
30,000
35,000
40,000 Mean (All Corridors)
US 31 (14th Street to CityLimits)
Division Street (US31) (NTownship Limits to RennieSchool Road)

CC page 71
Commercial, Central Business District
Corridor Overview
Corridor Segment and Surrounding 1/4 Mile Study Area Map
Economic DevelopmentCommunity policies or activities assisting economic development (City of Traverse City or Elmwood Charter Township)
Growth & Investment Strategy Community Economic Strategy
Identify Areas of Focus for G&I Community Marketing Strategy
Development Opportunities Market Potential Development Sites
Publish Development Guide Capital Improvement Plan
Traverse City M22/M72 Corridor41
YesYesYesYes
Unit(s) of Government:
West Bay Shore Drive (M22) & E Traverse Highway (M72) from Incochee to south of Carter Road; West Bay Shore Drive (M22) from S Township Limits to Cherry Bend Road
Yes
Bike Lane:
29,936 Source: MDOT
2-4, Bi-Directional Traffic with Turn/Passing Lanes
Parking Structure(s)
BATA - Dial-A-Ride
Yes
Sidewalks, Crosswalks, Mid-Block Crosswalks
63
Pedestrian Amenities:
Corridor Street Name(s):
Corridor Classification:
Length:
Street Classification:
2013 Traffic Volume(AADT):
Number of Traffic Lanes:
Walk Score
Yes
1.62 miles
Minor Arterial
City of Traverse City, Elmwood Charter Township
Parking
Transit Service:
Entertainment Venues:
The M-72 corridor transects the regional population center to form the region’s major east-west route. It provides access to Traverse City from Leelanau County and northern Benzie County as well as providing a route to the Sleeping Bear National Lakeshore. In the center section, it provides access to the Grand Traverse Bay, numerous businesses, downtown Traverse City. The corridor is significant because it provides a primary connection beyond the regional limits, a primary east-west route through the region, and access to commercial and light industrial areas. M-22 runs from the M-72 intersection north to the north Elmwood Township line. It is the gateway to Traverse City from such Leelanau County communities including Suttons Bay, Northport, and Leland.
YesYesYes

page 72 CC
Study Area Summary for 1/4 Mile Area Surrounding the Corridor
Total Population (2010)
People per AcrePeople per Square Mile
Total Housing (2010)
Gross Neighborhood Density (per acre)
Study Area Size (Land Cover)
AcresSquare Miles
Workers Living within Study Area
% with earnings $1250/month or less% with earnings $1251/month to $3333/month% with earnings greater than $3333/month
Jobs Located within Study Area
Job Density (per acre)
Zoning
Infrastructure Traffic Counts
Public Utilities
Sewer Additional Capacity
Water Additional Capacity
Energy Utilities
Underground ElectricRenewable Energy Production
Natural Gas
Broadband
Policy
Downtown Plan Yes
Corridor Improvement Plan Yes
Placemaking Elements
Theaters/Entertainment Venues Yes Grocery Stores YesRestaurants YesSidewalk Cafés NoParks Yes
Iconic Buildings No Pocket Parks NoPublic Art Installations NoWayfinding YesPedestrian Connections Yes
YesYes
Great Lakes Children’s Museum
Yes
NoNo
(Fiber, Cable, DSL, 4G, Fixed Wireless)Yes - 5 Technologies
Highest Density District
% of Districts That Allow Multi-Family
by Right
31%
Lowest Density District
Max Residential Site DensityMax Building
Height
28%41%
7.0 35 ftElmwood Township: NC | GC | SC 100% 0% 0% 7.0
G&I Area
69,802
21,631 34,164
28,068
0.85
% of Districts That Allow Residential
Use
Traverse City & Surrounding Townships
28%40%32%
1,099
1.63
47.5
Traverse City M22/M72 Corridor 41
Traverse City M22/M72 Corridor
Corridor Segment
63.4 45 ft100%
50,796.80 126,579.2079.37 197.78
0.270.43
% of Districts That Allow Mixed Use
By Right
2.571,224
35%
29%36%
42,477
17,788
36,9800.73 0.34
0.55353
475.860.74
1,511
778
3.18
100%City of Traverse City: C-1 | C-3
District(s)
100%
G&I Core Place
43,123
City of Traverse City, Garfield, East Bay, Greilickville CDP
2,032
Census Data
543
-
5,000
10,000
15,000
20,000
25,000
30,000
35,000
40,000 Mean (All Corridors)
West Bay Shore Drive(M22) & E TraverseHighway (M72) (Incochee tosouth of Carter Road)West Bay Shore Drive(M22) (S Township Limits toCherry Bend Road)

CC page 73
Commercial
Corridor Overview
Corridor Segment and Surrounding 1/4 Mile Study Area Map
Economic DevelopmentCommunity policies or activities assisting economic development (City of Traverse City)
Growth & Investment Strategy Community Economic Strategy
Identify Areas of Focus for G&I Community Marketing Strategy
Development Opportunities Market Potential Development Sites
Publish Development Guide Capital Improvement Plan
Traverse City Munson Ave Corridor42
YesYesYesYes
Unit(s) of Government:
Munson Avenue (US31) from E. Front Street to Avenue B
Yes
Bike Lane:
23,491 Source: MDOT
4, Bi-Directional Traffic with Turn/Passing Lanes
No Street Parking
BATA - Fixed Route
No
Sidewalks
42
Pedestrian Amenities:
Corridor Street Name(s):
Corridor Classification:
Length:
Street Classification:
2013 Traffic Volume(AADT):
Number of Traffic Lanes:
Walk Score
No
1.02 miles
Principal Arterial - Other
City of Traverse City
Parking
Transit Service:
Entertainment Venues:
Munson Avenue Corridor's US-31 provides the most direct north-south movement through the core of the Traverse City area. It is bounded on the northwest by Northwestern Michigan College and a large strip center and Munson Medical Facility to the southeast. It is lined by retail, office, and transient lodging uses.
YesYesYes

page 74 CC
Study Area Summary for 1/4 Mile Area Surrounding the Corridor
Total Population (2010)
People per AcrePeople per Square Mile
Total Housing (2010)
Gross Neighborhood Density (per acre)
Study Area Size (Land Cover)
AcresSquare Miles
Workers Living within Study Area
% with earnings $1250/month or less% with earnings $1251/month to $3333/month% with earnings greater than $3333/month
Jobs Located within Study Area
Job Density (per acre)
Zoning
Infrastructure Traffic Counts
Public Utilities
Sewer Additional Capacity
Water Additional Capacity
Energy Utilities
Underground ElectricRenewable Energy Production
Natural Gas
Broadband
Policy
Downtown Plan Yes
Corridor Improvement Plan Yes
Placemaking Elements
Theaters/Entertainment Venues No Grocery Stores YesRestaurants YesSidewalk Cafés NoParks No
Iconic Buildings No Pocket Parks NoPublic Art Installations NoWayfinding NoPedestrian Connections Yes
YesYes
Yes
NoNo
(Fiber, Cable, DSL, 4G, Fixed Wireless)Yes - 5 Technologies
Highest Density District
% of Districts That Allow Multi-Family
by Right
31%
Lowest Density District
Max Residential Site DensityMax Building
Height
28%41%
G&I Area
69,802
21,631 34,164
28,068
0.85
% of Districts That Allow Residential
Use
Traverse City & Surrounding Townships
28%40%32%
669
2.40
29.0
Traverse City Munson Ave Corridor 42
Traverse City Munson Ave Corridor
Corridor Segment
63.4 45 ft100%
50,796.80 126,579.2079.37 197.78
0.270.43
% of Districts That Allow Mixed Use
By Right
3.651,480
32%
30%39%
42,477
17,788
36,9800.73 0.34
0.55353
405.670.63
1,966
973
4.85
100%HR | C-1 | C-2 | C-3 | H-2
District(s)
100%
G&I Core Place
43,123
City of Traverse City, Garfield, East Bay, Greilickville CDP
3,102
Census Data
543
-
5,000
10,000
15,000
20,000
25,000
30,000
35,000
40,000Mean (All Corridors)
Munson Avenue (US31) (E.Front Street to Avenue B)
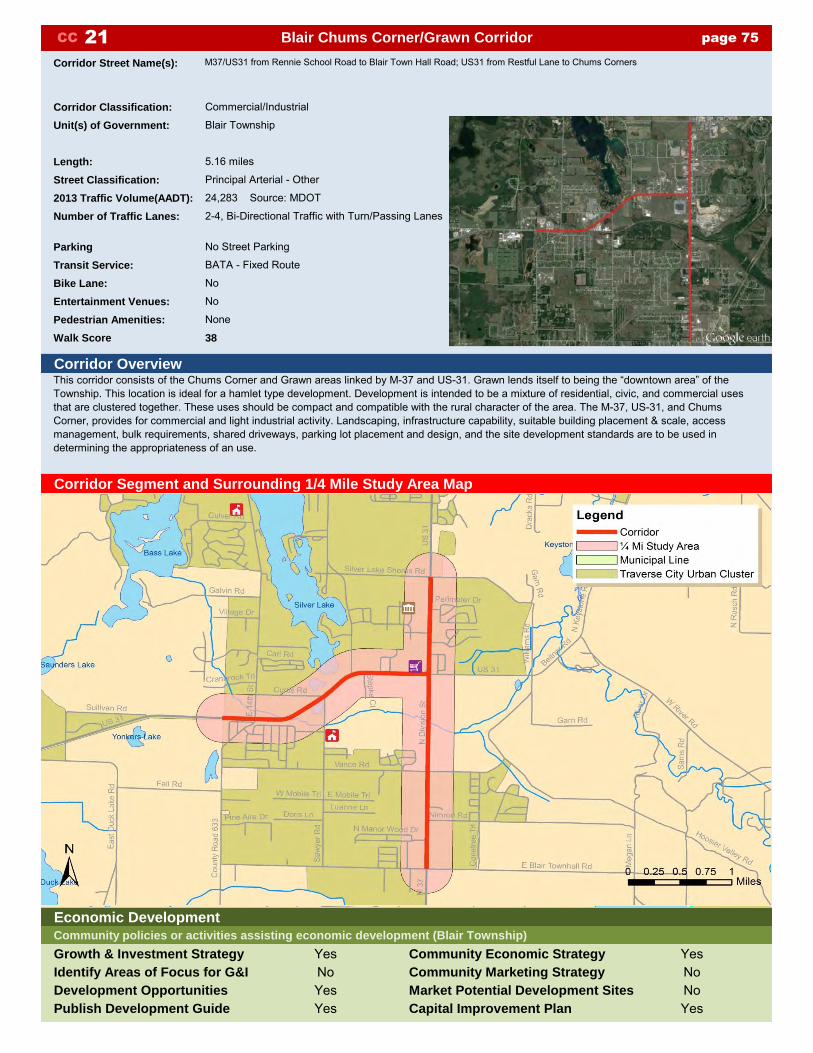
CC page 75
Commercial/Industrial
Corridor Overview
Corridor Segment and Surrounding 1/4 Mile Study Area Map
Economic DevelopmentCommunity policies or activities assisting economic development (Blair Township)
Growth & Investment Strategy Community Economic Strategy
Identify Areas of Focus for G&I Community Marketing Strategy
Development Opportunities Market Potential Development Sites
Publish Development Guide Capital Improvement Plan
Blair Chums Corner/Grawn Corridor21
YesNoNoYes
Unit(s) of Government:
M37/US31 from Rennie School Road to Blair Town Hall Road; US31 from Restful Lane to Chums Corners
Yes
Bike Lane:
24,283 Source: MDOT
2-4, Bi-Directional Traffic with Turn/Passing Lanes
No Street Parking
BATA - Fixed Route
No
None
38
Pedestrian Amenities:
Corridor Street Name(s):
Corridor Classification:
Length:
Street Classification:
2013 Traffic Volume(AADT):
Number of Traffic Lanes:
Walk Score
No
5.16 miles
Principal Arterial - Other
Blair Township
Parking
Transit Service:
Entertainment Venues:
This corridor consists of the Chums Corner and Grawn areas linked by M-37 and US-31. Grawn lends itself to being the “downtown area” of the Township. This location is ideal for a hamlet type development. Development is intended to be a mixture of residential, civic, and commercial uses that are clustered together. These uses should be compact and compatible with the rural character of the area. The M-37, US-31, and Chums Corner, provides for commercial and light industrial activity. Landscaping, infrastructure capability, suitable building placement & scale, access management, bulk requirements, shared driveways, parking lot placement and design, and the site development standards are to be used in determining the appropriateness of an use.
YesNoYes

page 76 CC
Study Area Summary for 1/4 Mile Area Surrounding the Corridor
Total Population (2010)
People per AcrePeople per Square Mile
Total Housing (2010)
Gross Neighborhood Density (per acre)
Study Area Size (Land Cover)
AcresSquare Miles
Workers Living within Study Area
% with earnings $1250/month or less% with earnings $1251/month to $3333/month% with earnings greater than $3333/month
Jobs Located within Study Area
Job Density (per acre)
Zoning
Infrastructure Traffic Counts
Public Utilities
Sewer Limited Additional Capacity
Water Additional Capacity
Energy Utilities
Underground ElectricRenewable Energy Production
Natural Gas
Broadband
Policy
Downtown Plan No
Corridor Improvement Plan No
Placemaking Elements
Theaters/Entertainment Venues No Grocery Stores YesRestaurants YesSidewalk Cafés NoParks Yes
Iconic Buildings Yes Pocket Parks NoPublic Art Installations YesWayfinding NoPedestrian Connections No
LimitedYes
Wuefel Park
Yes
NoNo
(Fiber, Cable, DSL, 4G, Fixed Wireless)Yes - 5 Technologies
Highest Density District
% of Districts That Allow Multi-Family
by Right
31%
Lowest Density District
Max Residential Site DensityMax Building
Height
28%41%
G&I Area
69,802
21,631 34,164
28,068
0.85
% of Districts That Allow Residential
Use
Traverse City & Surrounding Townships
28%40%32%
1,223
0.81
0.2
Blair Chums Corner/Grawn Corridor 21
Blair Chums Corner/Grawn Corridor
Corridor Segment
41.5 55 ft33%
50,796.80 126,579.2079.37 197.78
0.270.43
% of Districts That Allow Mixed Use
By Right
0.32556
27%
28%44%
42,477
17,788
36,9800.73 0.34
0.55353
1,739.472.72
3,465
1,404
1.99
33%RN | CM | RC | V | BV | IS
District(s)
83%
G&I Core Place
43,123
City of Traverse City, Garfield, East Bay, Greilickville CDP
1,275
Census Data
543
-
5,000
10,000
15,000
20,000
25,000
30,000
35,000
40,000 Mean (All Corridors)
M37/US31 (Rennie SchoolRoad to Blair Town HallRoad)
US31 (Restful Lane toChums Corners)

CC page 77
Central Business District
Corridor Overview
Corridor Segment and Surrounding 1/4 Mile Study Area Map
Economic DevelopmentCommunity policies or activities assisting economic development (Acme Township)
Growth & Investment Strategy Community Economic Strategy
Identify Areas of Focus for G&I Community Marketing Strategy
Development Opportunities Market Potential Development Sites
Publish Development Guide Capital Improvement Plan
Acme US31/M72 Acme Shores Corridor43
NoNoNoNo
Unit(s) of Government:
Munson Avenue (US31) from S Township Limits to Grand Traverse Resort Village Boulevard; M72 from US31 to Lautner Road; Mt Hope Road from US31 to M72
Yes
Bike Lane:
26,742 Source: MDOT, N/A
2-4, Bi-Directional Traffic with Turn/Passing Lanes
No Street Parking
BATA - Fixed Route
No
Sidewalks, Crosswalks
32
Pedestrian Amenities:
Corridor Street Name(s):
Corridor Classification:
Length:
Street Classification:
2013 Traffic Volume(AADT):
Number of Traffic Lanes:
Walk Score
Yes
4.95 miles
Principal Arterial - Other, Local
Acme Township
Parking
Transit Service:
Entertainment Venues:
The US-31/M72 Acme Shores Corridor provides the most direct north-south and east west movement through the core of the Traverse City area. The corridor provides access to other significant regional activity centers including the Grand Traverse Resort, Turtle Creek Casino, and the new Grand Traverse Town Center. It also provides a direct connection to the interstate system to the east via I-75 in Graying and south to US-131.
YesYesYes

page 78 CC
Study Area Summary for 1/4 Mile Area Surrounding the Corridor
Total Population (2010)
People per AcrePeople per Square Mile
Total Housing (2010)
Gross Neighborhood Density (per acre)
Study Area Size (Land Cover)
AcresSquare Miles
Workers Living within Study Area
% with earnings $1250/month or less% with earnings $1251/month to $3333/month% with earnings greater than $3333/month
Jobs Located within Study Area
Job Density (per acre)
Zoning
Infrastructure Traffic Counts
Public Utilities
Sewer Limited Additional Capacity
Water Limited Additional Capacity
Energy Utilities
Underground ElectricRenewable Energy Production
Natural Gas
Broadband
Policy
Downtown Plan Yes
Corridor Improvement Plan No
Placemaking Elements
Theaters/Entertainment Venues No Grocery Stores YesRestaurants YesSidewalk Cafés NoParks Yes
Iconic Buildings No Pocket Parks YesPublic Art Installations NoWayfinding YesPedestrian Connections Yes
LimitedLimited
Yes
NoNo
(Fiber, Cable, DSL, 4G, Fixed Wireless)Yes - 5 Technologies
Highest Density District
% of Districts That Allow Multi-Family
by Right
31%
Lowest Density District
Max Residential Site DensityMax Building
Height
28%41%
G&I Area
69,802
21,631 34,164
28,068
0.85
% of Districts That Allow Residential
Use
Traverse City & Surrounding Townships
28%40%32%
863
1.24
2.9
Acme US31/M72 Acme Shores Corridor 43
Acme US31/M72 Acme Shores Corridor
Corridor Segment
25.3 40 ft0%
50,796.80 126,579.2079.37 197.78
0.270.43
% of Districts That Allow Mixed Use
By Right
0.73918
33%
27%40%
42,477
17,788
36,9800.73 0.34
0.55353
1,255.621.96
2,402
1,556
1.91
17%B-1P | B-1S | B-2 | B-3 | R-2 | R-3
District(s)
67%
G&I Core Place
43,123
City of Traverse City, Garfield, East Bay, Greilickville CDP
1,224
Census Data
543
-
5,000
10,000
15,000
20,000
25,000
30,000
35,000
40,000 Mean (All Corridors)
Munson Avenue (US31) (STownship Limits to GrandTraverse Resort VillageBoulevard)M72 (US31 to LautnerRoad)
Mt Hope Road (US31 toM72)

CC page 79
Commercial
Corridor Overview
Corridor Segment and Surrounding 1/4 Mile Study Area Map
Economic DevelopmentCommunity policies or activities assisting economic development (East Bay Charter Township)
Growth & Investment Strategy Community Economic Strategy
Identify Areas of Focus for G&I Community Marketing Strategy
Development Opportunities Market Potential Development Sites
Publish Development Guide Capital Improvement Plan
East Bay Miracle Mile Corridor44
NoNoNoNo
Unit(s) of Government:
Munson Avenue (US31) from W Township Limits to N Township Limits; 3 Mile Road from US31 to Aero Park Drive
Yes
Bike Lane:
25,505 Source: MDOT, N/A
4, Bi-Directional Traffic with Turn/Passing Lanes
No Street Parking
BATA - Fixed Route
No
Sidewalks, Crosswalks
29
Pedestrian Amenities:
Corridor Street Name(s):
Corridor Classification:
Length:
Street Classification:
2013 Traffic Volume(AADT):
Number of Traffic Lanes:
Walk Score
Yes
2.29 miles
Principal Arterial - Other, Minor Arterial
East Bay Charter Township
Parking
Transit Service:
Entertainment Venues:
East Bay Miracle Mile Corridor's US-31 provides the most direct north-south and east west movement through the core of the Traverse City area. The corridor provides access to downtown Traverse City and other significant regional activity centers including the Grand Traverse Resort. It also contains a significant portion of the Traverse City areas waterfront transient lodging properties situated along East Bay. 3 Mile Road provides a localized north-south movement from Garfield Road to US-31. There are no direct connections to significant traffic generators, though the corridor provides access to Cherry Capital Airport via S. Airport Road.
NoNoYes

page 80 CC
Study Area Summary for 1/4 Mile Area Surrounding the Corridor
Total Population (2010)
People per AcrePeople per Square Mile
Total Housing (2010)
Gross Neighborhood Density (per acre)
Study Area Size (Land Cover)
AcresSquare Miles
Workers Living within Study Area
% with earnings $1250/month or less% with earnings $1251/month to $3333/month% with earnings greater than $3333/month
Jobs Located within Study Area
Job Density (per acre)
Zoning
Infrastructure Traffic Counts
Public Utilities
Sewer Additional Capacity
Water Additional Capacity
Energy Utilities
Underground ElectricRenewable Energy Production
Natural Gas
Broadband
Policy
Downtown Plan No
Corridor Improvement Plan No
Placemaking Elements
Theaters/Entertainment Venues No Grocery Stores NoRestaurants YesSidewalk Cafés NoParks Yes
Iconic Buildings No Pocket Parks NoPublic Art Installations NoWayfinding NoPedestrian Connections Yes
YesYes
Yes
NoNo
(Fiber, Cable, DSL, 4G, Fixed Wireless)Yes - 5 Technologies
Highest Density District
% of Districts That Allow Multi-Family
by Right
31%
Lowest Density District
Max Residential Site DensityMax Building
Height
28%41%
G&I Area
69,802
21,631 34,164
28,068
0.85
% of Districts That Allow Residential
Use
Traverse City & Surrounding Townships
28%40%32%
682
1.49
3.0
East Bay Miracle Mile Corridor 44
East Bay Miracle Mile Corridor
Corridor Segment
49.5 50 ft0%
50,796.80 126,579.2079.37 197.78
0.270.43
% of Districts That Allow Mixed Use
By Right
4.793,150
27%
28%45%
42,477
17,788
36,9800.73 0.34
0.55353
657.341.03
1,652
982
2.51
33%LDR | RB | PO
District(s)
33%
G&I Core Place
43,123
City of Traverse City, Garfield, East Bay, Greilickville CDP
1,608
Census Data
543
-
5,000
10,000
15,000
20,000
25,000
30,000
35,000
40,000 Mean (All Corridors)
Munson Avenue (US31) (WTownship Limits to NTownship Limits)
3 Mile Road (US31 to AeroPark Drive)

CC page 81
Commercial/Industrial
Corridor Overview
Corridor Segment and Surrounding 1/4 Mile Study Area Map
Economic DevelopmentCommunity policies or activities assisting economic development (East Bay Charter Township)
Growth & Investment Strategy Community Economic Strategy
Identify Areas of Focus for G&I Community Marketing Strategy
Development Opportunities Market Potential Development Sites
Publish Development Guide Capital Improvement Plan
East Bay 3 Mile & Hammond Corridor45
NoNoNoNo
Unit(s) of Government:
Hammond Road (C660) from Edgecomb Road to Chartwell Drive; 3 Mile Road from Vanderlip Road to TCAPS
Yes
Bike Lane:
NA
2-4, Bi-Directional Traffic with Turn/Passing Lanes
No Street Parking
BATA - Fixed Route
No
Sidewalks, Crosswalks
60
Pedestrian Amenities:
Corridor Street Name(s):
Corridor Classification:
Length:
Street Classification:
2013 Traffic Volume(AADT):
Number of Traffic Lanes:
Walk Score
No
1.48 miles
Minor Arterial
East Bay Charter Township
Parking
Transit Service:
Entertainment Venues:
The 3-Mile & Hammond Corridor facilitates a more regional east-west movement. Because it does not provide immediate access to a regionally significant center, Hammond Road is relied on primarily to provide access from less populated residential and local commercial centers to other corridors. 3 Mile Road provides a localized north-south movement from Garfield Road to US-31. There are no direct connections to significant traffic generators, though the corridor provides access to Cherry Capital Airport via S. Airport Road. Other than this connection, 3 Mile Road’s primary function is to provide access from commercial and light industrial areas.
NoNoYes

page 82 CC
Study Area Summary for 1/4 Mile Area Surrounding the Corridor
Total Population (2010)
People per AcrePeople per Square Mile
Total Housing (2010)
Gross Neighborhood Density (per acre)
Study Area Size (Land Cover)
AcresSquare Miles
Workers Living within Study Area
% with earnings $1250/month or less% with earnings $1251/month to $3333/month% with earnings greater than $3333/month
Jobs Located within Study Area
Job Density (per acre)
Zoning
Infrastructure Traffic Counts (Data Unavailable for Corridor)
Public Utilities
Sewer Additional Capacity
Water Additional Capacity
Energy Utilities
Underground ElectricRenewable Energy Production
Natural Gas
Broadband
Policy
Downtown Plan No
Corridor Improvement Plan No
Placemaking Elements
Theaters/Entertainment Venues No Grocery Stores YesRestaurants YesSidewalk Cafés YesParks No
Iconic Buildings No Pocket Parks NoPublic Art Installations NoWayfinding NoPedestrian Connections Yes
YesYes
Yes
NoNo
(Fiber, Cable, DSL, 4G, Fixed Wireless)Yes - 5 Technologies
Highest Density District
% of Districts That Allow Multi-Family
by Right
31%
Lowest Density District
Max Residential Site DensityMax Building
Height
28%41%
G&I Area
69,802
21,631 34,164
28,068
0.85
% of Districts That Allow Residential
Use
Traverse City & Surrounding Townships
28%40%32%
355
0.60
5.0
East Bay 3 Mile & Hammond Corridor 45
East Bay 3 Mile & Hammond Corridor
Corridor Segment
8.0 50 ft67%
50,796.80 126,579.2079.37 197.78
0.270.43
% of Districts That Allow Mixed Use
By Right
0.36203
32%
27%41%
42,477
17,788
36,9800.73 0.34
0.55353
559.240.87
856
335
1.53
33%MDR | VC | IND
District(s)
67%
G&I Core Place
43,123
City of Traverse City, Garfield, East Bay, Greilickville CDP
980
Census Data
543
-
5,000
10,000
15,000
20,000
25,000
30,000
35,000
40,000 Mean (All Corridors)
Hammond Road (C660)(Edgecomb Road toChartwell Drive)
3 Mile Road (VanderlipRoad to TCAPS)

CC page 83
Commercial
Corridor Overview
Corridor Segment and Surrounding 1/4 Mile Study Area Map
Economic DevelopmentCommunity policies or activities assisting economic development (Elmwood Charter Township)
Growth & Investment Strategy Community Economic Strategy
Identify Areas of Focus for G&I Community Marketing Strategy
Development Opportunities Market Potential Development Sites
Publish Development Guide Capital Improvement Plan
Elmwood Cherry Bend Corridor46
NoNoNoNo
Unit(s) of Government:
Cherry Bend Road from Avondale Lane to M22
No
Bike Lane:
NA
2, Bi-Directional Traffic
No Street Parking
BATA - Dial-A-Ride
No
None
38
Pedestrian Amenities:
Corridor Street Name(s):
Corridor Classification:
Length:
Street Classification:
2013 Traffic Volume(AADT):
Number of Traffic Lanes:
Walk Score
No
0.77 miles
Major Collector
Elmwood Charter Township
Parking
Transit Service:
Entertainment Venues:
The Cherry Bend Corridor consists of light commercial uses compatible with the adjoining residential uses. Commercial uses are characterized by low volume sales and low volume vehicular traffic requiring minimal off-street parking. The corridor is bisected by the Leelanau Trail, offering a non-motorized connection between Traverse City and Suttons Bay.
YesYesYes

page 84 CC
Study Area Summary for 1/4 Mile Area Surrounding the Corridor
Total Population (2010)
People per AcrePeople per Square Mile
Total Housing (2010)
Gross Neighborhood Density (per acre)
Study Area Size (Land Cover)
AcresSquare Miles
Workers Living within Study Area
% with earnings $1250/month or less% with earnings $1251/month to $3333/month% with earnings greater than $3333/month
Jobs Located within Study Area
Job Density (per acre)
Zoning
Infrastructure Traffic Counts (Data Unavailable for Corridor)
Public Utilities
Sewer Additional Capacity
Water Limited Additional Capacity
Energy Utilities
Underground ElectricRenewable Energy Production
Natural Gas
Broadband
Policy
Downtown Plan No
Corridor Improvement Plan No
Placemaking Elements
Theaters/Entertainment Venues No Grocery Stores NoRestaurants NoSidewalk Cafés NoParks Yes
Iconic Buildings No Pocket Parks NoPublic Art Installations NoWayfinding NoPedestrian Connections Yes
YesLimited
Yes
NoNo
(Fiber, Cable, DSL, 4G, Fixed Wireless)Yes - 5 Technologies
Highest Density District
% of Districts That Allow Multi-Family
by Right
31%
Lowest Density District
Max Residential Site DensityMax Building
Height
28%41%
G&I Area
69,802
21,631 34,164
28,068
0.85
% of Districts That Allow Residential
Use
Traverse City & Surrounding Townships
28%40%32%
403
2.05
3.5
Elmwood Cherry Bend Corridor 46
Elmwood Cherry Bend Corridor
Corridor Segment
7.0 35 ft0%
50,796.80 126,579.2079.37 197.78
0.270.43
% of Districts That Allow Mixed Use
By Right
0.96311
35%
25%40%
42,477
17,788
36,9800.73 0.34
0.55353
322.480.50
1,200
660
3.72
0%R-1 | NC
District(s)
100%
G&I Core Place
43,123
City of Traverse City, Garfield, East Bay, Greilickville CDP
2,382
Census Data
543
-
5,000
10,000
15,000
20,000
25,000
30,000
35,000
40,000Mean (All Corridors)
Cherry Bend Road(Avondale Lane to M22)

CC page 85
Commercial
Corridor Overview
Corridor Segment and Surrounding 1/4 Mile Study Area Map
Economic DevelopmentCommunity policies or activities assisting economic development (Charter Township of Garfield)
Growth & Investment Strategy Community Economic Strategy
Identify Areas of Focus for G&I Community Marketing Strategy
Development Opportunities Market Potential Development Sites
Publish Development Guide Capital Improvement Plan
Garfield South Airport Corridor47
NoNoYesNo
Unit(s) of Government:
South Airport Road from Sam's Club Service Drive to Townline Road
Yes
Bike Lane:
NA
2-4, Bi-Directional Traffic with Turn/Passing Lanes
No Street Parking
BATA - Fixed Route
Yes
Sidewalks, Crosswalks
65
Pedestrian Amenities:
Corridor Street Name(s):
Corridor Classification:
Length:
Street Classification:
2013 Traffic Volume(AADT):
Number of Traffic Lanes:
Walk Score
No
4.30 miles
Minor Arterial
Charter Township of Garfield
Parking
Transit Service:
Entertainment Venues:
The South Airport Corridor provides significant east-west movements in the core population center. However, unlike the M-72 corridor it does not provide direct access to points outside of the region. On its east end, the corridor provides direct access to the Cherry Capital Airport. On the west, it’s situated next to and provides access to the Grand Traverse Mall. The corridor forms a crucial link across the Boardman River between these two regionally significant centers. In addition, South Airport Road provides local access primarily to businesses in between the mall and the airport while serving through movements from residential areas on its extreme east and west termini.
YesYesYes

page 86 CC
Study Area Summary for 1/4 Mile Area Surrounding the Corridor
Total Population (2010)
People per AcrePeople per Square Mile
Total Housing (2010)
Gross Neighborhood Density (per acre)
Study Area Size (Land Cover)
AcresSquare Miles
Workers Living within Study Area
% with earnings $1250/month or less% with earnings $1251/month to $3333/month% with earnings greater than $3333/month
Jobs Located within Study Area
Job Density (per acre)
Zoning
Infrastructure Traffic Counts (Data Unavailable for Corridor)
Public Utilities
Sewer Additional Capacity
Water Additional Capacity
Energy Utilities
Underground ElectricRenewable Energy Production
Natural Gas
Broadband
Policy
Downtown Plan No
Corridor Improvement Plan No
Placemaking Elements
Theaters/Entertainment Venues Yes Grocery Stores YesRestaurants YesSidewalk Cafés NoParks Yes
Iconic Buildings Yes Pocket Parks NoPublic Art Installations NoWayfinding NoPedestrian Connections Yes
YesYes
Grand Traverse Cinema
Yes
NoNo
(Fiber, Cable, DSL, 4G, Fixed Wireless)Yes - 5 Technologies
Highest Density District
% of Districts That Allow Multi-Family
by Right
31%
Lowest Density District
Max Residential Site DensityMax Building
Height
28%41%
G&I Area
69,802
21,631 34,164
28,068
0.85
% of Districts That Allow Residential
Use
Traverse City & Surrounding Townships
28%40%32%
1,369
1.49
1.0
Garfield South Airport Corridor 47
Garfield South Airport Corridor
Corridor Segment
76.4 40 ft9%
50,796.80 126,579.2079.37 197.78
0.270.43
% of Districts That Allow Mixed Use
By Right
5.287,776
23%
33%44%
42,477
17,788
36,9800.73 0.34
0.55353
1,472.352.30
4,210
2,192
2.86
9%R-1A | R-1B | R-1M | R-1MH | C-1 | C-1-O | C-2 | C-3 | C-4 | MUIBD-G | MUIBD-L
District(s)
73%
G&I Core Place
43,123
City of Traverse City, Garfield, East Bay, Greilickville CDP
1,830
Census Data
543
-
5,000
10,000
15,000
20,000
25,000
30,000
35,000
40,000 Mean (All Corridors)
South Airport Road (Sam'sClub Service Drive toTownline Road)

CC page 87
Commercial/Industrial
Corridor Overview
Corridor Segment and Surrounding 1/4 Mile Study Area Map
Economic DevelopmentCommunity policies or activities assisting economic development (Charter Township of Garfield)
Growth & Investment Strategy Community Economic Strategy
Identify Areas of Focus for G&I Community Marketing Strategy
Development Opportunities Market Potential Development Sites
Publish Development Guide Capital Improvement Plan
Garfield Barlow Park Corridor48
NoNoYesNo
Unit(s) of Government:
Park Drive/Premier Street/Woodmere Avenue/Boon Street/Barlow Street from Keystone Road to South Airport Road
Yes
Bike Lane:
NA
2, Bi-Directional Traffic with Turn/Passing Lanes
No Street Parking
BATA - Fixed Route
No
Sidewalks, Crosswalks
49
Pedestrian Amenities:
Corridor Street Name(s):
Corridor Classification:
Length:
Street Classification:
2013 Traffic Volume(AADT):
Number of Traffic Lanes:
Walk Score
Yes
1.93 miles
Major Collector
Charter Township of Garfield
Parking
Transit Service:
Entertainment Venues:
The Barlow Park Corridor contains a significant industrial and commercial area surrounded by higher density residential to the east and west.
YesYesYes

page 88 CC
Study Area Summary for 1/4 Mile Area Surrounding the Corridor
Total Population (2010)
People per AcrePeople per Square Mile
Total Housing (2010)
Gross Neighborhood Density (per acre)
Study Area Size (Land Cover)
AcresSquare Miles
Workers Living within Study Area
% with earnings $1250/month or less% with earnings $1251/month to $3333/month% with earnings greater than $3333/month
Jobs Located within Study Area
Job Density (per acre)
Zoning
Infrastructure Traffic Counts (Data Unavailable for Corridor)
Public Utilities
Sewer Additional Capacity
Water Additional Capacity
Energy Utilities
Underground ElectricRenewable Energy Production
Natural Gas
Broadband
Policy
Downtown Plan No
Corridor Improvement Plan No
Placemaking Elements
Theaters/Entertainment Venues No Grocery Stores YesRestaurants YesSidewalk Cafés NoParks Yes
Iconic Buildings No Pocket Parks NoPublic Art Installations NoWayfinding NoPedestrian Connections No
YesYes
Yes
NoNo
(Fiber, Cable, DSL, 4G, Fixed Wireless)Yes - 5 Technologies
Highest Density District
% of Districts That Allow Multi-Family
by Right
31%
Lowest Density District
Max Residential Site DensityMax Building
Height
28%41%
G&I Area
69,802
21,631 34,164
28,068
0.85
% of Districts That Allow Residential
Use
Traverse City & Surrounding Townships
28%40%32%
1,600
4.23
4.4
Garfield Barlow Park Corridor 48
Garfield Barlow Park Corridor
Corridor Segment
51.9 40 ft0%
50,796.80 126,579.2079.37 197.78
0.270.43
% of Districts That Allow Mixed Use
By Right
3.601,989
23%
34%43%
42,477
17,788
36,9800.73 0.34
0.55353
552.840.86
4,193
2,338
7.58
0%R-1M | C-1 | C-2 | MUIBD-G
District(s)
75%
G&I Core Place
43,123
City of Traverse City, Garfield, East Bay, Greilickville CDP
4,854
Census Data
543
-
5,000
10,000
15,000
20,000
25,000
30,000
35,000
40,000 Mean (All Corridors)
Park Drive/PremierStreet/WoodmereAvenue/Boon Street/BarlowStreet (Keystone Road toSouth Airport Road)

CC page 89
Commercial/Industrial
Corridor Overview
Corridor Segment and Surrounding 1/4 Mile Study Area Map
Economic DevelopmentCommunity policies or activities assisting economic development (Charter Township of Garfield)
Growth & Investment Strategy Community Economic Strategy
Identify Areas of Focus for G&I Community Marketing Strategy
Development Opportunities Market Potential Development Sites
Publish Development Guide Capital Improvement Plan
Garfield Cass Road Corridor49
NoNoYesNo
Unit(s) of Government:
Cass Road from N Township Limits to Railroad Crossing
Yes
Bike Lane:
NA
2, Bi-Directional Traffic with Turn/Passing Lanes
No Street Parking
BATA - Dial-A-Ride
No
None
46
Pedestrian Amenities:
Corridor Street Name(s):
Corridor Classification:
Length:
Street Classification:
2013 Traffic Volume(AADT):
Number of Traffic Lanes:
Walk Score
No
2.53 miles
Minor Arterial
Charter Township of Garfield
Parking
Transit Service:
Entertainment Venues:
The Cass Road Corridor contains significant industrial and commercial activity including the Sara Lee Food Production Facility, a major area employer, on the north end. It is bisected by S. Airport Road connecting the corridor with major regional routes.
YesYesYes

page 90 CC
Study Area Summary for 1/4 Mile Area Surrounding the Corridor
Total Population (2010)
People per AcrePeople per Square Mile
Total Housing (2010)
Gross Neighborhood Density (per acre)
Study Area Size (Land Cover)
AcresSquare Miles
Workers Living within Study Area
% with earnings $1250/month or less% with earnings $1251/month to $3333/month% with earnings greater than $3333/month
Jobs Located within Study Area
Job Density (per acre)
Zoning
Infrastructure Traffic Counts (Data Unavailable for Corridor)
Public Utilities
Sewer Additional Capacity
Water Additional Capacity
Energy Utilities
Underground ElectricRenewable Energy Production
Natural Gas
Broadband
Policy
Downtown Plan No
Corridor Improvement Plan No
Placemaking Elements
Theaters/Entertainment Venues No Grocery Stores NoRestaurants YesSidewalk Cafés NoParks Yes
Iconic Buildings No Pocket Parks NoPublic Art Installations NoWayfinding NoPedestrian Connections No
YesYes
Yes
NoNo
(Fiber, Cable, DSL, 4G, Fixed Wireless)Yes - 5 Technologies
Highest Density District
% of Districts That Allow Multi-Family
by Right
31%
Lowest Density District
Max Residential Site DensityMax Building
Height
28%41%
G&I Area
69,802
21,631 34,164
28,068
0.85
% of Districts That Allow Residential
Use
Traverse City & Surrounding Townships
28%40%32%
563
1.00
4.4
Garfield Cass Road Corridor 49
Garfield Cass Road Corridor
Corridor Segment
51.9 40 ft0%
50,796.80 126,579.2079.37 197.78
0.270.43
% of Districts That Allow Mixed Use
By Right
4.944,329
22%
35%43%
42,477
17,788
36,9800.73 0.34
0.55353
876.761.37
1,522
876
1.74
0%C-1 | C-2 | MUIBD-G | MUIBD-L
District(s)
50%
G&I Core Place
43,123
City of Traverse City, Garfield, East Bay, Greilickville CDP
1,111
Census Data
543
-
5,000
10,000
15,000
20,000
25,000
30,000
35,000
40,000Mean (All Corridors)
Cass Road (N TownshipLimits to Railroad Crossing)

Methodology page 91
Growth & Investment Area Study
Census Class Definitions
2010 Census Urban and Rural Classification and Urban Area Criteria The Census Bureau’s urban-rural classification is fundamentally a delineation of geographical areas, identifying both individual urban areas and the rural areas of the nation. The Census Bureau’s urban areas represent dense-ly developed territory, and encompass residential, commercial, and other non-residential urban land uses.
For the 2010 Census, an urban area will comprise a densely settled core of census tracts and/or census blocks that meet minimum population density requirements, along with adjacent territory containing non-residential urban land uses as well as territory with low population density included to link outlying densely settled territory with the densely settled core. To qualify as an urban area, the territory identified according to criteria must encompass at least 2,500 people, at least 1,500 of which reside outside institutional group quarters. The Census Bureau identi-fies two types of urban areas:
Urbanized Areas (UAs) of 50,000 or more people;
Urban Clusters (UCs) of at least 2,500 and less than 50,000 people.
“Rural” encompasses all population, housing, and territory not included within an urban area.
Source: https://www.census.gov/geo/reference/ua/urban-rural-2010.html
About Metropolitan and Micropolitan Statistical Areas The United States Office of Management and Budget (OMB) delineates metropolitan and micropolitan statistical areas according to published standards that are applied to Census Bureau data. The general concept of a metro-politan or micropolitan statistical area is that of a core area containing a substantial population nucleus, together with adjacent communities having a high degree of economic and social integration with that core. Currently de-lineated metropolitan and micropolitan statistical areas are based on application of 2010 standards [PDF] (which appeared in the Federal Register on June 2010) to 2010 Census and 2006-2010 American Community Survey data. Current metropolitan and micropolitan statistical area delineations were announced by OMB effective Feb-ruary 2013.
Standard delineations of metropolitan areas were first issued in 1949 by the then Bureau of the Budget (prede-cessor of OMB), under the designation "standard metropolitan area" (SMA). The term was changed to "standard metropolitan statistical area" (SMSA) in 1959, and to "metropolitan statistical area" (MSA) in 1983. The term "met-ropolitan area" (MA) was adopted in 1990 and referred collectively to metropolitan statistical areas (MSAs), con-solidated metropolitan statistical areas (CMSAs), and primary metropolitan statistical areas (PMSAs). The term "core based statistical area" (CBSA) became effective in 2000 and refers collectively to metropolitan and mi-cropolitan statistical areas.
OMB has been responsible for the official metropolitan areas since they were first delineated, except for the peri-od 1977 to 1981, when they were the responsibility of the Office of Federal Statistical Policy and Standards, De-partment of Commerce. The standards for delineating metropolitan areas were modified in 1958, 1971, 1975, 1980, 1990, 2000, and 2010.
Delineating Metropolitan and Micropolitan Statistical Areas The 2010 standards provide that each CBSA must contain at least one urban area of 10,000 or more population. Each metropolitan statistical area must have at least one urbanized area of 50,000 or more inhabitants. Each mi-cropolitan statistical area must have at least one urban cluster of at least 10,000 but less than 50,000 population.
Under the standards, the county (or counties) in which at least 50 percent of the population resides within urban areas of 10,000 or more population, or that contain at least 5,000 people residing within a single urban area of 10,000 or more population, is identified as a "central county" (counties). Additional "outlying counties" are included in the CBSA if they meet specified requirements of commuting to or from the central counties. Counties or equiva-
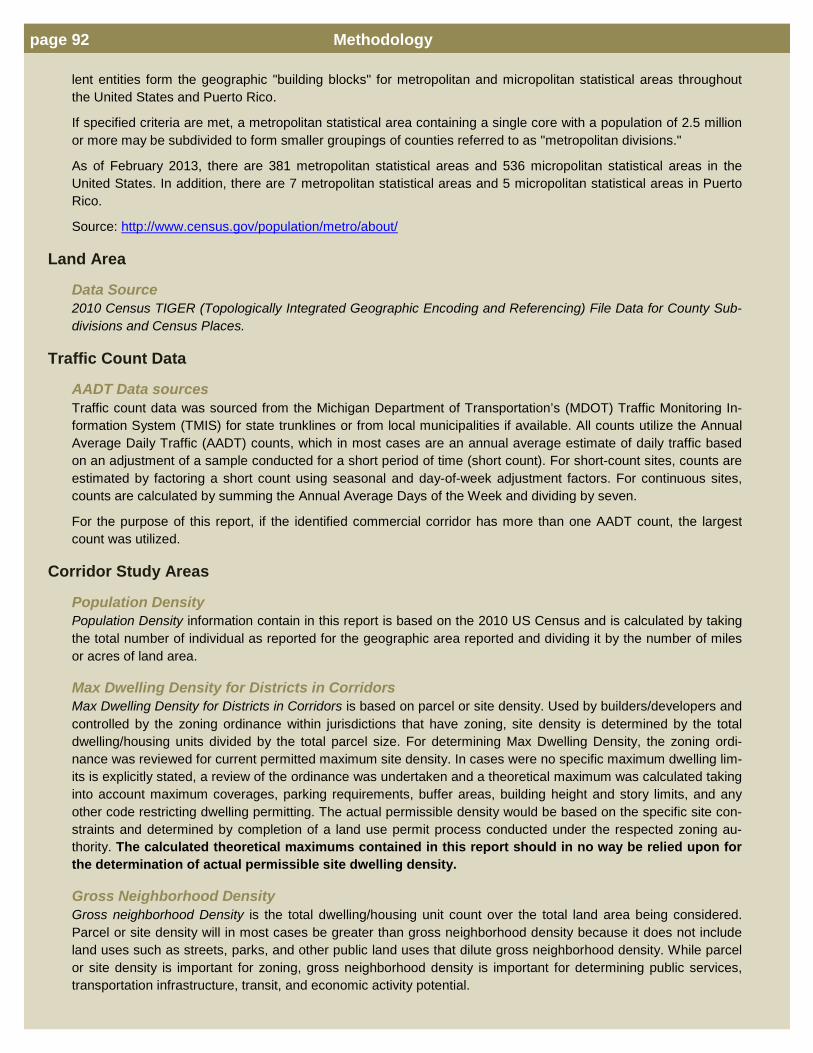
page 92 Methodology
lent entities form the geographic "building blocks" for metropolitan and micropolitan statistical areas throughout the United States and Puerto Rico.
If specified criteria are met, a metropolitan statistical area containing a single core with a population of 2.5 million or more may be subdivided to form smaller groupings of counties referred to as "metropolitan divisions."
As of February 2013, there are 381 metropolitan statistical areas and 536 micropolitan statistical areas in the United States. In addition, there are 7 metropolitan statistical areas and 5 micropolitan statistical areas in Puerto Rico.
Source: http://www.census.gov/population/metro/about/
Land Area
Data Source 2010 Census TIGER (Topologically Integrated Geographic Encoding and Referencing) File Data for County Sub-divisions and Census Places.
Traffic Count Data
AADT Data sources Traffic count data was sourced from the Michigan Department of Transportation’s (MDOT) Traffic Monitoring In-formation System (TMIS) for state trunklines or from local municipalities if available. All counts utilize the Annual Average Daily Traffic (AADT) counts, which in most cases are an annual average estimate of daily traffic based on an adjustment of a sample conducted for a short period of time (short count). For short-count sites, counts are estimated by factoring a short count using seasonal and day-of-week adjustment factors. For continuous sites, counts are calculated by summing the Annual Average Days of the Week and dividing by seven.
For the purpose of this report, if the identified commercial corridor has more than one AADT count, the largest count was utilized.
Corridor Study Areas
Population Density Population Density information contain in this report is based on the 2010 US Census and is calculated by taking the total number of individual as reported for the geographic area reported and dividing it by the number of miles or acres of land area.
Max Dwelling Density for Districts in Corridors Max Dwelling Density for Districts in Corridors is based on parcel or site density. Used by builders/developers and controlled by the zoning ordinance within jurisdictions that have zoning, site density is determined by the total dwelling/housing units divided by the total parcel size. For determining Max Dwelling Density, the zoning ordi-nance was reviewed for current permitted maximum site density. In cases were no specific maximum dwelling lim-its is explicitly stated, a review of the ordinance was undertaken and a theoretical maximum was calculated taking into account maximum coverages, parking requirements, buffer areas, building height and story limits, and any other code restricting dwelling permitting. The actual permissible density would be based on the specific site con-straints and determined by completion of a land use permit process conducted under the respected zoning au-thority. The calculated theoretical maximums contained in this report should in no way be relied upon for the determination of actual permissible site dwelling density.
Gross Neighborhood Density Gross neighborhood Density is the total dwelling/housing unit count over the total land area being considered. Parcel or site density will in most cases be greater than gross neighborhood density because it does not include land uses such as streets, parks, and other public land uses that dilute gross neighborhood density. While parcel or site density is important for zoning, gross neighborhood density is important for determining public services, transportation infrastructure, transit, and economic activity potential.

Methodology page 93
Job & Worker Density Job Density is based on 2012 data contained in the LEHD (Longitudinal Employer-Household Dynamics) Origin‐Destination Employment Statistics (LODES) from the US Census Bureau. Job count data by location is provided at the Census Block level by LODES, which is then used by culling the data based on which Census Blocks are contained by the geographical extent of the specific data being presented.
Worker Density is based on 2012 data contained in the LEHD (Longitudinal Employer-Household Dynamics) Origin‐Destination Employment Statistics (LODES) from the US Census Bureau. Worker count data (those indi-viduals currently employed and residing in the area of study) is provided at the Census Block level by LODES, which is then used by culling the data based on which Census Blocks are contained by the geographical extent of the specific data being presented.
Retail Sales
Data Source Retail data was sourced from Environmental Systems Research Institute, Inc. (Esri) by the purchase of a Com-plete State Retail MarketPlace Data License for the State of Michigan by all levels of geography.
Whitepaper Statement from Esri Esri has combined the latest Consumer Expenditure Surveys (CEX), 2006–2007, from the Bureau of Labor Statistics (BLS) to estimate current spending patterns. The continuing surveys include a Diary Survey for daily purchases and an Interview Survey for general purchases. The Diary Survey represents record keeping by consumer units for two consecutive weeklong periods. This component of the CEX collects data on small, dai-ly purchases that could be overlooked by the quarterly Interview Survey. The Interview Survey collects ex-penditure data from consumers in five interviews conducted every three months. Esri integrates data from both surveys to provide a comprehensive database on all consumer expenditures. To compensate for the rel-atively small CEX survey bases and the variability of single-year data, expenditures are averaged from the 2006–2007 surveys.
Esri computes Market Potential by combining 2011 Tapestry™ Segmentation data with Doublebase® 2009 data from GfK MRI. Doublebase 2009 is an integration of information from four consumer surveys. Each sur-vey respondent can be identified by Tapestry segment, so a rate of consumption by Tapestry segment can be determined for a product or service for any area.
The Expected Number of Consumers (households or adults) for a product or service in an area is computed by applying the consumption rate for Tapestry market segment "n" to households or adults in the area belong-ing to Tapestry segment "n," and summing across 65 Tapestry segments.
𝐸𝐸𝐸𝐸𝐸𝐸𝐸𝐸 𝑁𝑁𝑁𝑁𝐸𝑁 𝑜𝑜 𝐶𝑜𝐶𝐶𝑁𝑁𝐸𝑁𝐶 = �(𝐶𝑜𝑁𝐶𝐸𝑛 × 𝐶𝑜𝐶𝐶𝑁𝑁𝐸𝐸𝐶𝑜𝐶 𝑅𝑅𝐸𝐸𝑛)65
𝑛=1
The Local Consumption Rate for a product or service for an area is computed as the ratio of the expected number of consumers for a product or service in the area to the total households or adults in the area.
𝐿𝑜𝐸𝑅𝐿 𝐶𝑜𝐶𝐶𝑁𝑁𝐸𝐸𝐶𝑜𝐶 𝑅𝑅𝐸𝐸 =𝐸𝐸𝐸𝐸𝐸𝐸𝐸𝐸 𝑁𝑁𝑁𝑁𝐸𝑁 𝑜𝑜 𝐶𝑜𝐶𝐶𝑁𝑁𝐸𝑁𝐶
𝐵𝑅𝐶𝐸 𝐶𝑜𝑁𝐶𝐸
The Market Potential Index for a product or service for an area is the ratio of the local consumption rate for a product or service for the area to the US consumption rate for the product or service, multiplied by 100.
𝑀𝑅𝑁𝑀𝐸𝐸 𝑃𝑜𝐸𝐸𝐶𝐸𝐶𝑅𝐿 𝐼𝐶𝐸𝐸𝐸 =𝐿𝑜𝐸𝑅𝐿 𝐶𝑜𝐶𝐶𝑁𝑁𝐸𝐸𝐶𝑜𝐶 𝑅𝑅𝐸𝐸
𝑈𝑈 𝐶𝑜𝐶𝐶𝑁𝑁𝐸𝐸𝐶𝑜𝐶 𝑅𝑅𝐸𝐸× 100
Esri's Market Potential database includes data for more than 2,200 items, organized into 35 categories, rep-resenting goods, services, attitudes, and activities collected from GfK MRI surveys. Unless otherwise noted, each item refers to consumer spending or behavior in a 12-month period. The a or h following the five-digit product code denotes a consumer base of adults or households, respectively.

page 94 Methodology
Products and services, such as apparel items, types of digital cameras, video game systems, financial ac-counts and services, health-related items, Internet activities, satellite TV providers, personal care services, and detailed information about cell phones/PDAs (brands, service providers, average monthly bills, and pur-chase locations), are included. A product description was revised since the last Market Potential update if a product change was made by GfK MRI, if ranges had to be collapsed, or if more clarification was required. A product was dropped since the last Market Potential update if it did not pass a sample size test, became out-dated or unnecessary, or no longer exists in the GfK MRI database.
Retail Classification: Leakage is defined as the Potential Sales less the Total Sales. All inputs are as reported by Esri.
For the purposes of determining the Retail Classification, Sales, Potential Sales, and Leakage are taken from the Growth & Investment Area. A Retail Hub is defined in this study as having a negative retail leakage. If the Retail Sales for the Growth & Investment Area are greater than Potential Sales in the county in which it is located and the county’s leakage is negative, then the Retail Hub is classified as a Regional Hub. In the absence of these two conditions, then the Retail Hub is classified as a Local Hub.
Seasonal Housing: The Seasonal Housing percentage is determined by the dividing the Data Dictionary Reference Name H0050006 “For seasonal, recreational, or occasional use” of the H5 Table “Vacancy Status, Universe: Vacant housing units Total:” of the 2010 Census Summary File 1 by the total number of Housing Units.
The U.S. Census Bureau’s 2010 Census Summary File 1. Summary File 1 tables provide the most detailed counts available so far from the 2010 Census, including cross-tabulations of age, sex, households, families, rela-tionship to householder, housing units, detailed race and Hispanic or Latino origin groups, and group quarters. The statistics are available for a variety of geographic areas, with most tables available down to the block or cen-sus tract level.
Summary File 1 (SF 1) contains the data compiled from the questions asked of all people and about every hous-ing unit. Population items include sex, age, race, Hispanic or Latino origin, household relationship, household type, household size, family type, family size, and group quarters. Housing items include occupancy status, va-cancy status, and tenure (whether a housing unit is owner-occupied or renter-occupied).
There are 177 population tables (identified with a ‘‘P’’) and 58 housing tables (identified with an ‘‘H’’) shown down to the block level; 82 population tables (identified with a ‘‘PCT’’) and 4 housing tables (identified with an “HCT”) shown down to the census tract level; and 10 population tables (identified with a “PCO”) shown down to the coun-ty level, for a total of 331 tables. The SF 1 Urban/Rural Update added 2 PCT tables, increasing the total number to 333 tables. There are 14 population tables and 4 housing tables shown down to the block level and 5 popula-tion tables shown down to the census tract level that are repeated by the major race and Hispanic or Latino groups.
SF 1 includes population and housing characteristics for the total population, population totals for an extensive list of race (American Indian and Alaska Native tribes, Asian, and Native Hawaiian and Other Pacific Islander) and Hispanic or Latino groups, and population and housing characteristics for a limited list of race and Hispanic or La-tino groups. Population and housing items may be cross-tabulated. Selected aggregates and medians also are provided. A complete listing of subjects in this file is found in the “Subject Locator” chapter of the 2010 Census Summary File 1 Technical Documentation
Summary File 1 (SF 1) is released as individual files for each of the 50 states, the District of Columbia, and Puerto Rico, and for the United States. The tables (matrices) are identical for all files, but the geographic coverage dif-fers. SF 1 for states was released from June–August 2011.
Sprawl The Sprawl Assessment is based the ratio of Core Place Housing Units to the total Growth & Investment Area Housing Units as reported by the 2010 Census minus the ratio of Core Place Housing Units to the total Growth & Investment Area Housing Units as reported by the 2000 Census.

Methodology page 95
2010 𝐶𝑜𝑁𝐸 𝑃𝐿𝑅𝐸𝐸 𝐻𝑜𝑁𝐶𝐶𝐶𝐻 𝑈𝐶𝐶𝐸𝐶2010 𝐺𝑁𝑜𝐺𝐸ℎ & 𝐼𝐶𝐼𝐸𝐶𝑁𝐸𝐶𝐸 𝐻𝑜𝑁𝐶𝐶𝐶𝐻 𝑈𝐶𝐶𝐸𝐶
−2000 𝐶𝑜𝑁𝐸 𝑃𝐿𝑅𝐸𝐸 𝐻𝑜𝑁𝐶𝐶𝐶𝐻 𝑈𝐶𝐶𝐸𝐶
2000 𝐺𝑁𝑜𝐺𝐸ℎ & 𝐼𝐶𝐼𝐸𝐶𝑁𝐸𝐶𝐸 𝐻𝑜𝑁𝐶𝐶𝐶𝐻 𝑈𝐶𝐶𝐸𝐶
Other methods of quantifying sprawl such as using satellite spectral data to indicate changes in impervious sur-face over time, maybe investigated for future study. However, were beyond the scope of this project.
Population
2000-2010: The P1 “TOTAL POPULATION” table of the 2000 and 2010 Census’s Summary File 1 provided the data to calcu-late the Growth & Investment Area and Core Place population change.
Average Age: PCT12 “SEX BY AGE” table of the 2000 and 2010 Census’s Summary File 1 provided the data to calculate the average age for the Growth & Investment Area and Core Place populations and the percentage change from 2000-2010.
Demographic Shifts: Demographic Shifts used the PCT12 “SEX BY AGE” table of the 2000 and 2010 Census’s Summary File 1 to de-termine the population of the six current generational cohorts (living at the time of the 2010 census) for both 2000 and 2010 and then calculating the percentage change in each generational cohorts population. Generational co-horts’ birth by year range can fluctuate depending on the source. Table 1 lists the generational cohort and the cor-responding range for the year of birth used for this study. (Novak n.d.)
Table 1 Generational Cohorts Born Between GI Generation (Greatest) 1901 1926 Silent Generation 1927 1945 Baby Boomers 1946 1964 Generation X 1965 1980 Millennial Generation 1981 2000 Generation Z 2001 Present
The study targeted the Silent Generation, Baby Boomers, Generation X, and the Millennial Generation for chang-es in cohort population. The Generation Z was not alive at the time of the 2000 census and the percentage change could not be calculated and the GI Generation population was less the 3% for the total 2010 Northwest Michigan population and was not included in the targeted cohorts.
Talent Jobshed
Data Source All Jobshed information utilized data from LEHD (Longitudinal Employer-Household Dynamics) Origin‐Destination Employment Statistics (LODES) from the US Census Bureau. Data files are state-based and organized into three types: Origin-Destination (OD), Residence Area Characteristics (RAC), and Workplace Area Characteristics (WAC), all at census block geographic detail. Data is available for most states for the years 2002–2011.
Workers Living within Study Area, Worker's Earnings, and Jobs Located in Area and their resultant density calcu-lations utilized data from the Michigan RAC and WAC databases. The Origin-Destination database file for Michi-gan was not available at the time the Commuting Data was analyzed, so the OnTheMap application was used to download data sets for each of the Census Places and County Subdivisions that comprise the Growth & Invest-ment Areas. The available data from OnTheMap locates the worker’s residence within a 2010 Census Block. The centroid, as established by the Census Tiger Files, was used to calculate the start location of the commute route distance and time. Without the individual employment locations within the Growth & Investment being contained in the OnTheMap datasets, the end location for the commute route distance and time was determined by using a point along a major commercial corridor of the Census Places and County Subdivisions that comprise the Growth

page 96 Methodology
& Investment Areas. The data was filtered to utilize only workers living in Michigan as workers living out of the state would have low propensity for daily commutes. The start and end locations for filtered worker commutes was then processed by a Visual Basic for Applications routine that used the Google Distance Matrix API to calcu-late route distance and time for 35,524 pairs.
The Google Distance Matrix API is a service that provides travel distance and time for a matrix of origins and des-tinations. The information returned is based on the recommended route between start and end points, as calcu-lated by the Google Maps API, and consists of rows containing duration and distance values for each pair.
LEHD Origin‐Destination Employment Statistics (LODES)1 are the job data that are delivered in the OnTheMap application. This document describes the contents of the LODES Version 7 dataset in the context of the OnThe-Map application.
U.S. Census Bureau. 2013. LODES Data. Longitudinal-Employer Household Dynamics Program. http://lehd.ces.census.gov/applications/help/onthemap.html
U.S. Census Bureau. 2013. OnTheMap Application. Longitudinal-Employer Household Dynamics Program. http://onthemap.ces.census.gov/
Overview As with previous versions of data released in OnTheMap, LODES Version 7 is a partially synthetic dataset that describes geographic patterns of jobs by their employment locations and residential locations as well as the connections between the two locations. These data and marginal summaries are tabulated by several categorical variables. More detailed information on the variables and scope of the data follows.
Job Definition In the context of LODES and OnTheMap, a job is counted if a worker is employed with positive earnings dur-ing the reference quarter as well as in the quarter prior to the reference quarter. This is called a “beginning of quarter” job because the assumption is that the worker was employed on the first day of the reference quar-ter.
Years LODES Version 7 includes data for 2002‐2011, for which Quarter 2 (April – June) is the reference period in each year. Not all states have data available for each year and not every variable is available in each year.
Geographical Vintage LODES Version 7 and OnTheMap use 2010 census blocks, defined for the 2010 Decennial Census, as their base geography. Data released in previous versions of LODES and OnTheMap used 2000 census blocks as the geographical base. For data previously released in 2000 census blocks, the LODES data has been “crosswalked” or “transformed” into the base of 2010 census blocks. Further information on how OnTheMap and LODES implement the 2010 census blocks can be found in OnTheMap: Updating the Base Geography
Data Structure The overall file structure of LODES Version 7 remains similar to that of previous versions. The origin‐destination (OD) matrix is made available by 10 different “labor market segments.” The area characteristic (AC) data – summary margins by residence block and workplace block – contain additional variables includ-ing age, earnings, and industry plus the newer variables outlined below.
In OnTheMap, the OD data are used to produce the Destination, Distance/Direction, Inflow/Outflow, and Paired Area analyses. The AC data are used to produce the Area Profile and Area Comparison analyses.

Methodology page 97
Population & Housing Trends
Data Source Population and Housing Data: The 2000 and 2010 Census Summary File 1 data tables provide the most de-tailed information available so far from the 2000 Census and 2010 Census about a community's entire population, including cross-tabulations of age, sex, households, families, relationship to householder, housing units, detailed race and Hispanic or Latino origin groups, and group quarters. For Census Designated Places (CDPs) that were first established in 2010, the 2010 Census Block Relationship files were utilized to process the 2000 Census Summary File 1 block data to calculate the 2000 data for these CDPs.
The 2010 Census Block Relationship files are provided as a tool to help data users compare the universe of Cen-sus 2000 blocks to the universe of 2010 Census blocks. From these files, data users may determine how 2000 blocks now relate to 2010 Census blocks and vice versa.
Geographic Areas: 2010 Census TIGER (Topologically Integrated Geographic Encoding and Referencing) File Data for County Subdivisions and Census Places.
Core Place and G&I Area Geographic Extents The Core Place and G&I Area geographic extents were determined to provide the maximum continuity across dif-fering datasets from governmental and private sources. In cases where CDPs were utilized, data years of predat-ing the establishment of the CDP were unavailable causing gaps in total counts and percentage changes.
Gross Neighborhood Density Gross neighborhood Density is the total dwelling/housing unit count over the total land area being considered. Parcel or site density will in most cases be greater than gross neighborhood density because it does not include land uses such as streets, parks, and other public land uses that dilute gross neighborhood density. While parcel or site density is important for zoning, gross neighborhood density is important for determining public services, transportation infrastructure, transit, and economic activity potential.
Total Households The Percentage of Households without Children (under 18) was calculated by adding “Nonfamily households:” Table P0180007 together with “2-or-more-person household: Family households: Husband-wife family: No own children under 18 years” Table P0190009 from the 2010 Census Summary File 1 and then dividing by the total number of households.
Commercial Corridors
Corridor Length Corridor Lengths were determined by plotting the described commercial corridor from the Commercial Corridor Inventory Interviews with local units of government into the Google Earth desktop application, exporting the KML files for import to ArcMAP and projecting them to calculate the linear extent of the defined corridor in feet.
Population & Housing Density To calculate Population and Housing density, the TIGER/Line® with Selected Demographic and Economic Data Shapefiles for the 2010 Census were used for Census Block level data. A ¼ mile circumference buffer was creat-ed from the KML defined Commercial Corridor delineation. The buffer was then used to pull population and hous-ing data for any Census Block either fully or partially contained within the buffer.
Job & Worker Density To calculate Job and Worker density, All Job and Worker information utilized data from LEHD (Longitudinal Em-ployer-Household Dynamics) Origin‐Destination Employment Statistics (LODES) from the US Census Bureau. The 2011 (latest year available) Residence Area Characteristics (RAC) and Workplace Area Characteristics (WAC) data files were used at the Census Block level. A ¼ mile circumference buffer was created from the KML defined Commercial Corridor delineation. The buffer was then used to pull job and worker data for any Census Block either fully or partially contained within the buffer.

page 98 Methodology
Growth & Investment Core Place Map with Commercial Corridors The map of commercial corridors were defined by entering public road center points (latitude and longitude coor-dinates) along the extent provided by the Commercial Corridor Inventory Interviews into Google Earth with the Add Path tool. A sufficient number of points were used to maintain road radius conformity. The full 10 county commercial corridors studies contained 1,722 individual latitude and longitude coordinates. The Google Earth paths were then exported into a KML file for import into ArcMap. The corridors where combined with data from the 2010 TIGER/Line® Shapefiles of Census Places and Counties and road geographic features data from the Michi-gan Department of Technology, Management, & Budget’s Geographic Data Library Catalog.
Housing Data Housing data, other than counts provided by the 2010 Census, is sourced from the US Census Bureau’s Ameri-can Community Survey (ACS) 2008-2012 5 Year Detailed Tables.
The American Community Survey (ACS) is a part of the U.S. Census Bureau's Decennial Census Program and is designed to provide more current demographic, social, economic, and housing estimates throughout the decade. The ACS provides information on more than 40 topics, including education, language ability, the foreign-born, marital status, migration and many more. Each year the survey randomly samples around 3.5 million addresses and produces statistics that cover 1-year, 3-year, and 5-year periods for geographic areas in the United States and Puerto Rico. The 5-year estimates are available for many distinct geographies including the nation, all 50 states, DC, Puerto Rico, counties, places, census tracts, and block groups. ACS tables are published on the Cen-sus Bureau’s American FactFinder (AFF) website, factfinder2.census.gov, and are available for download in sev-eral forms. (US Census Bureau 2014)
Since the Detailed Tables contain a large number of cells, the tables are stored in a series of files with only the data from the tables, without such information as the title of the tables, the description of the rows, and the names of the geographic areas. That information is in other files that the user must merge with the data files to reproduce the tables. This study created a data search tool to pull detailed table data from the assembly of the Michigan ASCII data files for each sequence number files containing the subject data (Sequences: 58, 62, 63, 64, 104, 105, 106, 107, 108).
The ACS estimates are based on data from a sample of housing units and people in the population, not the full population. For this reason, ACS estimates have a degree of uncertainty associated with them, called sampling error. This study does not list the sampling error for each data point due to the statistical complexity of combining margins of error in Growth & Investment Areas containing multiple municipalities.
Housing Efficiency Rating (Average HERS) The Home Energy Rating System (HERS) Index is the industry standard by which a home's energy efficiency is measured. It’s also the nationally recognized system for inspecting and calculating a home's energy performance. It was developed by the Residential Energy Services Network (RESNET) an independent, non-profit organization to help homeowners reduce the cost of their utility bills by making their homes more energy efficient. To calculate a home’s HERS Index Score, a certified RESNET HERS Rater does an energy rating on your home and com-pares the data against a 'reference home'– a designed-model home of the same size and shape as the actual home, so your score is always relative to the size, shape and type of house you live in.
To calculate the Average HERS score for homes in the specified geography the Total Built by Year was used to-gether with an average HERS rating for the respective vintage of home construction to calculate an overall Aver-age HERS score. (Hodgson 2008)
𝐴𝐼𝐸𝑁𝑅𝐻𝐸 𝐻𝐸𝑅𝑈 =∑ 𝑁𝑁𝑁𝑁𝐸𝑁 𝑜𝑜 𝑉𝐶𝐶𝐸𝑅𝐻𝐸 𝐻𝑜𝑁𝐸𝐶 × 𝐴𝐼𝐸𝑁𝑅𝐻𝐸 𝐻𝐸𝑅𝑈 𝑅𝑅𝐸𝐶𝐶𝐻 𝑁𝑏 𝑉𝐶𝐶𝐸𝑅𝐻𝐸9𝑖=1
𝑇𝑜𝐸𝑅𝐿 𝐻𝑜𝑁𝐸𝐶
Percentage Built by Year & Average Year Sequence file 104 of the ACS 2008-2012 5 Year Detailed Table was used to provide total counts of housing units by vintage year. The housing counts were then combined in cases of multiple municipalities or used separately to calculate the Percentage Built by Year.

Methodology page 99
Median Value Sequence file 106 of the ACS 2008-2012 5 Year Detailed Table was used to provide median value for each of the municipalities comprising the Growth & Investment Area. If the Core Place or G&I Area consists of a single munic-ipality, then a Median Value is given for these geographies.
Home Heating Fuel Sequence file 104 of the ACS 2008-2012 5 Year Detailed Table was used to provide total counts of housing units by fuel used in heating. The counts were then combined in cases of multiple municipalities or used separately to calculate the Percentage of Homes Using Natural Gas, Percentage of Homes Using Propane, Percentage of Homes Using Wood, and Percentage of Homes Using Solar Energy.
Personal Income Personal Income data is sourced from the US Census Bureau’s American Community Survey (ACS) 2008-2012 5 Year Detailed Tables.
Median Household Income (2012 Dollars) Sequence file 63 of the ACS 2008-2012 5 Year Detailed Table was used to provide Median Household Income value for each of the municipalities comprising the Growth & Investment Area. If the Core Place or G&I Area con-sists of a single municipality, then a Median Value is given for these geographies.
Per Capital Annual Income (2012 Dollars) Sequence file 64 of the ACS 2008-2012 5 Year Detailed Table was used to provide Per Capita Annual Income and Aggregate Annual Income values for each of the municipalities comprising the Growth & Investment Area. Total Calculate the Core Place and G&I Area Per Capita Annual Incomes the Aggregate Annual Income was di-vided by the Per Capita Annual Income to derive the population number used in the Per Capita calculation. The Aggregate Annual Income for each unit of government was then summed together and divided by the sum of the Per Capita populations to provide the Per Capita Annual Income.
𝑃𝐸𝑁 𝐶𝑅𝐸𝐶𝐸𝑅 𝐼𝐶𝐸𝑜𝑁𝐸 =∑ 𝐴𝐻𝐻𝑁𝐸𝐻𝑅𝐸𝐸 𝐴𝐶𝐶𝑁𝑅𝐿 𝐼𝐶𝐸𝑜𝑁𝐸𝑖𝑛𝑖=1
∑ 𝐴𝐻𝐻𝑁𝐸𝐻𝑅𝐸𝐸 𝐴𝐶𝐶𝑁𝑅𝐿 𝐼𝐶𝐸𝑜𝑁𝐸𝑖𝑃𝐸𝑁 𝐶𝑅𝐸𝐶𝐸𝑅 𝐴𝐶𝐶𝑁𝑅𝐿 𝐼𝐶𝐸𝑜𝑁𝐸 𝑖
𝑛𝑖=1
𝐶 = 𝐸ℎ𝐸 𝐸𝑅𝐸𝑅 𝑜𝑜𝑁 𝐸𝑅𝐸ℎ 𝑁𝐶𝐶𝐸 𝑜𝑜 𝐻𝑜𝐼𝐸𝑁𝐶𝑁𝐸𝐶𝐸 𝐸𝑜𝐶𝐸𝑅𝐶𝐶𝐸𝐸 𝐶𝐶 𝐸ℎ𝐸 𝐻𝐸𝑜𝐻𝑁𝑅𝐸ℎ𝐶𝐸 𝐸𝐸𝐸𝐸𝐶𝐸
𝐶 = 𝐸𝑜 𝐸ℎ𝐸 𝐸𝑜𝐸𝑅𝐿 𝐶𝑁𝑁𝑁𝐸𝑁 𝑜𝑜 𝑁𝐶𝐶𝐸𝐶 𝑜𝑜 𝐻𝑜𝐼𝐸𝑁𝐶𝑁𝐸𝐶𝐸 𝐶𝐶 𝐸ℎ𝐸 𝐻𝐸𝑜𝐻𝑁𝑅𝐸ℎ𝐶𝐸 𝐸𝐸𝐸𝐸𝐶𝐸
Household Income Distribution Chart Sequence file 58 of the ACS 2008-2012 5 Year Detailed Table was used to provide number of households falling in each of the distribution segments for each of the municipalities comprising the Growth & Investment Area. If the Core Place or G&I Area consists of a single municipality, then the municipal household distribution is used to de-termine the percentage falling in each income segment. If there are multiple municipalities, then the household in-come segment counts are summed for all municipalities then divided by the sum of all the households to deter-mine the percentage distribution.
Policy All policy data was provided during the Commercial Corridor Inventory Interviews with representatives of local units of government or a search of documentation contained on the respective municipal website.
Zoning Zoning data was sourced from the respective municipality’s Zoning Ordinances and Maps. Commercial Corridor extents were used to pull which Districts were bisected or bordered by the corridor. The respective District stand-ards were then used to determine maximum dwelling densities, permitted uses and review criteria, and district standards for heights, parking requirements, maximum lot coverages, and setbacks. In cases where explicit dwell-ing densities were not contained in the zoning ordinance, a theoretical maximum was calculated taking into ac-

page 100 Methodology
count lot coverages, parking requirement, minimum unit counts and standard assumptions for building envelope ratios (specific formulas for each included district are available upon request). These maximums are theoretical and are not based on specific site constraints. As such they should not be relied upon for site planning or determinations of value. Contact the applicable Zoning Administrator for inquiries about any specific de-terminations. For a list of contacts please see the municipality’s website or the Networks Northwest County Guides to Permitting and Zoning.
(http://www.nwm.org/planning/resources/publications/permitting-and-zoning-guides.html)
Infrastructure
Municipal Water Service All Municipal Water Service data was provided during the Commercial Corridor Inventory Interviews with repre-sentatives of local units of government or a search of documentation contained on the respective municipal web-site.
Municipal Sewer Service All Municipal Sewer Service data was provided during the Commercial Corridor Inventory Interviews with repre-sentatives of local units of government or a search of documentation contained on the respective municipal web-site.
Broadband All data on Broadband available was sourced from Connect Michigan’s technology service maps. Connect Michi-gan is a subsidiary of Connected Nation and operates as a non-profit in the state of Michigan. Connect Michigan partnered with the Michigan Public Service Commission to engage in a comprehensive broadband planning and technology initiative as part of National effort to map and expand broadband. The program began by gathering provider data to form a statewide broadband map and performing statewide business and residential technology assessments, but has since progressed to working with communities on community plans. (Connect Michigan 2014) Ultra fiber service over 1 Gbps (Gigabits per Second) was sourced from the National Broadband Map (http://www.broadbandmap.gov/technology) as updated on 12/31/2013. (National Telecommunications & Information Administration 2013)
Energy All Energy Infrastructure data was provided during the Commercial Corridor Inventory Interviews with representa-tives of local units of government or a search of documentation contained on the respective municipal website.
Placemaking Elements
Select Placemaking Elements All data for the Parks and Pocket Parks and Pedestrian Connections was sourced from data provided during the Commercial Corridor Inventory Interviews with representatives of local units of government. The Theaters & En-tertainment Venues and Grocery Store data was sourced by a search of business listings from several sources including Google, Yellow Pages, and Fandango.com.
Job Population Ratio The rationale for including the ration of Jobs to Population Ratio in Commercial Corridors is based on research that finds that in mixed-use developments external vehicle trips decline substantially as the number of jobs and the resident population become more balanced. (Reid Ewing 2013) Ratios approaching 1 indicated balance jobs and population. The ration was calculated by dividing the job density by the population density. Ratios of less than 1 have higher resident populations than the number of jobs. Ratios greater than 1 have a higher number of jobs to the resident population.
To calculate Job density, Job information utilized data from LEHD (Longitudinal Employer-Household Dynamics) Origin‐Destination Employment Statistics (LODES) from the US Census Bureau. The 2011 (latest year available) Workplace Area Characteristics (WAC) data files were used at the Census Block level. A ¼ mile circumference
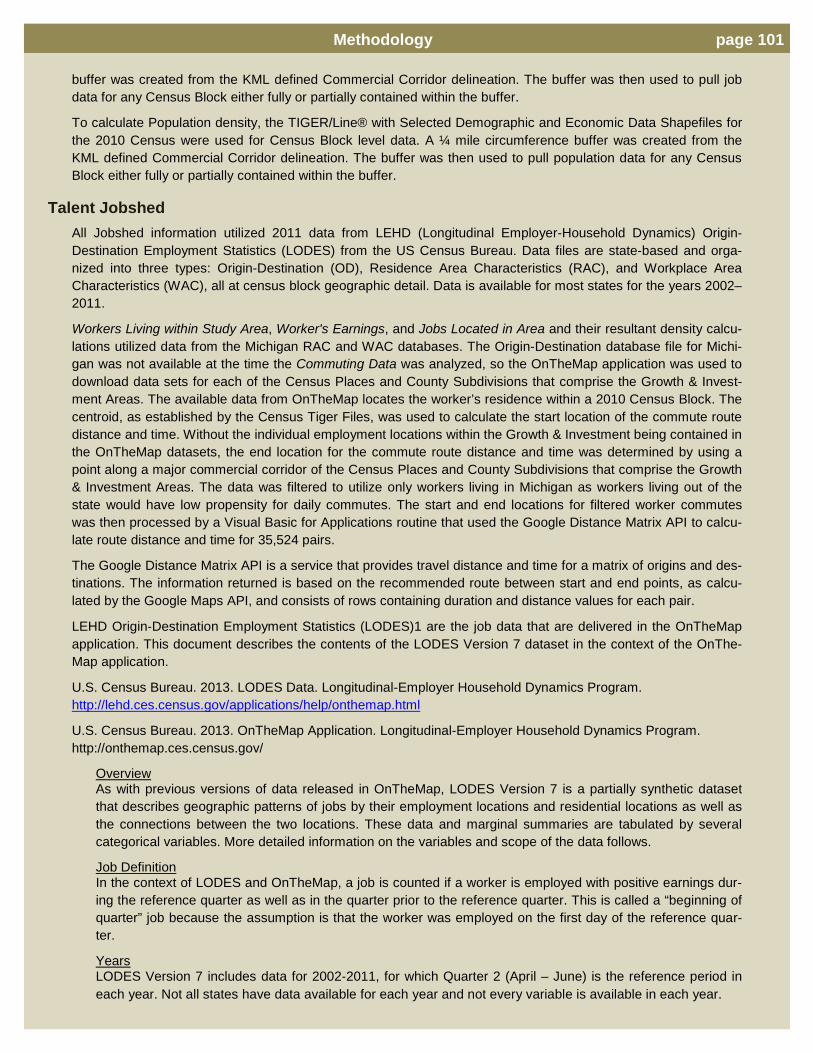
Methodology page 101
buffer was created from the KML defined Commercial Corridor delineation. The buffer was then used to pull job data for any Census Block either fully or partially contained within the buffer.
To calculate Population density, the TIGER/Line® with Selected Demographic and Economic Data Shapefiles for the 2010 Census were used for Census Block level data. A ¼ mile circumference buffer was created from the KML defined Commercial Corridor delineation. The buffer was then used to pull population data for any Census Block either fully or partially contained within the buffer.
Talent Jobshed All Jobshed information utilized 2011 data from LEHD (Longitudinal Employer-Household Dynamics) Origin‐Destination Employment Statistics (LODES) from the US Census Bureau. Data files are state-based and orga-nized into three types: Origin-Destination (OD), Residence Area Characteristics (RAC), and Workplace Area Characteristics (WAC), all at census block geographic detail. Data is available for most states for the years 2002–2011.
Workers Living within Study Area, Worker's Earnings, and Jobs Located in Area and their resultant density calcu-lations utilized data from the Michigan RAC and WAC databases. The Origin-Destination database file for Michi-gan was not available at the time the Commuting Data was analyzed, so the OnTheMap application was used to download data sets for each of the Census Places and County Subdivisions that comprise the Growth & Invest-ment Areas. The available data from OnTheMap locates the worker’s residence within a 2010 Census Block. The centroid, as established by the Census Tiger Files, was used to calculate the start location of the commute route distance and time. Without the individual employment locations within the Growth & Investment being contained in the OnTheMap datasets, the end location for the commute route distance and time was determined by using a point along a major commercial corridor of the Census Places and County Subdivisions that comprise the Growth & Investment Areas. The data was filtered to utilize only workers living in Michigan as workers living out of the state would have low propensity for daily commutes. The start and end locations for filtered worker commutes was then processed by a Visual Basic for Applications routine that used the Google Distance Matrix API to calcu-late route distance and time for 35,524 pairs.
The Google Distance Matrix API is a service that provides travel distance and time for a matrix of origins and des-tinations. The information returned is based on the recommended route between start and end points, as calcu-lated by the Google Maps API, and consists of rows containing duration and distance values for each pair.
LEHD Origin‐Destination Employment Statistics (LODES)1 are the job data that are delivered in the OnTheMap application. This document describes the contents of the LODES Version 7 dataset in the context of the OnThe-Map application.
U.S. Census Bureau. 2013. LODES Data. Longitudinal-Employer Household Dynamics Program. http://lehd.ces.census.gov/applications/help/onthemap.html
U.S. Census Bureau. 2013. OnTheMap Application. Longitudinal-Employer Household Dynamics Program. http://onthemap.ces.census.gov/
Overview As with previous versions of data released in OnTheMap, LODES Version 7 is a partially synthetic dataset that describes geographic patterns of jobs by their employment locations and residential locations as well as the connections between the two locations. These data and marginal summaries are tabulated by several categorical variables. More detailed information on the variables and scope of the data follows.
Job Definition In the context of LODES and OnTheMap, a job is counted if a worker is employed with positive earnings dur-ing the reference quarter as well as in the quarter prior to the reference quarter. This is called a “beginning of quarter” job because the assumption is that the worker was employed on the first day of the reference quar-ter.
Years LODES Version 7 includes data for 2002‐2011, for which Quarter 2 (April – June) is the reference period in each year. Not all states have data available for each year and not every variable is available in each year.

page 102 Methodology
Geographical Vintage LODES Version 7 and OnTheMap use 2010 census blocks, defined for the 2010 Decennial Census, as their base geography. Data released in previous versions of LODES and OnTheMap used 2000 census blocks as the geographical base. For data previously released in 2000 census blocks, the LODES data has been “crosswalked” or “transformed” into the base of 2010 census blocks. Further information on how OnTheMap and LODES implement the 2010 census blocks can be found in OnTheMap: Updating the Base Geography
Data Structure The overall file structure of LODES Version 7 remains similar to that of previous versions. The origin‐destination (OD) matrix is made available by 10 different “labor market segments.” The area characteristic (AC) data – summary margins by residence block and workplace block – contain additional variables includ-ing age, earnings, and industry plus the newer variables outlined below.
In OnTheMap, the OD data are used to produce the Destination, Distance/Direction, Inflow/Outflow, and Paired Area analyses. The AC data are used to produce the Area Profile and Area Comparison analyses.
Commuting Workers Commuting Workers is the subset of Jobs Located in Area that is defined by those jobs were the commute route is from 2 to 175 miles. This LODES data does not sample for weekly commutes. As a result, this study chose to filter job commuting data based on these assumptions for plausible commute distances.
Total Daily One Way Commute for all Commuters The Total Daily One Way Commute for all Commuters (TDOWC) is computed by taking all commuters as filtered by the 2 to 175 mile assumption and calculating the total daily one-way route distance in miles and time in minutes.
Total Annual Commute for all Commuters The Total Annual Commute for all Commuters Distance (TACD) is computed by taking all commuters as filtered by the 2 to 175 mile assumption and multiplying the total daily one-way route distance in miles by two for the daily commute distance then by 5.25 for the weekly distance then by 50 for the annual distance. The Total Annual Commute for all Commuters Time (TACT) is computed by taking all commuters as filtered by the 2 to 175 mile assumption and multiplying the total daily one-way route time in minutes by two for the daily commute time, then by 5.25 for the weekly time, then by 50 for the annual time, then dividing by 60 to arrive at the total annual time in hours.
𝑇𝐴𝐶𝑇 = 𝑇𝑇𝑇𝑇𝐶𝑇 × 𝑅𝑜𝑁𝐶𝐸 𝑇𝑁𝐶𝐸 𝐶𝑜𝑁𝑁𝑁𝐸𝐸 (2) × 𝑇𝑅𝑏𝐶 𝐶𝐶 𝑇𝑜𝑁𝑀 𝑇𝐸𝐸𝑀 (5.25) × 𝑇𝑜𝑁𝑀 𝑇𝐸𝐸𝑀𝐶 𝐶𝐶 𝑌𝐸𝑅𝑁 (50)
𝑇𝐴𝐶𝑇 = 𝑇𝑇𝑇𝑇𝐶𝑇 × 𝑅𝑜𝑁𝐶𝐸 𝑇𝑁𝐶𝐸 𝐶𝑜𝑁𝑁𝑁𝐸𝐸 (2) × 𝑇𝑅𝑏𝐶 𝐶𝐶 𝑇𝑜𝑁𝑀 𝑇𝐸𝐸𝑀 (5.25) × 𝑇𝑜𝑁𝑀 𝑇𝐸𝐸𝑀𝐶 𝐶𝐶 𝑌𝐸𝑅𝑁 (50) ÷ 60
Annual Commuting Costs The Total Fuel Cost is computed by taking the Total Annual Commute for all Commuters Distance and multiplying it by the cost of fuel per gallon ($3.15) and dividing by the fleet average from the 2003 CAFÉ Standards (20.7 Miles Per Gallon).
𝑇𝑜𝐸𝑅𝐿 𝐴𝐶𝐶𝑁𝑅𝐿 𝐹𝑁𝐸𝐿 𝐶𝑜𝐶𝐸 = 𝑇𝑇𝑇𝑇𝐶𝑇 × 𝐹𝑁𝐸𝐿 𝑃𝑁𝐶𝐸𝐸 ($3.15) ÷ 𝐹𝐿𝐸𝐸𝐸𝐴𝐼𝐸𝑁𝑅𝐻𝐸 𝑀𝑃𝐻(20.7)
The Total Cost (IRS 2014 Standard Mileage Rate) is computed by taking the Total Annual Commute for all Com-muters Distance and multiplying it by the cost per mile from the 2014 Internal Revenue Service Standard Mileage Rate ($.56).
𝑇𝑜𝐸𝑅𝐿 𝐶𝑜𝑁𝑁𝑁𝐸𝐶𝐶𝐻 𝐶𝑜𝐶𝐸 𝑇𝑜𝐸𝑅𝐿 𝐶𝑜𝐶𝐸 (𝐼𝑅𝑈) = 𝑇𝑇𝑇𝑇𝐶𝑇 × 2014 𝐼𝑅𝑈 𝑈𝐸𝑅𝐶𝐸𝑅𝑁𝐸 𝑀𝐶𝐿𝐸𝑅𝐻𝐸 𝑅𝑅𝐸𝐸($. 56)
Average Annual Per Worker Commute The Average Annual Per Worker Commute Distance is computed by dividing the Total Annual Commute for all Commuters by the number of Commuting Workers.
𝐴𝐼𝐸𝑁𝑅𝐻𝐸 𝐴𝐶𝐶𝑁𝑅𝐿 𝑃𝐸𝑁 𝑇𝑜𝑁𝑀𝐸𝑁 𝐶𝑜𝑁𝑁𝑁𝐸𝐸 𝑇𝐶𝐶𝐸𝑅𝐶𝐸𝐸 = 𝑇𝐴𝐶𝑇 ÷ 𝐶𝑜𝑁𝑁𝑁𝐸𝐶𝐶𝐻 𝑇𝑜𝑁𝑀𝐸𝑁𝐶

Methodology page 103
The Average Annual Per Worker Commute Time is computed by dividing the Total Annual Commute for all Com-muters by the number of Commuting Workers.
𝐴𝐼𝐸𝑁𝑅𝐻𝐸 𝐴𝐶𝐶𝑁𝑅𝐿 𝑃𝐸𝑁 𝑇𝑜𝑁𝑀𝐸𝑁 𝐶𝑜𝑁𝑁𝑁𝐸𝐸 𝑇𝐶𝐶𝐸𝑅𝐶𝐸𝐸 = 𝑇𝐴𝐶𝑇 ÷ 𝐶𝑜𝑁𝑁𝑁𝐸𝐶𝐶𝐻 𝑇𝑜𝑁𝑀𝐸𝑁𝐶
The Average Annual Per Worker Commute Total Cost is computed by dividing the Annual Commuting Cost Total Cost (IRS 2014 Standard Mileage Rate) by the number of Commuting Workers.
𝐴𝐼𝐸𝑁𝑅𝐻𝐸 𝐴𝐶𝐶𝑁𝑅𝐿 𝑃𝐸𝑁 𝑇𝑜𝑁𝑀𝐸𝑁 𝐶𝑜𝑁𝑁𝑁𝐸𝐸 𝑇𝐶𝐶𝐸𝑅𝐶𝐸𝐸 = 𝑇𝐴𝐶𝑇 ÷ 𝐶𝑜𝑁𝑁𝑁𝐸𝐶𝐶𝐻 𝑇𝑜𝑁𝑀𝐸𝑁𝐶
Retail Activity Retail data was sourced from Environmental Systems Research Institute, Inc. (Esri) by the purchase of a Com-plete State Retail MarketPlace Data License for the State of Michigan by all levels of geography.
Total Retail Sales Whitepaper Statement from Esri: Esri has combined the latest Consumer Expenditure Surveys (CEX), 2006–2007, from the Bureau of Labor Statistics (BLS) to estimate current spending patterns. The continuing surveys in-clude a Diary Survey for daily purchases and an Interview Survey for general purchases. The Diary Survey repre-sents record keeping by consumer units for two consecutive weeklong periods. This component of the CEX col-lects data on small, daily purchases that could be overlooked by the quarterly Interview Survey. The Interview Survey collects expenditure data from consumers in five interviews conducted every three months. Esri integrates data from both surveys to provide a comprehensive database on all consumer expenditures. To compensate for the relatively small CEX survey bases and the variability of single-year data, expenditures are averaged from the 2006–2007 surveys.
Products and services, such as apparel items, types of digital cameras, video game systems, financial accounts and services, health-related items, Internet activities, satellite TV providers, personal care services, and detailed information about cell phones/PDAs (brands, service providers, average monthly bills, and purchase locations), are included. A product description was revised since the last Market Potential update if a product change was made by GfK MRI, if ranges had to be collapsed, or if more clarification was required. A product was dropped since the last Market Potential update if it did not pass a sample size test, became outdated or unnecessary, or no longer exists in the GfK MRI database.
Total Potential Retail Sales Esri computes Market Potential by combining 2011 Tapestry™ Segmentation data with Doublebase® 2009 data from GfK MRI. Doublebase 2009 is an integration of information from four consumer surveys. Each survey re-spondent can be identified by Tapestry segment, so a rate of consumption by Tapestry segment can be deter-mined for a product or service for any area.
The Expected Number of Consumers (households or adults) for a product or service in an area is computed by applying the consumption rate for Tapestry market segment "n" to households or adults in the area belonging to Tapestry segment "n," and summing across 65 Tapestry segments.
𝐸𝐸𝐸𝐸𝐸𝐸𝐸𝐸 𝑁𝑁𝑁𝑁𝐸𝑁 𝑜𝑜 𝐶𝑜𝐶𝐶𝑁𝑁𝐸𝑁𝐶 = �(𝐶𝑜𝑁𝐶𝐸𝑛 × 𝐶𝑜𝐶𝐶𝑁𝑁𝐸𝐸𝐶𝑜𝐶 𝑅𝑅𝐸𝐸𝑛)65
𝑛=1
The Local Consumption Rate for a product or service for an area is computed as the ratio of the expected number of consumers for a product or service in the area to the total households or adults in the area.
𝐿𝑜𝐸𝑅𝐿 𝐶𝑜𝐶𝐶𝑁𝑁𝐸𝐸𝐶𝑜𝐶 𝑅𝑅𝐸𝐸 =𝐸𝐸𝐸𝐸𝐸𝐸𝐸𝐸 𝑁𝑁𝑁𝑁𝐸𝑁 𝑜𝑜 𝐶𝑜𝐶𝐶𝑁𝑁𝐸𝑁𝐶
𝐵𝑅𝐶𝐸 𝐶𝑜𝑁𝐶𝐸
The Market Potential Index for a product or service for an area is the ratio of the local consumption rate for a product or service for the area to the US consumption rate for the product or service, multiplied by 100.
𝑀𝑅𝑁𝑀𝐸𝐸 𝑃𝑜𝐸𝐸𝐶𝐸𝐶𝑅𝐿 𝐼𝐶𝐸𝐸𝐸 =𝐿𝑜𝐸𝑅𝐿 𝐶𝑜𝐶𝐶𝑁𝑁𝐸𝐸𝐶𝑜𝐶 𝑅𝑅𝐸𝐸
𝑈𝑈 𝐶𝑜𝐶𝐶𝑁𝑁𝐸𝐸𝐶𝑜𝐶 𝑅𝑅𝐸𝐸× 100

page 104 Methodology
Esri's Market Potential database includes data for more than 2,200 items, organized into 35 categories, represent-ing goods, services, attitudes, and activities collected from GfK MRI surveys. Unless otherwise noted, each item refers to consumer spending or behavior in a 12-month period. The a or h following the five-digit product code de-notes a consumer base of adults or households, respectively.
Leakage Leakage is defined as the Potential Sales less the Total Sales. All inputs are as reported by Esri.
Classification: For the purposes of determining the Classification, Sales, Potential Sales, and Leakage are used for the Growth & Investment Area and County to determine whether it is a Retail Hub and if its classified as a Local Hub or Re-gional Hub for the purpose of this study. A Retail Hub is defined in this study as having a negative retail leakage. If the Retail Sales for the Growth & Investment Area are greater than Potential Sales in the county in which it is located and the county’s leakage is negative, then the Retail Hub is classified as a Regional Hub. In the absence of these two conditions, then the Retail Hub is classified as a Local Hub.
Sales by Retail Store Type Ersi in the Retail MarketPlace Dataset contains 44 different types of retail store data. The sample of retail activity by store type included in this section represents approximately two-thirds of potential retail sales depending on the geographic area. This sample of store types is indicative of a diverse set of shopping type that would support a walkable mixed use environment.
Commercial Corridor Datasheets
Corridor Length Corridor Lengths were determined by plotting the described commercial corridor from the Commercial Corridor Inventory Interviews with local units of government into the Google Earth desktop application, exporting the KML files for import to ArcMAP and projecting them to calculate the linear extent of the defined corridor in feet.
Street Classification National Functional Classification (NFC) is a planning tool which federal, state and local transportation agencies have used since the late 1960's. The Federal Highway Administration (FHWA) developed this system of classify-ing all streets, roads and highways according to their function. The FHWA publication, Highway Functional Classification: Concepts, Criteria and Procedures, provides the basis for much of the following information.
Principal Arterials are at the top of the NFC hierarchial system. Principal arterials generally carry long dis-tance, through-travel movements. They also provide access to important traffic generators, such as major air-ports or regional shopping centers. Examples: Interstate and other freeways; other state routes between large cities; important surface streets in large cities.
Minor Arterials are similar in function to principal arterials, except they carry trips of shorter distance and to lesser traffic generators. Examples: State routes between smaller cities; surface streets of medium im-portance in large cities; important surface streets in smaller cities.
Collectors tend to provide more access to property than do arterials. Collectors also funnel traffic from resi-dential or rural areas to arterials. Examples: County, farm-to-market roads; various connecting streets in large and small cities.
Local roads primarily provide access to property. Examples: Residential streets; lightly-traveled county roads.

Methodology page 105
The following MDOT classifications for this study’s Commercial Corridor Inventory are source rom the MDOT’s National Functional Classification Maps. The classifications are as follows:
Principal Arterial - Other Minor Arterial Major Collector Minor Collector Local
If a Corridor has multiple classifications along one of its segments, then the highest classification is used. Corri-dors with multiple segments may contain multiple classifications.
2013 Traffic Volume (AADT) Traffic count data was sourced from the Michigan Department of Transportation’s (MDOT) Traffic Monitoring In-formation System (TMIS) for state trunklines or from local municipalities if available. All counts utilize the Annual Average Daily Traffic (AADT) counts, which in most cases are an annual average estimate of daily traffic based on an adjustment of a sample conducted for a short period of time (short count). For short-count sites, counts are estimated by factoring a short count using seasonal and day-of-week adjustment factors. For continuous sites, counts are calculated by summing the Annual Average Days of the Week and dividing by seven.
For the purpose of this report, if the identified commercial corridor has more than one AADT count, the largest count was utilized.
Number of Traffic Lanes Traffic Lane counts were sourced from Google Earth aerial imagery. On corridors with sections of varying amounts of traffic lanes, the count from the section with highest number of lanes was utilized.
Parking The presence of Parallel, Diagonal, or Parking Structures in commercial corridors was sourced from Google Earth aerial imagery.
Transit Service Transit Service was determined from data contained on the respective Transit Agency websites.
Bike Lane The presence of Bike Lakes available in commercial corridors was sourced from Google Earth aerial and street view imagery. Accuracy may vary based on the level of quality of the imagery.
Entertainment Venues The Theaters & Entertainment Venues data was sourced by a search of business listings from several sources including Google, Yellow Pages, and Fandango.com.
Pedestrian Amenities Pedestrian Amenities consist of Sidewalks, Crosswalks, and Mid-Block Crosswalks. The presence of these Pe-destrian Amenities in commercial corridors was sourced from Google Earth aerial imagery.
Walk Score Walk Score® measures the walkability of any address using a patented methodology that analyzes walking routes to nearby amenities and awards points based on the distance to amenities in each category with end results rang-ing between 0-100, 100 being a “Walker’s Paradise”. (Walk Score 2014)
Corridor Overview The Corridor Overview was source from Master Plans, Zoning Ordinances, Regional Transportation Plans, and other public source documents. Content has been edited.

page 106 Methodology
Corridor Segment and Surrounding 1/4 Mile Study Area Map The map of commercial corridors were defined by entering public road center points (latitude and longitude coor-dinates) along the extent provided by the Commercial Corridor Inventory Interviews into Google Earth with the Add Path tool. A sufficient number of points were used to maintain road radius conformity. The full 10 county commercial corridors studies contained 1,722 individual latitude and longitude coordinates. The Google Earth paths were then exported into a KML file for import into ArcMap. The corridors where combined with data from the 2010 TIGER/Line® Shapefiles of Census Places and Counties and road geographic features data from the Michi-gan Department of Technology, Management, & Budget’s Geographic Data Library Catalog. A ¼ mile circumfer-ence buffer was created from the KML defined Commercial Corridor delineation. The buffer was then used to que-ry data from various databases used in this study.
Additionally 317 Points of Interest in the 10 county Northwest Michigan region consisting of public use airports, colleges, cultural sites, grocery stores, hospitals, libraries, schools, and theaters & entertainment venues were lo-cated for inclusion into the corridor maps.
Economic Development All corridor specific Economic Development policy data was provided during the Commercial Corridor Inventory Interviews with representatives of local units of government or a search of documentation contained on the re-spective municipal website.
Additional information on specific community policies can be found in the Michigan Economic Development Cor-porations Redevelopment Ready Communities’ Best Practices guide.
http://www.michiganbusiness.org/cm/Files/Redevelopment_Ready_Communities/RRC-Best-Practices.pdf
Study Area Summary for 1/4 Mile Area Surrounding the Corridor
Population & Housing Data To calculate Population and Housing density, the TIGER/Line® with Selected Demographic and Economic Data Shapefiles for the 2010 Census were used for Census Block level data. A ¼ mile circumference buffer was creat-ed from the KML defined Commercial Corridor delineation. The buffer was then used to pull population and hous-ing data for any Census Block either fully or partially contained within the buffer for determining data for the Corri-dor Segment geography. To determine calculations for the G&I Core Places and G&I Areas, the 2010 Census TIGER (Topologically Integrated Geographic Encoding and Referencing) File Data for County Subdivisions, Cen-sus Places, and Census Blocks was imputed into to ArcMap software and used to create a database of Census Blocks contained in the respective geographic extents. The Census Block database was then queried for the ap-plicable population and housing data.
Study Area Size Data A ¼ mile circumference buffer was created from the KML defined Commercial Corridor delineation in ArcMap then used to calculate the land area contained within. To determine calculations for the G&I Core Places and G&I Areas, the 2010 Census TIGER (Topologically Integrated Geographic Encoding and Referencing) File Data for County Subdivisions, Census Places used to query the land area information.
Worker & Job Data To calculate Workers Living within Study Area and Jobs Located within Study Area, data from the US Census Bu-reau’s LEHD (Longitudinal Employer-Household Dynamics) Origin‐Destination Employment Statistics (LODES) was utilized. The 2011 (latest year available) Workplace Area Characteristics (WAC) and Residence Area Char-acteristics (RAC) data files were used at the Census Block level. A ¼ mile circumference buffer was created from the KML defined Commercial Corridor delineation. The buffer was then used to pull job data for any Census Block either fully or partially contained within the buffer for determining data for the Corridor Segment geography. To de-termine calculations for the G&I Core Places and G&I Areas, the 2010 Census TIGER (Topologically Integrated Geographic Encoding and Referencing) File Data for County Subdivisions, Census Places, and Census Blocks

Methodology page 107
was imputed into to ArcMap software and used to create a database of Census Blocks contained in the respective geographic extents. The Census Block database was then queried for the applicable Worker and Job data.
Zoning Zoning data was sourced from the respective municipality’s Zoning Ordinances and Maps. Commercial Corridor extents were used to pull which Districts were bisected or bordered by the corridor. The respective District stand-ards were then used to determine maximum dwelling densities, permitted uses and review criteria, and district standards for heights, parking requirements, maximum lot coverages, and setbacks. In cases where explicit dwell-ing densities were not contained in the zoning ordinance, a theoretical maximum was calculated taking into ac-count lot coverages, parking requirements, minimum unit counts and standard assumptions for building envelope ratios (specific formulas for each included district are available upon request). These maximums are theoretical and are not based on specific site constraints. As such they should not be relied upon for site planning or determinations of value. Contact the applicable Zoning Administrator for inquiries about any specific de-terminations. For a list of contacts please see the municipality’s website or the Networks Northwest County Guides to Permitting and Zoning.
(http://www.networksnorthwest.org/planning/planning-policy/land-use/growth-and-investment.html)
Infrastructure
Public Utilities All Municipal Water and Sewer Service data was provided during the Commercial Corridor Inventory Interviews with representatives of local units of government or a search of documentation contained on the respective mu-nicipal website.
Energy All Energy Infrastructure data was provided during the Commercial Corridor Inventory Interviews with representa-tives of local units of government or a search of documentation contained on the respective municipal website.
Broadband All data on Broadband available was sourced from both the Commercial Corridor Inventory Interviews with repre-sentatives of local units of government and Connect Michigan’s technology service maps. Connect Michigan is a subsidiary of Connected Nation and operates as a non-profit in the state of Michigan. Connect Michigan part-nered with the Michigan Public Service Commission to engage in a comprehensive broadband planning and technology initiative as part of National effort to map and expand broadband. The program began by gathering provider data to form a statewide broadband map and performing statewide business and residential technology assessments, but has since progressed to working with communities on community plans. (Connect Michigan 2014)
Policy All corridor specific policy data was provided during the Commercial Corridor Inventory Interviews with represent-atives of local units of government or a search of documentation contained on the respective municipal website.
Traffic Counts Traffic count data was sourced from the Michigan Department of Transportation’s (MDOT) Traffic Monitoring In-formation System (TMIS) for state trunklines or from local municipalities if available. All counts utilize the Annual Average Daily Traffic (AADT) counts, which in most cases are an annual average estimate of daily traffic based on an adjustment of a sample conducted for a short period of time (short count). For short-count sites, counts are estimated by factoring a short count using seasonal and day-of-week adjustment factors. For continuous sites, counts are calculated by summing the Annual Average Days of the Week and dividing by seven.
The Traffic Count Chart contains AADT counts for the described corridor segment. For the purpose of this chart, if the identified commercial corridor segment has more than one AADT count, the largest count was utilized.

page 108 Methodology
Placemaking Elements All data for the Placemaking Elements was sourced from information provided during the Commercial Corridor In-ventory Interviews with representatives of local units of government. The Theaters & Entertainment Venues, Gro-cery Store, and Restaurant data was sourced by a search of business listings from several sources including Google, Yellow Pages, and Fandango.com.

References page 109
References American Society of Planning Officials. "Minimum Requirements For Lot And Building Size." 1952.
Broadband Communities. What Fiber Broadband Can Do For Your Community. 9th. 2013.
Colin Buchanan and Partners. The economic impact of high density development and tall buildings in central business districts. London: British Property Federation, 2008.
Connect Michigan. Connect Michigan - Increasing Broadband Access and Use. 2014. http://www.connectmi.org/about (accessed 2014).
Design Center for American Urban Landscape. Measuring Density: Working Definitions for Residential Density and Building Intensity. University of Minnesota, 2003.
Eichholtz, Kok, Quigley. The Economics of Green Building. The Royal Institution of Chartered Surveyors, the European Center for Corporate, 2010.
EPA. 2013. EnergyStar.gov (accessed 2013).
Frank, Lawrence, and Gary Pivo. "Impacts of Mixed Use and Density on Utilization of Three Modes of Travel: Single-Occupant Vehicle, Transit, and Walking." Transportation Research Record. 1994.
Gibbs, Robert J. Principals of Urban Retail Planning and Development. Hoboken, New Jersey: John Wiley & Sons, Inc., 2012.
Hamilton, James D. "Oil Prices and the Economic Downturn." Joint Economic Committee of the United States Congress. 2009.
Henry, Jennifer, and David Goldstein. "Reducing Foreclosures and Environmental Impacts through Location-Efficient Neighborhood Design." Natural Resources Defense Council, 2010.
Hodgson, Mike. "Docket: 08—HERS-02 Comments." California Home Energy Rating System Phase II HERS rulemaking. 2008.
Jonathan Rose Companies. "Location Efficiency and Housing Type, Boiling it Down to BTUs." 2011.
LeRoy, Greg, Allison Lack, Karla Walter, and Philip Mattera. "The Geography of Incentives: Economic Development and Land Use in Michigan." Washington D.C., 2006.
Melo, Patricia C., Daniel J. Graham, David Levinson, and Sarah Aarabi. "Agglomeration, Accessibility, and Productivity: Evidence for Urbanized Areas in the US." Transportation Research Board 92nd Annual Meeting (2013). Washington DC: The National Academies, 2013.
Merrill Lynch. "The 2006 Merrill Lynch New Retirement Study: A Perspective From Individuals and Employers." 2006.
Michigan Department of Environmental Quality. "Whitepaper on the Statewide Code for On-site Wastewater Treatment." 2004.
National Association of Realtors. "National Community Preference Survey." 2013.
National Telecommunications & Information Administration. National Broadband Map. 2013. http://www.broadbandmap.gov/speed (accessed 7 29, 2014).
Northwest Michigan Council of Governments. "Environmental Stewardship and Economic Opportunity in Northest Lower Michigan's Coastal Cities and Villages: Implementation Strategy." 2012.
Northwest Michigan Council of Governments. Master Plan Review. Traverse City: NWMCOG, 2013.

page 110 References
Novak, Dr. Jill E. (Texas A&M University). "The Six Living Generations In America." n.d.
Paciorek, Andrew D. Supply Constraints and Housing Market Dynamics. Finance and Economics Discussion Series, Washington D.C.: Federal Reserve Board, Divisions of Research & Statistics and Monetary Affairs, 2012.
Paciorek, Andrew D. "Supply Constraints and Housing Market Dynamics." Divisions of Research & Statistics and Monetary Affairs, Federal Reserve Board, Washington D.C., 2012.
Pivo, Gary, and Jeffrey D. Fisher. "The Walkability Premium In Commercial Real Estate Investments." Real Estate Economics (Real Estate Economics), 2011.
Porter, Michael E. Clusters and Economic Policy: Aligning Public Policy with the New Economics of Competition. Boston: Harvard Business School, 2007 revised 2009.
Reid Ewing, Keith Bartholomew. Pedestrian- & Transit-Oriented Design. Washington DC: Urban Land Institute and the American Planning Association, 2013.
Rempel, Marc Gascho. "Deconstructing Density: Assessing The Per Capita Influence On Vegetation And Impervious Surface Area In Corvallis, Oregon,." 2005.
Saiz, Albert. "The Geographic Determinants of Housing Supply." The Warton School, University of Pennsylvania, 2010.
Sill, Keith. "The Macroeconomics of Oil Shocks." The Federal Reserve Bank of Philadelphia Business Review (The Philadelphia Federal Reserve), 2007.
Sommerfield, Dr. Cathlyn. Grand Vision 2012 Community Research. Traverse City: Rearch Services - Northwestern Michigan College, 2013.
Urban Land Institute, PricewaterhouseCoopers LLP. "Emerging Trends in Real Estate 2014." Washington DC, 2013.
US Census Bureau. The 2008-2012 ACS 5-Year Summary File Technical Documentation. 2014.
Walk Score. Walk Score. 7 21, 2014. http://www.walkscore.com/methodology.shtml.
William Fulton, Rolf Pendall, Mai Nguyen, and Alicia Harrison. Who Sprawls Most? How Growth Patterns Differ Across the U.S. Washington DC: The Brookings Institute, 2001.

Release Notes page 111
Release Notes
1. If any information is in error or incomplete or if a community not currently participating would like to re-quest a commercial corridor interview, please contact Scott Gest, Regional Planner at Networks North-west.
phone: 231-929-5091 email: [email protected]
mail: PO Box 506, Traverse City, MI 49685-0506

2014