Grand Teton National Park Visitor Studypsu.sesrc.wsu.edu/vsp/reports/206_GRTE_rept.pdf · Grand...
148
Social Science Program National Park Service U.S. Department of the Interior Visitor Services Project Grand Teton National Park Visitor Study Summer 2008 Park Studies Unit Visitor Services Project Report 206
-
Upload
truonghanh -
Category
Documents
-
view
218 -
download
0
Transcript of Grand Teton National Park Visitor Studypsu.sesrc.wsu.edu/vsp/reports/206_GRTE_rept.pdf · Grand...
Social Science Program National Park Service U.S. Department of the Interior Visitor Services Project
Grand Teton National Park Visitor Study
Summer 2008
Park Studies Unit
Visitor Services Project Report 206

Social Science Program National Park Service U.S. Department of the Interior Visitor Services Project
Grand Teton National Park Visitor Study
Summer 2008
Park Studies Unit Visitor Services Project
Report 206
April 2010
Ann Braak Steven J. Hollenhorst
Nancy C. Holmes Eleonora Papadogiannaki
Gail Vander Stoep
Ann Braak, Nancy Holmes, and Eleonora Papadogiannaki are Research Assistants with the Visitor Services Project. Dr. Steven Hollenhorst is the Director of the Park Studies Unit, Department of Conservation Social Sciences, University of Idaho. We thank Dr. Gail Vander Stoep, Associate Professor at Department of Community, Agriculture, Recreation and Resource Studies, Michigan State University, for overseeing the fieldwork, the staff and volunteers of Grand Teton National Park for assisting with the survey, and David Vollmer and Yanyin Xu for data processing.

Grand Teton National Park – VSP Visitor Study July 13-19, 2008
Visitor Services Project
Grand Teton National Park Report Summary
This report describes the results of a visitor study at Grand Teton National Park (NP) during July 13-19, 2008. A total of 1,044 questionnaires were distributed to visitor groups. Of those, 739 questionnaires were returned, resulting in a 71% response rate. The location of questionnaire distribution accurately reflects visitation statistics.
This report profiles a systematic random sample of Grand Teton NP visitors. Most results are presented in graphs and frequency tables. Summaries of visitor comments are included in the report and complete comments are included in the Visitor Comments Appendix.
Forty-four percent of visitor groups were in groups of two and 29% were in groups of three or four. Seventy-two percent of visitor groups were in family groups.
Thirty percent of visitors were ages 51-65 years, 19% were ages 15 years or younger and 11% were over 65 years. This is probably due to the aging and increasing affluence of the demographics of Grand Teton NP visitors. Seven percent of visitor groups included members with physical conditions that made it difficult to access or participate in park activities or services. The aging trend parallels the U.S. trend, and may be magnified by the age and income cohort of residents in the Jackson area, and the high cost to families with children.
United States visitors comprised 90% of total visitation during the survey period, with 12% from California, 7% from Utah, 7% from Wyoming, and smaller proportions from 45 other states and Washington, D.C. International visitors were from 21 countries and comprised 10% of total visitation, with 18% from Canada, 17% from the United Kingdom, 10% from the Netherlands, and 10% from Germany. Smaller proportions came from 17 other countries.
Sixty percent of visitors were visiting the park for the first time, while 21% had visited two or three times, and 16% had visited five or more times. Forty-one percent of visitor groups entered the park once during this visit and 44% entered two to four times. Eighty-six percent of visitor groups used one vehicle to arrive at the park.
Most visitor groups (89%) obtained information about the park prior to their visit. Prior to this visit, visitor groups most often obtained information about Grand Teton NP through previous visits (47%) and maps/brochures (41%). Use of the internet to obtain park information doubled to 36% since the Grand Teton NP VSP study conducted in 1997.
For 48% of visitor groups, visiting Yellowstone National Park was the most common reason for visiting the area. For 74% of visitor groups, Grand Teton NP was one of several destinations in their travel plans.
The most common sites visited by visitor groups were Jenny Lake (70%), followed by Colter Bay (48%). Reported visitation to the Craig Thomas Visitor Center may have been negatively affected by confusion with the name. The most common visitor activities were viewing scenery/scenic drive (77%) and hiking/walking (52%).
The information service/facility most commonly used by visitor groups was the park brochure/map (92%). Use of the park newspaper was surprisingly low at 38%. The most commonly used visitor service/facility was roads (90%). The concession service/facility most commonly used by visitor groups was the grocery/camp store/gift shop (66%).
All information, visitor, and concession services/facilities were rated above average in their importance and quality. The visitor information service most commonly used by visitor groups was the park brochure/map (92%). The information service receiving the highest importance rating was park brochure/map (85%). The service receiving the highest quality rating was assistance from park staff (96%).
Grand Teton National Park – VSP Visitor Study July 13-19, 2008
The visitor service/facility most commonly used by visitor groups was roads (90%). The visitor service/facility receiving the highest importance rating was trails (96%). The service/facility receiving the highest quality rating was trails (93%).
The concession service/facility most commonly used by visitor groups was grocery/camp store/gift shop (66%). The concession service/facility receiving the highest importance rating was camp in developed campground (96%). The concession service/facility receiving the highest quality rating was guided scenic float trip (93%).
The average group expenditure in the park and the surrounding area (within 100 miles) increased substantially from the 1997 study average of $575 to $1,388, with a median (50% spent more and 50% spent less) of $673. This is one of the higher average group expenditures in national park units studied by the VSP in recent years. The average total expenditure per person was $472. Sixty-six percent of visitor groups had two adults covered by expenditures, while 41% had no children covered by expenditures.
Most visitor groups (96%) rated the overall quality of visitor facilities, services, and recreational opportunities at Grand Teton National Park as ―very good‖ or ―good.‖ One percent of visitor groups rated the overall quality as ―very poor‖ or ―poor.‖
Comparison of 2008 and 1997 survey results
Demographics. Same proportion of first-time visitors; fewer children, slightly older visitors in 2008; group sizes and group types are similar; 96% of all visitors speak English in 2008 (not asked in 1997). 5% were residents of Teton County in 2008 compared to 2% in 1997.
International visitors. Slightly higher proportion in 2008 (10%) than in 1997 (8%).
Source of information. Use of internet more than doubled; about 40% used word-of-mouth (both studies).
Park as destination. 2008, 17% primary destination; 74% one of several destinations. Not asked in 1997.
Primary reason for visiting area. 2008: Yellowstone 48%; Grand Teton 28%. Not asked in 1997.
Arrival direction. Similar proportions: 50% Jackson/Moose-Wilson (2008); 53% Jackson (1997).
Average length of park visit. More groups spent more than one day: 56% (2008); 45% (1997).
Overnight stay. 81% stayed within 100 miles; average of 3.6 nights inside park, 4.6 nights outside. (Not asked in 1997 survey.)
Most common activity. Viewing scenery/scenic drive: Similar: 77% (2008); 98% (1997).
Most visited site. Jenny Lake: 70% (2008); 72% (1997).
Average expenditures. $1,388/visitor group (2008); $575/visitor group (1997).
Overall quality. Rated as ―very good‖ or ―good:‖ 96% (2008); 92% (1997).
For more information about the Visitor Services Project, please contact the Park Studies Unit at the University of Idaho at (208) 885-7863 or the following website http://www.psu.uidaho.edu.
Grand Teton National Park – VSP Visitor Study July 13-19, 2008
TABLE OF CONTENTS
INTRODUCTION ........................................................................................................................................... 1 Organization of the report .......................................................................................................................... 1 Presentation of the results......................................................................................................................... 2 METHODS .................................................................................................................................................... 3 Survey Design ............................................................................................................................................. 3
Sample size and sampling plan ........................................................................................................... 3 Questionnaire design .......................................................................................................................... 4 Survey procedure ................................................................................................................................ 4
Data Analysis .............................................................................................................................................. 4 Limitations ................................................................................................................................................... 5 Special Conditions ...................................................................................................................................... 5 Checking Non-response Bias .................................................................................................................... 6 RESULTS ...................................................................................................................................................... 7 Visitor and Group Characteristics ............................................................................................................ 7
Visitor group size ................................................................................................................................. 7 Visitor group type................................................................................................................................. 7 Visitors with organized groups ............................................................................................................ 8 United States visitors by state of residence ........................................................................................ 9 International visitors by country of residence .................................................................................... 10 Number of visits to the park ............................................................................................................... 11 Visitor age .......................................................................................................................................... 12 Language used for speaking and reading ......................................................................................... 13 Services preferred in languages other than English ......................................................................... 15 Visitors with physical conditions/impairments ................................................................................... 15 Respondents‘ level of education ....................................................................................................... 17
Trip/Visit Characteristics and Preferences ............................................................................................ 18 Information sources prior to visit ....................................................................................................... 18 Park as destination ............................................................................................................................ 20 Primary reason for visiting the area................................................................................................... 20 Places stayed on night before visit .................................................................................................... 21 Places stayed on night after visit ....................................................................................................... 26 Travel route to park ........................................................................................................................... 31 Sites visited and activities of visitors arriving from the north ............................................................. 32 Sites visited and activities of visitors arriving from the south ............................................................ 34 Length of stay for visitors arriving from the north and south ............................................................. 36 Forms of transportation used to arrive at park .................................................................................. 37 Number of vehicles ............................................................................................................................ 37 Number of park entries ...................................................................................................................... 38 Overnight stay and accommodations ................................................................................................ 39 Accommodations inside the park ...................................................................................................... 41 Length of stay in the park .................................................................................................................. 45 Sites visited ....................................................................................................................................... 46 Visitor activities .................................................................................................................................. 49 Visitor activities at Moose .................................................................................................................. 50 Time spent at Moose ......................................................................................................................... 51 Visitor activities at Colter Bay ............................................................................................................ 52 Time spent at Colter Bay ................................................................................................................... 53 Visitor activities at Jenny Lake .......................................................................................................... 54 Time spent at Jenny Lake ................................................................................................................. 55 Visitor activities at all other park locations ........................................................................................ 56 Time spent at other park locations .................................................................................................... 57 Visitor activities with commercial outfitter/guide ................................................................................ 58 Safety issues ..................................................................................................................................... 59
Grand Teton National Park – VSP Visitor Study July 13-19, 2008
TABLE OF CONTENTS (continued)
Ratings of Visitor Services, Facilities, Attributes and Resources ....................................................... 62
Information services and facilities used ............................................................................................ 62 Importance ratings of information services and facilities................................................................... 63 Quality ratings of information services and facilities ......................................................................... 69 Mean scores of importance and quality ratings for information services and facilities ..................... 75 Visitor services and facilities used ..................................................................................................... 76 Importance ratings of visitor services and facilities ........................................................................... 77 Quality ratings of visitor services and facilities .................................................................................. 81 Mean scores of importance and quality ratings for visitor services and facilities .............................. 85 Visitor comments on services/facilities .............................................................................................. 86 Services at Flagg Ranch ................................................................................................................... 89 Concession services and facilities used ............................................................................................ 91 Importance ratings of concession services and facilities .................................................................. 92 Quality ratings of concession services and facilities ......................................................................... 96 Mean scores of importance and quality ratings for concession services and facilities ................... 100 Visitor comments on concession services/facilities ......................................................................... 101 Importance of protecting park attributes/resources ......................................................................... 105
Expenditures ........................................................................................................................................... 107 Total expenditures inside and outside Grand Teton National Park ................................................. 107 Number of adults covered by expenditures ..................................................................................... 108 Number of children covered by expenditures .................................................................................. 108 Expenditures inside the park ........................................................................................................... 109 Expenditures outside the park ......................................................................................................... 113
Overall Quality ......................................................................................................................................... 119 Visitor Comments ................................................................................................................................... 120
Proposals for the future ................................................................................................................... 120 Additional comments ....................................................................................................................... 123
APPENDICES ........................................................................................................................................... 125 Appendix 1: The Questionnaire ............................................................................................................. 125 Appendix 2: Additional Analysis ........................................................................................................... 127
Colter Bay visitors............................................................................................................................ 127 Colter Bay and Moose visitors ......................................................................................................... 128 Travel patterns ................................................................................................................................. 129 Visitor centers used ......................................................................................................................... 130
Appendix 3: Decision Rules for Checking Non-response Bias ......................................................... 132 Appendix 4: Visitor Services Project Publications ............................................................................. 134 Visitor Comments Appendix .................................................................................................................. 139
Grand Teton National Park – VSP Visitor Study July 13-19, 2008
1
INTRODUCTION
This report describes the results of a visitor study at Grand Teton National Park, conducted July 13-19,
2008 by the National Park Service (NPS) Visitor Services Project (VSP), part of the Park Studies Unit (PSU) at
the University of Idaho.
―Located in northwestern Wyoming, Grand Teton National Park preserves a spectacular landscape
rich with majestic mountains, pristine lakes and extraordinary wildlife. The abrupt vertical rise of the jagged
Teton Range contrasts with the horizontal sage-covered valley and glacial lakes at their base, creating world-
renowned scenery that attracts nearly four million visitors per year‖ (Grand Teton National Park, National Park
Service, Department of the Interior website http://www.nps.gov/grte April, 2009).
Organization of the report
The report is organized into three sections.
Section 1: Methods. This section discusses the procedures, limitations, and special conditions that may affect
the results of the study.
Section 2: Results. This section provides summary information for each question in the questionnaire and
includes a summary of visitor comments. The presentation of the results of this study does not follow
the order of questions in the questionnaire.
Section 3: Appendices
Appendix 1: The Questionnaire. A copy of the questionnaire distributed to groups.
Appendix 2: Additional Analysis. A list of options for cross-references and cross comparisons. These
comparisons can be analyzed within park or between parks. Results of some additional
analyses are included in this report.
Appendix 3: Decision rules for checking non-response bias. An explanation of how the non-response bias
was determined.
Appendix 4: Visitor Services Project Publications. A complete list of publications by the PSU. Copies of
these reports can be obtained by contacting the PSU office at (208) 885-7863 or by visiting the
website: http://www.psu.uidaho.edu/vsp/reports.htm.
Visitor Comments Appendix: A separate appendix provides visitor responses to open-ended questions. It is
bound separately from this report due to its size.
Grand Teton National Park – VSP Visitor Study July 13-19, 2008
2
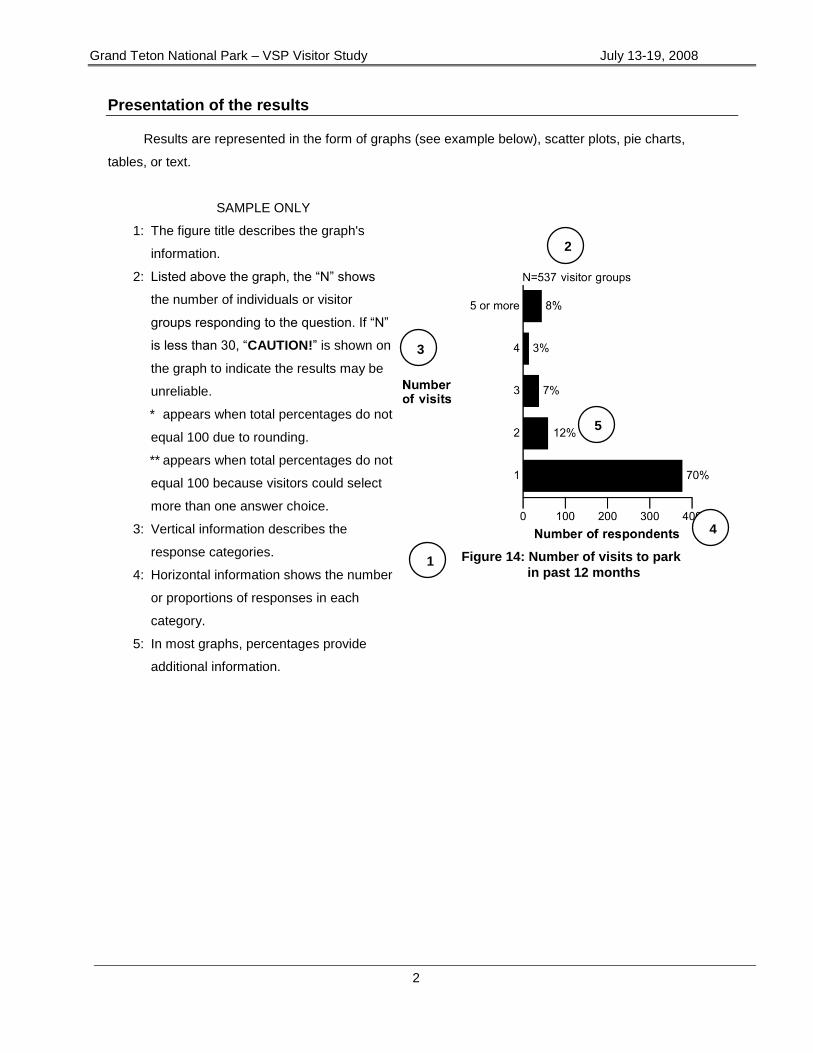
Presentation of the results
Results are represented in the form of graphs (see example below), scatter plots, pie charts,
tables, or text.
SAMPLE ONLY
1: The figure title describes the graph's
information.
2: Listed above the graph, the ―N‖ shows
the number of individuals or visitor
groups responding to the question. If ―N‖
is less than 30, ―CAUTION!‖ is shown on
the graph to indicate the results may be
unreliable.
* appears when total percentages do not
equal 100 due to rounding.
** appears when total percentages do not
equal 100 because visitors could select
more than one answer choice.
3: Vertical information describes the
response categories.
4: Horizontal information shows the number
or proportions of responses in each
category.
5: In most graphs, percentages provide
additional information.
1
3
2
5
4
Figure 14: Number of visits to park
in past 12 months
Grand Teton National Park – VSP Visitor Study July 13-19, 2008
3
METHODS
Survey Design
Sample size and sampling plan All VSP questionnaires follow design principles outlined in Don A. Dillman's book Mail and Internet
Surveys: The Tailored Design Method (2007). Using this methodology, the sample size was calculated based
on the park visitation statistics of previous years.
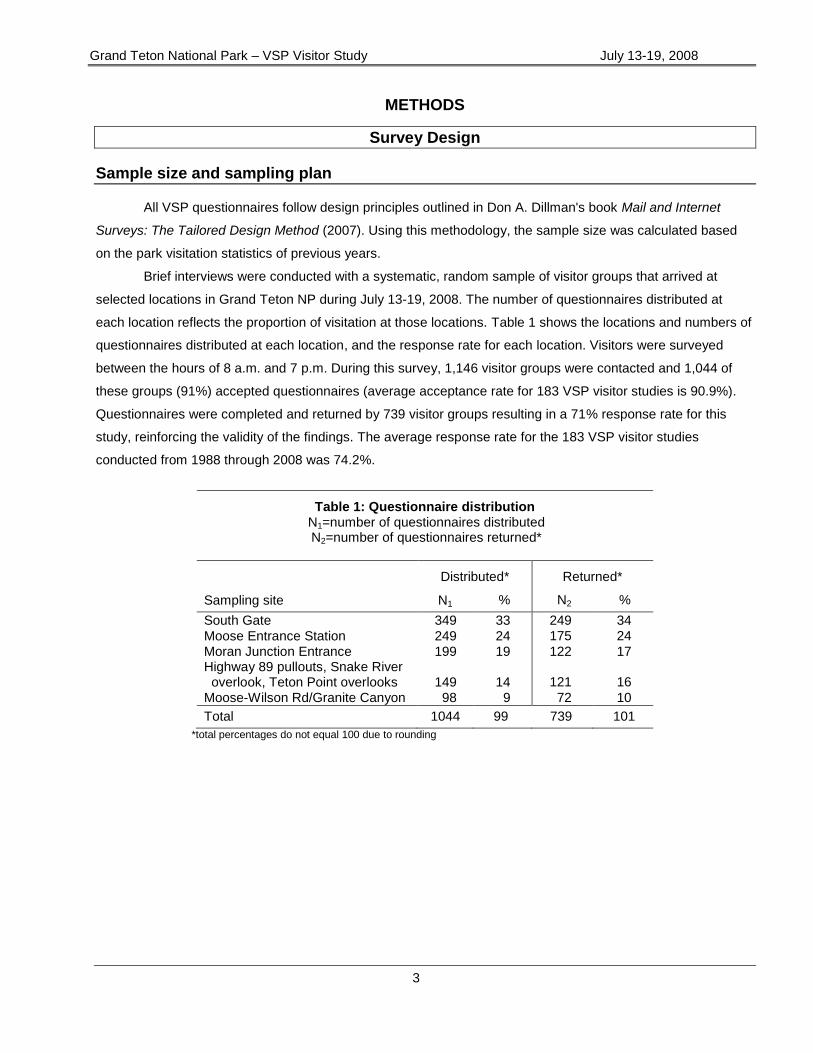
Brief interviews were conducted with a systematic, random sample of visitor groups that arrived at
selected locations in Grand Teton NP during July 13-19, 2008. The number of questionnaires distributed at
each location reflects the proportion of visitation at those locations. Table 1 shows the locations and numbers of
questionnaires distributed at each location, and the response rate for each location. Visitors were surveyed
between the hours of 8 a.m. and 7 p.m. During this survey, 1,146 visitor groups were contacted and 1,044 of
these groups (91%) accepted questionnaires (average acceptance rate for 183 VSP visitor studies is 90.9%).
Questionnaires were completed and returned by 739 visitor groups resulting in a 71% response rate for this
study, reinforcing the validity of the findings. The average response rate for the 183 VSP visitor studies
conducted from 1988 through 2008 was 74.2%.
Table 1: Questionnaire distribution N1=number of questionnaires distributed N2=number of questionnaires returned*
Distributed* Returned*
Sampling site N1 % N2 %
South Gate 349 33 249 34
Moose Entrance Station 249 24 175 24
Moran Junction Entrance 199 19 122 17 Highway 89 pullouts, Snake River overlook, Teton Point overlooks 149 14 121 16
Moose-Wilson Rd/Granite Canyon 98 9 72 10
Total 1044 99 739 101
*total percentages do not equal 100 due to rounding
Grand Teton National Park – VSP Visitor Study July 13-19, 2008
4
Questionnaire design
The Grand Teton National Park questionnaire was developed at a workshop held with park staff to
design and prioritize the questions. Some of the questions were comparable with VSP studies conducted at
other parks while others were customized for Grand Teton NP. Many questions asked visitors to choose
answers from a list of responses, with both closed and open-ended responses, while others were completely
open-ended.
No pilot study was conducted to test the Grand Teton NP questionnaire. However, all questions followed
Office of Management and Budget (OMB) guidelines and/or were used in previous surveys. Thus, the clarity
and consistency of the survey instrument have been tested and supported.
Survey procedure
Visitor groups were greeted, briefly introduced to the purpose of the study, and asked to participate. If
visitors agreed, they were asked which member (at least 16 years old) had the next birthday. The individual with
the next birthday was selected to complete the questionnaire for the group. An interview, lasting approximately
two minutes, was conducted with that person to determine group size, group type, and the age of the member
completing the questionnaire. These individuals were asked for their names, addresses, and telephone
numbers or email addresses in order to mail them a reminder/thank you postcard and follow-ups. Visitors were
asked to complete the survey after their visit, and return the questionnaire by mail. The questionnaires were
pre-addressed and affixed with a U.S. first class postage stamp.
Two weeks following the survey, a reminder/thank you postcard was mailed to all participants.
Replacement questionnaires were mailed to participants who had not returned their questionnaires four weeks
after the survey. Seven weeks after the survey, a second round of replacement questionnaires was mailed to
visitors who had not returned their questionnaires.
Data Analysis
Returned questionnaires were coded and the information was entered into a computer using custom
and standard statistical software applications—Statistical Analysis Software (SAS), and a custom designed
FileMaker Pro application. Descriptive statistics and cross-tabulations were calculated for the coded data and
responses to open-ended questions were categorized and summarized. The data were entered twice—by two
independent VSP data entry staff—and validated by a third staff member.
Grand Teton National Park – VSP Visitor Study July 13-19, 2008
5
Limitations
Like all surveys, this study has limitations that should be considered when interpreting the results.
1. This was a self-administered survey. Respondents completed the questionnaire after the visit,
which may have resulted in poor recall. Thus, it is not possible to know whether visitor responses
reflected actual behavior.
2. The data reflect visitor use patterns to the selected sites during the study period of July 13-19, 2008.
The results present a ‗snapshot-in-time‘ and do not necessarily apply to visitors during other times of
the year.
3. Caution is advised when interpreting any data with a sample size of less than 30, as the results
may be unreliable. Whenever the sample size is less than 30, the word "CAUTION!" is included in
the graph, figure, table, or text.
4. Occasionally, there may be inconsistencies in the results. Inconsistencies arise from missing data
or incorrect answers (due to misunderstood directions, carelessness, or poor recall of information).
Therefore, refer to both the percentage and N (number of individuals or visitor groups) when
interpreting the results.
Special Conditions The weather during the survey period was generally sunny and warm, with occasional breezy periods
and overcast skies.
Grand Teton National Park – VSP Visitor Study July 13-19, 2008
6
Checking Non-response Bias
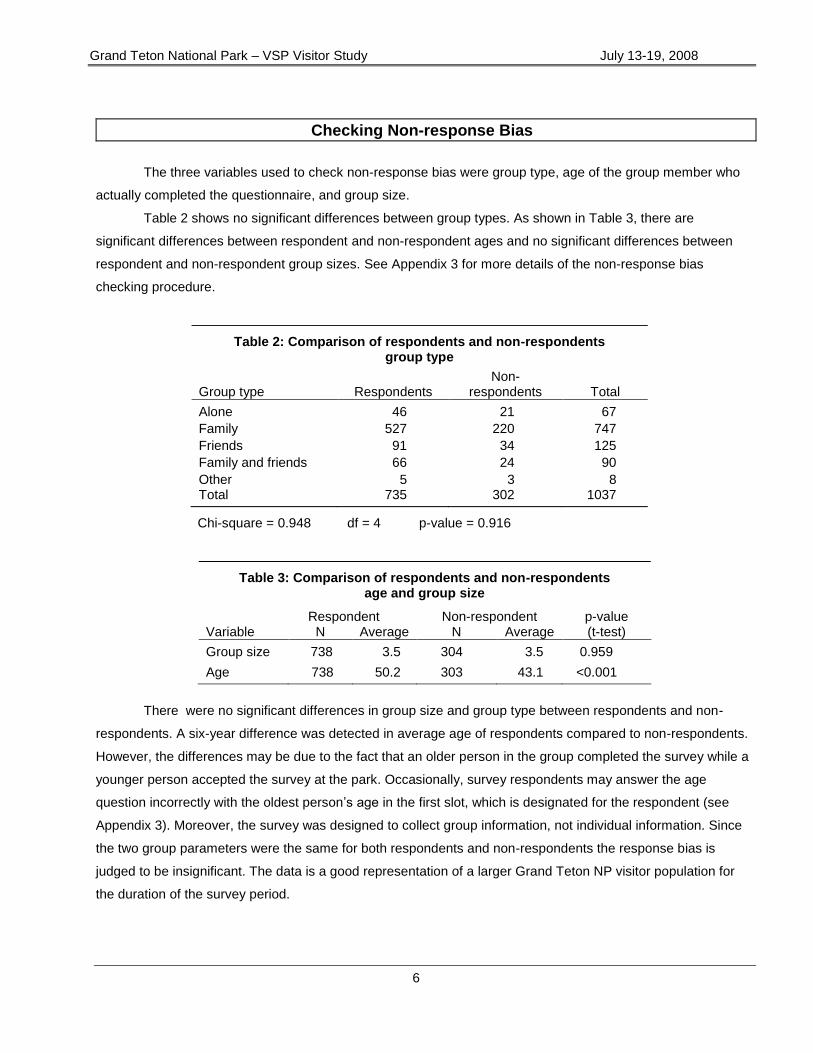
The three variables used to check non-response bias were group type, age of the group member who
actually completed the questionnaire, and group size.
Table 2 shows no significant differences between group types. As shown in Table 3, there are
significant differences between respondent and non-respondent ages and no significant differences between
respondent and non-respondent group sizes. See Appendix 3 for more details of the non-response bias
checking procedure.
Table 2: Comparison of respondents and non-respondents group type
Group type Respondents
Non-respondents Total
Alone 46 21 67
Family 527 220 747
Friends 91 34 125
Family and friends 66 24 90
Other 5 3 8 Total 735 302 1037
Chi-square = 0.948 df = 4 p-value = 0.916
Table 3: Comparison of respondents and non-respondents age and group size
Variable Respondent Non-respondent p-value
(t-test) N Average N Average
Group size 738 3.5 304 3.5 0.959
Age 738 50.2 303 43.1 <0.001
There were no significant differences in group size and group type between respondents and non-
respondents. A six-year difference was detected in average age of respondents compared to non-respondents.
However, the differences may be due to the fact that an older person in the group completed the survey while a
younger person accepted the survey at the park. Occasionally, survey respondents may answer the age
question incorrectly with the oldest person‘s age in the first slot, which is designated for the respondent (see
Appendix 3). Moreover, the survey was designed to collect group information, not individual information. Since
the two group parameters were the same for both respondents and non-respondents the response bias is
judged to be insignificant. The data is a good representation of a larger Grand Teton NP visitor population for
the duration of the survey period.
Grand Teton National Park – VSP Visitor Study July 13-19, 2008
7
RESULTS
Visitor and Group Characteristics
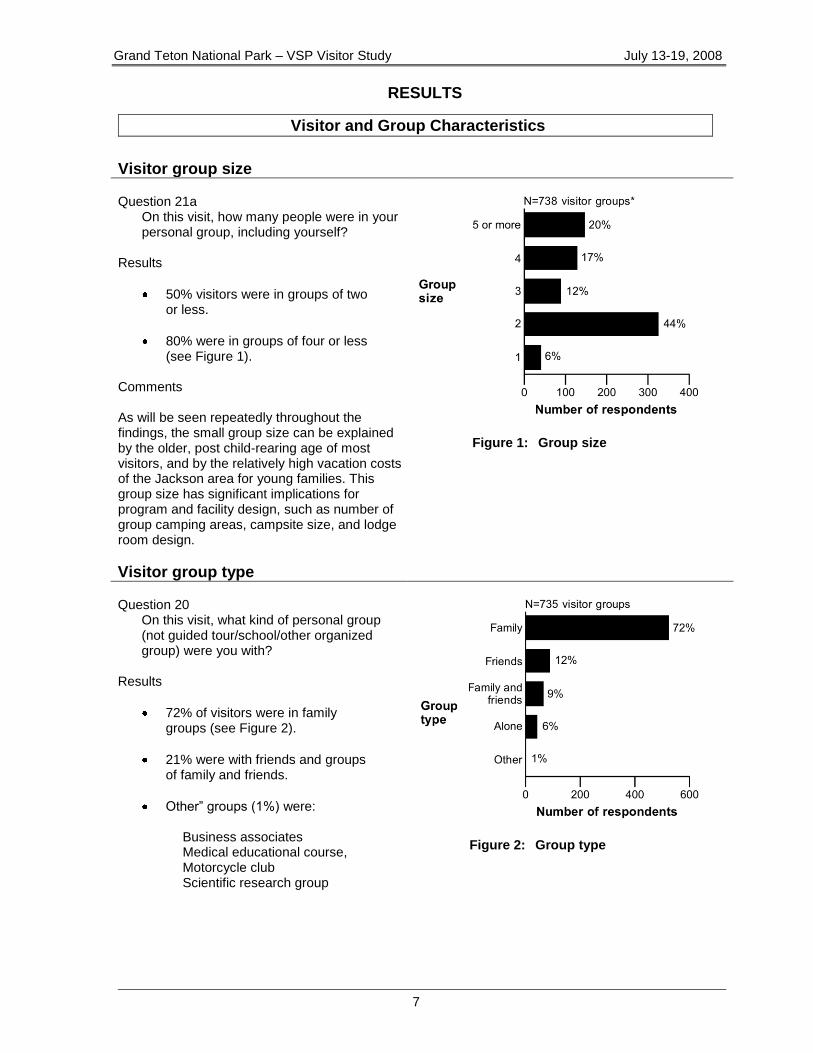
Visitor group size Question 21a
On this visit, how many people were in your personal group, including yourself?
Results
50% visitors were in groups of two or less.
80% were in groups of four or less (see Figure 1).
Comments As will be seen repeatedly throughout the findings, the small group size can be explained by the older, post child-rearing age of most visitors, and by the relatively high vacation costs of the Jackson area for young families. This group size has significant implications for program and facility design, such as number of group camping areas, campsite size, and lodge room design.
Figure 1: Group size
Visitor group type Question 20
On this visit, what kind of personal group (not guided tour/school/other organized group) were you with?
Results
72% of visitors were in family groups (see Figure 2).
21% were with friends and groups of family and friends.
Other‖ groups (1%) were:
Business associates Medical educational course, Motorcycle club Scientific research group
Figure 2: Group type
Grand Teton National Park – VSP Visitor Study July 13-19, 2008
8
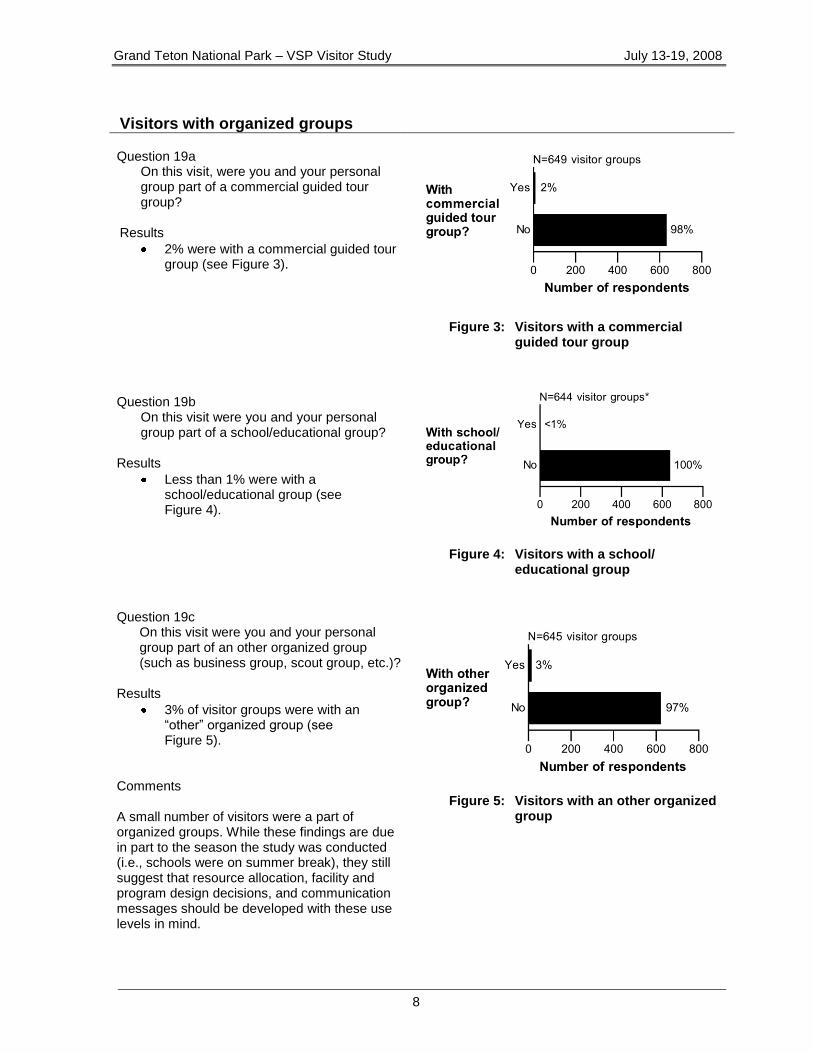
Visitors with organized groups Question 19a
On this visit, were you and your personal group part of a commercial guided tour group?
Results
2% were with a commercial guided tour group (see Figure 3).
Question 19b
On this visit were you and your personal group part of a school/educational group?
Results
Less than 1% were with a school/educational group (see Figure 4).
Question 19c
On this visit were you and your personal group part of an other organized group (such as business group, scout group, etc.)?
Results
3% of visitor groups were with an ―other‖ organized group (see Figure 5).
Comments A small number of visitors were a part of organized groups. While these findings are due in part to the season the study was conducted (i.e., schools were on summer break), they still suggest that resource allocation, facility and program design decisions, and communication messages should be developed with these use levels in mind.
Figure 3: Visitors with a commercial guided tour group
Figure 4: Visitors with a school/
educational group
Figure 5: Visitors with an other organized
group
Grand Teton National Park – VSP Visitor Study July 13-19, 2008
9
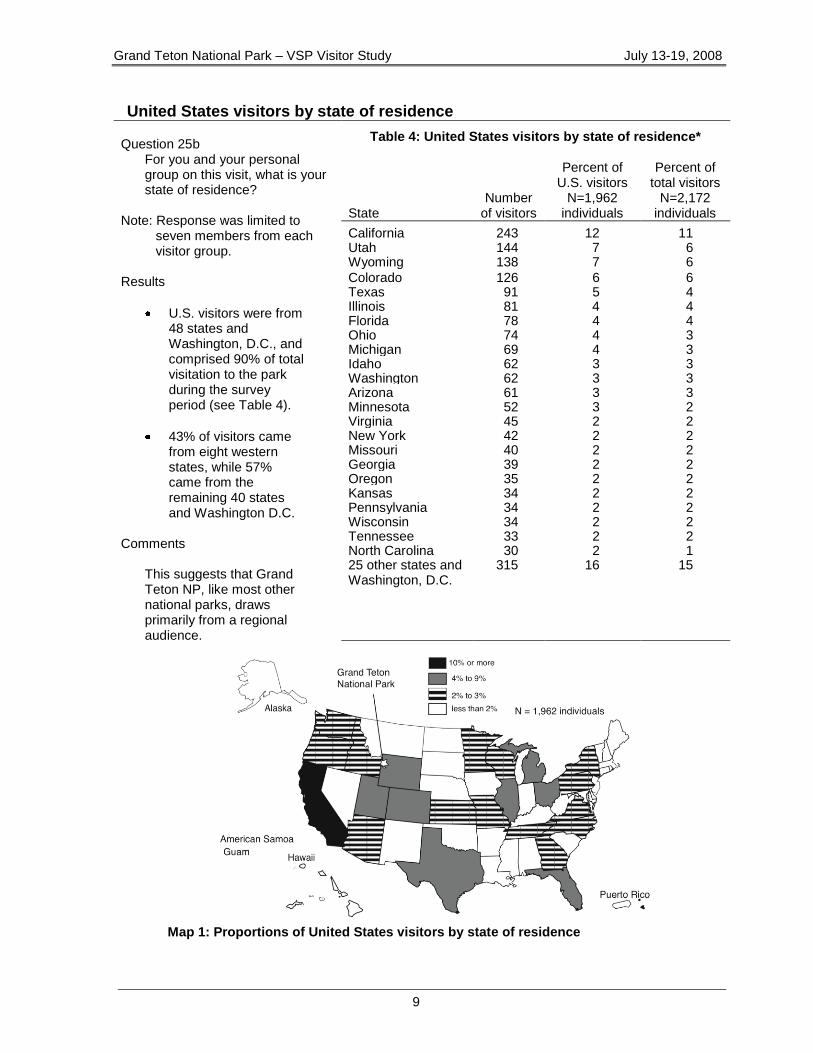
United States visitors by state of residence Question 25b
For you and your personal group on this visit, what is your state of residence?
Note: Response was limited to
seven members from each visitor group.
Results
U.S. visitors were from 48 states and Washington, D.C., and comprised 90% of total visitation to the park during the survey period (see Table 4).
43% of visitors came from eight western states, while 57% came from the remaining 40 states and Washington D.C.
Comments
This suggests that Grand Teton NP, like most other national parks, draws primarily from a regional audience.
Table 4: United States visitors by state of residence*
State Number
of visitors
Percent of U.S. visitors
N=1,962 individuals
Percent of total visitors
N=2,172 individuals
California 243 12 11 Utah 144 7 6 Wyoming 138 7 6
Colorado 126 6 6 Texas 91 5 4 Illinois 81 4 4 Florida 78 4 4 Ohio 74 4 3 Michigan 69 4 3 Idaho 62 3 3 Washington 62 3 3 Arizona 61 3 3 Minnesota 52 3 2 Virginia 45 2 2 New York 42 2 2 Missouri 40 2 2 Georgia 39 2 2 Oregon 35 2 2 Kansas 34 2 2 Pennsylvania 34 2 2 Wisconsin 34 2 2 Tennessee 33 2 2 North Carolina 30 2 1 25 other states and Washington, D.C.
315 16 15
Map 1: Proportions of United States visitors by state of residence
Grand Teton National Park – VSP Visitor Study July 13-19, 2008
10
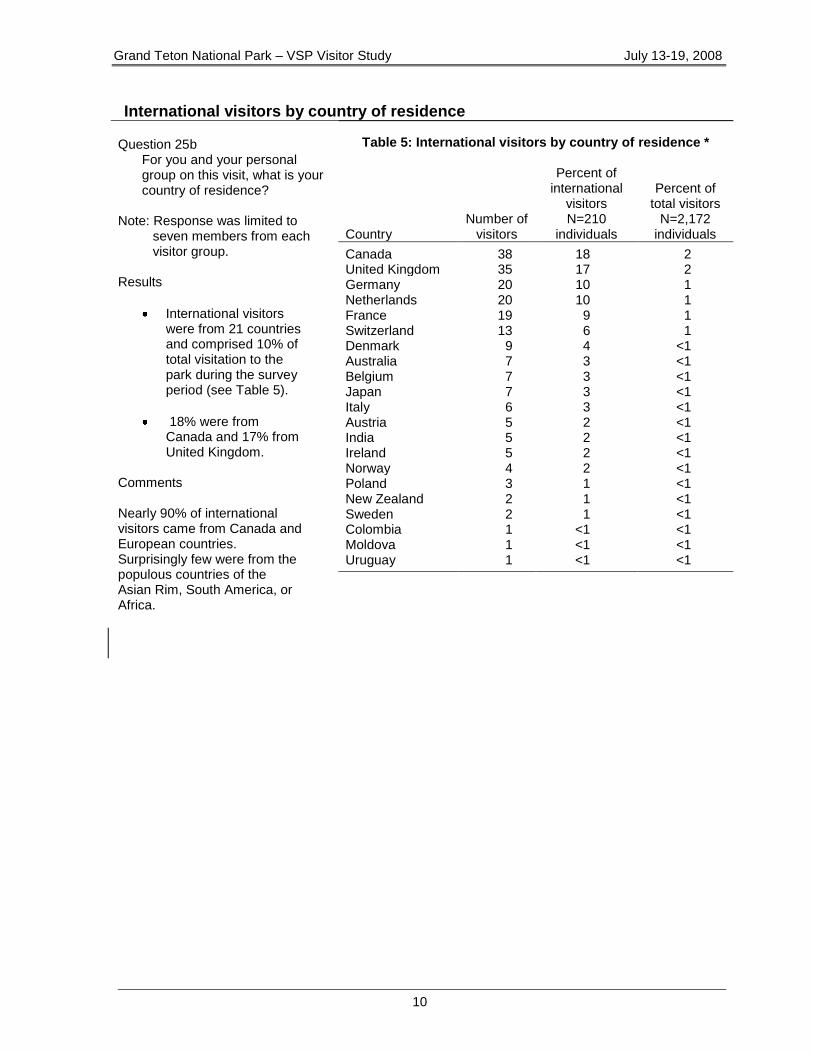
International visitors by country of residence Question 25b
For you and your personal group on this visit, what is your country of residence?
Note: Response was limited to
seven members from each visitor group.
Results
International visitors were from 21 countries and comprised 10% of total visitation to the park during the survey period (see Table 5).
18% were from Canada and 17% from United Kingdom.
Comments Nearly 90% of international visitors came from Canada and European countries. Surprisingly few were from the populous countries of the Asian Rim, South America, or Africa.
Table 5: International visitors by country of residence *
Country Number of
visitors
Percent of international
visitors N=210
individuals
Percent of total visitors
N=2,172 individuals
Canada 38 18 2 United Kingdom 35 17 2 Germany 20 10 1 Netherlands 20 10 1 France 19 9 1 Switzerland 13 6 1 Denmark 9 4 <1 Australia 7 3 <1 Belgium 7 3 <1 Japan 7 3 <1 Italy 6 3 <1 Austria 5 2 <1 India 5 2 <1 Ireland 5 2 <1 Norway 4 2 <1 Poland 3 1 <1 New Zealand 2 1 <1 Sweden 2 1 <1 Colombia 1 <1 <1 Moldova 1 <1 <1 Uruguay 1 <1 <1
Grand Teton National Park – VSP Visitor Study July 13-19, 2008
11
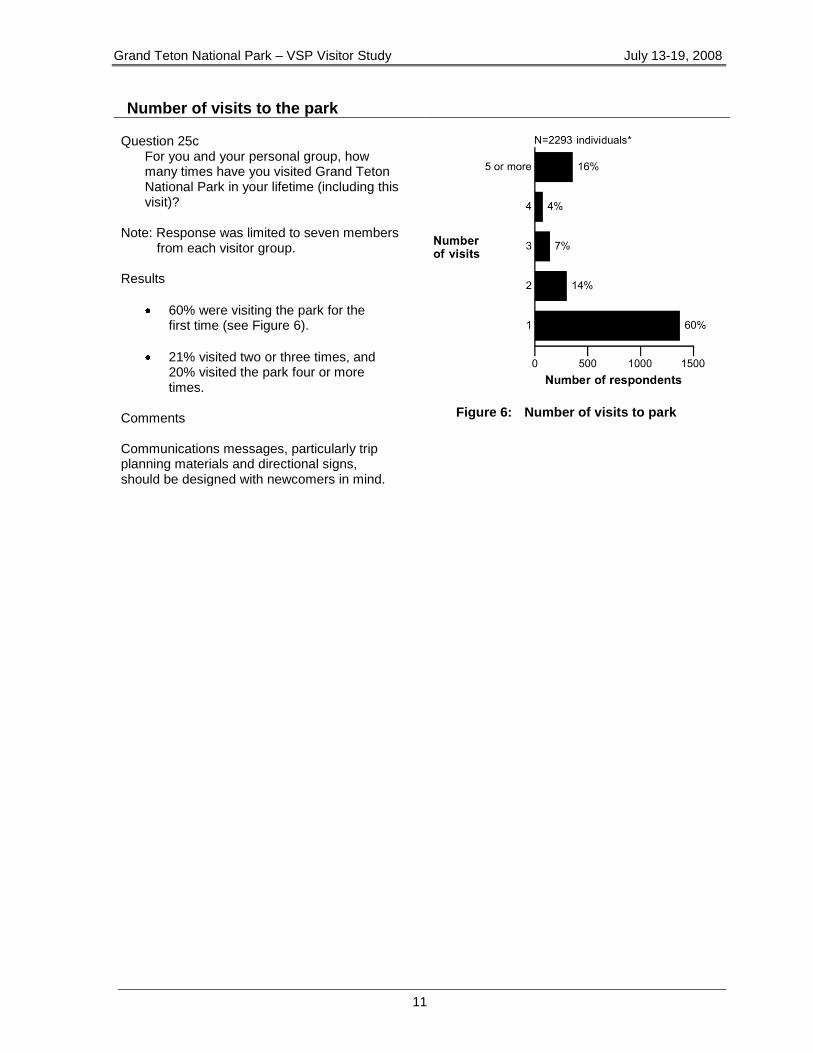
Number of visits to the park Question 25c
For you and your personal group, how many times have you visited Grand Teton National Park in your lifetime (including this visit)?
Note: Response was limited to seven members
from each visitor group. Results
60% were visiting the park for the first time (see Figure 6).
21% visited two or three times, and 20% visited the park four or more times.
Comments Communications messages, particularly trip planning materials and directional signs, should be designed with newcomers in mind.
Figure 6: Number of visits to park
Grand Teton National Park – VSP Visitor Study July 13-19, 2008
12
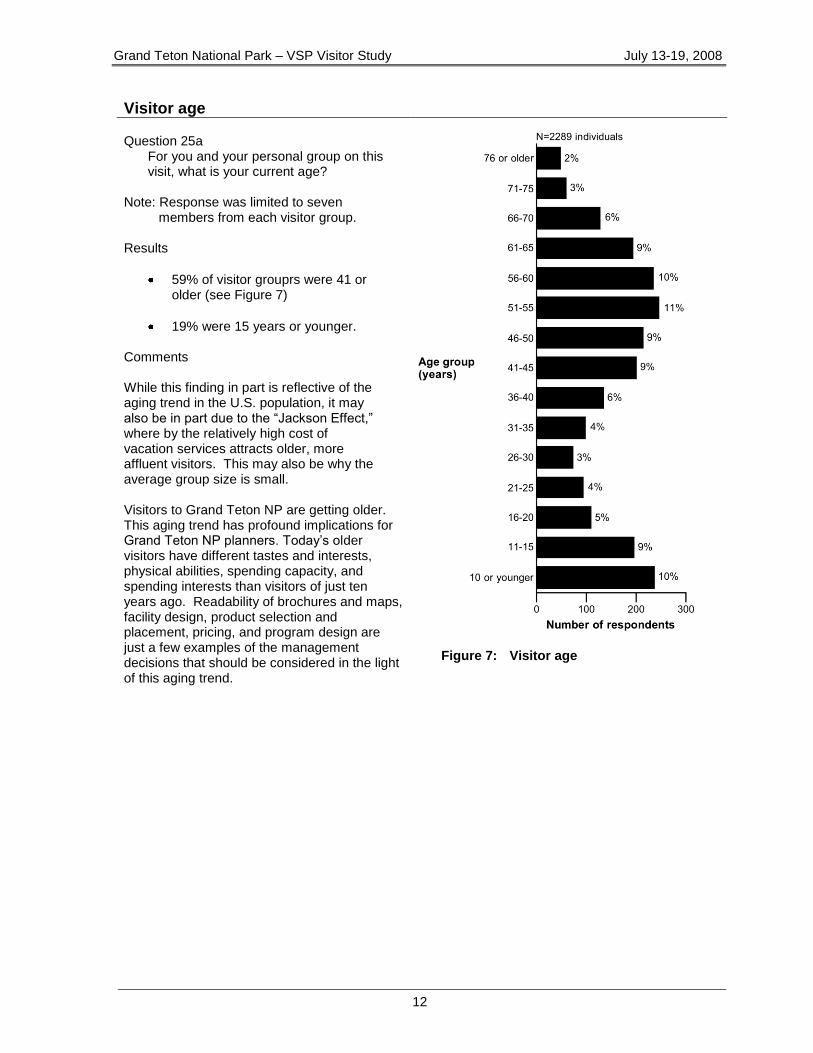
Visitor age Question 25a
For you and your personal group on this visit, what is your current age?
Note: Response was limited to seven
members from each visitor group.
Results
59% of visitor grouprs were 41 or older (see Figure 7)
19% were 15 years or younger. Comments While this finding in part is reflective of the aging trend in the U.S. population, it may also be in part due to the ―Jackson Effect,‖ where by the relatively high cost of vacation services attracts older, more affluent visitors. This may also be why the average group size is small. Visitors to Grand Teton NP are getting older. This aging trend has profound implications for Grand Teton NP planners. Today‘s older visitors have different tastes and interests, physical abilities, spending capacity, and spending interests than visitors of just ten years ago. Readability of brochures and maps, facility design, product selection and placement, pricing, and program design are just a few examples of the management decisions that should be considered in the light of this aging trend.
Figure 7: Visitor age
Grand Teton National Park – VSP Visitor Study July 13-19, 2008
13
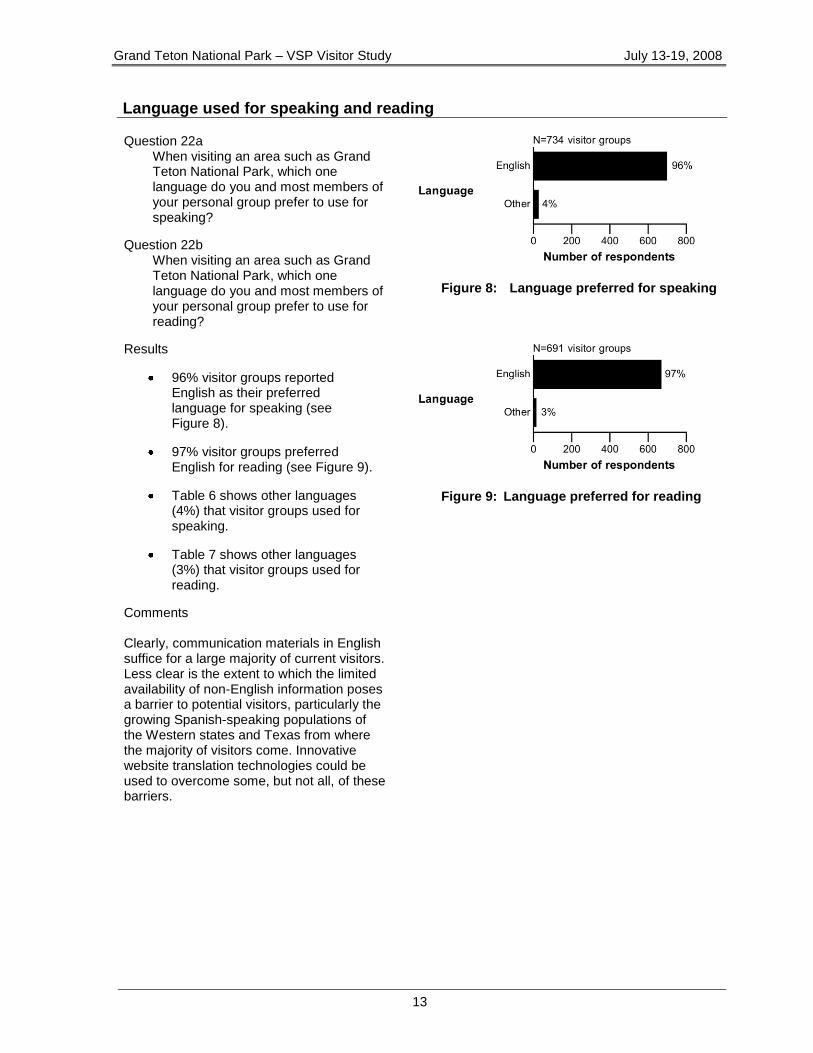
Language used for speaking and reading Question 22a
When visiting an area such as Grand Teton National Park, which one language do you and most members of your personal group prefer to use for speaking?
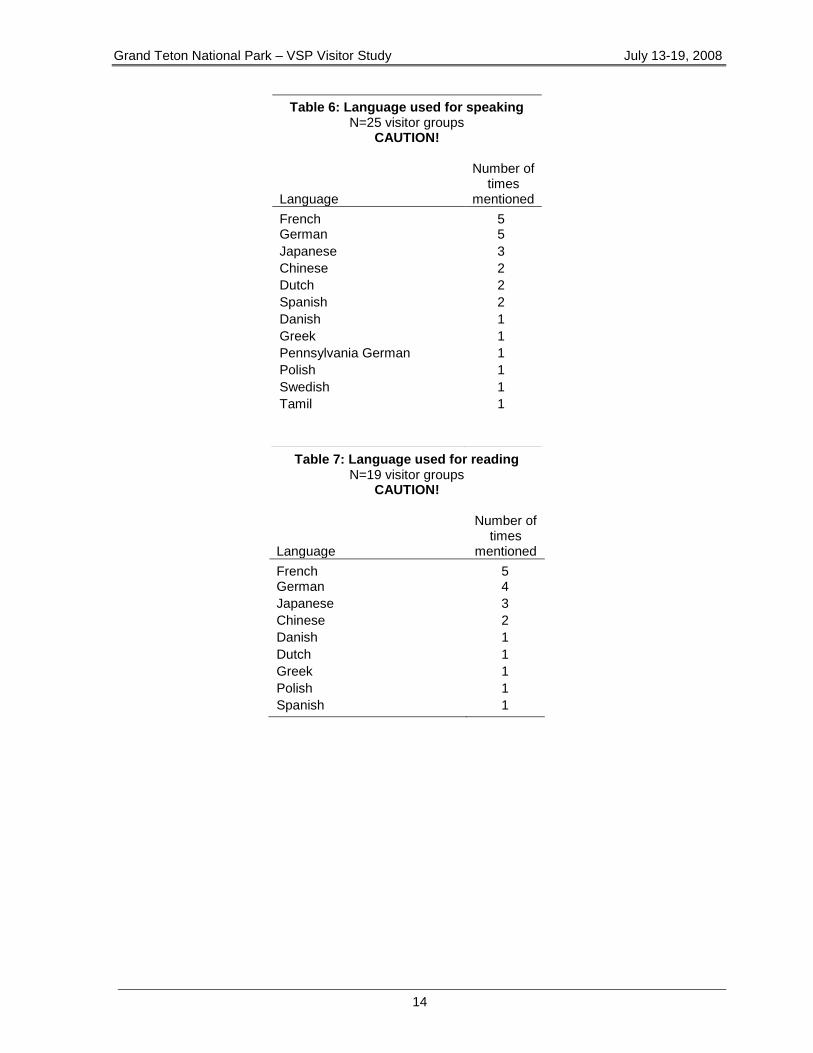
Question 22b When visiting an area such as Grand Teton National Park, which one language do you and most members of your personal group prefer to use for reading?
Results
96% visitor groups reported English as their preferred language for speaking (see Figure 8).
97% visitor groups preferred English for reading (see Figure 9).
Table 6 shows other languages (4%) that visitor groups used for speaking.
Table 7 shows other languages (3%) that visitor groups used for reading.
Comments Clearly, communication materials in English suffice for a large majority of current visitors. Less clear is the extent to which the limited availability of non-English information poses a barrier to potential visitors, particularly the growing Spanish-speaking populations of the Western states and Texas from where the majority of visitors come. Innovative website translation technologies could be used to overcome some, but not all, of these barriers.
Figure 8: Language preferred for speaking
Figure 9: Language preferred for reading
Grand Teton National Park – VSP Visitor Study July 13-19, 2008
14
Table 7: Language used for reading N=19 visitor groups
CAUTION!
Language
Number of times
mentioned
French 5 German 4
Japanese 3
Chinese 2
Danish 1
Dutch 1
Greek 1
Polish 1
Spanish 1
Table 6: Language used for speaking N=25 visitor groups
CAUTION!
Language
Number of times
mentioned
French 5 German 5
Japanese 3
Chinese 2
Dutch 2
Spanish 2
Danish 1
Greek 1
Pennsylvania German 1
Polish 1
Swedish 1
Tamil 1
Grand Teton National Park – VSP Visitor Study July 13-19, 2008
15
Services preferred in languages other than English Question 22c
In your opinion, what services in the park need to be provided in languages other than English? (open-ended)
Results
Fifty-three visitor groups commented on services they would like to have provided in languages other than English (see Table 8).
Table 8: Services preferred in other languages N=66 comments;
some visitor groups made more than one comment.
Service
Number of times
mentioned
All services 9 Restroom information 8 Directional signs 6 Brochures 5 Directions 5 Safety information 4 Information center 3 Interpretive signs 3 Signs 3 Emergency assistance 2 Entrance fee explanation 2 Guided tours 2 Lodging 2 Maps 2 Menus 2 Visitor center pamphlets 2 Warning signs 2 Bilingual climbing rangers 1 Bilingual staff 1 Distances in kilometers 1 ―Don't feed animals‖ signs 1
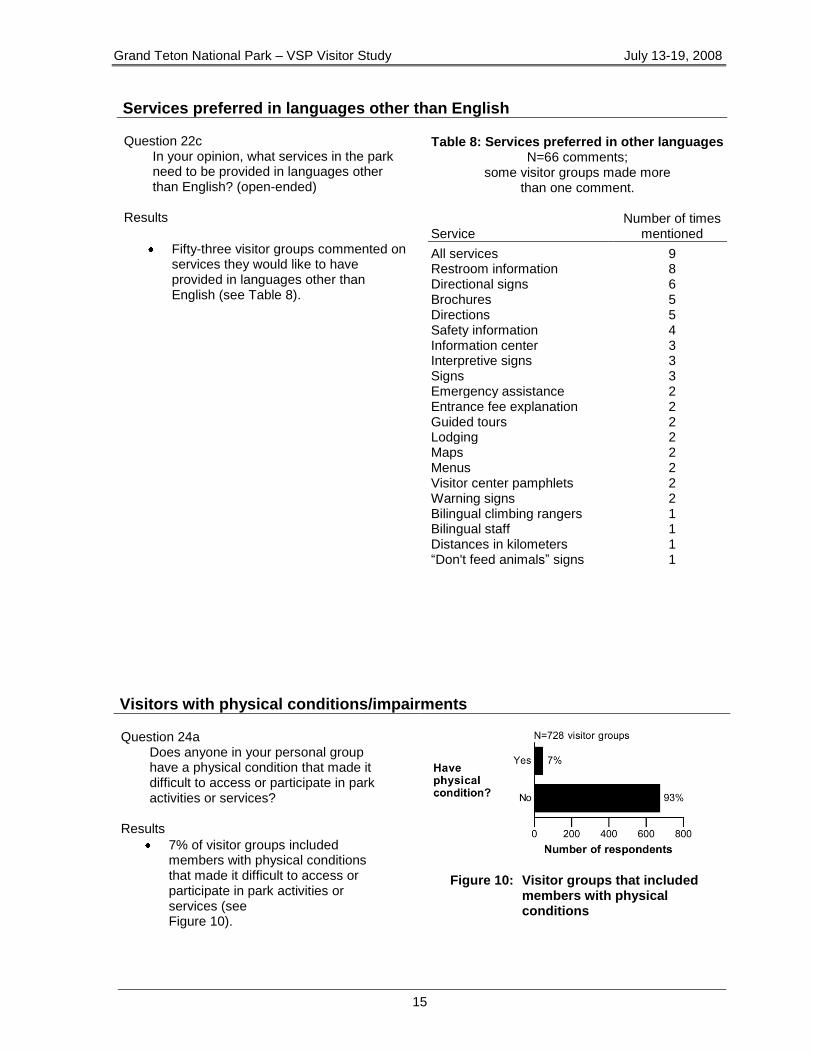
Visitors with physical conditions/impairments Question 24a
Does anyone in your personal group have a physical condition that made it difficult to access or participate in park activities or services?
Results
7% of visitor groups included members with physical conditions that made it difficult to access or participate in park activities or services (see Figure 10).
Figure 10: Visitor groups that included
members with physical conditions
Grand Teton National Park – VSP Visitor Study July 13-19, 2008
16
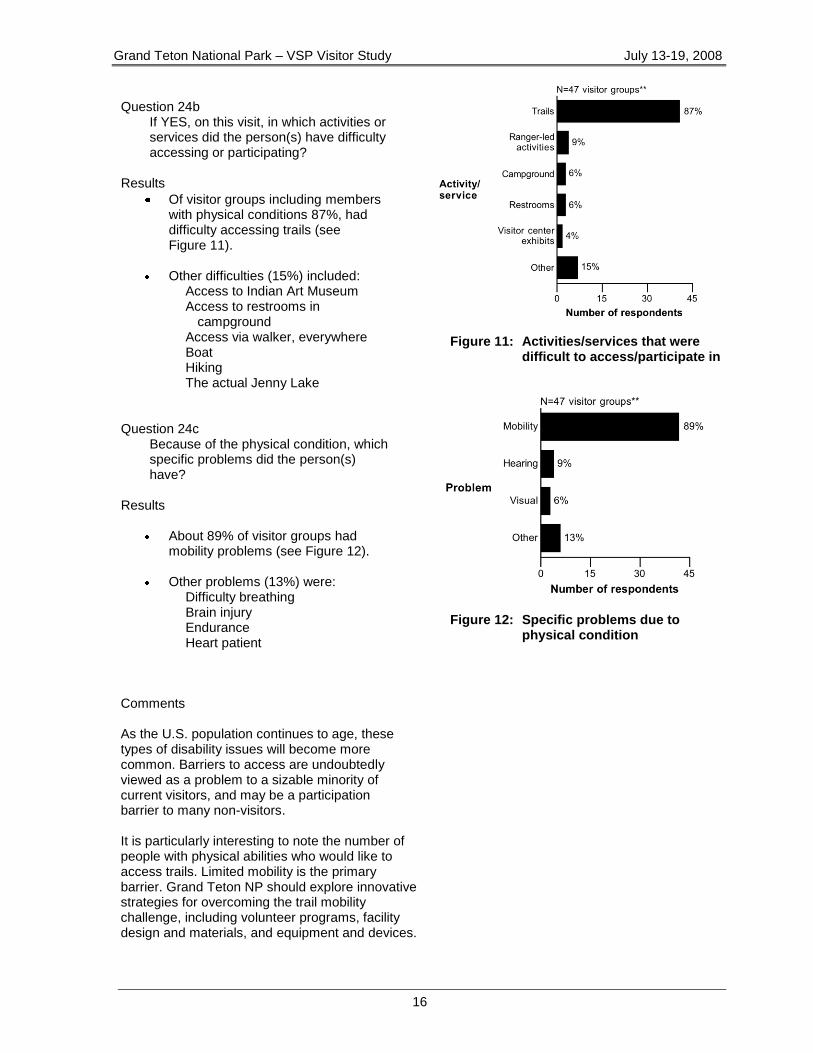
Question 24b
If YES, on this visit, in which activities or services did the person(s) have difficulty accessing or participating?
Results
Of visitor groups including members with physical conditions 87%, had difficulty accessing trails (see Figure 11).
Other difficulties (15%) included: Access to Indian Art Museum Access to restrooms in
campground Access via walker, everywhere Boat Hiking The actual Jenny Lake
Question 24c
Because of the physical condition, which specific problems did the person(s) have?
Results
About 89% of visitor groups had mobility problems (see Figure 12).
Other problems (13%) were: Difficulty breathing Brain injury Endurance Heart patient
Figure 11: Activities/services that were
difficult to access/participate in
Figure 12: Specific problems due to
physical condition
Comments As the U.S. population continues to age, these types of disability issues will become more common. Barriers to access are undoubtedly viewed as a problem to a sizable minority of current visitors, and may be a participation barrier to many non-visitors. It is particularly interesting to note the number of people with physical abilities who would like to access trails. Limited mobility is the primary barrier. Grand Teton NP should explore innovative strategies for overcoming the trail mobility challenge, including volunteer programs, facility design and materials, and equipment and devices.
Grand Teton National Park – VSP Visitor Study July 13-19, 2008
17
Respondents’ level of education
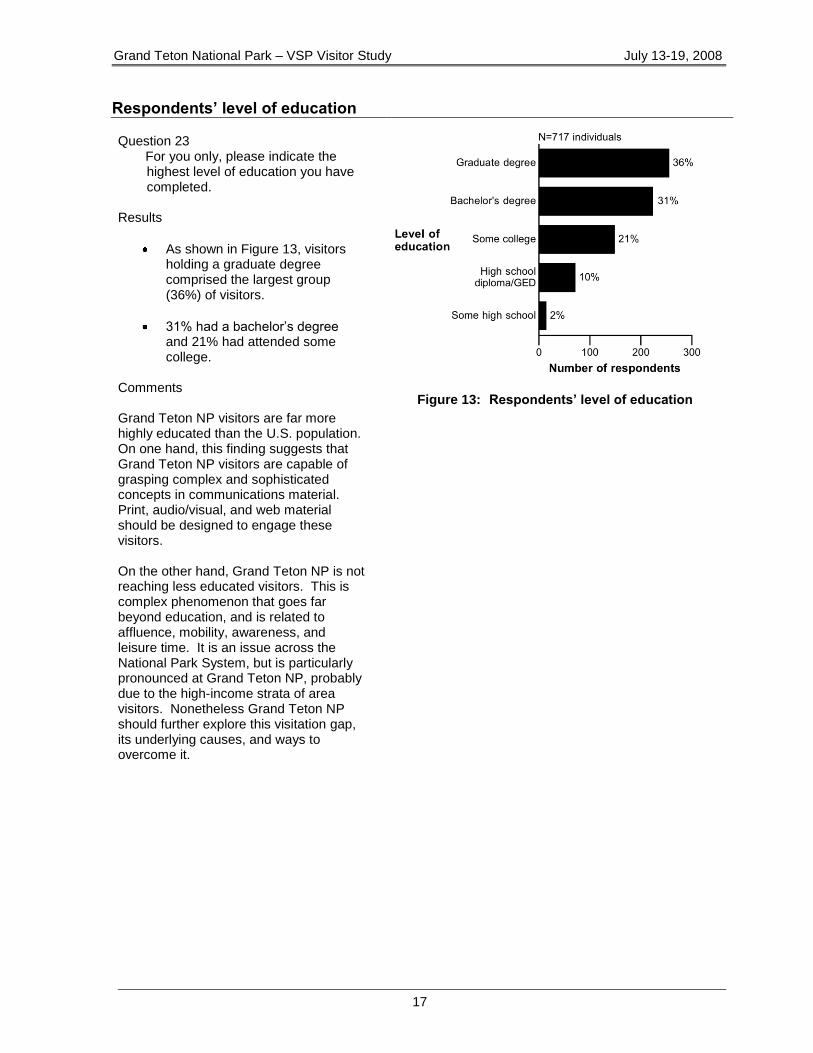
Question 23 For you only, please indicate the highest level of education you have completed.
Results
As shown in Figure 13, visitors holding a graduate degree comprised the largest group (36%) of visitors.
31% had a bachelor‘s degree and 21% had attended some college.
Comments Grand Teton NP visitors are far more highly educated than the U.S. population. On one hand, this finding suggests that Grand Teton NP visitors are capable of grasping complex and sophisticated concepts in communications material. Print, audio/visual, and web material should be designed to engage these visitors. On the other hand, Grand Teton NP is not reaching less educated visitors. This is complex phenomenon that goes far beyond education, and is related to affluence, mobility, awareness, and leisure time. It is an issue across the National Park System, but is particularly pronounced at Grand Teton NP, probably due to the high-income strata of area visitors. Nonetheless Grand Teton NP should further explore this visitation gap, its underlying causes, and ways to overcome it.
Figure 13: Respondents’ level of education
Grand Teton National Park – VSP Visitor Study July 13-19, 2008
18
Trip/Visit Characteristics and Preferences
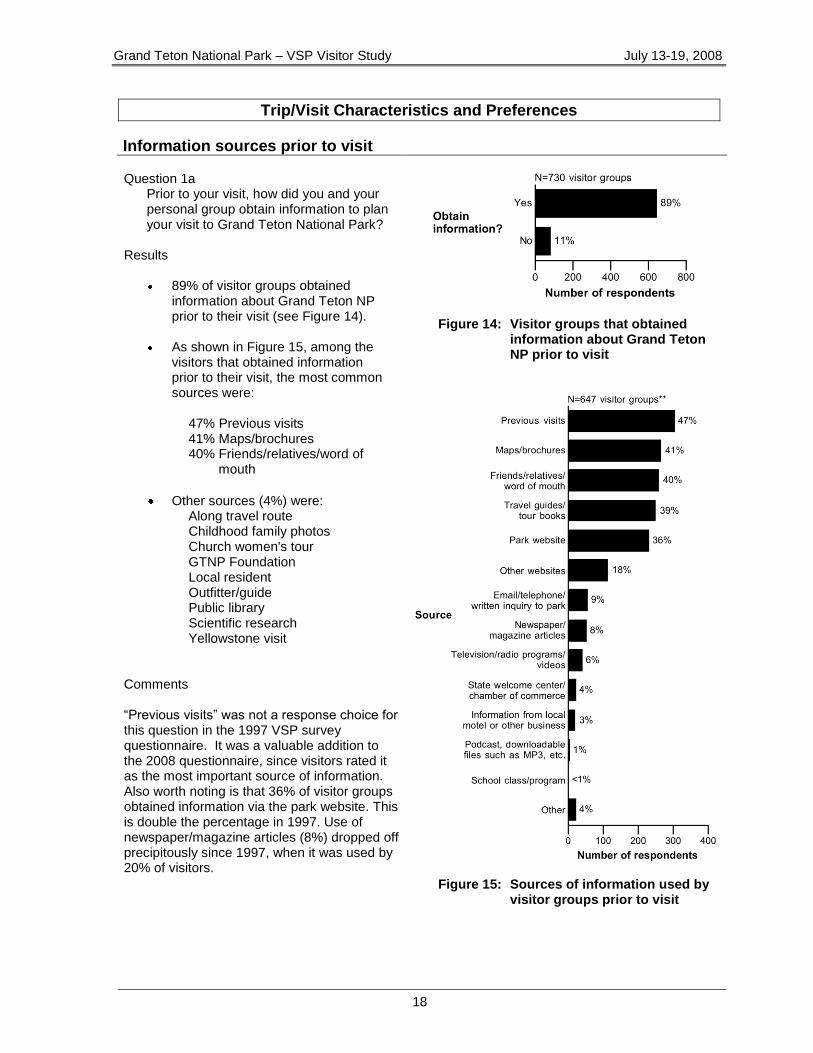
Information sources prior to visit Question 1a
Prior to your visit, how did you and your personal group obtain information to plan your visit to Grand Teton National Park?
Results
89% of visitor groups obtained information about Grand Teton NP prior to their visit (see Figure 14).
As shown in Figure 15, among the visitors that obtained information prior to their visit, the most common sources were:
47% Previous visits 41% Maps/brochures 40% Friends/relatives/word of
mouth
Other sources (4%) were: Along travel route Childhood family photos Church women's tour GTNP Foundation Local resident Outfitter/guide Public library Scientific research Yellowstone visit
Comments ―Previous visits‖ was not a response choice for this question in the 1997 VSP survey questionnaire. It was a valuable addition to the 2008 questionnaire, since visitors rated it as the most important source of information. Also worth noting is that 36% of visitor groups obtained information via the park website. This is double the percentage in 1997. Use of newspaper/magazine articles (8%) dropped off precipitously since 1997, when it was used by 20% of visitors.
Figure 14: Visitor groups that obtained
information about Grand Teton NP prior to visit
Figure 15: Sources of information used by
visitor groups prior to visit
Grand Teton National Park – VSP Visitor Study July 13-19, 2008
19
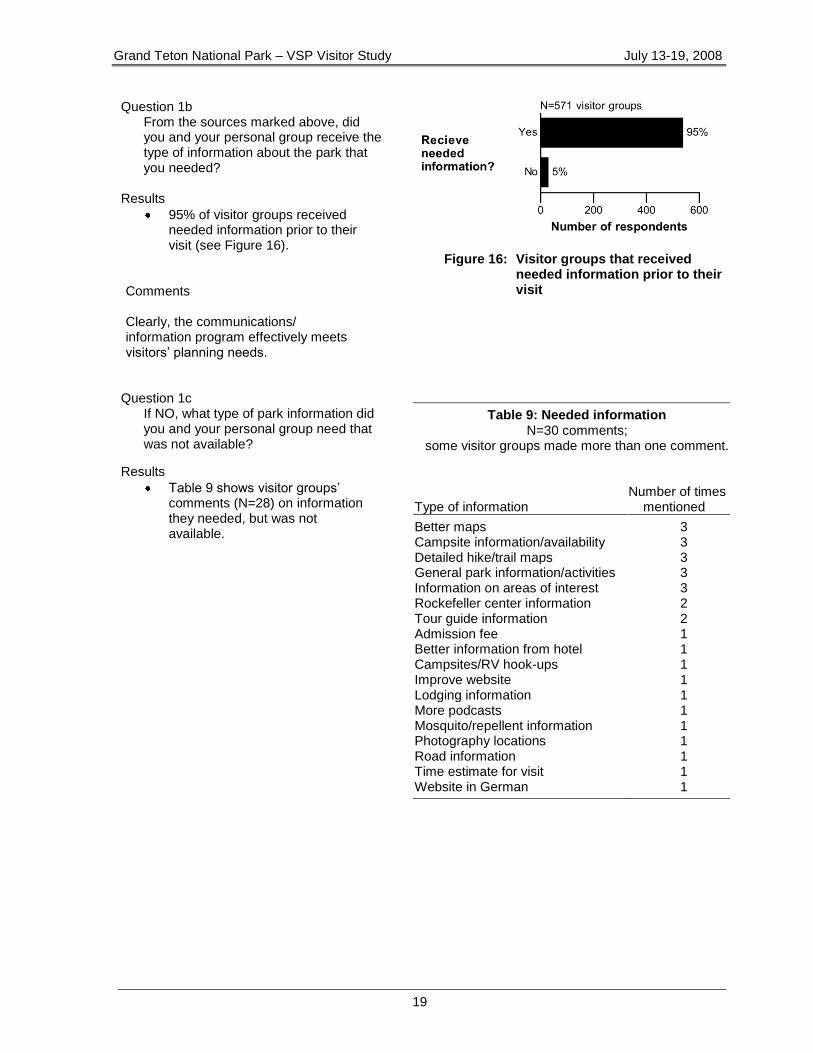
Question 1b
From the sources marked above, did you and your personal group receive the type of information about the park that you needed?
Results
95% of visitor groups received needed information prior to their visit (see Figure 16).
Comments Clearly, the communications/ information program effectively meets visitors‘ planning needs.
Figure 16: Visitor groups that received
needed information prior to their visit
Question 1c If NO, what type of park information did you and your personal group need that was not available?
Results
Table 9 shows visitor groups‘ comments (N=28) on information they needed, but was not available.
Table 9: Needed information N=30 comments;
some visitor groups made more than one comment.
Type of information
Number of times mentioned
Better maps 3 Campsite information/availability 3 Detailed hike/trail maps 3 General park information/activities 3 Information on areas of interest 3 Rockefeller center information 2 Tour guide information 2 Admission fee 1 Better information from hotel 1 Campsites/RV hook-ups 1 Improve website 1 Lodging information 1 More podcasts 1 Mosquito/repellent information 1 Photography locations 1 Road information 1 Time estimate for visit 1 Website in German 1
Grand Teton National Park – VSP Visitor Study July 13-19, 2008
20
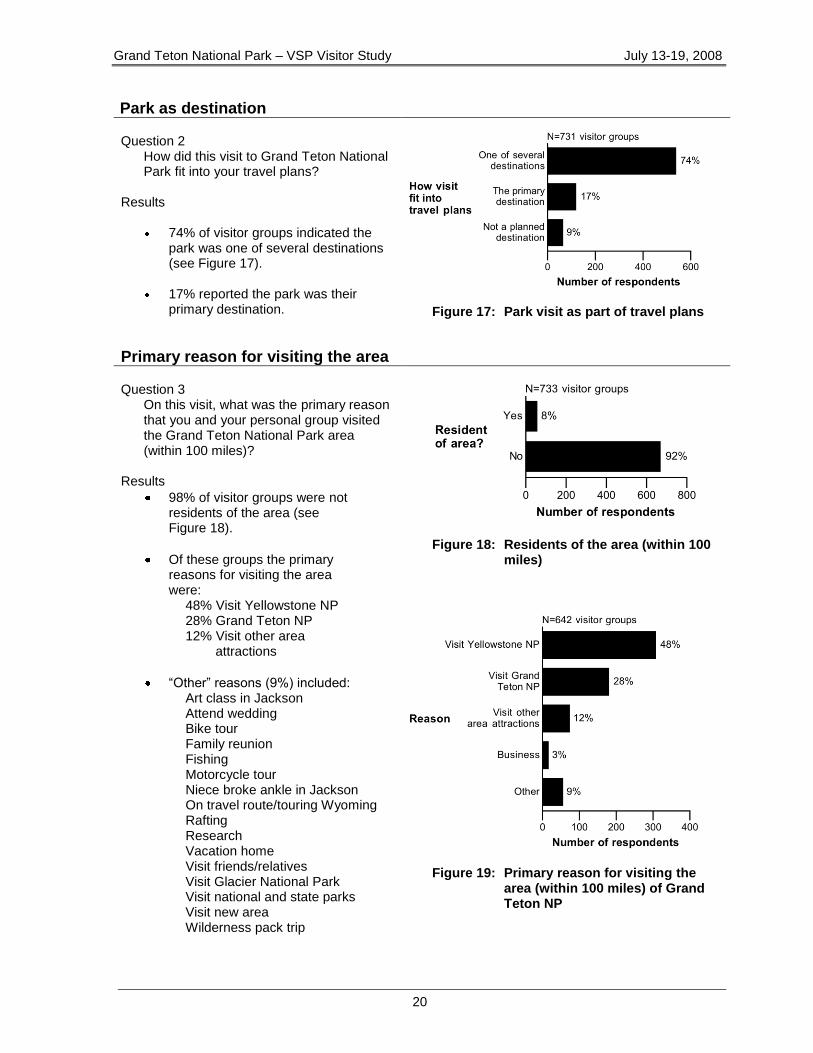
Park as destination Question 2
How did this visit to Grand Teton National Park fit into your travel plans?
Results
74% of visitor groups indicated the park was one of several destinations (see Figure 17).
17% reported the park was their primary destination.
Figure 17: Park visit as part of travel plans
Primary reason for visiting the area Question 3
On this visit, what was the primary reason that you and your personal group visited the Grand Teton National Park area (within 100 miles)?
Results
98% of visitor groups were not residents of the area (see Figure 18).
Of these groups the primary reasons for visiting the area were:
48% Visit Yellowstone NP 28% Grand Teton NP 12% Visit other area
attractions
―Other‖ reasons (9%) included: Art class in Jackson Attend wedding Bike tour Family reunion Fishing Motorcycle tour Niece broke ankle in Jackson On travel route/touring Wyoming Rafting Research Vacation home Visit friends/relatives Visit Glacier National Park Visit national and state parks Visit new area Wilderness pack trip
Figure 18: Residents of the area (within 100
miles)
Figure 19: Primary reason for visiting the
area (within 100 miles) of Grand Teton NP
Grand Teton National Park – VSP Visitor Study July 13-19, 2008
21
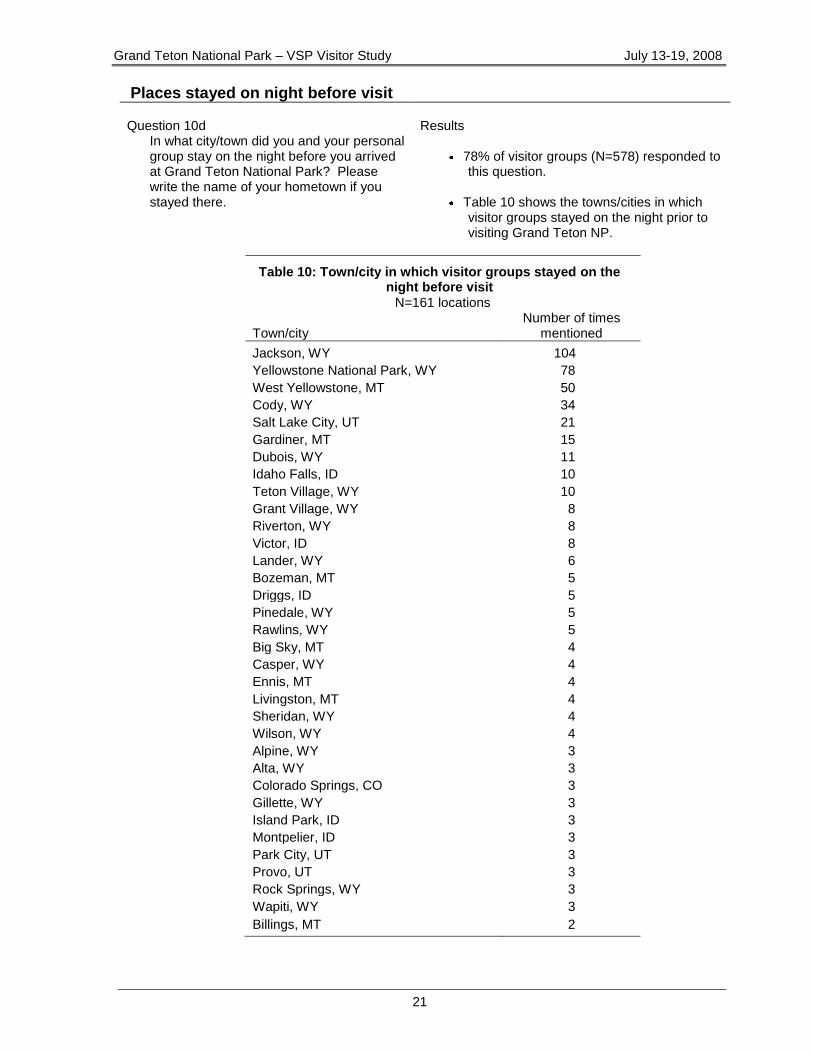
Places stayed on night before visit
Question 10d In what city/town did you and your personal group stay on the night before you arrived at Grand Teton National Park? Please write the name of your hometown if you stayed there.
Results
78% of visitor groups (N=578) responded to this question.
Table 10 shows the towns/cities in which
visitor groups stayed on the night prior to visiting Grand Teton NP.
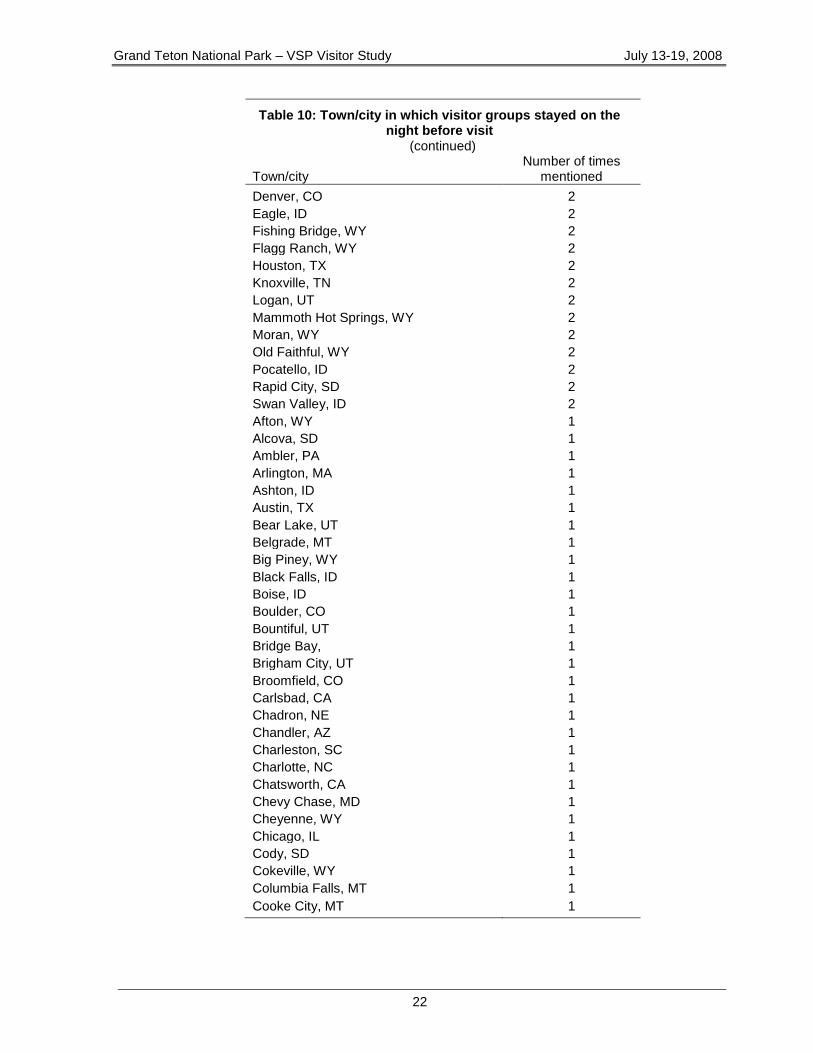
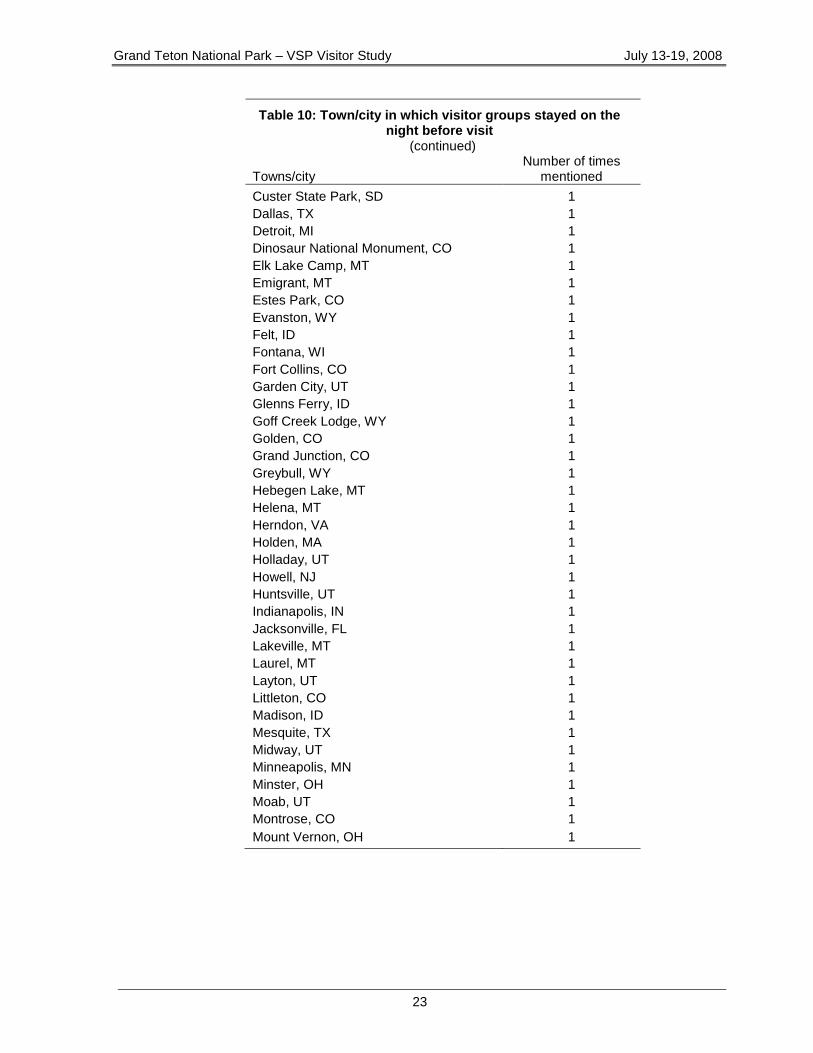
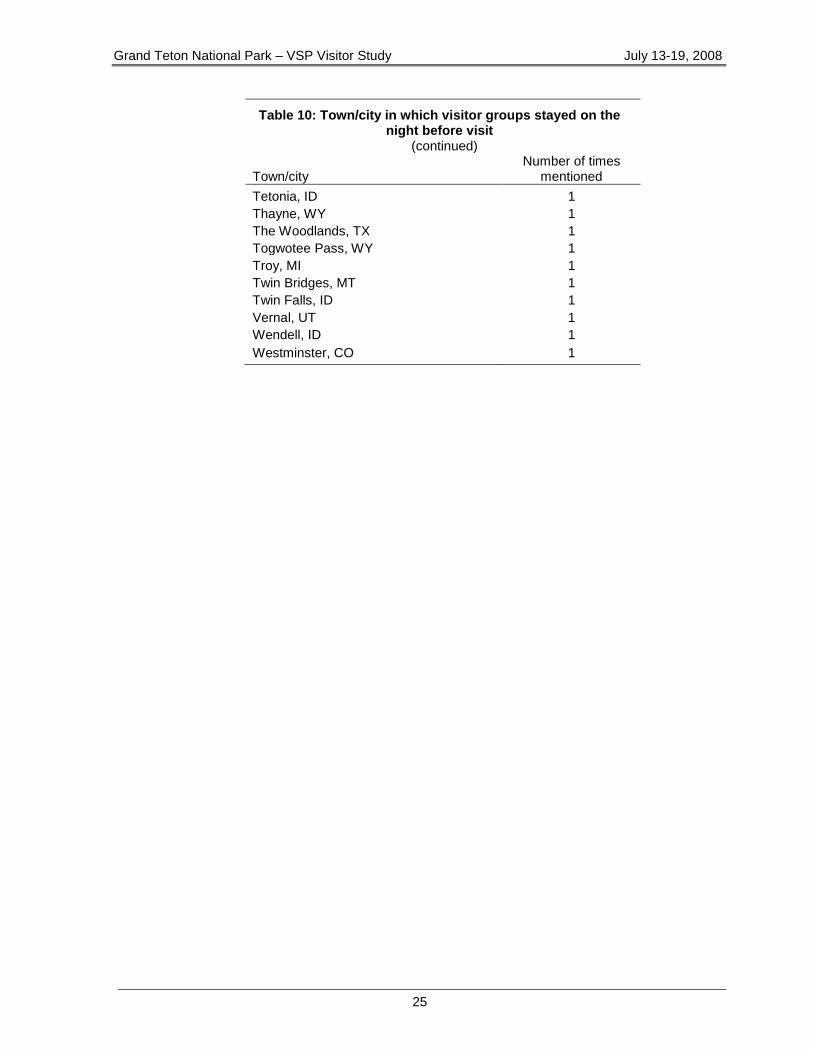
Table 10: Town/city in which visitor groups stayed on the night before visit
N=161 locations
Town/city Number of times
mentioned
Jackson, WY 104
Yellowstone National Park, WY 78
West Yellowstone, MT 50
Cody, WY 34
Salt Lake City, UT 21
Gardiner, MT 15
Dubois, WY 11
Idaho Falls, ID 10
Teton Village, WY 10
Grant Village, WY 8
Riverton, WY 8
Victor, ID 8
Lander, WY 6
Bozeman, MT 5
Driggs, ID 5
Pinedale, WY 5
Rawlins, WY 5
Big Sky, MT 4
Casper, WY 4
Ennis, MT 4
Livingston, MT 4
Sheridan, WY 4
Wilson, WY 4
Alpine, WY 3
Alta, WY 3
Colorado Springs, CO 3
Gillette, WY 3
Island Park, ID 3
Montpelier, ID 3
Park City, UT 3
Provo, UT 3
Rock Springs, WY 3
Wapiti, WY 3
Billings, MT 2
Grand Teton National Park – VSP Visitor Study July 13-19, 2008
22
Table 10: Town/city in which visitor groups stayed on the night before visit
(continued)
Town/city Number of times
mentioned
Denver, CO 2
Eagle, ID 2
Fishing Bridge, WY 2
Flagg Ranch, WY 2
Houston, TX 2
Knoxville, TN 2
Logan, UT 2
Mammoth Hot Springs, WY 2
Moran, WY 2
Old Faithful, WY 2
Pocatello, ID 2
Rapid City, SD 2
Swan Valley, ID 2
Afton, WY 1
Alcova, SD 1
Ambler, PA 1
Arlington, MA 1
Ashton, ID 1
Austin, TX 1
Bear Lake, UT 1
Belgrade, MT 1
Big Piney, WY 1
Black Falls, ID 1
Boise, ID 1
Boulder, CO 1
Bountiful, UT 1
Bridge Bay, 1
Brigham City, UT 1
Broomfield, CO 1
Carlsbad, CA 1
Chadron, NE 1
Chandler, AZ 1
Charleston, SC 1
Charlotte, NC 1
Chatsworth, CA 1
Chevy Chase, MD 1
Cheyenne, WY 1
Chicago, IL 1
Cody, SD 1
Cokeville, WY 1
Columbia Falls, MT 1
Cooke City, MT 1
Grand Teton National Park – VSP Visitor Study July 13-19, 2008
23
Table 10: Town/city in which visitor groups stayed on the night before visit
(continued)
Towns/city Number of times
mentioned
Custer State Park, SD 1
Dallas, TX 1
Detroit, MI 1
Dinosaur National Monument, CO 1
Elk Lake Camp, MT 1
Emigrant, MT 1
Estes Park, CO 1
Evanston, WY 1
Felt, ID 1
Fontana, WI 1
Fort Collins, CO 1
Garden City, UT 1
Glenns Ferry, ID 1
Goff Creek Lodge, WY 1
Golden, CO 1
Grand Junction, CO 1
Greybull, WY 1
Hebegen Lake, MT 1
Helena, MT 1
Herndon, VA 1
Holden, MA 1
Holladay, UT 1
Howell, NJ 1
Huntsville, UT 1
Indianapolis, IN 1
Jacksonville, FL 1
Lakeville, MT 1
Laurel, MT 1
Layton, UT 1
Littleton, CO 1
Madison, ID 1
Mesquite, TX 1
Midway, UT 1
Minneapolis, MN 1
Minster, OH 1
Moab, UT 1
Montrose, CO 1
Mount Vernon, OH 1

Grand Teton National Park – VSP Visitor Study July 13-19, 2008
24
Table 10: Town/city in which visitor groups stayed on the night before visit
(continued)
Town/city Number of times
mentioned
Naperville, IL 1
Nashville, TN 1
New Castle, WY 1
Niya, MO 1
Northbrook, IL 1
Oakland, CA 1
Oberlin, KS 1
Ogden, UT 1
Oklahoma City, OK 1
Pearl, MS 1
Powder Springs, GA 1
Providence, UT 1
Red Lodge, MT 1
Rexburg, ID 1
Rockledge, FL 1
Rowlette, TX 1
Sacramento, CA 1
San Diego, CA 1
San Luis Obispo, CA 1
Santa Fe, NM 1
Saratoga, CA 1
Sedalia, CO 1
Silver Spring, MD 1
Sky Mountain, MT 1
Smithfield, UT 1
Snowbird, UT 1
South Jordan, UT 1
Springfield, IL 1
Springville, UT 1
St. Charles, ID 1
St. Petersburg, FL 1
Stilwell, KS 1
Sun Valley, ID 1
Tallahassee, FL 1
Tampa, FL 1
Tequesta, FL 1
Grand Teton National Park – VSP Visitor Study July 13-19, 2008
25
Table 10: Town/city in which visitor groups stayed on the night before visit
(continued)
Town/city Number of times
mentioned
Tetonia, ID 1
Thayne, WY 1
The Woodlands, TX 1
Togwotee Pass, WY 1
Troy, MI 1
Twin Bridges, MT 1
Twin Falls, ID 1
Vernal, UT 1
Wendell, ID 1
Westminster, CO 1
Grand Teton National Park – VSP Visitor Study July 13-19, 2008
26
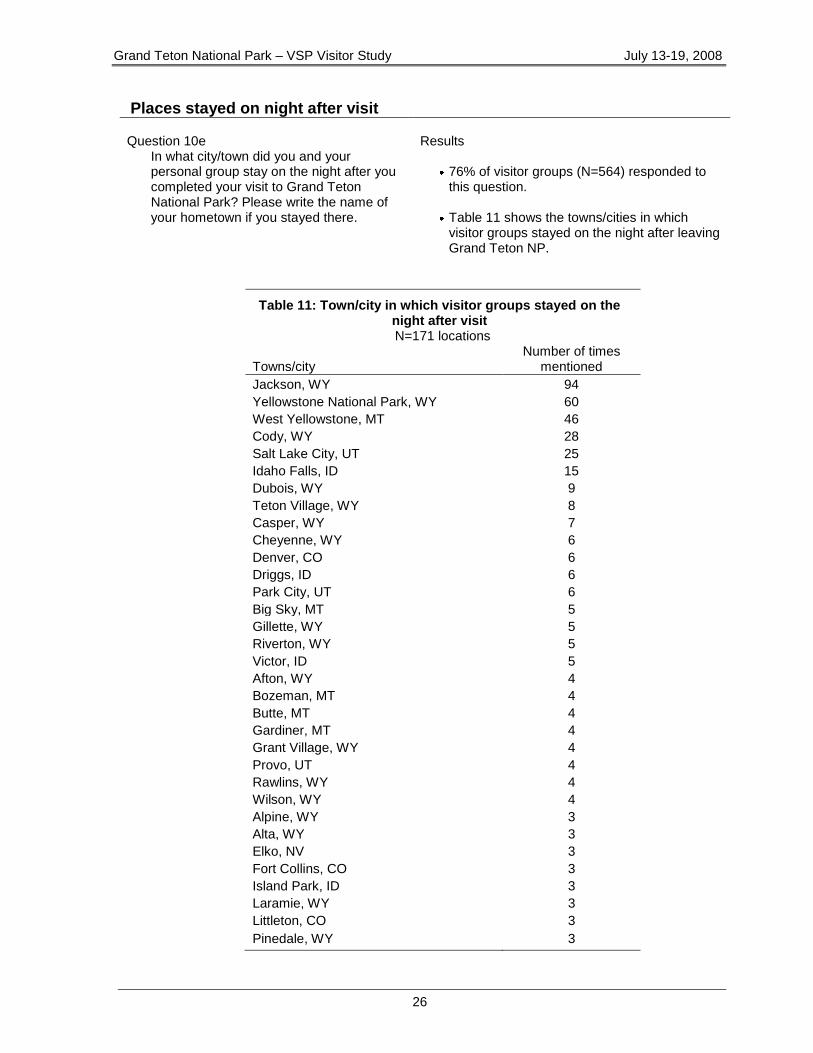
Places stayed on night after visit
Question 10e In what city/town did you and your personal group stay on the night after you completed your visit to Grand Teton National Park? Please write the name of your hometown if you stayed there.
Results
76% of visitor groups (N=564) responded to this question.
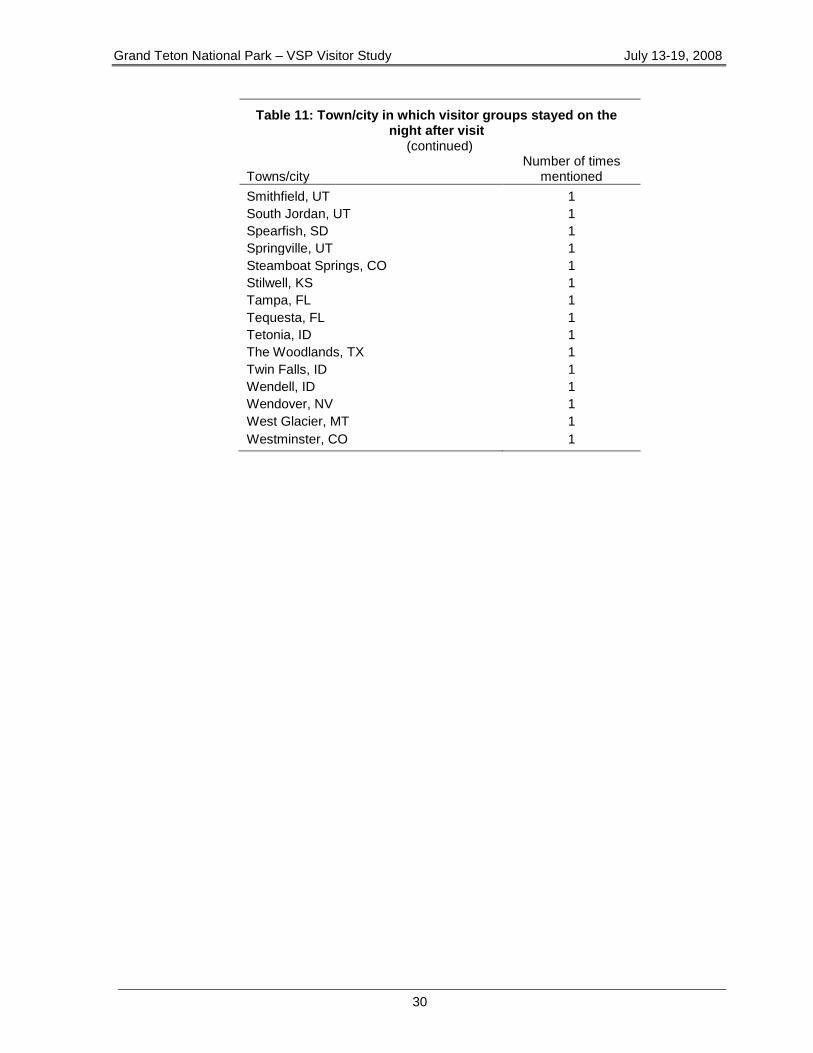
Table 11 shows the towns/cities in which visitor groups stayed on the night after leaving Grand Teton NP.
Table 11: Town/city in which visitor groups stayed on the night after visit N=171 locations
Towns/city Number of times
mentioned
Jackson, WY 94
Yellowstone National Park, WY 60
West Yellowstone, MT 46
Cody, WY 28
Salt Lake City, UT 25
Idaho Falls, ID 15
Dubois, WY 9
Teton Village, WY 8
Casper, WY 7
Cheyenne, WY 6
Denver, CO 6
Driggs, ID 6
Park City, UT 6
Big Sky, MT 5
Gillette, WY 5
Riverton, WY 5
Victor, ID 5
Afton, WY 4
Bozeman, MT 4
Butte, MT 4
Gardiner, MT 4
Grant Village, WY 4
Provo, UT 4
Rawlins, WY 4
Wilson, WY 4
Alpine, WY 3
Alta, WY 3
Elko, NV 3
Fort Collins, CO 3
Island Park, ID 3
Laramie, WY 3
Littleton, CO 3
Pinedale, WY 3
Grand Teton National Park – VSP Visitor Study July 13-19, 2008
27
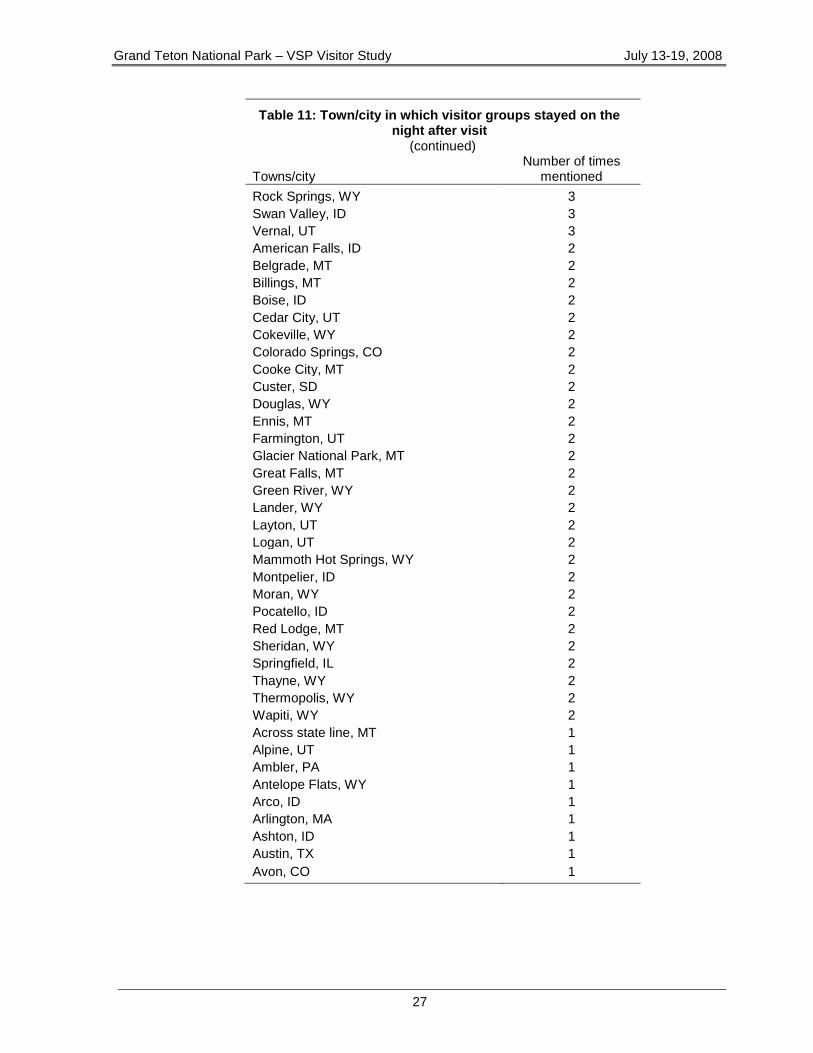
Table 11: Town/city in which visitor groups stayed on the night after visit
(continued)
Towns/city Number of times
mentioned
Rock Springs, WY 3
Swan Valley, ID 3
Vernal, UT 3
American Falls, ID 2
Belgrade, MT 2
Billings, MT 2
Boise, ID 2
Cedar City, UT 2
Cokeville, WY 2
Colorado Springs, CO 2
Cooke City, MT 2
Custer, SD 2
Douglas, WY 2
Ennis, MT 2
Farmington, UT 2
Glacier National Park, MT 2
Great Falls, MT 2
Green River, WY 2
Lander, WY 2
Layton, UT 2
Logan, UT 2
Mammoth Hot Springs, WY 2
Montpelier, ID 2
Moran, WY 2
Pocatello, ID 2
Red Lodge, MT 2
Sheridan, WY 2
Springfield, IL 2
Thayne, WY 2
Thermopolis, WY 2
Wapiti, WY 2
Across state line, MT 1
Alpine, UT 1
Ambler, PA 1
Antelope Flats, WY 1
Arco, ID 1
Arlington, MA 1
Ashton, ID 1
Austin, TX 1
Avon, CO 1
Grand Teton National Park – VSP Visitor Study July 13-19, 2008
28
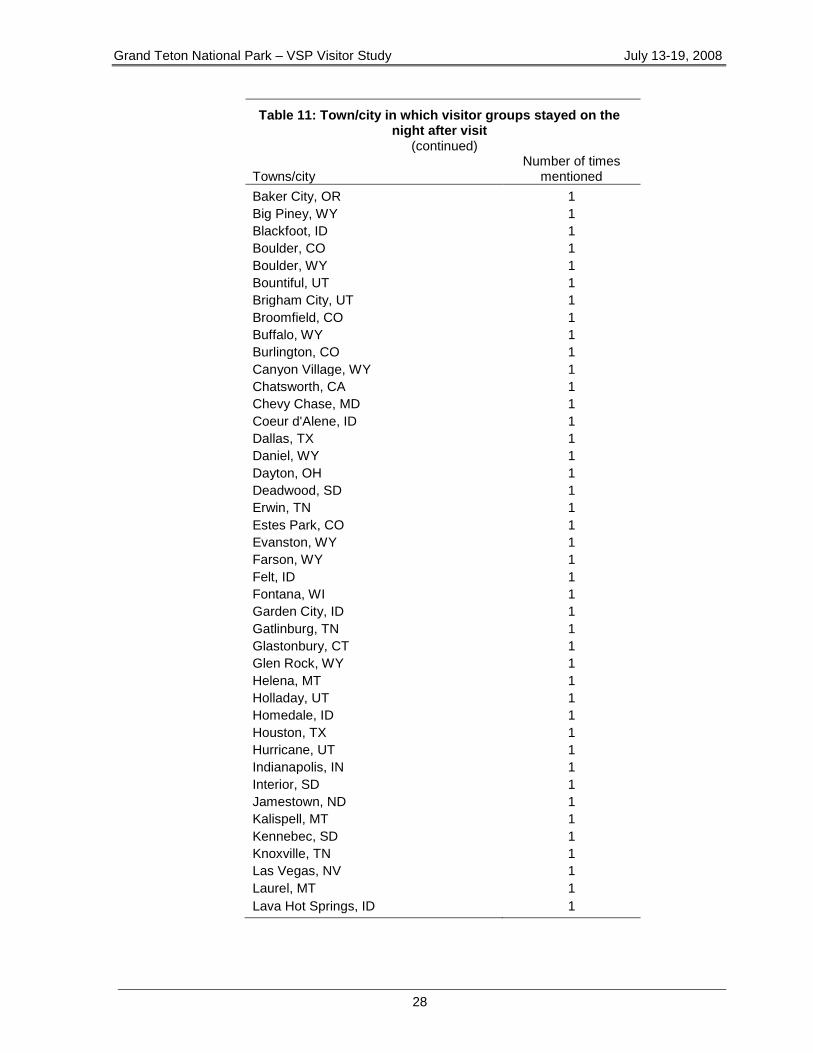
Table 11: Town/city in which visitor groups stayed on the night after visit
(continued)
Towns/city Number of times
mentioned
Baker City, OR 1
Big Piney, WY 1
Blackfoot, ID 1
Boulder, CO 1
Boulder, WY 1
Bountiful, UT 1
Brigham City, UT 1
Broomfield, CO 1
Buffalo, WY 1
Burlington, CO 1
Canyon Village, WY 1
Chatsworth, CA 1
Chevy Chase, MD 1
Coeur d'Alene, ID 1
Dallas, TX 1
Daniel, WY 1
Dayton, OH 1
Deadwood, SD 1
Erwin, TN 1
Estes Park, CO 1
Evanston, WY 1
Farson, WY 1
Felt, ID 1
Fontana, WI 1
Garden City, ID 1
Gatlinburg, TN 1
Glastonbury, CT 1
Glen Rock, WY 1
Helena, MT 1
Holladay, UT 1
Homedale, ID 1
Houston, TX 1
Hurricane, UT 1
Indianapolis, IN 1
Interior, SD 1
Jamestown, ND 1
Kalispell, MT 1
Kennebec, SD 1
Knoxville, TN 1
Las Vegas, NV 1
Laurel, MT 1
Lava Hot Springs, ID 1
Grand Teton National Park – VSP Visitor Study July 13-19, 2008
29
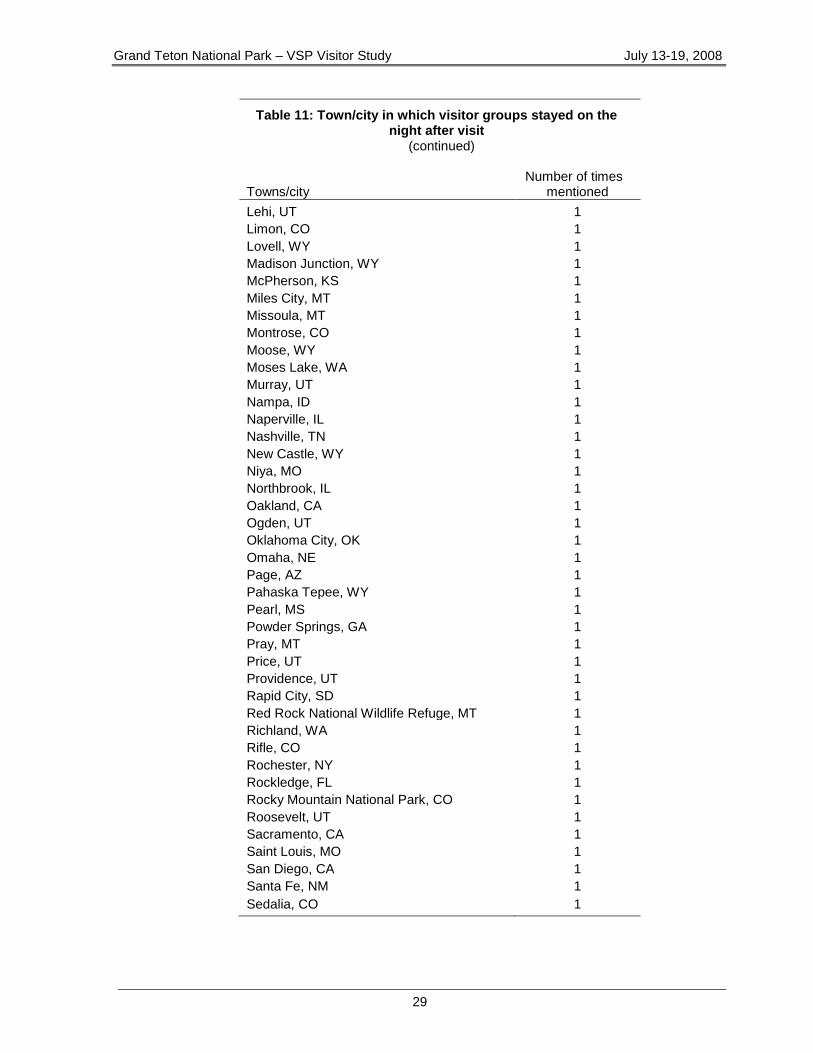
Table 11: Town/city in which visitor groups stayed on the night after visit
(continued)
Towns/city Number of times
mentioned
Lehi, UT 1
Limon, CO 1
Lovell, WY 1
Madison Junction, WY 1
McPherson, KS 1
Miles City, MT 1
Missoula, MT 1
Montrose, CO 1
Moose, WY 1
Moses Lake, WA 1
Murray, UT 1
Nampa, ID 1
Naperville, IL 1
Nashville, TN 1
New Castle, WY 1
Niya, MO 1
Northbrook, IL 1
Oakland, CA 1
Ogden, UT 1
Oklahoma City, OK 1
Omaha, NE 1
Page, AZ 1
Pahaska Tepee, WY 1
Pearl, MS 1
Powder Springs, GA 1
Pray, MT 1
Price, UT 1
Providence, UT 1
Rapid City, SD 1
Red Rock National Wildlife Refuge, MT 1
Richland, WA 1
Rifle, CO 1
Rochester, NY 1
Rockledge, FL 1
Rocky Mountain National Park, CO 1
Roosevelt, UT 1
Sacramento, CA 1
Saint Louis, MO 1
San Diego, CA 1
Santa Fe, NM 1
Sedalia, CO 1
Grand Teton National Park – VSP Visitor Study July 13-19, 2008
30
Table 11: Town/city in which visitor groups stayed on the night after visit
(continued)
Towns/city Number of times
mentioned
Smithfield, UT 1
South Jordan, UT 1
Spearfish, SD 1
Springville, UT 1
Steamboat Springs, CO 1
Stilwell, KS 1
Tampa, FL 1
Tequesta, FL 1
Tetonia, ID 1
The Woodlands, TX 1
Twin Falls, ID 1
Wendell, ID 1
Wendover, NV 1
West Glacier, MT 1
Westminster, CO 1

Grand Teton National Park – VSP Visitor Study July 13-19, 2008
31
Travel route to park
Question 4
On this trip, from which direction did you and your personal group come to first arrive at Grand Teton National Park?
Results
50% of visitor groups arrived at Grand Teton NP from the south, either via Jackson, WY or the Moose-Wilson road (see Figure 20).
49% arrived from the north and east, either via Yellowstone NP or Dubois, WY.
Comments In the 1997 VSP study, 53% of visitors arrived from Jackson, 36% from Yellowstone, and 11% from Dubois. Two routes (1) from the southwest Moose–Wilson Road and (2) from the west Grassy Lake, Ashton, ID were not response options in 1997 VSP questionnaire. Some of the southwest routes may be incorporated in the answer for the route from Jackson, WY in 1997. With this assumption, there is not a significant change in travel routes to the park.
Figure 20: Direction of approach to Grand
Teton NP
Grand Teton National Park – VSP Visitor Study July 13-19, 2008
32
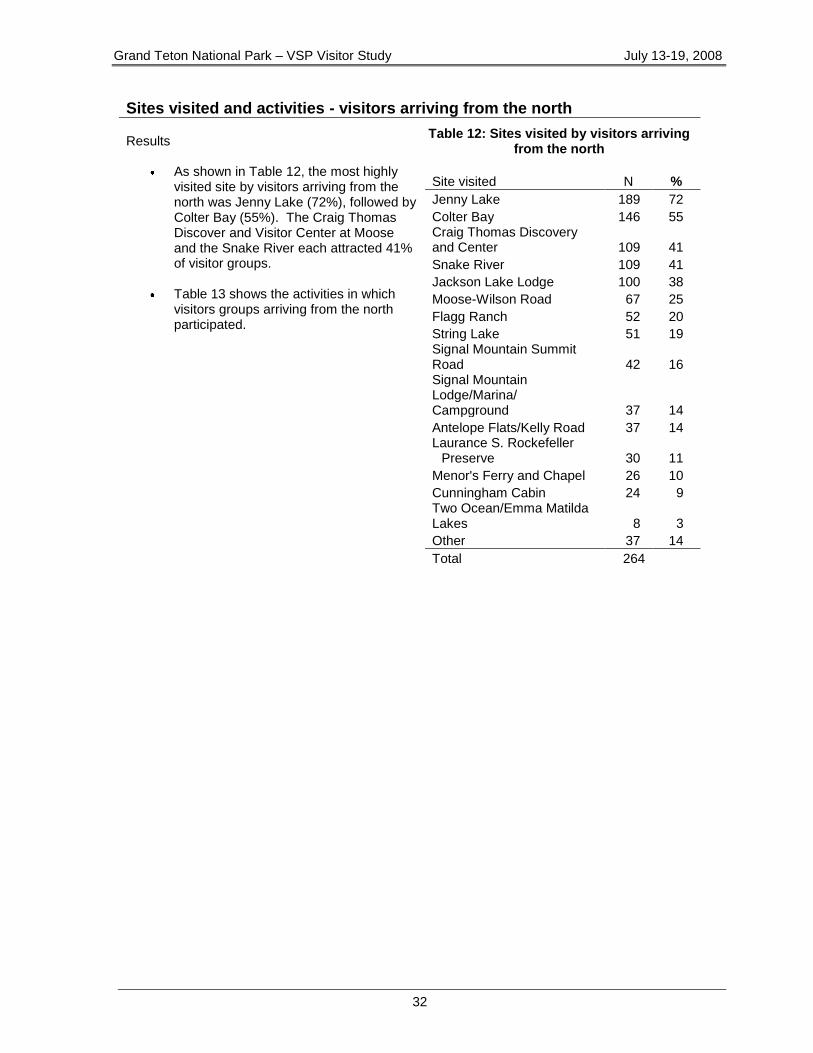
Sites visited and activities - visitors arriving from the north Results
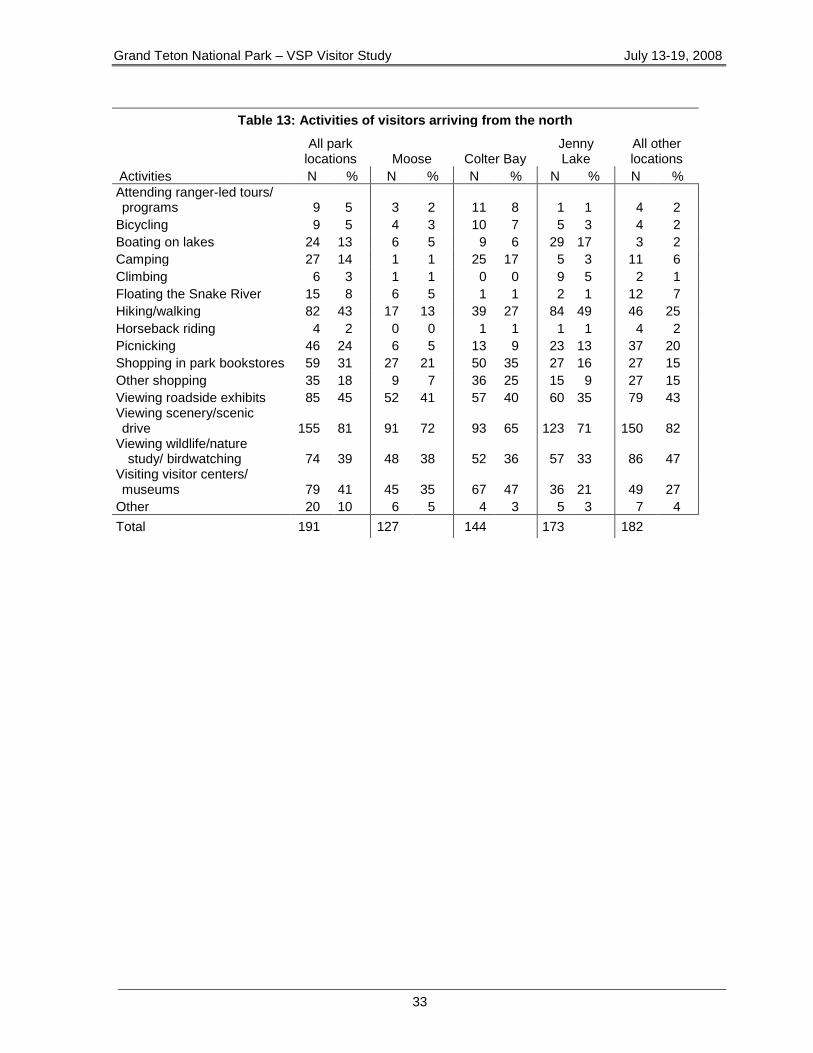
As shown in Table 12, the most highly visited site by visitors arriving from the north was Jenny Lake (72%), followed by Colter Bay (55%). The Craig Thomas Discover and Visitor Center at Moose and the Snake River each attracted 41% of visitor groups.
Table 13 shows the activities in which visitors groups arriving from the north participated.
Table 12: Sites visited by visitors arriving from the north
Site visited N %
Jenny Lake 189 72
Colter Bay 146 55 Craig Thomas Discovery and Center 109 41
Snake River 109 41
Jackson Lake Lodge 100 38
Moose-Wilson Road 67 25
Flagg Ranch 52 20
String Lake 51 19 Signal Mountain Summit Road 42 16 Signal Mountain Lodge/Marina/ Campground 37 14
Antelope Flats/Kelly Road 37 14 Laurance S. Rockefeller
Preserve 30 11
Menor's Ferry and Chapel 26 10
Cunningham Cabin 24 9 Two Ocean/Emma Matilda Lakes 8 3
Other 37 14
Total 264
Grand Teton National Park – VSP Visitor Study July 13-19, 2008
33
Table 13: Activities of visitors arriving from the north
Activities
All park locations Moose Colter Bay
Jenny Lake
All other locations
N % N % N % N % N %
Attending ranger-led tours/ programs 9 5 3 2 11 8 1 1 4 2
Bicycling 9 5 4 3 10 7 5 3 4 2
Boating on lakes 24 13 6 5 9 6 29 17 3 2
Camping 27 14 1 1 25 17 5 3 11 6
Climbing 6 3 1 1 0 0 9 5 2 1
Floating the Snake River 15 8 6 5 1 1 2 1 12 7
Hiking/walking 82 43 17 13 39 27 84 49 46 25
Horseback riding 4 2 0 0 1 1 1 1 4 2
Picnicking 46 24 6 5 13 9 23 13 37 20
Shopping in park bookstores 59 31 27 21 50 35 27 16 27 15
Other shopping 35 18 9 7 36 25 15 9 27 15
Viewing roadside exhibits 85 45 52 41 57 40 60 35 79 43 Viewing scenery/scenic drive 155 81 91 72 93 65 123 71 150 82
Viewing wildlife/nature study/ birdwatching 74 39 48 38 52 36 57 33 86 47
Visiting visitor centers/ museums 79 41 45 35 67 47 36 21 49 27
Other 20 10 6 5 4 3 5 3 7 4
Total 191 127 144 173 182
Grand Teton National Park – VSP Visitor Study July 13-19, 2008
34
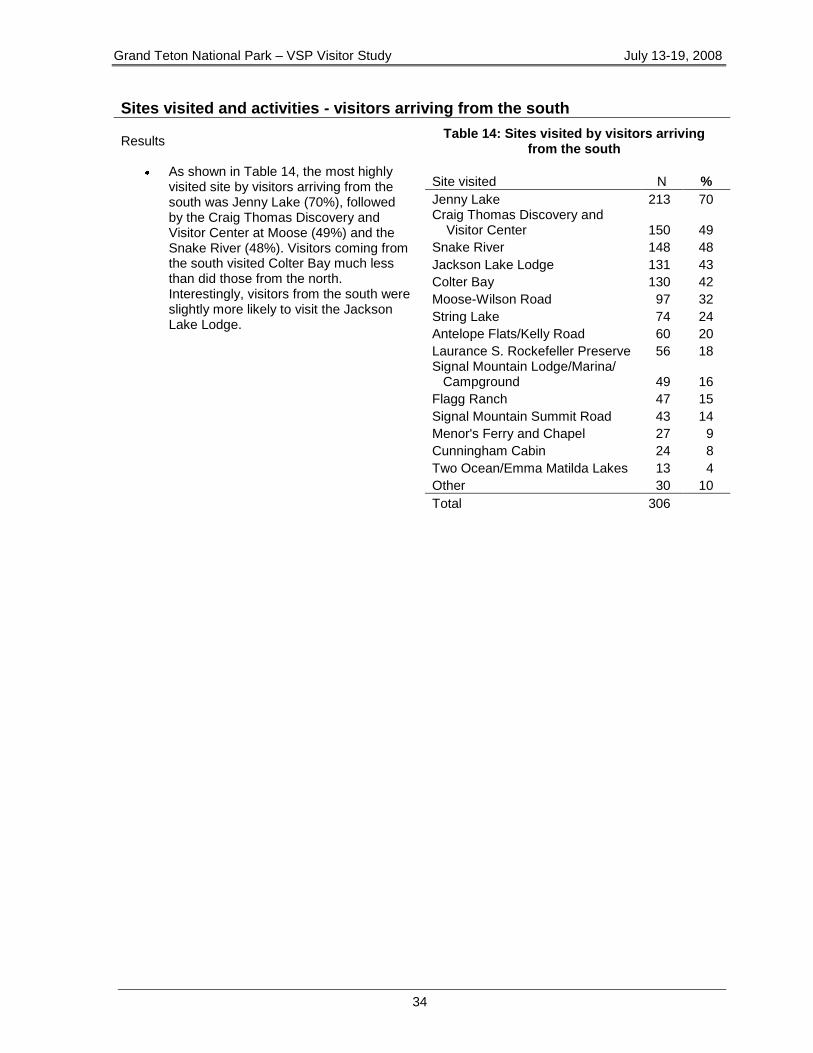
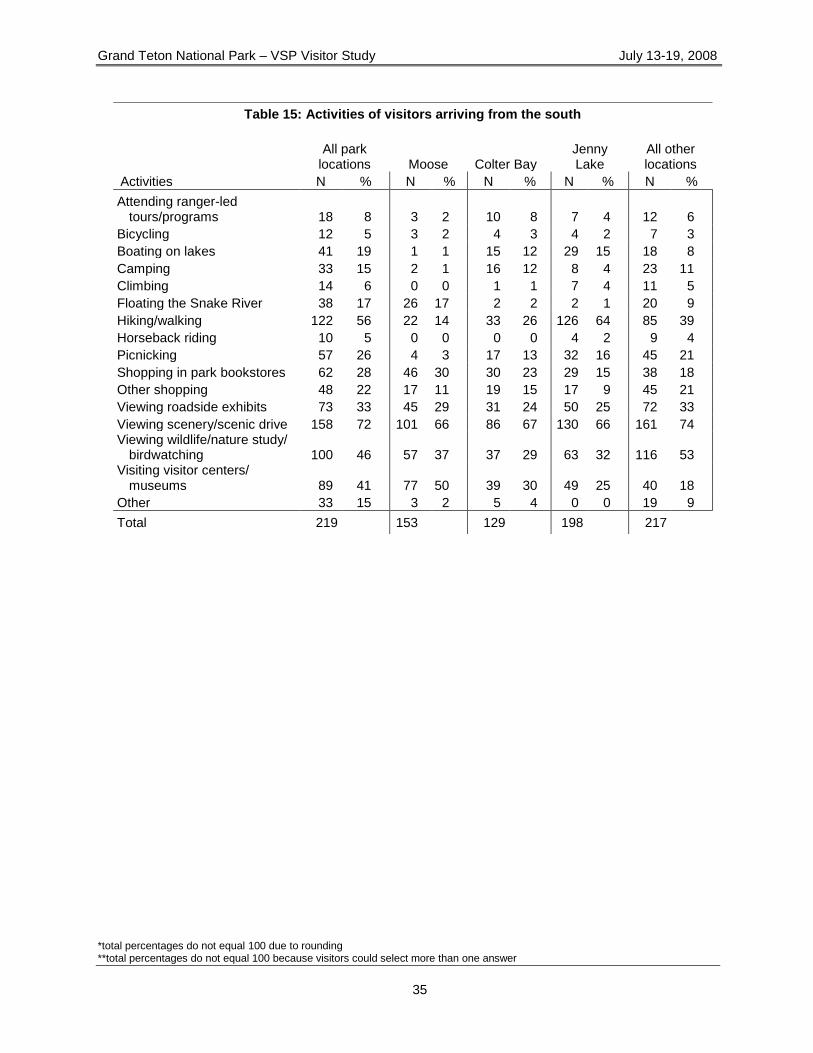
Sites visited and activities - visitors arriving from the south Results
As shown in Table 14, the most highly visited site by visitors arriving from the south was Jenny Lake (70%), followed by the Craig Thomas Discovery and Visitor Center at Moose (49%) and the Snake River (48%). Visitors coming from the south visited Colter Bay much less than did those from the north. Interestingly, visitors from the south were slightly more likely to visit the Jackson Lake Lodge.
Table 14: Sites visited by visitors arriving from the south
Site visited N %
Jenny Lake 213 70 Craig Thomas Discovery and
Visitor Center 150 49
Snake River 148 48
Jackson Lake Lodge 131 43
Colter Bay 130 42
Moose-Wilson Road 97 32
String Lake 74 24
Antelope Flats/Kelly Road 60 20
Laurance S. Rockefeller Preserve 56 18 Signal Mountain Lodge/Marina/
Campground 49 16
Flagg Ranch 47 15
Signal Mountain Summit Road 43 14
Menor's Ferry and Chapel 27 9
Cunningham Cabin 24 8
Two Ocean/Emma Matilda Lakes 13 4
Other 30 10
Total 306
Grand Teton National Park – VSP Visitor Study July 13-19, 2008
*total percentages do not equal 100 due to rounding **total percentages do not equal 100 because visitors could select more than one answer
35
Table 15: Activities of visitors arriving from the south
Activities
All park locations Moose Colter Bay
Jenny Lake
All other locations
N % N % N % N % N %
Attending ranger-led tours/programs 18 8 3 2 10 8 7 4 12 6
Bicycling 12 5 3 2 4 3 4 2 7 3
Boating on lakes 41 19 1 1 15 12 29 15 18 8
Camping 33 15 2 1 16 12 8 4 23 11
Climbing 14 6 0 0 1 1 7 4 11 5
Floating the Snake River 38 17 26 17 2 2 2 1 20 9
Hiking/walking 122 56 22 14 33 26 126 64 85 39
Horseback riding 10 5 0 0 0 0 4 2 9 4
Picnicking 57 26 4 3 17 13 32 16 45 21
Shopping in park bookstores 62 28 46 30 30 23 29 15 38 18
Other shopping 48 22 17 11 19 15 17 9 45 21
Viewing roadside exhibits 73 33 45 29 31 24 50 25 72 33
Viewing scenery/scenic drive 158 72 101 66 86 67 130 66 161 74 Viewing wildlife/nature study/
birdwatching 100 46 57 37 37 29 63 32 116 53 Visiting visitor centers/
museums 89 41 77 50 39 30 49 25 40 18
Other 33 15 3 2 5 4 0 0 19 9
Total 219 153 129 198 217
Grand Teton National Park – VSP Visitor Study July 13-19, 2008
*total percentages do not equal 100 due to rounding **total percentages do not equal 100 because visitors could select more than one answer
36
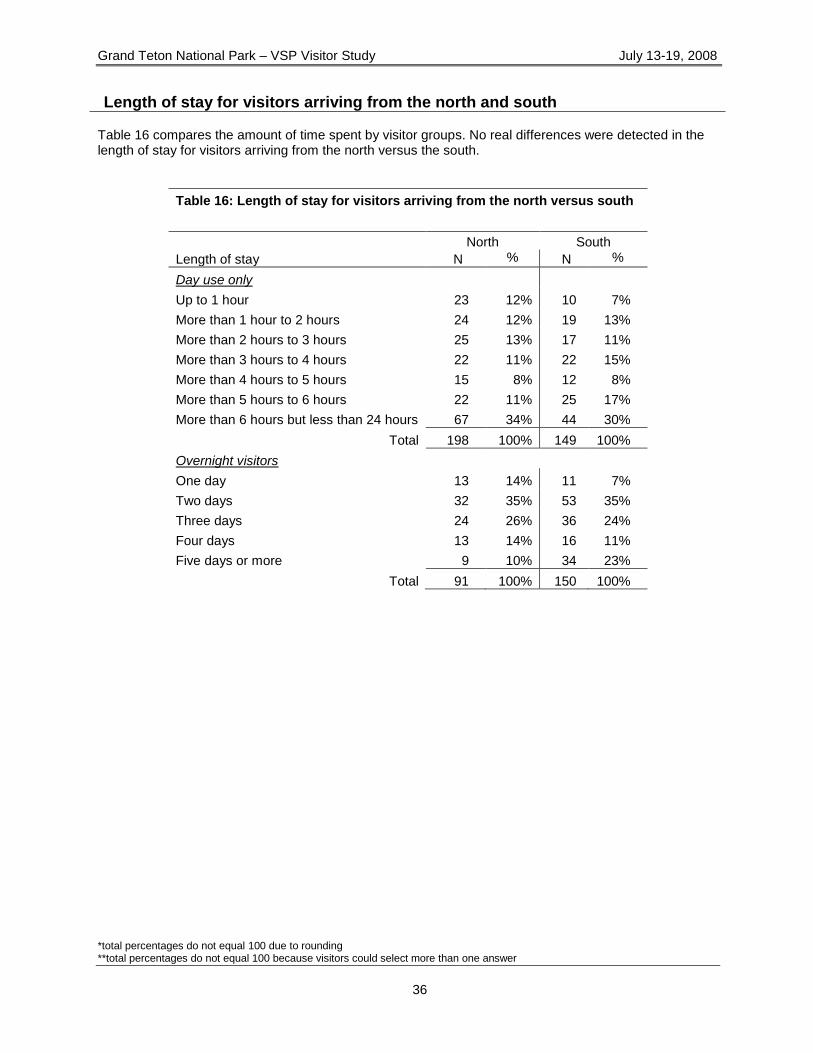
Length of stay for visitors arriving from the north and south Table 16 compares the amount of time spent by visitor groups. No real differences were detected in the length of stay for visitors arriving from the north versus the south.
Table 16: Length of stay for visitors arriving from the north versus south
North South
Length of stay N % N %
Day use only
Up to 1 hour 23 12% 10 7%
More than 1 hour to 2 hours 24 12% 19 13%
More than 2 hours to 3 hours 25 13% 17 11%
More than 3 hours to 4 hours 22 11% 22 15%
More than 4 hours to 5 hours 15 8% 12 8%
More than 5 hours to 6 hours 22 11% 25 17%
More than 6 hours but less than 24 hours 67 34% 44 30%
Total 198 100% 149 100%
Overnight visitors
One day 13 14% 11 7%
Two days 32 35% 53 35%
Three days 24 26% 36 24%
Four days 13 14% 16 11%
Five days or more 9 10% 34 23%
Total 91 100% 150 100%
Grand Teton National Park – VSP Visitor Study July 13-19, 2008
*total percentages do not equal 100 due to rounding **total percentages do not equal 100 because visitors could select more than one answer
37
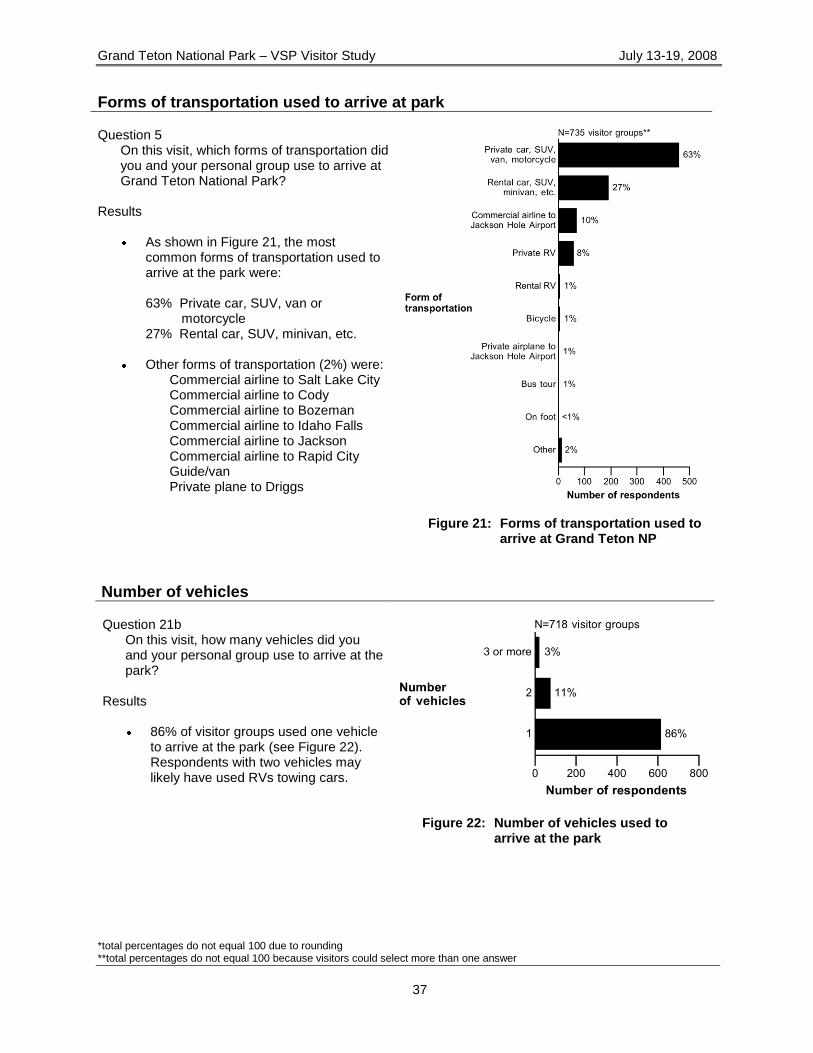
Forms of transportation used to arrive at park Question 5
On this visit, which forms of transportation did you and your personal group use to arrive at Grand Teton National Park?
Results
As shown in Figure 21, the most common forms of transportation used to arrive at the park were: 63% Private car, SUV, van or
motorcycle 27% Rental car, SUV, minivan, etc.
Other forms of transportation (2%) were: Commercial airline to Salt Lake City Commercial airline to Cody Commercial airline to Bozeman Commercial airline to Idaho Falls Commercial airline to Jackson Commercial airline to Rapid City Guide/van Private plane to Driggs
Figure 21: Forms of transportation used to
arrive at Grand Teton NP
Number of vehicles
Question 21b On this visit, how many vehicles did you and your personal group use to arrive at the park?
Results
86% of visitor groups used one vehicle to arrive at the park (see Figure 22). Respondents with two vehicles may likely have used RVs towing cars.
Figure 22: Number of vehicles used to
arrive at the park

Grand Teton National Park – VSP Visitor Study July 13-19, 2008
*total percentages do not equal 100 due to rounding **total percentages do not equal 100 because visitors could select more than one answer
38
Number of park entries
Question 6 On this trip, how many times did you and your personal group enter Grand Teton National Park?
Results
59% of visitor groups entered the park two or more times during their visit (see Figure 23).
41% entered the park once.
Comments Given the high number of multiple entries, Grand Teton NP may want to explore some sort of ―expedited‖ entry for repeat entries who have already paid the entrance fee and received park information. Such a system might be automated or a lane where a ranger simply checks entrance passes.
Figure 23: Number of park entries
Grand Teton National Park – VSP Visitor Study July 13-19, 2008
*total percentages do not equal 100 due to rounding **total percentages do not equal 100 because visitors could select more than one answer
39
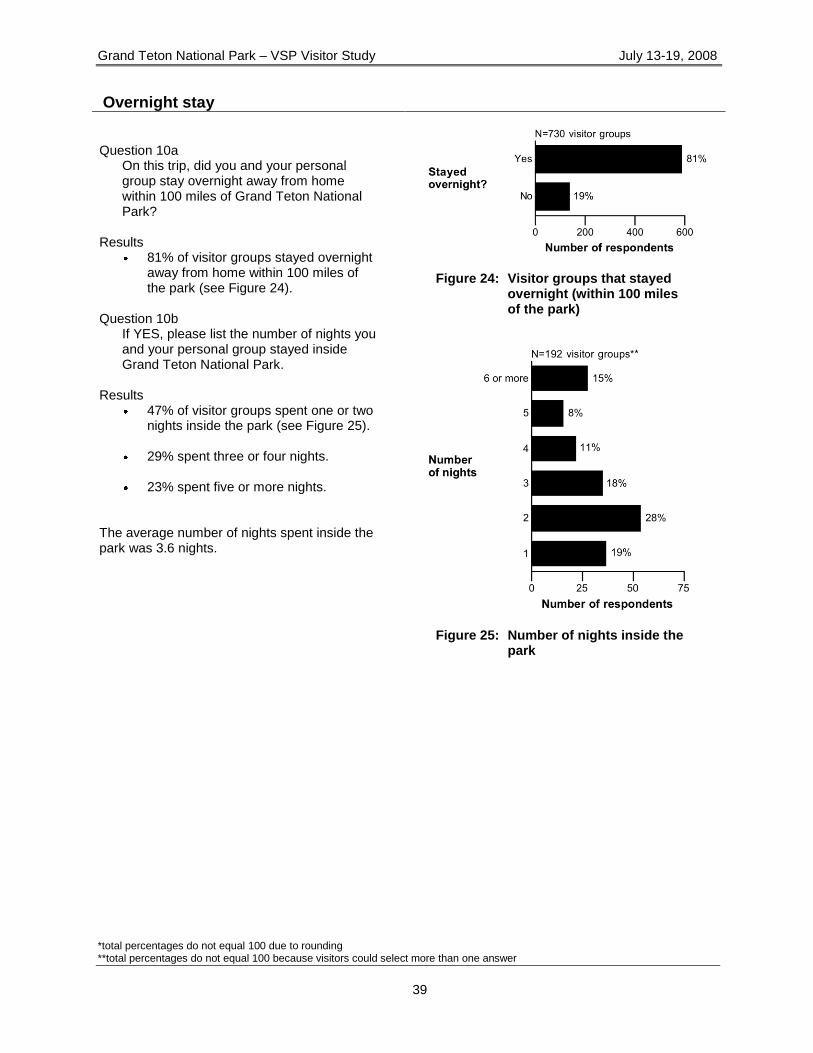
Overnight stay
Question 10a On this trip, did you and your personal group stay overnight away from home within 100 miles of Grand Teton National Park?
Results 81% of visitor groups stayed overnight
away from home within 100 miles of the park (see Figure 24).
Question 10b
If YES, please list the number of nights you and your personal group stayed inside Grand Teton National Park.
Results 47% of visitor groups spent one or two
nights inside the park (see Figure 25).
29% spent three or four nights.
23% spent five or more nights. The average number of nights spent inside the park was 3.6 nights.
Figure 24: Visitor groups that stayed
overnight (within 100 miles of the park)
Figure 25: Number of nights inside the
park
Grand Teton National Park – VSP Visitor Study July 13-19, 2008
*total percentages do not equal 100 due to rounding **total percentages do not equal 100 because visitors could select more than one answer
40
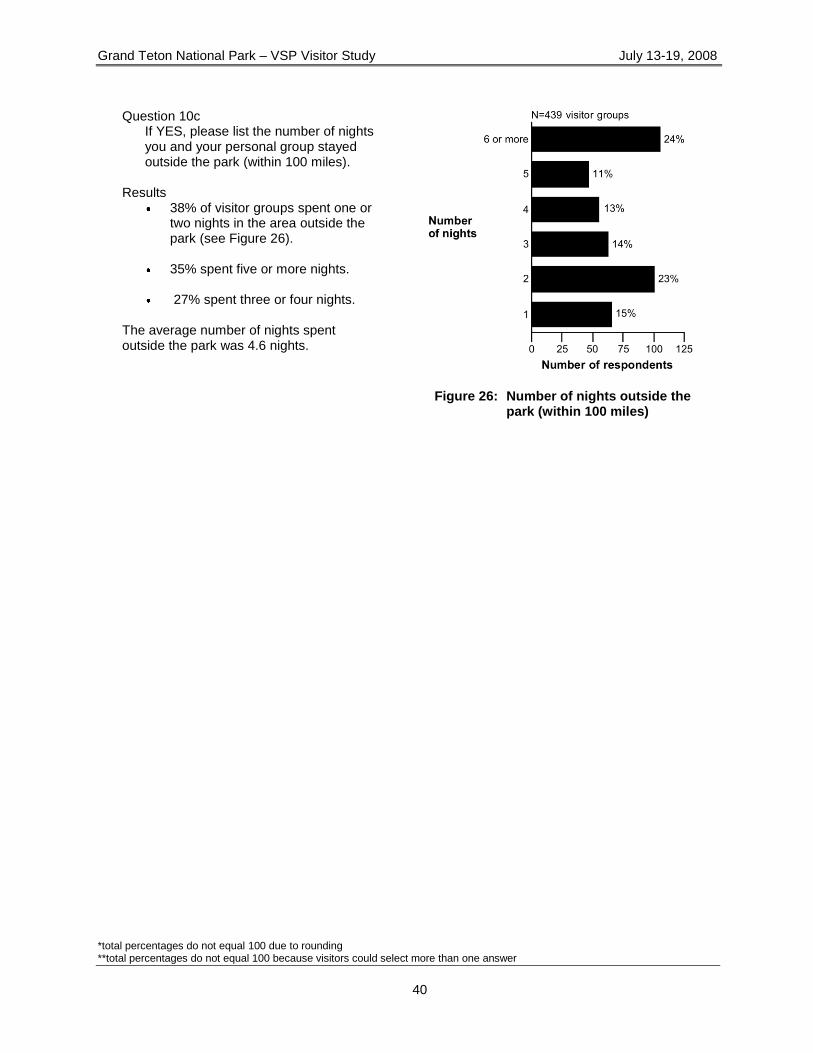
Question 10c
If YES, please list the number of nights you and your personal group stayed outside the park (within 100 miles).
Results
38% of visitor groups spent one or two nights in the area outside the park (see Figure 26).
35% spent five or more nights.
27% spent three or four nights. The average number of nights spent outside the park was 4.6 nights.
Figure 26: Number of nights outside the
park (within 100 miles)

Grand Teton National Park – VSP Visitor Study July 13-19, 2008
*total percentages do not equal 100 due to rounding **total percentages do not equal 100 because visitors could select more than one answer
41
Accommodations inside the park
Question 10b In what types of accommodations did you and your personal group spend the night(s) inside the park?
Results
52% of visitor groups stayed in a lodge, motel, cabin, rented condo/home, bed & breakfast inside the park (see Figure 27). Lodging locations in the park were:
Climbers Ranch Colter Bay Dornan's cabins Flagg Ranch Jackson Lake Lodge Jenny Lake Lodge Signal Mountain
42% camped in a developed
campground inside the park. Camping locations in the park were:
Colter Bay Gros Ventre Flagg Ranch Signal Mountain Jenny Lake Lizard Creek
―Other‖ accommodations (3%) in the park were:
Leigh Lake Pendagraph Meadow
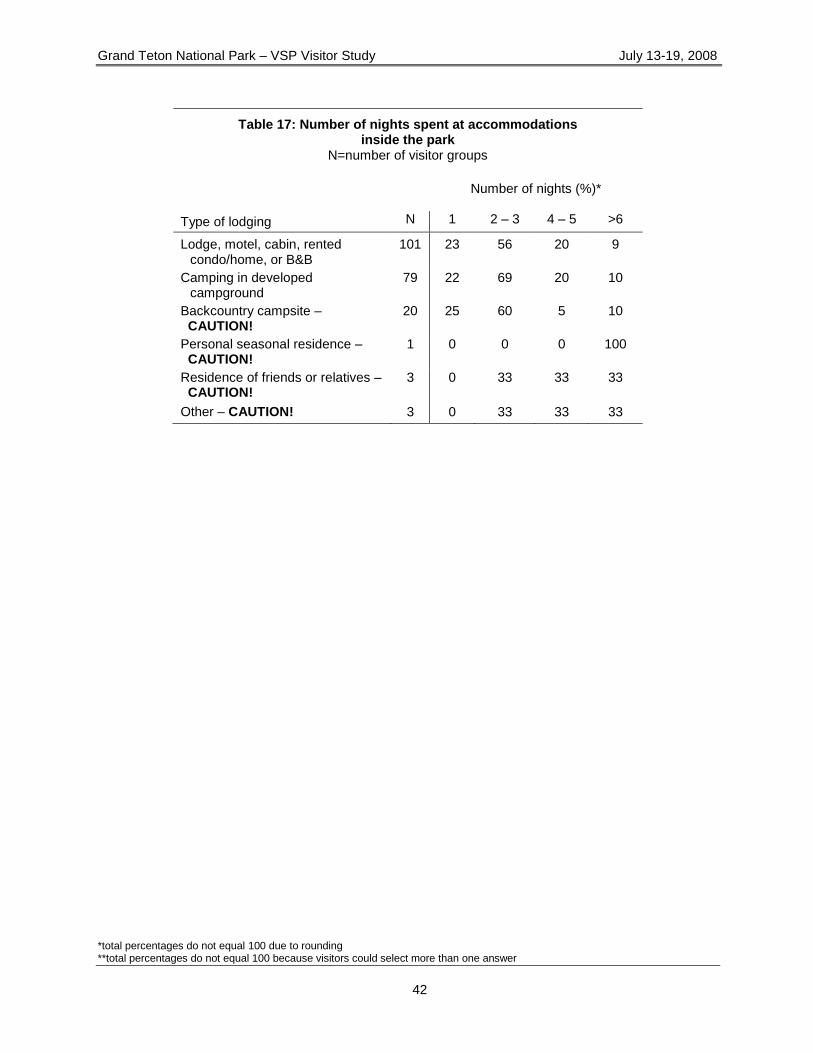
Table 17 shows the number of nights visitor groups stayed at each type of accommodation inside the park.
Figure 27: Types of accommodations
used inside the park
Grand Teton National Park – VSP Visitor Study July 13-19, 2008
*total percentages do not equal 100 due to rounding **total percentages do not equal 100 because visitors could select more than one answer
42
Table 17: Number of nights spent at accommodations inside the park
N=number of visitor groups
Number of nights (%)*
Type of lodging N 1 2 – 3 4 – 5 >6
Lodge, motel, cabin, rented condo/home, or B&B
101 23 56 20 9
Camping in developed campground
79 22 69 20 10
Backcountry campsite – CAUTION!
20 25 60 5 10
Personal seasonal residence – CAUTION!
1 0 0 0 100
Residence of friends or relatives – CAUTION!
3 0 33 33 33
Other – CAUTION! 3 0 33 33 33
Grand Teton National Park – VSP Visitor Study July 13-19, 2008
*total percentages do not equal 100 due to rounding **total percentages do not equal 100 because visitors could select more than one answer
43
Accommodations outside the park
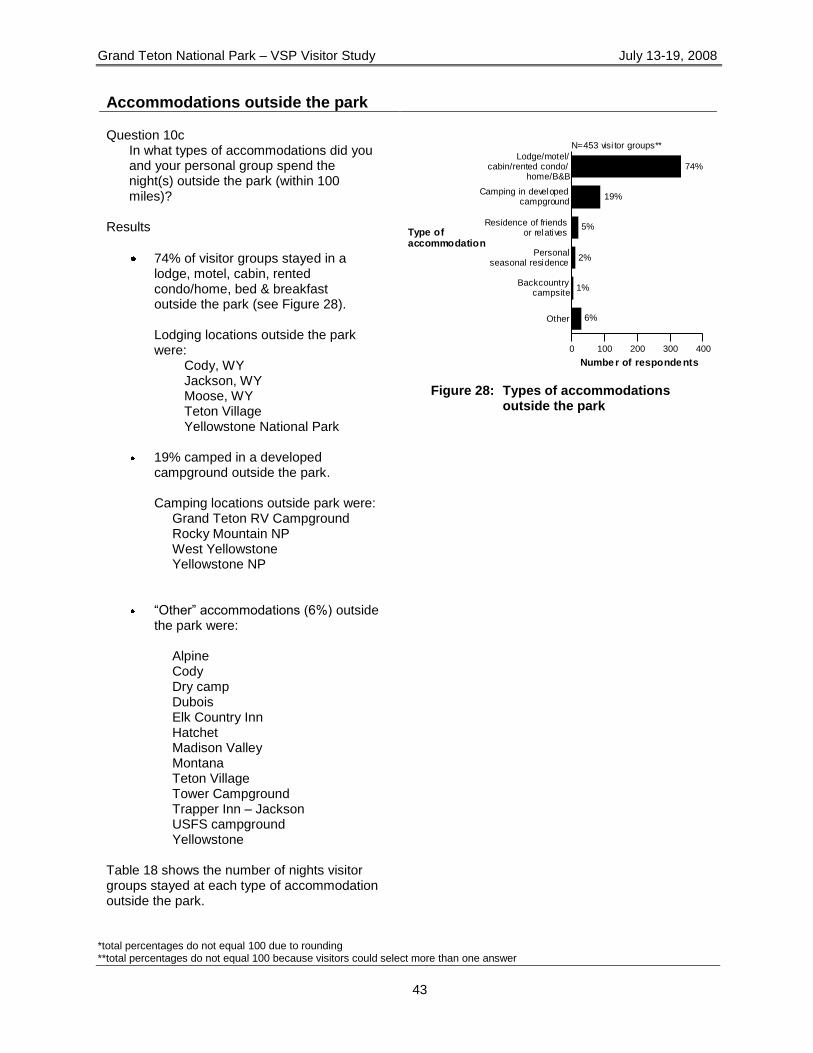
Question 10c In what types of accommodations did you and your personal group spend the night(s) outside the park (within 100 miles)?
Results
74% of visitor groups stayed in a lodge, motel, cabin, rented condo/home, bed & breakfast outside the park (see Figure 28). Lodging locations outside the park were:
Cody, WY Jackson, WY Moose, WY Teton Village Yellowstone National Park
19% camped in a developed
campground outside the park. Camping locations outside park were:
Grand Teton RV Campground Rocky Mountain NP West Yellowstone Yellowstone NP
―Other‖ accommodations (6%) outside the park were:
Alpine Cody Dry camp Dubois Elk Country Inn Hatchet Madison Valley Montana Teton Village Tower Campground Trapper Inn – Jackson USFS campground Yellowstone
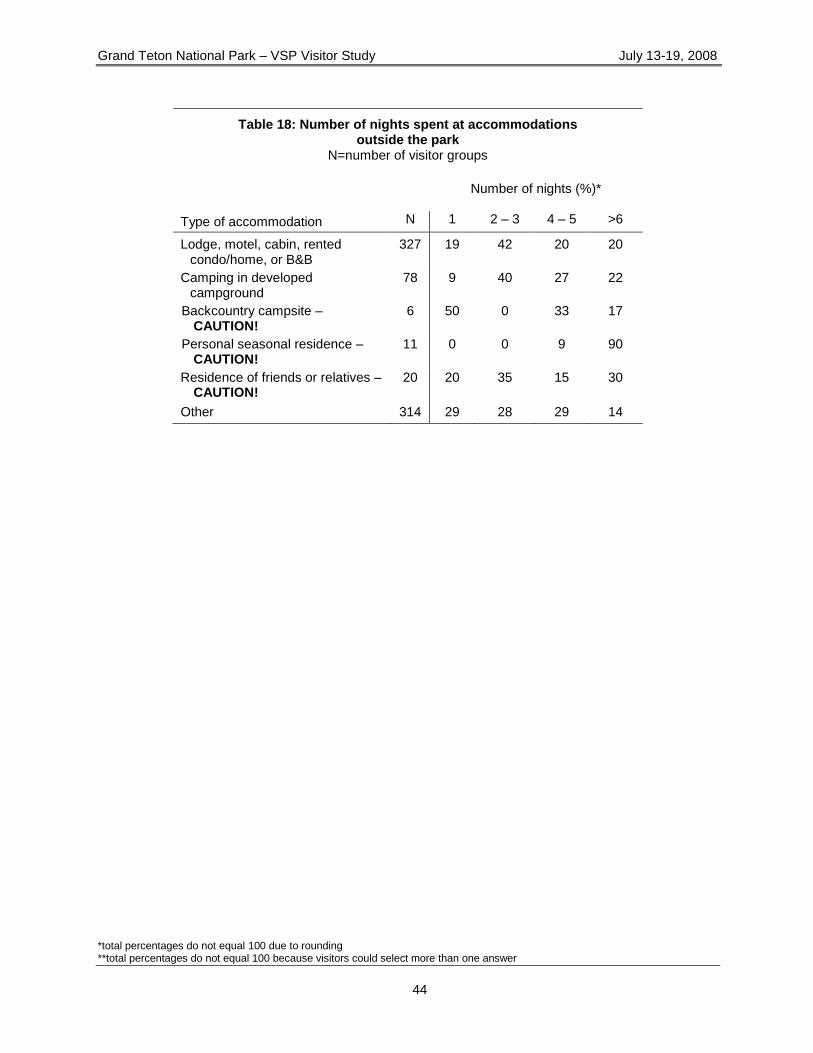
Table 18 shows the number of nights visitor groups stayed at each type of accommodation outside the park.
0 100 200 300 400
Numbe r of responde nts
Other
Backcountrycampsite
Personalseasonal residence
Residence of friendsor relatives
Camping in developedcampground
Lodge/motel/cabin/rented condo/
home/B&B
6%
1%
2%
5%
19%
74%
N=453 visi tor groups**
Type ofaccommodation
Figure 28: Types of accommodations
outside the park
Grand Teton National Park – VSP Visitor Study July 13-19, 2008
*total percentages do not equal 100 due to rounding **total percentages do not equal 100 because visitors could select more than one answer
44
Table 18: Number of nights spent at accommodations outside the park
N=number of visitor groups
Number of nights (%)*
Type of accommodation N 1 2 – 3 4 – 5 >6
Lodge, motel, cabin, rented condo/home, or B&B
327 19 42 20 20
Camping in developed campground
78 9 40 27 22
Backcountry campsite – CAUTION!
6 50 0 33 17
Personal seasonal residence – CAUTION!
11 0 0 9 90
Residence of friends or relatives – CAUTION!
20 20 35 15 30
Other 314 29 28 29 14
Grand Teton National Park – VSP Visitor Study July 13-19, 2008
*total percentages do not equal 100 due to rounding **total percentages do not equal 100 because visitors could select more than one answer
45
Length of stay in the park
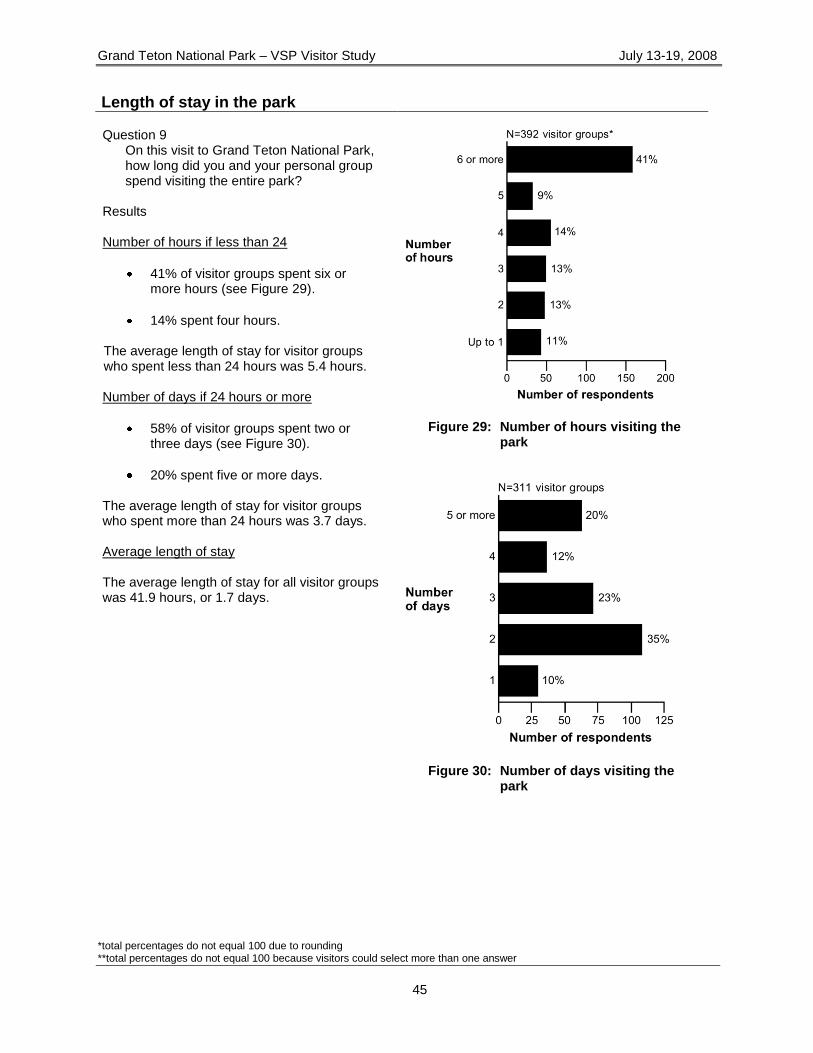
Question 9 On this visit to Grand Teton National Park, how long did you and your personal group spend visiting the entire park?
Results Number of hours if less than 24
41% of visitor groups spent six or more hours (see Figure 29).
14% spent four hours.
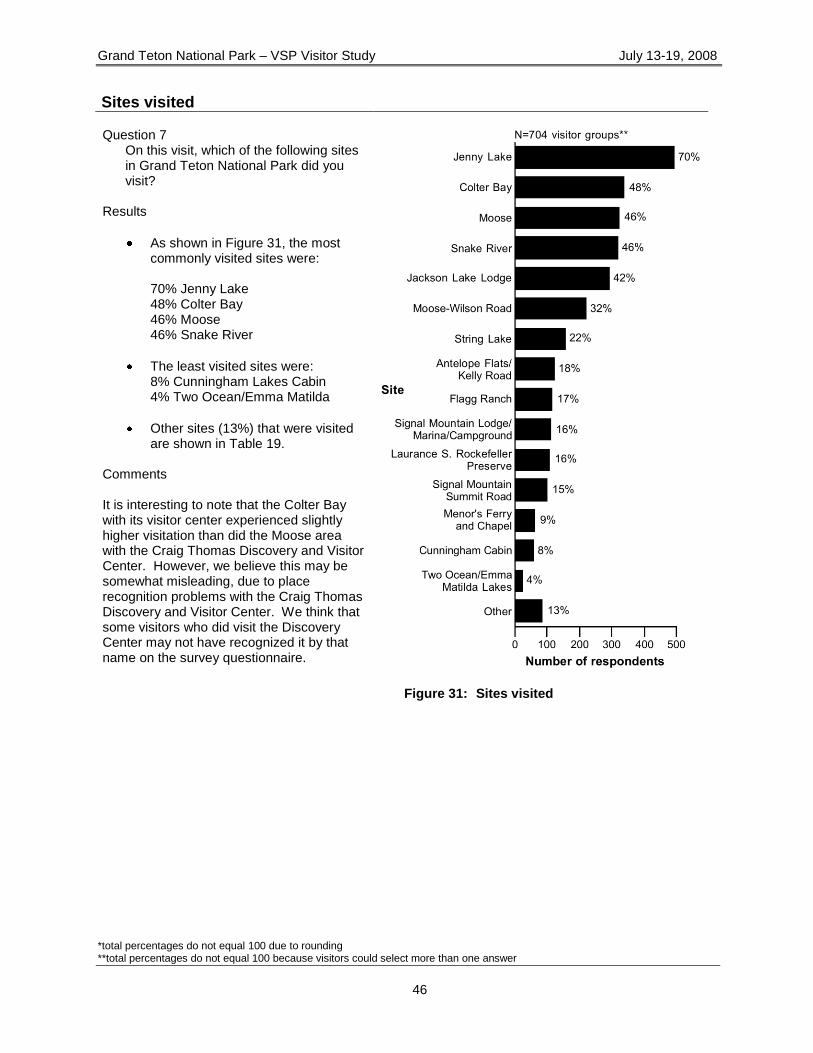
The average length of stay for visitor groups who spent less than 24 hours was 5.4 hours. Number of days if 24 hours or more
58% of visitor groups spent two or three days (see Figure 30).
20% spent five or more days.
The average length of stay for visitor groups who spent more than 24 hours was 3.7 days. Average length of stay The average length of stay for all visitor groups was 41.9 hours, or 1.7 days.
Figure 29: Number of hours visiting the
park
Figure 30: Number of days visiting the
park
Grand Teton National Park – VSP Visitor Study July 13-19, 2008
*total percentages do not equal 100 due to rounding **total percentages do not equal 100 because visitors could select more than one answer
46
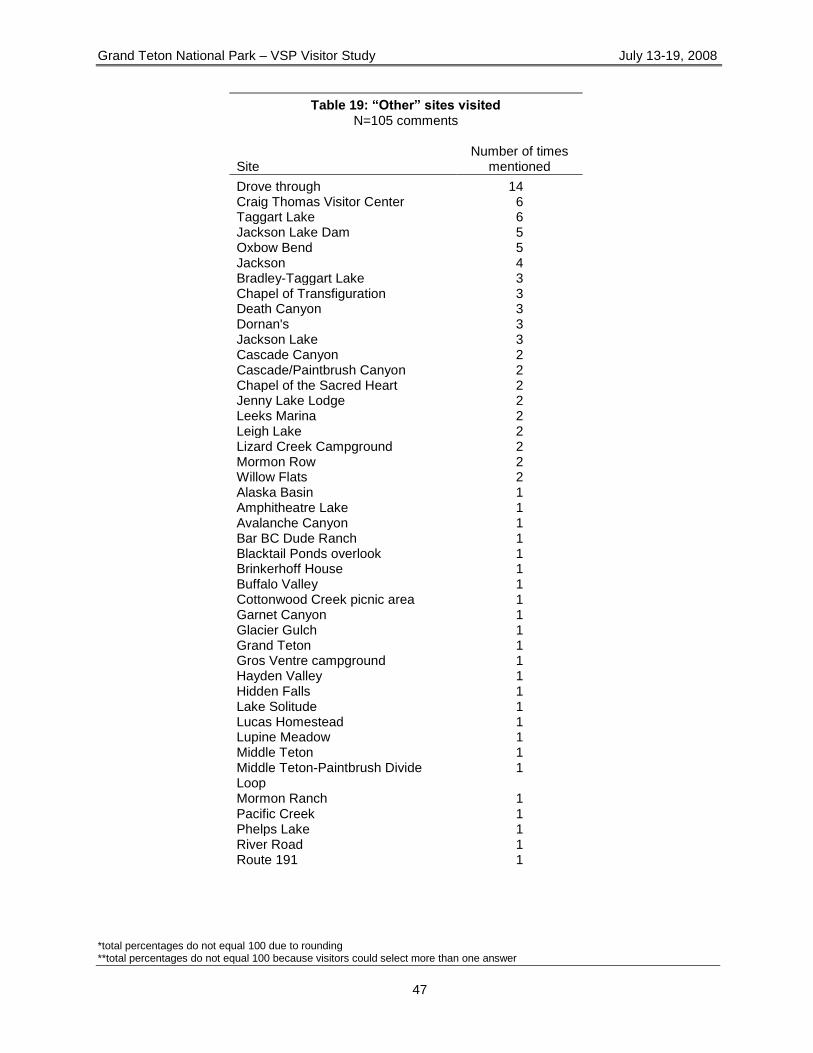
Sites visited
Question 7 On this visit, which of the following sites in Grand Teton National Park did you visit?
Results
As shown in Figure 31, the most commonly visited sites were: 70% Jenny Lake 48% Colter Bay 46% Moose 46% Snake River
The least visited sites were: 8% Cunningham Lakes Cabin 4% Two Ocean/Emma Matilda
Other sites (13%) that were visited are shown in Table 19.
Comments It is interesting to note that the Colter Bay with its visitor center experienced slightly higher visitation than did the Moose area with the Craig Thomas Discovery and Visitor Center. However, we believe this may be somewhat misleading, due to place recognition problems with the Craig Thomas Discovery and Visitor Center. We think that some visitors who did visit the Discovery Center may not have recognized it by that name on the survey questionnaire.
Figure 31: Sites visited
Grand Teton National Park – VSP Visitor Study July 13-19, 2008
*total percentages do not equal 100 due to rounding **total percentages do not equal 100 because visitors could select more than one answer
47
Table 19: “Other” sites visited N=105 comments
Site
Number of times mentioned
Drove through 14 Craig Thomas Visitor Center 6 Taggart Lake 6 Jackson Lake Dam 5 Oxbow Bend 5 Jackson 4 Bradley-Taggart Lake 3 Chapel of Transfiguration 3 Death Canyon 3 Dornan's 3 Jackson Lake 3 Cascade Canyon 2 Cascade/Paintbrush Canyon 2 Chapel of the Sacred Heart 2 Jenny Lake Lodge 2 Leeks Marina 2 Leigh Lake 2 Lizard Creek Campground 2 Mormon Row 2 Willow Flats 2 Alaska Basin 1 Amphitheatre Lake 1 Avalanche Canyon 1 Bar BC Dude Ranch 1 Blacktail Ponds overlook 1 Brinkerhoff House 1 Buffalo Valley 1 Cottonwood Creek picnic area 1 Garnet Canyon 1 Glacier Gulch 1 Grand Teton 1 Gros Ventre campground 1 Hayden Valley 1 Hidden Falls 1 Lake Solitude 1 Lucas Homestead 1 Lupine Meadow 1 Middle Teton 1 Middle Teton-Paintbrush Divide Loop
1
Mormon Ranch 1 Pacific Creek 1 Phelps Lake 1 River Road 1 Route 191 1
Grand Teton National Park – VSP Visitor Study July 13-19, 2008
*total percentages do not equal 100 due to rounding **total percentages do not equal 100 because visitors could select more than one answer
48
Table 19: “Other” sites visited (continued)
Site
Number of times mentioned
Schwabacher's Landing 1 Spread Creek 1 Teewinot 1 Teton Village 1 Two Ocean Road 1 Wilderness area 1
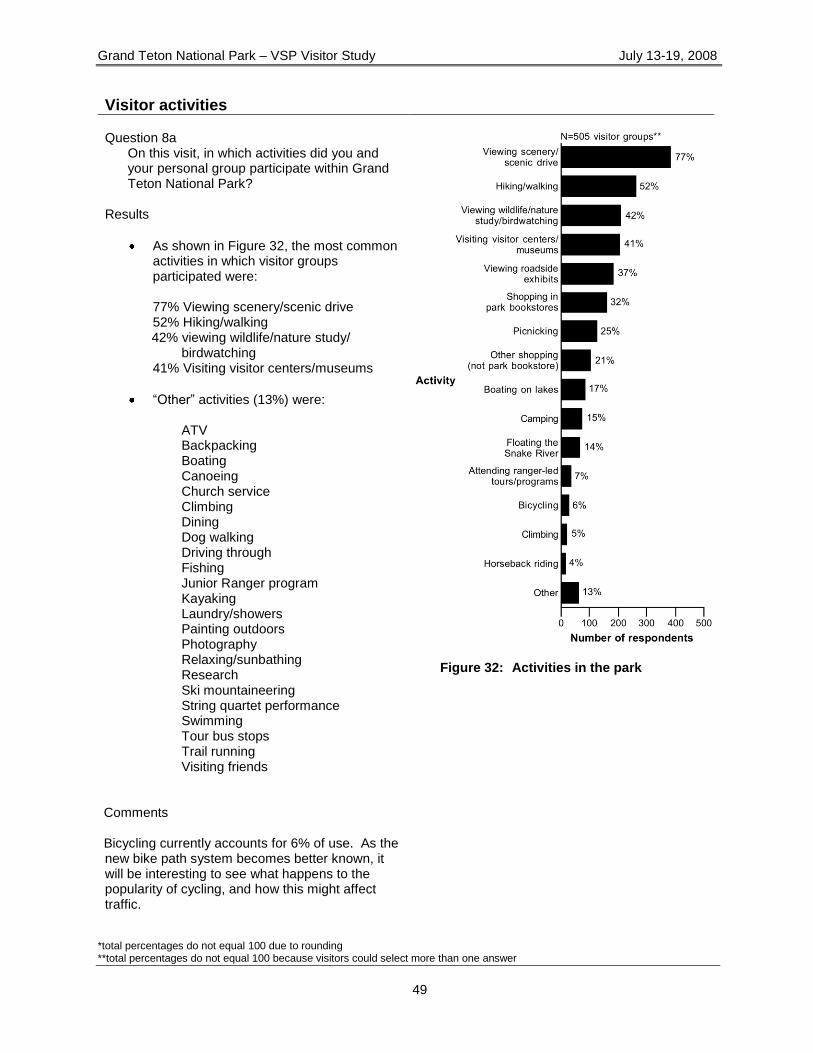
Grand Teton National Park – VSP Visitor Study July 13-19, 2008
*total percentages do not equal 100 due to rounding **total percentages do not equal 100 because visitors could select more than one answer
49
Visitor activities Question 8a
On this visit, in which activities did you and your personal group participate within Grand Teton National Park?
Results
As shown in Figure 32, the most common activities in which visitor groups participated were: 77% Viewing scenery/scenic drive 52% Hiking/walking 42% viewing wildlife/nature study/
birdwatching 41% Visiting visitor centers/museums
―Other‖ activities (13%) were:
ATV Backpacking Boating Canoeing Church service Climbing Dining Dog walking Driving through Fishing Junior Ranger program Kayaking Laundry/showers Painting outdoors Photography Relaxing/sunbathing Research Ski mountaineering String quartet performance Swimming Tour bus stops Trail running Visiting friends
Comments Bicycling currently accounts for 6% of use. As the new bike path system becomes better known, it will be interesting to see what happens to the popularity of cycling, and how this might affect traffic.
Figure 32: Activities in the park
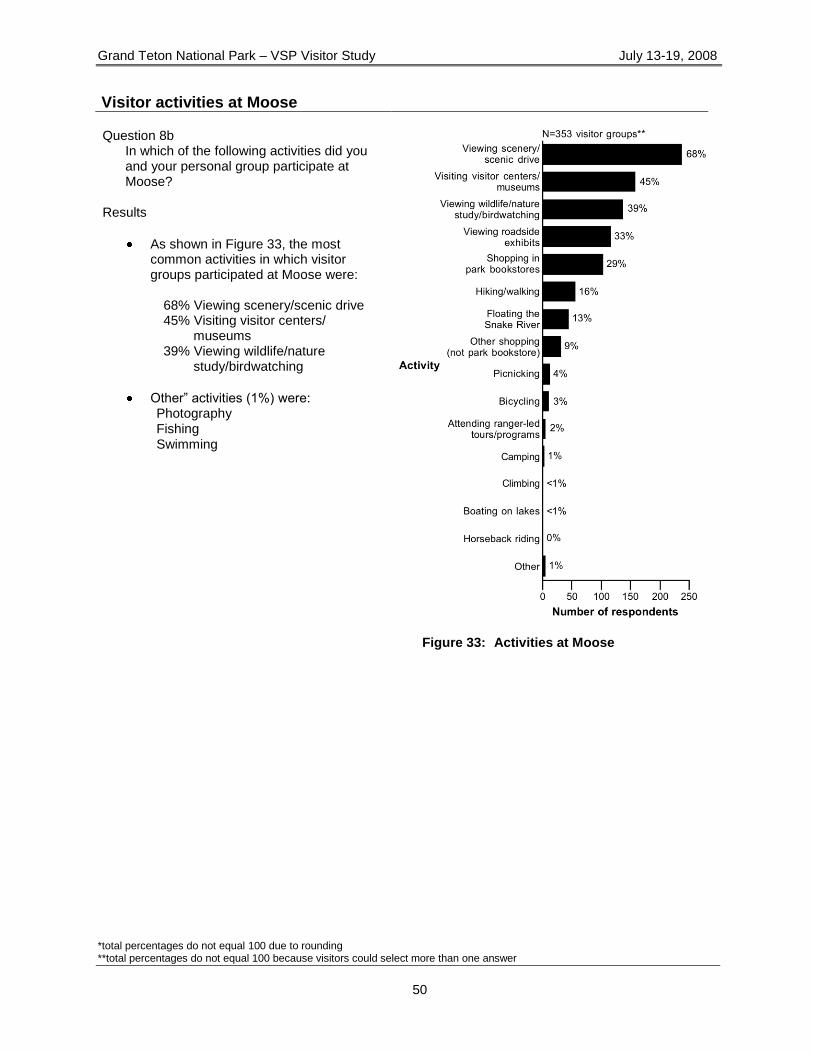
Grand Teton National Park – VSP Visitor Study July 13-19, 2008
*total percentages do not equal 100 due to rounding **total percentages do not equal 100 because visitors could select more than one answer
50
Visitor activities at Moose
Question 8b In which of the following activities did you and your personal group participate at Moose?
Results
As shown in Figure 33, the most common activities in which visitor groups participated at Moose were:
68% Viewing scenery/scenic drive 45% Visiting visitor centers/
museums 39% Viewing wildlife/nature
study/birdwatching
Other‖ activities (1%) were: Photography Fishing Swimming
Figure 33: Activities at Moose
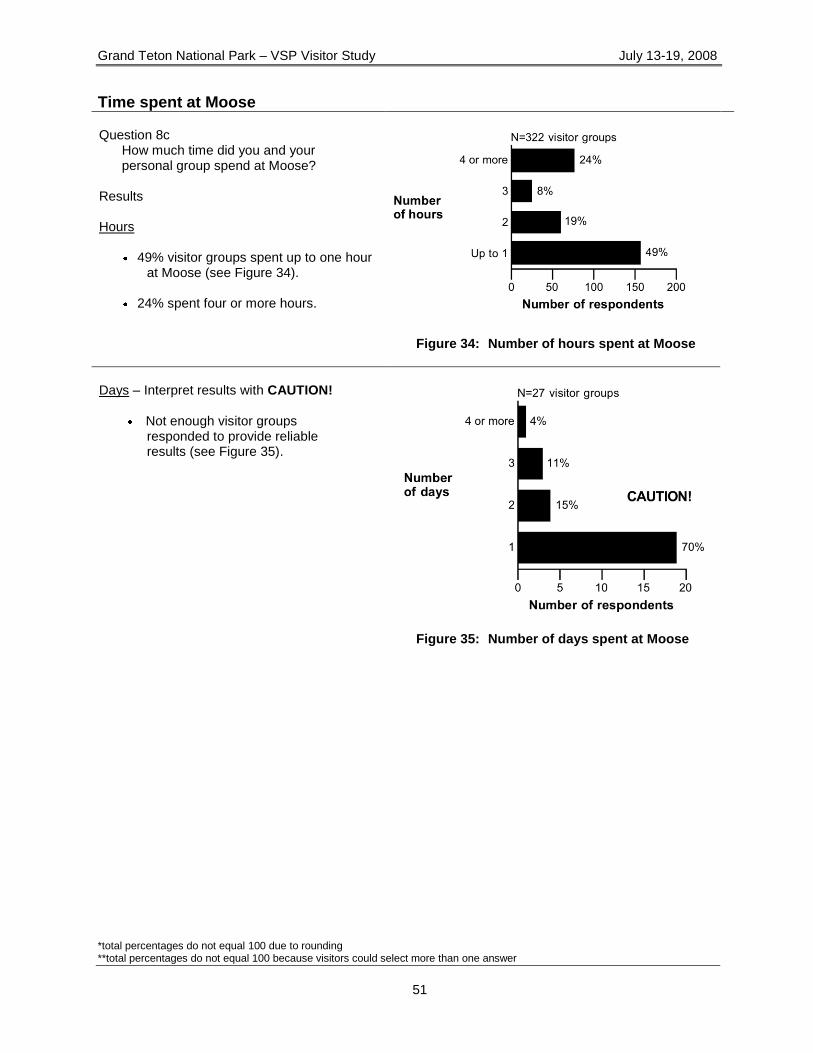
Grand Teton National Park – VSP Visitor Study July 13-19, 2008
*total percentages do not equal 100 due to rounding **total percentages do not equal 100 because visitors could select more than one answer
51
Time spent at Moose Question 8c
How much time did you and your personal group spend at Moose?
Results Hours
49% visitor groups spent up to one hour at Moose (see Figure 34).
24% spent four or more hours.
Figure 34: Number of hours spent at Moose
Days – Interpret results with CAUTION!
Not enough visitor groups responded to provide reliable results (see Figure 35).
Figure 35: Number of days spent at Moose

Grand Teton National Park – VSP Visitor Study July 13-19, 2008
*total percentages do not equal 100 due to rounding **total percentages do not equal 100 because visitors could select more than one answer
52
Visitor activities at Colter Bay
Question 8b In which of the following activities did you and your personal group participate at Colter Bay?
Results As shown in Figure 36, the most
common activities in which visitor groups participated at Colter Bay were:
65% Viewing scenery/scenic drive
39% Visiting visitor centers/museums
36% Viewing wildlife/nature study/ birdwatching
―Other‖ activities (3%) in which visitor
groups participated were:
Swimming Dining Fishing Laundry/showers Relaxing/Sunbathing Restaurant String quartet performance Visiting friends
Figure 36: Activities at Colter Bay
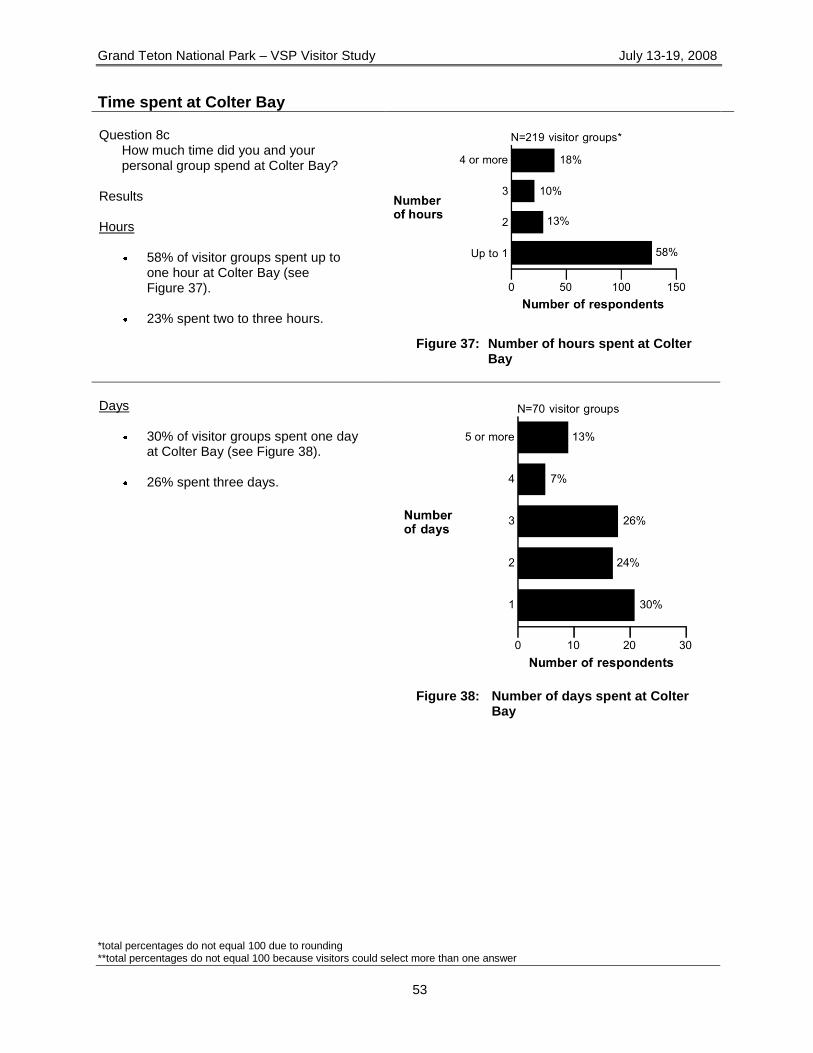
Grand Teton National Park – VSP Visitor Study July 13-19, 2008
*total percentages do not equal 100 due to rounding **total percentages do not equal 100 because visitors could select more than one answer
53
Time spent at Colter Bay Question 8c
How much time did you and your personal group spend at Colter Bay?
Results Hours
58% of visitor groups spent up to one hour at Colter Bay (see Figure 37).
23% spent two to three hours.
Figure 37: Number of hours spent at Colter Bay
Days
30% of visitor groups spent one day at Colter Bay (see Figure 38).
26% spent three days.
Figure 38: Number of days spent at Colter
Bay
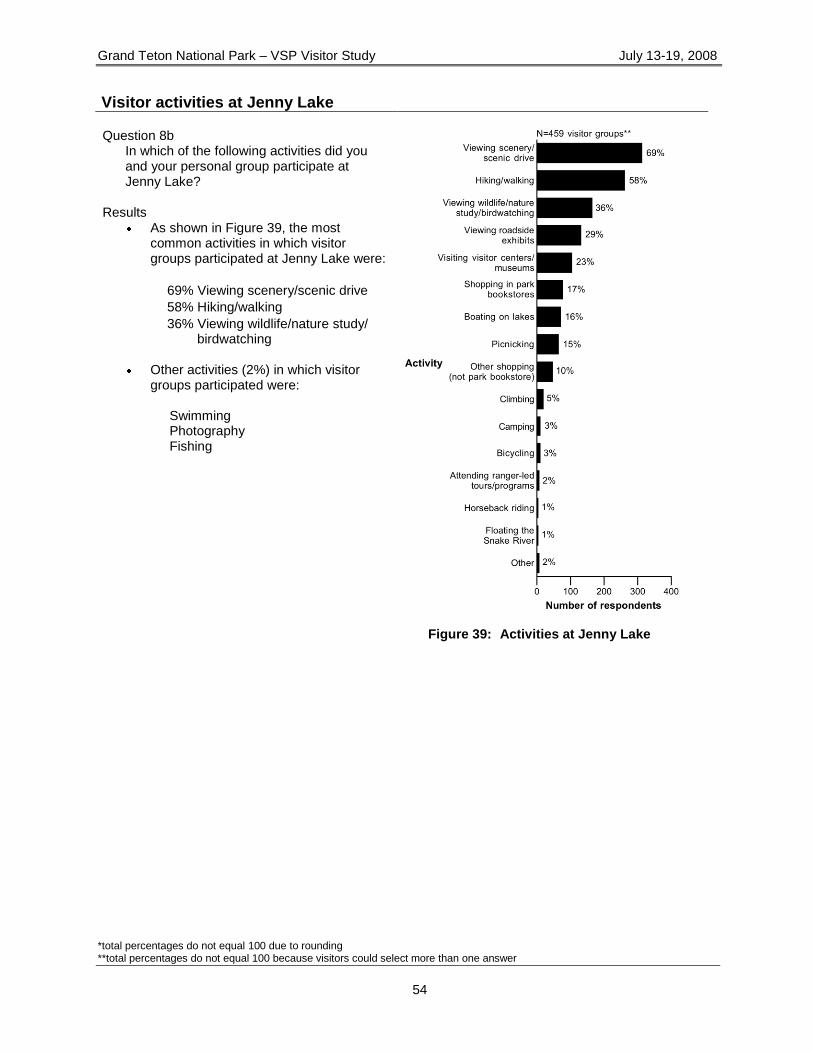
Grand Teton National Park – VSP Visitor Study July 13-19, 2008
*total percentages do not equal 100 due to rounding **total percentages do not equal 100 because visitors could select more than one answer
54
Visitor activities at Jenny Lake
Question 8b In which of the following activities did you and your personal group participate at Jenny Lake?
Results As shown in Figure 39, the most
common activities in which visitor groups participated at Jenny Lake were:
69% Viewing scenery/scenic drive
58% Hiking/walking
36% Viewing wildlife/nature study/ birdwatching
Other activities (2%) in which visitor
groups participated were: Swimming Photography Fishing
Figure 39: Activities at Jenny Lake
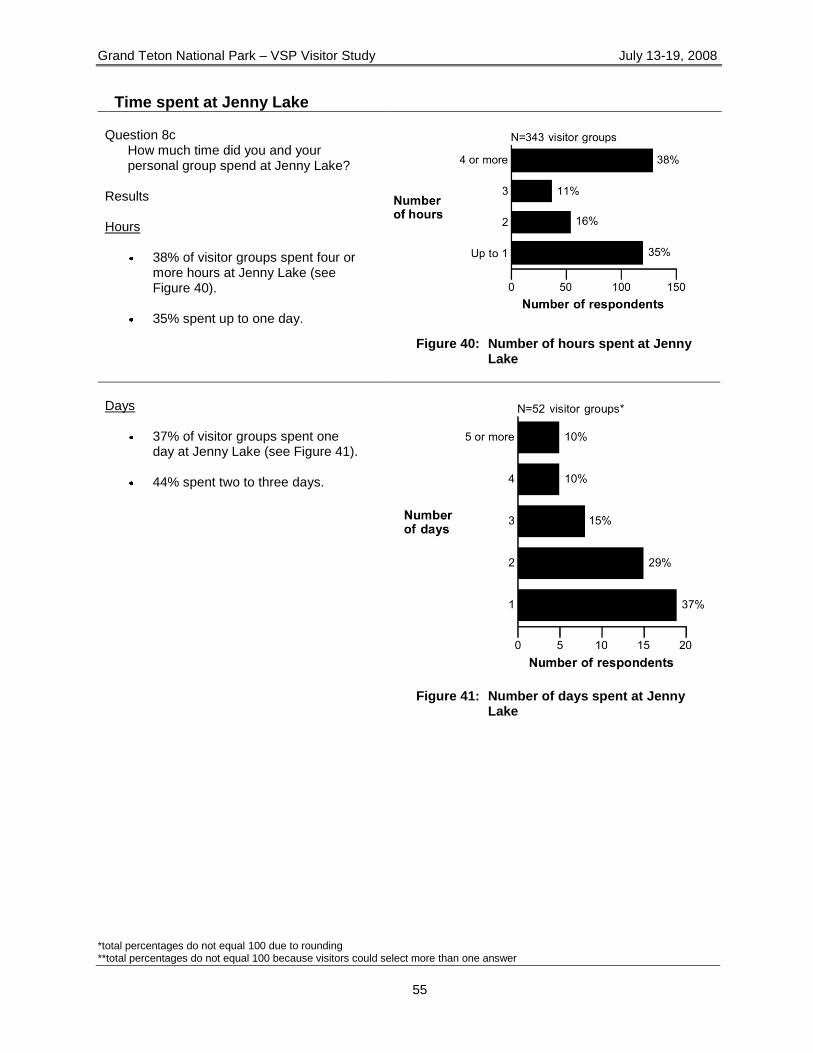
Grand Teton National Park – VSP Visitor Study July 13-19, 2008
*total percentages do not equal 100 due to rounding **total percentages do not equal 100 because visitors could select more than one answer
55
Time spent at Jenny Lake Question 8c
How much time did you and your personal group spend at Jenny Lake?
Results Hours
38% of visitor groups spent four or more hours at Jenny Lake (see Figure 40).
35% spent up to one day.
Figure 40: Number of hours spent at Jenny Lake
Days
37% of visitor groups spent one day at Jenny Lake (see Figure 41).
44% spent two to three days.
Figure 41: Number of days spent at Jenny
Lake
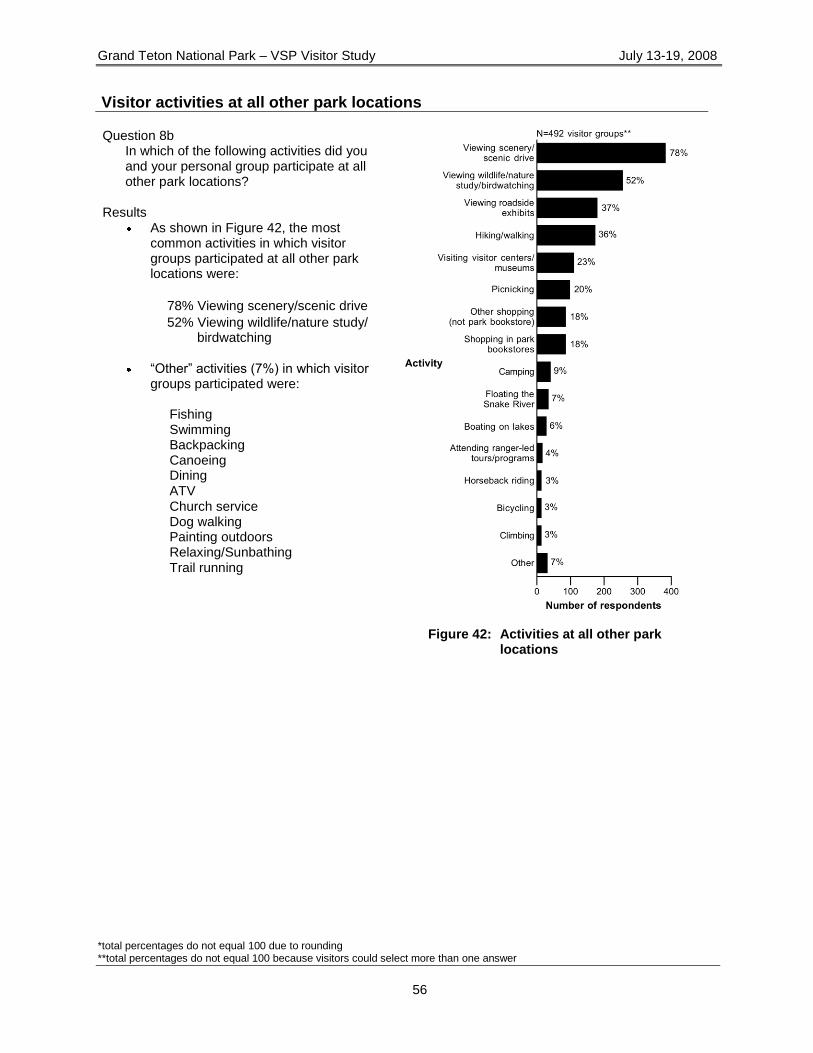
Grand Teton National Park – VSP Visitor Study July 13-19, 2008
*total percentages do not equal 100 due to rounding **total percentages do not equal 100 because visitors could select more than one answer
56
Visitor activities at all other park locations
Question 8b In which of the following activities did you and your personal group participate at all other park locations?
Results As shown in Figure 42, the most
common activities in which visitor groups participated at all other park locations were:
78% Viewing scenery/scenic drive
52% Viewing wildlife/nature study/ birdwatching
―Other‖ activities (7%) in which visitor
groups participated were:
Fishing Swimming Backpacking Canoeing Dining ATV Church service Dog walking Painting outdoors Relaxing/Sunbathing Trail running
Figure 42: Activities at all other park
locations
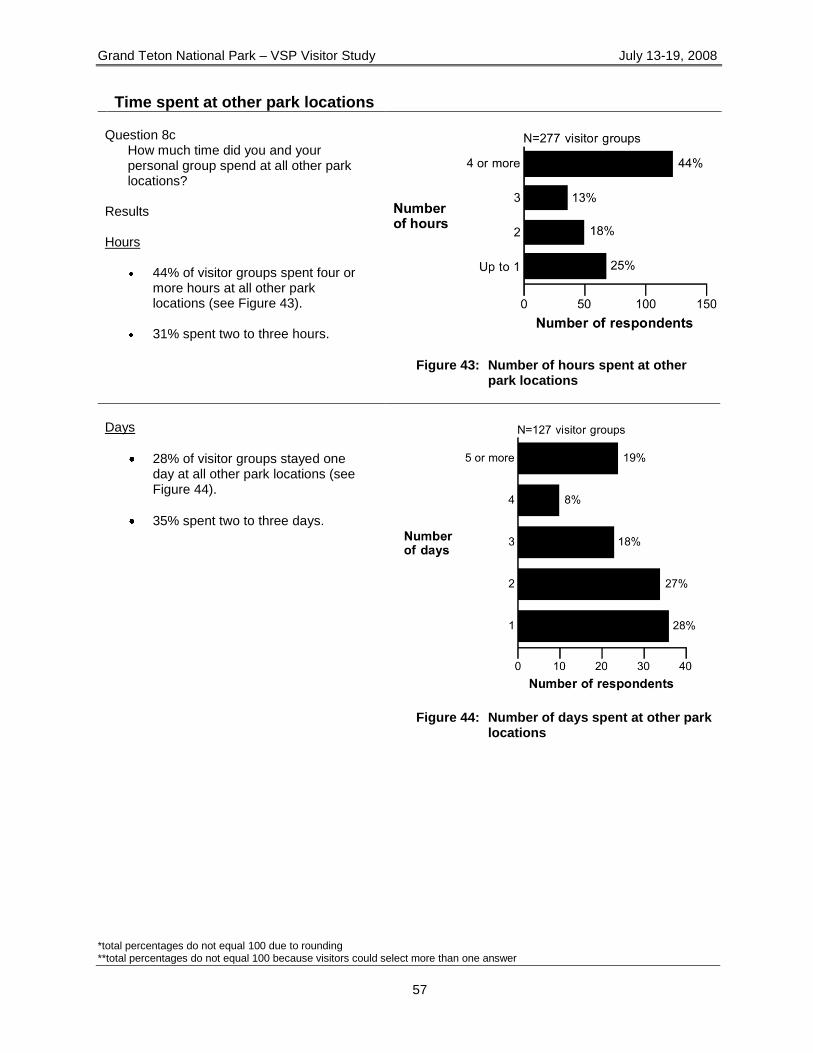
Grand Teton National Park – VSP Visitor Study July 13-19, 2008
*total percentages do not equal 100 due to rounding **total percentages do not equal 100 because visitors could select more than one answer
57
Time spent at other park locations Question 8c
How much time did you and your personal group spend at all other park locations?
Results Hours
44% of visitor groups spent four or more hours at all other park locations (see Figure 43).
31% spent two to three hours.
Figure 43: Number of hours spent at other park locations
Days
28% of visitor groups stayed one day at all other park locations (see Figure 44).
35% spent two to three days.
Figure 44: Number of days spent at other park
locations
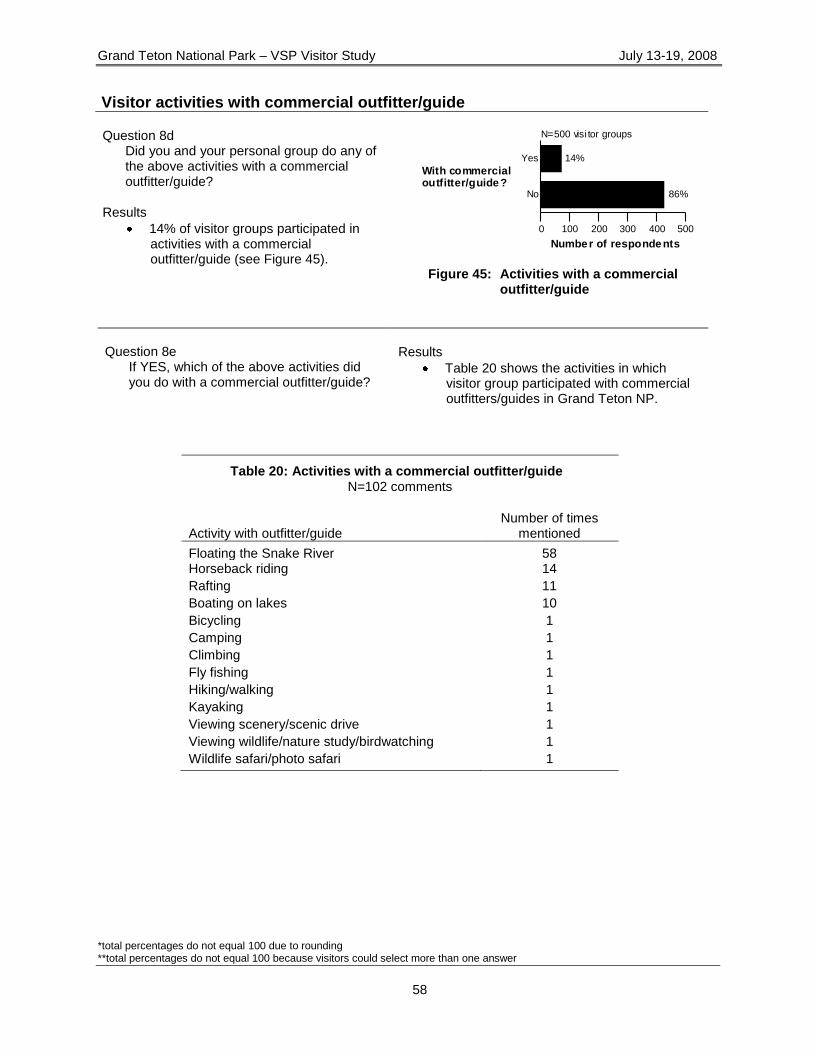
Grand Teton National Park – VSP Visitor Study July 13-19, 2008
*total percentages do not equal 100 due to rounding **total percentages do not equal 100 because visitors could select more than one answer
58
Visitor activities with commercial outfitter/guide
Question 8d Did you and your personal group do any of the above activities with a commercial outfitter/guide?
Results
14% of visitor groups participated in activities with a commercial outfitter/guide (see Figure 45).
0 100 200 300 400 500
Numbe r of responde nts
No
Yes
86%
14%
N=500 visi tor groups
With commercialoutfitter/guide ?
Figure 45: Activities with a commercial
outfitter/guide
Question 8e
If YES, which of the above activities did you do with a commercial outfitter/guide?
Results
Table 20 shows the activities in which visitor group participated with commercial outfitters/guides in Grand Teton NP.
Table 20: Activities with a commercial outfitter/guide N=102 comments
Activity with outfitter/guide Number of times
mentioned
Floating the Snake River 58 Horseback riding 14
Rafting 11
Boating on lakes 10
Bicycling 1
Camping 1
Climbing 1
Fly fishing 1
Hiking/walking 1
Kayaking 1
Viewing scenery/scenic drive 1
Viewing wildlife/nature study/birdwatching 1
Wildlife safari/photo safari 1
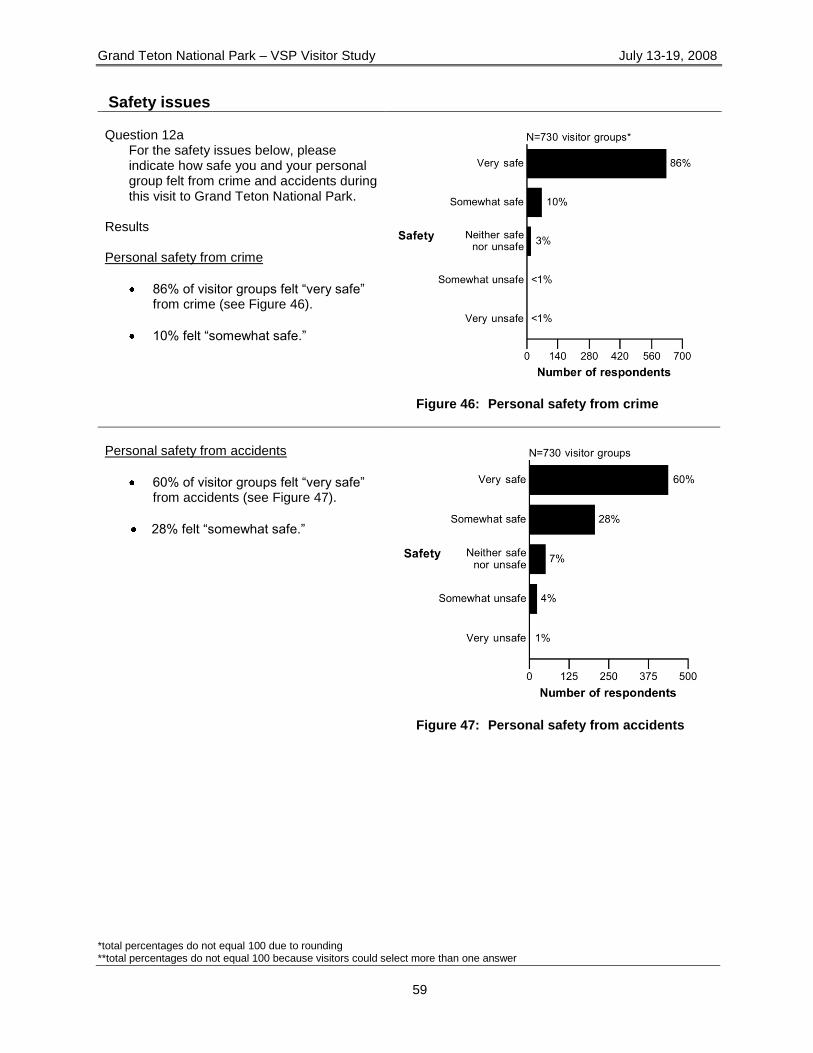
Grand Teton National Park – VSP Visitor Study July 13-19, 2008
*total percentages do not equal 100 due to rounding **total percentages do not equal 100 because visitors could select more than one answer
59
Safety issues Question 12a
For the safety issues below, please indicate how safe you and your personal group felt from crime and accidents during this visit to Grand Teton National Park.
Results Personal safety from crime
86% of visitor groups felt ―very safe‖ from crime (see Figure 46).
10% felt ―somewhat safe.‖
Figure 46: Personal safety from crime
Personal safety from accidents
60% of visitor groups felt ―very safe‖ from accidents (see Figure 47).
28% felt ―somewhat safe.‖
Figure 47: Personal safety from accidents
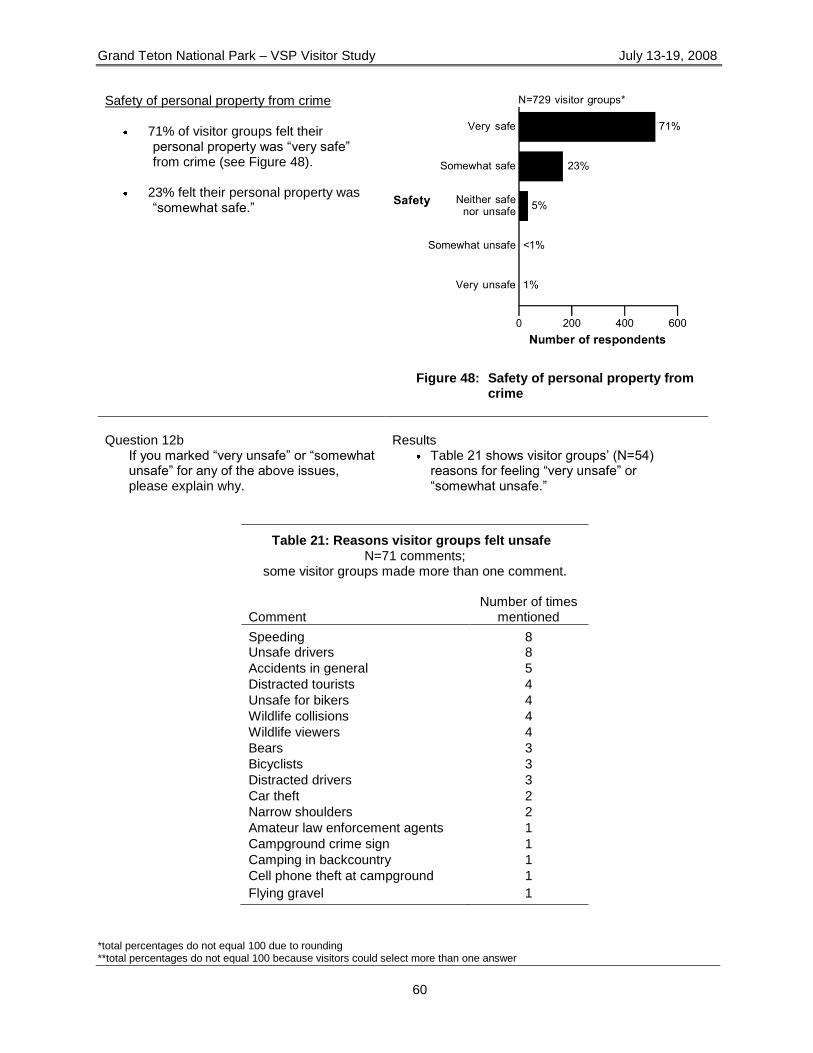
Grand Teton National Park – VSP Visitor Study July 13-19, 2008
*total percentages do not equal 100 due to rounding **total percentages do not equal 100 because visitors could select more than one answer
60
Safety of personal property from crime
71% of visitor groups felt their personal property was ―very safe‖ from crime (see Figure 48).
23% felt their personal property was
―somewhat safe.‖
Figure 48: Safety of personal property from crime
Question 12b
If you marked ―very unsafe‖ or ―somewhat unsafe‖ for any of the above issues, please explain why.
Results
Table 21 shows visitor groups‘ (N=54) reasons for feeling ―very unsafe‖ or ―somewhat unsafe.‖
Table 21: Reasons visitor groups felt unsafe N=71 comments;
some visitor groups made more than one comment.
Comment
Number of times mentioned
Speeding 8 Unsafe drivers 8
Accidents in general 5
Distracted tourists 4
Unsafe for bikers 4
Wildlife collisions 4
Wildlife viewers 4
Bears 3
Bicyclists 3
Distracted drivers 3
Car theft 2
Narrow shoulders 2
Amateur law enforcement agents 1
Campground crime sign 1
Camping in backcountry 1
Cell phone theft at campground 1
Flying gravel 1
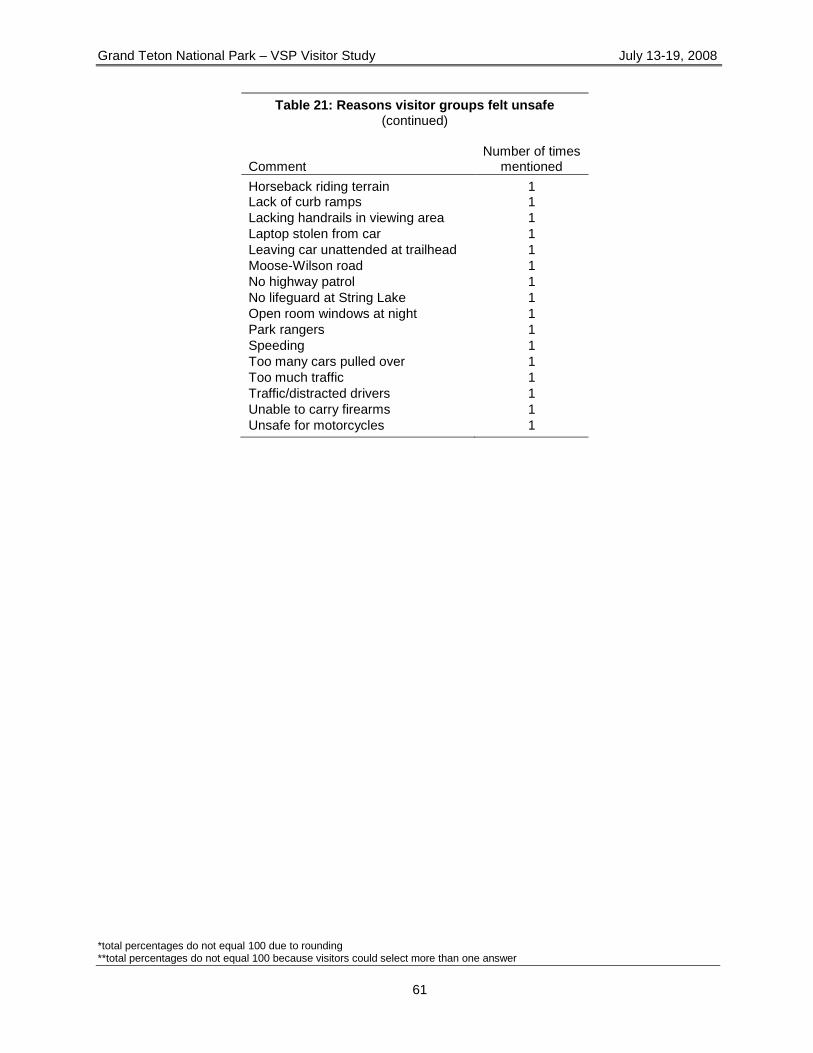
Grand Teton National Park – VSP Visitor Study July 13-19, 2008
*total percentages do not equal 100 due to rounding **total percentages do not equal 100 because visitors could select more than one answer
61
Table 21: Reasons visitor groups felt unsafe (continued)
Comment
Number of times mentioned
Horseback riding terrain 1 Lack of curb ramps 1
Lacking handrails in viewing area 1
Laptop stolen from car 1
Leaving car unattended at trailhead 1
Moose-Wilson road 1
No highway patrol 1
No lifeguard at String Lake 1
Open room windows at night 1
Park rangers 1
Speeding 1
Too many cars pulled over 1
Too much traffic 1
Traffic/distracted drivers 1
Unable to carry firearms 1
Unsafe for motorcycles 1
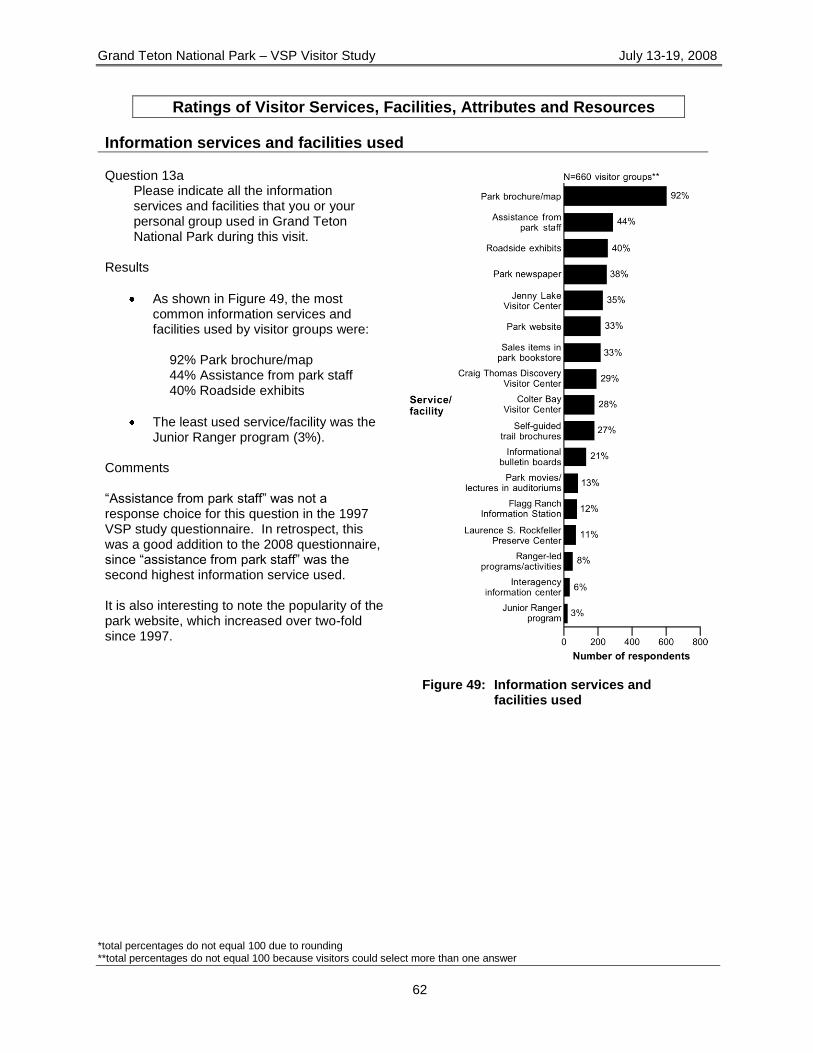
Grand Teton National Park – VSP Visitor Study July 13-19, 2008
*total percentages do not equal 100 due to rounding **total percentages do not equal 100 because visitors could select more than one answer
62
Ratings of Visitor Services, Facilities, Attributes and Resources
Information services and facilities used Question 13a
Please indicate all the information services and facilities that you or your personal group used in Grand Teton National Park during this visit.
Results
As shown in Figure 49, the most common information services and facilities used by visitor groups were:
92% Park brochure/map 44% Assistance from park staff 40% Roadside exhibits
The least used service/facility was the Junior Ranger program (3%).
Comments ―Assistance from park staff‖ was not a response choice for this question in the 1997 VSP study questionnaire. In retrospect, this was a good addition to the 2008 questionnaire, since ―assistance from park staff‖ was the second highest information service used. It is also interesting to note the popularity of the park website, which increased over two-fold since 1997.
Figure 49: Information services and
facilities used
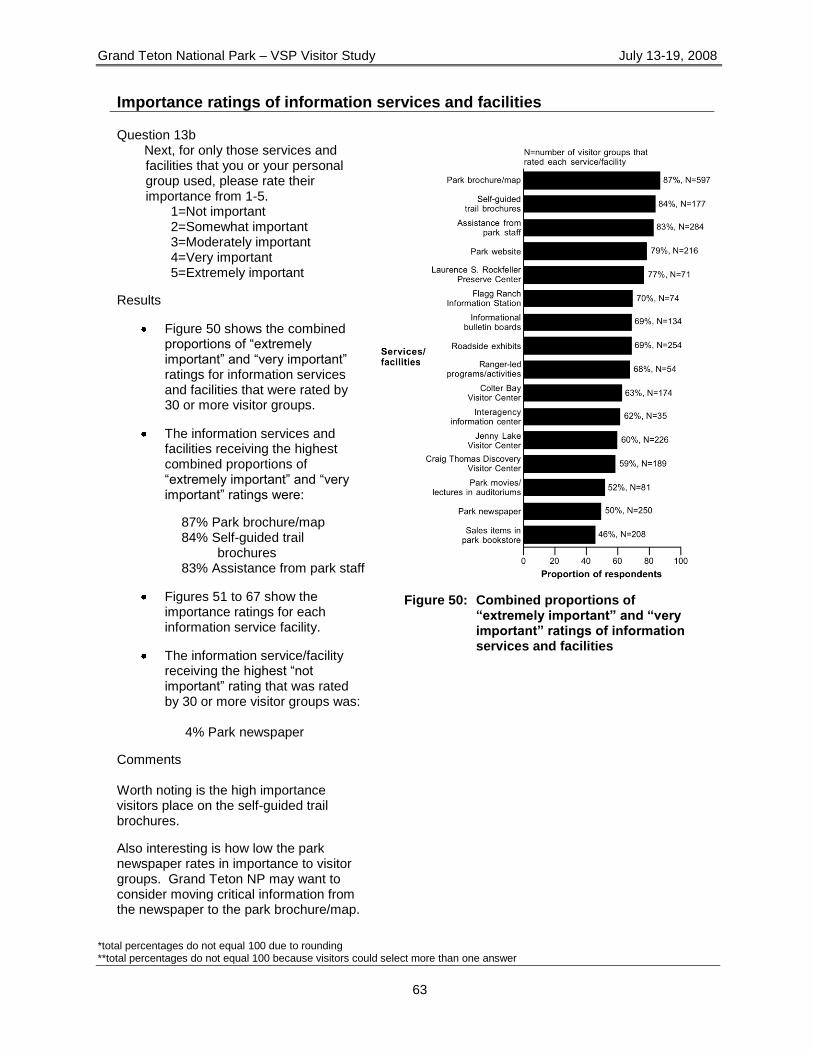
Grand Teton National Park – VSP Visitor Study July 13-19, 2008
*total percentages do not equal 100 due to rounding **total percentages do not equal 100 because visitors could select more than one answer
63
Importance ratings of information services and facilities Question 13b
Next, for only those services and facilities that you or your personal group used, please rate their importance from 1-5.
1=Not important 2=Somewhat important 3=Moderately important 4=Very important 5=Extremely important
Results
Figure 50 shows the combined proportions of ―extremely important‖ and ―very important‖ ratings for information services and facilities that were rated by 30 or more visitor groups.
The information services and facilities receiving the highest combined proportions of ―extremely important‖ and ―very important‖ ratings were:
87% Park brochure/map 84% Self-guided trail
brochures 83% Assistance from park staff
Figures 51 to 67 show the importance ratings for each information service facility.
The information service/facility receiving the highest ―not important‖ rating that was rated by 30 or more visitor groups was:
4% Park newspaper
Comments Worth noting is the high importance visitors place on the self-guided trail brochures.
Also interesting is how low the park newspaper rates in importance to visitor groups. Grand Teton NP may want to consider moving critical information from the newspaper to the park brochure/map.
Figure 50: Combined proportions of
“extremely important” and “very important” ratings of information services and facilities
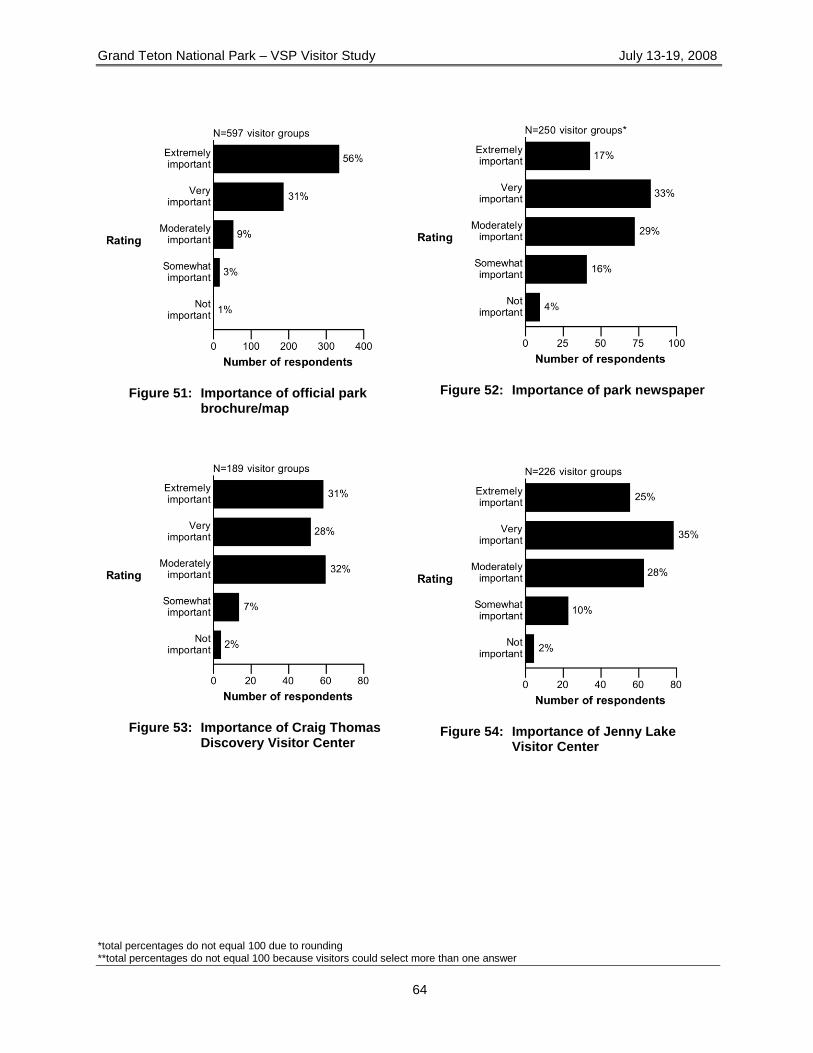
Grand Teton National Park – VSP Visitor Study July 13-19, 2008
*total percentages do not equal 100 due to rounding **total percentages do not equal 100 because visitors could select more than one answer
64
Figure 51: Importance of official park
brochure/map
Figure 52: Importance of park newspaper
Figure 53: Importance of Craig Thomas
Discovery Visitor Center
Figure 54: Importance of Jenny Lake
Visitor Center
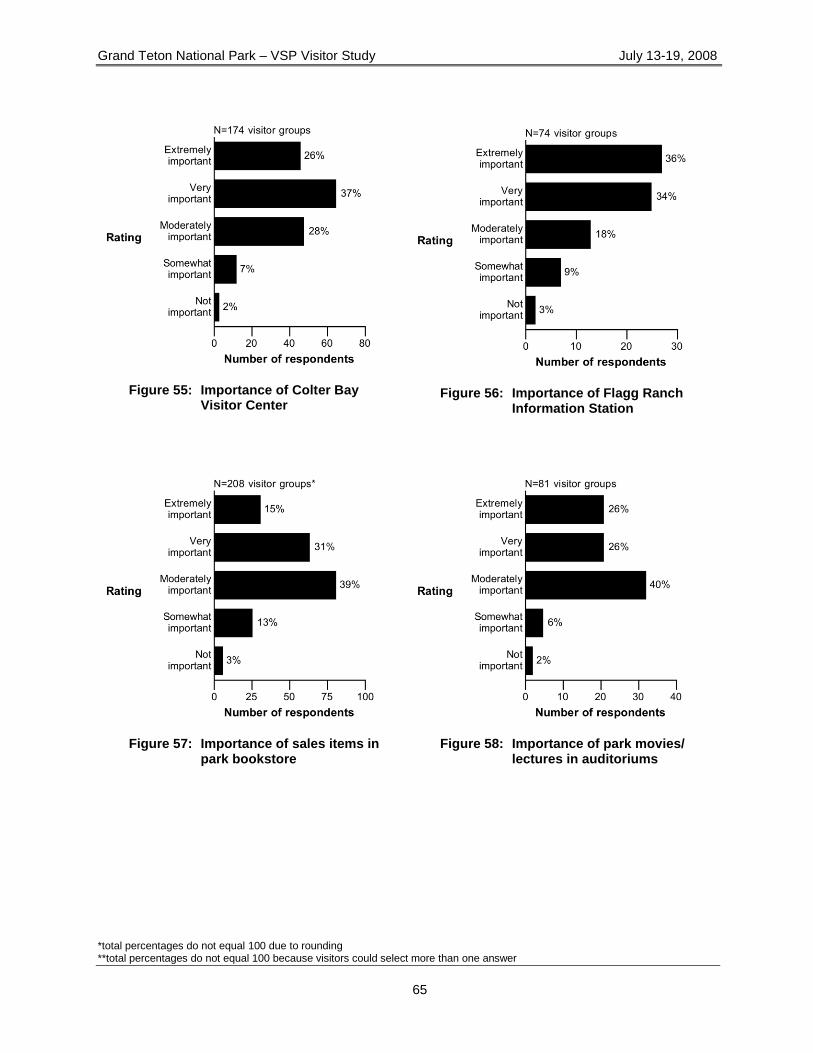
Grand Teton National Park – VSP Visitor Study July 13-19, 2008
*total percentages do not equal 100 due to rounding **total percentages do not equal 100 because visitors could select more than one answer
65
Figure 55: Importance of Colter Bay
Visitor Center
Figure 56: Importance of Flagg Ranch
Information Station
Figure 57: Importance of sales items in
park bookstore
Figure 58: Importance of park movies/
lectures in auditoriums
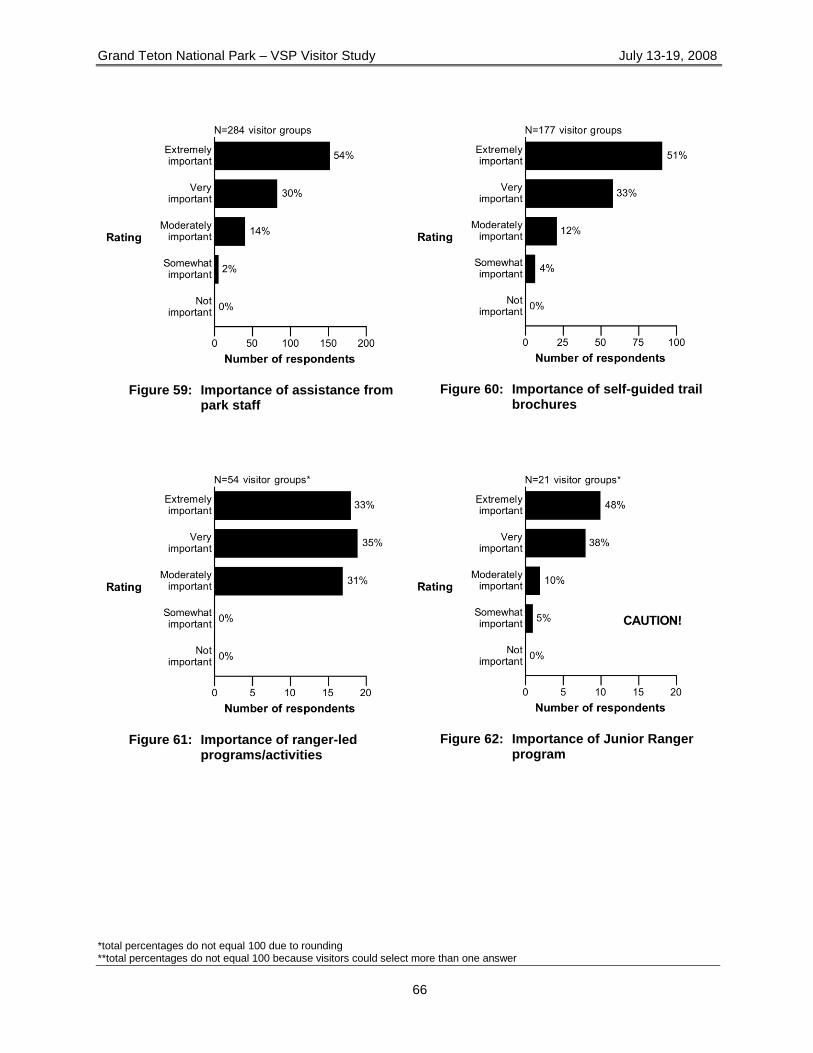
Grand Teton National Park – VSP Visitor Study July 13-19, 2008
*total percentages do not equal 100 due to rounding **total percentages do not equal 100 because visitors could select more than one answer
66
Figure 59: Importance of assistance from
park staff
Figure 60: Importance of self-guided trail
brochures
Figure 61: Importance of ranger-led
programs/activities
Figure 62: Importance of Junior Ranger
program
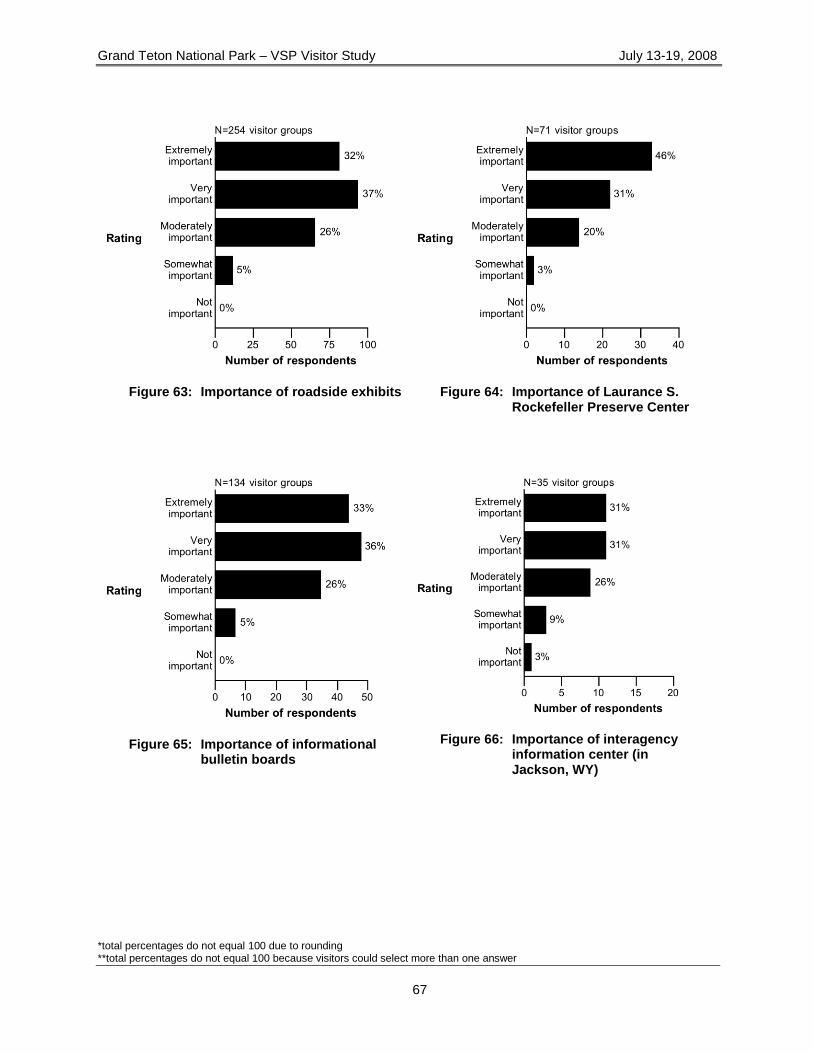
Grand Teton National Park – VSP Visitor Study July 13-19, 2008
*total percentages do not equal 100 due to rounding **total percentages do not equal 100 because visitors could select more than one answer
67
Figure 63: Importance of roadside exhibits
Figure 64: Importance of Laurance S.
Rockefeller Preserve Center
Figure 65: Importance of informational
bulletin boards
Figure 66: Importance of interagency
information center (in Jackson, WY)
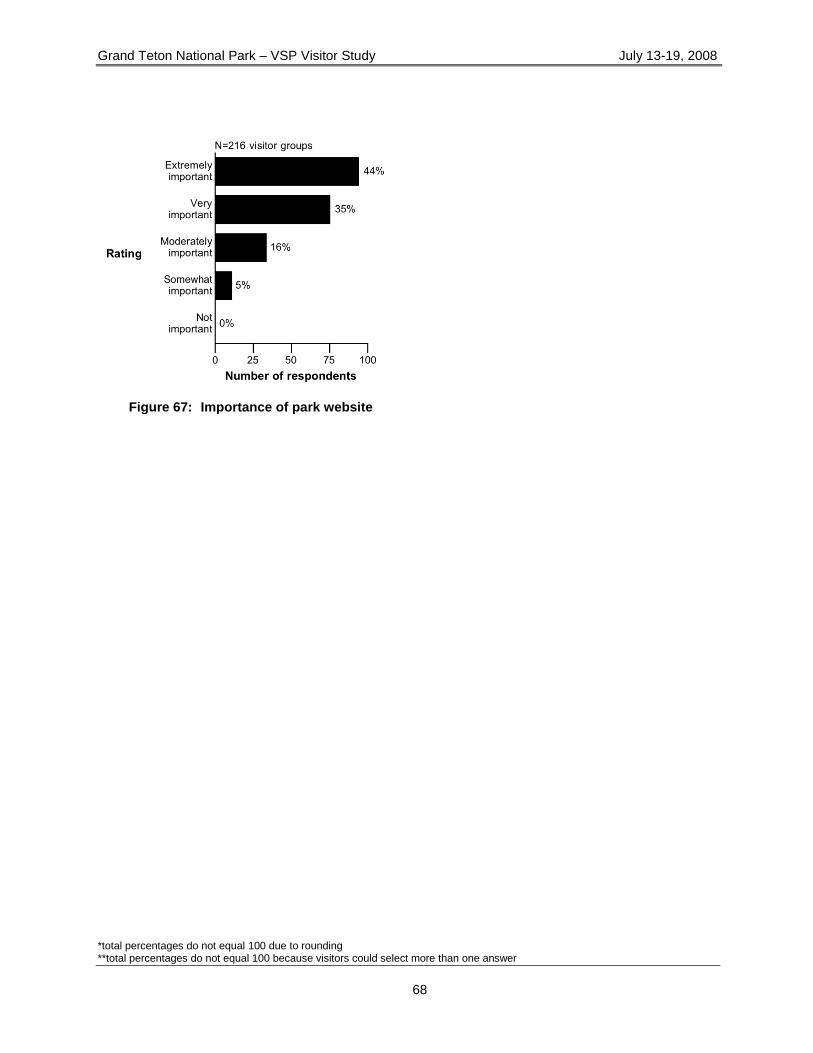
Grand Teton National Park – VSP Visitor Study July 13-19, 2008
*total percentages do not equal 100 due to rounding **total percentages do not equal 100 because visitors could select more than one answer
68
Figure 67: Importance of park website
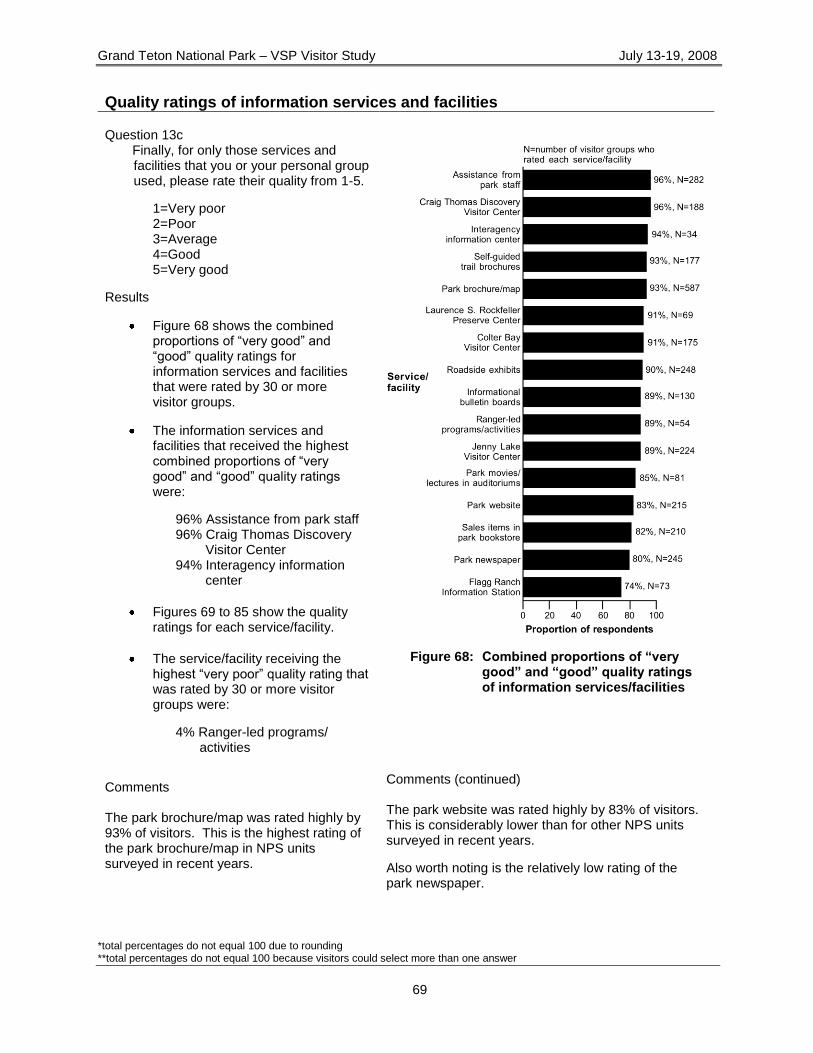
Grand Teton National Park – VSP Visitor Study July 13-19, 2008
*total percentages do not equal 100 due to rounding **total percentages do not equal 100 because visitors could select more than one answer
69
Quality ratings of information services and facilities Question 13c
Finally, for only those services and facilities that you or your personal group used, please rate their quality from 1-5.
1=Very poor 2=Poor 3=Average 4=Good 5=Very good
Results
Figure 68 shows the combined proportions of ―very good‖ and ―good‖ quality ratings for information services and facilities that were rated by 30 or more visitor groups.
The information services and facilities that received the highest combined proportions of ―very good‖ and ―good‖ quality ratings were:
96% Assistance from park staff 96% Craig Thomas Discovery
Visitor Center 94% Interagency information
center
Figures 69 to 85 show the quality ratings for each service/facility.
The service/facility receiving the highest ―very poor‖ quality rating that was rated by 30 or more visitor groups were:
4% Ranger-led programs/ activities
Comments The park brochure/map was rated highly by 93% of visitors. This is the highest rating of the park brochure/map in NPS units surveyed in recent years.
Figure 68: Combined proportions of “very
good” and “good” quality ratings of information services/facilities
Comments (continued) The park website was rated highly by 83% of visitors. This is considerably lower than for other NPS units surveyed in recent years.
Also worth noting is the relatively low rating of the park newspaper.
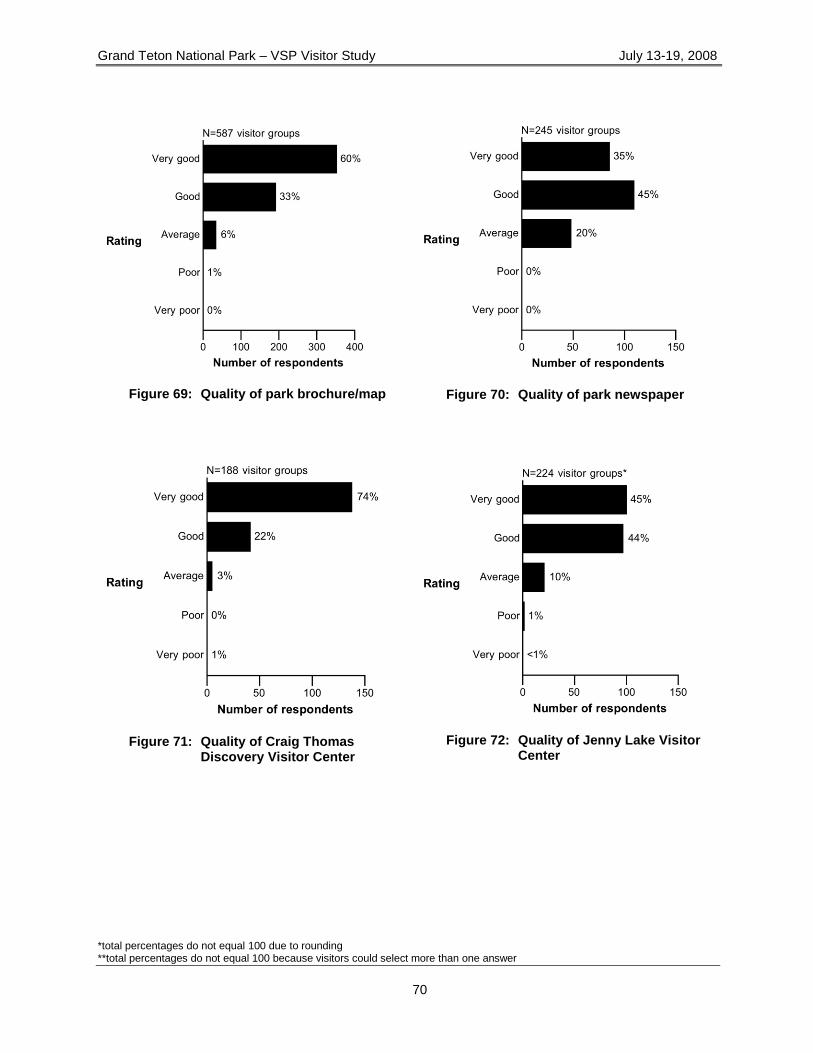
Grand Teton National Park – VSP Visitor Study July 13-19, 2008
*total percentages do not equal 100 due to rounding **total percentages do not equal 100 because visitors could select more than one answer
70
Figure 69: Quality of park brochure/map
Figure 70: Quality of park newspaper
Figure 71: Quality of Craig Thomas
Discovery Visitor Center
Figure 72: Quality of Jenny Lake Visitor
Center
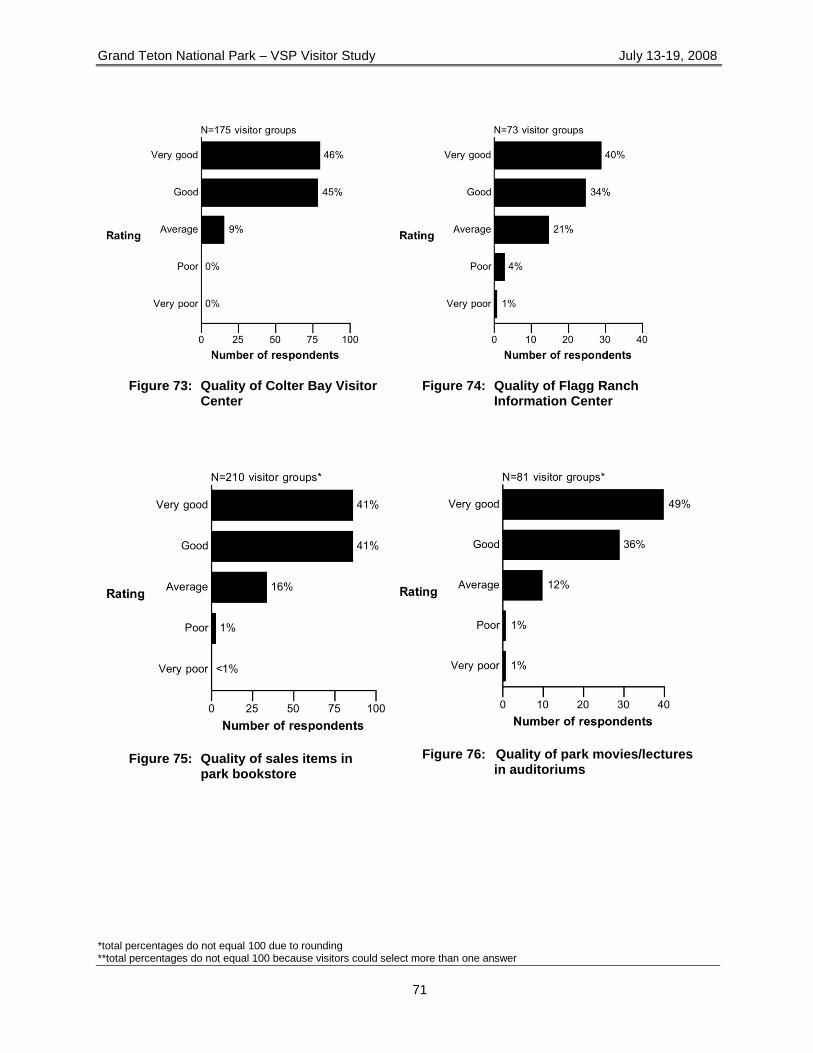
Grand Teton National Park – VSP Visitor Study July 13-19, 2008
*total percentages do not equal 100 due to rounding **total percentages do not equal 100 because visitors could select more than one answer
71
Figure 73: Quality of Colter Bay Visitor
Center
Figure 74: Quality of Flagg Ranch
Information Center
Figure 75: Quality of sales items in
park bookstore
Figure 76: Quality of park movies/lectures
in auditoriums
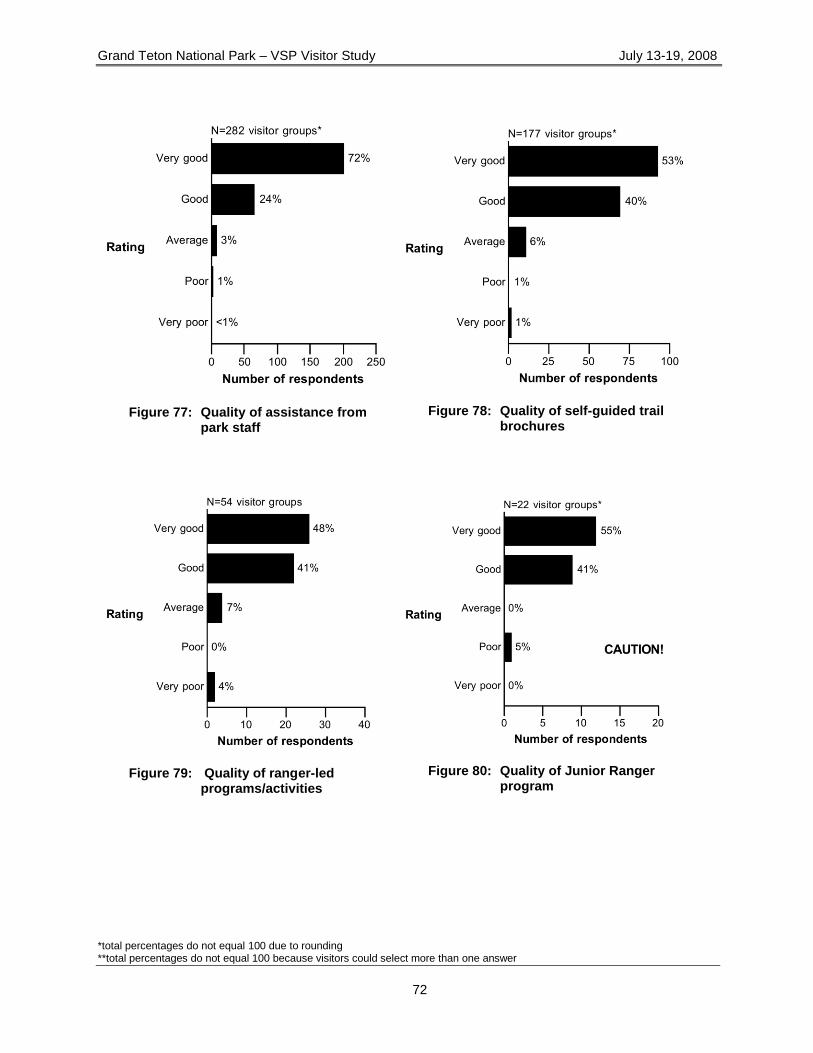
Grand Teton National Park – VSP Visitor Study July 13-19, 2008
*total percentages do not equal 100 due to rounding **total percentages do not equal 100 because visitors could select more than one answer
72
Figure 77: Quality of assistance from
park staff
Figure 78: Quality of self-guided trail
brochures
Figure 79: Quality of ranger-led
programs/activities
Figure 80: Quality of Junior Ranger
program
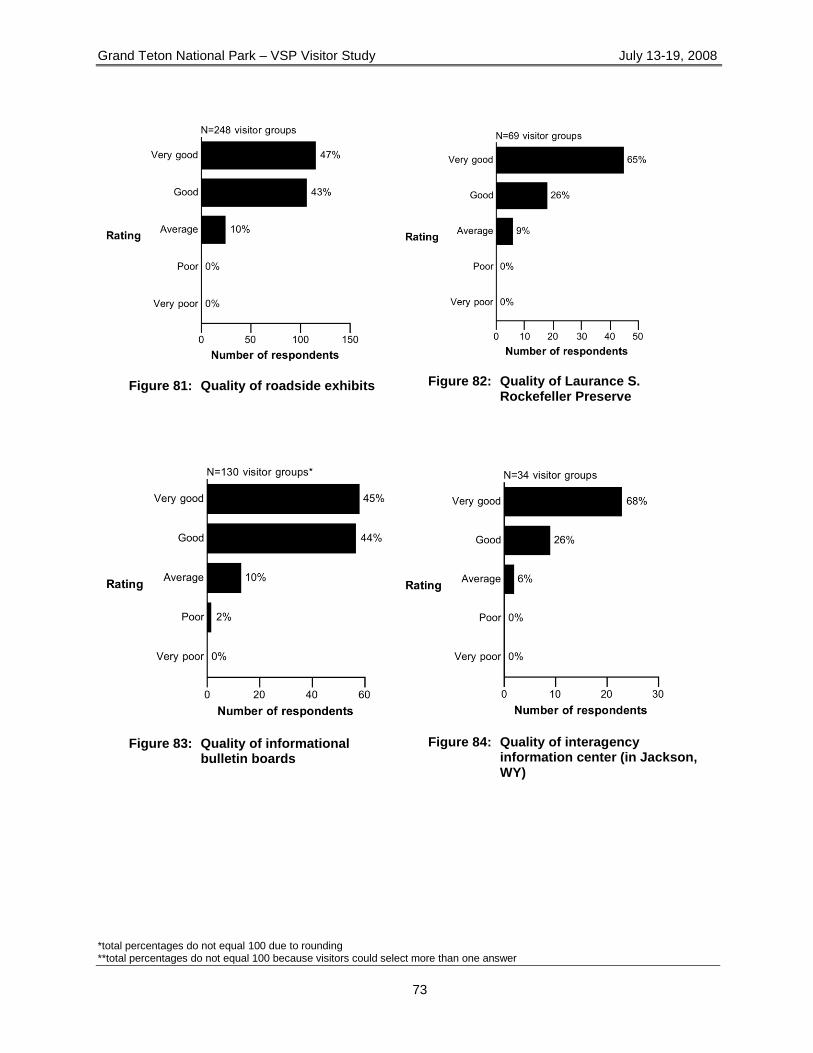
Grand Teton National Park – VSP Visitor Study July 13-19, 2008
*total percentages do not equal 100 due to rounding **total percentages do not equal 100 because visitors could select more than one answer
73
Figure 81: Quality of roadside exhibits
Figure 82: Quality of Laurance S.
Rockefeller Preserve
Figure 83: Quality of informational
bulletin boards
Figure 84: Quality of interagency
information center (in Jackson, WY)

Grand Teton National Park – VSP Visitor Study July 13-19, 2008
*total percentages do not equal 100 due to rounding **total percentages do not equal 100 because visitors could select more than one answer
74
Figure 85: Quality of park website
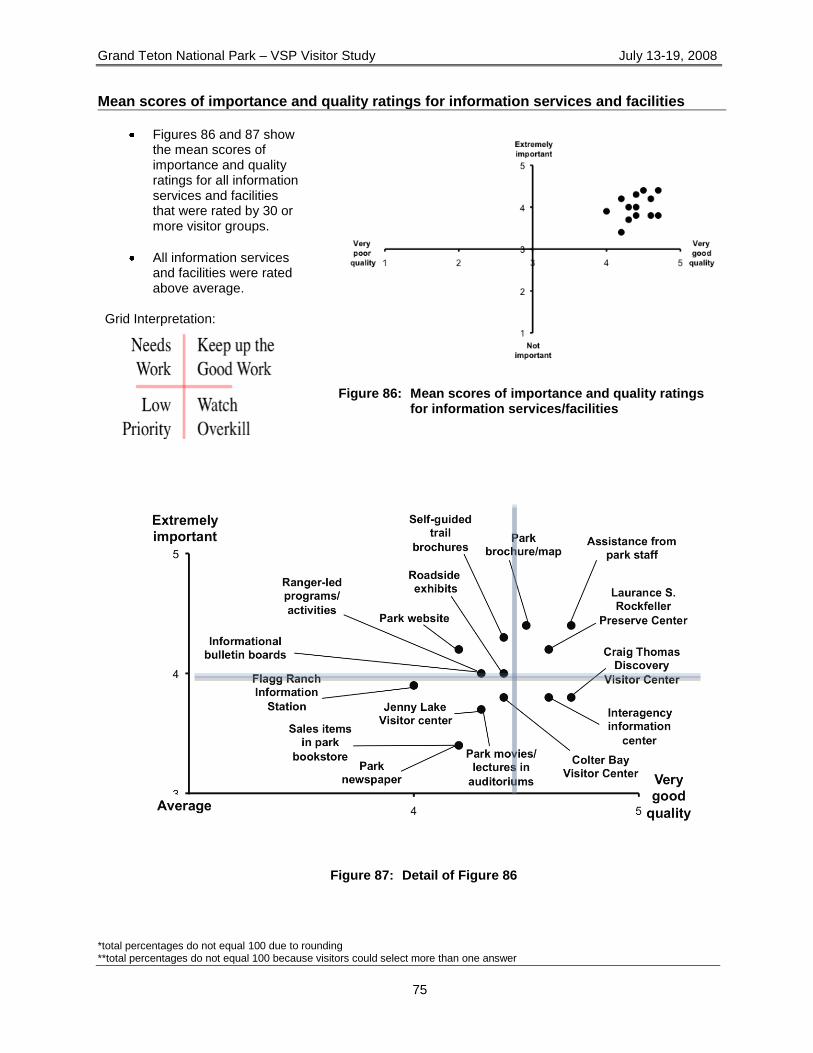
Grand Teton National Park – VSP Visitor Study July 13-19, 2008
*total percentages do not equal 100 due to rounding **total percentages do not equal 100 because visitors could select more than one answer
75
Mean scores of importance and quality ratings for information services and facilities
Figures 86 and 87 show the mean scores of importance and quality ratings for all information services and facilities that were rated by 30 or more visitor groups.
All information services and facilities were rated above average.
Grid Interpretation:
Figure 86: Mean scores of importance and quality ratings for information services/facilities
Figure 87: Detail of Figure 86
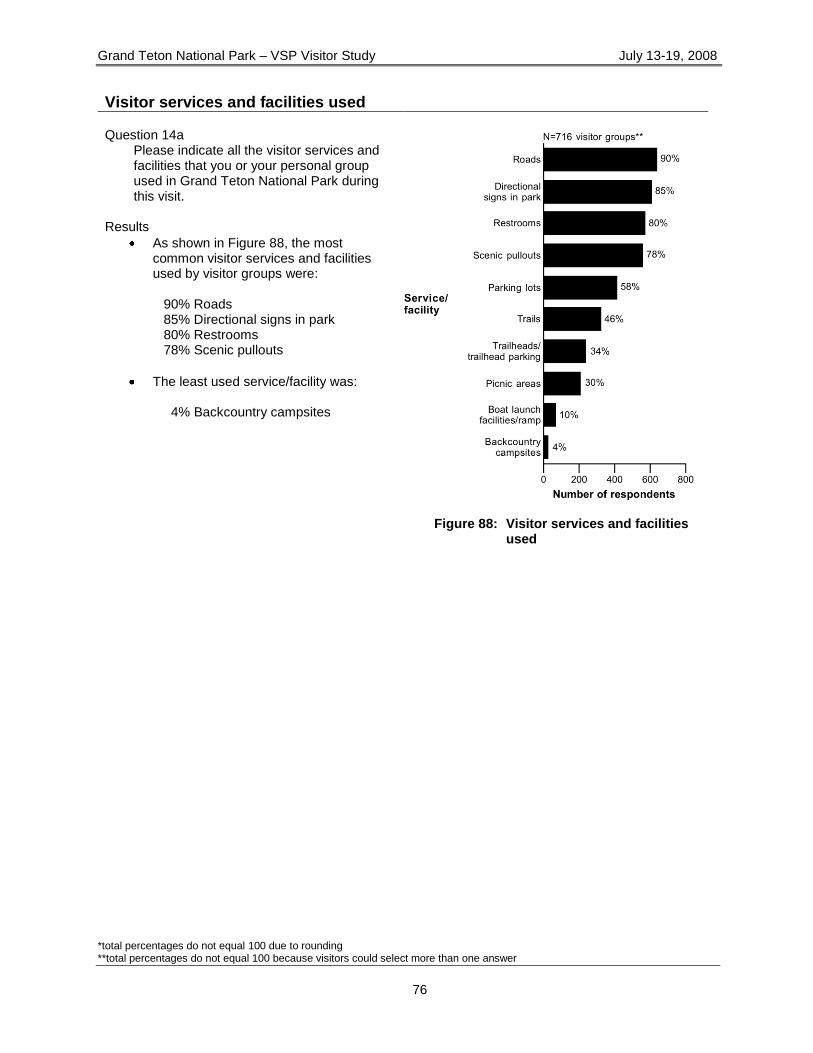
Grand Teton National Park – VSP Visitor Study July 13-19, 2008
*total percentages do not equal 100 due to rounding **total percentages do not equal 100 because visitors could select more than one answer
76
Visitor services and facilities used Question 14a
Please indicate all the visitor services and facilities that you or your personal group used in Grand Teton National Park during this visit.
Results
As shown in Figure 88, the most common visitor services and facilities used by visitor groups were:
90% Roads 85% Directional signs in park 80% Restrooms 78% Scenic pullouts
The least used service/facility was: 4% Backcountry campsites
Figure 88: Visitor services and facilities
used
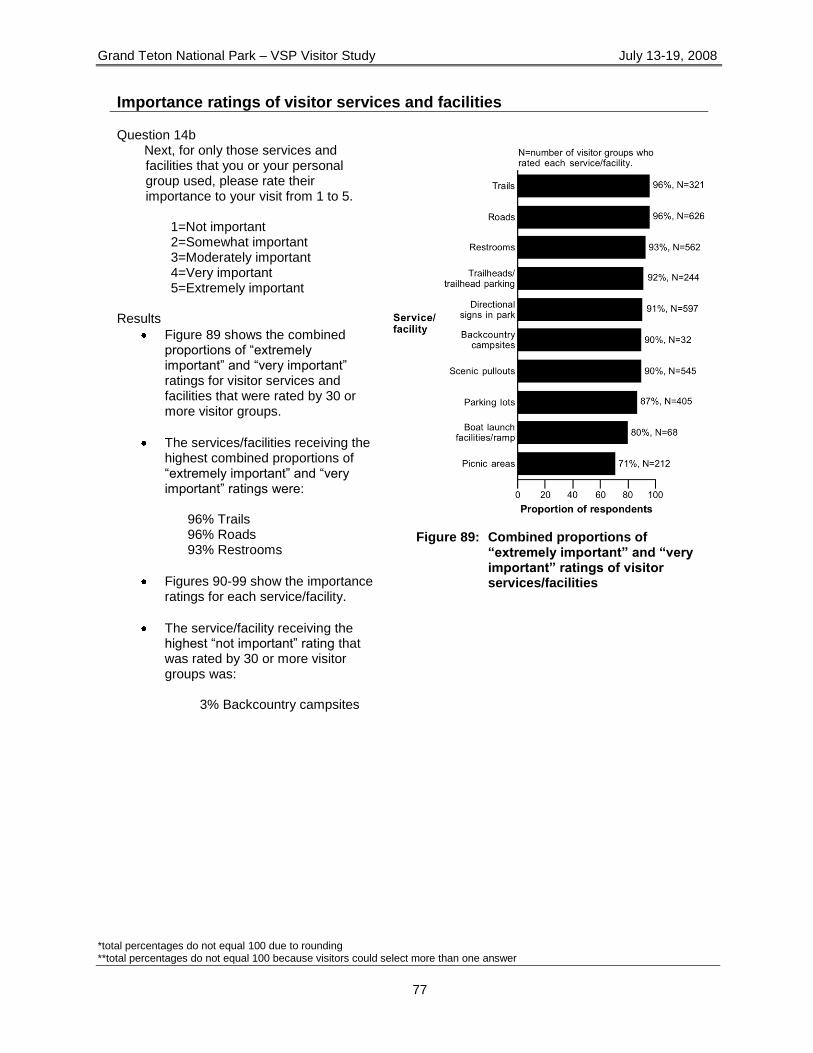
Grand Teton National Park – VSP Visitor Study July 13-19, 2008
*total percentages do not equal 100 due to rounding **total percentages do not equal 100 because visitors could select more than one answer
77
Importance ratings of visitor services and facilities Question 14b
Next, for only those services and facilities that you or your personal group used, please rate their importance to your visit from 1 to 5.
1=Not important 2=Somewhat important 3=Moderately important 4=Very important 5=Extremely important
Results
Figure 89 shows the combined proportions of ―extremely important‖ and ―very important‖ ratings for visitor services and facilities that were rated by 30 or more visitor groups.
The services/facilities receiving the highest combined proportions of ―extremely important‖ and ―very important‖ ratings were:
96% Trails 96% Roads 93% Restrooms
Figures 90-99 show the importance ratings for each service/facility.
The service/facility receiving the highest ―not important‖ rating that was rated by 30 or more visitor groups was:
3% Backcountry campsites
Figure 89: Combined proportions of
“extremely important” and “very important” ratings of visitor services/facilities
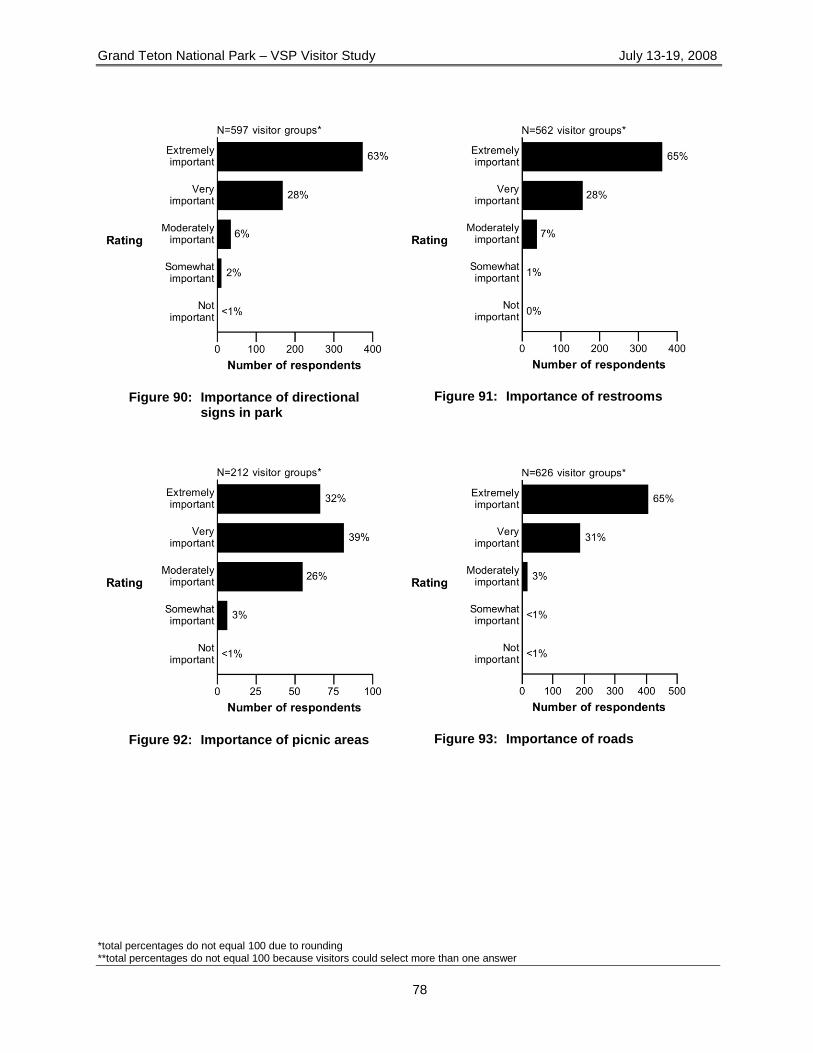
Grand Teton National Park – VSP Visitor Study July 13-19, 2008
*total percentages do not equal 100 due to rounding **total percentages do not equal 100 because visitors could select more than one answer
78
Figure 90: Importance of directional
signs in park
Figure 91: Importance of restrooms
Figure 92: Importance of picnic areas
Figure 93: Importance of roads
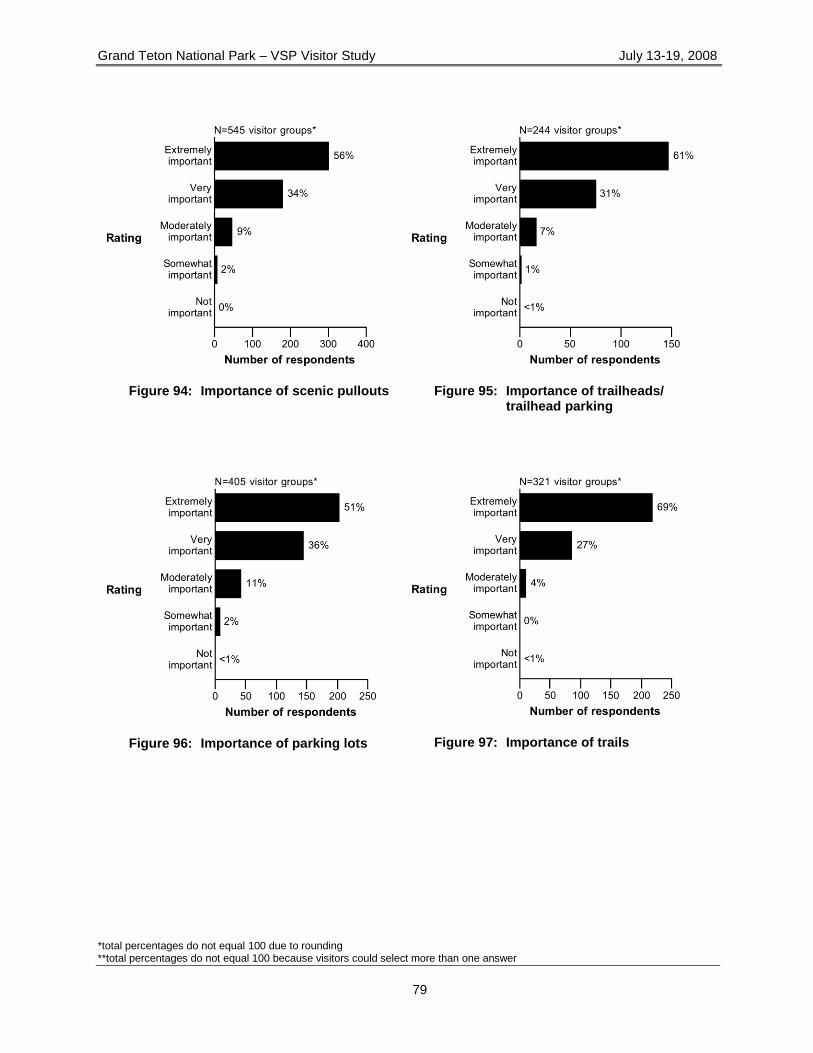
Grand Teton National Park – VSP Visitor Study July 13-19, 2008
*total percentages do not equal 100 due to rounding **total percentages do not equal 100 because visitors could select more than one answer
79
Figure 94: Importance of scenic pullouts
Figure 95: Importance of trailheads/
trailhead parking
Figure 96: Importance of parking lots
Figure 97: Importance of trails
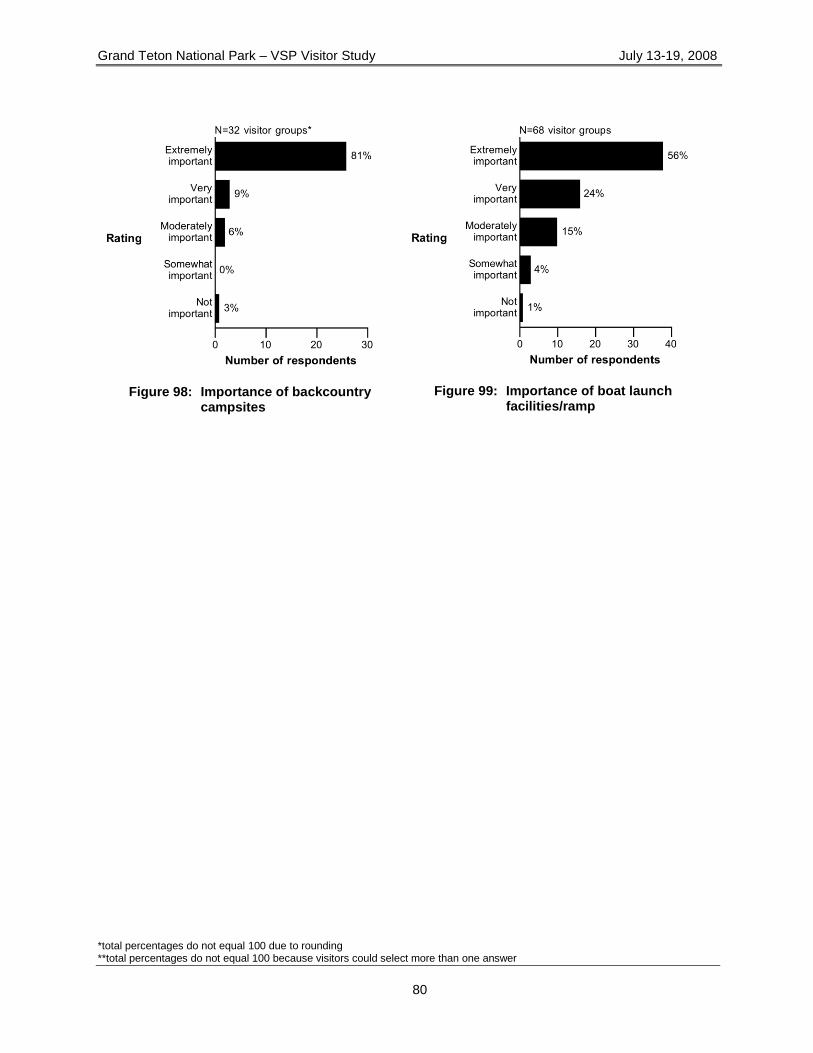
Grand Teton National Park – VSP Visitor Study July 13-19, 2008
*total percentages do not equal 100 due to rounding **total percentages do not equal 100 because visitors could select more than one answer
80
Figure 98: Importance of backcountry
campsites
Figure 99: Importance of boat launch
facilities/ramp
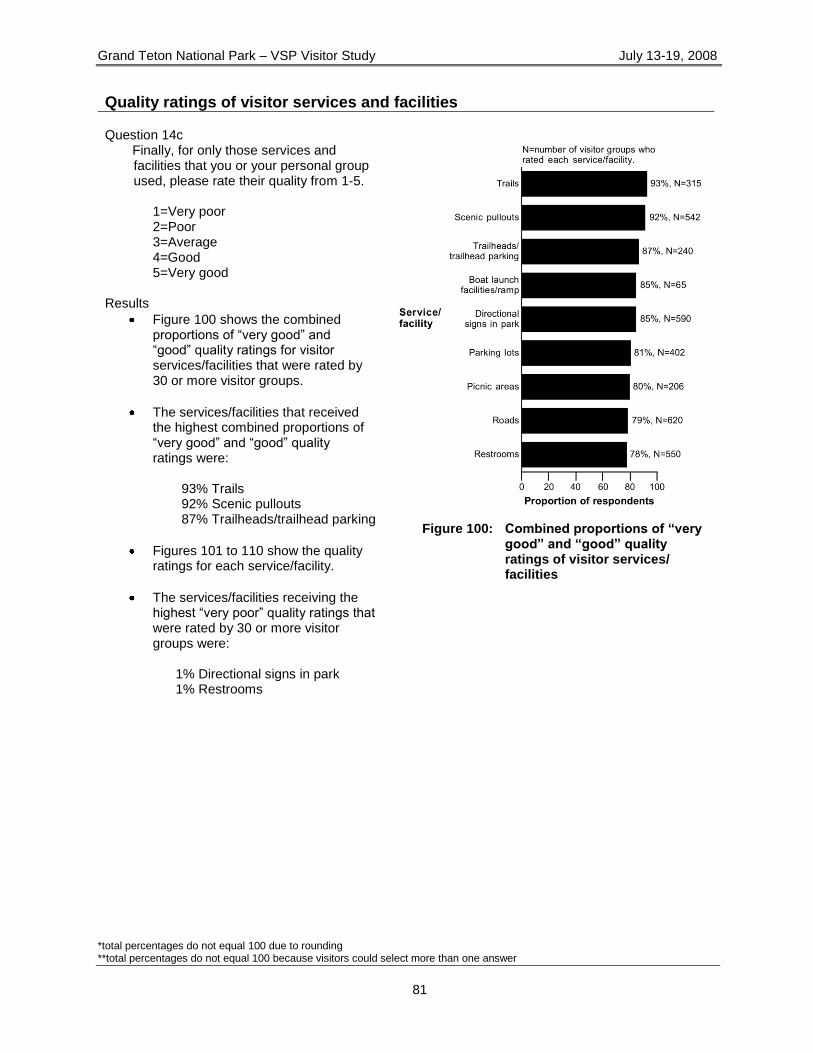
Grand Teton National Park – VSP Visitor Study July 13-19, 2008
*total percentages do not equal 100 due to rounding **total percentages do not equal 100 because visitors could select more than one answer
81
Quality ratings of visitor services and facilities Question 14c
Finally, for only those services and facilities that you or your personal group used, please rate their quality from 1-5.
1=Very poor 2=Poor 3=Average 4=Good 5=Very good
Results
Figure 100 shows the combined proportions of ―very good‖ and ―good‖ quality ratings for visitor services/facilities that were rated by 30 or more visitor groups.
The services/facilities that received the highest combined proportions of ―very good‖ and ―good‖ quality ratings were:
93% Trails 92% Scenic pullouts 87% Trailheads/trailhead parking
Figures 101 to 110 show the quality ratings for each service/facility.
The services/facilities receiving the highest ―very poor‖ quality ratings that were rated by 30 or more visitor groups were:
1% Directional signs in park 1% Restrooms
Figure 100: Combined proportions of “very
good” and “good” quality ratings of visitor services/ facilities
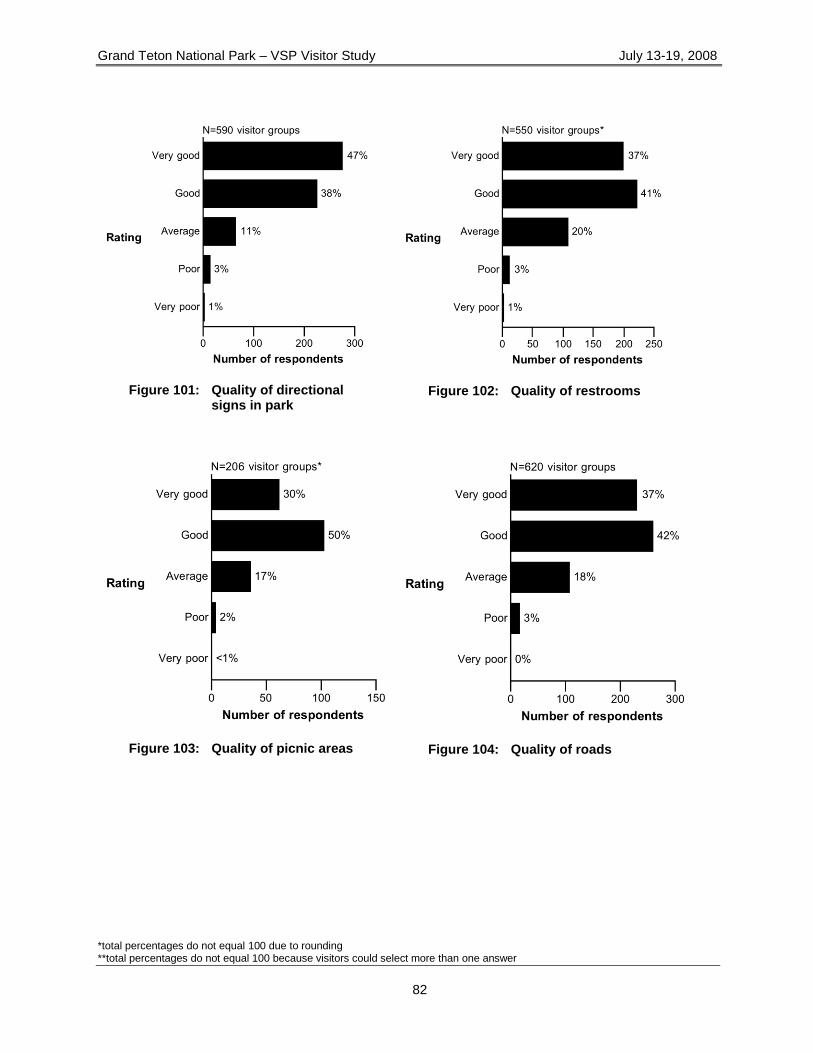
Grand Teton National Park – VSP Visitor Study July 13-19, 2008
*total percentages do not equal 100 due to rounding **total percentages do not equal 100 because visitors could select more than one answer
82
Figure 101: Quality of directional
signs in park
Figure 102: Quality of restrooms
Figure 103: Quality of picnic areas
Figure 104: Quality of roads
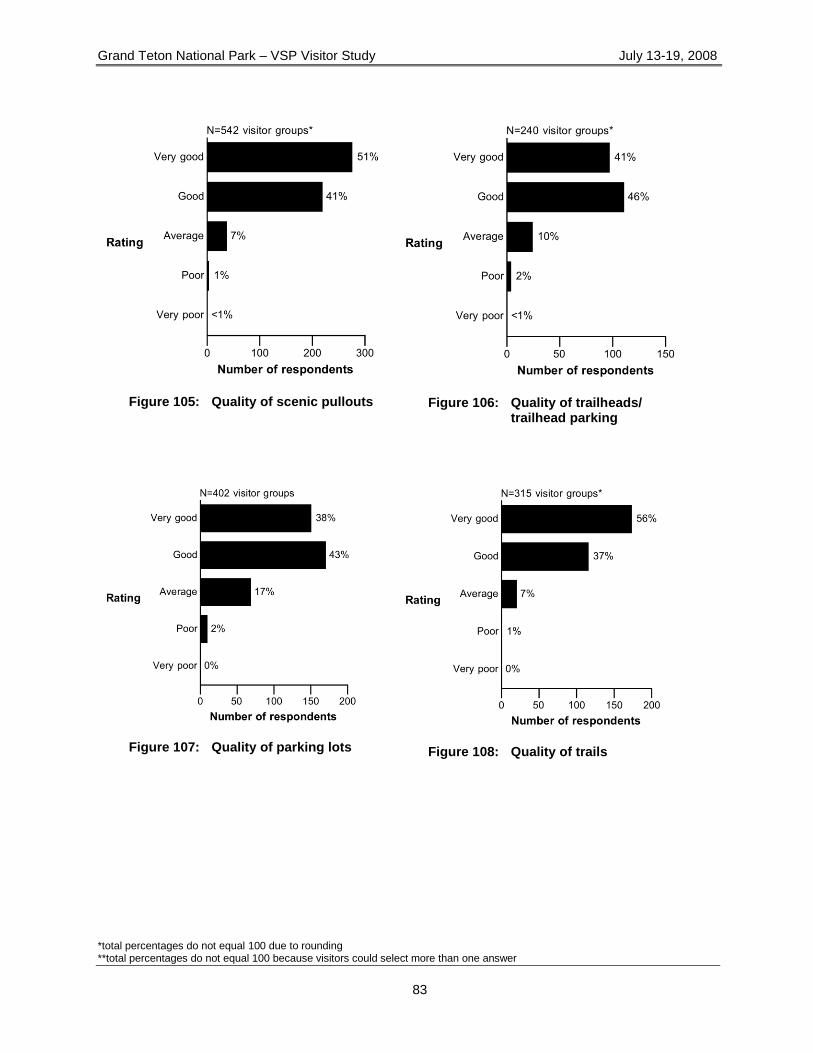
Grand Teton National Park – VSP Visitor Study July 13-19, 2008
*total percentages do not equal 100 due to rounding **total percentages do not equal 100 because visitors could select more than one answer
83
Figure 105: Quality of scenic pullouts
Figure 106: Quality of trailheads/
trailhead parking
Figure 107: Quality of parking lots
Figure 108: Quality of trails
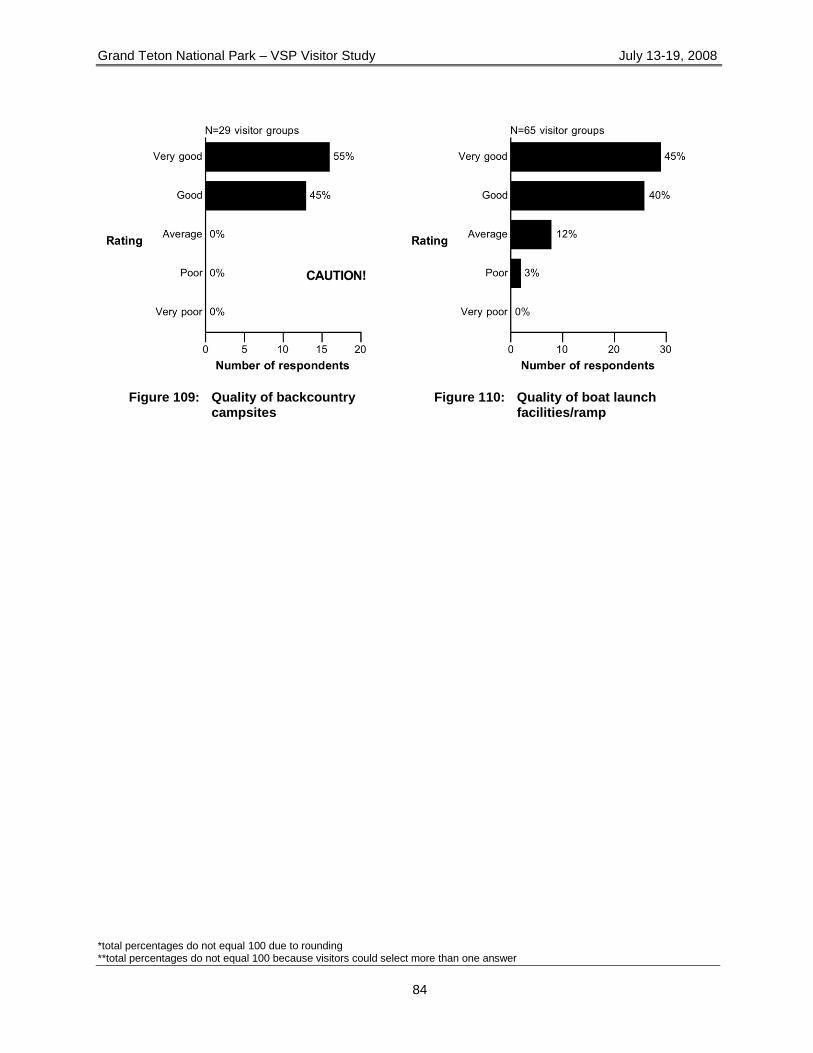
Grand Teton National Park – VSP Visitor Study July 13-19, 2008
*total percentages do not equal 100 due to rounding **total percentages do not equal 100 because visitors could select more than one answer
84
Figure 109: Quality of backcountry
campsites
Figure 110: Quality of boat launch
facilities/ramp
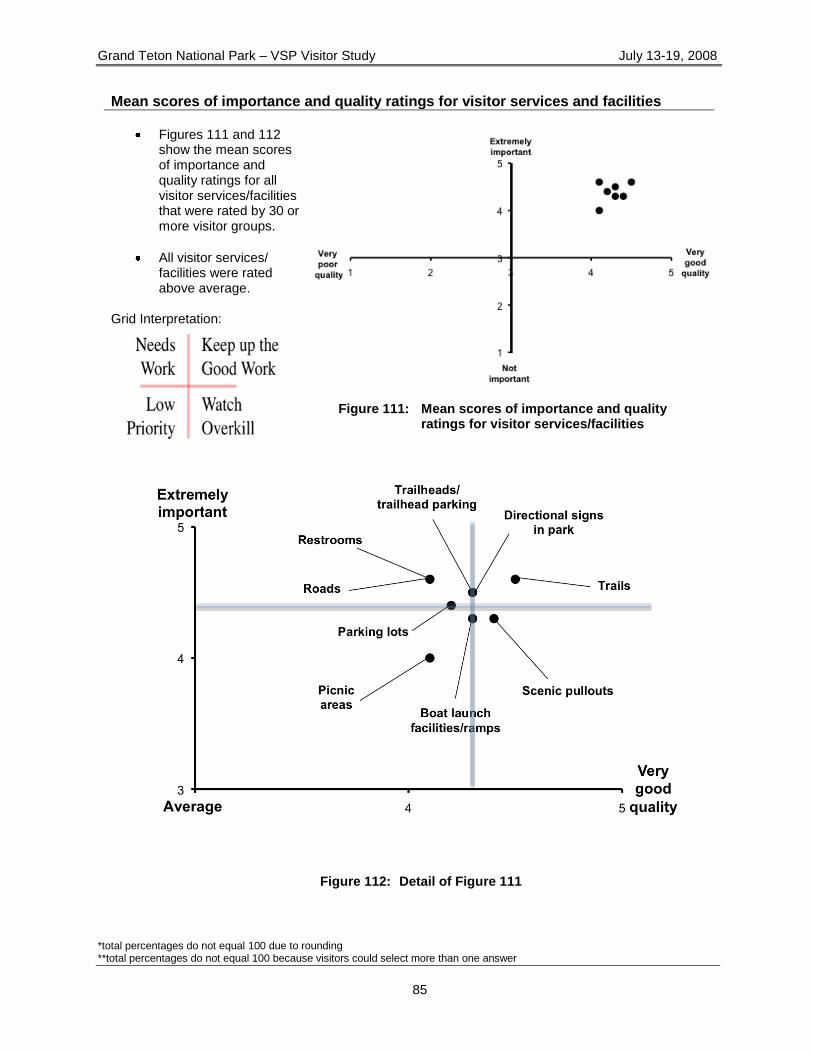
Grand Teton National Park – VSP Visitor Study July 13-19, 2008
*total percentages do not equal 100 due to rounding **total percentages do not equal 100 because visitors could select more than one answer
85
Mean scores of importance and quality ratings for visitor services and facilities
Figures 111 and 112 show the mean scores of importance and quality ratings for all visitor services/facilities that were rated by 30 or more visitor groups.
All visitor services/ facilities were rated above average.
Grid Interpretation:
Figure 111: Mean scores of importance and quality
ratings for visitor services/facilities
Figure 112: Detail of Figure 111
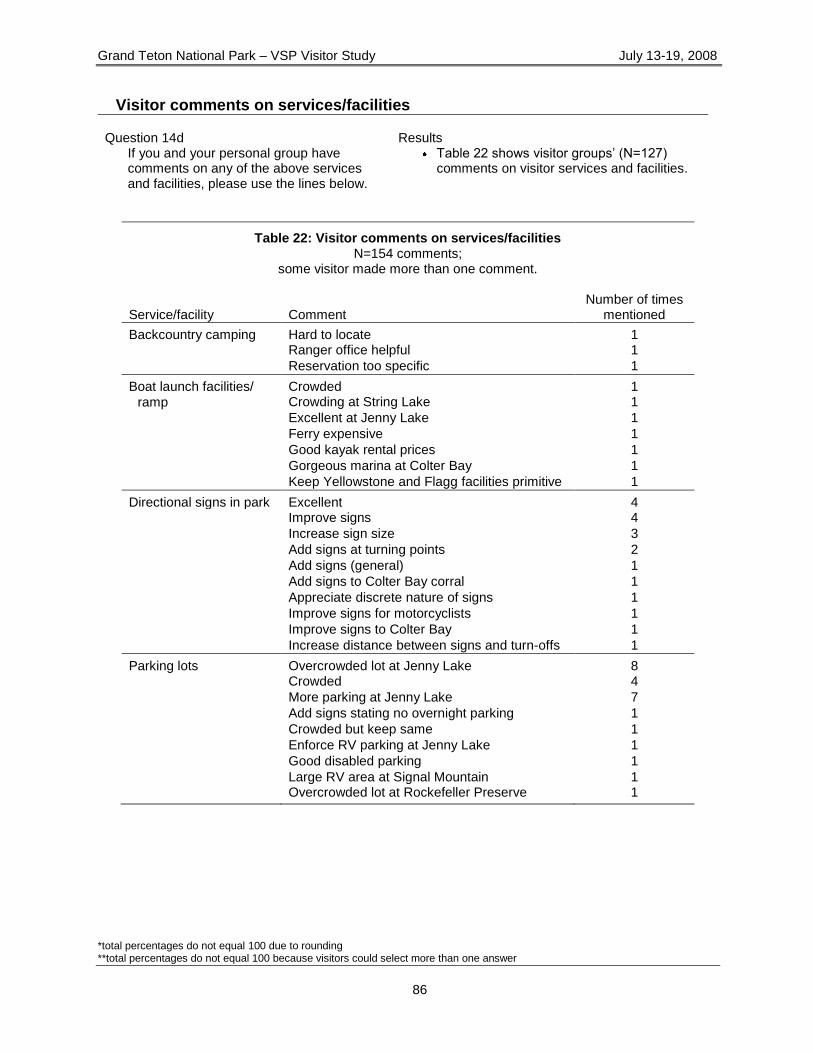
Grand Teton National Park – VSP Visitor Study July 13-19, 2008
*total percentages do not equal 100 due to rounding **total percentages do not equal 100 because visitors could select more than one answer
86
Visitor comments on services/facilities
Question 14d If you and your personal group have comments on any of the above services and facilities, please use the lines below.
Results
Table 22 shows visitor groups‘ (N=127) comments on visitor services and facilities.
Table 22: Visitor comments on services/facilities N=154 comments;
some visitor made more than one comment.
Service/facility
Comment
Number of times mentioned
Backcountry camping Hard to locate 1
Ranger office helpful 1
Reservation too specific 1
Boat launch facilities/ Crowded 1
ramp Crowding at String Lake 1
Excellent at Jenny Lake 1
Ferry expensive 1
Good kayak rental prices 1
Gorgeous marina at Colter Bay 1
Keep Yellowstone and Flagg facilities primitive 1
Directional signs in park Excellent 4
Improve signs 4
Increase sign size 3
Add signs at turning points 2
Add signs (general) 1
Add signs to Colter Bay corral 1
Appreciate discrete nature of signs 1
Improve signs for motorcyclists 1
Improve signs to Colter Bay 1
Increase distance between signs and turn-offs 1
Parking lots Overcrowded lot at Jenny Lake 8
Crowded 4
More parking at Jenny Lake 7
Add signs stating no overnight parking 1
Crowded but keep same 1
Enforce RV parking at Jenny Lake 1
Good disabled parking 1
Large RV area at Signal Mountain 1 Overcrowded lot at Rockefeller Preserve 1
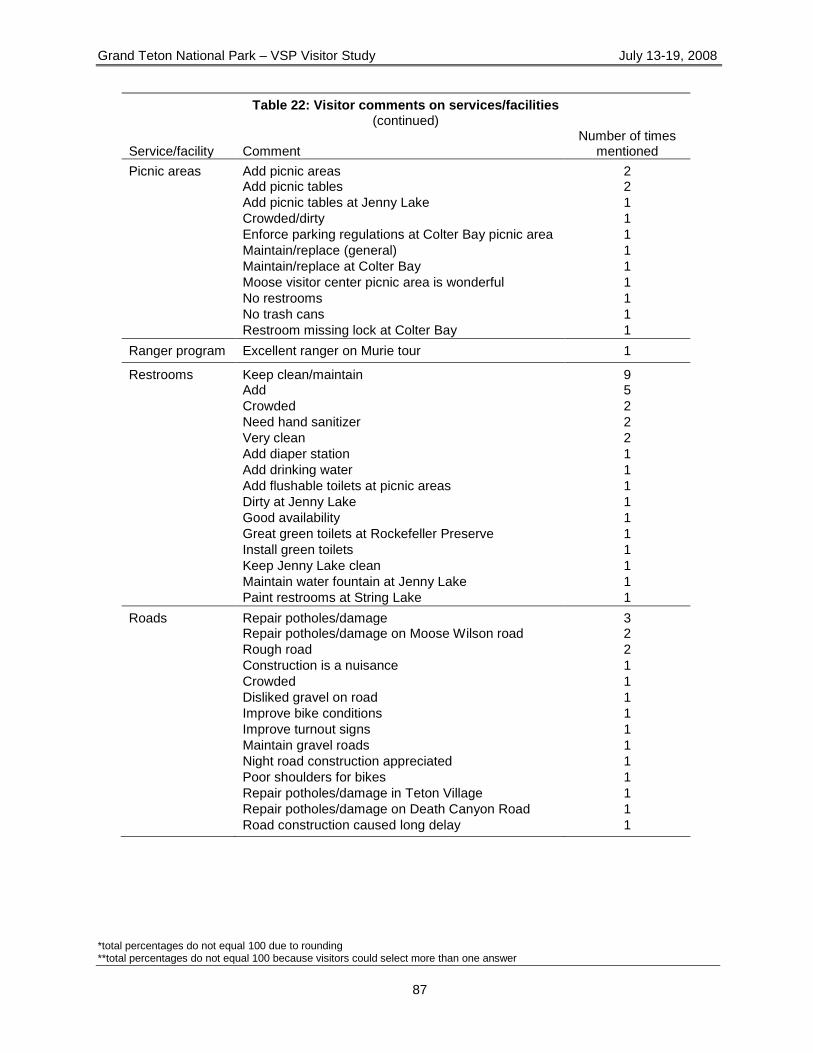
Grand Teton National Park – VSP Visitor Study July 13-19, 2008
*total percentages do not equal 100 due to rounding **total percentages do not equal 100 because visitors could select more than one answer
87
Table 22: Visitor comments on services/facilities (continued)
Service/facility
Comment
Number of times mentioned
Picnic areas Add picnic areas 2
Add picnic tables 2
Add picnic tables at Jenny Lake 1
Crowded/dirty 1
Enforce parking regulations at Colter Bay picnic area 1
Maintain/replace (general) 1
Maintain/replace at Colter Bay 1
Moose visitor center picnic area is wonderful 1
No restrooms 1
No trash cans 1
Restroom missing lock at Colter Bay 1
Ranger program Excellent ranger on Murie tour 1
Restrooms Keep clean/maintain 9
Add 5
Crowded 2
Need hand sanitizer 2
Very clean 2
Add diaper station 1
Add drinking water 1
Add flushable toilets at picnic areas 1
Dirty at Jenny Lake 1
Good availability 1
Great green toilets at Rockefeller Preserve 1
Install green toilets 1
Keep Jenny Lake clean 1
Maintain water fountain at Jenny Lake 1
Paint restrooms at String Lake 1
Roads Repair potholes/damage 3
Repair potholes/damage on Moose Wilson road 2
Rough road 2
Construction is a nuisance 1
Crowded 1
Disliked gravel on road 1
Improve bike conditions 1
Improve turnout signs 1
Maintain gravel roads 1
Night road construction appreciated 1
Poor shoulders for bikes 1
Repair potholes/damage in Teton Village 1
Repair potholes/damage on Death Canyon Road 1
Road construction caused long delay 1
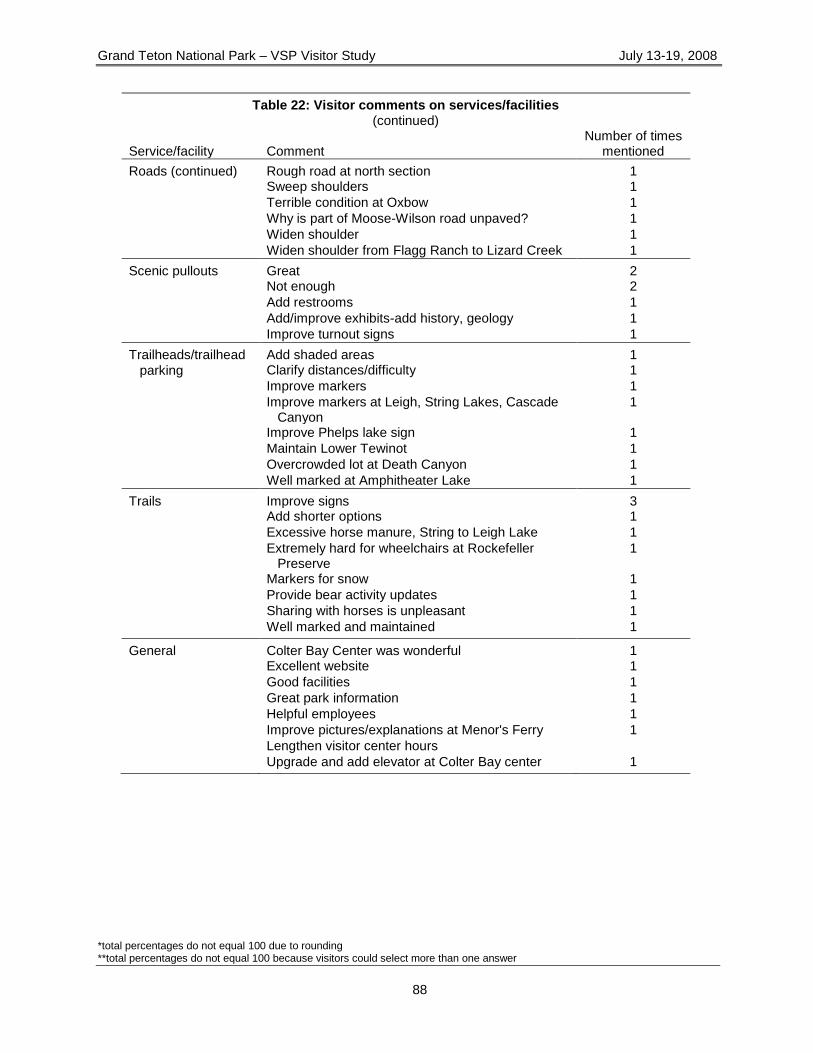
Grand Teton National Park – VSP Visitor Study July 13-19, 2008
*total percentages do not equal 100 due to rounding **total percentages do not equal 100 because visitors could select more than one answer
88
Table 22: Visitor comments on services/facilities (continued)
Service/facility
Comment
Number of times mentioned
Roads (continued) Rough road at north section 1
Sweep shoulders 1
Terrible condition at Oxbow 1
Why is part of Moose-Wilson road unpaved? 1
Widen shoulder 1
Widen shoulder from Flagg Ranch to Lizard Creek 1
Scenic pullouts Great 2
Not enough 2
Add restrooms 1
Add/improve exhibits-add history, geology 1
Improve turnout signs 1
Trailheads/trailhead Add shaded areas 1
parking Clarify distances/difficulty 1
Improve markers 1
Improve markers at Leigh, String Lakes, Cascade
Canyon 1
Improve Phelps lake sign 1
Maintain Lower Tewinot 1
Overcrowded lot at Death Canyon 1
Well marked at Amphitheater Lake 1
Trails Improve signs 3 Add shorter options 1
Excessive horse manure, String to Leigh Lake 1
Extremely hard for wheelchairs at Rockefeller
Preserve 1
Markers for snow 1
Provide bear activity updates 1
Sharing with horses is unpleasant 1
Well marked and maintained 1
General Colter Bay Center was wonderful 1
Excellent website 1
Good facilities 1
Great park information 1
Helpful employees 1
Improve pictures/explanations at Menor's Ferry 1
Lengthen visitor center hours
Upgrade and add elevator at Colter Bay center 1
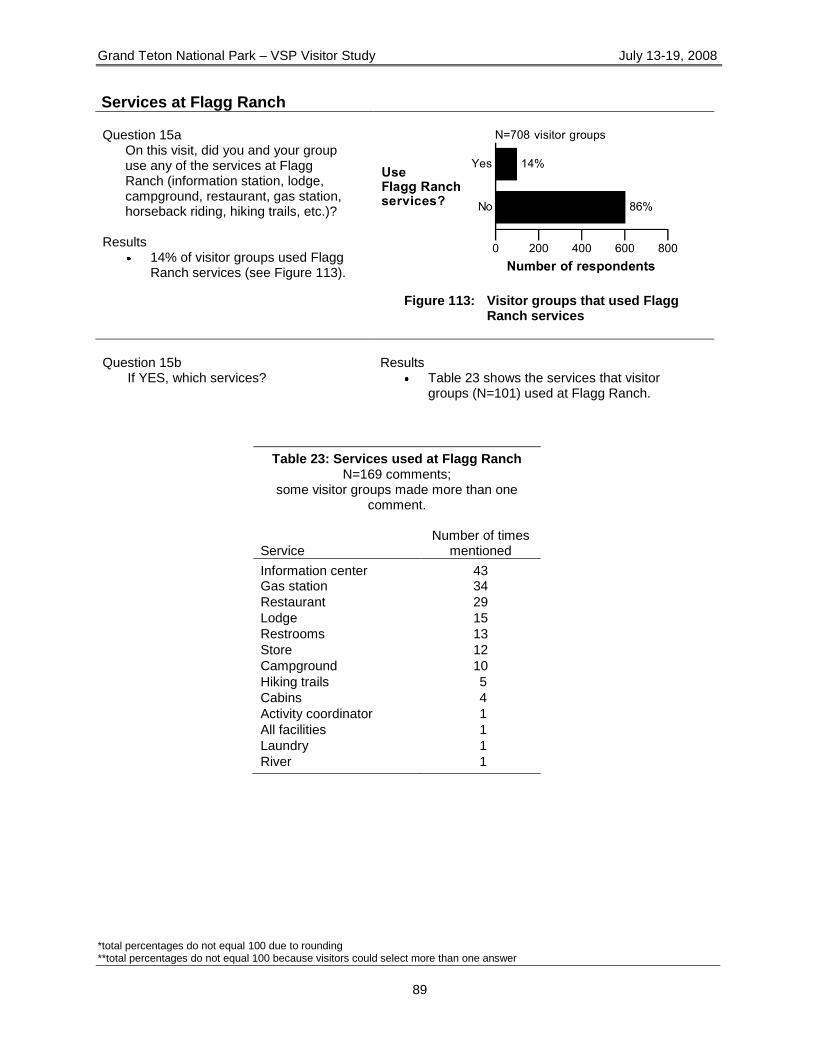
Grand Teton National Park – VSP Visitor Study July 13-19, 2008
*total percentages do not equal 100 due to rounding **total percentages do not equal 100 because visitors could select more than one answer
89
Services at Flagg Ranch
Question 15a On this visit, did you and your group use any of the services at Flagg Ranch (information station, lodge, campground, restaurant, gas station, horseback riding, hiking trails, etc.)?
Results 14% of visitor groups used Flagg
Ranch services (see Figure 113).
Figure 113: Visitor groups that used Flagg
Ranch services
Question 15b
If YES, which services?
Results
Table 23 shows the services that visitor groups (N=101) used at Flagg Ranch.
Table 23: Services used at Flagg Ranch N=169 comments;
some visitor groups made more than one comment.
Service
Number of times mentioned
Information center 43 Gas station 34
Restaurant 29
Lodge 15
Restrooms 13
Store 12
Campground 10
Hiking trails 5
Cabins 4
Activity coordinator 1
All facilities 1
Laundry 1
River 1
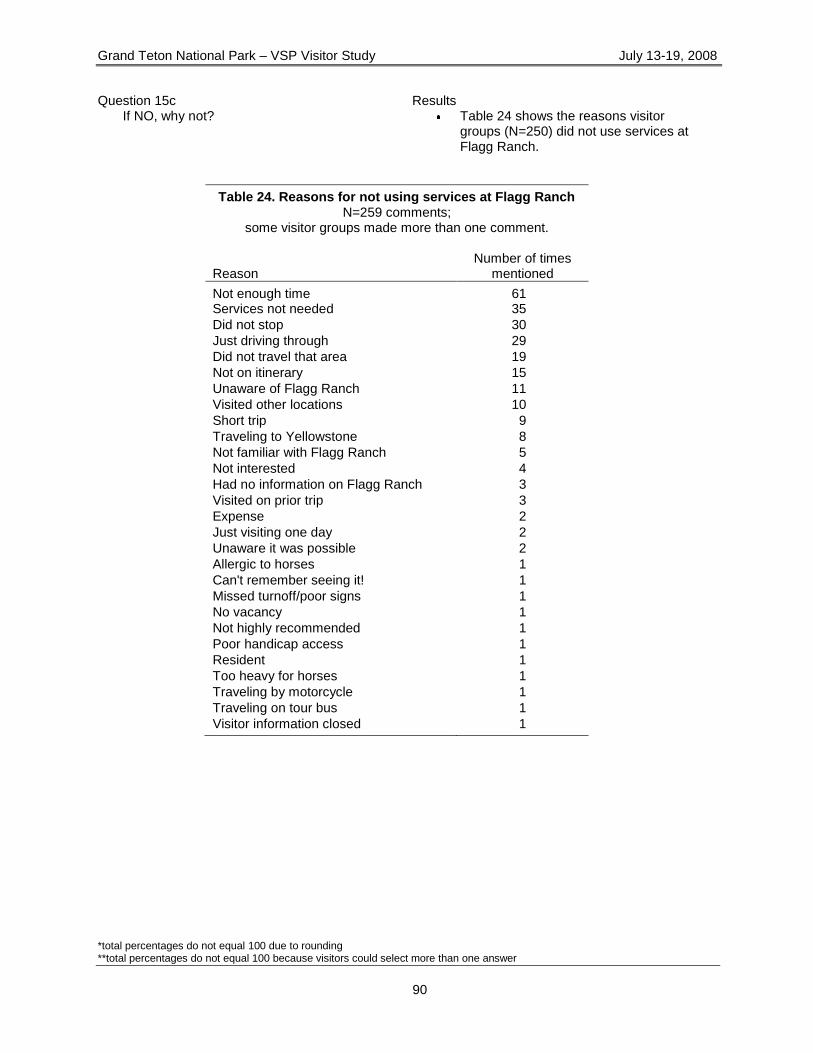
Grand Teton National Park – VSP Visitor Study July 13-19, 2008
*total percentages do not equal 100 due to rounding **total percentages do not equal 100 because visitors could select more than one answer
90
Question 15c
If NO, why not?
Results Table 24 shows the reasons visitor
groups (N=250) did not use services at Flagg Ranch.
Table 24. Reasons for not using services at Flagg Ranch N=259 comments;
some visitor groups made more than one comment.
Reason
Number of times mentioned
Not enough time 61 Services not needed 35
Did not stop 30
Just driving through 29
Did not travel that area 19
Not on itinerary 15
Unaware of Flagg Ranch 11
Visited other locations 10
Short trip 9
Traveling to Yellowstone 8
Not familiar with Flagg Ranch 5
Not interested 4
Had no information on Flagg Ranch 3
Visited on prior trip 3
Expense 2
Just visiting one day 2
Unaware it was possible 2
Allergic to horses 1
Can't remember seeing it! 1
Missed turnoff/poor signs 1
No vacancy 1
Not highly recommended 1
Poor handicap access 1
Resident 1
Too heavy for horses 1
Traveling by motorcycle 1
Traveling on tour bus 1
Visitor information closed 1
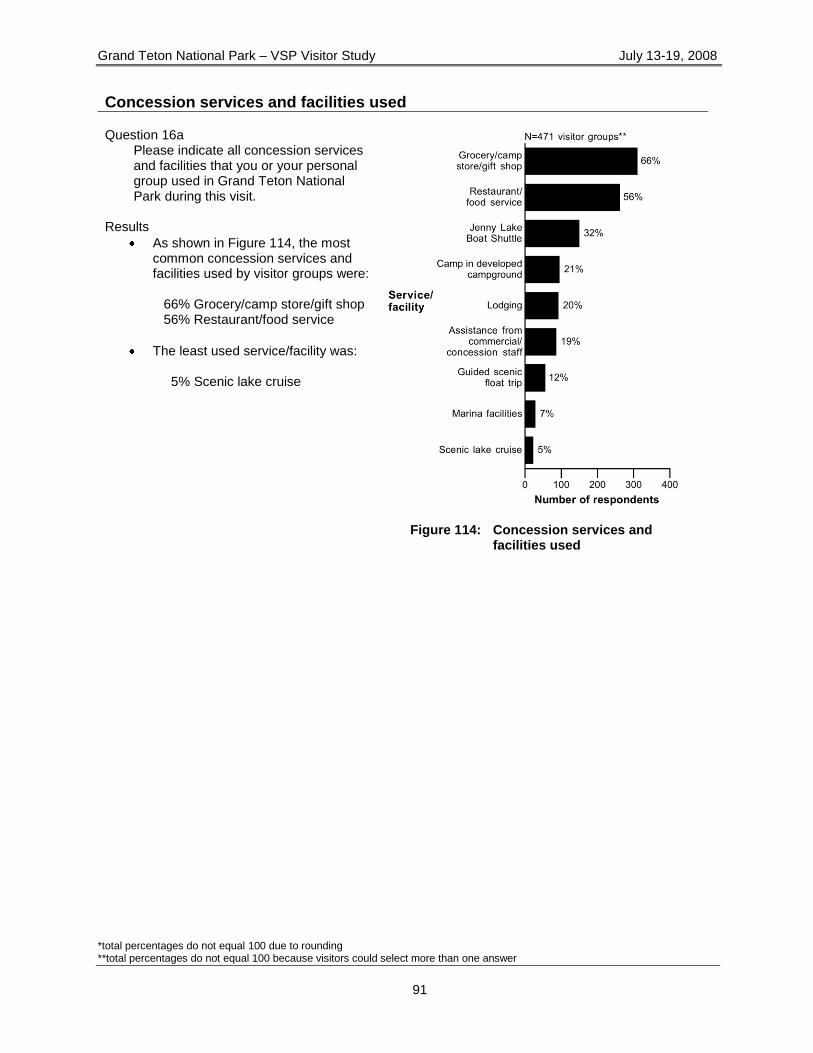
Grand Teton National Park – VSP Visitor Study July 13-19, 2008
*total percentages do not equal 100 due to rounding **total percentages do not equal 100 because visitors could select more than one answer
91
Concession services and facilities used Question 16a
Please indicate all concession services and facilities that you or your personal group used in Grand Teton National Park during this visit.
Results
As shown in Figure 114, the most common concession services and facilities used by visitor groups were:
66% Grocery/camp store/gift shop 56% Restaurant/food service
The least used service/facility was: 5% Scenic lake cruise
Figure 114: Concession services and
facilities used
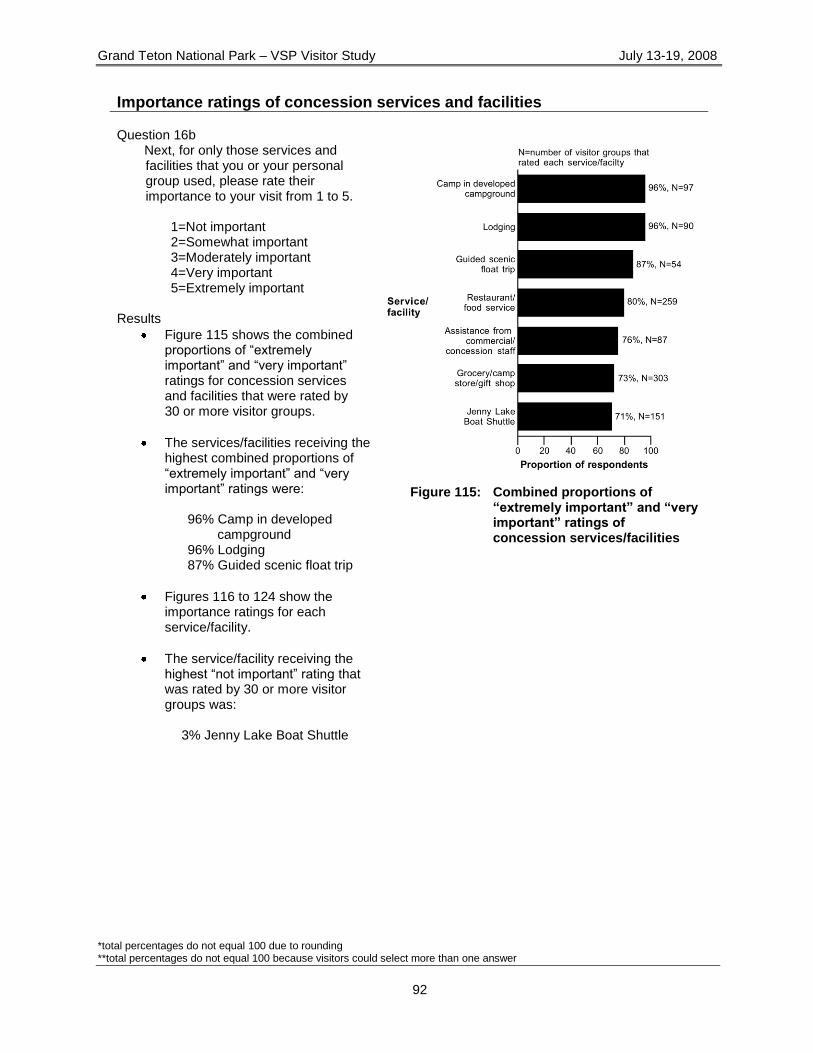
Grand Teton National Park – VSP Visitor Study July 13-19, 2008
*total percentages do not equal 100 due to rounding **total percentages do not equal 100 because visitors could select more than one answer
92
Importance ratings of concession services and facilities Question 16b
Next, for only those services and facilities that you or your personal group used, please rate their importance to your visit from 1 to 5.
1=Not important 2=Somewhat important 3=Moderately important 4=Very important 5=Extremely important
Results
Figure 115 shows the combined proportions of ―extremely important‖ and ―very important‖ ratings for concession services and facilities that were rated by 30 or more visitor groups.
The services/facilities receiving the highest combined proportions of ―extremely important‖ and ―very important‖ ratings were:
96% Camp in developed
campground 96% Lodging 87% Guided scenic float trip
Figures 116 to 124 show the importance ratings for each service/facility.
The service/facility receiving the highest ―not important‖ rating that was rated by 30 or more visitor groups was:
3% Jenny Lake Boat Shuttle
Figure 115: Combined proportions of
“extremely important” and “very important” ratings of concession services/facilities
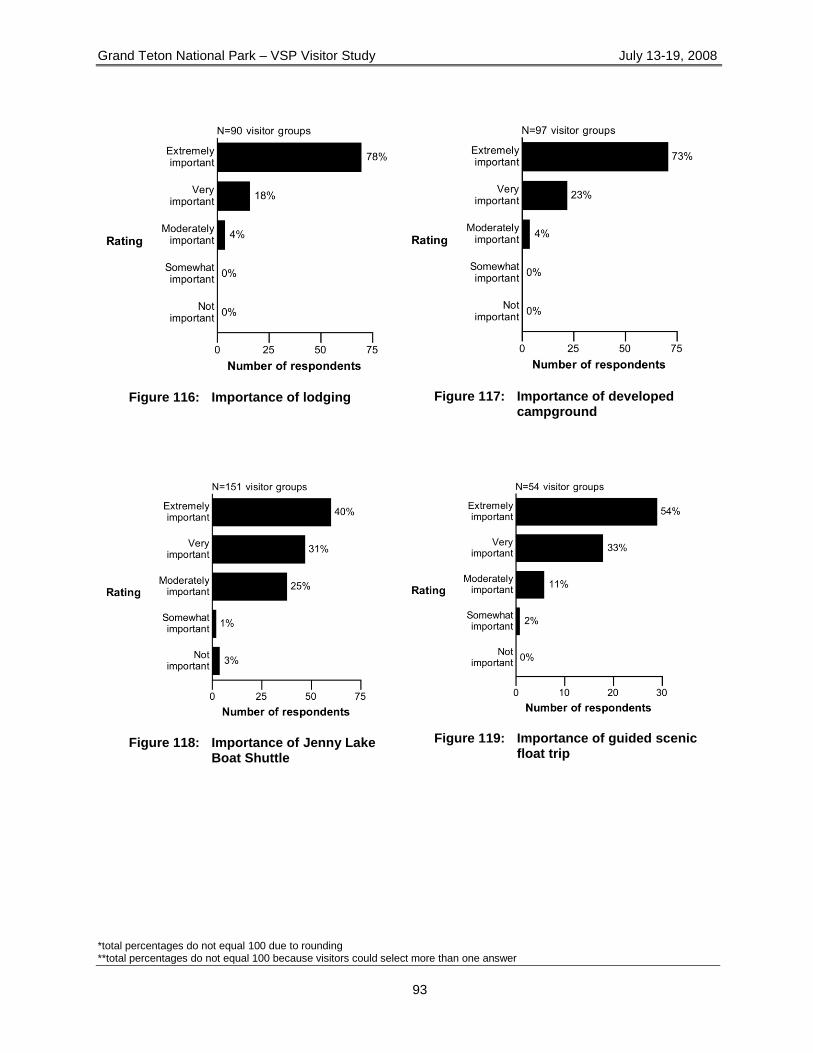
Grand Teton National Park – VSP Visitor Study July 13-19, 2008
*total percentages do not equal 100 due to rounding **total percentages do not equal 100 because visitors could select more than one answer
93
Figure 116: Importance of lodging
Figure 117: Importance of developed
campground
Figure 118: Importance of Jenny Lake
Boat Shuttle
Figure 119: Importance of guided scenic
float trip
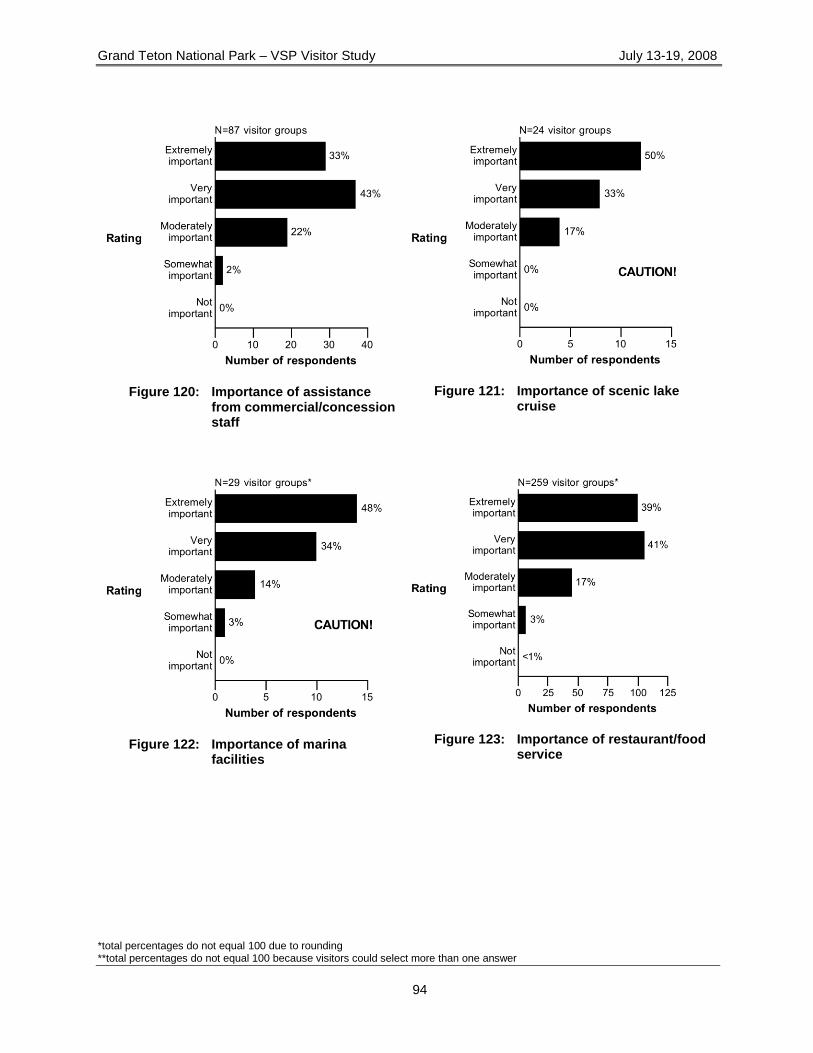
Grand Teton National Park – VSP Visitor Study July 13-19, 2008
*total percentages do not equal 100 due to rounding **total percentages do not equal 100 because visitors could select more than one answer
94
Figure 120: Importance of assistance
from commercial/concession staff
Figure 121: Importance of scenic lake
cruise
Figure 122: Importance of marina
facilities
Figure 123: Importance of restaurant/food
service
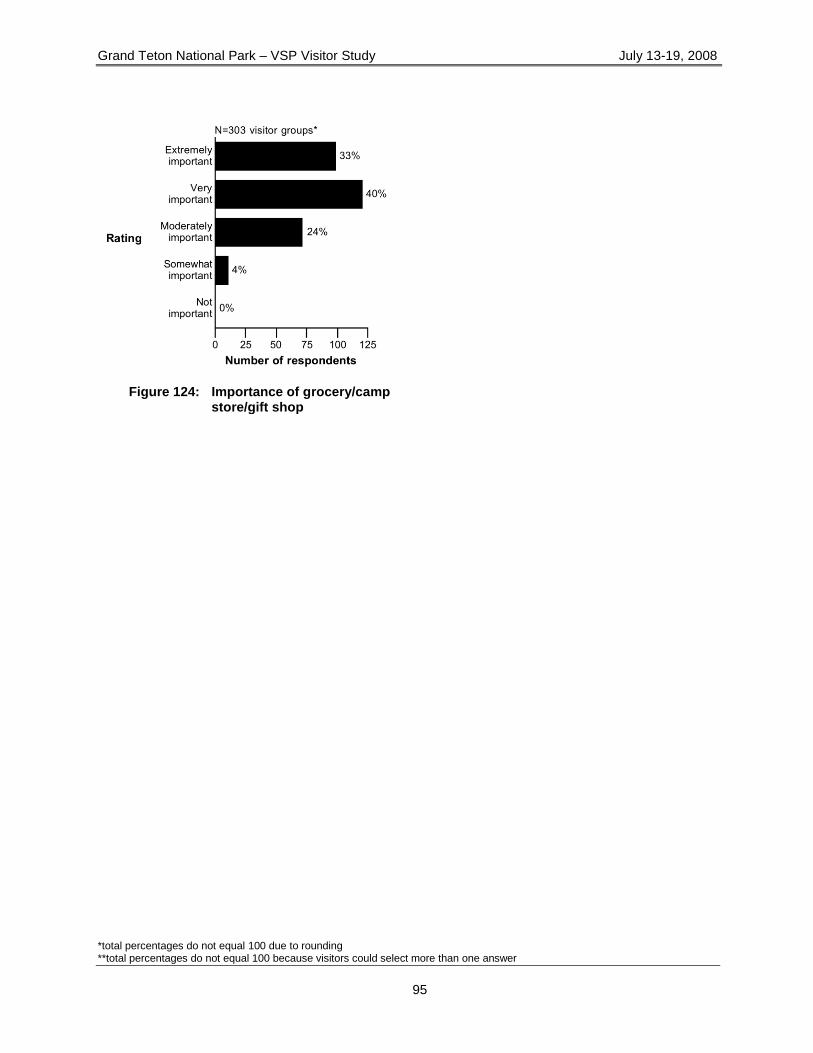
Grand Teton National Park – VSP Visitor Study July 13-19, 2008
*total percentages do not equal 100 due to rounding **total percentages do not equal 100 because visitors could select more than one answer
95
Figure 124: Importance of grocery/camp
store/gift shop
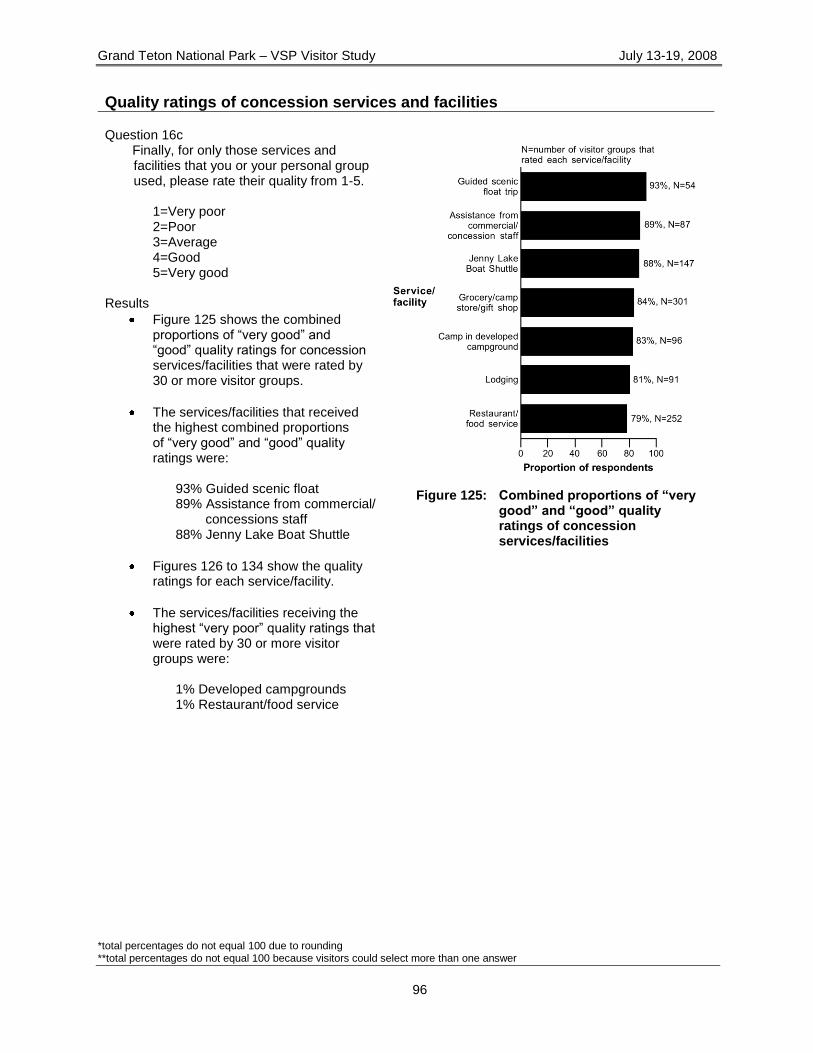
Grand Teton National Park – VSP Visitor Study July 13-19, 2008
*total percentages do not equal 100 due to rounding **total percentages do not equal 100 because visitors could select more than one answer
96
Quality ratings of concession services and facilities Question 16c
Finally, for only those services and facilities that you or your personal group used, please rate their quality from 1-5.
1=Very poor 2=Poor 3=Average 4=Good 5=Very good
Results
Figure 125 shows the combined proportions of ―very good‖ and ―good‖ quality ratings for concession services/facilities that were rated by 30 or more visitor groups.
The services/facilities that received the highest combined proportions of ―very good‖ and ―good‖ quality ratings were:
93% Guided scenic float 89% Assistance from commercial/
concessions staff 88% Jenny Lake Boat Shuttle
Figures 126 to 134 show the quality ratings for each service/facility.
The services/facilities receiving the highest ―very poor‖ quality ratings that were rated by 30 or more visitor groups were:
1% Developed campgrounds 1% Restaurant/food service
Figure 125: Combined proportions of “very
good” and “good” quality ratings of concession services/facilities
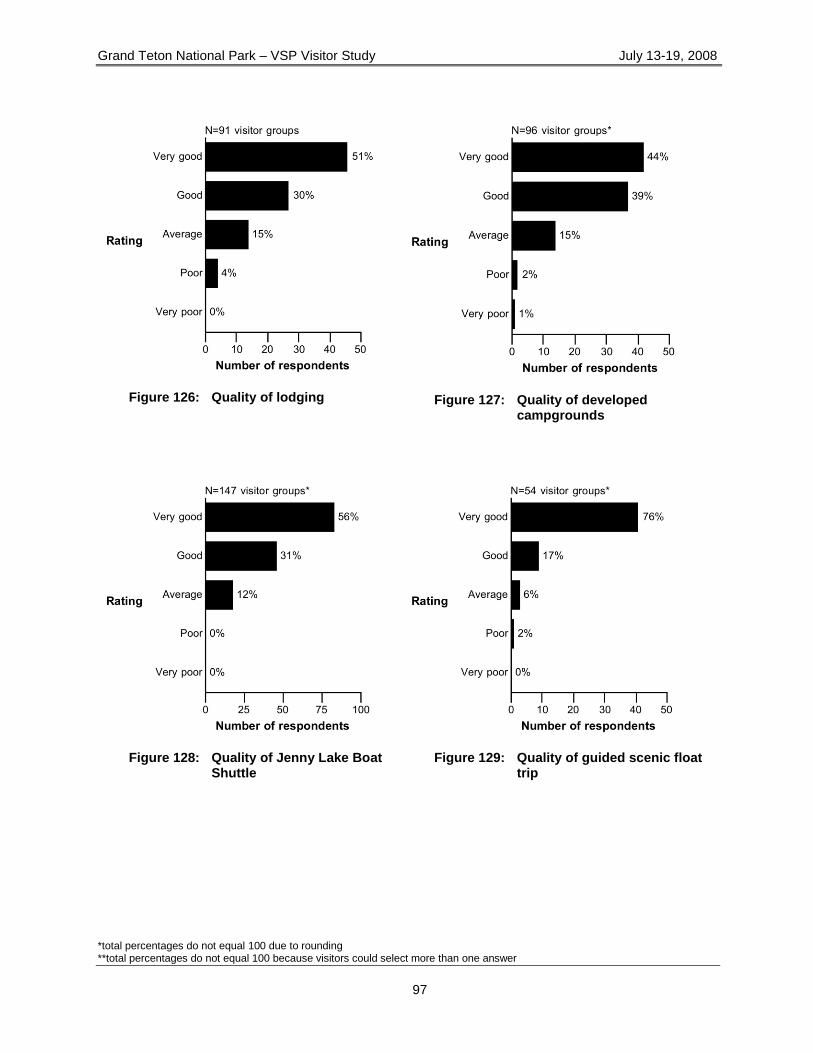
Grand Teton National Park – VSP Visitor Study July 13-19, 2008
*total percentages do not equal 100 due to rounding **total percentages do not equal 100 because visitors could select more than one answer
97
Figure 126: Quality of lodging
Figure 127: Quality of developed
campgrounds
Figure 128: Quality of Jenny Lake Boat
Shuttle
Figure 129: Quality of guided scenic float
trip
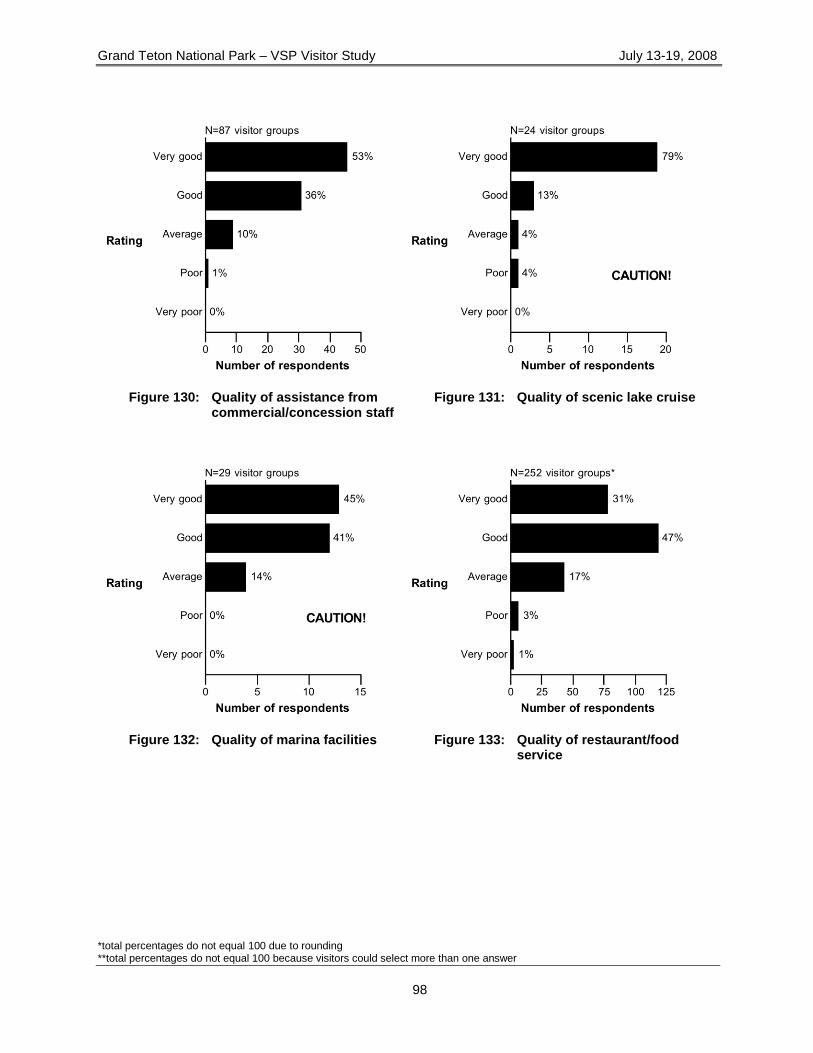
Grand Teton National Park – VSP Visitor Study July 13-19, 2008
*total percentages do not equal 100 due to rounding **total percentages do not equal 100 because visitors could select more than one answer
98
Figure 130: Quality of assistance from
commercial/concession staff
Figure 131: Quality of scenic lake cruise
Figure 132: Quality of marina facilities
Figure 133: Quality of restaurant/food
service
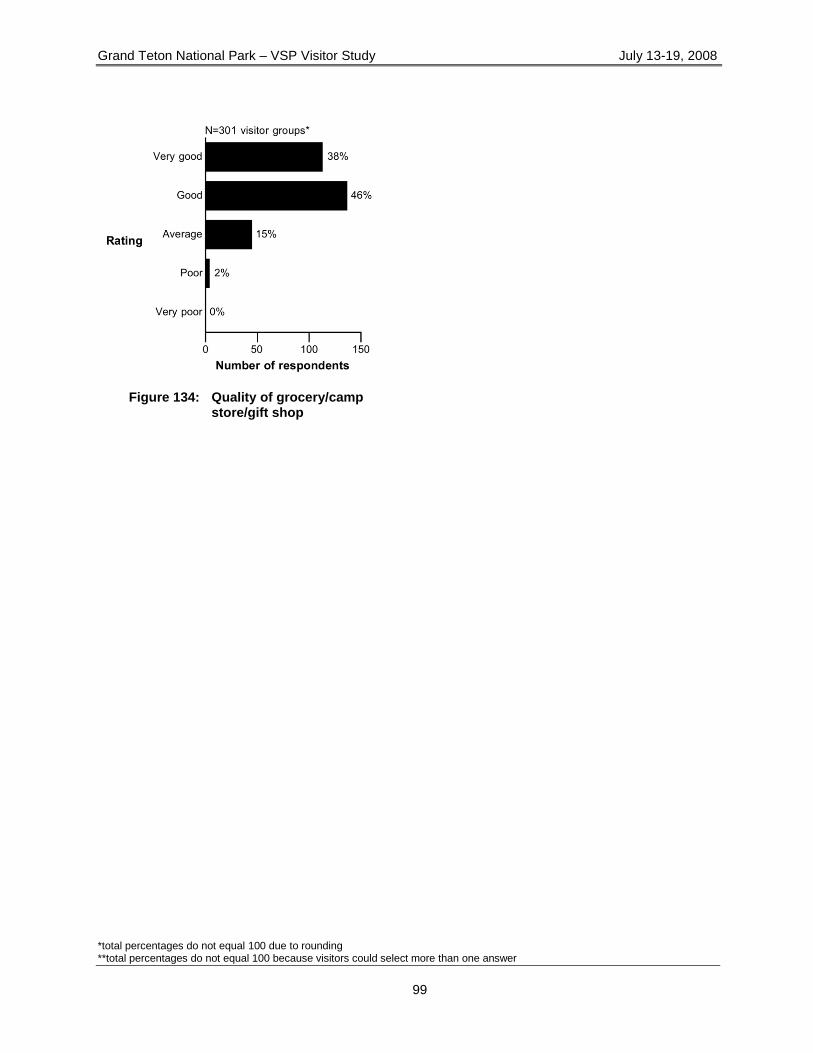
Grand Teton National Park – VSP Visitor Study July 13-19, 2008
*total percentages do not equal 100 due to rounding **total percentages do not equal 100 because visitors could select more than one answer
99
Figure 134: Quality of grocery/camp
store/gift shop
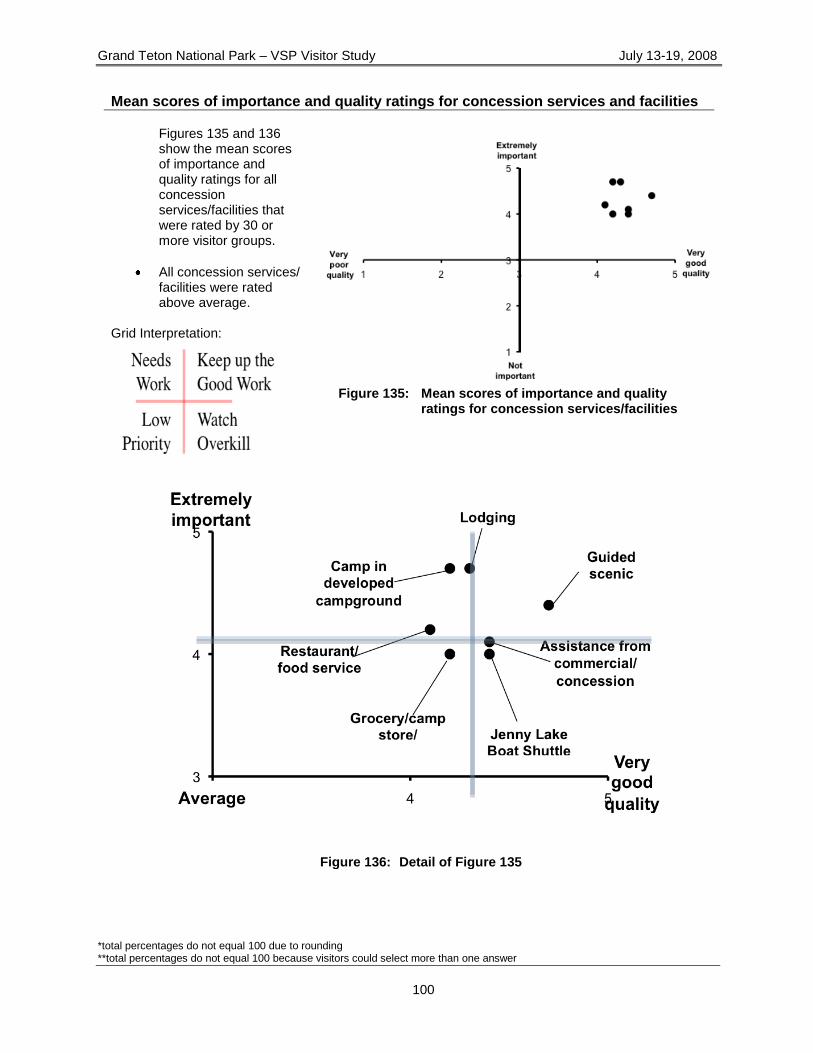
Grand Teton National Park – VSP Visitor Study July 13-19, 2008
*total percentages do not equal 100 due to rounding **total percentages do not equal 100 because visitors could select more than one answer
100
Mean scores of importance and quality ratings for concession services and facilities
Figures 135 and 136 show the mean scores of importance and quality ratings for all concession services/facilities that were rated by 30 or more visitor groups.
All concession services/ facilities were rated above average.
Grid Interpretation:
Figure 135: Mean scores of importance and quality
ratings for concession services/facilities
Figure 136: Detail of Figure 135
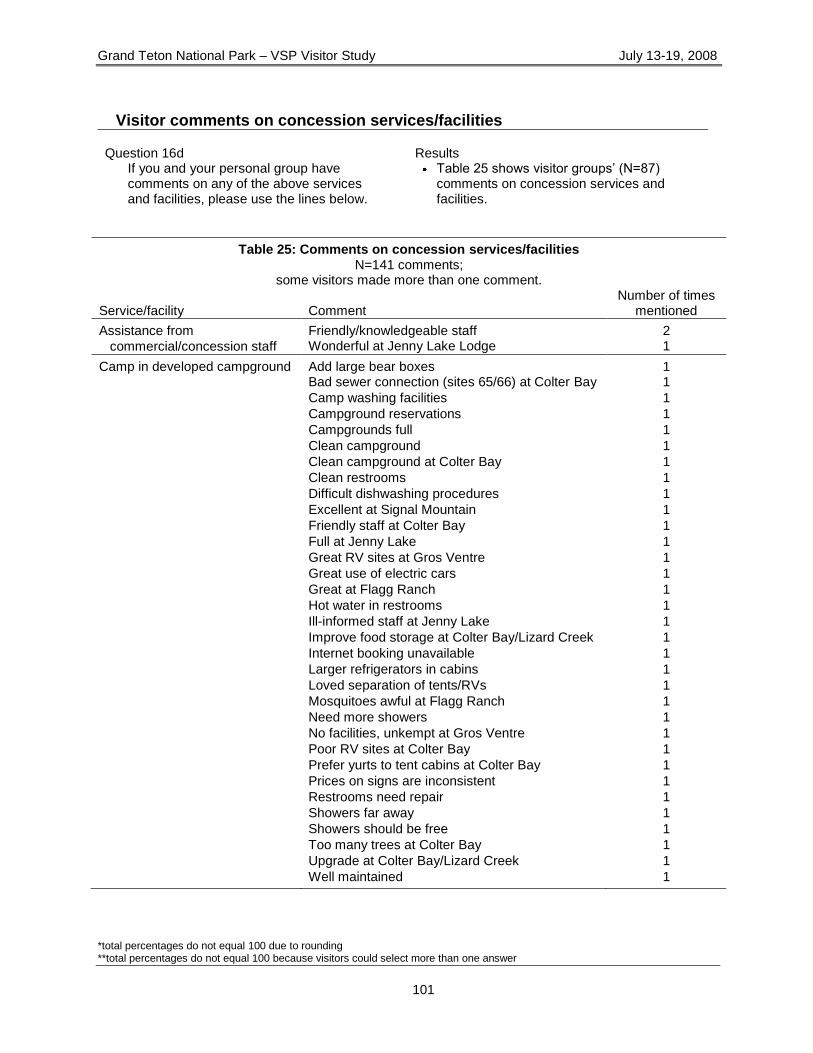
Grand Teton National Park – VSP Visitor Study July 13-19, 2008
*total percentages do not equal 100 due to rounding **total percentages do not equal 100 because visitors could select more than one answer
101
Visitor comments on concession services/facilities
Question 16d If you and your personal group have comments on any of the above services and facilities, please use the lines below.
Results
Table 25 shows visitor groups‘ (N=87) comments on concession services and facilities.
Table 25: Comments on concession services/facilities N=141 comments;
some visitors made more than one comment. Service/facility
Comment
Number of times mentioned
Assistance from Friendly/knowledgeable staff 2
commercial/concession staff Wonderful at Jenny Lake Lodge 1
Camp in developed campground Add large bear boxes 1
Bad sewer connection (sites 65/66) at Colter Bay 1
Camp washing facilities 1
Campground reservations 1
Campgrounds full 1
Clean campground 1
Clean campground at Colter Bay 1
Clean restrooms 1
Difficult dishwashing procedures 1
Excellent at Signal Mountain 1
Friendly staff at Colter Bay 1
Full at Jenny Lake 1
Great RV sites at Gros Ventre 1
Great use of electric cars 1
Great at Flagg Ranch 1
Hot water in restrooms 1
Ill-informed staff at Jenny Lake 1
Improve food storage at Colter Bay/Lizard Creek 1
Internet booking unavailable 1
Larger refrigerators in cabins 1
Loved separation of tents/RVs 1
Mosquitoes awful at Flagg Ranch 1
Need more showers 1
No facilities, unkempt at Gros Ventre 1
Poor RV sites at Colter Bay 1
Prefer yurts to tent cabins at Colter Bay 1
Prices on signs are inconsistent 1
Restrooms need repair 1
Showers far away 1
Showers should be free 1
Too many trees at Colter Bay 1
Upgrade at Colter Bay/Lizard Creek 1
Well maintained 1
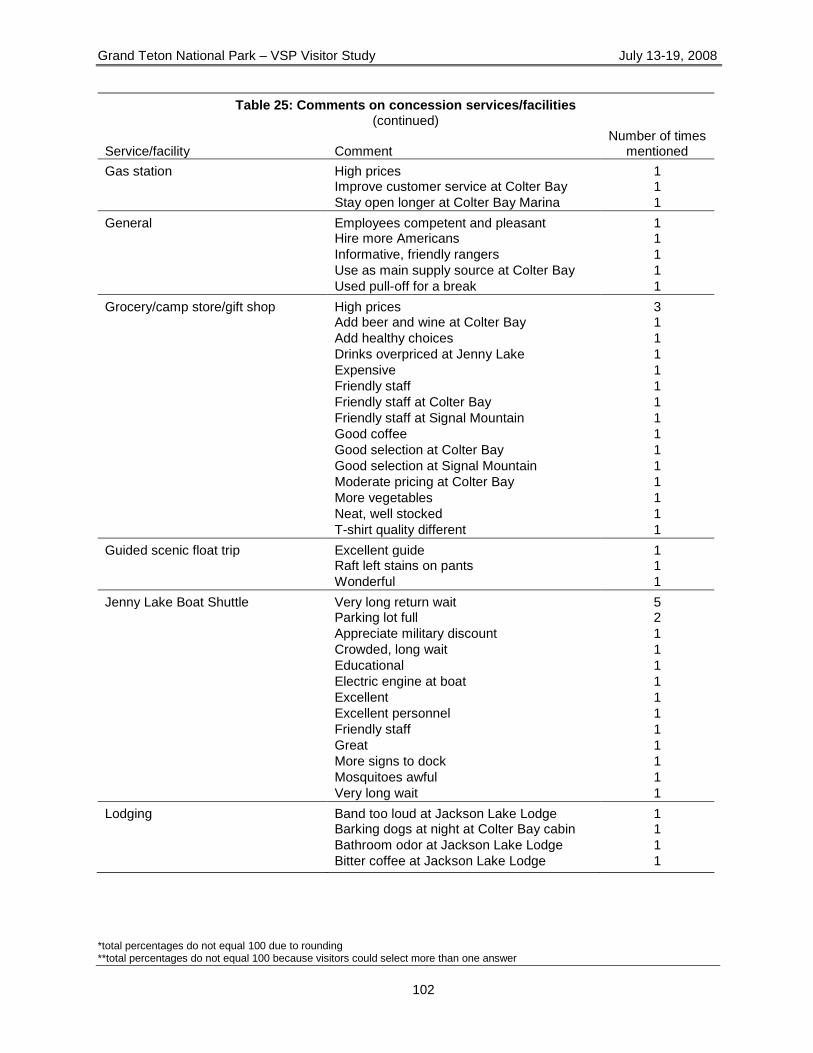
Grand Teton National Park – VSP Visitor Study July 13-19, 2008
*total percentages do not equal 100 due to rounding **total percentages do not equal 100 because visitors could select more than one answer
102
Table 25: Comments on concession services/facilities (continued)
Service/facility
Comment
Number of times mentioned
Gas station High prices 1
Improve customer service at Colter Bay 1
Stay open longer at Colter Bay Marina 1
General Employees competent and pleasant 1
Hire more Americans 1
Informative, friendly rangers 1
Use as main supply source at Colter Bay 1
Used pull-off for a break 1
Grocery/camp store/gift shop High prices 3
Add beer and wine at Colter Bay 1
Add healthy choices 1
Drinks overpriced at Jenny Lake 1
Expensive 1
Friendly staff 1
Friendly staff at Colter Bay 1
Friendly staff at Signal Mountain 1
Good coffee 1
Good selection at Colter Bay 1
Good selection at Signal Mountain 1
Moderate pricing at Colter Bay 1
More vegetables 1
Neat, well stocked 1
T-shirt quality different 1
Guided scenic float trip Excellent guide 1
Raft left stains on pants 1
Wonderful 1
Jenny Lake Boat Shuttle Very long return wait 5
Parking lot full 2
Appreciate military discount 1
Crowded, long wait 1
Educational 1
Electric engine at boat 1
Excellent 1
Excellent personnel 1
Friendly staff 1
Great 1
More signs to dock 1
Mosquitoes awful 1
Very long wait 1
Lodging Band too loud at Jackson Lake Lodge 1
Barking dogs at night at Colter Bay cabin 1
Bathroom odor at Jackson Lake Lodge 1
Bitter coffee at Jackson Lake Lodge 1
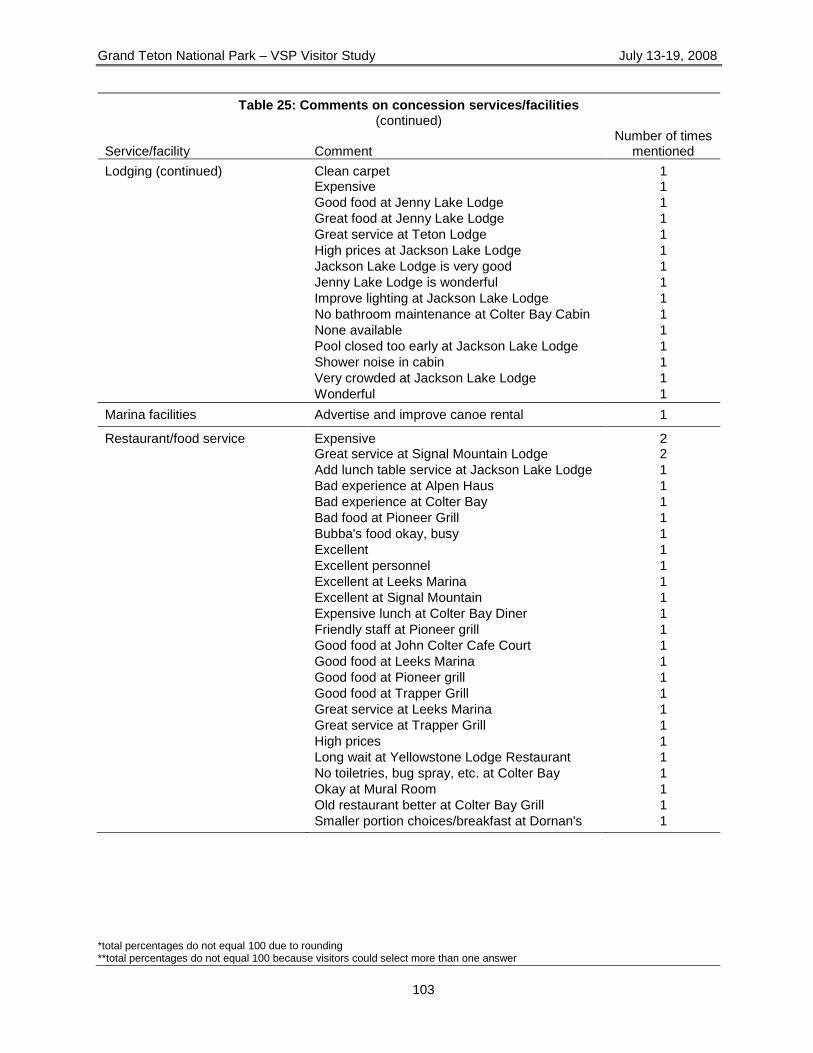
Grand Teton National Park – VSP Visitor Study July 13-19, 2008
*total percentages do not equal 100 due to rounding **total percentages do not equal 100 because visitors could select more than one answer
103
Table 25: Comments on concession services/facilities (continued)
Service/facility
Comment
Number of times mentioned
Lodging (continued) Clean carpet 1
Expensive 1
Good food at Jenny Lake Lodge 1
Great food at Jenny Lake Lodge 1
Great service at Teton Lodge 1
High prices at Jackson Lake Lodge 1
Jackson Lake Lodge is very good 1
Jenny Lake Lodge is wonderful 1
Improve lighting at Jackson Lake Lodge 1
No bathroom maintenance at Colter Bay Cabin 1
None available 1
Pool closed too early at Jackson Lake Lodge 1
Shower noise in cabin 1
Very crowded at Jackson Lake Lodge 1
Wonderful 1
Marina facilities Advertise and improve canoe rental 1
Restaurant/food service Expensive 2
Great service at Signal Mountain Lodge 2
Add lunch table service at Jackson Lake Lodge 1
Bad experience at Alpen Haus 1
Bad experience at Colter Bay 1
Bad food at Pioneer Grill 1
Bubba's food okay, busy 1
Excellent 1
Excellent personnel 1
Excellent at Leeks Marina 1
Excellent at Signal Mountain 1
Expensive lunch at Colter Bay Diner 1
Friendly staff at Pioneer grill 1
Good food at John Colter Cafe Court 1
Good food at Leeks Marina 1
Good food at Pioneer grill 1
Good food at Trapper Grill 1
Great service at Leeks Marina 1
Great service at Trapper Grill 1
High prices 1
Long wait at Yellowstone Lodge Restaurant 1
No toiletries, bug spray, etc. at Colter Bay 1
Okay at Mural Room 1
Old restaurant better at Colter Bay Grill 1
Smaller portion choices/breakfast at Dornan's 1
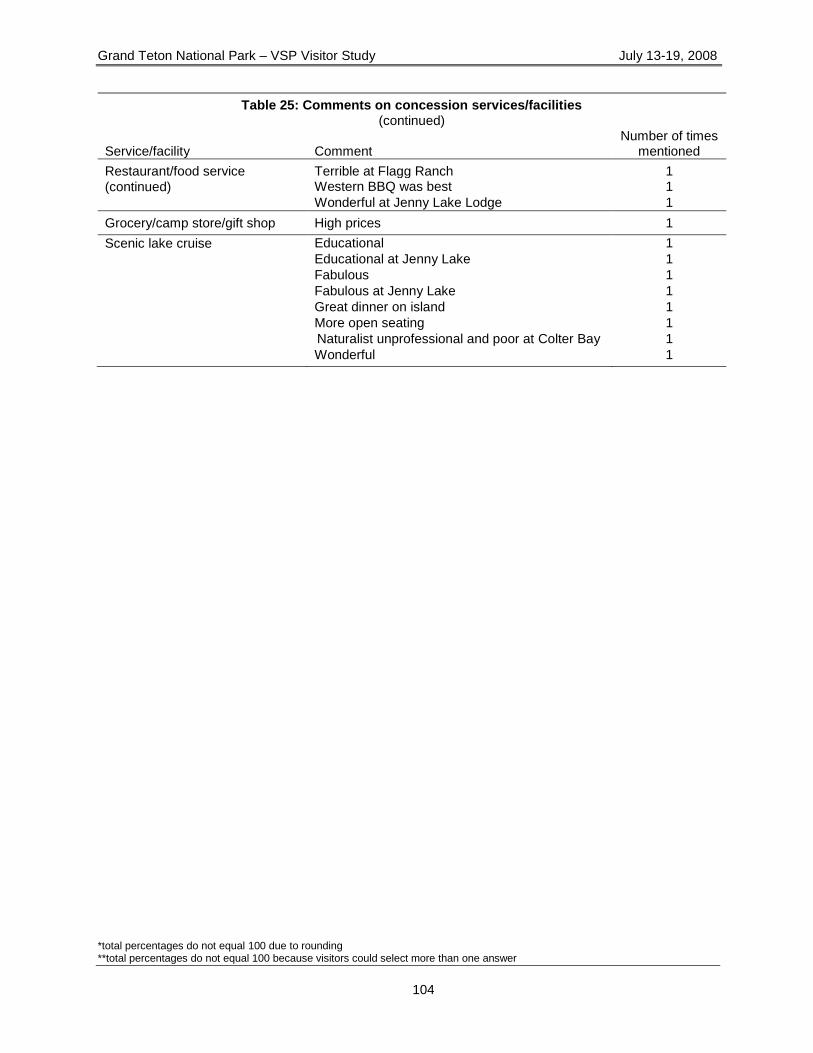
Grand Teton National Park – VSP Visitor Study July 13-19, 2008
*total percentages do not equal 100 due to rounding **total percentages do not equal 100 because visitors could select more than one answer
104
Table 25: Comments on concession services/facilities (continued)
Service/facility
Comment
Number of times mentioned
Restaurant/food service Terrible at Flagg Ranch 1
(continued) Western BBQ was best 1
Wonderful at Jenny Lake Lodge 1
Grocery/camp store/gift shop High prices 1
Scenic lake cruise Educational 1
Educational at Jenny Lake 1
Fabulous 1
Fabulous at Jenny Lake 1
Great dinner on island 1
More open seating 1
Naturalist unprofessional and poor at Colter Bay 1
Wonderful 1
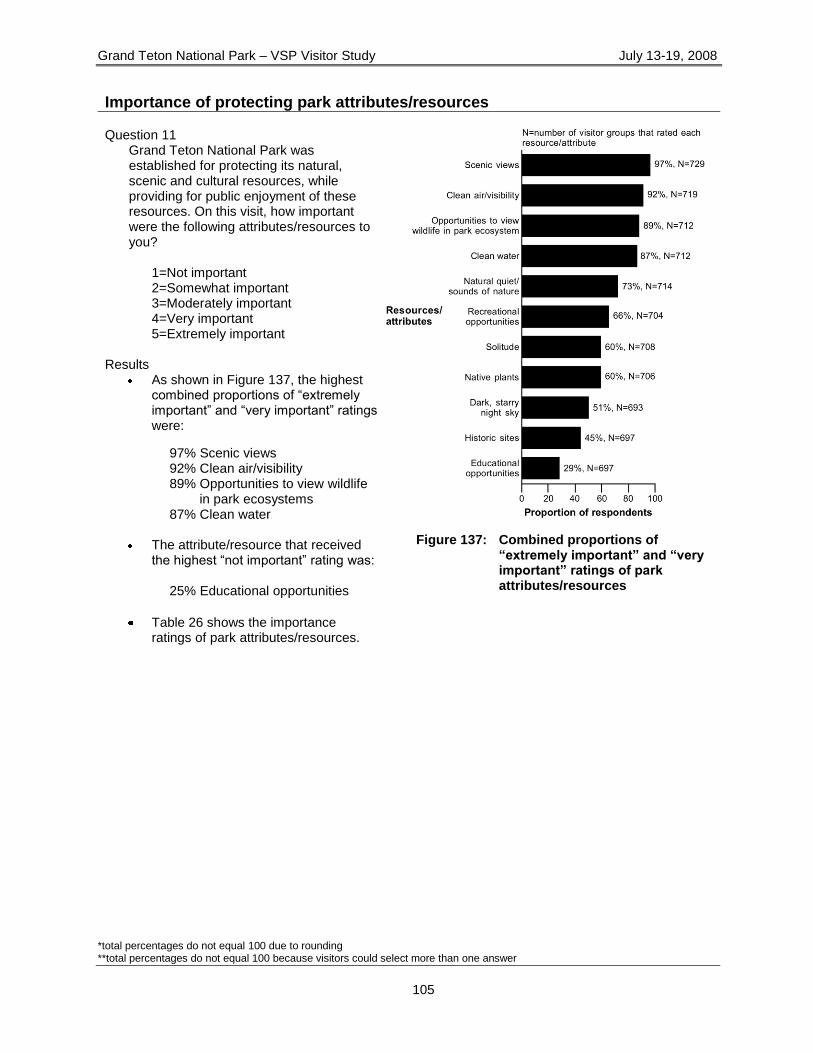
Grand Teton National Park – VSP Visitor Study July 13-19, 2008
*total percentages do not equal 100 due to rounding **total percentages do not equal 100 because visitors could select more than one answer
105
Importance of protecting park attributes/resources Question 11
Grand Teton National Park was established for protecting its natural, scenic and cultural resources, while providing for public enjoyment of these resources. On this visit, how important were the following attributes/resources to you?
1=Not important 2=Somewhat important 3=Moderately important 4=Very important 5=Extremely important
Results
As shown in Figure 137, the highest combined proportions of ―extremely important‖ and ―very important‖ ratings were:
97% Scenic views 92% Clean air/visibility 89% Opportunities to view wildlife
in park ecosystems 87% Clean water
The attribute/resource that received the highest ―not important‖ rating was:
25% Educational opportunities
Table 26 shows the importance ratings of park attributes/resources.
Figure 137: Combined proportions of
“extremely important” and “very important” ratings of park attributes/resources
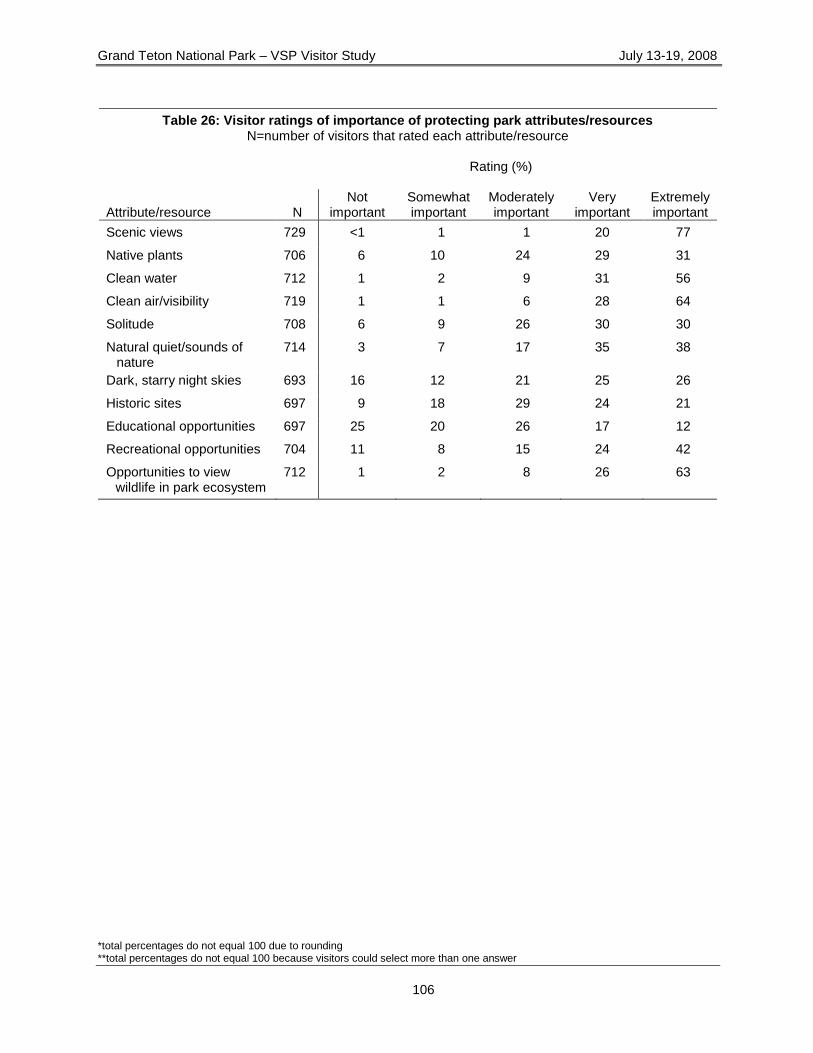
Grand Teton National Park – VSP Visitor Study July 13-19, 2008
*total percentages do not equal 100 due to rounding **total percentages do not equal 100 because visitors could select more than one answer
106
Table 26: Visitor ratings of importance of protecting park attributes/resources N=number of visitors that rated each attribute/resource
Rating (%)
Attribute/resource
N
Not important
Somewhat important
Moderately important
Very important
Extremely important
Scenic views 729 <1 1 1 20 77
Native plants 706 6 10 24 29 31
Clean water 712 1 2 9 31 56
Clean air/visibility 719 1 1 6 28 64
Solitude 708 6 9 26 30 30
Natural quiet/sounds of nature
714 3 7 17 35 38
Dark, starry night skies 693 16 12 21 25 26
Historic sites 697 9 18 29 24 21
Educational opportunities 697 25 20 26 17 12
Recreational opportunities 704 11 8 15 24 42
Opportunities to view wildlife in park ecosystem
712 1 2 8 26 63
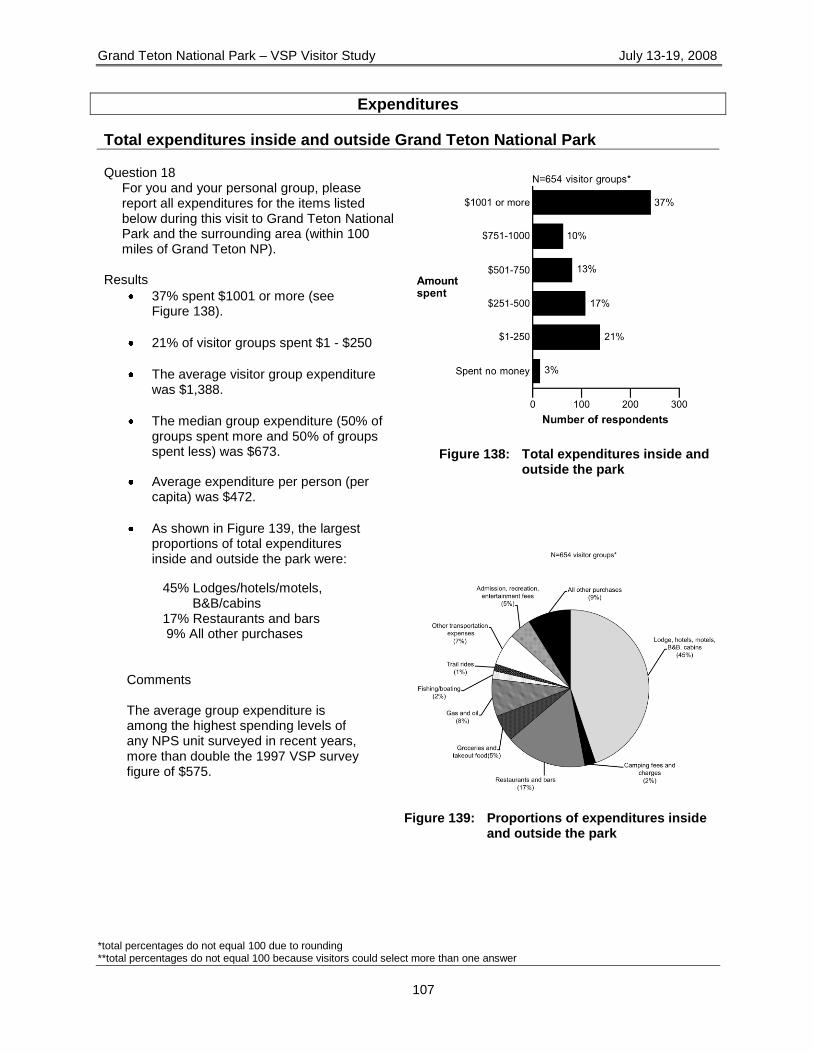
Grand Teton National Park – VSP Visitor Study July 13-19, 2008
*total percentages do not equal 100 due to rounding **total percentages do not equal 100 because visitors could select more than one answer
107
Expenditures
Total expenditures inside and outside Grand Teton National Park Question 18
For you and your personal group, please report all expenditures for the items listed below during this visit to Grand Teton National Park and the surrounding area (within 100 miles of Grand Teton NP).
Results
37% spent $1001 or more (see Figure 138).
21% of visitor groups spent $1 - $250
The average visitor group expenditure was $1,388.
The median group expenditure (50% of groups spent more and 50% of groups spent less) was $673.
Average expenditure per person (per capita) was $472.
Figure 138: Total expenditures inside and outside the park
As shown in Figure 139, the largest proportions of total expenditures inside and outside the park were:
45% Lodges/hotels/motels, B&B/cabins
17% Restaurants and bars 9% All other purchases
Comments The average group expenditure is among the highest spending levels of any NPS unit surveyed in recent years, more than double the 1997 VSP survey figure of $575.
Figure 139: Proportions of expenditures inside
and outside the park
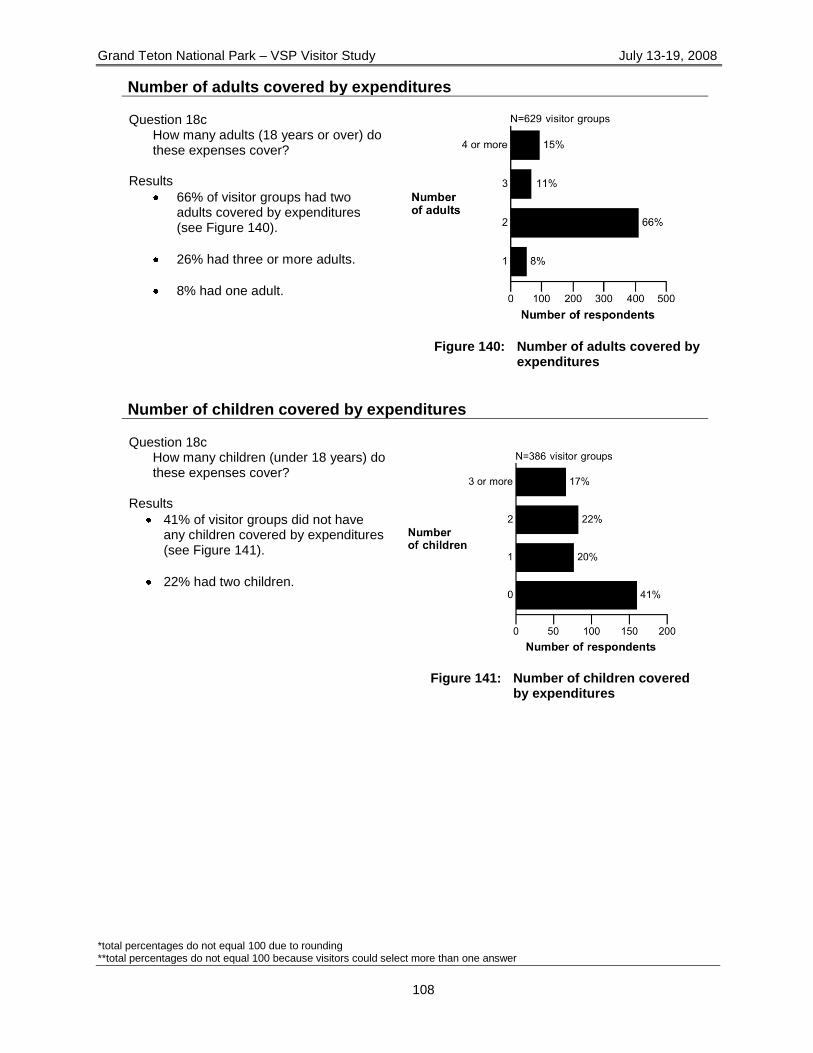
Grand Teton National Park – VSP Visitor Study July 13-19, 2008
*total percentages do not equal 100 due to rounding **total percentages do not equal 100 because visitors could select more than one answer
108
Number of adults covered by expenditures Question 18c
How many adults (18 years or over) do these expenses cover?
Results
66% of visitor groups had two adults covered by expenditures (see Figure 140).
26% had three or more adults.
8% had one adult.
Figure 140: Number of adults covered by
expenditures
Number of children covered by expenditures Question 18c
How many children (under 18 years) do these expenses cover?
Results
41% of visitor groups did not have any children covered by expenditures (see Figure 141).
22% had two children.
Figure 141: Number of children covered
by expenditures
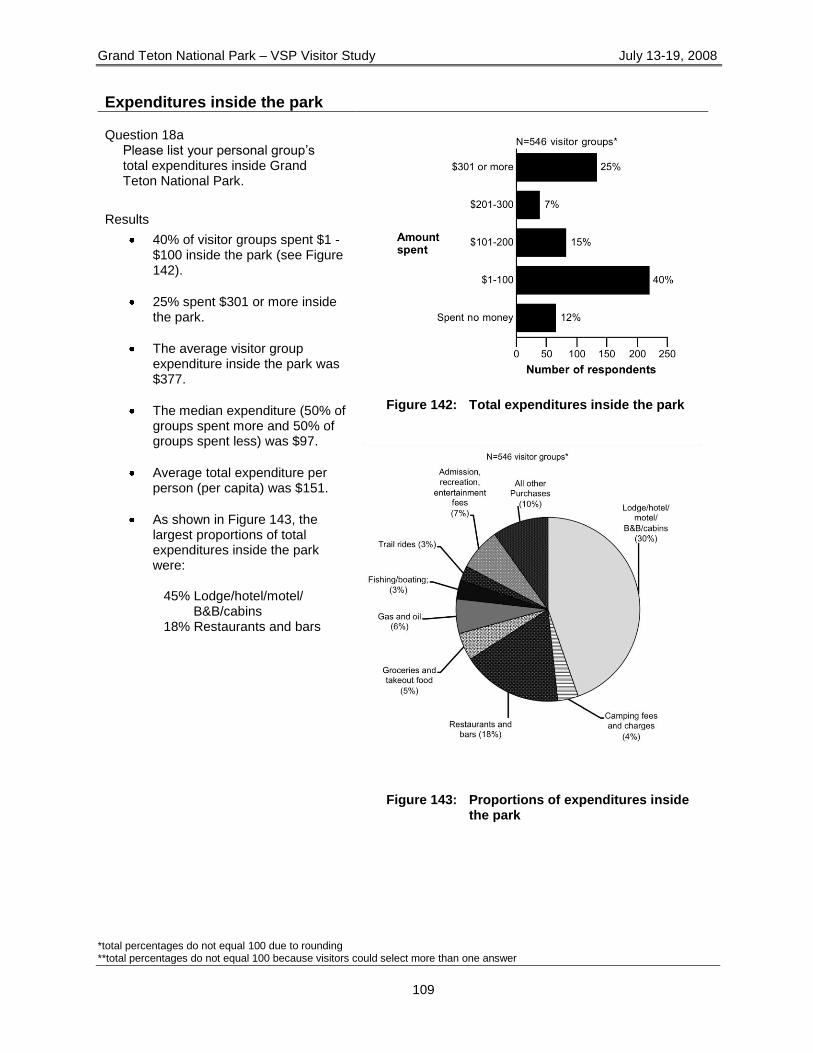
Grand Teton National Park – VSP Visitor Study July 13-19, 2008
*total percentages do not equal 100 due to rounding **total percentages do not equal 100 because visitors could select more than one answer
109
Expenditures inside the park Question 18a
Please list your personal group‘s total expenditures inside Grand Teton National Park.
Results
40% of visitor groups spent $1 - $100 inside the park (see Figure 142).
25% spent $301 or more inside the park.
The average visitor group expenditure inside the park was $377.
The median expenditure (50% of groups spent more and 50% of groups spent less) was $97.
Average total expenditure per person (per capita) was $151.
As shown in Figure 143, the largest proportions of total expenditures inside the park were:
45% Lodge/hotel/motel/
B&B/cabins 18% Restaurants and bars
Figure 142: Total expenditures inside the park
Figure 143: Proportions of expenditures inside
the park
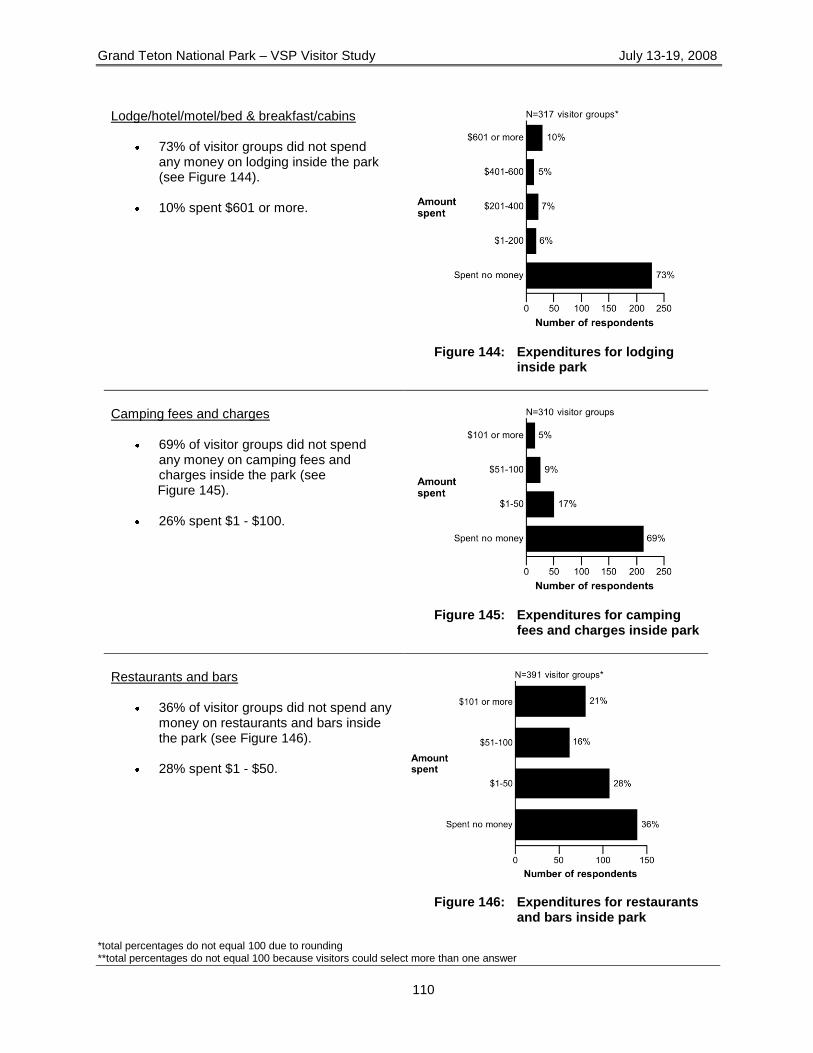
Grand Teton National Park – VSP Visitor Study July 13-19, 2008
*total percentages do not equal 100 due to rounding **total percentages do not equal 100 because visitors could select more than one answer
110
Lodge/hotel/motel/bed & breakfast/cabins
73% of visitor groups did not spend any money on lodging inside the park (see Figure 144).
10% spent $601 or more.
Figure 144: Expenditures for lodging inside park
Camping fees and charges
69% of visitor groups did not spend any money on camping fees and charges inside the park (see Figure 145).
26% spent $1 - $100.
Figure 145: Expenditures for camping
fees and charges inside park
Restaurants and bars
36% of visitor groups did not spend any money on restaurants and bars inside the park (see Figure 146).
28% spent $1 - $50.
Figure 146: Expenditures for restaurants
and bars inside park
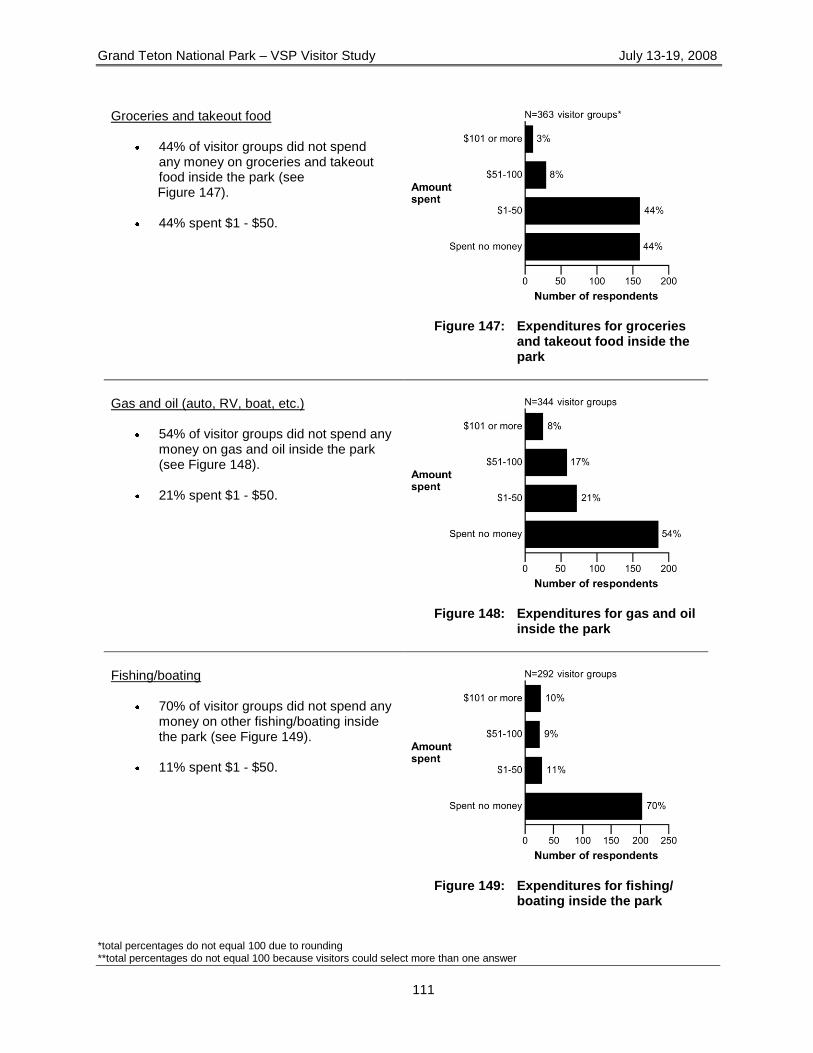
Grand Teton National Park – VSP Visitor Study July 13-19, 2008
*total percentages do not equal 100 due to rounding **total percentages do not equal 100 because visitors could select more than one answer
111
Groceries and takeout food
44% of visitor groups did not spend any money on groceries and takeout food inside the park (see Figure 147).
44% spent $1 - $50.
Figure 147: Expenditures for groceries and takeout food inside the park
Gas and oil (auto, RV, boat, etc.)
54% of visitor groups did not spend any money on gas and oil inside the park (see Figure 148).
21% spent $1 - $50.
Figure 148: Expenditures for gas and oil
inside the park
Fishing/boating
70% of visitor groups did not spend any money on other fishing/boating inside the park (see Figure 149).
11% spent $1 - $50.
Figure 149: Expenditures for fishing/
boating inside the park
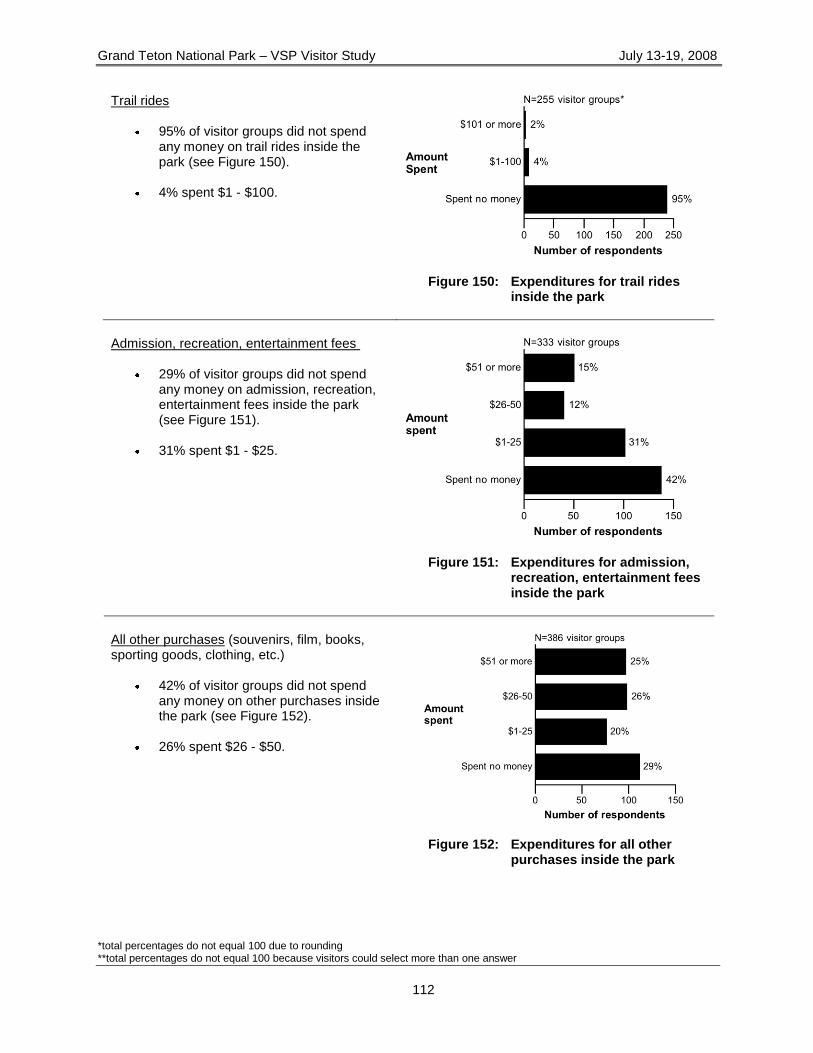
Grand Teton National Park – VSP Visitor Study July 13-19, 2008
*total percentages do not equal 100 due to rounding **total percentages do not equal 100 because visitors could select more than one answer
112
Trail rides
95% of visitor groups did not spend any money on trail rides inside the park (see Figure 150).
4% spent $1 - $100.
Figure 150: Expenditures for trail rides
inside the park
Admission, recreation, entertainment fees
29% of visitor groups did not spend any money on admission, recreation, entertainment fees inside the park (see Figure 151).
31% spent $1 - $25.
Figure 151: Expenditures for admission,
recreation, entertainment fees inside the park
All other purchases (souvenirs, film, books, sporting goods, clothing, etc.)
42% of visitor groups did not spend any money on other purchases inside the park (see Figure 152).
26% spent $26 - $50.
Figure 152: Expenditures for all other purchases inside the park
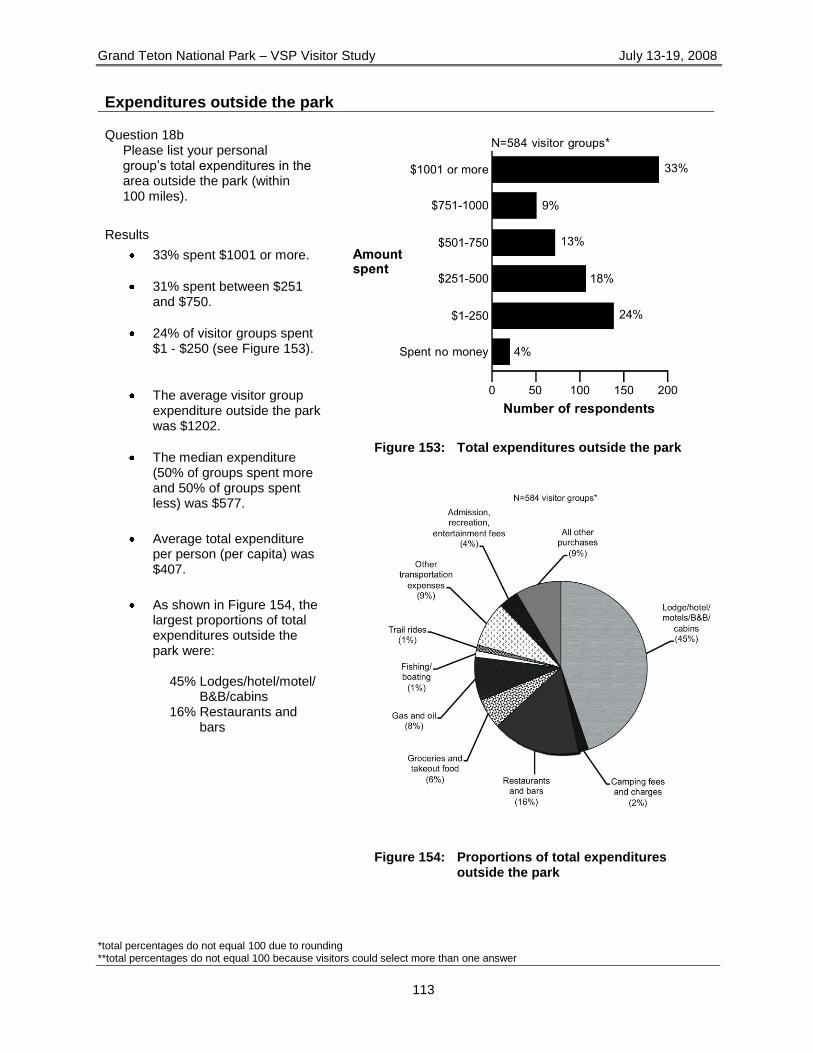
Grand Teton National Park – VSP Visitor Study July 13-19, 2008
*total percentages do not equal 100 due to rounding **total percentages do not equal 100 because visitors could select more than one answer
113
Expenditures outside the park Question 18b
Please list your personal group‘s total expenditures in the area outside the park (within 100 miles).
Results
33% spent $1001 or more.
31% spent between $251 and $750.
24% of visitor groups spent $1 - $250 (see Figure 153).
The average visitor group expenditure outside the park was $1202.
The median expenditure (50% of groups spent more and 50% of groups spent less) was $577.
Average total expenditure per person (per capita) was $407.
As shown in Figure 154, the largest proportions of total expenditures outside the park were:
45% Lodges/hotel/motel/
B&B/cabins 16% Restaurants and
bars
Figure 153: Total expenditures outside the park
Figure 154: Proportions of total expenditures
outside the park
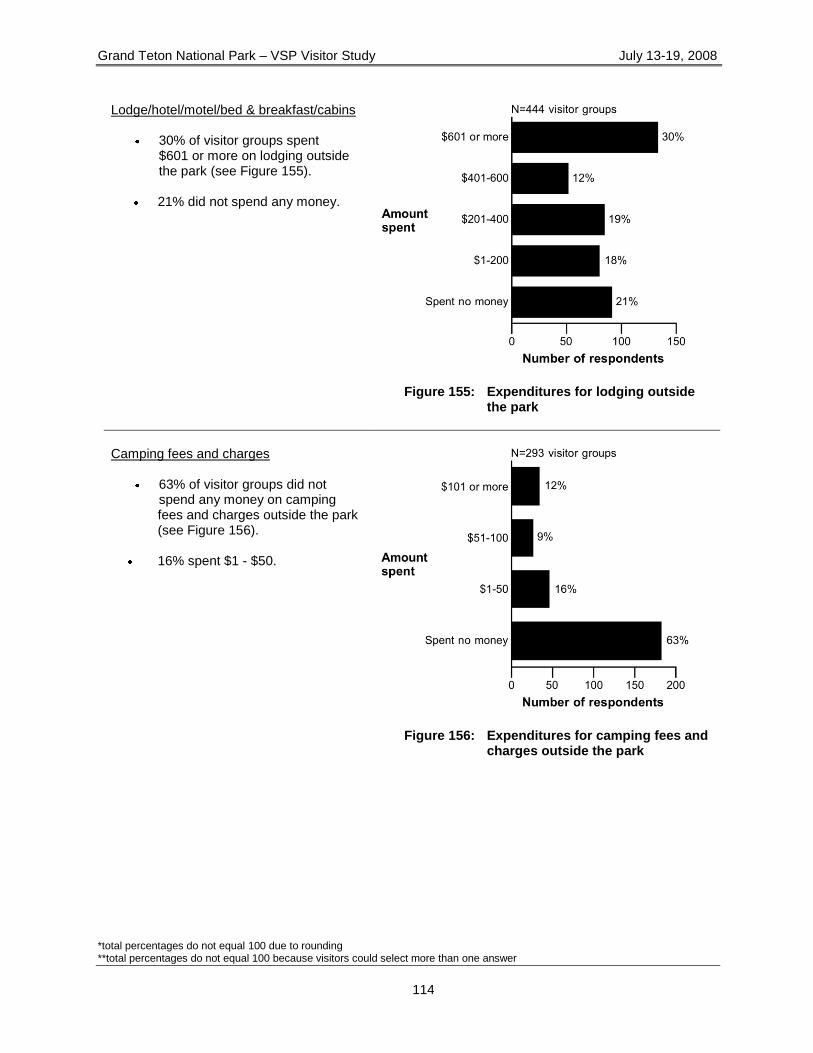
Grand Teton National Park – VSP Visitor Study July 13-19, 2008
*total percentages do not equal 100 due to rounding **total percentages do not equal 100 because visitors could select more than one answer
114
Lodge/hotel/motel/bed & breakfast/cabins
30% of visitor groups spent $601 or more on lodging outside the park (see Figure 155).
21% did not spend any money.
Figure 155: Expenditures for lodging outside
the park
Camping fees and charges
63% of visitor groups did not spend any money on camping fees and charges outside the park (see Figure 156).
16% spent $1 - $50.
Figure 156: Expenditures for camping fees and
charges outside the park
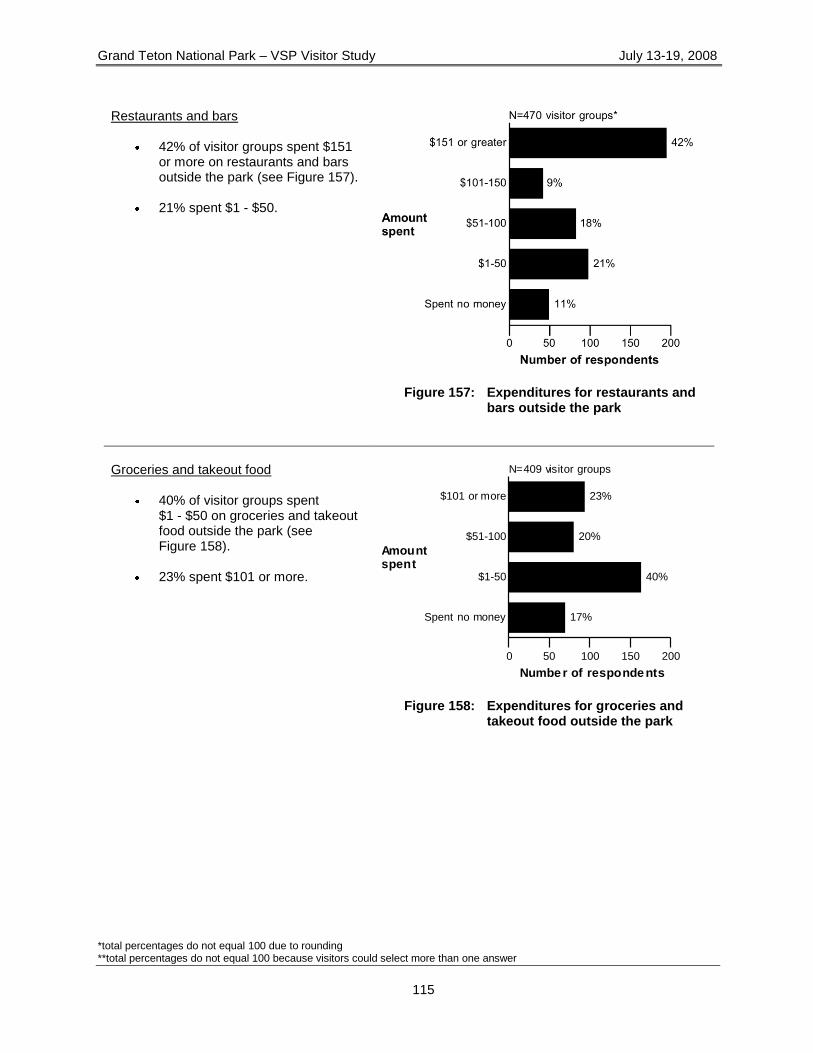
Grand Teton National Park – VSP Visitor Study July 13-19, 2008
*total percentages do not equal 100 due to rounding **total percentages do not equal 100 because visitors could select more than one answer
115
Restaurants and bars
42% of visitor groups spent $151 or more on restaurants and bars outside the park (see Figure 157).
21% spent $1 - $50.
Figure 157: Expenditures for restaurants and
bars outside the park
Groceries and takeout food
40% of visitor groups spent $1 - $50 on groceries and takeout food outside the park (see Figure 158).
23% spent $101 or more.
0 50 100 150 200
Numbe r of responde nts
Spent no money
$1-50
$51-100
$101 or more
17%
40%
20%
23%
N=409 visitor groups
Amountspent
Figure 158: Expenditures for groceries and
takeout food outside the park
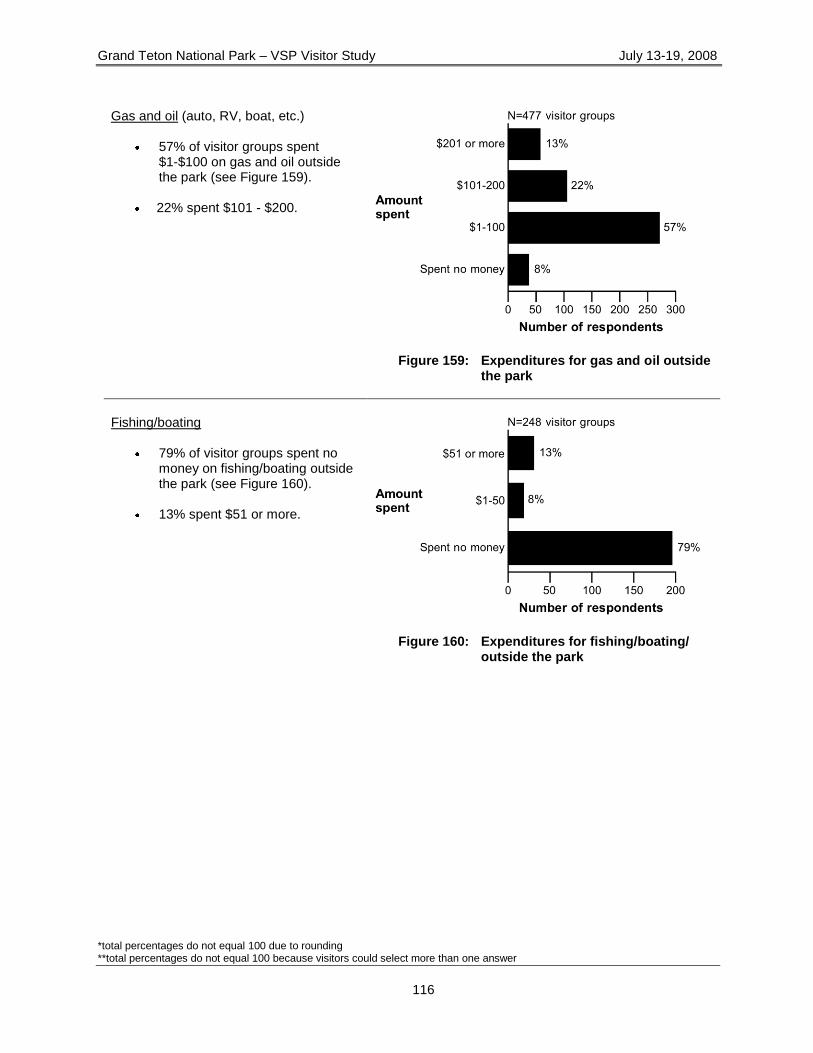
Grand Teton National Park – VSP Visitor Study July 13-19, 2008
*total percentages do not equal 100 due to rounding **total percentages do not equal 100 because visitors could select more than one answer
116
Gas and oil (auto, RV, boat, etc.)
57% of visitor groups spent $1-$100 on gas and oil outside the park (see Figure 159).
22% spent $101 - $200.
Figure 159: Expenditures for gas and oil outside
the park
Fishing/boating
79% of visitor groups spent no money on fishing/boating outside the park (see Figure 160).
13% spent $51 or more.
Figure 160: Expenditures for fishing/boating/
outside the park
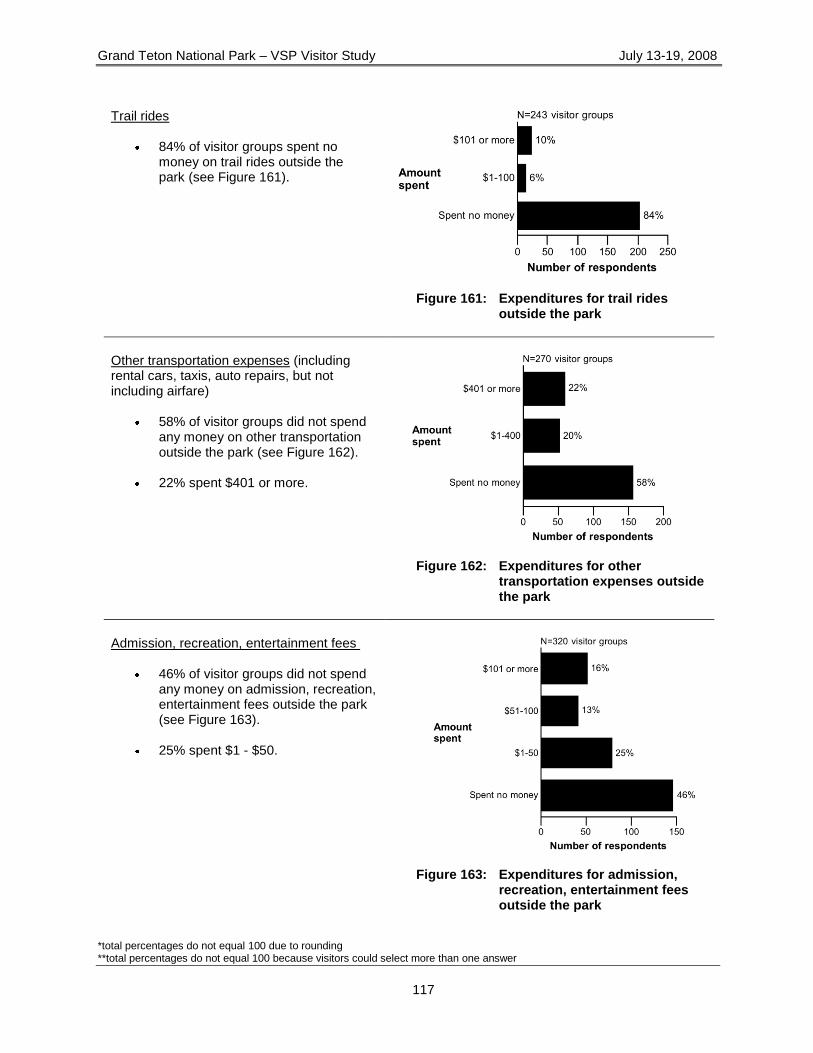
Grand Teton National Park – VSP Visitor Study July 13-19, 2008
*total percentages do not equal 100 due to rounding **total percentages do not equal 100 because visitors could select more than one answer
117
Trail rides
84% of visitor groups spent no money on trail rides outside the park (see Figure 161).
Figure 161: Expenditures for trail rides
outside the park
Other transportation expenses (including rental cars, taxis, auto repairs, but not including airfare)
58% of visitor groups did not spend any money on other transportation outside the park (see Figure 162).
22% spent $401 or more.
Figure 162: Expenditures for other
transportation expenses outside the park
Admission, recreation, entertainment fees
46% of visitor groups did not spend any money on admission, recreation, entertainment fees outside the park (see Figure 163).
25% spent $1 - $50.
Figure 163: Expenditures for admission,
recreation, entertainment fees outside the park
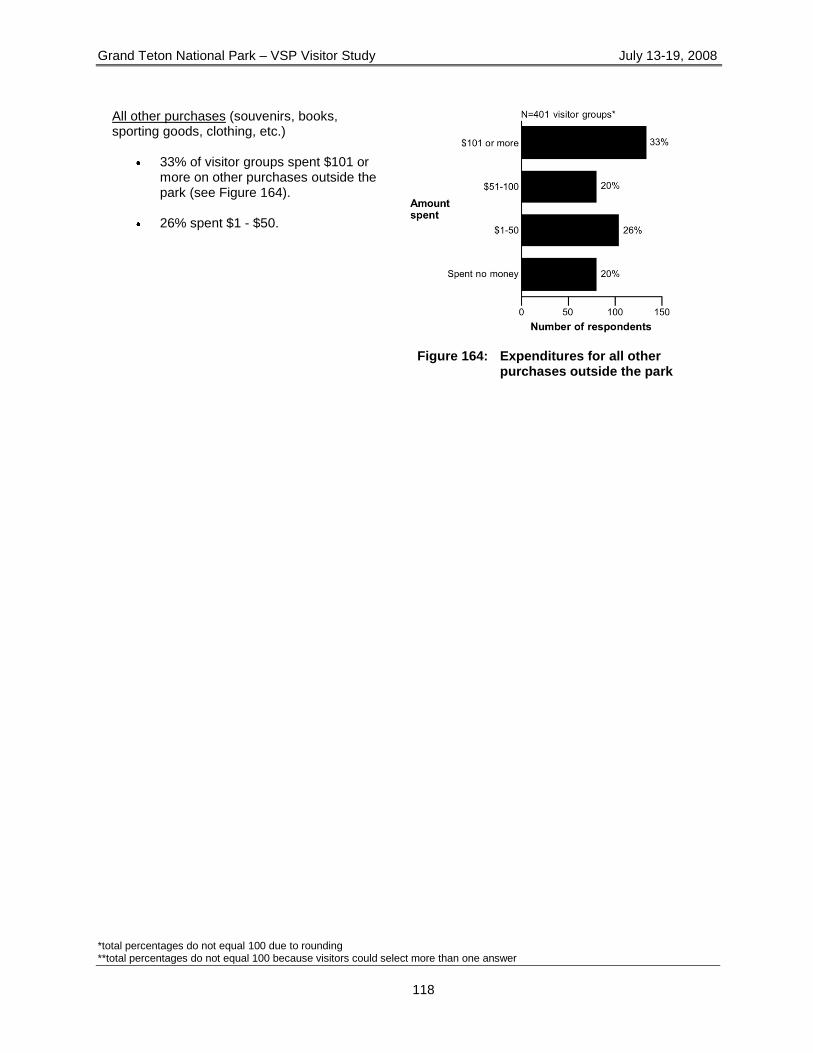
Grand Teton National Park – VSP Visitor Study July 13-19, 2008
*total percentages do not equal 100 due to rounding **total percentages do not equal 100 because visitors could select more than one answer
118
All other purchases (souvenirs, books, sporting goods, clothing, etc.)
33% of visitor groups spent $101 or more on other purchases outside the park (see Figure 164).
26% spent $1 - $50.
Figure 164: Expenditures for all other
purchases outside the park
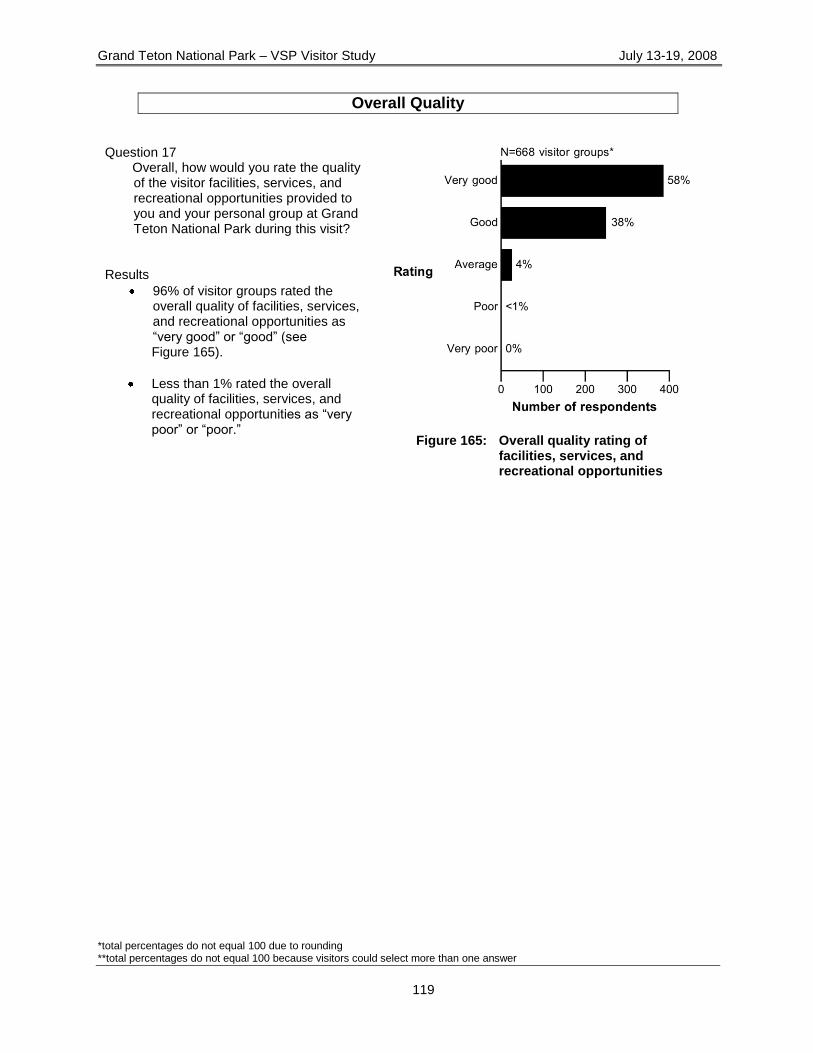
Grand Teton National Park – VSP Visitor Study July 13-19, 2008
*total percentages do not equal 100 due to rounding **total percentages do not equal 100 because visitors could select more than one answer
119
Overall Quality Question 17
Overall, how would you rate the quality of the visitor facilities, services, and recreational opportunities provided to you and your personal group at Grand Teton National Park during this visit?
Results
96% of visitor groups rated the overall quality of facilities, services, and recreational opportunities as ―very good‖ or ―good‖ (see Figure 165).
Less than 1% rated the overall quality of facilities, services, and recreational opportunities as ―very poor‖ or ―poor.‖
Figure 165: Overall quality rating of
facilities, services, and recreational opportunities
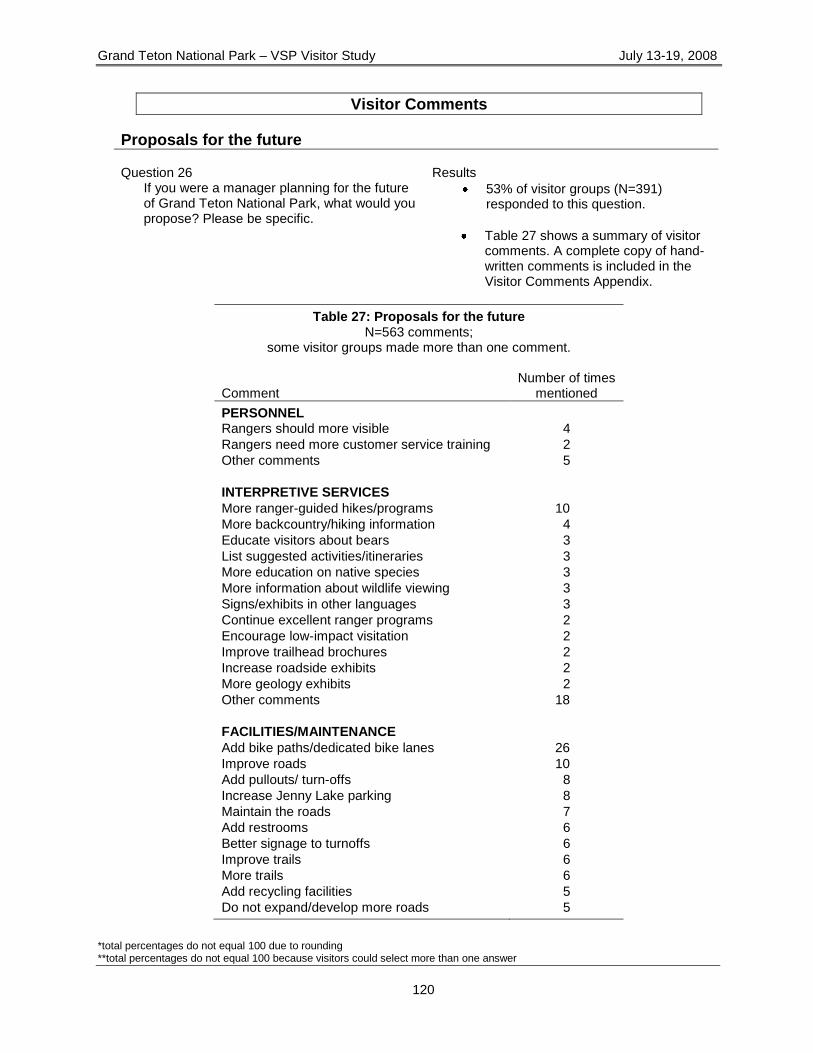
Grand Teton National Park – VSP Visitor Study July 13-19, 2008
*total percentages do not equal 100 due to rounding **total percentages do not equal 100 because visitors could select more than one answer
120
Visitor Comments
Proposals for the future Question 26
If you were a manager planning for the future of Grand Teton National Park, what would you propose? Please be specific.
Results
53% of visitor groups (N=391) responded to this question.
Table 27 shows a summary of visitor comments. A complete copy of hand-written comments is included in the Visitor Comments Appendix.
Table 27: Proposals for the future N=563 comments;
some visitor groups made more than one comment.
Comment
Number of times mentioned
PERSONNEL Rangers should more visible 4
Rangers need more customer service training 2
Other comments 5
INTERPRETIVE SERVICES
More ranger-guided hikes/programs 10
More backcountry/hiking information 4
Educate visitors about bears 3
List suggested activities/itineraries 3
More education on native species 3
More information about wildlife viewing 3
Signs/exhibits in other languages 3
Continue excellent ranger programs 2
Encourage low-impact visitation 2
Improve trailhead brochures 2
Increase roadside exhibits 2
More geology exhibits 2
Other comments 18
FACILITIES/MAINTENANCE
Add bike paths/dedicated bike lanes 26
Improve roads 10
Add pullouts/ turn-offs 8
Increase Jenny Lake parking 8
Maintain the roads 7
Add restrooms 6
Better signage to turnoffs 6
Improve trails 6
More trails 6
Add recycling facilities 5
Do not expand/develop more roads 5
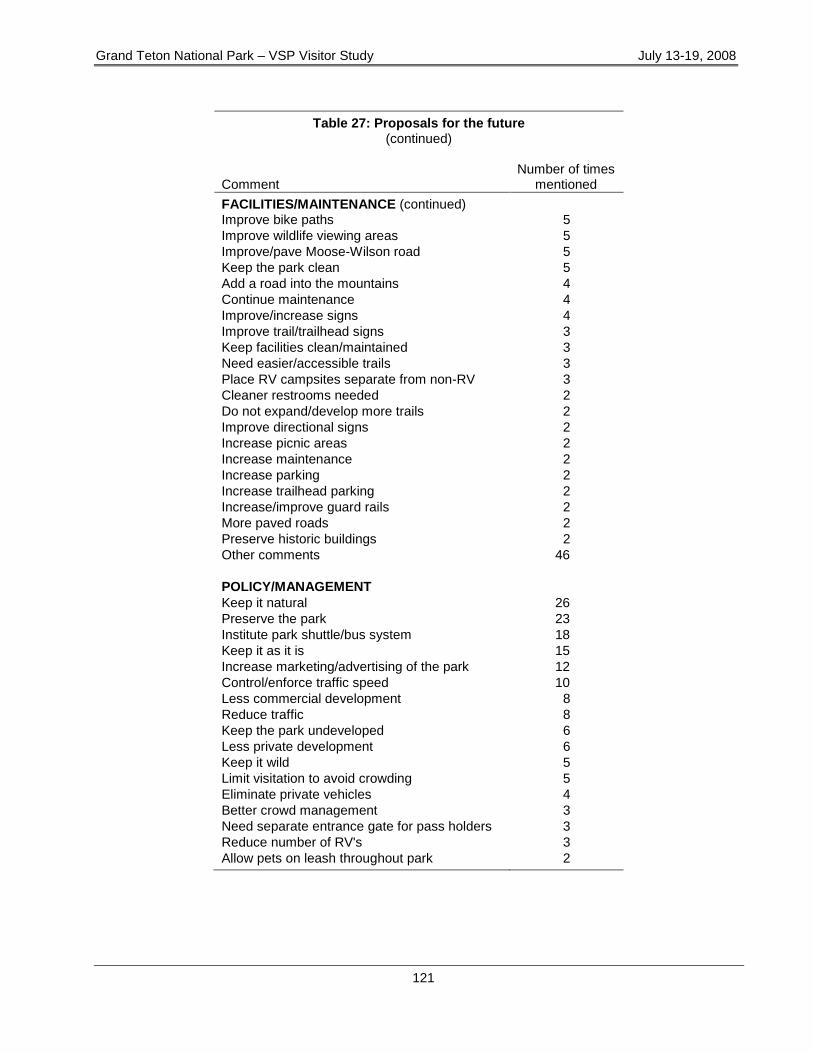
Grand Teton National Park – VSP Visitor Study July 13-19, 2008
121
Table 27: Proposals for the future (continued)
Comment
Number of times mentioned
FACILITIES/MAINTENANCE (continued) Improve bike paths 5
Improve wildlife viewing areas 5
Improve/pave Moose-Wilson road 5
Keep the park clean 5
Add a road into the mountains 4
Continue maintenance 4
Improve/increase signs 4
Improve trail/trailhead signs 3
Keep facilities clean/maintained 3
Need easier/accessible trails 3
Place RV campsites separate from non-RV 3
Cleaner restrooms needed 2
Do not expand/develop more trails 2
Improve directional signs 2
Increase picnic areas 2
Increase maintenance 2
Increase parking 2
Increase trailhead parking 2
Increase/improve guard rails 2
More paved roads 2
Preserve historic buildings 2
Other comments 46
POLICY/MANAGEMENT
Keep it natural 26
Preserve the park 23
Institute park shuttle/bus system 18
Keep it as it is 15
Increase marketing/advertising of the park 12
Control/enforce traffic speed 10
Less commercial development 8
Reduce traffic 8
Keep the park undeveloped 6
Less private development 6
Keep it wild 5
Limit visitation to avoid crowding 5
Eliminate private vehicles 4
Better crowd management 3
Need separate entrance gate for pass holders 3
Reduce number of RV's 3
Allow pets on leash throughout park 2
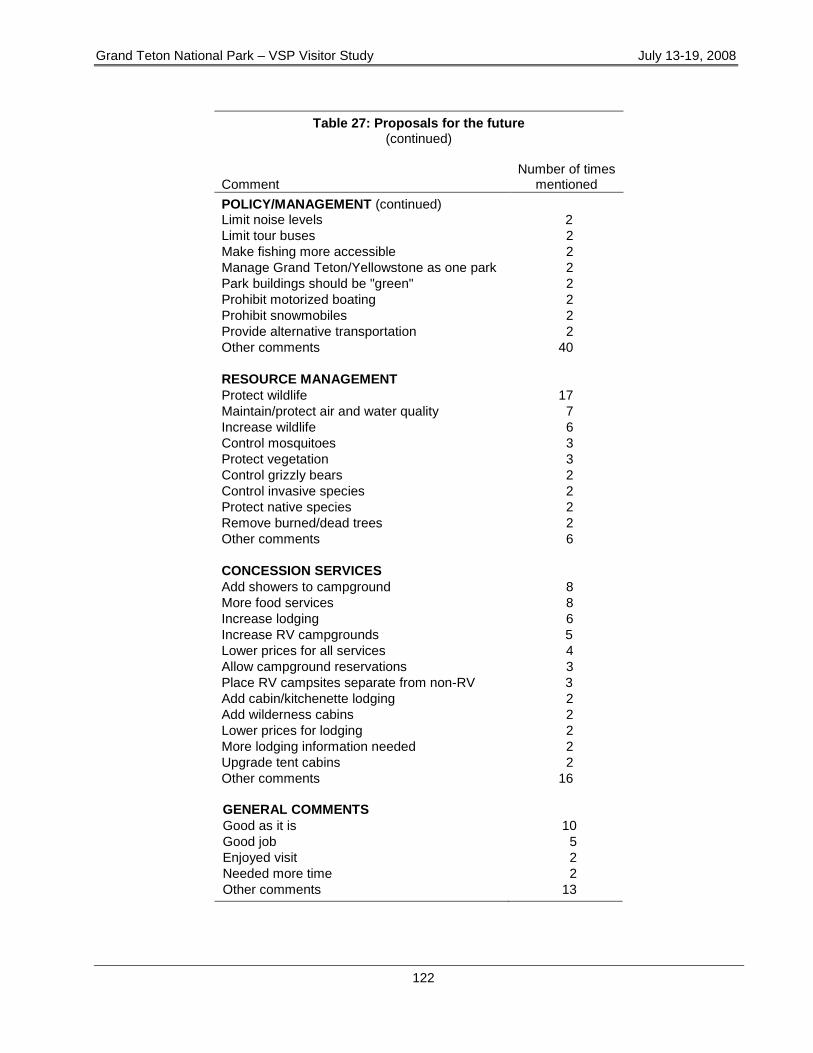
Grand Teton National Park – VSP Visitor Study July 13-19, 2008
122
Table 27: Proposals for the future (continued)
Comment
Number of times mentioned
POLICY/MANAGEMENT (continued) Limit noise levels 2
Limit tour buses 2
Make fishing more accessible 2
Manage Grand Teton/Yellowstone as one park 2
Park buildings should be "green" 2
Prohibit motorized boating 2
Prohibit snowmobiles 2
Provide alternative transportation 2
Other comments 40
RESOURCE MANAGEMENT
Protect wildlife 17
Maintain/protect air and water quality 7
Increase wildlife 6
Control mosquitoes 3
Protect vegetation 3
Control grizzly bears 2
Control invasive species 2
Protect native species 2
Remove burned/dead trees 2
Other comments 6
CONCESSION SERVICES
Add showers to campground 8
More food services 8
Increase lodging 6
Increase RV campgrounds 5
Lower prices for all services 4
Allow campground reservations 3
Place RV campsites separate from non-RV 3
Add cabin/kitchenette lodging 2
Add wilderness cabins 2
Lower prices for lodging 2
More lodging information needed 2
Upgrade tent cabins 2
Other comments 16
GENERAL COMMENTS
Good as it is 10
Good job 5
Enjoyed visit 2
Needed more time 2
Other comments 13
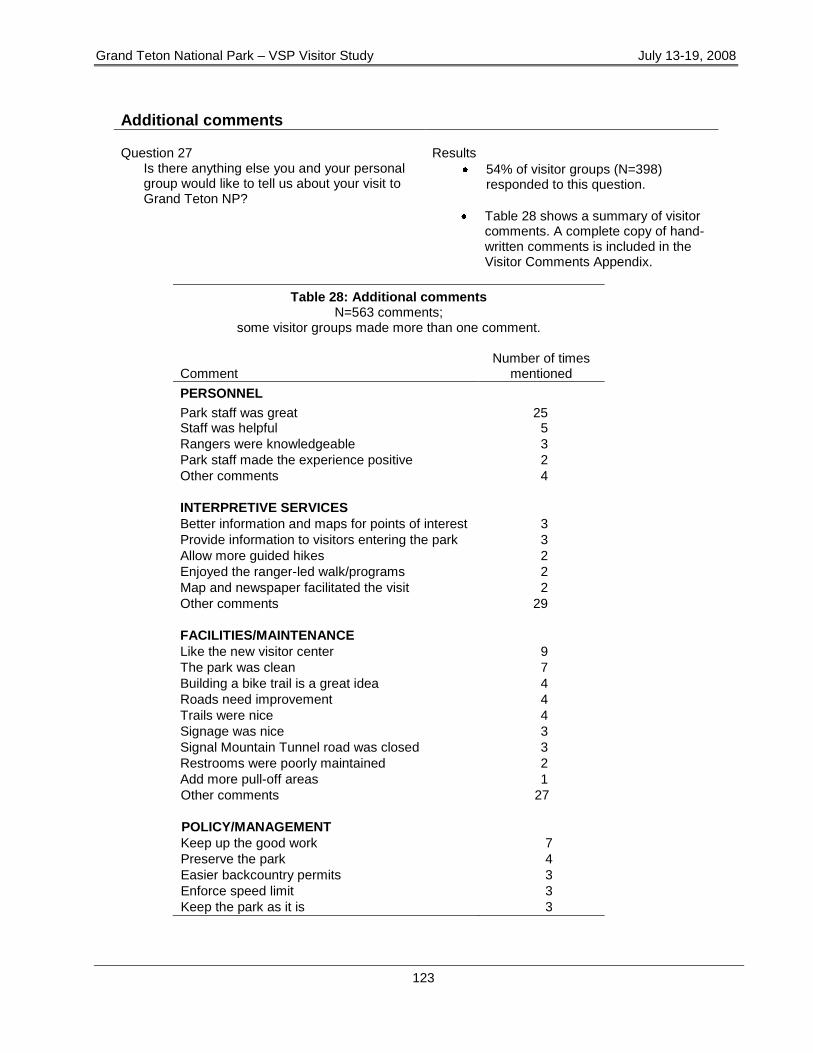
Grand Teton National Park – VSP Visitor Study July 13-19, 2008
123
Additional comments Question 27
Is there anything else you and your personal group would like to tell us about your visit to Grand Teton NP?
Results
54% of visitor groups (N=398) responded to this question.
Table 28 shows a summary of visitor comments. A complete copy of hand-written comments is included in the Visitor Comments Appendix.
Table 28: Additional comments N=563 comments;
some visitor groups made more than one comment.
Comment
Number of times mentioned
PERSONNEL
Park staff was great 25 Staff was helpful 5
Rangers were knowledgeable 3
Park staff made the experience positive 2
Other comments 4
INTERPRETIVE SERVICES
Better information and maps for points of interest 3
Provide information to visitors entering the park 3
Allow more guided hikes 2
Enjoyed the ranger-led walk/programs 2
Map and newspaper facilitated the visit 2
Other comments 29
FACILITIES/MAINTENANCE
Like the new visitor center 9
The park was clean 7
Building a bike trail is a great idea 4
Roads need improvement 4
Trails were nice 4
Signage was nice 3
Signal Mountain Tunnel road was closed 3
Restrooms were poorly maintained 2
Add more pull-off areas 1
Other comments 27
POLICY/MANAGEMENT
Keep up the good work 7
Preserve the park 4
Easier backcountry permits 3
Enforce speed limit 3
Keep the park as it is 3
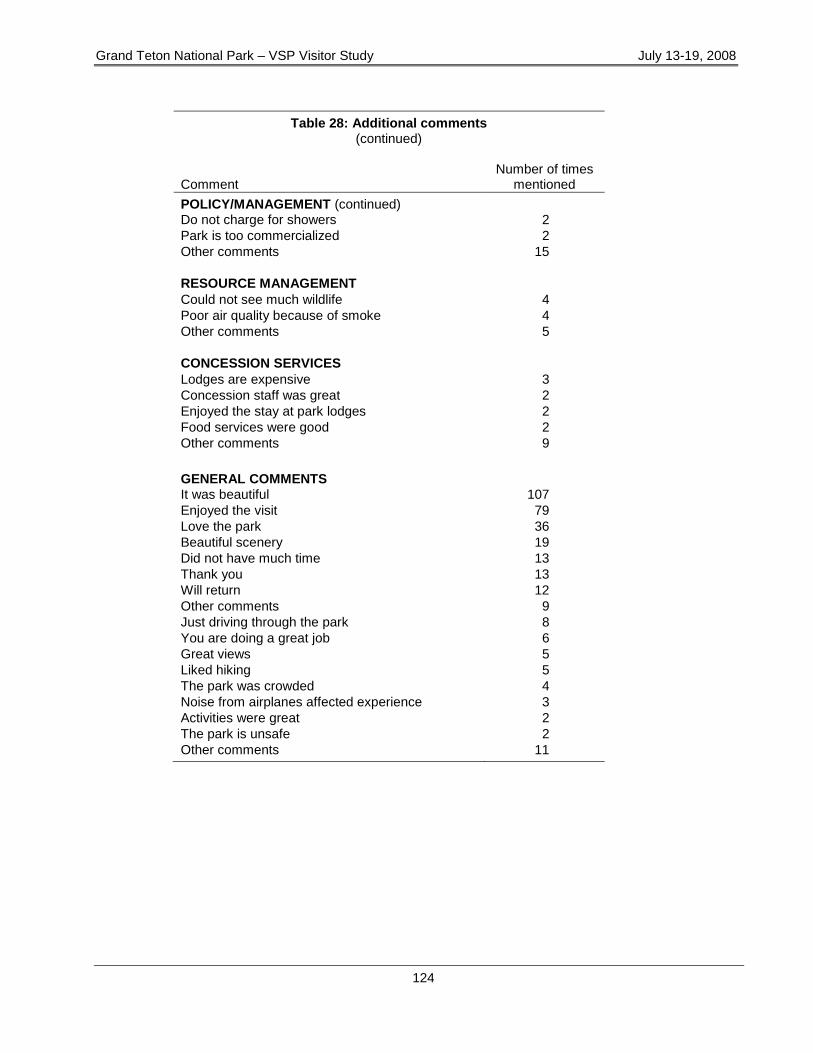
Grand Teton National Park – VSP Visitor Study July 13-19, 2008
124
Table 28: Additional comments (continued)
Comment
Number of times mentioned
POLICY/MANAGEMENT (continued) Do not charge for showers 2
Park is too commercialized 2
Other comments 15
RESOURCE MANAGEMENT
Could not see much wildlife 4
Poor air quality because of smoke 4
Other comments 5
CONCESSION SERVICES
Lodges are expensive 3
Concession staff was great 2
Enjoyed the stay at park lodges 2
Food services were good 2
Other comments 9
GENERAL COMMENTS It was beautiful 107
Enjoyed the visit 79
Love the park 36
Beautiful scenery 19
Did not have much time 13
Thank you 13
Will return 12
Other comments 9
Just driving through the park 8
You are doing a great job 6
Great views 5
Liked hiking 5
The park was crowded 4
Noise from airplanes affected experience 3
Activities were great 2
The park is unsafe 2
Other comments 11

Grand Teton National Park – VSP Visitor Study July 13-19, 2008
125
APPENDICES
Appendix 1: The Questionnaire

Grand Teton National Park – VSP Visitor Study July 13-19, 2008
126
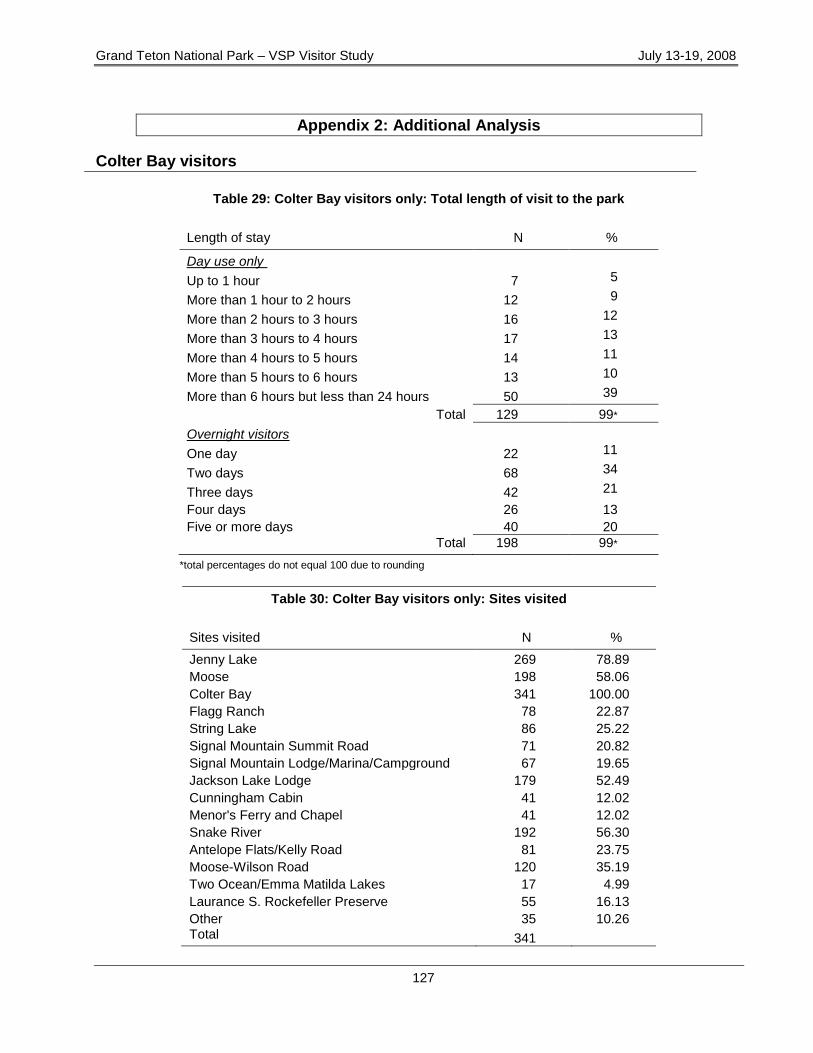
Grand Teton National Park – VSP Visitor Study July 13-19, 2008
127
Appendix 2: Additional Analysis
Colter Bay visitors
Table 29: Colter Bay visitors only: Total length of visit to the park
Length of stay N %
Day use only
Up to 1 hour 7 5
More than 1 hour to 2 hours 12 9
More than 2 hours to 3 hours 16 12
More than 3 hours to 4 hours 17 13
More than 4 hours to 5 hours 14 11
More than 5 hours to 6 hours 13 10
More than 6 hours but less than 24 hours 50 39
Total 129 99*
Overnight visitors
One day 22 11
Two days 68 34
Three days 42 21
Four days 26 13
Five or more days 40 20
Total 198 99*
*total percentages do not equal 100 due to rounding
Table 30: Colter Bay visitors only: Sites visited
Sites visited N %
Jenny Lake 269 78.89
Moose 198 58.06
Colter Bay 341 100.00
Flagg Ranch 78 22.87
String Lake 86 25.22
Signal Mountain Summit Road 71 20.82
Signal Mountain Lodge/Marina/Campground 67 19.65
Jackson Lake Lodge 179 52.49
Cunningham Cabin 41 12.02
Menor's Ferry and Chapel 41 12.02
Snake River 192 56.30
Antelope Flats/Kelly Road 81 23.75
Moose-Wilson Road 120 35.19
Two Ocean/Emma Matilda Lakes 17 4.99
Laurance S. Rockefeller Preserve 55 16.13
Other 35 10.26 Total 341
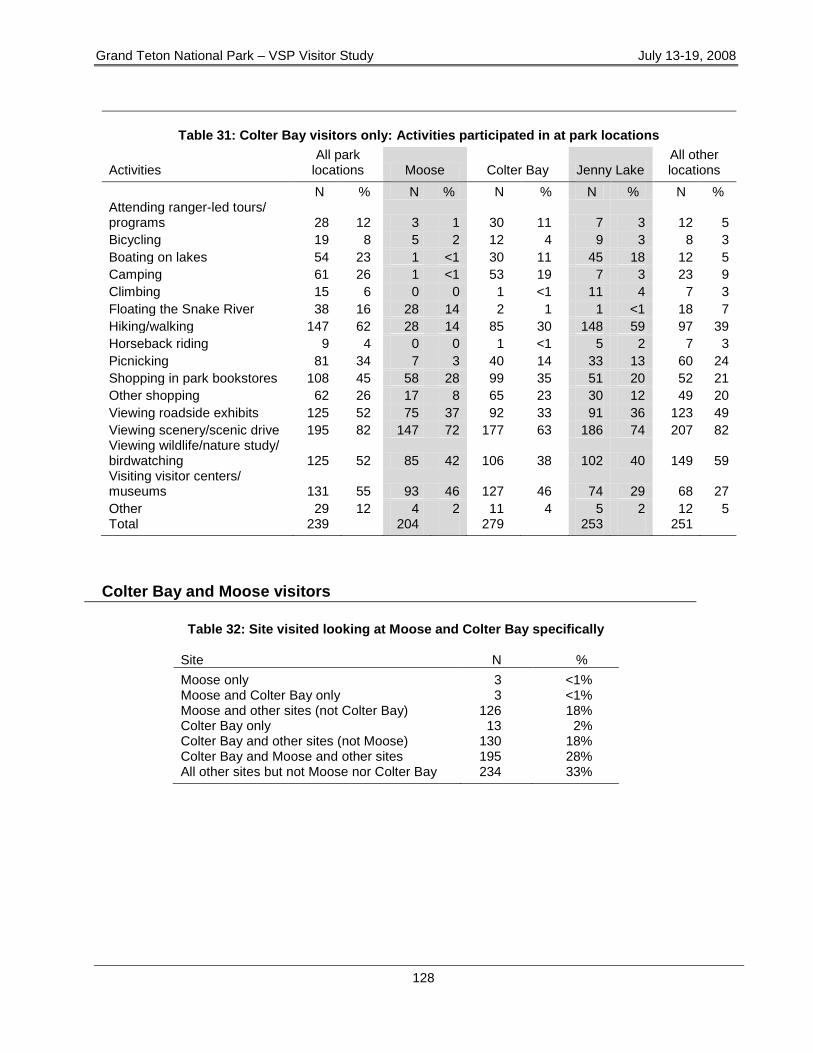
Grand Teton National Park – VSP Visitor Study July 13-19, 2008
128
Table 31: Colter Bay visitors only: Activities participated in at park locations
Activities All park
locations Moose Colter Bay Jenny Lake All other locations
N % N % N % N % N % Attending ranger-led tours/ programs 28 12 3 1 30 11 7 3 12 5
Bicycling 19 8 5 2 12 4 9 3 8 3
Boating on lakes 54 23 1 <1 30 11 45 18 12 5
Camping 61 26 1 <1 53 19 7 3 23 9
Climbing 15 6 0 0 1 <1 11 4 7 3
Floating the Snake River 38 16 28 14 2 1 1 <1 18 7
Hiking/walking 147 62 28 14 85 30 148 59 97 39
Horseback riding 9 4 0 0 1 <1 5 2 7 3
Picnicking 81 34 7 3 40 14 33 13 60 24
Shopping in park bookstores 108 45 58 28 99 35 51 20 52 21
Other shopping 62 26 17 8 65 23 30 12 49 20
Viewing roadside exhibits 125 52 75 37 92 33 91 36 123 49
Viewing scenery/scenic drive 195 82 147 72 177 63 186 74 207 82 Viewing wildlife/nature study/ birdwatching 125 52 85 42 106 38 102 40 149 59 Visiting visitor centers/ museums 131 55 93 46 127 46 74 29 68 27
Other 29 12 4 2 11 4 5 2 12 5 Total 239 204 279 253 251
Colter Bay and Moose visitors
Table 32: Site visited looking at Moose and Colter Bay specifically Site N %
Moose only 3 <1% Moose and Colter Bay only 3 <1% Moose and other sites (not Colter Bay) 126 18% Colter Bay only 13 2% Colter Bay and other sites (not Moose) 130 18% Colter Bay and Moose and other sites 195 28% All other sites but not Moose nor Colter Bay 234 33%
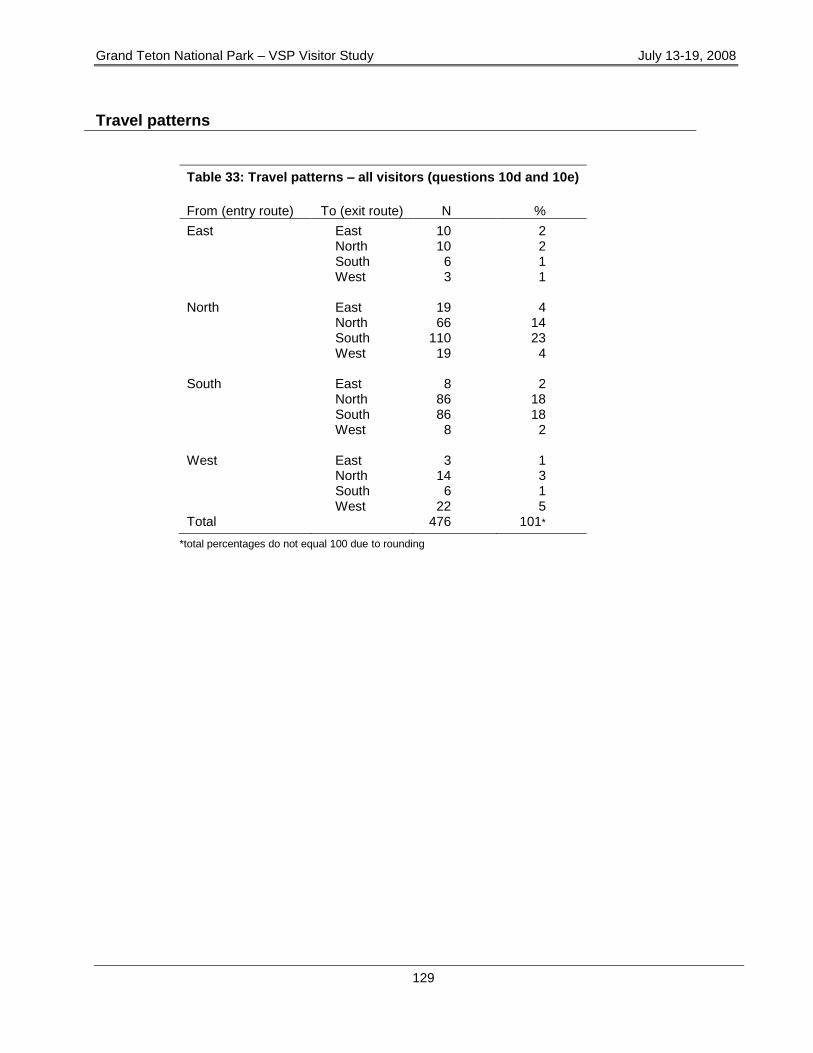
Grand Teton National Park – VSP Visitor Study July 13-19, 2008
129
Travel patterns
Table 33: Travel patterns – all visitors (questions 10d and 10e)
From (entry route) To (exit route) N %
East East 10 2 North 10 2 South 6 1 West 3 1 North East 19 4 North 66 14 South 110 23 West 19 4 South East 8 2 North 86 18 South 86 18 West 8 2 West East 3 1 North 14 3 South 6 1 West 22 5 Total 476 101*
*total percentages do not equal 100 due to rounding
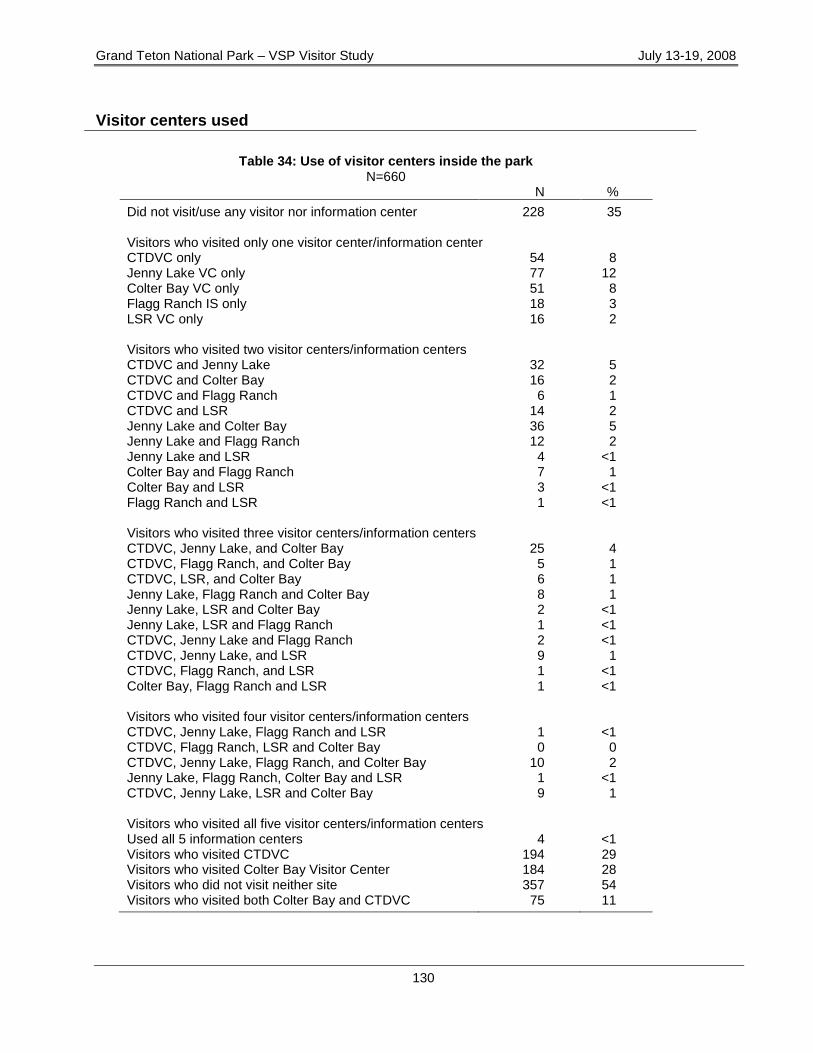
Grand Teton National Park – VSP Visitor Study July 13-19, 2008
130
Visitor centers used
Table 34: Use of visitor centers inside the park N=660
N %
Did not visit/use any visitor nor information center 228 35
Visitors who visited only one visitor center/information center CTDVC only 54 8 Jenny Lake VC only 77 12 Colter Bay VC only 51 8 Flagg Ranch IS only 18 3 LSR VC only 16 2
Visitors who visited two visitor centers/information centers CTDVC and Jenny Lake 32 5 CTDVC and Colter Bay 16 2 CTDVC and Flagg Ranch 6 1 CTDVC and LSR 14 2 Jenny Lake and Colter Bay 36 5 Jenny Lake and Flagg Ranch 12 2 Jenny Lake and LSR 4 <1 Colter Bay and Flagg Ranch 7 1 Colter Bay and LSR 3 <1 Flagg Ranch and LSR 1 <1 Visitors who visited three visitor centers/information centers CTDVC, Jenny Lake, and Colter Bay 25 4 CTDVC, Flagg Ranch, and Colter Bay 5 1 CTDVC, LSR, and Colter Bay 6 1 Jenny Lake, Flagg Ranch and Colter Bay 8 1 Jenny Lake, LSR and Colter Bay 2 <1 Jenny Lake, LSR and Flagg Ranch 1 <1 CTDVC, Jenny Lake and Flagg Ranch 2 <1 CTDVC, Jenny Lake, and LSR 9 1 CTDVC, Flagg Ranch, and LSR 1 <1 Colter Bay, Flagg Ranch and LSR 1 <1 Visitors who visited four visitor centers/information centers CTDVC, Jenny Lake, Flagg Ranch and LSR 1 <1 CTDVC, Flagg Ranch, LSR and Colter Bay 0 0 CTDVC, Jenny Lake, Flagg Ranch, and Colter Bay 10 2 Jenny Lake, Flagg Ranch, Colter Bay and LSR 1 <1 CTDVC, Jenny Lake, LSR and Colter Bay 9 1 Visitors who visited all five visitor centers/information centers Used all 5 information centers 4 <1 Visitors who visited CTDVC 194 29 Visitors who visited Colter Bay Visitor Center 184 28 Visitors who did not visit neither site 357 54 Visitors who visited both Colter Bay and CTDVC 75 11

Grand Teton National Park – VSP Visitor Study July 13-19, 2008
131
The Visitor Services Project (VSP) offers the opportunity to learn more from VSP visitor study data through additional analysis. Two-way and three-way cross tabulations can be made with any questions. Below are some examples of the types of cross tabulations that can be requested. To make a request, please use the contact information below, and include your name, address and phone number in the request. 1. What proportion of family groups with children attend interpretive programs?
2. Is there a correlation between visitors‘ ages and their preferred sources of information about the park?
3. Are highly satisfied visitors more likely to return for a future visit?
4. How many international visitors participate in hiking?
5. What ages of visitors would use the park website as a source of information on a future visit?
6. Is there a correlation between visitor groups‘ rating of the overall quality of their park experience and their
ratings of individual services and facilities?
7. Do larger visitor groups (e.g., four or more) participate in different activities than smaller groups?
8. Do frequent visitors rate the overall quality of their park experiences differently than less frequent visitors? For more information please contact: Visitor Services Project, PSU College of Natural Resources P.O. Box 441139 University of Idaho Moscow, ID 83844-1139 Phone: 208-885-7863 Fax: 208-885-4261 Email: [email protected] Website: http://www.psu.uidaho.edu
Grand Teton National Park – VSP Visitor Study July 13-19, 2008
132
Appendix 3: Decision Rules for Checking Non-response Bias
There are several methods for checking non-response bias. However, the most common way is to
use some demographic indicators to compare between respondents and non-respondents (Dey 1997;
Salant and Dillman 1994; Dillman, 2007; Stoop 2004). In this study, group type, group size and age of the
group member (at least 16 years old) completing the survey were three variables that were used to check
for non-response bias.
A Chi-square test was used to detect the difference in the response rates among different group
types. The hypothesis was that group types are equally represented. If p-value is greater than 0.05, the
difference in group type is judged to be insignificant.
Two independent-sample T-tests were used to test the differences between respondents and non-
respondents. The p-values represent the significance levels of these tests. If p-value is greater than 0.05,
the two groups are judged to be insignificantly different.
Therefore, the hypotheses for checking non-response bias are:
1. Respondents from different group types are equally represented
2. Average age of respondents – average age of non-respondents = 0
3. Average group size of respondents – average group size of non-respondents = 0
Table 2 shows no significant difference in group type.
As shown in Table 3, the p-value for respondent/non-respondent group size test is greater than
0.05, indicating insignificant differences between respondents and non-respondents. Thus, non-response
bias for group size is judged to be insignificant. However, the p-value for respondent/non-respondent age
test is less than 0.05 indicating significant age differences between respondents and non-respondents. In
regard to age difference, various reviews of survey methodology (Dillman and Carley-Baxter 2000; Goudy
1976, Filion 1976, Mayer and Pratt Jr. 1967) have consistently found that in public opinion surveys,
average respondent ages tend to be higher than average non-respondent ages. This difference is often
caused by other reasons such as availability of free time rather than problems with survey methodology. In
addition, because unit of analysis for this study is a visitor group, the group member who received the
questionnaire may be different than the one who actually completed it after the visit. Sometimes the age of
the actual respondent is higher than the age of the group member who accepted the questionnaire at the
park. In the Grand Teton National Park survey, 99 respondents reported to be the older person in the
Grand Teton National Park – VSP Visitor Study July 13-19, 2008
133
group rather than the person who accepted the survey at the park to be the person who completed the
survey. Therefore, non-response bias is judged to be insignificant.
References Filion F. L. (Winter 1975-Winter 1976) Estimating Bias due to Non-response in Mail Surveys. Public
Opinion Quarterly, Vol 39 (4): 482-492. Dey, E.L. (1997) Working with Low Survey Response Rates: The Efficacy of Weighting Adjustment.
Research in Higher Education, 38(2): 215-227. Dillman D. A. (2007) Mail and Internet Surveys: The Tailored Design Method, Updated version with New
Internet, Visual, and Mixed-Mode Guide, 2nd
Edition, New York: John Wiley and Sons, Inc. Dillman D. A. and Carley-Baxter L. R. (2000) Structural determinants of survey response rate over a 12-
year period, 1988-1999, Proceedings of the section on survey research methods, 394-399, American Statistical Association, Washington, D.C.
Goudy, W. J. (1976) Non-response Effect on Relationships Between Variables. Public Opinion Quarterly. Vol 40 (3): 360-369.
Mayer C. S. and Pratt Jr. R. W. (Winter 1966-Winter 1967) A Note on Non-response in a Mail Survey. Public Opinion Quarterly. Vol 30 (4): 637-646.
Salant, P. and Dillman, D. A. (1994) How to Conduct Your Own Survey. U.S.: John Wiley and Sons, Inc. Stoop, I. A. L. (2004) Surveying Non-respondents. Field Methods, 16 (1): 23.
Grand Teton National Park – VSP Visitor Study July 13-19, 2008
134
Appendix 4: Visitor Services Project Publications
All VSP reports are available on the Park Studies Unit website at www.psu.uidaho.edu.vsp.reports.htm. All studies were conducted in summer unless otherwise noted.
1982 1. Mapping interpretive services: A pilot study
at Grand Teton National Park.
1983 2. Mapping interpretive services: Identifying
barriers to adoption and diffusion of the method.
3. Mapping interpretive services: A follow-up study at Yellowstone National Park and Mt Rushmore National Memorial.
4. Mapping visitor populations: A pilot study at Yellowstone National Park.
1985 5. North Cascades National Park Service
Complex 6. Crater Lake National Park 1986 7. Gettysburg National Military Park 8. Independence National Historical Park 9. Valley Forge National Historical Park 1987 10. Colonial National Historical Park (summer
& fall) 11. Grand Teton National Park 12. Harpers Ferry National Historical Park 13. Mesa Verde National Park 14. Shenandoah National Park (summer &
fall) 15. Yellowstone National Park 16. Independence National Historical Park: Four Seasons Study
1988 17. Glen Canyon National Recreational Area 18. Denali National Park and Preserve 19. Bryce Canyon National Park 20. Craters of the Moon National Monument
1989 21. Everglades National Park (winter) 22. Statue of Liberty National Monument 23. The White House Tours, President's Park
1989 (continued) 24. Lincoln Home National Historic Site 25. Yellowstone National Park 26. Delaware Water Gap National Recreation
Area 27. Muir Woods National Monument 1990 28. Canyonlands National Park (spring) 29. White Sands National Monument 30. National Monuments & Memorials,
Washington, D.C. 31. Kenai Fjords National Park 32. Gateway National Recreation Area 33. Petersburg National Battlefield 34. Death Valley National Monument 35. Glacier National Park 36. Scott's Bluff National Monument 37. John Day Fossil Beds National Monument
1991 38. Jean Lafitte National Historical Park
(spring) 39. Joshua Tree National Monument (spring) 40. The White House Tours, President's Park
(spring) 41. Natchez Trace Parkway (spring) 42. Stehekin-North Cascades NP/Lake Chelan
NRA 43. City of Rocks National Reserve 44. The White House Tours, President's Park
(fall)
1992 45. Big Bend National Park (spring) 46. Frederick Douglass National Historic Site
(spring) 47. Glen Echo Park (spring) 48. Bent's Old Fort National Historic Site 49. Jefferson National Expansion Memorial 50. Zion National Park 51. New River Gorge National River 52. Klondike Gold Rush National Historical
Park, AK 53. Arlington House-The Robert E. Lee
Memorial
Grand Teton National Park – VSP Visitor Study July 13-19, 2008
135
Visitor Services Project Publications (continued)
1982 1. Mapping interpretive services: A pilot study
at Grand Teton National Park.
1983 2. Mapping interpretive services: Identifying
barriers to adoption and diffusion of the method.
3. Mapping interpretive services: A follow-up study at Yellowstone National Park and Mt Rushmore National Memorial.
4. Mapping visitor populations: A pilot study at Yellowstone National Park.
1985 5. North Cascades National Park Service
Complex 6. Crater Lake National Park
1986 7. Gettysburg National Military Park 8. Independence National Historical Park 9. Valley Forge National Historical Park
1987 10. Colonial National Historical Park (summer
& fall) 11. Grand Teton National Park 12. Harpers Ferry National Historical Park 13. Mesa Verde National Park 14. Shenandoah National Park (summer &
fall) 15. Yellowstone National Park 16. Independence National Historical Park: Four Seasons Study
1988 17. Glen Canyon National Recreational Area 18. Denali National Park and Preserve 19. Bryce Canyon National Park 20. Craters of the Moon National Monument
1989 21. Everglades National Park (winter) 22. Statue of Liberty National Monument 23. The White House Tours, President's Park
1989 (continued) 24. Lincoln Home National Historic Site 25. Yellowstone National Park 26. Delaware Water Gap National Recreation
Area 27. Muir Woods National Monument 1990 28. Canyonlands National Park (spring) 29. White Sands National Monument 30. National Monuments & Memorials,
Washington, D.C. 31. Kenai Fjords National Park 32. Gateway National Recreation Area 33. Petersburg National Battlefield 34. Death Valley National Monument 35. Glacier National Park 36. Scott's Bluff National Monument 37. John Day Fossil Beds National Monument
1991 38. Jean Lafitte National Historical Park (spring) 39. Joshua Tree National Monument (spring) 40. The White House Tours, President's Park
(spring) 41. Natchez Trace Parkway (spring) 42. Stehekin-North Cascades NP/Lake Chelan
NRA 43. City of Rocks National Reserve 44. The White House Tours, President's Park (fall)
1992 45. Big Bend National Park (spring) 46. Frederick Douglass National Historic Site
(spring) 47. Glen Echo Park (spring) 48. Bent's Old Fort National Historic Site 49. Jefferson National Expansion Memorial 50. Zion National Park 51. New River Gorge National River 52. Klondike Gold Rush National Historical Park,
AK 53. Arlington House-The Robert E. Lee Memorial
Grand Teton National Park – VSP Visitor Study July 13-19, 2008
136
Visitor Services Project Publications (continued)
1993 54. Belle Haven Park/Dyke Marsh Wildlife
Park (spring) 55. Santa Monica Mountains National
Recreation Area (spring) 56. Whitman Mission National Historic Site 57. Sitka National Historical Park 58. Indiana Dunes National Lakeshore 59. Redwood National Park 60. Channel Islands National Park 61. Pecos National Historical Park 62. Canyon de Chelly National Monument 63. Bryce Canyon National Park (fall) 1994 64. Death Valley National Monument
Backcountry (winter) 65. San Antonio Missions National Historical
Park (spring) 66. Anchorage Alaska Public Lands
Information Center 67. Wolf Trap Farm Park for the Performing
Arts 68. Nez Perce National Historical Park 69. Edison National Historic Site 70. San Juan Island National Historical Park 71. Canaveral National Seashore 72. Indiana Dunes National Lakeshore (fall) 73. Gettysburg National Military Park (fall) 1995 74. Grand Teton National Park (winter) 75. Yellowstone National Park (winter) 76. Bandelier National Monument 77. Wrangell-St. Elias National Park &
Preserve 78. Adams National Historic Site 79. Devils Tower National Monument 80. Manassas National Battlefield Park 81. Booker T. Washington National
Monument 82. San Francisco Maritime National
Historical Park 83. Dry Tortugas National Park 1996 84. Everglades National Park (spring) 85. Chiricahua National Monument (spring)
1996 (continued) 86. Fort Bowie National Historic Site (spring) 87. Great Falls Park, Virginia (spring) 88. Great Smoky Mountains National Park 89. Chamizal National Memorial 90. Death Valley National Park (fall) 91. Prince William Forest Park (fall) 92. Great Smoky Mountains National Park (fall) 1997
93. Virgin Islands National Park (winter) 94. Mojave National Preserve (spring) 95. Martin Luther King, Jr., National Historic
Site (spring) 96. Lincoln Boyhood National Memorial 97. Grand Teton National Park 98. Bryce Canyon National Park 99. Voyageurs National Park 100. Lowell National Historical Park 1998 101. Jean Lafitte National Historical Park &
Park (spring) 102. Chattahoochee River National Recreation
Area (spring) 103. Cumberland Island National Seashore
(spring) 104. Iwo Jima/Netherlands Carillon Memorials 105. National Monuments & Memorials,
Washington, D.C. 106. Klondike Gold Rush National Historical
Park, AK 107. Whiskeytown National Recreation Area 108. Acadia National Park 1999 109. Big Cypress National Preserve (winter) 110. San Juan National Historic Site, Puerto
Rico (winter) 111. St. Croix National Scenic Riverway 112. Rock Creek Park 113. New Bedford Whaling National Historical
Park 114. Glacier Bay National Park & Preserve 115. Kenai Fjords National Park 116. Lassen Volcanic National Park 117. Cumberland Gap National Historical Park
(fall)
Grand Teton National Park – VSP Visitor Study July 13-19, 2008
137
Visitor Services Project Publications (continued)
2000 118. Haleakala National Park (spring) 119. White House Tour and White House
Visitor Center (spring) 120. USS Arizona Memorial 121. Olympic National Park 122. Eisenhower National Historic Site 123. Badlands National Park 124. Mount Rainier National Park 2001 125. Biscayne National Park (spring) 126. Colonial National Historical Park
(Jamestown) 127. Shenandoah National Park 128. Pictured Rocks National Lakeshore 129. Crater Lake National Park 130. Valley Forge National Historical Park 2002 131. Everglades National Park (spring) 132. Dry Tortugas National Park (spring) 133. Pinnacles National Monument (spring) 134. Great Sand Dunes National Park &
Preserve 135. Pipestone National Monument 136. Outer Banks Group (Cape Hatteras
National Seashore, Ft. Raleigh National Historic Site, and Wright Brothers National Memorial)
137. Sequoia & Kings Canyon National Parks and Sequoia National Forest
138. Catoctin Mountain Park 139. Hopewell Furnace National Historic Site 140. Stones River National Battlefield (fall) 2003 141. Gateway National Recreation Area: Floyd
Bennett Field (spring) 142. Cowpens National Battlefield (spring) 143. Grand Canyon National Park – North Rim 144. Grand Canyon National Park – South Rim 145. C&O Canal National Historical Park 146. Capulin Volcano National Monument 147. Oregon Caves National Monument 148. Knife River Indian Villages National
Historic Site 149. Fort Stanwix National Monument 150. Arches National Park
2003 continued 151. Mojave National Preserve (fall) 2004 152. Joshua Tree National Park (spring) 153. New River Gorge National River 154. George Washington Birthplace National
Monument 155. Craters of the Moon National Monument &
Preserve 156. Dayton Aviation Heritage National
Historical Park 157. Apostle Islands National Lakeshore 158. Keweenaw National Historical Park 159. Effigy Mounds National Monument 160. Saint-Gaudens National Historic Site 161. Manzanar National Historic Site 162. John Day Fossil Beds National Monument
2005 163. Congaree National Park (spring) 164. San Francisco Maritime National Historical
Park (spring) 165. Lincoln Home National Historic Site 166. Chickasaw National Recreation Area 167. Timpanogos Cave National Monument 168. Yosemite National Park 169. Fort Sumter National Monument 170. Harpers Ferry National Historical Park 171. Cuyahoga Valley National Park 172. Johnstown Flood National Memorial 173. Nicodemus National Historic Site 2006 174. Kings Mountain National Military Park
(spring) 175. John Fitzgerald Kennedy National Historic
Site 176. Devils Postpile National Monument 177. Mammoth Cave National Park 178. Yellowstone National Park 179. Monocacy National Battlefield 180. Denali National Park & Preserve 181. Golden Spike National Historic Site 182. Katmai National Park and Preserve 183. Zion National Park (spring and fall)
Grand Teton National Park – VSP Visitor Study July 13-19, 2008
138
Visitor Services Project Publications (continued)
2007 184.1. Big Cypress National Preserve (spring) 184.2. Big Cypress National Preserve
(ORVPermit Holder/Camp Owner) 185. Hawaii Volcanoes National Park (spring) 186. Glen Canyon National Recreation Area
(spring and summer) 187. Lava Beds National Monument 188. John Muir National Historic Site 189. Fort Union Trading Post NHS 190. Fort Donelson National Battlefield 191. Agate Fossil Beds National Monument 192. Mount Rushmore National Memorial 193. Ebey's Landing National Historical
Reserve 194. Rainbow Bridge National Monument 195. Independence National Historical Park 196. Minute Man National Historical Park 2008 197. Blue Ridge Parkway (fall and summer) 198. Yosemite National Park 199. Everglades National Park (winter and
spring) 200. Horseshoe Bend National Military Park
(spring) 201. Carl Sandburg Home National Historic
Site (spring) 202. Fire Island National Seashore resident
(spring) 203. Fire Island National Seashore visitor 204. Capitol Reef National Park 205.1 Great Smoky Mountains National Park (summer) 206. Grand Teton National Park
For more information about the Visitor Services Project, please contact the University of Idaho Park Studies Unit, website: www.psu.uidaho.edu or phone (208) 885-7863.

Grand Teton National Park – VSP Visitor Study July 13-19, 2008
139
Visitor Comments Appendix This section contains complete visitor comments of all open-ended questions and is bound separately from this report due to its size.

Grand Teton National Park – VSP Visitor Study July 13-19, 2008
140
NPS 136/101599 April 2010
Printed on recycled paper