self-study Guide to Hedging with Grain and oilseed Futures and
Upload
jessamine-castroCategory
view
21download
0description

George A. ShumakerProfessor Emeritus, Ag & Applied Economics
GRAIN AND OILSEEDOUTLOOK AND SITUATION REPORT
March 1, 2005South Carolina Ag Expo
Columbia, SC

U.S. Cash Receipts 2003-2004FU.S. Farm Sector Cash Receipts 2003-2004FCrop Receipts 2003 2004F %
Corn 18.3 20.4 11.5Soybeans 15.9 16.1 1.3Wheat 6.7 7.5 11.9Cotton 5.0 5.3 6.0
Sub-total 45.9 49.3 7.4
Total Crops 106.2 111.9 5.4Total Livestock 105.5 121.5 15.2
Total Receipts 211.6 233.4 10.3
$ billion

Value Per Acre vs
YieldChanges in $/acre versus Changes in YieldsCrop Receipts 2003 2004F % 2003 2004F %
Corn 258 277 7.4 142.2 160.4 12.8Soybeans 219 218 -0.8 33.9 42.5 25.4Wheat 126 150 18.9 44.2 43.2 -2.3Cotton 417 406 -2.6 730.0 846.0 15.9
Total 1,020 1,051 3.0
yield$ acre

GLOBAL COURSE GRAIN
0
200
400
600
800
1000
1200
1995 1996 1997 1998 1999 2000 2001 2002 2003 2004
Mill
ion
Met
ric
To
nn
es
Production Use End Stocks

U.S. CORN ACREAGE
40.0
45.0
50.0
55.0
60.0
65.0
70.0
75.0
80.0
85.0
90.0
1980
1981
1982
1983
1984
1985
1986
1987
1988
1989
1990
1991
1992
1993
1994
1995
1996
1997
1998
1999
2000
2001
2002
2003
2004
2005
Mil
lio
n A
cres
Planted Harvested

U.S. Corn Yields
60.0
80.0
100.0
120.0
140.0
160.0
180.0
1980 1983 1986 1989 1992 1995 1998 2001 2004
Bu
shel
s P
er A
cre

U.S. Corn Total Supply
0
2,000
4,000
6,000
8,000
10,000
12,000
14,000
1980
1981
1982
1983
1984
1985
1986
1987
1988
1989
1990
1991
1992
1993
1994
1995
1996
1997
1998
1999
2000
2001
2002
2003
2004
2005
Mill
ion
Bu
shel
s
Production Carry In Stocks

U.S. Corn Usage
0
2,000
4,000
6,000
8,000
10,000
12,000
1980 1983 1986 1989 1992 1995 1998 2001 2004
Mill
ion
Bu
shel
s
Feed Use F. S.& I. Export
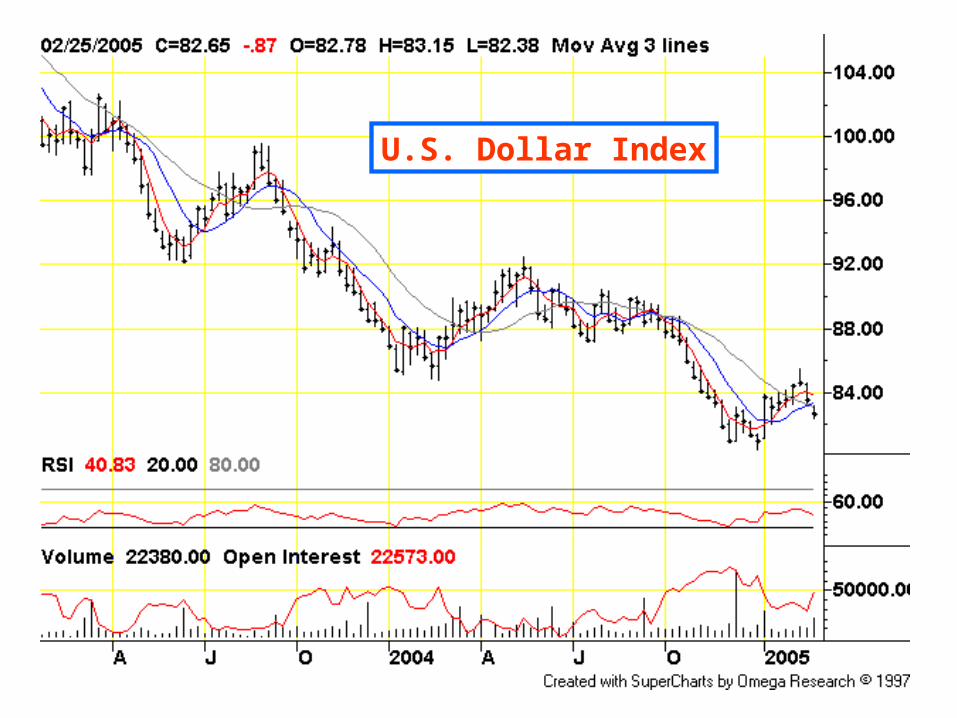
U.S. Dollar Index

BSE WILD CARD!
Grain Consuming Animal Units
60
65
70
75
80
85
90
95
1980
1981
1982
1983
1984
1985
1986
1987
1988
1989
1990
1991
1992
1993
1994
1995
1996
1997
1998
1999
2000
2001
2002
2003
2004
2005
Mil
lio
ns

Food, Seed & Industrial Use of U.S. Corn
0
500
1000
1500
2000
2500
3000
1980
1982
1984
1986
1988
1990
1992
1994
1996
1998
2000
2002
2004
Th
ou
san
d B
ush
els
HFCS Glocuse & Dextrose Starch Fuel Beverage Cereal & Other

U.S. Corn End Stocks
0
500
1,000
1,500
2,000
2,500
3,000
3,500
4,000
4,500
5,000
1980 1983 1986 1989 1992 1995 1998 2001 2004
Mill
ion
Bu
shel
s

U.S. Corn Price vs Stocks-Use Ratio
$1.50
$1.70
$1.90
$2.10
$2.30
$2.50
$2.70
$2.90
$3.10
$3.30
$3.50
1980 1983 1986 1989 1992 1995 1998 2001 2004
Do
lla
rs P
er
Bu
sh
el
0.0%
10.0%
20.0%
30.0%
40.0%
50.0%
60.0%
70.0%
Sto
cks-
to-U
se R
atio
Corn Price Stocks-Use Ratio

CORN SEASONAL PRICE TENDENCIES1997-2002
Jan Feb Mar
Apr
May
Jun
Jul
Aug
Sep
Oct Nov
Dec
85
90
95
100
105
110
Jan Feb Mar Apr May Jun Jul Aug Sep Oct Nov Dec
% o
f S
easo
n A
vera
ge

Weekly Nearby CornFutures

December Corn Futures

GLOBAL SOYBEAN SITUATION
0
50
100
150
200
250
300
350
400
450
1995 1996 1997 1998 1999 2000 2001 2002 2003 2004
Mil
lio
n M
etir
c T
on
nes
Production Use End Stocks

U.S.SOYBEAN ACREAGE
40.0
45.0
50.0
55.0
60.0
65.0
70.0
75.0
80.0
1980
1981
1982
1983
1984
1985
1986
1987
1988
1989
1990
1991
1992
1993
1994
1995
1996
1997
1998
1999
2000
2001
2002
2003
2004
2005
Mill
ion
Acr
es
Planted Harvested
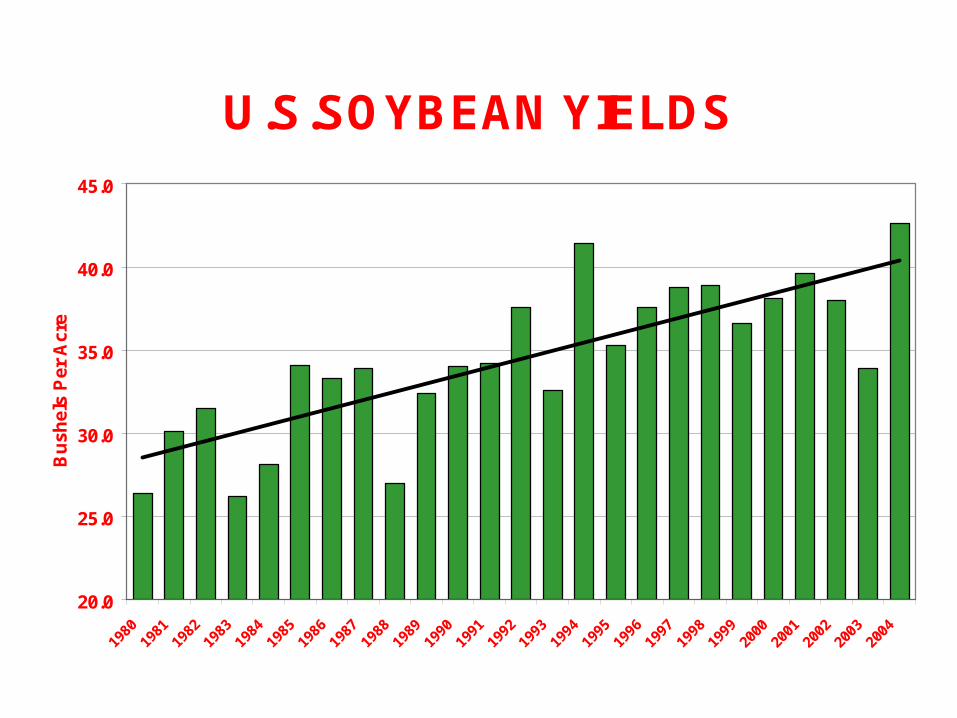
U.S.SOYBEAN YIELDS
20.0
25.0
30.0
35.0
40.0
45.0
1980
1981
1982
1983
1984
1985
1986
1987
1988
1989
1990
1991
1992
1993
1994
1995
1996
1997
1998
1999
2000
2001
2002
2003
2004
Bu
shel
s P
er A
cre

U.S. SOYBEANS TOTAL SUPPLY
1,000
1,500
2,000
2,500
3,000
3,500
1980
1981
1982
1983
1984
1985
1986
1987
1988
1989
1990
1991
1992
1993
1994
1995
1996
1997
1998
1999
2000
2001
2002
2003
2004
2005
Mill
ion
Bu
shel
s
Production In Stocks

SOUTH AMERICAN SOYBEAN PRODUCTION
0
500
1000
1500
2000
2500
3000
1980
1981
1982
1983
1984
1985
1986
1987
1988
1989
1990
1991
1992
1993
1994
1995
1996
1997
1998
1999
2000
2001
2002
2003
2004
Mill
ion
Bu
shel
s
Brazil Argentina Paraguay

U.S. SOYBEAN USE
0
500
1,000
1,500
2,000
2,500
3,000
3,500
1980
1981
1982
1983
1984
1985
1986
1987
1988
1989
1990
1991
1992
1993
1994
1995
1996
1997
1998
1999
2000
2001
2002
2003
2004
2005
Mill
ion
Bu
shel
s
Domestic Exports Other

U.S. SOYBEAN END STOCKS
0
100
200
300
400
500
600
1980
1981
1982
1983
1984
1985
1986
1987
1988
1989
1990
1991
1992
1993
1994
1995
1996
1997
1998
1999
2000
2001
2002
2003
2004
2005
Mill
ion
Bu
shel
s

U.S. SOYBEAN PRICE vs STOCKS RATIO
0.0%
5.0%
10.0%
15.0%
20.0%
25.0%
30.0%
1980
1981
1982
1983
1984
1985
1986
1987
1988
1989
1990
1991
1992
1993
1994
1995
1996
1997
1998
1999
2000
2001
2002
2003
2004
2005
$0.00
$1.00
$2.00
$3.00
$4.00
$5.00
$6.00
$7.00
$8.00
$9.00
Stocks Ratio Price

SEASONAL PRICE TENDENCIES1997-2002
Nov
Dec
Jan Feb Mar Apr
May
Jun
Jul
Aug
Sep
Oct
94
95
96
97
98
99
100
101
102
103
Nov Dec Jan Feb Mar Apr May Jun Jul Aug Sep Oct
% o
f S
ea
so
n A
ve
rag
e P
ric
e

Weekly Nearby Soybean Futures

November Soybean Futures

GLOBAL WHEAT SITUATION
0
100
200
300
400
500
600
700
1995 1996 1997 1998 1999 2000 2001 2002 2003 2004
Mill
ion
Met
ric
To
nn
es
Production Use End Stocks

U.S. WHEAT ACRES
0.0
10.0
20.0
30.0
40.0
50.0
60.0
70.0
80.0
90.0
100.0
1980
1981
1982
1983
1984
1985
1986
1987
1988
1989
1990
1991
1992
1993
1994
1995
1996
1997
1998
1999
2000
2001
2002
2003
2004
2005
Mill
ion
Ac
res
Planted Acres Harvested Acres

U.S. Wheat Yields
25.0
30.0
35.0
40.0
45.0
50.0
1980 1982 1984 1986 1988 1990 1992 1994 1996 1998 2000 2002 2004
Bu
shel
s P
er A
cre

U.S.WHEAT - TOTAL SUPPLY
0
500
1,000
1,500
2,000
2,500
3,000
3,500
4,000
4,500
5,000
1980
1981
1982
1983
1984
1985
1986
1987
1988
1989
1990
1991
1992
1993
1994
1995
1996
1997
1998
1999
2000
2001
2002
2003
2004
2005
Mill
ion
Bu
shel
s
Carry In Stocks Production

U.S. Wheat Use
0
500
1,000
1,500
2,000
2,500
3,000
1980
1981
1982
1983
1984
1985
1986
1987
1988
1989
1990
1991
1992
1993
1994
1995
1996
1997
1998
1999
2000
2001
2002
2003
2004
2005
Mill
ion
Bu
shel
s
Domestic Mill Use Exports Seed Feed

U.S. Wheat Ending Stocks
0
500
1,000
1,500
2,000
2,500
1980
1981
1982
1983
1984
1985
1986
1987
1988
1989
1990
1991
1992
1993
1994
1995
1996
1997
1998
1999
2000
2001
2002
2003
2004
2005
Mil
lio
n B
us
he
ls

WHEAT PRICE vs STOCK-USE RATIO
9192 93
94
9596
97
9899
'00'01
'02'95
90
'03'04
$0.00
$0.50
$1.00
$1.50
$2.00
$2.50
$3.00
$3.50
$4.00
$4.50
$5.00
0.0% 5.0% 10.0% 15.0% 20.0% 25.0% 30.0% 35.0% 40.0% 45.0%

WHEAT SEASONAL PRICE TENDENCIESJuly Futures Contract 1997-2002
Jan
Feb Mar
Apr
May
Jul
Aug Sep Oct
Nov
Dec
Jun
80
85
90
95
100
105
110
Jan Feb Mar Apr May Jun Jul Aug Sep Oct Nov Dec
% o
f S
easo
n A
vera
ge

Nearby Weekly Wheat Futures

July Wheat Futures