Gracechurch Corporate Loans 2007-1 Investor Report ... · Gracechurch Corporate Loans 2007-1...
57
Gracechurch Corporate Loans 2007-1 Investor Report September-09 For period 31-Aug-2009 - 30-Sep-2009 Gracechurch Corporate Loans 2007-1 Investor Report Page 1
Transcript of Gracechurch Corporate Loans 2007-1 Investor Report ... · Gracechurch Corporate Loans 2007-1...

Gracechurch Corporate Loans 2007-1
Investor Report
September-09For period 31-Aug-2009 - 30-Sep-2009
Gracechurch Corporate Loans 2007-1Investor Report Page 1

Portfolio Summary
Report Date 30-Sep-09Interest Payment Date 20-Sep-09Previous Report Date 31-Aug-09Dates Applicable to Report 31-Aug-2009 - 30-Sep-2009Transaction Settlement Date 08-Feb-07Next Investor Report Produced 31-Oct-09Next Investor Report Distribution Date 31-Oct-09Next Interest Payment Date 20-Dec-09
Note Classes
Tranche Size Tranche Size Pool Factor as at Note Balances as at Legal% STG Equiv. (£m) 20-Sep-09 20-Sep-09 Final
A1 AAA/Aaa STG £1,046,000,000.00 1.000000 £1,046,000,000.00 3mth £ Libor + 0.17%A2 AAA/Aaa EUR £698,983,297.00 1.000000 £698,983,297.00 3mth Euribor + 0.16%A3 AAA/Aaa USD £1,160,016,703.00 1.000000 £1,160,016,703.00 3mth $ Libor + 0.15%
AB1 AAA/Aaa STG £106,750,000.00 1.000000 £106,750,000.00 3mth £ Libor + 0.19%AB2 AAA/Aaa EUR £68,250,000.00 1.000000 £68,250,000.00 3mth Euribor + 0.18%B1 AA+/Aa2 STG £32,600,000.00 1.000000 £32,600,000.00 3mth £ Libor + 0.30%B2 AA+/Aa2 EUR £42,816,633.00 1.000000 £42,816,633.00 3mth Euribor + 0.28%B3 AA+/Aa2 USD £5,083,367.00 1.000000 £5,083,367.00 3mth $ Libor + 0.27%C1 A+/A2 STG £36,400,000.00 1.000000 £36,400,000.00 3mth £ Libor + 0.58%C2 A+/A2 EUR £46,408,255.00 1.000000 £46,408,255.00 3mth Euribor + 0.55%C3 A+/A2 USD £11,691,745.00 1.000000 £11,691,745.00 3mth $ Libor + 0.55%D1 BBB+/Baa3 STG £33,000,000.00 1.000000 £33,000,000.00 3mth £ Libor + 0.87%D2 BBB+/Baa3 EUR £26,500,000.00 1.000000 £26,500,000.00 3mth Euribor + 0.83%E1 BB/Ba2 STG £43,100,000.00 1.000000 £43,100,000.00 3mth £ Libor + 2.95%E2 BB/Ba2 EUR £26,900,000.00 1.000000 £26,900,000.00 3mth Euribor + 2.75%F1 B/B2 STG £28,050,000.00 1.000000 £28,050,000.00 3mth £ Libor + 5.90%F2 B/B2 EUR £17,450,000.00 1.000000 £17,450,000.00 3mth Euribor + 5.70%G NR/NR STG £70,000,000.00 1.000000 £70,000,000.00 3mth £ Libor + 9.00% Sep-31
TOTAL 100.00% £3,500,000,000 £3,500,000,000
Collateral SummaryAt Closing Date At Reporting Date At Reporting Date
08-Feb-07 31-Aug-09 30-Sep-09
Reference Portfolio Notional Amount £3,500,000,000.00 £3,499,250,000.00 £3,499,250,000.00
Reference Portfolio Notional Replenished Amount £0.00 £605,294,406.96 £585,003,842.12
Reference Portfolio Aggregate Reference Obligation Outstanding Debt £4,334,728,018.22 £4,196,004,314.44 £4,101,704,864.60
Number of Borrowers 1343 1457 1458
Number of Reference Obligations 1701 1987 2010
Largest Borrower Notional Amount £24,500,000.00 £24,500,000.00 £24,500,000.00
Smallest Borrower Notional Amount £500,000.00 £5,839.32 £7,947.83
Average Borrower Notional Amount £2,606,105.73 £2,401,681.54 £2,400,034.29
Largest Borrower Aggregate Reference Obligation Outstanding Debt £212,338,265.00 £90,356,089.66 £101,982,202.03
Smallest Borrower Aggregate Reference Obligation Outstanding Debt £500,000.00 £15,265.16 £7,947.83
Average Borrower Aggregate Reference Obligation Outstanding Debt £3,227,645.58 £2,879,893.15 £2,813,240.65
Weighted Average Time To Maturity of the Reference Obligations 5.03 4.76 4.76
Weighted Average Barclays Expected Loss Severity 40.00% 27.16% 26.62%
Annual CPR (excluding short-term facilities) 29.80%
Hurdle Moody's Metric for Current Reporting PeriodClass Actual Moody's Metric Required Moody's MetricAB 0.44833 1B 2.45927 3C 5.16589 6D 8.81224 10E 10.70487 12F 12.73412 15
S&P Scenario Default Rate For Current Reporting PeriodRating Scenario Default Rate (%) Breakeven Default Rate (%)AAA 14.626% 31.112%AA+ 14.079% 25.949%A+ 12.648% 19.896%BBB+ 11.131% 15.315%BB 8.255% 10.790%B 6.774% 7.777%
Table 1Portfolio Summary
Weighted Average Minimum MaximumBarclays Expected Loss-given-default Severity ("BELS") 26.62% 5.00% 100.00%Reference Loan Notional Amount (£) 1,740,920.40 630.29 24,500,000.00Borrower Notional Amount (£) 2,400,034.29 7,947.83 24,500,000.00Issuer Concentration 0.07% 0.00% 0.70%Industry Concentration (Moody's Industry Sector) 3.03% 0.00% 19.87%Years to Maturity 4.76 0.00 17.66Proportion of syndicated facilities 4.33%Note: In the case of the Reference Loan/Borrower Notional Amount, Issuer and Industry Concentration the average shown is unweighted.
2.00%
Sep-31
Sep-31
Sep-31
Sep-31
Sep-31
Sep-31
2.70%
1.70%
2.00%
Coupons
5.00%
83.00% Sep-31
2.30%
1.30%
Class Rating (S/M) Currency
Page 2 of 5730/06/2008

Stratification Tables
Table 2
No. of Borrowers
% of TotalAggregate Borrower
Notional Amount% of Total
> - <= 2.5 1,134 77.78% £1,085,017,458 31.01%> 2.5 <= 5.0 173 11.87% £604,745,743 17.28%> 5.0 <= 7.5 52 3.57% £317,560,598 9.08%> 7.5 <= 10.0 32 2.19% £274,886,297 7.86%> 10.0 <= 15.0 23 1.58% £276,822,079 7.91%> 15.0 <= 20.0 17 1.17% £298,960,624 8.54%> 20.0 27 1.85% £641,257,201 18.33%Total 1,458 100% £3,499,250,000 100%
Table 3
No. of Borrowers
% of TotalAggregate Borrower
Reference Debt Outstanding
% of Total
> - <= 5.0 1,290 88.48% £1,706,698,147 41.61%> 5.0 <= 10.0 93 6.38% £642,968,997 15.68%> 10.0 <= 15.0 29 1.99% £354,040,928 8.63%> 15.0 <= 20.0 16 1.10% £280,799,945 6.85%> 20.0 <= 30.0 14 0.96% £352,722,561 8.60%> 30.0 <= 40.0 9 0.62% £315,627,036 7.70%> 40.0 <= 50.0 2 0.14% £85,356,714 2.08%> 50.0 <= 75.0 4 0.27% £261,508,333 6.38%> 75.0 <= 100.0 0 0.00% £0 0.00%> 100.0 1 0.07% £101,982,202 2.49%Total 1,458 100% £4,101,704,865 100%
Table 4
No of Reference
Obligations% of Total
Aggregate Ref Obligation Notional
Amount% of Total
> - <= 2.5 1,704 84.78% £1,499,836,679 42.86%> 2.5 <= 5.0 184 9.15% £643,352,534 18.39%> 5.0 <= 7.5 49 2.44% £290,467,751 8.30%> 7.5 <= 10.0 28 1.39% £245,674,871 7.02%> 10.0 <= 15.0 12 0.60% £154,709,672 4.42%> 15.0 <= 20.0 17 0.85% £292,018,697 8.35%> 20.0 16 0.80% £373,189,795 10.66%Total 2,010 100% £3,499,250,000 100%
Table 5
No. of Reference
Obligations% of Total
Aggregate Reference Obligation Outstanding
Debt% of Total
> - <= 2.5 1,684 83.78% £1,542,941,434 37.62%> 2.5 <= 5.0 187 9.30% £653,981,884 15.94%> 5.0 <= 7.5 58 2.89% £347,685,857 8.48%> 7.5 <= 10.0 25 1.24% £222,008,144 5.41%> 10.0 <= 15.0 20 1.00% £263,694,428 6.43%> 15.0 <= 20.0 16 0.80% £277,853,306 6.77%> 20.0 <= 30.0 9 0.45% £219,896,919 5.36%> 30.0 <= 40.0 5 0.25% £175,795,643 4.29%> 40.0 <= 50.0 2 0.10% £85,356,714 2.08%> 50.0 <= 75.0 3 0.15% £210,508,333 5.13%> 75.0 <= 100.0 0 0.00% £0 0.00%> 100.0 1 0.05% £101,982,202 2.49%Total 2,010 100% £4,101,704,865 100%
Distribution of Borrowers by Borrower Aggregate Reference Obligation Outstanding Debt
Distribution of Reference Obligations by Reference Obligation Notional Amount
Distribution of Borrowers by Notional Amount
Borrower Notional Amount (£m)
Distribution of Reference Obligations by Reference Obligation Outstanding Debt
Reference Obligation Outstanding Debt
Reference Obligation Notional Amount (£m)
Borrower Aggregate Reference Obligation Outstanding Debt
Page 3 of 5730/06/2008

Stratification Tables
Table 6
No. of Borrowers
% of TotalAggregate Borrower
Notional Amount% of Total
0 0.00% £0 0.00%76 5.21% £135,204,908 3.86%10 0.69% £77,963,303 2.23%32 2.19% £113,331,979 3.24%
295 20.23% £695,226,631 19.87%31 2.13% £86,384,168 2.47%
8 0.55% £20,103,619 0.57%15 1.03% £23,836,662 0.68%10 0.69% £11,256,426 0.32%81 5.56% £212,678,919 6.08%
6 0.41% £8,438,276 0.24%12 0.82% £28,243,011 0.81%33 2.26% £133,578,548 3.82%
1 0.07% £24,500,000 0.70%55 3.77% £91,547,411 2.62%38 2.61% £63,231,031 1.81%
123 8.44% £266,673,539 7.62%56 3.84% £72,957,248 2.08%84 5.76% £307,792,715 8.80%
3 0.21% £17,824,110 0.51%69 4.73% £190,270,977 5.44%75 5.14% £100,086,376 2.86%25 1.71% £47,376,227 1.35%17 1.17% £24,775,954 0.71%59 4.05% £181,649,627 5.19%25 1.71% £100,488,061 2.87%56 3.84% £74,177,363 2.12%88 6.04% £206,289,885 5.90%
7 0.48% £63,705,079 1.82%40 2.74% £45,418,814 1.30%13 0.89% £29,787,976 0.85%
2 0.14% £11,782,515 0.34%13 0.89% £32,668,641 0.93%
1,458 100% £3,499,250,000 100%
Table 7
No. of Reference
Obligations% of Total
Aggregate Ref Obligation Notional
Amount% of Total
> - <= 1.0 829 41.24% £1,243,226,967 35.53%> 1.0 <= 2.0 120 5.97% £381,295,071 10.90%> 2.0 <= 3.0 90 4.48% £326,719,554 9.34%> 3.0 <= 4.0 79 3.93% £232,591,733 6.65%> 4.0 <= 5.0 74 3.68% £161,346,369 4.61%> 5.0 <= 7.0 120 5.97% £180,241,161 5.15%> 7.0 <= 10.0 212 10.55% £276,108,330 7.89%> 10.0 <= 15.0 357 17.76% £498,997,193 14.26%> 15.0 <= 20.0 129 6.42% £198,723,624 5.68%> 20.0 0 0.00% £0 0.00%Total 2,010 100% £3,499,250,000 100%
Table 8
No. of Borrowers
% of TotalAggregate Borrower
Notional Amount% of Total
2 0.14% £628,233 0.02%26 1.78% £152,798,546 4.37%
6 0.41% £28,303,259 0.81%35 2.40% £94,228,283 2.69%15 1.03% £19,024,515 0.54%20 1.37% £107,915,618 3.08%
179 12.28% £477,517,166 13.65%262 17.97% £660,095,278 18.86%264 18.11% £562,284,171 16.07%298 20.44% £753,984,553 21.55%132 9.05% £244,410,912 6.98%216 14.81% £394,206,708 11.27%
3 0.21% £3,852,759 0.11%0 0.00% £0 0.00%
1,458 100.00% £3,499,250,000 100.00%
6.07.08.0
Total
3.04.05.0
9.010.0
1.82.12.52.8
Barclays Business Grade
1.2
Distribution of Borrowers by Barclays Business Grade
1.5
Broadcasting & EntertainmentTotal
Years to Maturity
Distribution of Reference Obligations by Years to Maturity
TelecommunicationsTextiles and LeatherPersonal TransportationUtilities
Personal, Food and MiscellaneousPrinting and PublishingCargo TransportRetail Stores
Leisure, Amusement, EntertainmentMachinery (Non-Agriculture, Non-Construction, Mining, Steel, Iron and Non Precious MetalsOil and Gas
Healthcare, Education and ChildcareHome and Office Furnishings, Housewares, and Hotels, Motels, Inns and GamingInsurance
Containers, Packaging and Glass
Diversified/Conglomerate ManufacturingDiversified/Conglomerate Service
GroceryFarming and Agriculture
Diversified Natural Resources, PreciousEcologicalElectronicsFinance
Personal and Non Durable Consumer Products
Moodys Industry Sector
Beverage, Food and TobaccoBuildings and Real EstateChemicals, Plastics and Rubber
AutomobileBanking
Aerospace and Defense
Distribution of Borrowers By Industry Sector
Page 4 of 5730/06/2008

Stratification Tables
Table 9
No. of Reference
Obligations% of Total
Aggregate Ref. Obligation Notional
Amount% of Total
> - <= 10.0 430 21.39% £561,012,320 16.03%> 10.0 <= 20.0 785 39.05% £1,191,274,890 34.04%> 20.0 <= 30.0 315 15.67% £523,261,809 14.95%> 30.0 <= 40.0 154 7.66% £409,287,961 11.70%> 40.0 <= 50.0 121 6.02% £492,674,702 14.08%> 50.0 <= 60.0 100 4.98% £185,115,902 5.29%> 60.0 <= 70.0 43 2.14% £70,588,279 2.02%> 70.0 <= 80.0 24 1.19% £23,731,810 0.68%> 80.0 <= 90.0 31 1.54% £29,996,854 0.86%> 90.0 7 0.35% £12,305,472 0.35%Total 2,010 100% £3,499,250,000 100%
Table 10
BBG 0 - 10 % 10 - 20 % 20 - 30 % 30 - 40 % 40 - 50 % 50 - 60 % 60 - 70 % 70 - 80 % 80 - 90 % 90 - 100 % Total1.2 0.00% 0.00% 0.00% 0.00% 0.00% 0.01% 0.00% 0.00% 0.00% 0.00% 0.02%1.5 0.33% 0.04% 0.14% 1.43% 1.71% 0.70% 0.00% 0.00% 0.01% 0.00% 4.37%1.8 0.00% 0.19% 0.00% 0.25% 0.00% 0.05% 0.31% 0.00% 0.00% 0.00% 0.81%2.1 1.08% 0.72% 0.19% 0.57% 0.11% 0.02% 0.00% 0.00% 0.00% 0.00% 2.69%2.5 0.19% 0.20% 0.03% 0.00% 0.00% 0.12% 0.01% 0.00% 0.00% 0.00% 0.54%2.8 0.12% 1.65% 0.89% 0.04% 0.39% 0.00% 0.00% 0.00% 0.00% 0.00% 3.08%3 2.00% 3.88% 3.07% 2.29% 1.79% 0.20% 0.37% 0.00% 0.04% 0.00% 13.65%4 4.28% 5.96% 2.53% 1.79% 3.02% 0.75% 0.15% 0.13% 0.20% 0.05% 18.86%5 3.73% 6.48% 1.59% 1.53% 1.93% 0.27% 0.22% 0.24% 0.07% 0.00% 16.07%6 2.25% 7.95% 2.58% 2.83% 2.58% 2.02% 0.61% 0.19% 0.38% 0.17% 21.55%7 1.04% 1.91% 1.23% 0.52% 1.53% 0.34% 0.13% 0.02% 0.12% 0.13% 6.98%8 1.01% 4.97% 2.69% 0.44% 1.02% 0.79% 0.20% 0.09% 0.05% 0.00% 11.27%9 0.00% 0.09% 0.02% 0.00% 0.00% 0.00% 0.00% 0.00% 0.00% 0.00% 0.11%10 0.00% 0.00% 0.00% 0.00% 0.00% 0.00% 0.00% 0.00% 0.00% 0.00% 0.00%Grand Total 16.03% 34.04% 14.95% 11.70% 14.08% 5.29% 2.02% 0.68% 0.86% 0.35% 100.00%
Table 11
No. of Borrowers
% of TotalAggregate Borrower
Notional Amount% of Total
1,115 76.47% £2,397,579,387 68.52%68 4.66% £333,160,976 9.52%
265 18.18% £753,685,261 21.54%10 0.69% £14,824,376 0.42%
1,458 100% £3,499,250,000 100%
Table 12
BELS vs EWL Not on EWL 1 2 3 Total0 - 10% 12.92% 1.007% 1.977% 0.03% 15.94%10 - 20% 24.63% 1.827% 6.805% 0.17% 33.43%20 - 30% 10.24% 0.829% 4.208% 0.03% 15.31%30 - 40% 7.24% 2.292% 2.138% 0.00% 11.67%40 - 50% 7.81% 2.508% 3.559% 0.00% 13.88%50 - 60% 2.78% 0.934% 1.790% 0.17% 5.67%60 - 70% 1.34% 0.041% 0.636% 0.00% 2.02%70 - 80% 0.51% 0.073% 0.072% 0.02% 0.68%80 - 90% 0.57% 0.010% 0.353% 0.00% 0.94%90 - 100% 0.47% 0.000% 0.000% 0.00% 0.47%
68.52% 9.52% 21.54% 0.42% 100%
Table 13
No. of Reference
Obligations% of Total
Aggregate Notional Amount
% of Total
1,998 99.40% £3,347,859,316 95.67%12 0.60% £151,390,684 4.33%
2,010 100% £3,499,250,000 100%
Not on EWL
Total
Distribution of Reference Obligations by Number of Holders
BilateralSyndicated
Number of Holders
1
Total
Distribution of Borrowers by BELS and EWL Status
23
Total
EWL Level
Distribution of Reference Obligations by Barclays Expected Loss Severity
Barclays Expected Loss Severity Bands
Barclays Expected Loss -given-default Severity BandsPercentage of Reference Portfolio Notional Amount
Distribution of Borrowers by Early Warning List Level
Page 5 of 5730/06/2008

Cashflow Waterfall
Available Income Funds Priority of Payments
Issuer Income £Income from Cash Deposit £10,722,106.16Income from Credit Default Swap Premium £10,283,253.57Other Income £0.00TOTAL INCOME £21,005,359.73
Issuer OutgoingsWaterfall Priority Description of Payment £
1 Interest payments for Class A1 Notes £3,647,710.071 Payment to Swap Counterparty for Class A2 Note interest £2,468,928.691 Payment to Swap Counterparty for Class A3 Note interest £4,145,964.852 Credit PDL Ledger for Class A Notes £0.003 Interest payments for Class AB1 Notes £377,591.573 Payment to Swap Counterparty for Class AB2 Note interest £245,086.403 Payment to Swap Counterparty for Class AB3 Note interest £0.004 Credit PDL Ledger for Class AB Notes £0.005 Interest payments for Class B1 Notes £124,251.775 Payment to Swap Counterparty for Class B2 Note interest £165,988.305 Payment to Swap Counterparty for Class B3 Note interest £19,856.366 Credit PDL Ledger for Class B Notes £0.007 Interest payments for Class C1 Notes £164,145.307 Payment to Swap Counterparty for Class C2 Note interest £215,583.197 Payment to Swap Counterparty for Class C3 Note interest £54,627.218 Credit PDL Ledger for Class C Notes £0.009 Interest payments for Class D1 Notes £172,672.509 Payment to Swap Counterparty for Class D2 Note interest £145,420.069 Payment to Swap Counterparty for Class D3 Note interest £0.00
10 Credit PDL Ledger for Class D Notes £0.0011 Interest payments for Class E Notes £449,026.7211 Payment to Swap Counterparty for Class E2 Note interest £300,840.2012 Credit PDL Ledger for Class E Notes £0.0013 Interest payments for Class F Notes £498,533.9913 Payment to Swap Counterparty for Class F2 Note interest £352,087.6714 Credit PDL Ledger for Class F Notes £0.0015 Credit the Reserve Account to its Required Amount £0.0016 Interest payments for Class G Notes £1,785,127.0517 Credit PDL Ledger for Class G Notes £0.0018 Payment of any Cross Currency Swap Termination Payment £0.0019 Remaining Cash Paid to CDS Counterparty (Excess Spread) £5,671,917.81
Excess Spread % (p.a) 0.65
Reserve Fund Analysis £Reserve Fund Required Amount £0.00Reserve Fund Balance b/f £0.00Reserve Fund Additions this period £0.00Reserve Fund Drawings this period £0.00Reserve Fund Balance c/F £0.00
Loss Analysis £Losses Arising in the Current Period
Principal Deficiency Ledger AnalysisPDL Outstanding PDL Cured This Period Carried Forward PDL
Class A £0.00 £0.00 £0.00Class AB £0.00 £0.00 £0.00Class B £0.00 £0.00 £0.00Class C £0.00 £0.00 £0.00Class D £0.00 £0.00 £0.00Class E £0.00 £0.00 £0.00Class F £0.00 £0.00 £0.00Class G £0.00 £0.00 £0.00TOTAL £0.00 £0.00 £0.00
Page 6 of 5730/06/2008

Defaulted Reference Obligations
Analysis of Defaulted Reference Obligations
Date of Credit Event Loan Number
Borrower Number BBG
Barclays Expected Loss Severity (%)
Severity Band
Reference Obligation Outstanding Debt
Reference Obligation Notional Amount
Moody's Industry Sector Moody's Industry Sector Maturity Date
Remaining Term
(Months)EWL prior to default Syndicated
15/08/2007 207964 203905 9 54 50 - 60% 15,000,000.00 17,973.42 4 Beverage, Food and Tobacco 24/07/2011 1.98 215/05/2008 215240 203667 9 27 20 - 30% 802,276.68 787,301.99 26 Printing and Publishing 31/10/2009 0.25 015/07/2008 205196 203586 7 28 20 - 30% 615,778.22 609,787.79 18 Home and Office Furnishings, Housewares, and Durable Consumer Products 03/10/2021 12.17 015/08/2008 218065 204670 8 27 20 - 30% 796,590.46 796,590.46 16 Grocery 01/03/2009 0.00 215/04/2009 207385 200353 6 59 50 - 60% 460,950.13 460,950.13 2 Automobile 31/05/2009 0.00 315/08/2009 200614 200485 7 53 50 - 60% 353,661.34 350,000.00 21 Leisure, Amusement, Entertainment 17/07/2012 2.96 315/08/2009 213837 200485 7 53 50 - 60% 3,964,116.30 2,784,231.23 21 Leisure, Amusement, Entertainment 30/09/2009 0.16 315/09/2009 227375 204105 9 20 10 - 20% 3,058,880.16 3,047,483.41 23 Mining, Steel, Iron and Non Precious Metals 28/11/2026 17.33 3
25,052,253.29 8,854,318.43
Page 7 of 5730/06/2008
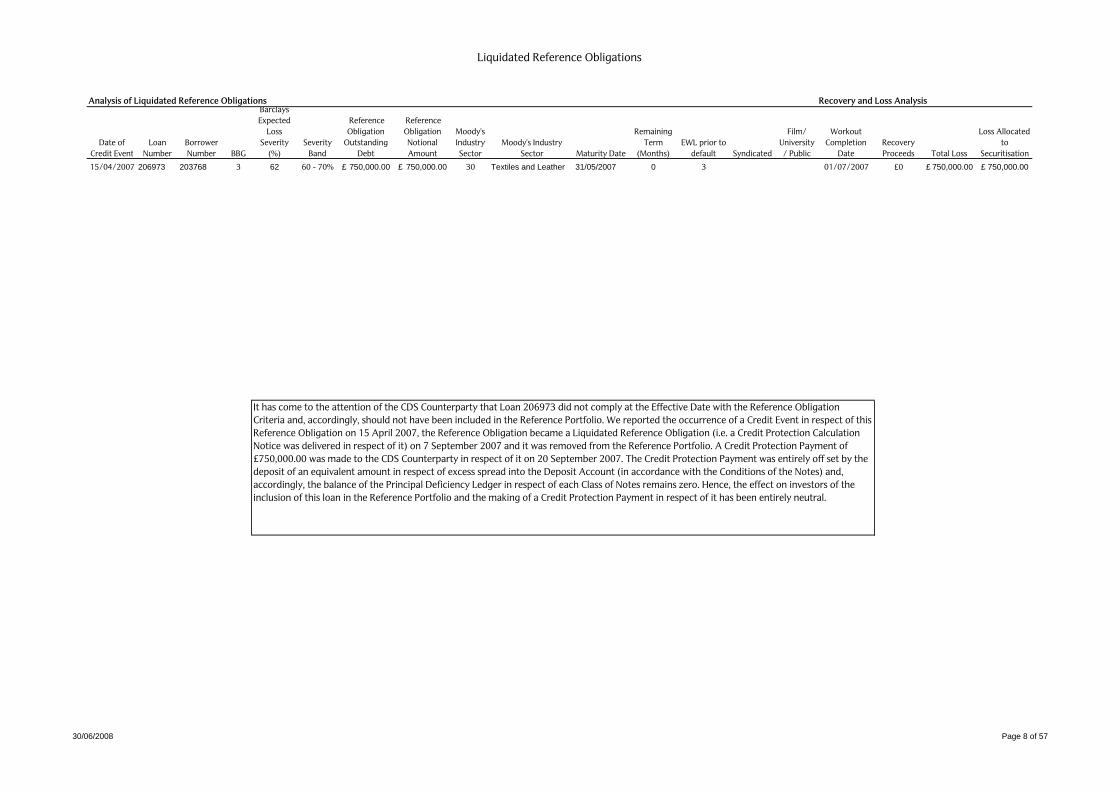
Liquidated Reference Obligations
Analysis of Liquidated Reference Obligations Recovery and Loss Analysis
Date of Credit Event
Loan Number
Borrower Number BBG
Barclays Expected
Loss Severity
(%)Severity
Band
Reference Obligation
Outstanding Debt
Reference Obligation Notional Amount
Moody's Industry Sector
Moody's Industry Sector Maturity Date
Remaining Term
(Months)EWL prior to
default Syndicated
Film/ University/ Public
Workout Completion
DateRecovery Proceeds Total Loss
Loss Allocated to
Securitisation
15/04/2007 206973 203768 3 62 60 - 70% 750,000.00£ 750,000.00£ 30 Textiles and Leather 31/05/2007 0 3 01/07/2007 £0 750,000.00£ 750,000.00£
It has come to the attention of the CDS Counterparty that Loan 206973 did not comply at the Effective Date with the Reference Obligation Criteria and, accordingly, should not have been included in the Reference Portfolio. We reported the occurrence of a Credit Event in respect of this Reference Obligation on 15 April 2007, the Reference Obligation became a Liquidated Reference Obligation (i.e. a Credit Protection Calculation Notice was delivered in respect of it) on 7 September 2007 and it was removed from the Reference Portfolio. A Credit Protection Payment of £750,000.00 was made to the CDS Counterparty in respect of it on 20 September 2007. The Credit Protection Payment was entirely off set by the deposit of an equivalent amount in respect of excess spread into the Deposit Account (in accordance with the Conditions of the Notes) and, accordingly, the balance of the Principal Deficiency Ledger in respect of each Class of Notes remains zero. Hence, the effect on investors of the inclusion of this loan in the Reference Portfolio and the making of a Credit Protection Payment in respect of it has been entirely neutral.
Page 8 of 5730/06/2008

Triggers & Restrictions
Analysis of Transaction Triggers and Restrictions
1) Reserve Fund Required Amount - if Balance of reference obligations subject to a credit event exceed 3.9% of outstanding note balance then trap £45.5m
Trigger level 0.25%Trigger Pass or Fail PASSIf Trigger Failed Previously, can Reserve Fund Deposit be released? N/A
2) The Concentration of any one industry must not exceed 20% (based on Moody's Industry Sectors)
Maximum Industry Concentration 19.868%Trigger Pass or Fail PASS
3) The S&P CDO Evaluator condition is satisfied
Trigger Pass or Fail PASS
4) The Moodys CDOROM condition is satisfied
Trigger Pass or Fail PASS
5) No more than 5% of the reference portfolio by value will not have an S&P equivalent Rating
% of portfolio without an S&P equivalent rating 0.77%Trigger Pass or Fail PASS
6) No more than 1% of the reference portfolio by value will have a Moody's 1 year EDF of greater than 13%
% of portfolio with an EDF greater than 13% 0.35%Trigger Pass or Fail PASS
7) Pro-rata repayment tests
a) Are the Class A and AB notes combined 50% of their initial size? NOb) Is Reserve Fund at its Required Amount? TRUE TRUEc) No PDL's exist TRUEd) The sum of (A) and (B) is less than the balance of the G Notes TRUE(A) - the Balance of Defaulted Reference Obligations £8,854,318.43(B) - 50% of the Balance of Reference Obligations Notional Amounts that have a Moody's 1 year EDF of greater than 15% £5,705,969.00Balance of the Class G Notes £70,000,000e) The Weighted Average of the 1 year expected loss of the Reference Obligations (calculated by Moody's Riskcalc) is less than 4% 1.30% PASS
> Are all Pro-rata repayment tests satisfied? NO> Note Repayment Basis SEQUENTIAL
Page 9 of 5730/06/2008

Data By Reference Obligation
Data as of 01 August 2009
Loan Number Borrower Number BBGBarclays Expected LossSeverity (%) Severity Band
Reference Obligation Outstanding Debt
Reference Obligation Notional Amount
Moody's Industry Sector Moody's Industry Sector Maturity Date
Remaining Term(Years) EWL Syndicated
Date of Entry into Pool
BBG Upon PoolEntry BELS Upon Pool Entry EWL Upon Pool Entry
200019 200013 3.0 19 10 - 20% 1,277,999.41£ 1,118,753.83£ 23 Mining, Steel, Iron and Non Precious Metals 30/01/2023 13.50 01/08/2006 3.0 15200032 200024 1.2 10 0 - 10% 118,230.00£ 118,230.00£ 17 Healthcare, Education and Childcare 21/12/2009 0.39 01/05/2006 2.1 15200055 200040 4.0 14 10 - 20% 679,244.00£ 679,244.00£ 21 Leisure, Amusement, Entertainment 28/05/2018 8.83 01/05/2006 2.1 15200063 200046 4.0 5 0 - 10% 607,243.98£ 607,243.98£ 27 Cargo Transport 09/02/2020 10.52 01/08/2006 3.0 15200068 200050 5.0 13 10 - 20% 721,836.02£ 719,636.02£ 17 Healthcare, Education and Childcare 04/03/2023 13.59 01/08/2006 3.0 15200071 200053 6.0 21 20 - 30% 496,513.50£ 496,513.50£ 28 Retail Stores 23/04/2024 14.73 01/08/2006 3.0 29200078 200060 3.0 10 0 - 10% 671,198.51£ 671,198.51£ 2 Automobile 03/01/2021 11.42 01/08/2006 3.0 15200109 200085 4.0 46 40 - 50% 455,503.42£ 455,503.42£ 21 Leisure, Amusement, Entertainment 31/03/2021 11.67 01/08/2006 3.0 15200140 200109 6.0 6 0 - 10% 693,488.51£ 571,412.64£ 19 Hotels, Motels, Inns and Gaming 31/10/2009 0.25 01/11/2008 6.0 6200141 200109 6.0 6 0 - 10% 104,194.80£ 104,194.80£ 19 Hotels, Motels, Inns and Gaming 06/01/2010 0.43 01/05/2006 4.0 15200144 200112 7.0 13 10 - 20% 660,219.14£ 435,361.35£ 30 Textiles and Leather 31/10/2009 0.25 01/08/2006 3.0 15200172 200136 6.0 13 10 - 20% 1,274,382.50£ 1,261,197.48£ 19 Hotels, Motels, Inns and Gaming 11/04/2010 0.69 2 01/08/2006 2.5 15200173 200136 6.0 13 10 - 20% 1,178,643.98£ 1,012,803.15£ 19 Hotels, Motels, Inns and Gaming 24/03/2020 10.65 2 01/05/2006 2.1 15200196 200155 3.0 6 0 - 10% 627,030.19£ 627,030.19£ 19 Hotels, Motels, Inns and Gaming 15/10/2012 3.21 01/05/2006 4.0 15200200 200158 3.0 5 0 - 10% 381,132.02£ 381,132.02£ 21 Leisure, Amusement, Entertainment 29/09/2012 3.16 01/05/2006 4.0 15200244 200185 8.0 12 10 - 20% 1,083,303.52£ 1,083,303.52£ 2 Automobile 11/12/2021 12.36 2 01/05/2006 3.0 15200247 200188 4.0 10 0 - 10% 483,964.18£ 483,964.18£ 28 Retail Stores 30/10/2017 8.25 01/08/2006 4.0 15200273 200209 8.0 12 10 - 20% 1,171,684.78£ 1,160,418.00£ 2 Automobile 30/06/2020 10.91 2 01/05/2006 5.0 28200281 200215 3.0 11 10 - 20% 577,986.90£ 577,986.90£ 25 Personal, Food and Miscellaneous 22/01/2019 9.48 01/08/2006 2.1 15200282 200216 7.0 6 0 - 10% 420,000.00£ 420,000.00£ 10 Diversified/Conglomerate Service 03/01/2011 1.42 01/05/2006 4.0 100200292 200225 6.0 13 10 - 20% 807,571.23£ 807,571.23£ 27 Cargo Transport 31/10/2009 0.25 01/08/2006 5.0 15200321 200251 4.0 6 0 - 10% 605,000.00£ 605,000.00£ 4 Beverage, Food and Tobacco 31/10/2009 0.25 01/05/2006 4.0 24200334 200262 6.0 16 10 - 20% 785,193.64£ 632,607.00£ 16 Grocery 12/06/2022 12.86 01/05/2006 4.0 15200362 200285 6.0 6 0 - 10% 513,520.31£ 513,520.31£ 31 Personal Transportation 07/03/2021 11.60 2 01/08/2006 4.0 15200368 200291 5.0 15 10 - 20% 852,765.64£ 852,765.64£ 17 Healthcare, Education and Childcare 19/01/2021 11.47 01/05/2006 2.5 15200369 200292 3.0 10 0 - 10% 2,658,300.00£ 2,658,300.00£ 25 Personal, Food and Miscellaneous 23/12/2024 15.39 01/05/2006 2.8 15200370 200293 4.0 5 0 - 10% 452,313.75£ 452,313.75£ 31 Personal Transportation 30/04/2024 14.75 01/08/2006 2.1 37200373 200296 8.0 15 10 - 20% 663,589.96£ 663,589.96£ 28 Retail Stores 29/09/2015 6.16 2 01/08/2006 2.5 15200394 200315 8.0 30 20 - 30% 645,503.17£ 645,503.17£ 28 Retail Stores 27/03/2021 11.66 2 01/08/2006 5.0 16200401 200321 4.0 9 0 - 10% 401,362.78£ 401,362.78£ 28 Retail Stores 16/05/2013 3.79 01/05/2006 4.0 15200443 200354 3.0 15 10 - 20% 477,933.62£ 477,933.62£ 2 Automobile 27/05/2015 5.82 01/08/2006 2.5 20200458 200366 7.0 14 10 - 20% 1,242,969.35£ 1,242,969.35£ 23 Mining, Steel, Iron and Non Precious Metals 21/12/2020 11.39 01/08/2006 3.0 20200463 200368 5.0 25 20 - 30% 518,379.68£ 518,379.68£ 17 Healthcare, Education and Childcare 24/11/2024 15.31 01/08/2006 4.0 45200496 200387 8.0 15 10 - 20% 2,665,587.60£ 2,665,587.60£ 26 Printing and Publishing 30/09/2015 6.16 2 01/10/2008 6.0 15200513 200401 5.0 24 20 - 30% 490,698.17£ 470,133.18£ 22 Machinery (Non-Agriculture, Non-Construction, Non-Electro 05/04/2021 11.68 01/05/2006 5.0 39200523 200410 5.0 82 80 - 90% 555,190.86£ 555,190.86£ 16 Grocery 22/05/2016 6.81 01/05/2006 2.8 81200539 200425 6.0 8 0 - 10% 278,922.00£ 278,922.00£ 9 Diversified/Conglomerate Manufacturing 08/10/2011 2.19 01/05/2006 3.0 15200541 200427 5.0 29 20 - 30% 696,957.23£ 635,705.00£ 27 Cargo Transport 17/12/2019 10.38 01/08/2006 6.0 35 2200545 200430 4.0 74 70 - 80% 327,777.24£ 327,777.24£ 27 Cargo Transport 08/06/2014 4.85 01/05/2006 2.1 15200546 200430 4.0 74 70 - 80% 338,020.47£ 338,020.47£ 27 Cargo Transport 08/06/2014 4.85 01/05/2006 2.1 15200547 200430 4.0 74 70 - 80% 318,203.13£ 318,203.13£ 27 Cargo Transport 28/12/2011 2.41 01/05/2006 2.1 15200551 200433 6.0 5 0 - 10% 2,552,083.29£ 2,552,083.29£ 24 Oil and Gas 06/02/2018 8.51 01/05/2006 4.0 28200567 200446 3.0 8 0 - 10% 686,823.24£ 686,823.24£ 28 Retail Stores 28/07/2019 9.99 01/08/2006 3.0 15200576 200161 2.8 30 20 - 30% 5,161,405.97£ 5,161,405.97£ 5 Buildings and Real Estate 03/11/2013 4.26 01/05/2006 2.5 28200582 200459 3.0 6 0 - 10% 961,689.00£ 961,689.00£ 27 Cargo Transport 23/09/2018 9.14 01/05/2006 4.0 15200584 200461 2.1 12 10 - 20% 4,811,631.28£ 4,811,631.28£ 5 Buildings and Real Estate 15/04/2011 1.71 01/08/2006 2.1 15200587 200463 3.0 19 10 - 20% 721,728.49£ 721,728.49£ 17 Healthcare, Education and Childcare 16/12/2015 6.38 01/08/2006 2.1 29200591 200467 3.0 7 0 - 10% 727,557.03£ 727,557.03£ 17 Healthcare, Education and Childcare 31/07/2015 6.00 01/08/2006 2.1 15200597 200472 3.0 12 10 - 20% 732,979.72£ 732,246.22£ 17 Healthcare, Education and Childcare 05/07/2019 9.93 01/08/2006 3.0 15200608 200480 4.0 20 10 - 20% 468,217.88£ 468,217.88£ 22 Machinery (Non-Agriculture, Non-Construction, Non-Electro 23/12/2020 11.39 01/08/2006 4.0 20200614 200485 7.0 53 50 - 60% 353,661.34£ 350,000.00£ 21 Leisure, Amusement, Entertainment 17/07/2012 2.96 3 01/05/2006 5.0 19200620 200489 4.0 22 20 - 30% 548,058.60£ 548,058.60£ 23 Mining, Steel, Iron and Non Precious Metals 31/01/2025 15.50 01/08/2006 2.5 15200635 200497 7.0 7 0 - 10% 542,884.50£ 523,091.30£ 18 Home and Office Furnishings, Housewares, and Durable Co 23/08/2014 5.06 01/08/2006 3.0 33200648 200508 2.1 6 0 - 10% 544,496.88£ 541,757.38£ 33 Broadcasting & Entertainment 01/05/2021 11.75 01/08/2006 2.1 15200652 200512 5.0 13 10 - 20% 330,878.74£ 330,878.74£ 17 Healthcare, Education and Childcare 30/05/2016 6.83 01/08/2006 2.1 15200671 200531 5.0 13 10 - 20% 523,600.00£ 523,600.00£ 30 Textiles and Leather 01/04/2011 1.67 01/05/2006 5.0 28200675 200534 5.0 13 10 - 20% 688,456.51£ 688,456.51£ 25 Personal, Food and Miscellaneous 17/11/2015 6.29 01/08/2006 5.0 15200679 200537 3.0 15 10 - 20% 1,642,735.59£ 1,634,453.21£ 28 Retail Stores 18/11/2020 11.30 01/08/2006 4.0 15200695 200549 5.0 12 10 - 20% 439,324.57£ 439,324.57£ 30 Textiles and Leather 18/02/2015 5.55 01/05/2006 4.0 15200698 200552 3.0 12 10 - 20% 453,918.88£ 453,918.88£ 18 Home and Office Furnishings, Housewares, and Durable Co 22/03/2014 4.64 01/08/2006 2.1 17200703 200557 4.0 14 10 - 20% 1,773,450.71£ 1,773,450.71£ 4 Beverage, Food and Tobacco 31/10/2009 0.25 01/06/2009 4.0 14200718 200569 3.0 8 0 - 10% 2,423,416.70£ 2,423,416.70£ 5 Buildings and Real Estate 23/09/2020 11.14 01/05/2006 2.8 15200720 200571 6.0 21 20 - 30% 465,000.00£ 465,000.00£ 26 Printing and Publishing 12/11/2024 15.28 01/05/2006 2.8 15200721 200571 6.0 21 20 - 30% 465,000.00£ 465,000.00£ 26 Printing and Publishing 12/11/2024 15.28 01/05/2006 2.8 15200722 200571 6.0 21 20 - 30% 520,000.00£ 520,000.00£ 26 Printing and Publishing 13/05/2022 12.78 01/05/2006 2.8 15200739 200582 5.0 30 20 - 30% 843,563.20£ 153,820.24£ 15 Farming and Agriculture 31/10/2009 0.25 01/01/2008 6.0 27200740 200582 5.0 30 20 - 30% 489,435.47£ 489,435.47£ 15 Farming and Agriculture 04/03/2019 9.59 01/08/2006 6.0 24200742 200584 8.0 15 10 - 20% 703,312.90£ 611,343.35£ 28 Retail Stores 23/09/2018 9.14 2 01/08/2006 6.0 15200767 200601 8.0 11 10 - 20% 490,913.04£ 490,913.04£ 13 Electronics 06/03/2012 2.60 1 01/05/2006 2.8 51200781 200610 1.5 16 10 - 20% 380,887.32£ 287,703.89£ 15 Farming and Agriculture 31/10/2009 0.25 01/08/2008 1.5 16200785 200614 2.1 6 0 - 10% 960,332.52£ 960,332.52£ 2 Automobile 10/08/2019 10.03 01/08/2006 4.0 15200801 200628 4.0 10 0 - 10% 634,618.67£ 634,618.67£ 17 Healthcare, Education and Childcare 20/06/2016 6.89 01/05/2006 3.0 22200802 200628 4.0 10 0 - 10% 527,862.97£ 527,862.97£ 17 Healthcare, Education and Childcare 20/06/2016 6.89 01/05/2006 3.0 22200827 200651 4.0 14 10 - 20% 1,359,310.36£ 1,359,310.36£ 27 Cargo Transport 05/06/2022 12.84 01/08/2006 4.0 22200837 200661 6.0 25 20 - 30% 1,003,767.74£ 1,003,767.74£ 17 Healthcare, Education and Childcare 16/08/2024 15.04 01/05/2006 3.0 17200844 200667 4.0 12 10 - 20% 2,884,455.78£ 2,884,455.78£ 21 Leisure, Amusement, Entertainment 02/09/2019 10.09 01/08/2006 3.0 15200848 200668 4.0 16 10 - 20% 765,821.61£ 765,821.61£ 22 Machinery (Non-Agriculture, Non-Construction, Non-Electro 06/01/2016 6.43 01/05/2006 2.5 15200878 200693 6.0 38 30 - 40% 473,000.00£ 473,000.00£ 16 Grocery 30/11/2015 6.33 2 01/05/2006 3.0 28200900 200707 6.0 23 20 - 30% 1,595,635.89£ 1,595,635.89£ 6 Chemicals, Plastics and Rubber 07/07/2020 10.93 01/05/2006 2.8 29200916 200720 6.0 11 10 - 20% 561,796.20£ 561,796.20£ 30 Textiles and Leather 14/10/2020 11.20 01/08/2006 5.0 15200944 200742 6.0 17 10 - 20% 541,193.50£ 541,193.50£ 28 Retail Stores 14/01/2015 5.45 01/05/2006 3.0 15200948 200745 6.0 19 10 - 20% 1,428,439.70£ 1,087,034.70£ 24 Oil and Gas 23/03/2021 11.64 01/08/2006 3.0 15
Gracechurch Corporate Loans 2007-1
Page 10 of 5730/06/2008

Data By Reference Obligation
Loan Number Borrower Number BBGBarclays Expected LossSeverity (%) Severity Band
Reference Obligation Outstanding Debt
Reference Obligation Notional Amount
Moody's Industry Sector Moody's Industry Sector Maturity Date
Remaining Term(Years) EWL Syndicated
Date of Entry into Pool
BBG Upon PoolEntry BELS Upon Pool Entry EWL Upon Pool Entry
200952 200749 3.0 16 10 - 20% 627,832.10£ 627,832.10£ 21 Leisure, Amusement, Entertainment 31/01/2020 10.50 01/08/2006 2.1 15200968 200737 3.0 22 20 - 30% 7,750,000.00£ 6,007,812.00£ 5 Buildings and Real Estate 27/02/2011 1.57 01/07/2006 2.1 32200983 200775 4.0 5 0 - 10% 426,222.00£ 426,222.00£ 17 Healthcare, Education and Childcare 17/11/2014 5.29 01/05/2006 2.1 15200992 200783 5.0 17 10 - 20% 374,511.11£ 374,511.11£ 4 Beverage, Food and Tobacco 28/11/2012 3.33 01/05/2006 4.0 15200994 200785 5.0 20 10 - 20% 532,247.61£ 532,247.61£ 23 Mining, Steel, Iron and Non Precious Metals 19/02/2024 14.55 01/05/2006 4.0 37200997 200788 5.0 17 10 - 20% 549,195.40£ 549,195.40£ 6 Chemicals, Plastics and Rubber 04/07/2017 7.93 01/05/2006 3.0 15201026 200811 4.0 8 0 - 10% 501,629.36£ 501,629.36£ 19 Hotels, Motels, Inns and Gaming 02/09/2017 8.09 01/05/2006 2.1 15201029 200814 4.0 5 0 - 10% 84,765.90£ 84,765.90£ 24 Oil and Gas 09/11/2009 0.27 01/05/2006 2.5 36201036 200820 4.0 16 10 - 20% 689,759.99£ 660,781.81£ 17 Healthcare, Education and Childcare 24/12/2018 9.40 01/08/2006 4.0 15201059 200838 7.0 8 0 - 10% 1,126,222.83£ 1,063,019.38£ 22 Machinery (Non-Agriculture, Non-Construction, Non-Electro 24/11/2022 13.31 01/08/2006 4.0 15201068 200847 8.0 14 10 - 20% 1,061,689.76£ 1,061,689.76£ 27 Cargo Transport 20/11/2023 14.30 2 01/08/2006 5.0 26 1201100 200870 5.0 16 10 - 20% 890,852.65£ 890,852.65£ 18 Home and Office Furnishings, Housewares, and Durable Co 07/04/2024 14.68 01/08/2006 2.8 46201122 200889 5.0 18 10 - 20% 2,256,025.00£ 2,256,025.00£ 13 Electronics 24/03/2011 1.65 01/05/2006 2.1 26201127 200894 6.0 38 30 - 40% 2,025,000.00£ 2,025,000.00£ 24 Oil and Gas 19/01/2014 4.47 2 01/05/2006 2.1 28201134 200900 8.0 29 20 - 30% 899,806.65£ 845,000.00£ 7 Containers, Packaging and Glass 17/01/2021 11.46 1 01/05/2006 5.0 37201137 200903 4.0 9 0 - 10% 698,100.81£ 698,100.81£ 10 Diversified/Conglomerate Service 07/11/2015 6.27 01/08/2006 4.0 28201167 200928 6.0 13 10 - 20% 5,450,000.00£ 5,450,000.00£ 5 Buildings and Real Estate 31/10/2009 0.25 2 01/06/2009 6.0 15 2201169 200930 3.0 9 0 - 10% 577,524.34£ 498,744.45£ 19 Hotels, Motels, Inns and Gaming 15/06/2023 13.87 01/08/2006 3.0 15201172 200933 2.1 12 10 - 20% 4,500,000.00£ 4,500,000.00£ 15 Farming and Agriculture 30/03/2011 1.66 01/06/2009 2.1 12201176 200935 7.0 12 10 - 20% 1,424,237.86£ 1,424,237.86£ 28 Retail Stores 01/01/2024 14.42 01/05/2006 2.1 15201196 200950 4.0 6 0 - 10% 551,476.88£ 549,676.88£ 2 Automobile 29/10/2013 4.24 01/05/2006 4.0 28201220 200965 6.0 20 10 - 20% 243,956.02£ 243,956.02£ 21 Leisure, Amusement, Entertainment 10/12/2017 8.36 01/05/2006 2.1 15201221 200966 5.0 8 0 - 10% 344,858.35£ 344,858.35£ 27 Cargo Transport 13/06/2013 3.87 01/05/2006 3.0 15201227 200941 5.0 16 10 - 20% 14,362,000.00£ 14,362,000.00£ 5 Buildings and Real Estate 19/05/2015 5.80 01/05/2006 1.8 28201228 200941 5.0 16 10 - 20% 10,000,000.00£ 10,000,000.00£ 5 Buildings and Real Estate 30/04/2014 4.75 01/05/2006 2.1 28201254 200996 4.0 23 20 - 30% 250,000.00£ 250,000.00£ 6 Chemicals, Plastics and Rubber 02/08/2010 1.00 01/05/2006 2.1 15201262 201003 8.0 11 10 - 20% 880,271.93£ 748,368.13£ 17 Healthcare, Education and Childcare 20/02/2019 9.55 2 01/08/2006 3.0 15201286 201023 4.0 15 10 - 20% 803,086.27£ 588,500.00£ 17 Healthcare, Education and Childcare 14/12/2022 13.37 01/05/2006 2.1 19201296 200197 8.0 9 0 - 10% 768,497.93£ 768,497.93£ 19 Hotels, Motels, Inns and Gaming 21/07/2015 5.97 2 01/08/2006 5.0 15201305 201041 6.0 26 20 - 30% 313,056.54£ 313,056.54£ 13 Electronics 28/02/2016 6.58 01/05/2006 5.0 58201343 201073 3.0 11 10 - 20% 419,127.85£ 419,127.85£ 30 Textiles and Leather 02/07/2018 8.92 01/08/2006 2.1 15201353 201081 4.0 8 0 - 10% 520,028.81£ 256,905.60£ 25 Personal, Food and Miscellaneous 15/12/2017 8.37 01/05/2006 4.0 15201356 201084 5.0 23 20 - 30% 1,510,861.17£ 1,112,064.00£ 19 Hotels, Motels, Inns and Gaming 28/02/2023 13.58 01/08/2006 3.0 15201372 201099 1.5 8 0 - 10% 480,000.00£ 480,000.00£ 15 Farming and Agriculture 30/06/2013 3.91 01/05/2006 2.8 68201374 201100 4.0 14 10 - 20% 1,500,000.00£ 1,062,503.00£ 19 Hotels, Motels, Inns and Gaming 13/03/2011 1.62 01/08/2006 2.8 15201381 201107 6.0 44 40 - 50% 399,375.82£ 399,375.82£ 18 Home and Office Furnishings, Housewares, and Durable Co 04/08/2019 10.01 01/05/2006 5.0 49201390 201113 3.0 7 0 - 10% 370,725.46£ 370,725.46£ 22 Machinery (Non-Agriculture, Non-Construction, Non-Electro 02/04/2014 4.67 01/05/2006 2.8 28201395 201115 6.0 6 0 - 10% 739,790.32£ 732,771.35£ 16 Grocery 10/12/2023 14.36 01/05/2006 5.0 15201396 201116 5.0 48 40 - 50% 677,082.15£ 677,082.15£ 21 Leisure, Amusement, Entertainment 11/03/2017 7.61 01/08/2006 2.8 15201409 201129 3.0 15 10 - 20% 392,681.07£ 392,681.07£ 27 Cargo Transport 23/04/2017 7.73 01/08/2006 3.0 21201420 201136 8.0 12 10 - 20% 408,975.75£ 408,713.88£ 27 Cargo Transport 03/09/2014 5.09 2 01/08/2006 3.0 27201429 201144 4.0 10 0 - 10% 796,031.76£ 448,000.00£ 25 Personal, Food and Miscellaneous 28/03/2024 14.66 01/05/2006 3.0 15201433 201147 6.0 5 0 - 10% 571,126.79£ 571,126.79£ 17 Healthcare, Education and Childcare 08/08/2017 8.02 2 01/08/2006 5.0 15201452 201158 4.0 35 30 - 40% 750,000.00£ 750,000.00£ 21 Leisure, Amusement, Entertainment 07/11/2010 1.27 01/05/2006 2.1 15201455 201161 8.0 7 0 - 10% 504,000.00£ 504,000.00£ 15 Farming and Agriculture 22/08/2012 3.06 2 01/05/2006 1.8 15201464 201170 4.0 6 0 - 10% 277,717.71£ 277,717.71£ 17 Healthcare, Education and Childcare 07/12/2011 2.35 01/05/2006 2.1 15201473 201178 6.0 17 10 - 20% 524,869.14£ 469,475.04£ 23 Mining, Steel, Iron and Non Precious Metals 31/10/2009 0.25 01/08/2006 4.0 15201485 201189 3.0 17 10 - 20% 516,777.21£ 516,777.21£ 28 Retail Stores 18/12/2023 14.38 01/08/2006 2.1 27201486 201190 3.0 9 0 - 10% 266,851.26£ 266,851.26£ 4 Beverage, Food and Tobacco 17/03/2011 1.63 01/05/2006 2.1 28201487 201190 3.0 9 0 - 10% 266,851.26£ 266,851.26£ 4 Beverage, Food and Tobacco 17/03/2011 1.63 01/05/2006 2.1 28201488 201190 3.0 9 0 - 10% 295,648.47£ 295,648.47£ 4 Beverage, Food and Tobacco 19/04/2011 1.72 01/05/2006 2.1 28201526 201218 5.0 7 0 - 10% 963,198.00£ 960,501.00£ 19 Hotels, Motels, Inns and Gaming 08/10/2021 12.19 01/05/2006 3.0 15201545 201229 5.0 13 10 - 20% 1,561,610.38£ 1,561,610.38£ 22 Machinery (Non-Agriculture, Non-Construction, Non-Electro 31/10/2009 0.25 01/06/2008 5.0 15201561 201243 4.0 82 80 - 90% 225,500.00£ 225,500.00£ 17 Healthcare, Education and Childcare 08/11/2009 0.27 01/05/2006 2.5 100201562 200721 3.0 23 20 - 30% 2,797,306.00£ 2,797,306.00£ 5 Buildings and Real Estate 31/07/2017 8.00 01/05/2006 1.5 15201570 201250 3.0 5 0 - 10% 545,718.02£ 545,718.02£ 28 Retail Stores 03/04/2016 6.67 01/08/2006 2.5 15201574 201254 7.0 5 0 - 10% 879,207.81£ 598,667.12£ 8 Personal and Non Durable Consumer Products (Manufactu 31/10/2009 0.25 01/08/2006 5.0 15201581 201259 3.0 22 20 - 30% 979,870.68£ 717,308.24£ 15 Farming and Agriculture 02/12/2022 13.34 01/08/2006 2.5 15201597 201275 1.5 9 0 - 10% 2,955,749.47£ 2,955,749.47£ 5 Buildings and Real Estate 02/01/2014 4.42 01/05/2006 3.0 15201600 201278 6.0 15 10 - 20% 522,999.65£ 522,999.65£ 27 Cargo Transport 22/02/2025 15.56 01/08/2006 2.8 40201610 201288 6.0 9 0 - 10% 12,692,168.74£ 1,382,593.00£ 5 Buildings and Real Estate 01/08/2010 1.00 01/08/2006 2.1 15201612 201289 4.0 16 10 - 20% 603,019.15£ 603,019.15£ 18 Home and Office Furnishings, Housewares, and Durable Co 13/02/2024 14.53 01/05/2006 3.0 15201631 201307 6.0 24 20 - 30% 3,374,353.02£ 3,374,353.02£ 19 Hotels, Motels, Inns and Gaming 22/04/2020 10.73 01/05/2006 2.5 24201639 201315 5.0 23 20 - 30% 1,007,275.00£ 921,920.84£ 16 Grocery 20/02/2018 8.55 01/02/2008 3.0 28201641 201317 5.0 6 0 - 10% 337,500.00£ 337,500.00£ 10 Diversified/Conglomerate Service 31/03/2012 2.67 01/05/2006 3.0 28201645 201320 4.0 20 10 - 20% 542,386.99£ 542,386.99£ 31 Personal Transportation 13/07/2017 7.95 01/08/2006 2.1 33201657 201330 6.0 6 0 - 10% 555,900.79£ 555,900.79£ 25 Personal, Food and Miscellaneous 28/09/2012 3.16 01/05/2006 4.0 15201680 201346 6.0 28 20 - 30% 450,036.23£ 450,036.23£ 25 Personal, Food and Miscellaneous 18/03/2018 8.63 01/08/2006 4.0 15201697 201354 4.0 28 20 - 30% 13,400,000.00£ 541,935.00£ 5 Buildings and Real Estate 09/01/2014 4.44 01/08/2006 2.1 100201702 201358 3.0 10 0 - 10% 262,150.00£ 262,150.00£ 13 Electronics 11/10/2010 1.19 01/05/2006 2.1 15201716 201365 5.0 5 0 - 10% 634,593.75£ 634,593.75£ 4 Beverage, Food and Tobacco 19/08/2014 5.05 01/05/2006 3.0 15201717 201365 5.0 5 0 - 10% 634,593.75£ 634,593.75£ 4 Beverage, Food and Tobacco 19/08/2014 5.05 01/05/2006 3.0 15201745 201389 4.0 8 0 - 10% 413,351.79£ 413,351.79£ 30 Textiles and Leather 11/05/2014 4.78 01/05/2006 4.0 15201756 201397 7.0 6 0 - 10% 902,037.88£ 534,723.10£ 8 Personal and Non Durable Consumer Products (Manufactu 31/10/2009 0.25 01/09/2008 7.0 7201777 201413 5.0 15 10 - 20% 3,208,040.28£ 2,106,659.85£ 5 Buildings and Real Estate 24/06/2010 0.90 2 01/05/2009 5.0 6 2201784 201419 5.0 6 0 - 10% 509,655.59£ 509,655.59£ 6 Chemicals, Plastics and Rubber 07/07/2015 5.93 01/05/2006 2.1 15201785 201419 5.0 6 0 - 10% 523,137.41£ 523,137.41£ 6 Chemicals, Plastics and Rubber 27/01/2015 5.49 01/08/2006 2.1 15201792 201425 8.0 9 0 - 10% 603,000.00£ 603,000.00£ 22 Machinery (Non-Agriculture, Non-Construction, Non-Electro 03/05/2021 11.76 1 01/05/2006 2.1 15201793 201425 8.0 9 0 - 10% 716,666.78£ 716,666.78£ 22 Machinery (Non-Agriculture, Non-Construction, Non-Electro 02/08/2019 10.00 1 01/05/2006 2.1 15201800 201432 4.0 48 40 - 50% 400,000.00£ 400,000.00£ 4 Beverage, Food and Tobacco 27/05/2013 3.82 01/05/2006 1.5 28201821 201450 4.0 5 0 - 10% 1,080,000.00£ 1,080,000.00£ 25 Personal, Food and Miscellaneous 30/10/2012 3.25 01/03/2008 4.0 15201845 201470 5.0 12 10 - 20% 557,761.92£ 557,761.92£ 2 Automobile 13/09/2019 10.12 01/08/2006 4.0 28201873 201486 2.8 9 0 - 10% 761,562.18£ 761,562.18£ 24 Oil and Gas 30/01/2017 7.50 01/05/2006 2.1 15
Page 11 of 5730/06/2008

Data By Reference Obligation
Loan Number Borrower Number BBGBarclays Expected LossSeverity (%) Severity Band
Reference Obligation Outstanding Debt
Reference Obligation Notional Amount
Moody's Industry Sector Moody's Industry Sector Maturity Date
Remaining Term(Years) EWL Syndicated
Date of Entry into Pool
BBG Upon PoolEntry BELS Upon Pool Entry EWL Upon Pool Entry
201875 201488 4.0 18 10 - 20% 650,889.52£ 650,889.52£ 17 Healthcare, Education and Childcare 26/06/2019 9.90 01/08/2006 3.0 19201881 201494 5.0 10 0 - 10% 667,843.73£ 559,665.00£ 6 Chemicals, Plastics and Rubber 31/10/2009 0.25 01/05/2006 5.0 46201895 200161 2.8 18 10 - 20% 3,709,000.00£ 3,709,000.00£ 5 Buildings and Real Estate 03/11/2013 4.26 01/05/2006 2.5 28201914 201521 4.0 5 0 - 10% 339,817.56£ 339,817.56£ 13 Electronics 30/11/2011 2.33 01/05/2006 3.0 23201917 201524 8.0 10 0 - 10% 3,007,458.76£ 3,007,458.76£ 5 Buildings and Real Estate 01/04/2020 10.67 2 01/08/2006 2.1 15201925 201529 4.0 17 10 - 20% 999,323.48£ 999,323.48£ 17 Healthcare, Education and Childcare 30/10/2023 14.25 01/08/2006 3.0 15201927 201531 4.0 20 10 - 20% 512,852.24£ 512,852.24£ 10 Diversified/Conglomerate Service 31/05/2024 14.83 01/08/2006 2.1 15201933 201536 4.0 25 20 - 30% 633,003.29£ 633,003.29£ 16 Grocery 12/11/2023 14.28 01/08/2006 3.0 17201953 201547 5.0 20 10 - 20% 591,617.37£ 563,223.03£ 22 Machinery (Non-Agriculture, Non-Construction, Non-Electro 14/11/2017 8.29 01/08/2006 3.0 35201956 201550 4.0 59 50 - 60% 896,110.35£ 604,268.19£ 8 Personal and Non Durable Consumer Products (Manufactu 31/10/2009 0.25 01/09/2008 3.0 41201969 201559 3.0 7 0 - 10% 539,989.00£ 539,989.00£ 17 Healthcare, Education and Childcare 20/12/2015 6.39 01/05/2006 1.2 48201993 201579 8.0 12 10 - 20% 1,468,894.59£ 1,444,158.50£ 28 Retail Stores 14/10/2020 11.20 2 01/08/2006 6.0 15202015 201598 5.0 62 60 - 70% 1,664,757.52£ 1,664,757.52£ 16 Grocery 31/08/2020 11.08 01/08/2006 3.0 15202019 201602 3.0 15 10 - 20% 427,536.74£ 427,536.74£ 28 Retail Stores 16/06/2015 5.88 01/05/2006 2.1 15202023 201606 7.0 23 20 - 30% 545,275.25£ 545,275.25£ 18 Home and Office Furnishings, Housewares, and Durable Co 03/01/2018 8.42 01/08/2006 4.0 29202034 201616 5.0 16 10 - 20% 506,773.20£ 506,773.20£ 24 Oil and Gas 08/09/2023 14.10 01/08/2006 3.0 21202037 201619 5.0 75 70 - 80% 400,000.00£ 400,000.00£ 10 Diversified/Conglomerate Service 30/09/2010 1.16 01/05/2006 3.0 48202042 201623 4.0 21 20 - 30% 520,000.00£ 520,000.00£ 27 Cargo Transport 22/11/2015 6.31 01/05/2006 2.1 60202050 201629 8.0 12 10 - 20% 667,084.41£ 667,084.41£ 25 Personal, Food and Miscellaneous 15/09/2019 10.12 2 01/08/2006 8.0 15202056 201634 5.0 32 30 - 40% 1,462,211.83£ 1,150,479.33£ 33 Broadcasting & Entertainment 24/11/2024 15.31 01/08/2006 3.0 15202065 201643 5.0 14 10 - 20% 836,667.00£ 836,667.00£ 17 Healthcare, Education and Childcare 26/03/2019 9.65 01/05/2006 2.1 15202066 201644 4.0 5 0 - 10% 1,111,427.36£ 1,111,427.36£ 2 Automobile 01/07/2014 4.92 01/05/2006 2.1 28202067 201644 4.0 5 0 - 10% 673,800.00£ 673,800.00£ 2 Automobile 04/10/2014 5.18 01/05/2006 2.1 28202079 201656 2.8 22 20 - 30% 1,308,554.26£ 1,308,554.26£ 33 Broadcasting & Entertainment 10/08/2020 11.03 01/08/2006 3.0 15202124 201692 2.1 8 0 - 10% 552,117.29£ 552,117.29£ 2 Automobile 07/11/2022 13.27 01/08/2006 2.1 15202127 201695 5.0 15 10 - 20% 390,204.52£ 390,204.52£ 2 Automobile 01/04/2013 3.67 01/08/2006 6.0 15202135 201702 4.0 12 10 - 20% 1,245,936.71£ 1,245,936.71£ 6 Chemicals, Plastics and Rubber 26/03/2019 9.65 01/08/2006 4.0 16202141 201707 5.0 17 10 - 20% 479,216.64£ 479,216.64£ 28 Retail Stores 28/02/2023 13.58 01/08/2006 4.0 15202152 201716 4.0 12 10 - 20% 500,000.00£ 500,000.00£ 27 Cargo Transport 30/06/2014 4.91 01/05/2006 2.1 15202165 201726 6.0 13 10 - 20% 625,521.14£ 625,521.14£ 16 Grocery 16/10/2018 9.21 01/05/2006 4.0 37202185 201741 4.0 12 10 - 20% 599,346.92£ 598,746.92£ 17 Healthcare, Education and Childcare 03/12/2018 9.34 01/08/2006 3.0 19202187 201742 5.0 22 20 - 30% 1,922,173.87£ 1,922,173.87£ 4 Beverage, Food and Tobacco 31/10/2009 0.25 01/06/2009 5.0 22202194 201748 4.0 18 10 - 20% 675,436.36£ 675,436.36£ 22 Machinery (Non-Agriculture, Non-Construction, Non-Electro 01/10/2016 7.17 01/08/2006 2.1 32202198 201750 4.0 6 0 - 10% 1,907,820.04£ 1,907,820.04£ 19 Hotels, Motels, Inns and Gaming 31/10/2009 0.25 01/04/2008 2.1 7202211 200808 2.1 35 30 - 40% 2,267,082.97£ 2,267,082.97£ 5 Buildings and Real Estate 26/08/2019 10.07 01/05/2006 2.8 15202215 201763 2.5 8 0 - 10% 322,176.25£ 322,176.25£ 25 Personal, Food and Miscellaneous 25/07/2018 8.98 01/05/2006 2.1 15202241 201783 4.0 20 10 - 20% 653,177.03£ 653,177.03£ 18 Home and Office Furnishings, Housewares, and Durable Co 21/12/2024 15.39 01/08/2006 3.0 26202260 201796 4.0 12 10 - 20% 3,786,679.52£ 3,786,679.52£ 17 Healthcare, Education and Childcare 28/12/2020 11.41 01/08/2006 2.1 15202262 201798 6.0 13 10 - 20% 849,120.20£ 835,129.00£ 25 Personal, Food and Miscellaneous 28/01/2020 10.49 01/08/2006 4.0 15202268 201803 7.0 12 10 - 20% 230,654.25£ 177,630.91£ 16 Grocery 31/10/2009 0.25 01/08/2006 4.0 15202270 201805 3.0 82 80 - 90% 486,715.06£ 486,715.06£ 10 Diversified/Conglomerate Service 11/03/2015 5.61 01/05/2006 2.1 15202291 201821 3.0 5 0 - 10% 295,492.29£ 295,492.29£ 18 Home and Office Furnishings, Housewares, and Durable Co 02/07/2019 9.92 01/08/2006 2.1 15202298 201825 2.8 13 10 - 20% 624,644.80£ 624,644.80£ 5 Buildings and Real Estate 31/10/2009 0.25 01/08/2006 3.0 15202299 201825 2.8 13 10 - 20% 1,522,309.46£ 1,522,309.46£ 5 Buildings and Real Estate 31/10/2009 0.25 01/05/2006 2.1 15202307 200201 7.0 12 10 - 20% 494,057.42£ 494,057.42£ 10 Diversified/Conglomerate Service 13/09/2014 5.12 2 01/05/2006 6.0 15202309 201834 3.0 21 20 - 30% 748,506.91£ 748,506.91£ 28 Retail Stores 09/02/2019 9.52 01/08/2006 3.0 49202311 201836 4.0 8 0 - 10% 503,375.04£ 503,375.04£ 16 Grocery 13/10/2020 11.20 01/08/2006 4.0 15202318 201841 4.0 35 30 - 40% 680,341.46£ 680,341.46£ 18 Home and Office Furnishings, Housewares, and Durable Co 04/01/2025 15.43 01/08/2006 2.1 20202338 201855 4.0 17 10 - 20% 810,000.00£ 804,000.00£ 8 Personal and Non Durable Consumer Products (Manufactu 31/10/2009 0.25 01/05/2006 5.0 22202340 201857 4.0 14 10 - 20% 442,164.79£ 442,164.79£ 16 Grocery 01/04/2020 10.67 01/08/2006 4.0 15202341 201857 4.0 14 10 - 20% 487,275.79£ 487,275.79£ 16 Grocery 24/09/2024 15.15 01/08/2006 4.0 15202350 201865 7.0 9 0 - 10% 905,704.03£ 905,704.03£ 18 Home and Office Furnishings, Housewares, and Durable Co 20/02/2021 11.55 01/05/2006 4.0 15202357 201872 4.0 13 10 - 20% 390,000.00£ 390,000.00£ 22 Machinery (Non-Agriculture, Non-Construction, Non-Electro 20/08/2022 13.05 01/05/2006 2.8 15202366 201879 4.0 20 10 - 20% 617,983.37£ 617,983.37£ 27 Cargo Transport 07/06/2022 12.85 01/08/2006 3.0 24202375 201888 5.0 10 0 - 10% 630.29£ 630.29£ 30 Textiles and Leather 17/06/2018 8.88 01/08/2006 4.0 15202377 201890 6.0 11 10 - 20% 573,793.04£ 573,793.04£ 18 Home and Office Furnishings, Housewares, and Durable Co 26/04/2020 10.74 01/05/2006 4.0 15202404 201903 7.0 6 0 - 10% 86,702.15£ 86,702.15£ 25 Personal, Food and Miscellaneous 22/06/2021 11.89 01/05/2006 5.0 15202409 201908 5.0 42 40 - 50% 515,633.72£ 515,633.72£ 22 Machinery (Non-Agriculture, Non-Construction, Non-Electro 09/08/2015 6.02 01/08/2006 3.0 33202415 201913 5.0 16 10 - 20% 490,107.17£ 490,107.17£ 10 Diversified/Conglomerate Service 04/05/2021 11.76 01/05/2006 2.5 22202424 201921 5.0 33 30 - 40% 920,828.38£ 920,828.38£ 28 Retail Stores 03/08/2019 10.01 01/08/2006 3.0 43202461 201949 4.0 10 0 - 10% 3,015,000.00£ 3,015,000.00£ 5 Buildings and Real Estate 31/10/2009 0.25 01/05/2006 2.1 24202469 201954 5.0 9 0 - 10% 334,102.90£ 334,102.90£ 2 Automobile 02/06/2018 8.84 01/08/2006 4.0 28202490 201962 3.0 6 0 - 10% 567,958.80£ 567,958.80£ 27 Cargo Transport 11/08/2023 14.03 01/08/2006 2.8 15202526 201990 3.0 25 20 - 30% 9,000,000.00£ 9,000,000.00£ 5 Buildings and Real Estate 20/12/2009 0.39 01/05/2006 2.5 15202533 201994 4.0 5 0 - 10% 478,640.19£ 478,640.19£ 21 Leisure, Amusement, Entertainment 14/11/2013 4.29 01/05/2006 2.1 15202536 201997 6.0 84 80 - 90% 4,980,000.00£ 4,980,000.00£ 10 Diversified/Conglomerate Service 21/12/2011 2.39 2 01/05/2006 5.0 20202537 201997 6.0 84 80 - 90% 953,000.00£ 953,000.00£ 10 Diversified/Conglomerate Service 21/12/2011 2.39 2 01/05/2006 3.0 28202538 201997 6.0 84 80 - 90% 1,545,000.00£ 1,545,000.00£ 10 Diversified/Conglomerate Service 21/12/2011 2.39 2 01/05/2006 3.0 28202544 202002 4.0 17 10 - 20% 738,495.18£ 507,000.73£ 16 Grocery 20/11/2022 13.30 01/08/2006 2.5 15202546 202003 4.0 9 0 - 10% 2,820,577.81£ 2,820,577.81£ 19 Hotels, Motels, Inns and Gaming 26/05/2011 1.82 01/08/2006 2.5 15202548 202005 5.0 14 10 - 20% 564,847.02£ 564,847.02£ 19 Hotels, Motels, Inns and Gaming 01/12/2023 14.33 01/05/2006 3.0 15202559 202015 4.0 25 20 - 30% 361,792.61£ 361,792.61£ 28 Retail Stores 23/04/2013 3.73 01/05/2006 3.0 46202566 202021 2.1 10 0 - 10% 1,305,744.38£ 1,305,744.38£ 27 Cargo Transport 13/10/2020 11.20 01/08/2006 2.1 15202578 202031 6.0 11 10 - 20% 553,756.45£ 553,756.45£ 21 Leisure, Amusement, Entertainment 23/03/2018 8.64 01/08/2006 5.0 15202580 202033 5.0 5 0 - 10% 653,718.77£ 653,718.77£ 19 Hotels, Motels, Inns and Gaming 12/07/2017 7.95 01/08/2006 5.0 15202591 202043 7.0 7 0 - 10% 345,856.43£ 345,856.43£ 25 Personal, Food and Miscellaneous 06/01/2011 1.43 01/05/2006 4.0 15202597 202048 3.0 14 10 - 20% 10,600,000.00£ 4,780,926.00£ 5 Buildings and Real Estate 27/02/2019 9.57 01/05/2006 2.1 15202613 202057 7.0 17 10 - 20% 965,151.63£ 965,151.63£ 21 Leisure, Amusement, Entertainment 28/04/2018 8.74 01/05/2006 5.0 15202614 202057 7.0 17 10 - 20% 937,898.51£ 937,898.51£ 21 Leisure, Amusement, Entertainment 28/04/2018 8.74 01/05/2006 5.0 15202615 202058 6.0 17 10 - 20% 121,486.49£ 26,187.05£ 10 Diversified/Conglomerate Service 31/10/2009 0.25 01/05/2006 7.0 15202626 202066 6.0 16 10 - 20% 979,725.61£ 979,725.61£ 26 Printing and Publishing 01/07/2023 13.92 01/08/2006 3.0 15202654 202093 3.0 9 0 - 10% 856,211.72£ 719,451.41£ 22 Machinery (Non-Agriculture, Non-Construction, Non-Electro 07/09/2014 5.10 01/08/2006 3.0 15202658 202096 3.0 12 10 - 20% 421,654.81£ 421,654.81£ 23 Mining, Steel, Iron and Non Precious Metals 24/12/2016 7.40 01/05/2006 2.1 15
Page 12 of 5730/06/2008

Data By Reference Obligation
Loan Number Borrower Number BBGBarclays Expected LossSeverity (%) Severity Band
Reference Obligation Outstanding Debt
Reference Obligation Notional Amount
Moody's Industry Sector Moody's Industry Sector Maturity Date
Remaining Term(Years) EWL Syndicated
Date of Entry into Pool
BBG Upon PoolEntry BELS Upon Pool Entry EWL Upon Pool Entry
202660 202098 5.0 18 10 - 20% 2,916,670.00£ 2,916,670.00£ 29 Telecommunications 14/03/2013 3.62 01/05/2006 2.1 28202661 201852 3.0 14 10 - 20% 2,265,230.00£ 2,265,230.00£ 5 Buildings and Real Estate 20/05/2015 5.80 01/05/2006 2.1 15202666 202102 5.0 11 10 - 20% 170,000.00£ 170,000.00£ 27 Cargo Transport 12/01/2013 3.45 01/05/2006 2.1 33202668 202104 4.0 12 10 - 20% 428,154.68£ 428,154.68£ 22 Machinery (Non-Agriculture, Non-Construction, Non-Electro 06/09/2017 8.10 01/05/2006 3.0 23202684 202116 4.0 14 10 - 20% 688,648.42£ 688,648.42£ 2 Automobile 30/12/2019 10.41 01/08/2006 3.0 28202692 202123 6.0 30 20 - 30% 680,030.49£ 680,030.49£ 31 Personal Transportation 28/09/2016 7.16 2 01/08/2006 3.0 15202705 202131 8.0 32 30 - 40% 691,839.72£ 691,839.72£ 31 Personal Transportation 03/05/2022 12.76 2 01/05/2006 5.0 15202706 202132 5.0 18 10 - 20% 6,641,627.20£ 6,641,627.20£ 5 Buildings and Real Estate 31/03/2014 4.67 2 01/05/2006 2.1 15202708 202134 5.0 13 10 - 20% 1,185,877.20£ 995,321.13£ 17 Healthcare, Education and Childcare 06/07/2019 9.93 01/08/2006 4.0 15202720 202143 5.0 68 60 - 70% 926,288.27£ 926,288.27£ 25 Personal, Food and Miscellaneous 24/01/2018 8.48 01/08/2006 2.8 15202726 202148 8.0 74 70 - 80% 874,051.70£ 874,051.70£ 31 Personal Transportation 24/03/2025 15.65 01/08/2006 4.0 28202727 202148 8.0 74 70 - 80% 890,544.77£ 890,542.02£ 31 Personal Transportation 25/11/2024 15.32 01/08/2006 4.0 28202739 202156 6.0 33 30 - 40% 1,018,424.28£ 1,018,424.28£ 27 Cargo Transport 11/01/2024 14.44 01/08/2006 5.0 15202757 202168 6.0 34 30 - 40% 334,633.62£ 334,633.62£ 13 Electronics 28/05/2010 0.83 2 01/05/2006 2.1 28202765 202172 3.0 6 0 - 10% 712,790.44£ 712,790.44£ 17 Healthcare, Education and Childcare 02/02/2018 8.50 01/08/2006 2.1 15202767 202173 4.0 11 10 - 20% 1,578,120.00£ 1,578,120.00£ 17 Healthcare, Education and Childcare 06/12/2022 13.35 01/05/2006 2.1 19202778 202183 4.0 10 0 - 10% 581,250.00£ 581,250.00£ 21 Leisure, Amusement, Entertainment 30/04/2013 3.75 01/05/2006 4.0 15202796 202200 5.0 7 0 - 10% 947,970.42£ 947,970.42£ 10 Diversified/Conglomerate Service 29/04/2020 10.74 01/08/2006 3.0 15202821 202218 6.0 22 20 - 30% 3,606,700.00£ 3,389,133.33£ 5 Buildings and Real Estate 30/10/2009 0.25 2 01/08/2006 4.0 15202848 202242 3.0 16 10 - 20% 2,261,721.81£ 2,261,721.81£ 15 Farming and Agriculture 31/10/2009 0.25 01/06/2009 3.0 17202857 202248 4.0 13 10 - 20% 776,066.72£ 776,066.72£ 21 Leisure, Amusement, Entertainment 29/09/2019 10.16 01/08/2006 4.0 16202864 202255 5.0 31 30 - 40% 1,231,949.20£ 1,231,949.20£ 22 Machinery (Non-Agriculture, Non-Construction, Non-Electro 31/03/2016 6.67 01/05/2006 4.0 38202865 202256 4.0 23 20 - 30% 621,932.45£ 621,932.45£ 10 Diversified/Conglomerate Service 29/11/2024 15.33 01/08/2006 2.8 22202869 202260 5.0 18 10 - 20% 532,493.87£ 532,493.87£ 19 Hotels, Motels, Inns and Gaming 30/04/2017 7.75 01/08/2006 7.0 21202905 202284 7.0 17 10 - 20% 425,680.92£ 425,680.92£ 13 Electronics 15/11/2017 8.29 2 01/08/2006 5.0 15202958 202328 8.0 11 10 - 20% 446,504.90£ 434,879.58£ 28 Retail Stores 24/01/2014 4.48 01/05/2006 6.0 15202989 202343 6.0 5 0 - 10% 510,825.08£ 510,825.08£ 16 Grocery 12/10/2018 9.20 01/05/2006 3.0 15203007 202356 3.0 8 0 - 10% 497,538.23£ 497,538.23£ 25 Personal, Food and Miscellaneous 07/01/2018 8.43 01/08/2006 3.0 15203061 202392 6.0 28 20 - 30% 541,724.44£ 541,724.44£ 24 Oil and Gas 05/05/2018 8.76 2 01/08/2006 3.0 19203081 202406 6.0 23 20 - 30% 494,164.41£ 494,164.41£ 18 Home and Office Furnishings, Housewares, and Durable Co 12/05/2021 11.78 01/05/2006 3.0 15203093 202417 7.0 9 0 - 10% 459,374.89£ 459,374.89£ 22 Machinery (Non-Agriculture, Non-Construction, Non-Electro 22/11/2014 5.31 01/05/2006 2.1 15203102 202424 3.0 15 10 - 20% 579,349.36£ 579,349.36£ 19 Hotels, Motels, Inns and Gaming 03/04/2023 13.67 01/05/2006 3.0 15203120 202439 7.0 34 30 - 40% 712,953.06£ 712,953.06£ 22 Machinery (Non-Agriculture, Non-Construction, Non-Electro 24/02/2016 6.56 01/05/2006 4.0 15203127 202444 7.0 5 0 - 10% 742,413.33£ 742,413.33£ 19 Hotels, Motels, Inns and Gaming 27/06/2015 5.91 01/08/2006 5.0 15203128 202445 6.0 6 0 - 10% 354,864.02£ 354,864.02£ 27 Cargo Transport 30/09/2013 4.16 01/05/2006 3.0 28203132 202448 4.0 13 10 - 20% 551,778.26£ 551,778.26£ 2 Automobile 22/05/2018 8.81 01/08/2006 3.0 15203138 202454 3.0 5 0 - 10% 1,614,813.99£ 1,614,813.99£ 21 Leisure, Amusement, Entertainment 29/10/2013 4.24 01/05/2006 4.0 15203150 202463 6.0 65 60 - 70% 214,082.78£ 214,082.78£ 31 Personal Transportation 29/07/2010 0.99 2 01/05/2006 3.0 23203176 202444 7.0 6 0 - 10% 479,765.44£ 479,765.44£ 19 Hotels, Motels, Inns and Gaming 27/06/2013 3.91 01/05/2006 5.0 15203177 202444 7.0 6 0 - 10% 479,765.44£ 479,765.44£ 19 Hotels, Motels, Inns and Gaming 27/06/2013 3.91 01/05/2006 5.0 15203181 202483 5.0 16 10 - 20% 1,871,152.74£ 1,465,677.06£ 10 Diversified/Conglomerate Service 30/12/2024 15.41 01/08/2006 3.0 15203210 202510 6.0 34 30 - 40% 3,105,935.00£ 3,105,935.00£ 13 Electronics 31/01/2013 3.50 2 01/05/2006 2.1 41203219 202517 5.0 12 10 - 20% 517,238.62£ 517,238.62£ 18 Home and Office Furnishings, Housewares, and Durable Co 28/11/2023 14.33 01/08/2006 2.8 22203232 202526 7.0 12 10 - 20% 6,765,000.00£ 6,765,000.00£ 5 Buildings and Real Estate 22/01/2010 0.48 01/05/2006 4.0 15203240 202533 6.0 24 20 - 30% 3,955,218.67£ 3,919,981.67£ 5 Buildings and Real Estate 16/03/2013 3.63 2 01/08/2006 5.0 28203262 202554 3.0 29 20 - 30% 913,000.00£ 913,000.00£ 27 Cargo Transport 16/10/2009 0.21 01/05/2006 3.0 15203264 202556 6.0 17 10 - 20% 1,429,930.37£ 1,429,930.37£ 27 Cargo Transport 09/10/2013 4.19 01/05/2006 5.0 15203272 202563 4.0 10 0 - 10% 591,087.50£ 591,087.50£ 17 Healthcare, Education and Childcare 04/11/2023 14.26 01/05/2006 4.0 20203295 202584 5.0 12 10 - 20% 811,954.24£ 811,954.24£ 17 Healthcare, Education and Childcare 14/01/2024 14.45 01/08/2006 5.0 15203304 202591 2.1 10 0 - 10% 1,800,000.00£ 1,800,000.00£ 10 Diversified/Conglomerate Service 28/10/2018 9.24 01/05/2006 2.1 23203316 202600 6.0 8 0 - 10% 893,253.13£ 730,787.00£ 33 Broadcasting & Entertainment 18/12/2009 0.38 01/05/2006 4.0 15203344 202618 6.0 5 0 - 10% 740,000.00£ 740,000.00£ 28 Retail Stores 01/10/2010 1.17 2 01/05/2006 6.0 15203368 202636 5.0 7 0 - 10% 417,603.99£ 417,603.99£ 30 Textiles and Leather 29/06/2015 5.91 01/08/2006 4.0 15203420 202679 8.0 24 20 - 30% 701,613.45£ 701,613.45£ 6 Chemicals, Plastics and Rubber 16/02/2020 10.54 2 01/08/2006 3.0 23203429 202686 8.0 25 20 - 30% 722,661.00£ 698,909.79£ 26 Printing and Publishing 31/03/2024 14.67 1 01/08/2006 6.0 22203499 202738 8.0 13 10 - 20% 1,460,877.12£ 1,460,877.12£ 2 Automobile 26/03/2024 14.65 2 01/05/2006 4.0 15203514 202751 6.0 11 10 - 20% 2,417,538.64£ 2,417,538.64£ 19 Hotels, Motels, Inns and Gaming 05/03/2020 10.59 01/08/2006 5.0 15203526 202760 3.0 65 60 - 70% 4,000,000.00£ 4,000,000.00£ 13 Electronics 31/05/2013 3.83 01/06/2009 3.0 65203561 202789 5.0 20 10 - 20% 4,600,000.00£ 4,600,000.00£ 5 Buildings and Real Estate 23/04/2014 4.73 01/05/2006 3.0 15203567 202794 4.0 15 10 - 20% 2,595,829.00£ 2,595,829.00£ 2 Automobile 10/04/2018 8.69 01/05/2006 4.0 21203573 202800 6.0 20 10 - 20% 1,363,579.78£ 1,362,182.56£ 17 Healthcare, Education and Childcare 01/10/2019 10.17 01/08/2006 6.0 15203588 202813 3.0 6 0 - 10% 453,167.42£ 453,167.42£ 23 Mining, Steel, Iron and Non Precious Metals 15/09/2019 10.12 01/08/2006 3.0 15203610 202831 4.0 36 30 - 40% 2,584,988.30£ 2,584,988.30£ 5 Buildings and Real Estate 18/06/2018 8.88 01/05/2006 3.0 15203612 202833 2.5 18 10 - 20% 2,830,280.62£ 2,830,280.62£ 5 Buildings and Real Estate 22/07/2020 10.98 01/05/2006 2.1 15203616 202837 6.0 14 10 - 20% 426,266.87£ 426,266.87£ 22 Machinery (Non-Agriculture, Non-Construction, Non-Electro 22/11/2024 15.31 01/05/2006 5.0 15203633 202851 8.0 20 10 - 20% 1,288,162.63£ 1,288,162.63£ 19 Hotels, Motels, Inns and Gaming 01/03/2025 15.58 01/05/2006 5.0 15203644 202862 3.0 8 0 - 10% 341,491.95£ 341,491.95£ 5 Buildings and Real Estate 01/10/2013 4.17 01/05/2006 6.0 20203662 202877 6.0 18 10 - 20% 5,247,199.96£ 4,796,248.40£ 5 Buildings and Real Estate 30/07/2013 4.00 2 01/08/2006 2.8 28203692 202901 6.0 15 10 - 20% 943,462.48£ 603,217.60£ 19 Hotels, Motels, Inns and Gaming 01/09/2024 15.08 01/08/2006 5.0 16203748 202943 5.0 11 10 - 20% 947,981.50£ 947,981.50£ 13 Electronics 16/05/2020 10.79 01/05/2006 2.8 28203749 202944 6.0 16 10 - 20% 862,499.95£ 862,499.95£ 25 Personal, Food and Miscellaneous 31/01/2020 10.50 2 01/05/2006 5.0 16203835 203013 5.0 19 10 - 20% 461,313.74£ 461,273.91£ 27 Cargo Transport 25/02/2025 15.57 01/08/2006 5.0 15203847 203020 8.0 23 20 - 30% 1,252,828.16£ 1,252,828.16£ 26 Printing and Publishing 04/01/2025 15.43 2 01/05/2006 4.0 15203863 203033 5.0 19 10 - 20% 447,558.56£ 447,558.56£ 2 Automobile 28/02/2020 10.58 01/05/2006 5.0 15203905 200636 7.0 5 0 - 10% 430,256.00£ 430,256.00£ 17 Healthcare, Education and Childcare 29/03/2011 1.66 01/05/2006 2.1 28203943 203099 5.0 17 10 - 20% 546,908.07£ 546,908.07£ 15 Farming and Agriculture 24/03/2025 15.65 01/05/2006 6.0 15203945 203101 7.0 24 20 - 30% 1,300,000.00£ 1,192,243.02£ 5 Buildings and Real Estate 30/09/2011 2.16 2 01/08/2006 5.0 15203977 203132 6.0 11 10 - 20% 904,637.65£ 904,637.65£ 7 Containers, Packaging and Glass 26/05/2021 11.82 01/05/2006 4.0 15204009 203157 6.0 39 30 - 40% 1,659,146.25£ 1,659,146.25£ 9 Diversified/Conglomerate Manufacturing 31/03/2025 15.67 01/05/2006 3.0 15204020 203165 8.0 19 10 - 20% 629,390.32£ 629,390.32£ 4 Beverage, Food and Tobacco 06/07/2012 2.93 01/05/2006 3.0 15204096 203225 6.0 15 10 - 20% 724,419.54£ 681,300.00£ 7 Containers, Packaging and Glass 23/02/2017 7.56 01/05/2006 5.0 15204117 203246 6.0 22 20 - 30% 663,530.71£ 663,530.71£ 6 Chemicals, Plastics and Rubber 31/01/2021 11.50 01/08/2006 5.0 15204124 203252 3.0 15 10 - 20% 900,000.00£ 900,000.00£ 15 Farming and Agriculture 30/06/2018 8.91 01/05/2006 2.8 36
Page 13 of 5730/06/2008

Data By Reference Obligation
Loan Number Borrower Number BBGBarclays Expected LossSeverity (%) Severity Band
Reference Obligation Outstanding Debt
Reference Obligation Notional Amount
Moody's Industry Sector Moody's Industry Sector Maturity Date
Remaining Term(Years) EWL Syndicated
Date of Entry into Pool
BBG Upon PoolEntry BELS Upon Pool Entry EWL Upon Pool Entry
204130 203258 7.0 20 10 - 20% 877,755.61£ 877,755.61£ 25 Personal, Food and Miscellaneous 07/10/2020 11.18 01/08/2006 5.0 21204183 203298 5.0 12 10 - 20% 1,053,497.58£ 1,053,497.58£ 19 Hotels, Motels, Inns and Gaming 12/10/2020 11.20 01/05/2006 4.0 15204184 203298 5.0 12 10 - 20% 4,346,896.10£ 4,346,896.10£ 19 Hotels, Motels, Inns and Gaming 11/10/2020 11.19 01/05/2006 4.0 15204197 203308 7.0 11 10 - 20% 514,623.21£ 514,623.21£ 28 Retail Stores 21/11/2015 6.31 01/08/2006 4.0 17204271 203368 8.0 5 0 - 10% 458,392.88£ 458,392.88£ 25 Personal, Food and Miscellaneous 13/02/2019 9.53 2 01/08/2006 5.0 15204276 203373 8.0 16 10 - 20% 1,731,971.22£ 1,688,340.20£ 27 Cargo Transport 24/03/2024 14.65 01/08/2006 6.0 15204285 203382 4.0 49 40 - 50% 10,000,000.00£ 10,000,000.00£ 25 Personal, Food and Miscellaneous 30/11/2011 2.33 01/06/2009 4.0 49204299 203395 6.0 40 30 - 40% 5,000,000.00£ 5,000,000.00£ 5 Buildings and Real Estate 31/10/2009 0.25 01/05/2006 2.8 15204343 203433 6.0 15 10 - 20% 889,158.21£ 889,158.21£ 28 Retail Stores 03/03/2016 6.59 01/05/2006 4.0 10204359 203447 7.0 26 20 - 30% 5,539,000.00£ 5,271,000.00£ 25 Personal, Food and Miscellaneous 07/04/2026 16.68 2 01/05/2006 5.0 15204362 203450 5.0 31 30 - 40% 902,400.00£ 854,107.40£ 17 Healthcare, Education and Childcare 30/06/2018 8.91 01/05/2006 4.0 33204374 203462 7.0 14 10 - 20% 1,920,656.25£ 1,886,666.67£ 25 Personal, Food and Miscellaneous 18/04/2021 11.71 01/08/2006 4.0 15204422 203509 5.0 18 10 - 20% 713,000.00£ 713,000.00£ 5 Buildings and Real Estate 15/12/2009 0.37 01/05/2006 2.8 15204448 203512 3.0 8 0 - 10% 531,409.24£ 531,409.24£ 17 Healthcare, Education and Childcare 29/11/2016 7.33 01/05/2006 2.1 15204449 203512 3.0 8 0 - 10% 442,814.83£ 442,814.83£ 17 Healthcare, Education and Childcare 01/06/2017 7.83 01/05/2006 2.1 15204450 203512 3.0 8 0 - 10% 747,790.37£ 747,790.37£ 17 Healthcare, Education and Childcare 23/04/2017 7.73 01/05/2006 2.1 15204510 200077 6.0 19 10 - 20% 1,121,415.62£ 1,121,415.62£ 17 Healthcare, Education and Childcare 30/12/2020 11.41 01/07/2006 5.0 27204528 200186 8.0 17 10 - 20% 2,090,974.08£ 2,090,974.08£ 17 Healthcare, Education and Childcare 10/01/2023 13.44 2 01/09/2008 6.0 17 2204535 200205 5.0 19 10 - 20% 589,291.74£ 589,291.74£ 5 Buildings and Real Estate 01/12/2014 5.33 01/08/2006 4.0 23204545 200268 1.8 17 10 - 20% 1,605,465.69£ 1,605,465.69£ 5 Buildings and Real Estate 30/11/2019 10.33 01/08/2006 4.0 15204548 200277 4.0 52 50 - 60% 799,500.00£ 799,500.00£ 5 Buildings and Real Estate 20/11/2009 0.30 01/08/2006 3.0 27204556 200331 5.0 5 0 - 10% 499,927.55£ 499,927.55£ 2 Automobile 09/08/2010 1.02 01/07/2006 4.0 15204559 200338 4.0 11 10 - 20% 530,807.86£ 530,807.86£ 21 Leisure, Amusement, Entertainment 31/10/2015 6.25 01/08/2006 2.8 15204584 200441 3.0 9 0 - 10% 631,982.92£ 631,982.92£ 10 Diversified/Conglomerate Service 18/04/2015 5.71 01/07/2006 3.0 15204605 200505 4.0 23 20 - 30% 634,162.09£ 634,162.09£ 5 Buildings and Real Estate 02/02/2025 15.50 01/08/2006 6.0 16204614 200564 6.0 25 20 - 30% 1,302,774.52£ 1,139,962.77£ 5 Buildings and Real Estate 06/11/2009 0.26 2 01/05/2008 5.0 26204617 200585 6.0 28 20 - 30% 402,000.00£ 402,000.00£ 5 Buildings and Real Estate 31/10/2009 0.25 2 01/08/2008 3.0 15 2204631 200685 4.0 28 20 - 30% 885,000.00£ 616,400.00£ 5 Buildings and Real Estate 19/09/2020 11.13 01/08/2006 4.0 15204640 200721 3.0 82 80 - 90% 750,000.00£ 750,000.00£ 5 Buildings and Real Estate 31/10/2009 0.25 01/07/2006 2.8 15204651 200782 3.0 18 10 - 20% 703,000.00£ 671,344.83£ 5 Buildings and Real Estate 01/03/2011 1.58 01/08/2006 3.0 15204657 200828 3.0 33 30 - 40% 575,122.70£ 575,122.70£ 27 Cargo Transport 22/11/2020 11.31 01/07/2006 4.0 15204669 203561 6.0 58 50 - 60% 14,400,000.00£ 14,400,000.00£ 33 Broadcasting & Entertainment 19/04/2011 1.72 01/06/2009 6.0 58204676 200924 7.0 14 10 - 20% 2,150,000.00£ 2,150,000.00£ 21 Leisure, Amusement, Entertainment 07/07/2020 10.93 01/05/2008 6.0 15204678 200931 3.0 10 0 - 10% 538,844.81£ 538,844.81£ 5 Buildings and Real Estate 09/02/2025 15.52 01/08/2006 5.0 15204680 200939 6.0 9 0 - 10% 486,648.63£ 486,648.63£ 5 Buildings and Real Estate 31/03/2020 10.67 01/08/2006 7.0 15204684 200958 6.0 16 10 - 20% 1,056,380.67£ 1,056,380.67£ 17 Healthcare, Education and Childcare 19/09/2020 11.13 01/07/2006 3.0 15204686 200963 4.0 5 0 - 10% 941,811.36£ 803,569.00£ 5 Buildings and Real Estate 31/10/2009 0.25 01/08/2006 2.1 50204687 200963 4.0 5 0 - 10% 2,948,112.71£ 2,948,112.71£ 5 Buildings and Real Estate 31/10/2009 0.25 01/08/2006 2.1 50204689 200974 3.0 16 10 - 20% 901,529.25£ 901,529.25£ 18 Home and Office Furnishings, Housewares, and Durable Co 13/12/2022 13.37 01/07/2006 3.0 21204698 201046 7.0 23 20 - 30% 1,182,510.99£ 1,182,510.99£ 5 Buildings and Real Estate 27/01/2021 11.49 01/08/2006 4.0 15204702 200992 4.0 19 10 - 20% 774,563.29£ 484,867.69£ 5 Buildings and Real Estate 24/05/2010 0.81 01/08/2006 5.0 15204713 201124 2.1 5 0 - 10% 550,579.96£ 550,579.96£ 5 Buildings and Real Estate 07/03/2020 10.60 01/08/2006 2.1 15204714 200992 4.0 21 20 - 30% 2,178,948.21£ 1,035,244.34£ 5 Buildings and Real Estate 24/05/2010 0.81 01/08/2006 5.0 15204724 201170 4.0 6 0 - 10% 2,036,013.62£ 2,036,013.62£ 17 Healthcare, Education and Childcare 27/04/2022 12.74 01/06/2009 3.0 6204725 201184 3.0 6 0 - 10% 664,208.00£ 661,248.00£ 5 Buildings and Real Estate 20/07/2014 4.97 01/08/2006 2.1 15204727 201202 2.1 5 0 - 10% 736,384.08£ 736,384.08£ 5 Buildings and Real Estate 04/07/2018 8.93 01/07/2006 3.0 15204729 201224 5.0 14 10 - 20% 625,361.94£ 605,388.00£ 5 Buildings and Real Estate 31/10/2009 0.25 01/08/2006 3.0 15204736 201277 8.0 20 10 - 20% 124,697.28£ 124,697.28£ 30 Textiles and Leather 29/09/2019 10.16 2 01/07/2006 3.0 15204760 200628 4.0 5 0 - 10% 372,765.30£ 372,765.30£ 17 Healthcare, Education and Childcare 18/10/2011 2.21 01/07/2006 2.8 15204776 201513 4.0 15 10 - 20% 1,236,861.09£ 1,236,861.09£ 5 Buildings and Real Estate 27/09/2024 15.16 01/08/2006 4.0 15204799 201662 4.0 16 10 - 20% 655,188.01£ 534,198.53£ 5 Buildings and Real Estate 18/08/2021 12.05 01/07/2006 3.0 15204806 201691 3.0 18 10 - 20% 484,158.31£ 484,158.31£ 5 Buildings and Real Estate 24/01/2022 12.48 01/08/2006 4.0 21204808 201712 4.0 17 10 - 20% 1,540,000.00£ 1,540,000.00£ 5 Buildings and Real Estate 12/12/2009 0.36 01/07/2006 3.0 15204815 201731 4.0 22 20 - 30% 859,616.62£ 859,616.62£ 17 Healthcare, Education and Childcare 31/12/2023 14.42 01/07/2006 3.0 15204822 201767 2.1 16 10 - 20% 827,413.88£ 827,413.88£ 5 Buildings and Real Estate 14/11/2016 7.29 01/08/2006 2.1 15204827 201781 6.0 17 10 - 20% 317,700.00£ 317,700.00£ 2 Automobile 04/05/2019 9.76 01/07/2006 3.0 15204829 201789 6.0 23 20 - 30% 714,584.29£ 714,584.29£ 22 Machinery (Non-Agriculture, Non-Construction, Non-Electro 30/08/2022 13.08 01/07/2006 4.0 15204831 201800 3.0 16 10 - 20% 1,401,599.41£ 1,401,599.41£ 5 Buildings and Real Estate 29/01/2018 8.49 01/08/2006 5.0 15204834 201801 6.0 23 20 - 30% 887,562.00£ 887,562.00£ 5 Buildings and Real Estate 31/10/2009 0.25 2 01/03/2008 5.0 22204839 201819 2.1 54 50 - 60% 3,811,651.00£ 866,930.86£ 5 Buildings and Real Estate 31/12/2011 2.42 01/08/2006 3.0 5204847 201870 3.0 7 0 - 10% 608,146.04£ 608,146.04£ 5 Buildings and Real Estate 23/04/2019 9.73 01/08/2006 3.0 15204852 201880 7.0 21 20 - 30% 477,598.35£ 477,598.35£ 23 Mining, Steel, Iron and Non Precious Metals 30/09/2024 15.16 1 01/08/2006 6.0 23204866 201952 2.1 7 0 - 10% 484,603.89£ 484,603.89£ 5 Buildings and Real Estate 23/10/2018 9.23 01/08/2006 2.1 15204875 201979 2.1 6 0 - 10% 577,348.18£ 577,348.18£ 5 Buildings and Real Estate 11/07/2013 3.94 01/07/2006 5.0 15204879 201995 3.0 12 10 - 20% 610,822.70£ 610,822.70£ 17 Healthcare, Education and Childcare 23/04/2018 8.73 01/07/2006 3.0 20204880 201029 8.0 14 10 - 20% 953,029.85£ 942,338.66£ 25 Personal, Food and Miscellaneous 04/11/2021 12.26 2 01/07/2006 3.0 15204891 202084 4.0 14 10 - 20% 1,799,998.40£ 1,799,998.40£ 5 Buildings and Real Estate 02/07/2019 9.92 01/08/2006 2.8 15204930 202297 8.0 14 10 - 20% 8,750,000.00£ 8,750,000.00£ 19 Hotels, Motels, Inns and Gaming 01/02/2010 0.50 2 01/11/2008 7.0 15 2204933 202318 4.0 15 10 - 20% 902,925.70£ 902,925.70£ 5 Buildings and Real Estate 21/11/2022 13.31 01/07/2006 2.8 15204942 202355 1.8 35 30 - 40% 3,752,567.76£ 3,328,743.00£ 3 Banking 05/04/2018 8.68 01/07/2006 1.2 15204960 202397 8.0 21 20 - 30% 843,559.43£ 843,559.43£ 5 Buildings and Real Estate 25/11/2023 14.32 1 01/08/2006 4.0 15204972 202467 2.5 22 20 - 30% 1,234,998.89£ 909,629.00£ 5 Buildings and Real Estate 01/05/2018 8.75 01/08/2006 4.0 15204984 202588 6.0 21 20 - 30% 1,200,959.19£ 1,200,959.19£ 22 Machinery (Non-Agriculture, Non-Construction, Non-Electro 23/12/2017 8.39 01/07/2006 4.0 15204988 202595 5.0 10 0 - 10% 870,000.00£ 560,095.95£ 19 Hotels, Motels, Inns and Gaming 03/10/2016 7.17 01/11/2007 3.0 15205005 202233 3.0 66 60 - 70% 447,910.48£ 447,910.48£ 22 Machinery (Non-Agriculture, Non-Construction, Non-Electro 07/03/2013 3.60 01/07/2006 2.1 34205006 202233 3.0 66 60 - 70% 590,118.16£ 587,842.81£ 22 Machinery (Non-Agriculture, Non-Construction, Non-Electro 06/05/2013 3.76 01/07/2006 2.1 34205009 202714 8.0 14 10 - 20% 606,700.90£ 606,700.90£ 5 Buildings and Real Estate 17/07/2016 6.96 2 01/08/2006 4.0 37205015 202756 5.0 12 10 - 20% 653,328.71£ 653,328.71£ 5 Buildings and Real Estate 02/04/2019 9.67 01/08/2006 3.0 15205017 201239 8.0 36 30 - 40% 1,023,433.94£ 714,058.00£ 21 Leisure, Amusement, Entertainment 31/10/2009 0.25 2 01/07/2006 5.0 46205019 202766 7.0 20 10 - 20% 1,000,000.00£ 1,000,000.00£ 5 Buildings and Real Estate 31/10/2009 0.25 01/07/2006 4.0 15205023 201907 5.0 21 20 - 30% 676,211.39£ 676,211.39£ 5 Buildings and Real Estate 31/08/2019 10.08 01/07/2006 3.0 24205026 202805 6.0 21 20 - 30% 3,630,365.53£ 3,630,365.53£ 5 Buildings and Real Estate 10/01/2016 6.44 2 01/07/2006 5.0 15205038 202903 2.8 11 10 - 20% 629,885.44£ 389,992.34£ 27 Cargo Transport 27/01/2025 15.49 01/07/2006 2.1 16
Page 14 of 5730/06/2008

Data By Reference Obligation
Loan Number Borrower Number BBGBarclays Expected LossSeverity (%) Severity Band
Reference Obligation Outstanding Debt
Reference Obligation Notional Amount
Moody's Industry Sector Moody's Industry Sector Maturity Date
Remaining Term(Years) EWL Syndicated
Date of Entry into Pool
BBG Upon PoolEntry BELS Upon Pool Entry EWL Upon Pool Entry
205039 202903 2.8 11 10 - 20% 648,173.81£ 648,173.81£ 27 Cargo Transport 27/01/2025 15.49 01/07/2006 2.1 16205044 202912 4.0 5 0 - 10% 736,329.00£ 736,329.00£ 13 Electronics 06/04/2011 1.68 01/07/2006 2.1 36205057 202990 3.0 24 20 - 30% 722,382.90£ 722,382.90£ 5 Buildings and Real Estate 11/01/2020 10.44 01/07/2006 3.0 39205058 202990 3.0 24 20 - 30% 500,129.75£ 500,129.75£ 5 Buildings and Real Estate 11/01/2020 10.44 01/07/2006 3.0 39205059 203012 5.0 19 10 - 20% 520,328.84£ 520,328.84£ 6 Chemicals, Plastics and Rubber 04/02/2025 15.51 01/07/2006 6.0 19205071 203079 6.0 22 20 - 30% 1,271,995.14£ 1,200,930.75£ 33 Broadcasting & Entertainment 19/07/2017 7.97 1 01/07/2006 7.0 19205079 203132 6.0 11 10 - 20% 470,582.17£ 470,582.17£ 7 Containers, Packaging and Glass 26/05/2021 11.82 01/07/2006 4.0 15205093 203339 7.0 12 10 - 20% 500,965.94£ 500,965.94£ 5 Buildings and Real Estate 19/12/2021 12.38 01/08/2006 5.0 15205095 203346 4.0 24 20 - 30% 8,009,617.00£ 7,891,936.00£ 19 Hotels, Motels, Inns and Gaming 31/12/2021 12.42 01/02/2008 8.0 17205109 203454 3.0 9 0 - 10% 1,331,727.91£ 1,306,525.97£ 5 Buildings and Real Estate 11/05/2021 11.78 01/08/2006 3.0 15205157 200149 5.0 34 30 - 40% 253,771.57£ 108,260.17£ 10 Diversified/Conglomerate Service 31/10/2009 0.25 01/08/2006 6.0 100205173 200240 8.0 12 10 - 20% 2,500,000.00£ 2,500,000.00£ 15 Farming and Agriculture 30/12/2025 16.41 2 01/08/2006 3.0 15205192 203598 7.0 9 0 - 10% 1,013,129.44£ 1,013,129.44£ 28 Retail Stores 29/07/2020 10.99 01/08/2006 3.0 15205195 203598 7.0 9 0 - 10% 536,138.21£ 536,138.21£ 28 Retail Stores 16/01/2015 5.46 01/08/2006 3.0 15205196 203586 7.0 28 20 - 30% 615,778.22£ 609,787.79£ 18 Home and Office Furnishings, Housewares, and Durable Co 03/10/2021 12.17 01/08/2006 3.0 28 2205214 200446 3.0 8 0 - 10% 1,997,161.42£ 1,997,161.42£ 28 Retail Stores 20/07/2026 16.97 01/08/2006 3.0 15205272 200730 4.0 8 0 - 10% 1,270,500.00£ 1,270,500.00£ 5 Buildings and Real Estate 08/07/2026 16.94 01/08/2006 3.0 15205285 203589 6.0 12 10 - 20% 378,179.09£ 378,179.09£ 22 Machinery (Non-Agriculture, Non-Construction, Non-Electro 01/08/2013 4.00 01/08/2006 4.0 23 2205298 200861 8.0 43 40 - 50% 1,639,376.32£ 1,639,376.32£ 29 Telecommunications 08/11/2025 16.27 2 01/08/2006 2.1 42205304 203514 7.0 28 20 - 30% 3,333,333.36£ 3,333,333.36£ 22 Machinery (Non-Agriculture, Non-Construction, Non-Electro 18/07/2019 9.96 2 01/08/2006 5.0 28205403 201402 4.0 13 10 - 20% 714,560.00£ 714,560.00£ 26 Printing and Publishing 14/08/2013 4.04 01/08/2006 2.1 33205441 201597 6.0 17 10 - 20% 3,335,561.12£ 3,335,561.12£ 2 Automobile 03/08/2016 7.01 01/01/2007 6.0 28205469 203591 3.0 17 10 - 20% 1,340,541.12£ 1,340,541.12£ 19 Hotels, Motels, Inns and Gaming 25/10/2019 10.23 01/08/2006 3.0 15205549 202148 8.0 74 70 - 80% 877,639.08£ 877,639.08£ 31 Personal Transportation 27/07/2025 15.99 01/08/2006 4.0 28205558 202184 6.0 17 10 - 20% 877,373.05£ 877,373.05£ 28 Retail Stores 21/07/2026 16.97 01/08/2006 5.0 17205606 202396 6.0 10 0 - 10% 40,356,714.24£ 24,500,000.00£ 21 Leisure, Amusement, Entertainment 07/04/2010 0.68 2 Y 01/06/2009 5.0 10 1205678 203620 7.0 26 20 - 30% 1,021,240.91£ 1,021,240.91£ 17 Healthcare, Education and Childcare 30/06/2011 1.91 01/08/2006 6.0 54 1205679 203620 7.0 26 20 - 30% 473,620.46£ 473,620.00£ 17 Healthcare, Education and Childcare 30/09/2010 1.16 01/08/2006 6.0 54 1205680 203620 7.0 26 20 - 30% 609,722.73£ 609,722.73£ 17 Healthcare, Education and Childcare 30/06/2010 0.91 01/08/2006 6.0 54 1205681 203620 7.0 26 20 - 30% 598,620.46£ 598,620.00£ 17 Healthcare, Education and Childcare 30/09/2011 2.16 01/08/2006 6.0 54 1205765 203626 4.0 45 40 - 50% 13,450,000.00£ 13,450,000.00£ 25 Personal, Food and Miscellaneous 10/06/2012 2.86 01/06/2009 4.0 45205775 203629 5.0 22 20 - 30% 440,332.89£ 440,332.89£ 16 Grocery 20/07/2025 15.97 01/09/2006 5.0 15205779 203748 7.0 9 0 - 10% 2,682,053.92£ 2,682,053.92£ 2 Automobile 31/12/2024 15.42 2 01/09/2006 6.0 28 1205783 203630 3.0 31 30 - 40% 1,362,988.69£ 1,317,858.60£ 30 Textiles and Leather 27/02/2026 16.57 01/09/2006 3.0 23205784 200042 4.0 12 10 - 20% 2,500,000.00£ 1,725,000.00£ 5 Buildings and Real Estate 03/06/2019 9.84 01/09/2006 5.0 15205793 203632 6.0 18 10 - 20% 1,010,270.23£ 1,010,270.23£ 26 Printing and Publishing 14/09/2026 17.12 01/09/2006 7.0 15205839 203635 5.0 27 20 - 30% 904,818.33£ 710,474.00£ 2 Automobile 15/05/2026 16.79 01/09/2006 3.0 15205853 203636 6.0 10 0 - 10% 840,807.24£ 840,807.24£ 8 Personal and Non Durable Consumer Products (Manufactu 15/02/2021 11.54 2 01/09/2006 6.0 60 2205859 203637 5.0 28 20 - 30% 412,676.57£ 412,676.57£ 5 Buildings and Real Estate 07/08/2016 7.02 01/09/2006 4.0 15205860 203638 4.0 12 10 - 20% 1,260,000.00£ 1,260,000.00£ 29 Telecommunications 09/06/2016 6.86 01/09/2006 4.0 24205867 200340 8.0 36 30 - 40% 1,919,666.90£ 1,881,066.90£ 5 Buildings and Real Estate 06/03/2022 12.60 2 01/09/2006 6.0 15205869 203640 6.0 34 30 - 40% 547,970.79£ 545,427.07£ 15 Farming and Agriculture 05/05/2026 16.76 01/09/2006 2.5 29205871 203640 6.0 34 30 - 40% 525,082.23£ 522,995.98£ 15 Farming and Agriculture 13/03/2026 16.62 01/09/2006 2.5 29205875 200362 2.1 6 0 - 10% 2,309,775.91£ 2,309,775.91£ 5 Buildings and Real Estate 30/06/2015 5.91 01/09/2006 3.0 15205885 203752 3.0 17 10 - 20% 2,215,487.69£ 2,215,487.69£ 15 Farming and Agriculture 01/02/2026 16.50 01/09/2006 2.1 15205908 203646 6.0 5 0 - 10% 811,088.21£ 811,088.21£ 4 Beverage, Food and Tobacco 13/09/2026 17.12 01/09/2006 6.0 15205916 200510 3.0 23 20 - 30% 2,396,459.00£ 1,884,838.00£ 5 Buildings and Real Estate 24/05/2020 10.81 01/09/2006 3.0 15205918 203753 7.0 32 30 - 40% 472,500.00£ 472,500.00£ 18 Home and Office Furnishings, Housewares, and Durable Co 20/08/2014 5.05 2 01/09/2006 7.0 28 2205919 203753 7.0 32 30 - 40% 661,517.00£ 661,517.00£ 18 Home and Office Furnishings, Housewares, and Durable Co 18/06/2014 4.88 2 01/09/2006 7.0 28 2205923 203649 3.0 18 10 - 20% 713,975.73£ 713,975.73£ 33 Broadcasting & Entertainment 17/07/2021 11.96 01/09/2006 4.0 15205925 203754 3.0 10 0 - 10% 747,760.14£ 747,760.14£ 28 Retail Stores 10/10/2025 16.19 01/09/2006 4.0 15205949 200593 3.0 41 40 - 50% 206,572.90£ 206,572.90£ 10 Diversified/Conglomerate Service 31/07/2010 1.00 01/09/2006 3.0 60205962 200650 5.0 38 30 - 40% 460,875.39£ 460,875.39£ 6 Chemicals, Plastics and Rubber 14/10/2023 14.20 01/09/2006 5.0 15205964 203652 4.0 17 10 - 20% 745,695.13£ 745,695.13£ 16 Grocery 08/05/2026 16.77 01/09/2006 3.0 15205969 203654 6.0 11 10 - 20% 1,168,736.48£ 1,168,736.48£ 19 Hotels, Motels, Inns and Gaming 20/04/2025 15.72 01/09/2006 3.0 15205974 200707 6.0 23 20 - 30% 863,146.07£ 742,442.00£ 6 Chemicals, Plastics and Rubber 26/09/2021 12.15 01/09/2006 2.5 29205996 200791 7.0 60 50 - 60% 517,254.07£ 517,254.07£ 10 Diversified/Conglomerate Service 18/09/2016 7.13 01/09/2006 6.0 67206007 203657 3.0 15 10 - 20% 673,753.22£ 673,753.22£ 28 Retail Stores 19/07/2016 6.97 01/09/2006 2.1 15206012 203659 4.0 11 10 - 20% 583,000.01£ 583,000.01£ 19 Hotels, Motels, Inns and Gaming 09/05/2026 16.77 01/09/2006 2.1 15206016 203660 4.0 14 10 - 20% 718,864.77£ 718,864.77£ 25 Personal, Food and Miscellaneous 08/03/2016 6.60 01/09/2006 2.8 15206035 203662 8.0 38 30 - 40% 791,086.98£ 791,086.98£ 12 Ecological 13/07/2024 14.95 2 01/09/2006 6.0 15206069 203517 6.0 5 0 - 10% 922,091.82£ 922,091.82£ 31 Personal Transportation 18/10/2019 10.21 2 01/09/2006 4.0 43 2206076 201063 7.0 58 50 - 60% 1,600,000.04£ 1,600,000.04£ 5 Buildings and Real Estate 21/08/2021 12.06 01/09/2006 5.0 28206131 203669 4.0 74 70 - 80% 666,398.33£ 666,398.33£ 22 Machinery (Non-Agriculture, Non-Construction, Non-Electro 11/08/2013 4.03 01/09/2006 7.0 77206142 203767 4.0 5 0 - 10% 742,033.77£ 738,751.95£ 17 Healthcare, Education and Childcare 27/08/2024 15.07 01/09/2006 2.1 15 2206146 203672 6.0 56 50 - 60% 1,575,000.00£ 1,575,000.00£ 16 Grocery 31/08/2011 2.08 01/09/2006 5.0 15206155 203673 3.0 13 10 - 20% 735,617.70£ 735,617.70£ 22 Machinery (Non-Agriculture, Non-Construction, Non-Electro 09/02/2026 16.52 01/09/2006 4.0 15 2206173 203769 5.0 11 10 - 20% 347,568.84£ 347,568.84£ 25 Personal, Food and Miscellaneous 16/12/2025 16.38 01/09/2006 4.0 23206180 201481 5.0 15 10 - 20% 1,963,132.80£ 1,963,132.80£ 5 Buildings and Real Estate 30/04/2019 9.75 01/09/2006 2.1 15206189 201511 4.0 15 10 - 20% 3,015,000.00£ 3,015,000.00£ 5 Buildings and Real Estate 31/10/2009 0.25 01/06/2009 4.0 15206193 203770 8.0 17 10 - 20% 2,312,807.78£ 2,312,807.78£ 17 Healthcare, Education and Childcare 11/11/2025 16.28 2 01/09/2006 6.0 15206194 203770 8.0 17 10 - 20% 1,503,710.05£ 1,503,710.05£ 17 Healthcare, Education and Childcare 11/11/2025 16.28 2 01/09/2006 6.0 15206203 203773 6.0 23 20 - 30% 1,411,084.12£ 1,411,084.12£ 28 Retail Stores 14/07/2020 10.95 01/09/2006 7.0 33 2206217 201574 3.0 20 10 - 20% 3,500,000.00£ 2,350,000.00£ 5 Buildings and Real Estate 30/11/2012 3.33 01/09/2006 2.1 15206219 201574 3.0 20 10 - 20% 2,250,000.00£ 2,250,000.00£ 5 Buildings and Real Estate 28/06/2010 0.91 01/09/2006 2.1 15206228 203676 4.0 20 10 - 20% 1,025,867.58£ 1,002,457.34£ 27 Cargo Transport 24/07/2026 16.98 01/09/2006 2.1 20206237 200243 8.0 5 0 - 10% 773,426.69£ 773,426.69£ 17 Healthcare, Education and Childcare 14/08/2026 17.04 01/09/2006 5.0 15206244 201681 2.8 12 10 - 20% 1,803,049.19£ 1,803,049.19£ 5 Buildings and Real Estate 05/05/2021 11.76 01/09/2006 2.1 15206260 201754 6.0 8 0 - 10% 1,747,427.45£ 1,747,427.45£ 5 Buildings and Real Estate 14/04/2022 12.70 01/09/2006 6.0 15206265 201767 2.1 16 10 - 20% 1,651,902.06£ 1,651,902.06£ 5 Buildings and Real Estate 06/12/2014 5.35 01/09/2006 2.1 15206273 201785 8.0 20 10 - 20% 900,696.98£ 900,696.98£ 33 Broadcasting & Entertainment 19/09/2026 17.13 2 01/09/2006 6.0 15206281 203777 2.1 21 20 - 30% 2,500,000.00£ 2,481,822.00£ 28 Retail Stores 22/04/2025 15.73 01/09/2006 2.1 27206283 201825 2.8 13 10 - 20% 6,343,622.86£ 4,077,577.00£ 5 Buildings and Real Estate 22/09/2011 2.14 01/09/2006 3.0 15
Page 15 of 5730/06/2008

Data By Reference Obligation
Loan Number Borrower Number BBGBarclays Expected LossSeverity (%) Severity Band
Reference Obligation Outstanding Debt
Reference Obligation Notional Amount
Moody's Industry Sector Moody's Industry Sector Maturity Date
Remaining Term(Years) EWL Syndicated
Date of Entry into Pool
BBG Upon PoolEntry BELS Upon Pool Entry EWL Upon Pool Entry
206299 203682 3.0 8 0 - 10% 766,827.00£ 766,827.00£ 2 Automobile 16/06/2022 12.88 01/09/2006 2.8 24206300 203683 5.0 6 0 - 10% 414,735.49£ 412,933.85£ 15 Farming and Agriculture 05/06/2016 6.84 01/09/2006 2.1 15206304 203684 3.0 9 0 - 10% 1,541,990.11£ 1,541,990.11£ 28 Retail Stores 20/06/2026 16.89 01/09/2006 3.0 15206317 203780 4.0 22 20 - 30% 635,283.40£ 635,283.40£ 10 Diversified/Conglomerate Service 17/06/2025 15.88 01/09/2006 2.8 26206319 203734 3.0 21 20 - 30% 1,063,643.50£ 1,063,643.50£ 17 Healthcare, Education and Childcare 29/01/2019 9.49 01/09/2006 5.0 15 2206320 203734 3.0 21 20 - 30% 985,067.51£ 985,067.51£ 17 Healthcare, Education and Childcare 29/01/2019 9.49 01/09/2006 5.0 15 2206328 201956 2.8 5 0 - 10% 1,110,000.00£ 1,110,000.00£ 5 Buildings and Real Estate 28/04/2011 1.74 01/09/2006 2.8 15206351 203609 4.0 8 0 - 10% 2,263,157.86£ 2,263,157.86£ 5 Buildings and Real Estate 19/05/2020 10.80 01/09/2006 5.0 15 2206365 202025 3.0 11 10 - 20% 3,100,000.00£ 2,604,838.00£ 5 Buildings and Real Estate 19/04/2010 0.72 01/09/2006 6.0 15206368 203686 6.0 20 10 - 20% 284,717.80£ 284,717.80£ 22 Machinery (Non-Agriculture, Non-Construction, Non-Electro 07/07/2011 1.93 01/09/2006 5.0 17206375 202055 4.0 19 10 - 20% 800,000.00£ 800,000.00£ 5 Buildings and Real Estate 31/10/2009 0.25 01/09/2006 5.0 15206384 203688 4.0 27 20 - 30% 1,100,633.49£ 1,100,633.49£ 28 Retail Stores 11/08/2026 17.03 01/09/2006 3.0 43206410 203786 7.0 13 10 - 20% 694,999.28£ 690,405.59£ 21 Leisure, Amusement, Entertainment 18/05/2025 15.80 01/09/2006 4.0 15206411 203787 6.0 21 20 - 30% 1,156,250.00£ 750,000.00£ 4 Beverage, Food and Tobacco 29/12/2017 8.41 01/02/2008 4.0 28206415 203690 8.0 9 0 - 10% 442,387.65£ 442,387.65£ 23 Mining, Steel, Iron and Non Precious Metals 29/10/2014 5.24 01/09/2006 7.0 15 2206416 203691 5.0 30 20 - 30% 2,363,615.15£ 2,363,615.15£ 27 Cargo Transport 31/03/2026 16.67 01/09/2006 5.0 20206428 202218 6.0 22 20 - 30% 1,482,500.00£ 1,395,000.00£ 5 Buildings and Real Estate 31/10/2009 0.25 2 01/09/2006 4.0 15206429 203692 3.0 11 10 - 20% 1,042,835.79£ 1,042,835.79£ 25 Personal, Food and Miscellaneous 01/02/2027 17.50 01/09/2006 2.5 15206438 202251 1.5 10 0 - 10% 2,017,182.68£ 2,017,182.68£ 5 Buildings and Real Estate 15/08/2022 13.04 01/09/2006 1.5 15206501 203698 5.0 5 0 - 10% 164,135.67£ 164,135.67£ 19 Hotels, Motels, Inns and Gaming 30/06/2026 16.91 01/09/2006 3.0 15206504 202479 2.5 56 50 - 60% 91,190.97£ 91,190.97£ 17 Healthcare, Education and Childcare 31/10/2009 0.25 01/09/2006 2.1 39206505 203700 5.0 31 30 - 40% 482,068.45£ 481,820.77£ 10 Diversified/Conglomerate Service 20/02/2026 16.55 01/09/2006 5.0 30206509 203743 5.0 75 70 - 80% 6,000,000.00£ 3,196,000.00£ 26 Printing and Publishing 30/09/2013 4.16 01/09/2006 7.0 47 2206510 203743 5.0 75 70 - 80% 3,669,704.34£ 3,669,704.34£ 26 Printing and Publishing 28/09/2012 3.16 01/09/2006 7.0 47 2206514 202528 4.0 18 10 - 20% 953,518.85£ 953,518.85£ 19 Hotels, Motels, Inns and Gaming 10/08/2026 17.03 01/09/2006 5.0 15206523 203801 8.0 19 10 - 20% 2,246,617.43£ 2,246,617.43£ 21 Leisure, Amusement, Entertainment 02/09/2025 16.09 2 01/09/2006 7.0 15206526 203702 8.0 22 20 - 30% 625,000.00£ 613,408.52£ 19 Hotels, Motels, Inns and Gaming 15/12/2025 16.37 2 01/09/2006 5.0 19206527 203702 8.0 22 20 - 30% 1,546,205.42£ 1,546,205.42£ 19 Hotels, Motels, Inns and Gaming 16/05/2026 16.79 2 01/09/2006 5.0 19206541 203805 5.0 5 0 - 10% 568,988.23£ 568,988.23£ 17 Healthcare, Education and Childcare 29/12/2024 15.41 01/09/2006 3.0 15206544 203703 5.0 15 10 - 20% 700,250.00£ 673,057.72£ 28 Retail Stores 30/06/2023 13.91 01/09/2006 4.0 15206547 203704 6.0 9 0 - 10% 1,226,614.71£ 1,226,614.71£ 19 Hotels, Motels, Inns and Gaming 14/09/2021 12.12 01/09/2006 8.0 15206573 203745 8.0 48 40 - 50% 6,400,000.00£ 6,400,000.00£ 10 Diversified/Conglomerate Service 30/04/2010 0.75 2 01/09/2006 7.0 45 1206578 203808 7.0 89 80 - 90% 1,500,000.00£ 1,500,000.00£ 13 Electronics 31/07/2010 1.00 2 01/09/2006 5.0 90206579 203808 7.0 89 80 - 90% 1,153,693.00£ 1,153,693.00£ 13 Electronics 31/07/2010 1.00 2 01/09/2006 5.0 90206593 203709 5.0 14 10 - 20% 1,345,556.02£ 1,345,556.02£ 2 Automobile 07/06/2021 11.85 01/09/2006 5.0 15206603 203710 5.0 20 10 - 20% 5,000,000.00£ 5,000,000.00£ 4 Beverage, Food and Tobacco 07/02/2015 5.52 01/09/2006 2.5 60206604 203710 5.0 20 10 - 20% 3,437,500.00£ 3,437,500.00£ 4 Beverage, Food and Tobacco 07/02/2015 5.52 01/06/2009 5.0 20206605 203811 7.0 14 10 - 20% 964,106.71£ 964,106.71£ 25 Personal, Food and Miscellaneous 08/08/2025 16.02 01/09/2006 7.0 15206610 201016 7.0 100 90 - 100% 931,244.16£ 840,603.22£ 5 Buildings and Real Estate 31/10/2009 0.25 01/03/2009 7.0 83206614 203813 5.0 6 0 - 10% 606,360.96£ 606,360.96£ 17 Healthcare, Education and Childcare 23/11/2025 16.31 01/09/2006 4.0 15206616 203814 8.0 12 10 - 20% 1,756,300.00£ 1,756,300.00£ 19 Hotels, Motels, Inns and Gaming 05/09/2015 6.09 2 01/09/2006 2.1 15206618 203713 8.0 22 20 - 30% 382,214.25£ 382,214.25£ 27 Cargo Transport 25/10/2015 6.23 2 01/09/2006 8.0 15 2206626 203717 8.0 18 10 - 20% 1,160,990.98£ 1,160,990.98£ 17 Healthcare, Education and Childcare 17/03/2026 16.63 1 01/09/2006 3.0 15206627 203717 8.0 18 10 - 20% 1,633,525.32£ 1,633,525.32£ 17 Healthcare, Education and Childcare 14/06/2026 16.87 1 01/09/2006 3.0 15206631 203718 7.0 12 10 - 20% 764,107.36£ 764,107.36£ 17 Healthcare, Education and Childcare 11/01/2026 16.44 01/09/2006 5.0 15 2206637 203722 8.0 10 0 - 10% 2,226,884.97£ 2,111,000.00£ 19 Hotels, Motels, Inns and Gaming 30/03/2026 16.66 2 01/09/2006 6.0 15206644 203726 8.0 20 10 - 20% 621,517.90£ 621,517.90£ 18 Home and Office Furnishings, Housewares, and Durable Co 02/06/2026 16.84 1 01/09/2006 6.0 23206659 200033 3.0 12 10 - 20% 1,434,449.40£ 1,421,123.28£ 5 Buildings and Real Estate 07/07/2020 10.93 01/10/2006 2.8 15206726 200277 4.0 52 50 - 60% 1,950,000.00£ 1,548,428.00£ 5 Buildings and Real Estate 31/10/2009 0.25 01/10/2006 5.0 27206731 200314 4.0 8 0 - 10% 1,431,855.26£ 1,431,855.26£ 5 Buildings and Real Estate 15/05/2021 11.79 01/10/2006 4.0 15206798 200585 6.0 28 20 - 30% 292,070.00£ 292,070.00£ 5 Buildings and Real Estate 31/10/2009 0.25 2 01/10/2006 5.0 15206830 203729 5.0 42 40 - 50% 1,400,000.00£ 1,400,000.00£ 2 Automobile 31/12/2009 0.42 1 01/10/2008 5.0 42206836 200752 4.0 5 0 - 10% 1,000,000.00£ 1,000,000.00£ 5 Buildings and Real Estate 27/10/2010 1.24 01/10/2006 5.0 15206842 203758 7.0 14 10 - 20% 151,664.30£ 11,683.14£ 4 Beverage, Food and Tobacco 31/10/2009 0.25 01/10/2006 6.0 15 2206852 200844 6.0 12 10 - 20% 1,937,161.21£ 1,937,161.21£ 6 Chemicals, Plastics and Rubber 04/07/2016 6.93 01/10/2006 6.0 28 2206854 200868 5.0 10 0 - 10% 1,553,645.88£ 1,553,645.88£ 5 Buildings and Real Estate 21/04/2021 11.72 01/10/2006 7.0 15206998 201531 4.0 20 10 - 20% 931,235.24£ 931,235.24£ 10 Diversified/Conglomerate Service 31/05/2024 14.83 01/10/2006 2.5 15206999 203773 6.0 23 20 - 30% 1,066,586.72£ 631,127.37£ 28 Retail Stores 31/10/2009 0.25 01/08/2008 6.0 23207031 203678 8.0 57 50 - 60% 833,522.74£ 819,698.16£ 30 Textiles and Leather 31/10/2009 0.25 3 01/10/2006 4.0 30 2207033 203775 4.0 46 40 - 50% 1,528,727.48£ 989,137.27£ 18 Home and Office Furnishings, Housewares, and Durable Co 31/10/2009 0.25 01/01/2009 4.0 46207045 201767 2.1 16 10 - 20% 1,764,899.59£ 1,764,899.59£ 5 Buildings and Real Estate 30/10/2021 12.25 01/10/2006 2.1 15207056 201840 6.0 10 0 - 10% 1,018,115.34£ 1,018,115.34£ 19 Hotels, Motels, Inns and Gaming 26/10/2021 12.24 01/10/2006 7.0 15207090 200156 5.0 13 10 - 20% 4,405,317.70£ 4,405,317.70£ 5 Buildings and Real Estate 19/10/2021 12.22 01/10/2006 3.0 15207117 202043 7.0 7 0 - 10% 842,778.74£ 842,778.74£ 25 Personal, Food and Miscellaneous 10/10/2014 5.19 01/10/2006 6.0 15207126 202077 7.0 7 0 - 10% 2,999,999.92£ 1,676,816.00£ 5 Buildings and Real Estate 22/03/2012 2.64 01/10/2006 6.0 15207150 202190 6.0 15 10 - 20% 700,771.45£ 700,771.45£ 17 Healthcare, Education and Childcare 27/10/2021 12.24 01/10/2006 5.0 15207158 202224 7.0 8 0 - 10% 712,812.77£ 712,812.77£ 13 Electronics 11/09/2014 5.11 01/10/2006 2.1 15207164 203693 6.0 11 10 - 20% 761,885.82£ 761,885.82£ 21 Leisure, Amusement, Entertainment 09/08/2021 12.02 01/10/2006 5.0 15207188 202351 4.0 22 20 - 30% 1,314,423.52£ 1,314,423.52£ 5 Buildings and Real Estate 17/01/2023 13.46 01/10/2006 5.0 27207192 202190 6.0 17 10 - 20% 1,137,871.00£ 1,137,871.00£ 17 Healthcare, Education and Childcare 27/10/2021 12.24 01/10/2006 5.0 15207226 201016 7.0 21 20 - 30% 153,318.00£ 63,327.00£ 5 Buildings and Real Estate 31/10/2009 0.25 01/10/2006 3.0 15207274 203248 8.0 22 20 - 30% 4,018,000.00£ 4,018,000.00£ 19 Hotels, Motels, Inns and Gaming 28/07/2025 15.99 2 01/06/2009 8.0 22 2207289 203382 4.0 49 40 - 50% 10,000,000.00£ 10,000,000.00£ 25 Personal, Food and Miscellaneous 29/11/2011 2.33 01/06/2009 4.0 49207295 203478 5.0 5 0 - 10% 314,789.00£ 314,789.00£ 2 Automobile 19/04/2021 11.72 01/10/2006 6.0 17207300 203816 5.0 41 40 - 50% 101,982,202.03£ 17,856,089.66£ 28 Retail Stores 19/04/2011 1.72 01/10/2006 3.0 53207351 203819 2.1 5 0 - 10% 3,311,350.64£ 3,311,350.64£ 5 Buildings and Real Estate 30/09/2013 4.16 01/11/2006 2.1 15207366 200233 3.0 9 0 - 10% 410,753.34£ 410,753.34£ 26 Printing and Publishing 17/06/2017 7.88 01/11/2006 2.1 15207371 200247 8.0 5 0 - 10% 193,458.93£ 193,458.93£ 5 Buildings and Real Estate 31/10/2009 0.25 2 01/11/2006 2.1 15207385 200353 6.0 59 50 - 60% 460,950.13£ 460,950.13£ 2 Automobile 30/04/2009 0.00 3 01/11/2006 6.0 57207412 200429 8.0 18 10 - 20% 511,307.06£ 511,307.06£ 25 Personal, Food and Miscellaneous 17/09/2013 4.13 2 01/11/2006 4.0 15207430 200494 4.0 17 10 - 20% 1,746,224.35£ 1,746,224.35£ 28 Retail Stores 31/10/2009 0.25 01/06/2009 4.0 17207462 203755 7.0 6 0 - 10% 314,827.15£ 314,827.15£ 2 Automobile 15/06/2011 1.87 1 01/11/2006 6.0 28 2207463 203756 6.0 35 30 - 40% 543,981.50£ 543,981.50£ 10 Diversified/Conglomerate Service 31/10/2009 0.25 2 01/11/2006 2.1 15
Page 16 of 5730/06/2008

Data By Reference Obligation
Loan Number Borrower Number BBGBarclays Expected LossSeverity (%) Severity Band
Reference Obligation Outstanding Debt
Reference Obligation Notional Amount
Moody's Industry Sector Moody's Industry Sector Maturity Date
Remaining Term(Years) EWL Syndicated
Date of Entry into Pool
BBG Upon PoolEntry BELS Upon Pool Entry EWL Upon Pool Entry
207486 203829 6.0 65 60 - 70% 1,976,748.00£ 1,779,873.00£ 18 Home and Office Furnishings, Housewares, and Durable Co 27/06/2011 1.91 2 01/11/2006 2.8 60207506 200841 4.0 11 10 - 20% 367,469.19£ 342,920.17£ 22 Machinery (Non-Agriculture, Non-Construction, Non-Electro 31/10/2009 0.25 01/11/2007 3.0 15 2207526 200935 7.0 12 10 - 20% 1,136,167.52£ 1,136,167.52£ 28 Retail Stores 31/10/2009 0.25 01/11/2008 5.0 11207527 200938 3.0 6 0 - 10% 975,000.00£ 975,000.00£ 18 Home and Office Furnishings, Housewares, and Durable Co 07/12/2015 6.35 01/11/2006 5.0 28207549 201050 7.0 19 10 - 20% 572,692.23£ 568,449.09£ 18 Home and Office Furnishings, Housewares, and Durable Co 07/11/2021 12.27 01/11/2006 4.0 22207552 203834 5.0 20 10 - 20% 5,169,000.00£ 4,214,596.00£ 5 Buildings and Real Estate 31/08/2011 2.08 01/11/2006 3.0 15207555 201079 2.1 7 0 - 10% 5,000,000.00£ 5,000,000.00£ 5 Buildings and Real Estate 28/01/2025 15.49 01/11/2006 2.5 25207606 203844 4.0 23 20 - 30% 3,569,606.25£ 2,517,606.25£ 5 Buildings and Real Estate 30/04/2011 1.75 01/11/2006 2.1 27207607 203844 4.0 23 20 - 30% 3,471,577.40£ 1,236,577.40£ 5 Buildings and Real Estate 30/04/2011 1.75 01/11/2006 2.1 27207617 203845 3.0 20 10 - 20% 300,000.00£ 300,000.00£ 25 Personal, Food and Miscellaneous 25/06/2012 2.90 01/11/2006 2.1 29207646 201509 3.0 70 60 - 70% 1,292,902.25£ 1,292,902.25£ 5 Buildings and Real Estate 31/10/2009 0.25 01/06/2009 2.8 70207652 203850 5.0 13 10 - 20% 912,554.30£ 425,913.07£ 21 Leisure, Amusement, Entertainment 31/10/2009 0.25 01/11/2006 3.0 15207676 203854 3.0 6 0 - 10% 1,087,252.79£ 1,087,252.79£ 17 Healthcare, Education and Childcare 02/09/2011 2.09 01/11/2006 2.1 27207703 203860 1.5 8 0 - 10% 1,068,528.98£ 506,280.00£ 15 Farming and Agriculture 31/10/2009 0.25 01/11/2006 1.8 15207705 203861 5.0 26 20 - 30% 453,290.76£ 453,290.76£ 6 Chemicals, Plastics and Rubber 30/11/2014 5.33 01/11/2006 2.5 15207708 201767 2.1 16 10 - 20% 2,751,876.25£ 2,741,616.57£ 5 Buildings and Real Estate 06/08/2018 9.01 01/11/2006 2.5 15207730 203866 3.0 9 0 - 10% 2,250,000.00£ 2,250,000.00£ 5 Buildings and Real Estate 07/11/2013 4.27 01/11/2006 3.0 15207738 201886 8.0 45 40 - 50% 2,902,743.31£ 2,902,743.31£ 18 Home and Office Furnishings, Housewares, and Durable Co 31/10/2009 0.25 2 01/04/2009 7.0 45 2207747 201898 6.0 15 10 - 20% 1,851,243.36£ 1,584,496.00£ 5 Buildings and Real Estate 30/08/2021 12.08 01/11/2006 6.0 21207764 202003 4.0 9 0 - 10% 371,477.59£ 371,477.59£ 19 Hotels, Motels, Inns and Gaming 02/11/2011 2.25 01/11/2006 4.0 15207825 202302 8.0 17 10 - 20% 694,001.97£ 694,001.97£ 18 Home and Office Furnishings, Housewares, and Durable Co 29/11/2017 8.33 01/11/2006 6.0 15207842 203878 4.0 38 30 - 40% 3,066,732.00£ 2,561,732.00£ 5 Buildings and Real Estate 30/04/2011 1.75 01/11/2006 2.8 27207860 202479 2.5 56 50 - 60% 181,049.00£ 181,049.00£ 17 Healthcare, Education and Childcare 24/11/2009 0.31 01/11/2006 2.1 39207867 202546 6.0 7 0 - 10% 433,902.94£ 433,902.94£ 4 Beverage, Food and Tobacco 15/11/2021 12.29 01/11/2006 6.0 55207869 202554 3.0 29 20 - 30% 200,000.00£ 200,000.00£ 27 Cargo Transport 16/10/2009 0.21 01/11/2006 5.0 15207872 202637 5.0 5 0 - 10% 471,875.10£ 471,875.10£ 16 Grocery 19/12/2013 4.38 01/11/2006 5.0 28207903 202961 6.0 13 10 - 20% 590,254.60£ 557,975.00£ 11 Diversified Natural Resources, Precious 24/11/2015 6.31 01/11/2006 7.0 15 2207920 203898 7.0 48 40 - 50% 16,690,830.86£ 16,690,830.86£ 2 Automobile 30/04/2012 2.75 2 01/06/2009 8.0 48 2207950 203328 6.0 58 50 - 60% 562,500.00£ 562,500.00£ 4 Beverage, Food and Tobacco 05/12/2010 1.34 1 01/11/2006 4.0 38207961 203885 6.0 31 30 - 40% 617,723.45£ 617,723.45£ 6 Chemicals, Plastics and Rubber 28/07/2016 6.99 01/11/2006 3.0 36207964 203905 9.0 54 50 - 60% 15,000,000.00£ 17,973.42£ 4 Beverage, Food and Tobacco 24/07/2011 1.98 01/04/2007 7.0 54 2207995 203924 5.0 20 10 - 20% 590,678.08£ 398,298.36£ 22 Machinery (Non-Agriculture, Non-Construction, Non-Electro 31/10/2009 0.25 01/12/2006 5.0 27208056 200404 6.0 7 0 - 10% 190,092.17£ 190,092.17£ 19 Hotels, Motels, Inns and Gaming 31/10/2009 0.25 1 01/09/2008 5.0 8208076 200501 6.0 15 10 - 20% 1,905,988.96£ 1,905,988.96£ 4 Beverage, Food and Tobacco 31/10/2009 0.25 2 01/11/2008 5.0 5208098 200592 8.0 41 40 - 50% 20,727,272.74£ 20,727,272.74£ 2 Automobile 08/02/2011 1.52 2 Y 01/06/2009 8.0 41 2208116 203940 5.0 19 10 - 20% 540,950.20£ 38,439.65£ 2 Automobile 31/10/2009 0.25 01/12/2006 4.0 27208119 200728 5.0 5 0 - 10% 1,973,120.69£ 1,973,120.69£ 25 Personal, Food and Miscellaneous 31/10/2009 0.25 01/06/2009 4.0 5208151 203945 5.0 82 80 - 90% 278,830.79£ 218,012.50£ 3 Banking 31/10/2009 0.25 1 01/12/2006 5.0 100208228 203954 5.0 82 80 - 90% 711,731.63£ 329,125.78£ 30 Textiles and Leather 31/10/2009 0.25 01/04/2008 5.0 81208365 203966 5.0 10 0 - 10% 345,686.36£ 342,096.36£ 10 Diversified/Conglomerate Service 31/10/2009 0.25 01/12/2006 4.0 15208539 203996 4.0 58 50 - 60% 1,400,000.00£ 1,400,000.00£ 13 Electronics 21/07/2011 1.97 01/12/2006 4.0 28208564 204000 6.0 100 90 - 100% 1,900,000.00£ 1,900,000.00£ 10 Diversified/Conglomerate Service 29/07/2011 1.99 01/12/2006 6.0 47208573 203328 6.0 38 30 - 40% 911,250.00£ 911,250.00£ 4 Beverage, Food and Tobacco 03/12/2010 1.34 1 01/12/2006 4.0 38208583 203725 8.0 10 0 - 10% 1,000,000.00£ 1,000,000.00£ 2 Automobile 20/05/2010 0.80 2 01/12/2006 5.0 28208609 200010 5.0 14 10 - 20% 289,414.27£ 171,251.83£ 22 Machinery (Non-Agriculture, Non-Construction, Non-Electro 31/10/2009 0.25 1 01/01/2007 3.0 15208613 204066 6.0 22 20 - 30% 2,344,383.98£ 2,344,383.98£ 9 Diversified/Conglomerate Manufacturing 31/10/2009 0.25 2 01/06/2009 6.0 22 2208624 200074 7.0 14 10 - 20% 2,096,397.88£ 2,096,397.88£ 10 Diversified/Conglomerate Service 03/01/2022 12.42 01/04/2008 4.0 15208644 204067 3.0 26 20 - 30% 269,191.40£ 269,191.40£ 26 Printing and Publishing 29/12/2011 2.41 01/01/2007 3.0 46208654 200193 5.0 9 0 - 10% 1,042,641.92£ 1,042,641.92£ 21 Leisure, Amusement, Entertainment 10/06/2018 8.86 01/01/2007 8.0 15208677 204020 8.0 24 20 - 30% 1,271,524.42£ 1,127,295.39£ 10 Diversified/Conglomerate Service 03/06/2017 7.84 2 01/01/2007 6.0 16208684 200335 6.0 14 10 - 20% 925,000.00£ 750,000.00£ 2 Automobile 27/09/2018 9.16 01/01/2007 5.0 28208702 203933 3.0 5 0 - 10% 300,000.00£ 300,000.00£ 4 Beverage, Food and Tobacco 11/05/2012 2.78 01/01/2007 3.0 15208723 203753 7.0 28 20 - 30% 1,046,019.87£ 1,046,019.87£ 18 Home and Office Furnishings, Housewares, and Durable Co 25/01/2017 7.48 2 01/01/2007 3.0 28 2208734 200547 5.0 16 10 - 20% 531,345.12£ 15,265.16£ 2 Automobile 31/10/2009 0.25 01/07/2008 4.0 16208739 204024 5.0 23 20 - 30% 750,000.00£ 750,000.00£ 30 Textiles and Leather 17/11/2016 7.29 01/01/2007 4.0 15208814 204013 8.0 18 10 - 20% 528,312.30£ 248,203.45£ 2 Automobile 31/10/2009 0.25 1 01/01/2007 7.0 33208872 201181 6.0 32 30 - 40% 241,798.80£ 241,798.80£ 2 Automobile 31/10/2009 0.25 2 01/01/2007 4.0 15208890 204029 6.0 12 10 - 20% 7,873,437.48£ 7,710,546.85£ 25 Personal, Food and Miscellaneous 25/10/2011 2.23 2 01/01/2007 4.0 74208905 204052 6.0 8 0 - 10% 910,507.36£ 910,507.36£ 13 Electronics 01/12/2016 7.33 01/01/2007 5.0 28 2208925 204054 6.0 5 0 - 10% 1,506,640.76£ 1,506,640.76£ 19 Hotels, Motels, Inns and Gaming 31/05/2014 4.83 2 01/01/2007 5.0 15 2208926 201380 6.0 13 10 - 20% 291,943.77£ 291,943.77£ 6 Chemicals, Plastics and Rubber 30/05/2020 10.83 01/01/2007 4.0 28208979 201564 6.0 24 20 - 30% 410,662.05£ 410,662.05£ 23 Mining, Steel, Iron and Non Precious Metals 23/06/2014 4.89 01/01/2007 3.0 32208988 204033 8.0 38 30 - 40% 1,724,840.00£ 1,724,840.00£ 17 Healthcare, Education and Childcare 12/12/2016 7.36 2 01/01/2007 3.0 39209005 201669 6.0 35 30 - 40% 1,080,599.95£ 1,080,599.95£ 2 Automobile 25/01/2019 9.48 01/01/2007 4.0 36209013 201714 6.0 11 10 - 20% 2,667,740.20£ 2,667,740.20£ 19 Hotels, Motels, Inns and Gaming 17/02/2024 14.54 01/01/2007 2.1 15209017 204035 3.0 17 10 - 20% 1,730,365.78£ 1,730,365.78£ 6 Chemicals, Plastics and Rubber 22/07/2017 7.98 01/01/2007 2.1 15209022 204055 4.0 74 70 - 80% 945,664.22£ 945,664.22£ 33 Broadcasting & Entertainment 30/06/2011 1.91 01/01/2007 8.0 19 1209031 201835 4.0 13 10 - 20% 454,543.22£ 454,543.22£ 23 Mining, Steel, Iron and Non Precious Metals 29/01/2019 9.49 01/01/2007 3.0 15209073 202006 5.0 9 0 - 10% 477,266.98£ 477,266.98£ 22 Machinery (Non-Agriculture, Non-Construction, Non-Electro 19/01/2014 4.47 01/01/2007 3.0 15209076 202034 1.8 18 10 - 20% 814,752.97£ 405,462.62£ 15 Farming and Agriculture 31/10/2009 0.25 01/08/2008 1.5 15209077 202034 1.8 18 10 - 20% 431,396.61£ 431,396.61£ 15 Farming and Agriculture 29/12/2021 12.41 01/01/2007 2.1 27209082 202043 7.0 7 0 - 10% 1,400,000.00£ 1,400,000.00£ 25 Personal, Food and Miscellaneous 31/01/2010 0.50 01/01/2007 5.0 15209100 204096 5.0 43 40 - 50% 402,887.48£ 325,883.46£ 28 Retail Stores 31/10/2009 0.25 01/03/2008 5.0 57 2209106 204018 4.0 100 90 - 100% 1,790,223.58£ 1,790,223.58£ 10 Diversified/Conglomerate Service 31/10/2009 0.25 01/06/2009 4.0 100209127 204098 4.0 81 80 - 90% 312,382.86£ 312,382.86£ 17 Healthcare, Education and Childcare 13/11/2010 1.28 01/01/2007 4.0 62 2209128 204099 8.0 51 50 - 60% 774,889.30£ 613,528.31£ 2 Automobile 31/10/2009 0.25 2 01/01/2007 7.0 71 2209162 203978 5.0 17 10 - 20% 696,056.82£ 696,056.82£ 22 Machinery (Non-Agriculture, Non-Construction, Non-Electro 20/05/2018 8.80 01/01/2007 4.0 15209176 203796 3.0 15 10 - 20% 3,132,454.79£ 3,132,454.79£ 2 Automobile 01/12/2021 12.33 01/01/2007 3.0 15209179 204040 5.0 9 0 - 10% 1,318,811.80£ 1,318,811.80£ 17 Healthcare, Education and Childcare 22/07/2013 3.98 01/01/2007 6.0 15209181 204041 6.0 5 0 - 10% 518,766.76£ 518,766.76£ 10 Diversified/Conglomerate Service 28/08/2013 4.08 01/01/2007 7.0 15209231 204063 8.0 42 40 - 50% 462,964.44£ 462,964.44£ 26 Printing and Publishing 31/10/2009 0.25 2 01/01/2007 4.0 85 2209256 204043 3.0 34 30 - 40% 3,333,333.33£ 3,333,333.33£ 27 Cargo Transport 30/06/2011 1.91 01/07/2008 3.0 34209258 203995 4.0 16 10 - 20% 1,232,354.43£ 1,232,354.43£ 28 Retail Stores 24/06/2020 10.90 01/01/2007 4.0 15
Page 17 of 5730/06/2008

Data By Reference Obligation
Loan Number Borrower Number BBGBarclays Expected LossSeverity (%) Severity Band
Reference Obligation Outstanding Debt
Reference Obligation Notional Amount
Moody's Industry Sector Moody's Industry Sector Maturity Date
Remaining Term(Years) EWL Syndicated
Date of Entry into Pool
BBG Upon PoolEntry BELS Upon Pool Entry EWL Upon Pool Entry
209279 204112 4.0 28 20 - 30% 7,512,387.93£ 7,512,387.93£ 32 Utilities 31/12/2016 7.42 01/01/2007 1.5 28209280 204112 4.0 28 20 - 30% 3,527,968.97£ 3,527,968.97£ 32 Utilities 31/12/2016 7.42 01/06/2009 4.0 28209285 204000 6.0 100 90 - 100% 1,000,000.00£ 1,000,000.00£ 10 Diversified/Conglomerate Service 31/07/2012 3.00 01/01/2007 6.0 47209299 204114 6.0 5 0 - 10% 470,886.20£ 470,886.20£ 2 Automobile 31/10/2009 0.25 2 01/12/2008 4.0 28 2209303 204007 6.0 48 40 - 50% 785,155.20£ 785,155.20£ 26 Printing and Publishing 28/07/2013 3.99 01/01/2007 4.0 28209311 204047 6.0 49 40 - 50% 4,909,000.00£ 4,909,000.00£ 17 Healthcare, Education and Childcare 30/04/2012 2.75 2 01/06/2009 5.0 49 1209337 200079 8.0 9 0 - 10% 1,204,250.00£ 1,200,000.00£ 18 Home and Office Furnishings, Housewares, and Durable Co 31/10/2009 0.25 1 01/07/2007 4.0 15209382 200238 6.0 16 10 - 20% 574,369.32£ 394,412.82£ 22 Machinery (Non-Agriculture, Non-Construction, Non-Electro 31/10/2009 0.25 01/01/2008 4.0 30209393 203641 8.0 9 0 - 10% 361,200.06£ 361,200.06£ 28 Retail Stores 31/10/2009 0.25 2 01/09/2008 3.0 10 1209400 203932 4.0 11 10 - 20% 2,982,379.40£ 2,553,068.34£ 19 Hotels, Motels, Inns and Gaming 31/10/2009 0.25 01/06/2009 4.0 11209415 200460 5.0 12 10 - 20% 265,592.25£ 137,710.16£ 21 Leisure, Amusement, Entertainment 31/10/2009 0.25 01/06/2008 4.0 10209478 200783 5.0 17 10 - 20% 346,994.89£ 306,727.97£ 4 Beverage, Food and Tobacco 31/10/2009 0.25 01/02/2008 4.0 15209590 201375 2.5 5 0 - 10% 378,514.95£ 377,572.45£ 15 Farming and Agriculture 30/12/2013 4.41 01/02/2007 1.5 15209901 202526 7.0 37 30 - 40% 2,487,776.70£ 2,487,776.70£ 5 Buildings and Real Estate 31/03/2010 0.67 01/02/2007 7.0 28210145 203762 4.0 36 30 - 40% 3,064,733.22£ 2,567,472.02£ 10 Diversified/Conglomerate Service 31/10/2009 0.25 01/05/2009 3.0 40210168 201149 4.0 24 20 - 30% 535,674.85£ 283,099.13£ 28 Retail Stores 31/10/2009 0.25 01/01/2008 3.0 15210172 204115 4.0 12 10 - 20% 828,307.50£ 828,307.50£ 5 Buildings and Real Estate 22/04/2014 4.73 01/03/2007 4.0 15210342 201924 2.8 15 10 - 20% 35,000,000.00£ 21,500,000.00£ 5 Buildings and Real Estate 21/03/2010 0.64 01/03/2007 1.8 28210343 201926 8.0 23 20 - 30% 391,563.52£ 141,675.86£ 15 Farming and Agriculture 31/10/2009 0.25 2 01/03/2007 7.0 15210470 204104 8.0 24 20 - 30% 406,346.80£ 391,691.85£ 30 Textiles and Leather 31/10/2009 0.25 2 01/03/2007 6.0 24 2210497 202802 6.0 9 0 - 10% 1,886,393.95£ 538,247.61£ 26 Printing and Publishing 31/10/2009 0.25 01/12/2008 8.0 36210562 203289 7.0 49 40 - 50% 2,559,277.79£ 2,559,277.79£ 13 Electronics 31/10/2009 0.25 1 01/06/2009 7.0 49 1210672 200301 7.0 7 0 - 10% 720,336.46£ 403,769.10£ 2 Automobile 31/10/2009 0.25 01/04/2007 7.0 15210682 203640 6.0 34 30 - 40% 1,350,526.00£ 1,340,473.00£ 15 Farming and Agriculture 01/08/2010 1.00 01/04/2007 2.5 29210691 200309 5.0 16 10 - 20% 725,500.00£ 530,000.00£ 19 Hotels, Motels, Inns and Gaming 07/11/2012 3.27 01/04/2007 4.0 15210694 203932 4.0 11 10 - 20% 501,250.00£ 501,250.00£ 19 Hotels, Motels, Inns and Gaming 28/03/2011 1.66 01/04/2007 4.0 28210792 200858 7.0 19 10 - 20% 2,411,452.41£ 745,231.27£ 5 Buildings and Real Estate 01/01/2010 0.42 01/10/2008 6.0 15 2210868 203952 8.0 75 70 - 80% 225,000.00£ 225,000.00£ 25 Personal, Food and Miscellaneous 28/10/2010 1.24 01/04/2007 7.0 81210921 201473 4.0 9 0 - 10% 478,613.34£ 420,621.93£ 22 Machinery (Non-Agriculture, Non-Construction, Non-Electro 31/10/2009 0.25 01/04/2008 3.0 15210985 201751 8.0 13 10 - 20% 709,500.00£ 707,000.00£ 19 Hotels, Motels, Inns and Gaming 31/10/2009 0.25 2 01/04/2007 7.0 15211013 201897 4.0 5 0 - 10% 655,796.00£ 655,796.00£ 5 Buildings and Real Estate 01/04/2010 0.67 01/04/2007 4.0 28211183 203571 7.0 45 40 - 50% 2,606,038.46£ 2,030,859.77£ 4 Beverage, Food and Tobacco 31/10/2009 0.25 2 01/12/2008 6.0 45211238 204009 4.0 5 0 - 10% 23,083,333.32£ 23,083,333.32£ 19 Hotels, Motels, Inns and Gaming 06/06/2011 1.85 Y 01/04/2007 4.0 15211239 204009 4.0 5 0 - 10% 5,333,333.03£ 1,416,666.68£ 19 Hotels, Motels, Inns and Gaming 06/06/2011 1.85 Y 01/05/2007 4.0 15211246 201812 6.0 15 10 - 20% 5,311,100.00£ 5,311,100.00£ 2 Automobile 31/03/2021 11.67 2 01/06/2009 6.0 15211247 203668 4.0 17 10 - 20% 2,278,032.36£ 2,278,032.36£ 22 Machinery (Non-Agriculture, Non-Construction, Non-Electro 31/01/2022 12.50 01/04/2007 2.8 28211248 203605 7.0 26 20 - 30% 5,118,391.43£ 5,118,391.43£ 13 Electronics 07/06/2022 12.85 2 01/04/2007 4.0 33 2211249 202725 6.0 17 10 - 20% 4,933,654.85£ 4,933,654.85£ 10 Diversified/Conglomerate Service 02/04/2023 13.67 01/06/2009 8.0 17 2211250 203573 6.0 45 40 - 50% 65,833,333.17£ 12,600,709.17£ 28 Retail Stores 31/12/2012 3.42 1 01/04/2007 3.0 45211251 203578 5.0 7 0 - 10% 19,437,500.00£ 19,437,500.00£ 21 Leisure, Amusement, Entertainment 23/11/2011 2.31 1 01/04/2007 3.0 15211266 200043 5.0 7 0 - 10% 1,780,956.64£ 1,780,956.64£ 5 Buildings and Real Estate 31/10/2009 0.25 01/05/2007 2.1 15211285 203901 3.0 39 30 - 40% 26,229,237.92£ 21,049,652.34£ 6 Chemicals, Plastics and Rubber 29/06/2011 1.91 01/05/2007 2.5 48211350 203890 8.0 18 10 - 20% 310,088.33£ 256,015.26£ 15 Farming and Agriculture 31/10/2009 0.25 2 01/05/2007 6.0 15211357 200440 4.0 16 10 - 20% 1,657,006.17£ 1,657,006.17£ 26 Printing and Publishing 31/10/2009 0.25 01/06/2009 5.0 16211387 203558 2.8 28 20 - 30% 16,333,333.33£ 16,333,333.33£ 4 Beverage, Food and Tobacco 07/11/2010 1.27 01/05/2007 2.5 28211388 203558 2.8 28 20 - 30% 3,333,333.00£ 3,009,659.00£ 4 Beverage, Food and Tobacco 07/11/2010 1.27 01/05/2007 2.5 28211458 200935 7.0 12 10 - 20% 608,278.77£ 608,278.77£ 28 Retail Stores 01/01/2024 14.42 01/05/2007 3.0 15211461 200953 6.0 18 10 - 20% 3,028,573.10£ 3,015,241.26£ 5 Buildings and Real Estate 08/08/2024 15.02 01/05/2007 2.5 17211541 204054 6.0 5 0 - 10% 2,500,000.00£ 2,500,000.00£ 19 Hotels, Motels, Inns and Gaming 31/12/2009 0.42 2 01/06/2009 6.0 5 2211610 201385 2.1 5 0 - 10% 2,232,700.00£ 2,232,700.00£ 5 Buildings and Real Estate 16/03/2016 6.63 01/05/2007 2.1 15211612 200372 6.0 18 10 - 20% 280,000.00£ 280,000.00£ 2 Automobile 29/11/2011 2.33 2 01/05/2007 2.1 28211672 202003 4.0 9 0 - 10% 61,815.69£ 61,815.69£ 19 Hotels, Motels, Inns and Gaming 31/10/2009 0.25 01/09/2008 3.0 10211799 203567 6.0 47 40 - 50% 14,375,439.21£ 12,665,036.24£ 13 Electronics 12/07/2011 1.95 1 01/04/2008 4.0 54211838 203811 7.0 14 10 - 20% 1,154,211.16£ 1,102,000.00£ 25 Personal, Food and Miscellaneous 02/12/2009 0.34 01/05/2007 8.0 15211881 200012 3.0 39 30 - 40% 1,068,750.00£ 1,068,750.00£ 15 Farming and Agriculture 22/02/2014 4.56 01/06/2007 2.1 28211902 200131 3.0 24 20 - 30% 6,057,516.32£ 4,716,900.68£ 5 Buildings and Real Estate 04/06/2022 12.84 01/06/2007 2.1 22211943 200259 4.0 6 0 - 10% 492,703.25£ 492,703.25£ 4 Beverage, Food and Tobacco 01/06/2013 3.83 01/06/2007 2.8 28211980 203645 7.0 45 40 - 50% 950,000.00£ 550,000.00£ 28 Retail Stores 31/12/2018 9.42 2 01/06/2007 4.0 60211981 203645 7.0 45 40 - 50% 885,416.00£ 885,416.00£ 28 Retail Stores 31/03/2012 2.67 2 01/06/2007 4.0 60212013 203651 4.0 11 10 - 20% 386,824.99£ 386,824.99£ 2 Automobile 04/08/2013 4.01 01/06/2007 5.0 15212077 200951 5.0 58 50 - 60% 878,262.93£ 878,262.93£ 18 Home and Office Furnishings, Housewares, and Durable Co 10/05/2012 2.78 01/06/2007 4.0 43212101 201051 3.0 5 0 - 10% 1,461,762.42£ 1,461,762.42£ 28 Retail Stores 01/06/2012 2.83 01/06/2007 2.1 33212200 204091 8.0 17 10 - 20% 582,646.30£ 323,660.76£ 2 Automobile 31/10/2009 0.25 2 01/06/2007 4.0 15212240 203678 8.0 57 50 - 60% 386,926.23£ 384,053.72£ 30 Textiles and Leather 19/06/2013 3.88 3 01/06/2007 4.0 30 2212251 203532 6.0 18 10 - 20% 2,295,000.00£ 2,295,000.00£ 5 Buildings and Real Estate 10/04/2022 12.69 2 01/06/2007 2.1 28 1212302 202064 6.0 81 80 - 90% 1,295,439.85£ 847,488.04£ 18 Home and Office Furnishings, Housewares, and Durable Co 31/10/2009 0.25 01/06/2007 5.0 80212321 203872 7.0 18 10 - 20% 323,993.64£ 157,480.79£ 18 Home and Office Furnishings, Housewares, and Durable Co 31/10/2009 0.25 01/06/2007 4.0 27212351 202303 6.0 14 10 - 20% 848,337.49£ 517,000.00£ 21 Leisure, Amusement, Entertainment 31/10/2009 0.25 01/12/2007 4.0 15212378 203881 4.0 21 20 - 30% 936,971.09£ 579,881.84£ 31 Personal Transportation 31/10/2009 0.25 1 01/06/2007 5.0 48212464 203575 6.0 17 10 - 20% 2,500,000.00£ 2,500,000.00£ 6 Chemicals, Plastics and Rubber 16/06/2010 0.88 2 01/01/2008 4.0 29212489 204006 6.0 34 30 - 40% 5,250,000.00£ 5,250,000.00£ 10 Diversified/Conglomerate Service 13/04/2011 1.70 1 01/06/2007 6.0 41212490 204006 6.0 34 30 - 40% 2,693,679.85£ 2,693,679.85£ 10 Diversified/Conglomerate Service 31/03/2011 1.67 1 01/06/2007 6.0 41212533 204119 3.0 5 0 - 10% 3,312,400.00£ 3,312,400.00£ 5 Buildings and Real Estate 31/08/2015 6.08 01/07/2007 1.8 28212554 200211 4.0 7 0 - 10% 3,474,909.47£ 3,384,386.18£ 5 Buildings and Real Estate 02/07/2018 8.92 01/07/2007 4.0 15212597 200417 3.0 10 0 - 10% 451,915.88£ 451,915.88£ 18 Home and Office Furnishings, Housewares, and Durable Co 03/11/2014 5.26 01/07/2007 1.5 15212607 203557 4.0 39 30 - 40% 25,075,386.82£ 16,141,537.73£ 10 Diversified/Conglomerate Service 14/05/2012 2.79 01/07/2007 2.1 48212655 204026 4.0 5 0 - 10% 427,681.48£ 427,681.48£ 19 Hotels, Motels, Inns and Gaming 02/08/2015 6.00 01/07/2007 3.0 84212659 203939 2.5 5 0 - 10% 768,856.34£ 763,910.90£ 5 Buildings and Real Estate 22/03/2017 7.64 01/07/2007 6.0 15212660 200296 8.0 15 10 - 20% 396,182.63£ 396,182.63£ 28 Retail Stores 01/12/2014 5.33 01/07/2007 5.0 15212661 200689 8.0 12 10 - 20% 410,725.76£ 410,725.76£ 6 Chemicals, Plastics and Rubber 30/08/2018 9.08 01/07/2007 4.0 17 2212680 200783 5.0 17 10 - 20% 518,114.48£ 518,114.48£ 4 Beverage, Food and Tobacco 31/07/2017 8.00 01/07/2007 5.0 15212685 204012 3.0 12 10 - 20% 9,106,886.77£ 8,915,339.29£ 5 Buildings and Real Estate 16/01/2018 8.46 01/07/2007 2.1 16212719 201028 8.0 21 20 - 30% 1,609,400.00£ 1,609,400.00£ 5 Buildings and Real Estate 20/06/2010 0.89 2 01/07/2007 2.1 15
Page 18 of 5730/06/2008

Data By Reference Obligation
Loan Number Borrower Number BBGBarclays Expected LossSeverity (%) Severity Band
Reference Obligation Outstanding Debt
Reference Obligation Notional Amount
Moody's Industry Sector Moody's Industry Sector Maturity Date
Remaining Term(Years) EWL Syndicated
Date of Entry into Pool
BBG Upon PoolEntry BELS Upon Pool Entry EWL Upon Pool Entry
212755 203602 4.0 26 20 - 30% 1,733,980.70£ 1,733,980.70£ 17 Healthcare, Education and Childcare 21/06/2017 7.89 01/07/2007 3.0 39212778 201326 5.0 17 10 - 20% 424,239.85£ 424,239.85£ 23 Mining, Steel, Iron and Non Precious Metals 10/04/2012 2.69 01/07/2007 3.0 20212813 203847 3.0 5 0 - 10% 1,255,882.36£ 1,050,000.00£ 21 Leisure, Amusement, Entertainment 29/01/2017 7.49 01/04/2008 2.1 5212818 201448 5.0 18 10 - 20% 3,250,000.00£ 3,250,000.00£ 19 Hotels, Motels, Inns and Gaming 31/07/2010 1.00 01/07/2007 5.0 15212882 201746 5.0 9 0 - 10% 3,228,620.27£ 3,108,000.00£ 22 Machinery (Non-Agriculture, Non-Construction, Non-Electro 25/07/2010 0.98 01/07/2007 2.8 15212887 201772 8.0 16 10 - 20% 1,723,975.07£ 1,723,975.07£ 19 Hotels, Motels, Inns and Gaming 05/06/2017 7.84 2 01/07/2007 4.0 15212895 203560 3.0 41 40 - 50% 4,702,270.68£ 4,702,270.68£ 5 Buildings and Real Estate 07/06/2012 2.85 Y 01/07/2007 3.0 43212962 203737 6.0 60 50 - 60% 2,000,000.00£ 2,000,000.00£ 33 Broadcasting & Entertainment 31/03/2011 1.67 1 01/07/2007 7.0 28 2212963 203737 6.0 60 50 - 60% 2,000,000.00£ 2,000,000.00£ 33 Broadcasting & Entertainment 31/03/2011 1.67 1 01/07/2007 7.0 28 2213025 202587 6.0 58 50 - 60% 6,367,703.04£ 6,290,000.00£ 5 Buildings and Real Estate 01/12/2009 0.33 2 01/07/2007 6.0 28 1213043 202710 2.5 11 10 - 20% 1,639,000.00£ 1,639,000.00£ 27 Cargo Transport 01/03/2017 7.58 01/07/2007 3.0 15213076 204043 3.0 34 30 - 40% 9,000,000.00£ 9,000,000.00£ 27 Cargo Transport 30/06/2011 1.91 01/06/2009 3.0 34213107 204004 5.0 47 40 - 50% 6,933,797.14£ 6,933,797.14£ 20 Insurance 31/03/2013 3.67 1 01/07/2007 4.0 60213193 200284 4.0 29 20 - 30% 1,208,669.26£ 1,208,669.26£ 18 Home and Office Furnishings, Housewares, and Durable Co 06/08/2015 6.01 01/08/2007 3.0 15213212 200416 4.0 60 50 - 60% 650,000.00£ 650,000.00£ 11 Diversified Natural Resources, Precious 30/08/2012 3.08 01/08/2007 4.0 89213216 200446 3.0 8 0 - 10% 417,779.61£ 212,689.15£ 28 Retail Stores 31/10/2009 0.25 01/10/2008 3.0 14213275 200670 5.0 12 10 - 20% 2,850,000.00£ 2,772,000.00£ 5 Buildings and Real Estate 21/12/2009 0.39 01/08/2007 5.0 15213281 200694 2.1 13 10 - 20% 2,800,000.00£ 2,800,000.00£ 5 Buildings and Real Estate 31/10/2009 0.25 01/08/2007 3.0 28213300 200768 2.8 11 10 - 20% 5,002,500.00£ 5,002,500.00£ 5 Buildings and Real Estate 10/08/2012 3.03 01/08/2007 3.0 15213454 203849 4.0 50 40 - 50% 3,825,771.74£ 3,825,771.74£ 25 Personal, Food and Miscellaneous 31/10/2009 0.25 01/06/2009 6.0 50213457 201504 5.0 59 50 - 60% 450,000.00£ 450,000.00£ 4 Beverage, Food and Tobacco 20/08/2013 4.05 01/08/2007 4.0 51213458 200161 2.8 18 10 - 20% 2,500,000.00£ 2,500,000.00£ 5 Buildings and Real Estate 26/04/2013 3.74 01/08/2007 2.5 28213481 204033 8.0 38 30 - 40% 850,000.00£ 850,000.00£ 17 Healthcare, Education and Childcare 30/11/2009 0.33 2 01/08/2007 4.0 39 2213544 202032 8.0 21 20 - 30% 1,352,392.13£ 1,352,392.13£ 18 Home and Office Furnishings, Housewares, and Durable Co 01/06/2019 9.83 1 01/08/2007 3.0 43213549 203870 6.0 18 10 - 20% 1,508,845.89£ 1,508,845.89£ 13 Electronics 29/08/2015 6.08 01/08/2007 2.1 15213571 202135 5.0 19 10 - 20% 452,298.94£ 452,298.94£ 28 Retail Stores 30/06/2019 9.91 01/08/2007 3.0 39213589 202243 3.0 15 10 - 20% 1,212,052.67£ 1,212,052.67£ 28 Retail Stores 29/08/2017 8.08 01/08/2007 2.5 15213590 202243 3.0 15 10 - 20% 1,254,851.67£ 1,254,851.67£ 28 Retail Stores 20/08/2017 8.05 01/08/2007 2.5 15213607 202369 6.0 17 10 - 20% 8,495,000.00£ 8,495,000.00£ 5 Buildings and Real Estate 22/08/2012 3.06 2 01/08/2007 3.0 15213624 204125 6.0 36 30 - 40% 2,698,040.81£ 2,664,000.00£ 5 Buildings and Real Estate 01/12/2009 0.33 2 01/08/2007 6.0 28 1213652 202700 5.0 14 10 - 20% 2,452,900.00£ 2,452,900.00£ 5 Buildings and Real Estate 31/10/2009 0.25 1 01/06/2009 5.0 17 1213691 204771 4.0 8 0 - 10% 36,066,670.54£ 24,500,000.00£ 19 Hotels, Motels, Inns and Gaming 25/05/2012 2.82 Y 01/08/2007 3.0 22213723 203580 8.0 56 50 - 60% 9,609,537.90£ 7,965,594.89£ 29 Telecommunications 31/12/2011 2.42 2 01/05/2008 7.0 75 2213724 203580 8.0 56 50 - 60% 12,122,501.63£ 11,695,300.34£ 29 Telecommunications 31/12/2011 2.42 2 01/10/2008 7.0 75 2213757 200136 6.0 13 10 - 20% 4,453,000.00£ 4,453,000.00£ 19 Hotels, Motels, Inns and Gaming 27/09/2010 1.16 2 01/06/2009 6.0 13 2213769 200173 4.0 8 0 - 10% 650,523.56£ 650,523.56£ 25 Personal, Food and Miscellaneous 12/09/2012 3.11 01/09/2007 2.1 15213771 203906 4.0 8 0 - 10% 1,478,562.78£ 1,478,562.78£ 5 Buildings and Real Estate 27/04/2017 7.74 01/09/2007 2.1 15213773 200186 8.0 17 10 - 20% 1,249,914.31£ 1,074,225.37£ 17 Healthcare, Education and Childcare 27/06/2022 12.91 2 01/10/2007 4.0 15213775 200190 2.8 16 10 - 20% 670,335.77£ 670,335.77£ 5 Buildings and Real Estate 31/10/2009 0.25 01/09/2007 4.0 15213804 200284 4.0 29 20 - 30% 1,289,645.15£ 1,289,645.15£ 18 Home and Office Furnishings, Housewares, and Durable Co 15/05/2022 12.79 01/09/2007 2.1 15213806 203929 7.0 13 10 - 20% 691,844.12£ 363,866.18£ 22 Machinery (Non-Agriculture, Non-Construction, Non-Electro 31/10/2009 0.25 01/09/2007 3.0 27213816 200363 8.0 18 10 - 20% 1,010,848.07£ 1,010,848.07£ 10 Diversified/Conglomerate Service 24/02/2018 8.56 2 01/09/2007 6.0 15213823 200399 5.0 9 0 - 10% 2,202,332.33£ 2,202,332.33£ 22 Machinery (Non-Agriculture, Non-Construction, Non-Electro 11/04/2022 12.69 01/09/2007 3.0 29213837 200485 7.0 53 50 - 60% 3,964,116.30£ 2,784,231.23£ 21 Leisure, Amusement, Entertainment 31/08/2009 0.08 3 01/07/2008 6.0 43 2213883 200682 6.0 13 10 - 20% 117,460.19£ 117,460.19£ 10 Diversified/Conglomerate Service 30/10/2009 0.25 2 01/09/2007 3.0 28213884 200682 6.0 13 10 - 20% 953,556.32£ 953,556.32£ 10 Diversified/Conglomerate Service 07/10/2016 7.18 2 01/09/2007 3.0 28213906 200813 2.5 8 0 - 10% 1,952,422.03£ 1,952,422.03£ 5 Buildings and Real Estate 03/04/2017 7.67 01/09/2007 2.1 15213914 200867 3.0 13 10 - 20% 2,850,000.00£ 2,850,000.00£ 5 Buildings and Real Estate 28/09/2010 1.16 01/09/2007 4.0 15213921 203514 7.0 28 20 - 30% 1,645,760.32£ 1,645,760.32£ 22 Machinery (Non-Agriculture, Non-Construction, Non-Electro 31/10/2009 0.25 2 01/06/2009 7.0 28 2213941 200992 4.0 19 10 - 20% 7,078,280.91£ 6,873,280.91£ 5 Buildings and Real Estate 24/05/2010 0.81 01/09/2007 3.0 15213943 200999 6.0 44 40 - 50% 900,000.00£ 900,000.00£ 28 Retail Stores 10/12/2017 8.36 2 01/09/2007 3.0 50213975 201137 8.0 23 20 - 30% 174,696.68£ 1,618.81£ 23 Mining, Steel, Iron and Non Precious Metals 31/10/2009 0.25 2 01/09/2007 2.1 15213983 204123 2.1 13 10 - 20% 1,970,000.00£ 1,970,000.00£ 5 Buildings and Real Estate 31/01/2014 4.50 01/09/2007 2.1 16214047 200903 4.0 5 0 - 10% 1,762,500.00£ 1,762,500.00£ 10 Diversified/Conglomerate Service 01/08/2010 1.00 01/09/2007 2.1 28214064 201465 5.0 36 30 - 40% 476,900.43£ 476,900.43£ 22 Machinery (Non-Agriculture, Non-Construction, Non-Electro 18/02/2022 12.55 01/09/2007 3.0 56214078 201511 4.0 15 10 - 20% 2,115,384.60£ 2,115,384.60£ 5 Buildings and Real Estate 31/03/2022 12.67 01/09/2007 2.1 15214081 201533 3.0 20 10 - 20% 2,260,400.00£ 2,260,400.00£ 5 Buildings and Real Estate 25/05/2010 0.82 01/09/2007 2.1 15214088 201564 6.0 24 20 - 30% 1,030,055.36£ 931,613.29£ 23 Mining, Steel, Iron and Non Precious Metals 02/01/2022 12.42 01/09/2007 4.0 26214096 203676 4.0 20 10 - 20% 517,118.23£ 144,315.58£ 27 Cargo Transport 31/10/2009 0.25 01/09/2007 2.8 15214097 201630 5.0 17 10 - 20% 461,531.17£ 461,531.17£ 10 Diversified/Conglomerate Service 16/11/2021 12.29 01/09/2007 4.0 15214098 201630 5.0 17 10 - 20% 623,261.28£ 623,261.28£ 10 Diversified/Conglomerate Service 12/07/2020 10.95 01/09/2007 4.0 15214099 201630 5.0 17 10 - 20% 772,376.79£ 772,376.79£ 10 Diversified/Conglomerate Service 21/08/2021 12.06 01/09/2007 4.0 15214115 201743 3.0 12 10 - 20% 1,701,722.04£ 1,701,722.04£ 5 Buildings and Real Estate 31/10/2009 0.25 01/09/2007 4.0 15214130 201871 5.0 11 10 - 20% 970,265.37£ 916,665.75£ 21 Leisure, Amusement, Entertainment 28/10/2019 10.24 01/09/2007 2.5 15214153 201971 6.0 14 10 - 20% 860,909.72£ 860,909.72£ 19 Hotels, Motels, Inns and Gaming 05/06/2022 12.84 01/09/2007 4.0 15214157 202015 4.0 25 20 - 30% 467,953.36£ 467,953.36£ 28 Retail Stores 21/03/2022 12.64 01/09/2007 2.1 27214172 203785 6.0 13 10 - 20% 1,524,608.33£ 1,469,344.15£ 17 Healthcare, Education and Childcare 22/02/2023 13.56 01/09/2007 6.0 15214186 202137 6.0 26 20 - 30% 1,500,885.74£ 1,423,717.93£ 12 Ecological 07/02/2023 13.52 01/09/2007 2.1 16214190 202159 2.8 10 0 - 10% 2,200,000.00£ 2,200,000.00£ 5 Buildings and Real Estate 15/12/2011 2.37 01/09/2007 4.0 15214193 203736 7.0 25 20 - 30% 1,350,000.00£ 1,350,000.00£ 17 Healthcare, Education and Childcare 31/05/2022 12.83 01/09/2007 4.0 23214219 202426 6.0 56 50 - 60% 4,753,992.88£ 4,753,992.88£ 17 Healthcare, Education and Childcare 31/12/2011 2.42 1 01/09/2007 3.0 60214220 202426 6.0 56 50 - 60% 1,313,268.70£ 1,313,268.70£ 17 Healthcare, Education and Childcare 31/12/2011 2.42 1 01/09/2007 3.0 60214221 202426 6.0 56 50 - 60% 8,083,281.04£ 8,083,281.04£ 17 Healthcare, Education and Childcare 31/12/2011 2.42 1 01/06/2009 6.0 56 1214222 202433 4.0 10 0 - 10% 1,432,677.90£ 1,432,677.90£ 16 Grocery 10/02/2020 10.53 01/09/2007 2.1 28214238 204772 6.0 35 30 - 40% 863,656.19£ 863,656.19£ 18 Home and Office Furnishings, Housewares, and Durable Co 19/08/2019 10.05 2 01/09/2007 3.0 60214242 202593 3.0 15 10 - 20% 1,467,252.79£ 1,467,252.79£ 5 Buildings and Real Estate 17/10/2013 4.21 01/09/2007 2.1 15214250 202670 7.0 10 0 - 10% 1,965,646.87£ 1,965,646.87£ 27 Cargo Transport 21/01/2020 10.47 01/09/2007 6.0 15214267 203567 6.0 47 40 - 50% 5,194,444.44£ 2,207,869.69£ 13 Electronics 12/07/2011 1.95 1 01/09/2008 4.0 54214272 202917 5.0 22 20 - 30% 1,521,000.00£ 1,521,000.00£ 30 Textiles and Leather 14/10/2019 10.20 01/09/2007 4.0 23214274 202940 6.0 43 40 - 50% 720,927.71£ 632,469.22£ 17 Healthcare, Education and Childcare 25/01/2021 11.48 01/09/2007 4.0 58214297 203177 4.0 16 10 - 20% 464,954.49£ 464,954.49£ 6 Chemicals, Plastics and Rubber 29/09/2014 5.16 01/09/2007 3.0 15214304 203251 6.0 11 10 - 20% 2,303,664.06£ 2,100,315.00£ 5 Buildings and Real Estate 31/10/2009 0.25 01/09/2007 3.0 5214314 203443 6.0 19 10 - 20% 1,946,287.84£ 1,946,287.84£ 2 Automobile 27/10/2015 6.24 2 01/09/2007 3.0 28
Page 19 of 5730/06/2008

Data By Reference Obligation
Loan Number Borrower Number BBGBarclays Expected LossSeverity (%) Severity Band
Reference Obligation Outstanding Debt
Reference Obligation Notional Amount
Moody's Industry Sector Moody's Industry Sector Maturity Date
Remaining Term(Years) EWL Syndicated
Date of Entry into Pool
BBG Upon PoolEntry BELS Upon Pool Entry EWL Upon Pool Entry
214317 203723 7.0 22 20 - 30% 1,429,863.32£ 1,302,800.00£ 25 Personal, Food and Miscellaneous 30/06/2022 12.91 01/09/2007 4.0 29214320 203886 4.0 28 20 - 30% 1,400,000.00£ 1,400,000.00£ 5 Buildings and Real Estate 31/10/2009 0.25 01/09/2007 3.0 28214332 200025 5.0 51 50 - 60% 2,200,000.00£ 2,200,000.00£ 10 Diversified/Conglomerate Service 30/04/2011 1.75 01/10/2007 2.5 57214347 204156 4.0 6 0 - 10% 548,258.39£ 201,928.39£ 18 Home and Office Furnishings, Housewares, and Durable Co 31/10/2009 0.25 01/10/2007 5.0 20214348 204128 5.0 13 10 - 20% 4,595,786.72£ 4,476,792.31£ 5 Buildings and Real Estate 26/03/2023 13.65 01/10/2007 3.0 15214363 204186 8.0 25 20 - 30% 463,461.40£ 463,461.40£ 33 Broadcasting & Entertainment 04/10/2012 3.18 2 01/10/2007 3.0 39214440 204209 4.0 48 40 - 50% 69,675,000.00£ 24,500,000.00£ 5 Buildings and Real Estate 15/12/2014 5.37 01/10/2007 3.0 48214447 200571 6.0 21 20 - 30% 1,137,500.00£ 1,137,500.00£ 26 Printing and Publishing 18/10/2012 3.21 01/10/2007 6.0 15214459 203826 4.0 12 10 - 20% 355,635.61£ 262,692.91£ 28 Retail Stores 31/10/2009 0.25 01/10/2007 2.5 15214473 204140 4.0 14 10 - 20% 325,440.15£ 325,440.15£ 19 Hotels, Motels, Inns and Gaming 17/08/2011 2.04 01/10/2007 5.0 15214478 200718 2.1 16 10 - 20% 1,800,700.00£ 1,800,700.00£ 13 Electronics 31/08/2012 3.08 01/10/2007 4.0 15214588 204189 4.0 10 0 - 10% 382,546.20£ 380,089.50£ 10 Diversified/Conglomerate Service 09/11/2013 4.27 01/10/2007 2.5 15214614 204190 5.0 9 0 - 10% 367,750.21£ 367,750.21£ 30 Textiles and Leather 24/11/2011 2.31 01/10/2007 6.0 15214637 204203 8.0 15 10 - 20% 1,424,471.49£ 1,421,671.49£ 5 Buildings and Real Estate 31/10/2009 0.25 3 01/10/2007 3.0 15214659 204191 4.0 6 0 - 10% 454,507.95£ 417,004.19£ 29 Telecommunications 12/07/2012 2.95 01/10/2007 2.1 100214666 201597 6.0 17 10 - 20% 1,000,000.00£ 1,000,000.00£ 2 Automobile 31/10/2009 0.25 01/10/2007 4.0 28214667 201612 6.0 58 50 - 60% 1,521,108.09£ 1,521,108.09£ 22 Machinery (Non-Agriculture, Non-Construction, Non-Electro 31/10/2009 0.25 2 01/06/2009 6.0 58 2214675 201659 8.0 21 20 - 30% 696,926.84£ 485,461.31£ 22 Machinery (Non-Agriculture, Non-Construction, Non-Electro 31/10/2009 0.25 2 01/10/2007 5.0 35214720 204164 2.1 19 10 - 20% 617,560.16£ 154,150.25£ 15 Farming and Agriculture 31/10/2009 0.25 01/10/2007 1.5 15214743 204141 4.0 82 80 - 90% 3,542,742.43£ 3,498,404.79£ 5 Buildings and Real Estate 06/05/2019 9.76 01/10/2007 4.0 17214762 204169 7.0 5 0 - 10% 301,275.00£ 301,275.00£ 10 Diversified/Conglomerate Service 30/06/2010 0.91 01/10/2007 6.0 94 1214777 204172 6.0 81 80 - 90% 412,500.00£ 412,500.00£ 17 Healthcare, Education and Childcare 09/01/2012 2.44 01/10/2007 7.0 80 2214784 204132 5.0 12 10 - 20% 3,235,288.00£ 2,897,056.00£ 5 Buildings and Real Estate 03/03/2023 13.59 01/10/2007 3.0 15214807 204134 1.8 13 10 - 20% 4,325,180.60£ 4,325,180.60£ 5 Buildings and Real Estate 05/08/2020 11.01 01/10/2007 6.0 15214871 204204 4.0 7 0 - 10% 483,323.96£ 483,323.96£ 5 Buildings and Real Estate 08/12/2009 0.35 01/10/2007 3.0 15214895 203237 7.0 15 10 - 20% 2,408,922.90£ 2,408,922.90£ 17 Healthcare, Education and Childcare 30/03/2011 1.66 01/10/2007 5.0 15214912 204211 4.0 15 10 - 20% 4,965,111.02£ 4,965,111.02£ 19 Hotels, Motels, Inns and Gaming 31/12/2022 13.42 01/10/2007 4.0 15214964 200108 6.0 15 10 - 20% 5,999,999.20£ 3,988,892.70£ 5 Buildings and Real Estate 31/10/2009 0.25 2 01/11/2007 3.0 27215020 203751 3.0 41 40 - 50% 583,578.19£ 580,622.91£ 17 Healthcare, Education and Childcare 13/11/2010 1.28 01/11/2007 2.1 39215024 204232 5.0 12 10 - 20% 485,194.94£ 485,194.94£ 18 Home and Office Furnishings, Housewares, and Durable Co 24/03/2014 4.65 01/11/2007 2.5 15215042 204314 4.0 24 20 - 30% 3,255,000.00£ 3,255,000.00£ 15 Farming and Agriculture 31/12/2010 1.42 01/11/2007 2.1 15215070 200552 3.0 12 10 - 20% 263,963.50£ 260,000.00£ 18 Home and Office Furnishings, Housewares, and Durable Co 10/11/2010 1.28 01/11/2007 2.1 17215088 204234 3.0 23 20 - 30% 445,254.18£ 445,254.18£ 2 Automobile 24/06/2014 4.90 01/11/2007 2.1 15215101 204283 2.1 10 0 - 10% 660,569.63£ 630,594.04£ 17 Healthcare, Education and Childcare 27/01/2015 5.49 01/11/2007 2.1 10215122 204286 1.5 28 20 - 30% 629,871.09£ 629,871.09£ 17 Healthcare, Education and Childcare 20/07/2020 10.97 01/11/2007 3.0 28215123 204286 1.5 28 20 - 30% 3,223,457.91£ 3,003,329.00£ 17 Healthcare, Education and Childcare 20/07/2020 10.97 01/11/2007 3.0 28215127 204288 5.0 10 0 - 10% 410,980.08£ 410,980.08£ 28 Retail Stores 05/12/2015 6.34 01/11/2007 4.0 15215158 204316 2.8 19 10 - 20% 3,700,000.00£ 3,700,000.00£ 15 Farming and Agriculture 01/09/2013 4.08 01/11/2007 2.8 15215159 204316 2.8 19 10 - 20% 850,000.00£ 850,000.00£ 15 Farming and Agriculture 01/09/2013 4.08 01/11/2007 2.8 15215210 204236 7.0 25 20 - 30% 298,881.15£ 60,594.77£ 13 Electronics 31/10/2009 0.25 01/11/2007 6.0 30 2215240 203667 9.0 27 20 - 30% 802,276.68£ 787,301.99£ 26 Printing and Publishing 01/11/2008 0.00 01/11/2007 7.0 27215241 201249 6.0 70 60 - 70% 1,050,000.00£ 1,050,000.00£ 28 Retail Stores 28/04/2011 1.74 2 01/11/2007 2.5 60215243 200313 6.0 6 0 - 10% 553,256.28£ 550,561.34£ 13 Electronics 22/08/2012 3.06 01/11/2007 5.0 28215272 203845 3.0 20 10 - 20% 500,000.00£ 500,000.00£ 25 Personal, Food and Miscellaneous 29/08/2011 2.08 01/11/2007 2.1 29215285 204298 6.0 43 40 - 50% 9,999.22£ 9,999.22£ 24 Oil and Gas 31/10/2009 0.25 01/11/2007 5.0 67215322 204224 8.0 15 10 - 20% 1,427,700.00£ 1,427,700.00£ 5 Buildings and Real Estate 31/10/2009 0.25 3 01/11/2007 2.1 15215342 204300 6.0 35 30 - 40% 550,000.00£ 550,000.00£ 22 Machinery (Non-Agriculture, Non-Construction, Non-Electro 07/02/2012 2.52 2 01/11/2007 4.0 25215350 204301 4.0 6 0 - 10% 263,193.59£ 263,193.59£ 24 Oil and Gas 16/12/2015 6.38 01/12/2007 4.0 28215357 204311 6.0 35 30 - 40% 3,632,555.78£ 1,677,529.15£ 8 Personal and Non Durable Consumer Products (Manufactu 31/07/2010 1.00 2 01/11/2007 5.0 46 1215377 201916 4.0 45 40 - 50% 977,091.40£ 977,091.40£ 30 Textiles and Leather 15/11/2011 2.29 01/11/2007 3.0 32215400 202057 7.0 17 10 - 20% 277,271.31£ 277,271.31£ 21 Leisure, Amusement, Entertainment 31/10/2009 0.25 01/10/2008 6.0 9215418 202135 5.0 19 10 - 20% 366,903.78£ 363,815.87£ 28 Retail Stores 13/11/2012 3.28 01/11/2007 3.0 39215426 204312 8.0 11 10 - 20% 7,100,000.00£ 7,000,000.00£ 19 Hotels, Motels, Inns and Gaming 31/10/2009 0.25 2 01/11/2007 4.0 15215444 202303 6.0 14 10 - 20% 944,902.00£ 901,067.59£ 21 Leisure, Amusement, Entertainment 30/06/2013 3.91 01/11/2007 3.0 15215471 204242 7.0 22 20 - 30% 428,093.23£ 428,093.23£ 31 Personal Transportation 26/10/2014 5.24 01/11/2007 6.0 19215523 204135 4.0 14 10 - 20% 5,416,666.70£ 5,416,666.70£ 28 Retail Stores 26/02/2021 11.57 01/11/2007 4.0 15215554 203014 7.0 7 0 - 10% 2,321,080.00£ 2,321,080.00£ 21 Leisure, Amusement, Entertainment 30/03/2012 2.66 2 01/11/2007 5.0 15215571 204229 6.0 75 70 - 80% 1,700,000.00£ 1,700,000.00£ 9 Diversified/Conglomerate Manufacturing 28/04/2011 1.74 1 01/11/2007 7.0 60 2215572 202587 6.0 44 40 - 50% 1,618,145.71£ 1,598,400.00£ 5 Buildings and Real Estate 01/12/2009 0.33 2 01/11/2007 5.0 28 1215574 202587 6.0 44 40 - 50% 4,696,540.13£ 4,633,962.59£ 5 Buildings and Real Estate 01/12/2009 0.33 2 01/11/2007 5.0 28 1215585 204307 7.0 7 0 - 10% 641,112.13£ 641,112.13£ 25 Personal, Food and Miscellaneous 23/11/2015 6.31 01/11/2007 6.0 15215589 204320 4.0 53 50 - 60% 1,400,000.00£ 1,400,000.00£ 28 Retail Stores 18/02/2011 1.55 2 01/11/2007 8.0 60215592 204225 8.0 14 10 - 20% 1,305,000.00£ 1,305,000.00£ 21 Leisure, Amusement, Entertainment 30/12/2011 2.41 01/11/2007 6.0 15215622 204261 4.0 13 10 - 20% 668,925.03£ 668,925.03£ 2 Automobile 20/10/2021 12.22 01/12/2007 3.0 36215623 204227 6.0 21 20 - 30% 1,392,119.11£ 1,392,119.11£ 28 Retail Stores 10/07/2019 9.94 01/12/2007 6.0 15215626 200040 4.0 14 10 - 20% 528,301.88£ 528,301.88£ 21 Leisure, Amusement, Entertainment 24/02/2018 8.56 01/12/2007 4.0 15215627 200040 4.0 14 10 - 20% 676,242.28£ 676,242.28£ 21 Leisure, Amusement, Entertainment 30/08/2022 13.08 01/12/2007 4.0 15215634 200071 5.0 16 10 - 20% 549,849.92£ 549,849.92£ 12 Ecological 30/05/2017 7.83 01/12/2007 2.8 16215638 204245 3.0 15 10 - 20% 6,098,320.00£ 6,098,320.00£ 5 Buildings and Real Estate 18/12/2009 0.38 01/12/2007 2.1 19215655 200148 4.0 22 20 - 30% 993,856.71£ 984,306.07£ 25 Personal, Food and Miscellaneous 17/09/2022 13.13 01/12/2007 4.0 26215659 200168 5.0 6 0 - 10% 1,452,366.66£ 1,191,172.01£ 25 Personal, Food and Miscellaneous 30/07/2022 13.00 01/12/2007 2.8 15215681 204271 6.0 6 0 - 10% 722,470.69£ 722,470.69£ 12 Ecological 04/08/2021 12.01 01/12/2007 2.8 15215682 204214 8.0 11 10 - 20% 5,568,000.00£ 5,568,000.00£ 5 Buildings and Real Estate 31/10/2009 0.25 2 01/12/2007 5.0 15215695 204335 5.0 8 0 - 10% 206,813.44£ 8,411.20£ 2 Automobile 31/10/2009 0.25 01/12/2007 3.0 15215700 203751 3.0 41 40 - 50% 1,558,626.17£ 1,551,307.53£ 17 Healthcare, Education and Childcare 13/11/2017 8.28 01/12/2007 2.1 39215705 204362 5.0 33 30 - 40% 498,460.10£ 498,460.10£ 10 Diversified/Conglomerate Service 29/09/2016 7.16 01/12/2007 4.0 36215715 203598 7.0 9 0 - 10% 1,002,900.00£ 1,002,900.00£ 28 Retail Stores 31/10/2017 8.25 01/12/2007 2.1 15215769 200602 7.0 13 10 - 20% 4,500,000.00£ 4,500,000.00£ 2 Automobile 05/07/2022 12.93 01/12/2007 3.0 15215771 204281 8.0 26 20 - 30% 676,388.46£ 643,384.35£ 10 Diversified/Conglomerate Service 22/11/2017 8.31 01/12/2007 7.0 15215772 203756 6.0 35 30 - 40% 530,250.00£ 530,250.00£ 10 Diversified/Conglomerate Service 13/12/2009 0.37 2 01/12/2007 2.8 15215777 200625 3.0 20 10 - 20% 2,816,106.02£ 2,816,106.02£ 2 Automobile 28/06/2022 12.91 01/12/2007 2.1 24215804 204338 5.0 7 0 - 10% 822,057.55£ 569,432.79£ 12 Ecological 31/10/2009 0.25 01/12/2007 4.0 15215805 204287 5.0 17 10 - 20% 589,902.02£ 589,902.02£ 18 Home and Office Furnishings, Housewares, and Durable Co 31/08/2018 9.08 01/12/2007 4.0 29
Page 20 of 5730/06/2008

Data By Reference Obligation
Loan Number Borrower Number BBGBarclays Expected LossSeverity (%) Severity Band
Reference Obligation Outstanding Debt
Reference Obligation Notional Amount
Moody's Industry Sector Moody's Industry Sector Maturity Date
Remaining Term(Years) EWL Syndicated
Date of Entry into Pool
BBG Upon PoolEntry BELS Upon Pool Entry EWL Upon Pool Entry
215810 203589 6.0 12 10 - 20% 349,576.37£ 349,576.37£ 22 Machinery (Non-Agriculture, Non-Construction, Non-Electro 21/12/2012 3.39 01/12/2007 6.0 74215821 200854 4.0 53 50 - 60% 1,212,358.62£ 1,212,358.62£ 10 Diversified/Conglomerate Service 19/12/2010 1.38 2 01/12/2007 2.5 35215834 204363 2.5 11 10 - 20% 629,066.84£ 629,066.84£ 5 Buildings and Real Estate 12/05/2016 6.78 01/12/2007 2.1 15215844 204346 5.0 18 10 - 20% 501,261.89£ 501,261.89£ 23 Mining, Steel, Iron and Non Precious Metals 18/04/2011 1.71 01/12/2007 4.0 15215848 204364 4.0 11 10 - 20% 580,433.44£ 580,433.44£ 28 Retail Stores 17/08/2016 7.04 01/12/2007 2.5 15215882 204357 5.0 26 20 - 30% 548,149.38£ 548,149.38£ 26 Printing and Publishing 20/03/2016 6.64 01/12/2007 4.0 22215907 204365 6.0 14 10 - 20% 459,909.16£ 459,909.16£ 17 Healthcare, Education and Childcare 05/10/2016 7.18 01/12/2007 2.1 15215927 201263 6.0 59 50 - 60% 410,000.00£ 410,000.00£ 17 Healthcare, Education and Childcare 17/12/2012 3.38 01/12/2007 3.0 39215930 204030 4.0 19 10 - 20% 685,823.83£ 685,823.83£ 22 Machinery (Non-Agriculture, Non-Construction, Non-Electro 27/07/2016 6.99 01/12/2007 4.0 21215939 204366 8.0 16 10 - 20% 520,265.36£ 520,265.36£ 2 Automobile 16/11/2016 7.29 2 01/12/2007 4.0 28 2215959 201387 3.0 19 10 - 20% 280,106.79£ 250,077.05£ 10 Diversified/Conglomerate Service 31/10/2009 0.25 01/12/2007 2.5 15215976 204367 3.0 27 20 - 30% 472,500.00£ 472,500.00£ 24 Oil and Gas 30/11/2016 7.33 01/12/2007 1.8 15215986 203605 7.0 26 20 - 30% 914,042.00£ 914,042.00£ 13 Electronics 23/04/2019 9.73 2 01/12/2007 2.8 45 2215992 201561 4.0 9 0 - 10% 764,778.96£ 764,778.96£ 25 Personal, Food and Miscellaneous 29/10/2022 13.24 01/12/2007 2.5 15216005 201596 8.0 17 10 - 20% 536,214.56£ 310,644.88£ 2 Automobile 31/10/2009 0.25 2 01/12/2007 4.0 15216009 204239 8.0 22 20 - 30% 557,915.88£ 557,915.88£ 13 Electronics 23/10/2016 7.23 2 01/12/2007 5.0 15216010 203676 4.0 20 10 - 20% 1,350,000.00£ 1,350,000.00£ 27 Cargo Transport 08/10/2017 8.19 01/12/2007 2.1 37216024 201726 6.0 13 10 - 20% 1,501,228.93£ 1,501,228.93£ 16 Grocery 05/10/2022 13.18 01/12/2007 5.0 28 2216028 204220 6.0 10 0 - 10% 938,233.48£ 938,233.48£ 17 Healthcare, Education and Childcare 15/07/2018 8.96 01/12/2007 4.0 15216049 204353 5.0 19 10 - 20% 116,392.23£ 116,392.23£ 28 Retail Stores 31/10/2009 0.25 01/12/2007 3.0 23 2216066 204360 6.0 14 10 - 20% 544,582.11£ 544,582.11£ 19 Hotels, Motels, Inns and Gaming 27/04/2016 6.74 2 01/12/2007 4.0 15216067 204360 6.0 14 10 - 20% 544,582.11£ 544,582.11£ 19 Hotels, Motels, Inns and Gaming 27/04/2016 6.74 2 01/12/2007 4.0 15216076 203781 8.0 15 10 - 20% 380,228.78£ 380,228.78£ 18 Home and Office Furnishings, Housewares, and Durable Co 03/03/2014 4.59 2 01/12/2007 2.8 15216079 204228 4.0 12 10 - 20% 887,337.21£ 887,337.21£ 17 Healthcare, Education and Childcare 31/08/2019 10.08 01/12/2007 2.1 15216088 202058 6.0 17 10 - 20% 2,285,554.54£ 2,165,636.71£ 10 Diversified/Conglomerate Service 31/10/2009 0.25 01/12/2007 6.0 15216090 204350 6.0 46 40 - 50% 513,095.68£ 349,075.55£ 2 Automobile 31/10/2009 0.25 01/12/2007 6.0 50216103 204130 5.0 16 10 - 20% 1,734,599.51£ 1,734,599.51£ 17 Healthcare, Education and Childcare 29/11/2019 10.33 01/12/2007 3.0 40216104 204130 5.0 16 10 - 20% 1,089,883.27£ 1,089,883.27£ 17 Healthcare, Education and Childcare 21/11/2018 9.31 01/12/2007 3.0 40216114 202198 4.0 9 0 - 10% 876,227.99£ 876,227.99£ 17 Healthcare, Education and Childcare 23/10/2022 13.23 01/12/2007 3.0 15216145 202393 5.0 17 10 - 20% 1,483,850.18£ 1,000,000.00£ 19 Hotels, Motels, Inns and Gaming 20/12/2022 13.39 01/12/2007 3.0 15216165 202488 7.0 43 40 - 50% 3,284,134.74£ 3,284,134.74£ 3 Banking 31/10/2009 0.25 2 01/06/2009 7.0 43 2216216 204369 6.0 82 80 - 90% 1,205,547.91£ 1,205,547.91£ 10 Diversified/Conglomerate Service 01/08/2016 7.00 01/12/2007 4.0 54216218 204223 8.0 12 10 - 20% 1,026,875.05£ 1,026,875.05£ 19 Hotels, Motels, Inns and Gaming 01/07/2019 9.92 1 01/12/2007 6.0 15216219 204223 8.0 12 10 - 20% 955,397.46£ 954,450.00£ 19 Hotels, Motels, Inns and Gaming 02/11/2022 13.25 1 01/12/2007 6.0 15216239 202962 4.0 19 10 - 20% 400,000.00£ 400,000.00£ 5 Buildings and Real Estate 31/10/2009 0.25 01/12/2007 3.0 56216240 202962 4.0 19 10 - 20% 535,000.00£ 535,000.00£ 5 Buildings and Real Estate 31/10/2009 0.25 01/12/2007 3.0 56216241 202962 4.0 19 10 - 20% 622,500.00£ 622,500.00£ 5 Buildings and Real Estate 31/10/2009 0.25 01/12/2007 3.0 56216242 202962 4.0 19 10 - 20% 640,000.00£ 640,000.00£ 5 Buildings and Real Estate 31/10/2009 0.25 01/12/2007 3.0 56216248 203031 6.0 30 20 - 30% 3,335,594.26£ 3,335,594.26£ 30 Textiles and Leather 31/10/2009 0.25 2 01/06/2009 6.0 30 2216249 203031 6.0 30 20 - 30% 2,483,534.69£ 2,483,534.69£ 30 Textiles and Leather 26/11/2019 10.32 2 01/12/2007 3.0 44216268 204343 8.0 69 60 - 70% 535,066.92£ 368,278.13£ 10 Diversified/Conglomerate Service 31/10/2009 0.25 01/12/2007 6.0 75216270 202587 6.0 44 40 - 50% 962,078.57£ 946,037.41£ 5 Buildings and Real Estate 01/12/2009 0.33 2 01/12/2007 5.0 28 1216281 202788 8.0 22 20 - 30% 1,823,125.01£ 1,823,125.01£ 5 Buildings and Real Estate 31/10/2009 0.25 2 01/06/2009 7.0 22 2216287 204361 7.0 13 10 - 20% 550,086.10£ 534,391.32£ 27 Cargo Transport 21/12/2015 6.39 01/12/2007 8.0 15 2216292 204145 6.0 19 10 - 20% 2,457,056.77£ 2,457,056.77£ 19 Hotels, Motels, Inns and Gaming 01/06/2024 14.83 01/12/2007 4.0 15216293 204145 6.0 19 10 - 20% 2,464,948.71£ 2,464,948.71£ 19 Hotels, Motels, Inns and Gaming 01/06/2024 14.83 01/12/2007 4.0 15216294 204145 6.0 19 10 - 20% 2,727,000.00£ 2,727,000.00£ 19 Hotels, Motels, Inns and Gaming 20/07/2022 12.97 01/12/2007 4.0 15216304 203579 3.0 34 30 - 40% 13,713,333.00£ 2,541,038.27£ 10 Diversified/Conglomerate Service 31/08/2012 3.08 01/10/2008 2.1 35216310 204010 5.0 12 10 - 20% 1,500,000.02£ 1,500,000.02£ 8 Personal and Non Durable Consumer Products (Manufactu 31/12/2013 4.42 1 01/12/2007 4.0 28216311 204371 6.0 15 10 - 20% 702,776.31£ 702,776.31£ 2 Automobile 10/12/2016 7.36 01/12/2007 5.0 20216315 204216 8.0 14 10 - 20% 3,817,937.59£ 3,526,644.50£ 10 Diversified/Conglomerate Service 30/03/2022 12.66 01/12/2007 6.0 15216319 203600 8.0 61 60 - 70% 1,000,000.00£ 1,000,000.00£ 10 Diversified/Conglomerate Service 05/11/2010 1.26 2 01/12/2007 3.0 60216320 203600 8.0 61 60 - 70% 1,750,000.00£ 1,550,000.00£ 10 Diversified/Conglomerate Service 05/11/2010 1.26 2 01/12/2007 3.0 60216339 204529 4.0 9 0 - 10% 6,500,000.00£ 6,500,000.00£ 16 Grocery 13/11/2011 2.28 01/01/2008 2.5 15216361 203906 4.0 8 0 - 10% 1,646,189.61£ 1,646,189.61£ 5 Buildings and Real Estate 31/10/2009 0.25 01/01/2008 2.1 15216375 204432 5.0 10 0 - 10% 703,500.00£ 693,729.17£ 19 Hotels, Motels, Inns and Gaming 11/06/2012 2.86 01/01/2008 2.8 15216411 204434 6.0 12 10 - 20% 649,889.00£ 649,889.00£ 25 Personal, Food and Miscellaneous 29/06/2011 1.91 2 01/01/2008 3.0 21216422 204483 5.0 82 80 - 90% 237,779.29£ 124,630.40£ 28 Retail Stores 31/10/2009 0.25 1 01/01/2008 5.0 100216430 204158 7.0 31 30 - 40% 48,244.72£ 48,244.72£ 5 Buildings and Real Estate 31/10/2009 0.25 01/01/2008 3.0 36216482 204449 5.0 6 0 - 10% 537,567.74£ 537,567.74£ 2 Automobile 04/04/2017 7.68 01/01/2008 4.0 28216489 200628 4.0 10 0 - 10% 1,871,986.76£ 1,871,986.76£ 17 Healthcare, Education and Childcare 31/01/2015 5.50 01/01/2008 2.5 28216513 200741 4.0 10 0 - 10% 571,200.00£ 560,000.00£ 5 Buildings and Real Estate 30/10/2009 0.25 01/01/2008 3.0 15216530 204545 4.0 10 0 - 10% 699,445.93£ 699,445.93£ 17 Healthcare, Education and Childcare 24/11/2014 5.31 01/01/2008 2.5 15216531 204438 5.0 10 0 - 10% 305,035.16£ 305,035.16£ 19 Hotels, Motels, Inns and Gaming 31/10/2009 0.25 01/12/2008 5.0 10216544 200912 5.0 6 0 - 10% 3,225,000.00£ 3,225,000.00£ 19 Hotels, Motels, Inns and Gaming 30/06/2015 5.91 01/01/2008 3.0 15216549 204440 6.0 48 40 - 50% 648,083.28£ 648,083.28£ 30 Textiles and Leather 31/07/2010 1.00 2 01/10/2008 3.0 32 2216572 201028 8.0 21 20 - 30% 1,151,575.00£ 1,151,575.00£ 5 Buildings and Real Estate 31/10/2009 0.25 2 01/01/2008 2.1 27216592 204375 5.0 24 20 - 30% 588,797.86£ 569,058.14£ 22 Machinery (Non-Agriculture, Non-Construction, Non-Electro 20/07/2012 2.97 01/01/2008 3.0 21216600 201106 4.0 5 0 - 10% 728,951.83£ 728,951.83£ 17 Healthcare, Education and Childcare 13/07/2020 10.95 01/01/2008 2.1 15216605 204508 5.0 16 10 - 20% 763,197.01£ 763,197.01£ 5 Buildings and Real Estate 31/10/2009 0.25 01/01/2008 3.0 15216607 203835 8.0 8 0 - 10% 809,096.32£ 716,235.50£ 5 Buildings and Real Estate 31/10/2009 0.25 2 01/01/2008 3.0 19216616 201156 6.0 5 0 - 10% 1,339,825.16£ 1,233,657.76£ 5 Buildings and Real Estate 31/10/2009 0.25 01/01/2008 2.8 15216617 201161 8.0 7 0 - 10% 1,719,685.13£ 1,163,317.41£ 15 Farming and Agriculture 31/10/2009 0.25 2 01/01/2009 7.0 7 2216620 201166 4.0 48 40 - 50% 316,069.06£ 297,742.62£ 22 Machinery (Non-Agriculture, Non-Construction, Non-Electro 31/10/2009 0.25 01/01/2008 4.0 65216640 204381 3.0 33 30 - 40% 616,250.00£ 616,250.00£ 30 Textiles and Leather 31/10/2018 9.25 01/01/2008 3.0 42216643 204453 6.0 26 20 - 30% 587,842.31£ 587,842.31£ 21 Leisure, Amusement, Entertainment 09/02/2016 6.52 2 01/01/2008 7.0 28216648 204489 5.0 19 10 - 20% 592,506.51£ 439,047.77£ 21 Leisure, Amusement, Entertainment 31/10/2009 0.25 01/01/2008 3.0 15216651 204382 3.0 15 10 - 20% 477,903.70£ 477,903.70£ 22 Machinery (Non-Agriculture, Non-Construction, Non-Electro 25/07/2018 8.98 01/01/2008 2.1 15216688 204442 5.0 24 20 - 30% 4,500,000.00£ 4,500,000.00£ 28 Retail Stores 15/01/2014 4.46 1 01/01/2008 2.8 30216729 204531 2.1 30 20 - 30% 3,375,000.00£ 3,375,000.00£ 4 Beverage, Food and Tobacco 01/02/2012 2.50 01/01/2008 3.0 38216734 204500 5.0 35 30 - 40% 459,276.72£ 459,276.72£ 4 Beverage, Food and Tobacco 29/09/2016 7.16 01/01/2008 2.8 15216742 201701 3.0 16 10 - 20% 471,574.53£ 371,077.03£ 5 Buildings and Real Estate 17/12/2009 0.38 01/01/2008 2.1 15216752 204388 4.0 12 10 - 20% 615,999.49£ 615,999.49£ 16 Grocery 27/07/2017 7.99 01/01/2008 2.1 15
Page 21 of 5730/06/2008
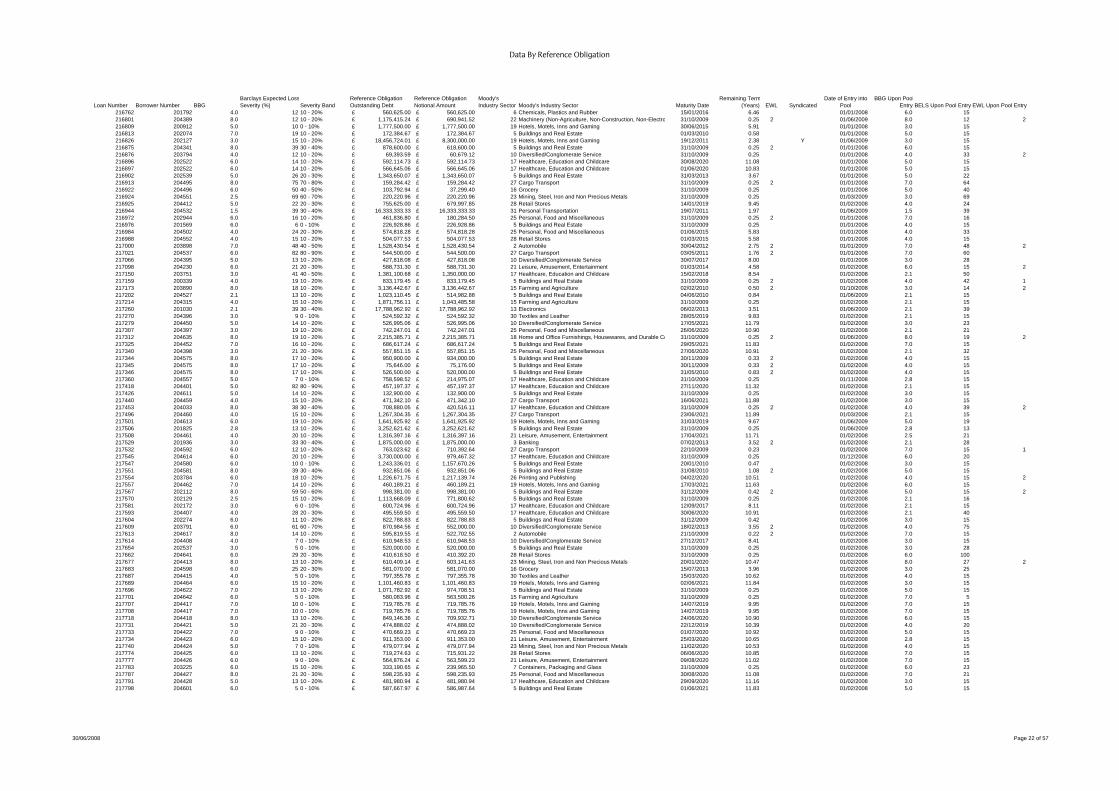
Data By Reference Obligation
Loan Number Borrower Number BBGBarclays Expected LossSeverity (%) Severity Band
Reference Obligation Outstanding Debt
Reference Obligation Notional Amount
Moody's Industry Sector Moody's Industry Sector Maturity Date
Remaining Term(Years) EWL Syndicated
Date of Entry into Pool
BBG Upon PoolEntry BELS Upon Pool Entry EWL Upon Pool Entry
216762 201792 4.0 12 10 - 20% 560,625.00£ 560,625.00£ 6 Chemicals, Plastics and Rubber 15/01/2016 6.46 01/01/2008 6.0 15216801 204389 8.0 12 10 - 20% 1,175,415.24£ 690,941.52£ 22 Machinery (Non-Agriculture, Non-Construction, Non-Electro 31/10/2009 0.25 2 01/06/2009 8.0 12 2216809 200912 5.0 10 0 - 10% 1,777,500.00£ 1,777,500.00£ 19 Hotels, Motels, Inns and Gaming 30/06/2015 5.91 01/01/2008 3.0 15216813 202074 7.0 19 10 - 20% 172,384.67£ 172,384.67£ 5 Buildings and Real Estate 01/03/2010 0.58 01/01/2008 5.0 15216826 202127 3.0 15 10 - 20% 18,456,724.01£ 8,300,000.00£ 19 Hotels, Motels, Inns and Gaming 19/12/2011 2.38 Y 01/06/2009 3.0 15216875 204341 8.0 39 30 - 40% 878,600.00£ 618,600.00£ 5 Buildings and Real Estate 31/10/2009 0.25 2 01/01/2008 6.0 15216876 203794 4.0 12 10 - 20% 69,393.59£ 60,679.12£ 10 Diversified/Conglomerate Service 31/10/2009 0.25 01/01/2008 4.0 33 2216896 202522 6.0 14 10 - 20% 592,114.73£ 592,114.73£ 17 Healthcare, Education and Childcare 30/08/2020 11.08 01/01/2008 5.0 15216897 202522 6.0 14 10 - 20% 566,645.06£ 566,645.06£ 17 Healthcare, Education and Childcare 01/06/2020 10.83 01/01/2008 5.0 15216902 202539 5.0 26 20 - 30% 1,343,650.07£ 1,343,650.07£ 5 Buildings and Real Estate 31/03/2013 3.67 01/01/2008 5.0 22216913 204495 8.0 75 70 - 80% 159,284.42£ 159,284.42£ 27 Cargo Transport 31/10/2009 0.25 2 01/01/2008 7.0 64216922 204496 6.0 50 40 - 50% 103,792.94£ 37,299.40£ 16 Grocery 31/10/2009 0.25 01/01/2008 5.0 40216924 204551 2.5 69 60 - 70% 220,220.96£ 220,220.96£ 23 Mining, Steel, Iron and Non Precious Metals 31/10/2009 0.25 01/03/2009 3.0 69216925 204412 5.0 22 20 - 30% 755,625.00£ 679,997.85£ 28 Retail Stores 14/01/2019 9.45 01/02/2008 4.0 24216944 204532 1.5 39 30 - 40% 16,333,333.33£ 16,333,333.33£ 31 Personal Transportation 19/07/2011 1.97 01/06/2009 1.5 39216972 202944 6.0 16 10 - 20% 461,836.80£ 180,284.50£ 25 Personal, Food and Miscellaneous 31/10/2009 0.25 2 01/01/2008 7.0 16216976 201569 6.0 6 0 - 10% 226,928.86£ 226,928.86£ 5 Buildings and Real Estate 31/10/2009 0.25 01/01/2008 4.0 15216984 204502 4.0 24 20 - 30% 574,818.28£ 574,818.28£ 25 Personal, Food and Miscellaneous 01/06/2015 5.83 01/01/2008 4.0 33216988 204552 4.0 15 10 - 20% 504,077.53£ 504,077.53£ 28 Retail Stores 01/03/2015 5.58 01/01/2008 4.0 15217000 203898 7.0 48 40 - 50% 1,528,430.54£ 1,528,430.54£ 2 Automobile 30/04/2012 2.75 2 01/01/2009 7.0 48 2217021 204537 6.0 82 80 - 90% 544,500.00£ 544,500.00£ 27 Cargo Transport 03/05/2011 1.76 2 01/01/2008 7.0 60217066 204395 5.0 13 10 - 20% 427,818.08£ 427,818.08£ 10 Diversified/Conglomerate Service 30/07/2017 8.00 01/01/2008 3.0 28217098 204230 6.0 21 20 - 30% 588,731.30£ 588,731.30£ 21 Leisure, Amusement, Entertainment 01/03/2014 4.58 01/02/2008 6.0 15 2217150 203751 3.0 41 40 - 50% 1,381,100.68£ 1,350,000.00£ 17 Healthcare, Education and Childcare 15/02/2018 8.54 01/02/2008 2.1 50217159 200339 4.0 19 10 - 20% 833,179.45£ 833,179.45£ 5 Buildings and Real Estate 31/10/2009 0.25 2 01/02/2008 4.0 42 1217173 203890 8.0 18 10 - 20% 3,136,442.67£ 3,136,442.67£ 15 Farming and Agriculture 02/02/2010 0.50 2 01/10/2008 3.0 14 2217202 204527 2.1 13 10 - 20% 1,023,110.45£ 514,982.88£ 5 Buildings and Real Estate 04/06/2010 0.84 01/06/2009 2.1 15217214 204315 4.0 15 10 - 20% 1,871,756.11£ 1,043,485.58£ 15 Farming and Agriculture 31/10/2009 0.25 01/02/2008 2.1 15217260 201030 2.1 39 30 - 40% 17,788,962.92£ 17,788,962.92£ 13 Electronics 06/02/2013 3.51 01/06/2009 2.1 39217270 204396 3.0 9 0 - 10% 524,592.32£ 524,592.32£ 30 Textiles and Leather 28/05/2019 9.83 01/02/2008 2.1 15217279 204450 5.0 14 10 - 20% 526,995.06£ 526,995.06£ 10 Diversified/Conglomerate Service 17/05/2021 11.79 01/02/2008 3.0 23217307 204397 3.0 19 10 - 20% 742,247.01£ 742,247.01£ 25 Personal, Food and Miscellaneous 26/06/2020 10.90 01/02/2008 2.1 21217312 204635 8.0 19 10 - 20% 2,215,385.71£ 2,215,385.71£ 18 Home and Office Furnishings, Housewares, and Durable Co 31/10/2009 0.25 2 01/06/2009 8.0 19 2217325 204452 7.0 16 10 - 20% 686,617.24£ 686,617.24£ 5 Buildings and Real Estate 29/05/2021 11.83 01/02/2008 7.0 15217340 204398 3.0 21 20 - 30% 557,851.15£ 557,851.15£ 25 Personal, Food and Miscellaneous 27/06/2020 10.91 01/02/2008 2.1 32217344 204575 8.0 17 10 - 20% 950,900.00£ 934,000.00£ 5 Buildings and Real Estate 30/11/2009 0.33 2 01/02/2008 4.0 15217345 204575 8.0 17 10 - 20% 75,646.00£ 75,176.00£ 5 Buildings and Real Estate 30/11/2009 0.33 2 01/02/2008 4.0 15217346 204575 8.0 17 10 - 20% 526,500.00£ 520,000.00£ 5 Buildings and Real Estate 31/05/2010 0.83 2 01/02/2008 4.0 15217360 204557 5.0 7 0 - 10% 758,598.52£ 214,975.07£ 17 Healthcare, Education and Childcare 31/10/2009 0.25 01/11/2008 2.8 15217418 204401 5.0 82 80 - 90% 457,197.37£ 457,197.37£ 17 Healthcare, Education and Childcare 27/11/2020 11.32 01/02/2008 2.1 15217426 204611 5.0 14 10 - 20% 132,900.00£ 132,900.00£ 5 Buildings and Real Estate 31/10/2009 0.25 01/02/2008 3.0 15217440 204459 4.0 15 10 - 20% 471,342.10£ 471,342.10£ 27 Cargo Transport 16/06/2021 11.88 01/02/2008 3.0 15217453 204033 8.0 38 30 - 40% 708,880.05£ 420,516.11£ 17 Healthcare, Education and Childcare 31/10/2009 0.25 2 01/02/2008 4.0 39 2217496 204460 4.0 15 10 - 20% 1,267,304.35£ 1,267,304.35£ 27 Cargo Transport 23/06/2021 11.89 01/03/2008 2.1 15217501 204613 6.0 19 10 - 20% 1,641,925.92£ 1,641,925.92£ 19 Hotels, Motels, Inns and Gaming 31/03/2019 9.67 01/06/2009 5.0 19217506 201825 2.8 13 10 - 20% 3,252,621.62£ 3,252,621.62£ 5 Buildings and Real Estate 31/10/2009 0.25 01/06/2009 2.8 13217508 204461 4.0 20 10 - 20% 1,316,397.16£ 1,316,397.16£ 21 Leisure, Amusement, Entertainment 17/04/2021 11.71 01/02/2008 2.5 21217529 201936 3.0 33 30 - 40% 1,875,000.00£ 1,875,000.00£ 3 Banking 07/02/2013 3.52 2 01/02/2008 2.1 28217532 204592 6.0 12 10 - 20% 763,023.62£ 710,392.64£ 27 Cargo Transport 22/10/2009 0.23 01/02/2008 7.0 15 1217545 204614 6.0 20 10 - 20% 3,730,000.00£ 979,467.32£ 17 Healthcare, Education and Childcare 31/10/2009 0.25 01/12/2008 6.0 20217547 204580 6.0 10 0 - 10% 1,243,336.01£ 1,157,670.26£ 5 Buildings and Real Estate 20/01/2010 0.47 01/02/2008 3.0 15217551 204581 8.0 39 30 - 40% 932,851.06£ 932,851.06£ 5 Buildings and Real Estate 31/08/2010 1.08 2 01/02/2008 5.0 15217554 203784 6.0 18 10 - 20% 1,226,671.75£ 1,217,139.74£ 26 Printing and Publishing 04/02/2020 10.51 01/02/2008 4.0 15 2217557 204462 7.0 14 10 - 20% 460,189.21£ 460,189.21£ 19 Hotels, Motels, Inns and Gaming 17/03/2021 11.63 01/02/2008 6.0 15217567 202112 8.0 59 50 - 60% 998,381.00£ 998,381.00£ 5 Buildings and Real Estate 31/12/2009 0.42 2 01/02/2008 5.0 15 2217570 202129 2.5 15 10 - 20% 1,113,668.09£ 771,800.62£ 5 Buildings and Real Estate 31/10/2009 0.25 01/02/2008 2.1 16217581 202172 3.0 6 0 - 10% 600,724.96£ 600,724.96£ 17 Healthcare, Education and Childcare 12/09/2017 8.11 01/02/2008 2.1 15217593 204407 4.0 28 20 - 30% 495,559.50£ 495,559.50£ 17 Healthcare, Education and Childcare 30/06/2020 10.91 01/02/2008 2.1 40217604 202274 6.0 11 10 - 20% 822,788.83£ 822,788.83£ 5 Buildings and Real Estate 31/12/2009 0.42 01/02/2008 3.0 15217609 203791 6.0 61 60 - 70% 870,984.56£ 552,000.00£ 10 Diversified/Conglomerate Service 18/02/2013 3.55 2 01/02/2008 4.0 75217613 204617 8.0 14 10 - 20% 595,819.55£ 522,702.55£ 2 Automobile 21/10/2009 0.22 2 01/02/2008 7.0 15217614 204408 4.0 7 0 - 10% 610,948.53£ 610,948.53£ 10 Diversified/Conglomerate Service 27/12/2017 8.41 01/02/2008 3.0 15217654 202537 3.0 5 0 - 10% 520,000.00£ 520,000.00£ 5 Buildings and Real Estate 31/10/2009 0.25 01/02/2008 3.0 28217662 204641 6.0 29 20 - 30% 410,618.50£ 410,392.20£ 28 Retail Stores 31/10/2009 0.25 01/02/2008 6.0 100217677 204413 8.0 13 10 - 20% 610,409.14£ 603,141.63£ 23 Mining, Steel, Iron and Non Precious Metals 20/01/2020 10.47 01/02/2008 8.0 27 2217683 204598 6.0 25 20 - 30% 581,070.00£ 581,070.00£ 16 Grocery 15/07/2013 3.96 01/02/2008 3.0 25217687 204415 4.0 5 0 - 10% 797,355.78£ 797,355.78£ 30 Textiles and Leather 15/03/2020 10.62 01/02/2008 4.0 15217689 204464 6.0 15 10 - 20% 1,101,460.83£ 1,101,460.83£ 19 Hotels, Motels, Inns and Gaming 02/06/2021 11.84 01/02/2008 3.0 15217696 204622 7.0 13 10 - 20% 1,071,782.92£ 974,708.51£ 5 Buildings and Real Estate 31/10/2009 0.25 01/02/2008 5.0 15217701 204642 6.0 5 0 - 10% 580,083.96£ 563,500.26£ 15 Farming and Agriculture 31/10/2009 0.25 01/02/2008 7.0 5217707 204417 7.0 10 0 - 10% 719,785.76£ 719,785.76£ 19 Hotels, Motels, Inns and Gaming 14/07/2019 9.95 01/02/2008 7.0 15217708 204417 7.0 10 0 - 10% 719,785.76£ 719,785.76£ 19 Hotels, Motels, Inns and Gaming 14/07/2019 9.95 01/02/2008 7.0 15217718 204418 8.0 13 10 - 20% 849,146.36£ 709,932.71£ 10 Diversified/Conglomerate Service 24/06/2020 10.90 01/02/2008 6.0 15217731 204421 5.0 21 20 - 30% 474,888.02£ 474,888.02£ 10 Diversified/Conglomerate Service 22/12/2019 10.39 01/02/2008 4.0 20217733 204422 7.0 9 0 - 10% 470,669.23£ 470,669.23£ 25 Personal, Food and Miscellaneous 01/07/2020 10.92 01/02/2008 5.0 15217734 204423 6.0 15 10 - 20% 911,353.00£ 911,353.00£ 21 Leisure, Amusement, Entertainment 25/03/2020 10.65 01/02/2008 2.8 15217740 204424 5.0 7 0 - 10% 479,077.94£ 479,077.94£ 23 Mining, Steel, Iron and Non Precious Metals 11/02/2020 10.53 01/02/2008 4.0 15217774 204425 6.0 13 10 - 20% 719,274.63£ 715,931.22£ 28 Retail Stores 06/06/2020 10.85 01/02/2008 7.0 15217777 204426 6.0 9 0 - 10% 564,876.24£ 563,599.23£ 21 Leisure, Amusement, Entertainment 09/08/2020 11.02 01/02/2008 7.0 15217783 203225 6.0 15 10 - 20% 333,190.65£ 239,965.50£ 7 Containers, Packaging and Glass 31/10/2009 0.25 01/02/2008 6.0 23217787 204427 8.0 21 20 - 30% 598,235.93£ 598,235.93£ 25 Personal, Food and Miscellaneous 30/08/2020 11.08 01/02/2008 7.0 21217791 204428 5.0 13 10 - 20% 481,980.94£ 481,980.94£ 17 Healthcare, Education and Childcare 29/09/2020 11.16 01/02/2008 3.0 15217798 204601 6.0 5 0 - 10% 587,667.97£ 586,987.64£ 5 Buildings and Real Estate 01/06/2021 11.83 01/02/2008 5.0 15
Page 22 of 5730/06/2008

Data By Reference Obligation
Loan Number Borrower Number BBGBarclays Expected LossSeverity (%) Severity Band
Reference Obligation Outstanding Debt
Reference Obligation Notional Amount
Moody's Industry Sector Moody's Industry Sector Maturity Date
Remaining Term(Years) EWL Syndicated
Date of Entry into Pool
BBG Upon PoolEntry BELS Upon Pool Entry EWL Upon Pool Entry
217799 204468 8.0 19 10 - 20% 1,156,412.50£ 1,146,163.42£ 21 Leisure, Amusement, Entertainment 26/01/2021 11.49 2 01/02/2008 7.0 15 2217800 204429 8.0 19 10 - 20% 1,012,368.43£ 1,012,368.43£ 21 Leisure, Amusement, Entertainment 20/12/2020 11.39 2 01/02/2008 8.0 21217806 204469 8.0 19 10 - 20% 1,588,503.62£ 1,588,503.62£ 21 Leisure, Amusement, Entertainment 12/04/2021 11.70 2 01/02/2008 8.0 15 2217816 204005 5.0 8 0 - 10% 649,034.40£ 642,000.37£ 27 Cargo Transport 31/10/2009 0.25 01/12/2008 4.0 8 2217817 204470 6.0 16 10 - 20% 1,250,800.00£ 1,250,800.00£ 27 Cargo Transport 19/05/2021 11.80 01/02/2008 6.0 27217826 204602 8.0 24 20 - 30% 1,927,426.50£ 1,916,426.50£ 17 Healthcare, Education and Childcare 31/10/2009 0.25 2 01/02/2008 4.0 17217832 204630 6.0 22 20 - 30% 1,146,713.32£ 1,100,287.61£ 5 Buildings and Real Estate 30/12/2009 0.41 01/02/2008 3.0 15217833 204645 7.0 51 50 - 60% 903,145.74£ 410,376.16£ 30 Textiles and Leather 31/10/2009 0.25 01/04/2008 5.0 55217836 204563 8.0 23 20 - 30% 1,460,456.03£ 1,059,415.84£ 18 Home and Office Furnishings, Housewares, and Durable Co 31/10/2009 0.25 2 01/05/2009 7.0 23217839 204586 7.0 24 20 - 30% 607,000.00£ 601,000.00£ 5 Buildings and Real Estate 03/05/2010 0.76 01/02/2008 8.0 15217842 204656 5.0 12 10 - 20% 1,125,961.85£ 1,125,961.85£ 4 Beverage, Food and Tobacco 31/10/2009 0.25 01/02/2008 5.0 15217844 204657 5.0 13 10 - 20% 703,306.80£ 408,018.42£ 9 Diversified/Conglomerate Manufacturing 31/10/2009 0.25 01/02/2008 3.0 27217852 204632 8.0 30 20 - 30% 777,107.00£ 761,870.00£ 5 Buildings and Real Estate 31/10/2009 0.25 2 01/02/2008 4.0 15217855 204633 6.0 5 0 - 10% 239,250.00£ 239,250.00£ 5 Buildings and Real Estate 31/10/2009 0.25 01/02/2008 3.0 15217856 204658 6.0 15 10 - 20% 16,000,000.00£ 16,000,000.00£ 19 Hotels, Motels, Inns and Gaming 31/10/2009 0.25 1 01/02/2008 4.0 28217867 200027 3.0 58 50 - 60% 875,000.00£ 875,000.00£ 28 Retail Stores 30/11/2015 6.33 01/03/2008 2.5 65217879 204747 3.0 16 10 - 20% 1,485,541.35£ 1,485,541.35£ 19 Hotels, Motels, Inns and Gaming 07/05/2013 3.77 01/06/2009 3.0 16217889 203595 6.0 16 10 - 20% 1,329,697.09£ 1,329,697.09£ 5 Buildings and Real Estate 31/10/2009 0.25 01/06/2009 6.0 13217913 204662 4.0 21 20 - 30% 342,165.61£ 150,406.48£ 13 Electronics 31/10/2009 0.25 01/03/2008 3.0 15217935 204710 8.0 29 20 - 30% 498,037.09£ 373,903.63£ 2 Automobile 31/10/2009 0.25 2 01/03/2008 5.0 42217944 204663 3.0 53 50 - 60% 1,625,094.94£ 1,205,168.31£ 15 Farming and Agriculture 31/10/2009 0.25 01/03/2008 1.5 50217949 204764 3.0 46 40 - 50% 1,500,000.00£ 1,500,000.00£ 28 Retail Stores 05/02/2013 3.51 01/03/2008 3.0 66217962 200339 4.0 19 10 - 20% 299,227.52£ 190,154.65£ 5 Buildings and Real Estate 31/10/2009 0.25 2 01/03/2008 4.0 22 1217975 204666 2.1 27 20 - 30% 211,132.11£ 211,132.11£ 15 Farming and Agriculture 31/10/2009 0.25 01/03/2008 5.0 35217984 203644 8.0 29 20 - 30% 3,755.62£ 3,755.62£ 2 Automobile 31/10/2009 0.25 2 01/03/2008 6.0 26217989 204765 4.0 20 10 - 20% 2,000,000.00£ 2,000,000.00£ 28 Retail Stores 25/05/2017 7.82 01/03/2008 2.8 21217990 204765 4.0 20 10 - 20% 700,000.00£ 700,000.00£ 28 Retail Stores 11/06/2012 2.86 01/03/2008 2.8 21218002 204712 4.0 5 0 - 10% 462,052.07£ 393,131.23£ 10 Diversified/Conglomerate Service 31/10/2009 0.25 01/11/2008 3.0 5218003 204766 5.0 15 10 - 20% 1,008,000.00£ 981,397.46£ 18 Home and Office Furnishings, Housewares, and Durable Co 05/01/2012 2.43 01/03/2008 2.8 15218015 204499 8.0 65 60 - 70% 1,225,986.69£ 1,225,986.69£ 18 Home and Office Furnishings, Housewares, and Durable Co 28/03/2018 8.66 2 01/03/2008 4.0 38218023 200542 6.0 21 20 - 30% 378,926.22£ 376,115.96£ 5 Buildings and Real Estate 31/10/2009 0.25 2 01/03/2008 4.0 15218061 204714 1.5 9 0 - 10% 777,810.41£ 772,020.41£ 15 Farming and Agriculture 03/12/2009 0.34 01/03/2008 1.8 15218065 204670 8.0 27 20 - 30% 796,590.46£ 796,590.46£ 16 Grocery 01/03/2009 0.00 2 01/03/2008 8.0 27 2218075 204767 7.0 60 50 - 60% 343,750.00£ 343,750.00£ 30 Textiles and Leather 25/05/2012 2.82 3 01/03/2008 1.5 65218080 204587 8.0 23 20 - 30% 657,136.00£ 625,363.62£ 5 Buildings and Real Estate 31/10/2009 0.25 1 01/03/2008 4.0 16218094 204673 6.0 20 10 - 20% 722,624.45£ 661,626.63£ 4 Beverage, Food and Tobacco 31/10/2009 0.25 01/06/2009 5.0 20218108 200919 6.0 75 70 - 80% 2,064,989.47£ 2,064,989.47£ 21 Leisure, Amusement, Entertainment 07/11/2011 2.27 01/06/2009 5.0 75218117 204748 8.0 7 0 - 10% 312,502.91£ 312,502.91£ 22 Machinery (Non-Agriculture, Non-Construction, Non-Electro 06/09/2011 2.10 2 01/03/2008 2.8 15218137 204749 6.0 20 10 - 20% 416,387.95£ 416,387.95£ 21 Leisure, Amusement, Entertainment 13/03/2011 1.62 2 01/03/2008 6.0 83218139 204718 1.5 8 0 - 10% 906,136.36£ 906,136.36£ 15 Farming and Agriculture 31/07/2010 1.00 01/03/2008 3.0 15218141 204718 1.5 8 0 - 10% 809,481.81£ 783,750.24£ 15 Farming and Agriculture 31/07/2010 1.00 01/03/2008 3.0 15218144 204719 1.5 12 10 - 20% 862,709.48£ 862,709.48£ 15 Farming and Agriculture 31/10/2009 0.25 01/11/2008 1.8 42218149 201048 6.0 10 0 - 10% 51,900.00£ 51,900.00£ 5 Buildings and Real Estate 04/11/2009 0.26 01/03/2008 4.0 15218156 201068 1.5 47 40 - 50% 670,000.00£ 670,000.00£ 15 Farming and Agriculture 31/10/2009 0.25 01/03/2008 1.5 15218170 204677 8.0 25 20 - 30% 1,414,745.87£ 984,547.59£ 15 Farming and Agriculture 31/10/2009 0.25 2 01/03/2008 3.0 15218171 204677 8.0 25 20 - 30% 812,000.00£ 812,000.00£ 15 Farming and Agriculture 31/10/2009 0.25 2 01/03/2008 3.0 15218175 204750 5.0 60 50 - 60% 235,882.19£ 235,882.19£ 3 Banking 12/07/2010 0.95 01/03/2008 3.0 60218176 201158 4.0 35 30 - 40% 1,800,000.00£ 1,305,000.00£ 21 Leisure, Amusement, Entertainment 06/02/2010 0.51 01/10/2008 4.0 18218184 204678 4.0 9 0 - 10% 663,527.15£ 427,270.78£ 2 Automobile 31/10/2009 0.25 01/03/2008 4.0 15218199 201235 5.0 18 10 - 20% 1,035,232.00£ 1,030,800.60£ 10 Diversified/Conglomerate Service 07/05/2020 10.77 1 01/03/2008 4.0 15218202 204751 3.0 56 50 - 60% 872,288.66£ 872,288.66£ 26 Printing and Publishing 19/03/2023 13.63 01/03/2008 2.1 58218210 204752 7.0 18 10 - 20% 585,761.23£ 585,761.23£ 12 Ecological 18/12/2011 2.38 01/03/2008 6.0 15218211 201317 5.0 6 0 - 10% 500,000.00£ 500,000.00£ 10 Diversified/Conglomerate Service 08/10/2009 0.19 01/03/2008 4.0 15218213 204454 7.0 17 10 - 20% 687,444.64£ 687,444.64£ 22 Machinery (Non-Agriculture, Non-Construction, Non-Electro 30/06/2021 11.91 01/03/2008 5.0 18218214 204454 7.0 17 10 - 20% 1,079,778.07£ 1,079,778.07£ 22 Machinery (Non-Agriculture, Non-Construction, Non-Electro 30/06/2021 11.91 01/03/2008 5.0 18218218 204722 1.5 17 10 - 20% 445,862.50£ 398,654.28£ 15 Farming and Agriculture 31/10/2009 0.25 01/03/2008 1.5 15218233 204768 6.0 7 0 - 10% 618,750.00£ 618,750.00£ 23 Mining, Steel, Iron and Non Precious Metals 30/08/2012 3.08 01/03/2008 4.0 15218239 204682 1.5 7 0 - 10% 507,130.84£ 189,972.07£ 15 Farming and Agriculture 31/10/2009 0.25 01/03/2008 1.5 15218240 204682 1.5 7 0 - 10% 500,000.00£ 500,000.00£ 15 Farming and Agriculture 23/09/2019 10.14 01/03/2008 1.5 15218255 204684 8.0 37 30 - 40% 65,105.39£ 29,437.05£ 15 Farming and Agriculture 31/10/2009 0.25 2 01/03/2008 5.0 45 1218263 204685 8.0 5 0 - 10% 373,035.44£ 108,623.24£ 28 Retail Stores 31/10/2009 0.25 2 01/03/2008 7.0 15218285 201598 5.0 62 60 - 70% 750,417.75£ 604,400.00£ 16 Grocery 02/01/2022 12.42 01/03/2008 2.1 15218292 204753 3.0 44 40 - 50% 300,000.00£ 300,000.00£ 28 Retail Stores 18/10/2009 0.21 01/03/2008 2.1 45218293 201629 8.0 12 10 - 20% 2,700,000.00£ 2,700,000.00£ 25 Personal, Food and Miscellaneous 31/10/2009 0.25 2 01/03/2008 7.0 18218297 201648 8.0 33 30 - 40% 776,371.81£ 494,999.40£ 15 Farming and Agriculture 31/10/2009 0.25 2 01/03/2008 3.0 15218310 204686 8.0 82 80 - 90% 701,108.92£ 529,269.27£ 22 Machinery (Non-Agriculture, Non-Construction, Non-Electro 31/10/2009 0.25 2 01/03/2008 7.0 91 2218311 204652 6.0 13 10 - 20% 574,714.88£ 574,714.88£ 17 Healthcare, Education and Childcare 18/03/2018 8.63 01/03/2008 7.0 32218324 201765 8.0 41 40 - 50% 751,200.00£ 751,200.00£ 5 Buildings and Real Estate 31/01/2010 0.50 2 01/03/2008 5.0 56218336 204301 4.0 6 0 - 10% 812,000.00£ 812,000.00£ 24 Oil and Gas 26/03/2018 8.65 01/03/2008 4.0 28218349 204770 6.0 16 10 - 20% 3,000,000.00£ 3,000,000.00£ 7 Containers, Packaging and Glass 11/03/2013 3.61 01/03/2008 4.0 15218350 204770 6.0 16 10 - 20% 6,100,000.00£ 6,100,000.00£ 7 Containers, Packaging and Glass 08/05/2021 11.77 01/03/2008 4.0 15218363 201897 4.0 5 0 - 10% 1,033,650.00£ 1,033,650.00£ 5 Buildings and Real Estate 01/04/2010 0.67 01/03/2008 2.5 28218370 204725 4.0 6 0 - 10% 798,969.29£ 798,969.29£ 25 Personal, Food and Miscellaneous 14/02/2011 1.54 01/03/2008 3.0 24218373 201931 1.5 5 0 - 10% 160,000.00£ 160,000.00£ 25 Personal, Food and Miscellaneous 14/11/2009 0.29 01/03/2008 3.0 15218376 201936 3.0 33 30 - 40% 7,930,170.58£ 7,930,170.58£ 3 Banking 05/07/2022 12.93 2 01/06/2009 3.0 29218392 204614 6.0 20 10 - 20% 3,808,746.58£ 3,808,746.58£ 17 Healthcare, Education and Childcare 12/09/2025 16.11 01/03/2008 2.1 20218394 204129 2.1 6 0 - 10% 1,859,615.35£ 1,859,615.35£ 21 Leisure, Amusement, Entertainment 27/04/2021 11.74 01/03/2008 2.1 15218399 204688 3.0 15 10 - 20% 501,250.00£ 501,250.00£ 15 Farming and Agriculture 31/10/2009 0.25 01/03/2008 1.5 15218400 204688 3.0 15 10 - 20% 1,621,336.50£ 1,398,193.51£ 15 Farming and Agriculture 31/10/2009 0.25 01/03/2008 1.5 15218401 204728 3.0 16 10 - 20% 759,123.97£ 504,623.97£ 15 Farming and Agriculture 19/01/2012 2.47 01/03/2008 2.5 15218403 202088 4.0 32 30 - 40% 650,000.00£ 650,000.00£ 4 Beverage, Food and Tobacco 01/05/2022 12.75 01/03/2008 2.1 55218408 204737 8.0 30 20 - 30% 1,595,085.30£ 1,595,085.30£ 21 Leisure, Amusement, Entertainment 31/10/2009 0.25 2 01/03/2008 4.0 15 2218412 202127 3.0 15 10 - 20% 16,200,000.00£ 16,200,000.00£ 19 Hotels, Motels, Inns and Gaming 19/12/2017 8.38 Y 01/03/2008 4.0 15
Page 23 of 5730/06/2008

Data By Reference Obligation
Loan Number Borrower Number BBGBarclays Expected LossSeverity (%) Severity Band
Reference Obligation Outstanding Debt
Reference Obligation Notional Amount
Moody's Industry Sector Moody's Industry Sector Maturity Date
Remaining Term(Years) EWL Syndicated
Date of Entry into Pool
BBG Upon PoolEntry BELS Upon Pool Entry EWL Upon Pool Entry
218415 202134 5.0 13 10 - 20% 943,057.14£ 897,378.87£ 17 Healthcare, Education and Childcare 03/03/2018 8.59 01/03/2008 4.0 33218420 204689 5.0 5 0 - 10% 962,066.46£ 428,088.08£ 17 Healthcare, Education and Childcare 31/10/2009 0.25 1 01/03/2008 4.0 5218428 204754 7.0 34 30 - 40% 342,175.05£ 342,175.05£ 10 Diversified/Conglomerate Service 20/04/2011 1.72 01/03/2008 5.0 100218431 204690 4.0 7 0 - 10% 673,938.87£ 673,938.87£ 15 Farming and Agriculture 22/12/2010 1.39 01/03/2008 3.0 15218433 204594 8.0 39 30 - 40% 327,818.57£ 327,818.57£ 5 Buildings and Real Estate 31/10/2009 0.25 2 01/03/2008 7.0 15218436 203788 6.0 17 10 - 20% 940,914.97£ 940,914.97£ 4 Beverage, Food and Tobacco 07/06/2022 12.85 01/03/2008 5.0 15218437 204738 8.0 16 10 - 20% 844,047.19£ 716,290.31£ 6 Chemicals, Plastics and Rubber 31/10/2009 0.25 2 01/03/2008 3.0 20218439 204691 8.0 12 10 - 20% 450,000.00£ 450,000.00£ 17 Healthcare, Education and Childcare 15/01/2017 7.46 2 01/03/2008 2.1 27218440 204691 8.0 12 10 - 20% 187,474.90£ 187,474.90£ 17 Healthcare, Education and Childcare 31/10/2009 0.25 2 01/03/2008 2.1 27218441 204691 8.0 12 10 - 20% 971,500.00£ 671,500.00£ 17 Healthcare, Education and Childcare 19/10/2010 1.22 2 01/03/2008 2.1 27218457 202358 5.0 25 20 - 30% 787,500.00£ 787,500.00£ 30 Textiles and Leather 30/12/2017 8.41 01/03/2008 4.0 56218467 203977 4.0 27 20 - 30% 1,097,863.33£ 645,014.99£ 17 Healthcare, Education and Childcare 31/10/2009 0.25 01/06/2009 4.0 27218471 203879 2.5 8 0 - 10% 574,958.02£ 456,121.42£ 15 Farming and Agriculture 31/10/2009 0.25 01/03/2008 3.0 14218473 204463 7.0 18 10 - 20% 914,518.35£ 901,175.16£ 17 Healthcare, Education and Childcare 15/09/2021 12.12 01/03/2008 2.1 15218483 202479 2.5 56 50 - 60% 270,683.29£ 270,683.29£ 17 Healthcare, Education and Childcare 30/03/2010 0.66 01/03/2008 2.5 59218484 202479 2.5 56 50 - 60% 443,314.13£ 443,314.13£ 17 Healthcare, Education and Childcare 28/09/2010 1.16 01/03/2008 2.5 59218486 202479 2.5 56 50 - 60% 524,913.55£ 524,913.55£ 17 Healthcare, Education and Childcare 07/01/2011 1.43 01/03/2008 2.5 59218487 202479 2.5 56 50 - 60% 443,310.48£ 443,310.48£ 17 Healthcare, Education and Childcare 31/10/2010 1.25 01/03/2008 2.5 59218488 202479 2.5 56 50 - 60% 359,404.96£ 359,404.96£ 17 Healthcare, Education and Childcare 24/07/2010 0.98 01/03/2008 2.5 59218509 204739 2.1 11 10 - 20% 506,268.75£ 502,500.00£ 15 Farming and Agriculture 02/03/2010 0.59 01/03/2008 4.0 15218526 204708 3.0 12 10 - 20% 2,500,000.00£ 2,500,000.00£ 19 Hotels, Motels, Inns and Gaming 13/02/2011 1.53 01/03/2008 3.0 11218527 204729 5.0 10 0 - 10% 452,384.00£ 452,384.00£ 17 Healthcare, Education and Childcare 19/05/2019 9.80 01/03/2008 2.5 15218538 202752 8.0 15 10 - 20% 877,375.00£ 861,375.00£ 5 Buildings and Real Estate 31/10/2009 0.25 2 01/03/2008 8.0 15218544 202810 8.0 35 30 - 40% 103,657.54£ 25,870.71£ 17 Healthcare, Education and Childcare 31/10/2009 0.25 2 01/03/2008 7.0 15 1218546 203705 5.0 8 0 - 10% 366,329.29£ 366,329.29£ 16 Grocery 19/03/2013 3.63 01/03/2008 5.0 28218564 203991 3.0 6 0 - 10% 928,336.61£ 928,336.61£ 5 Buildings and Real Estate 31/10/2009 0.25 01/03/2008 6.0 27218573 202981 7.0 14 10 - 20% 1,241,456.76£ 1,241,456.76£ 7 Containers, Packaging and Glass 29/10/2019 10.24 01/03/2008 4.0 14218576 203022 3.0 66 60 - 70% 490,490.06£ 490,490.06£ 10 Diversified/Conglomerate Service 31/12/2012 3.42 01/03/2008 3.0 60 2218577 203022 3.0 66 60 - 70% 1,664,408.00£ 1,664,408.00£ 10 Diversified/Conglomerate Service 31/12/2012 3.42 01/03/2008 3.0 60 2218579 203022 3.0 66 60 - 70% 1,053,360.00£ 1,053,360.00£ 10 Diversified/Conglomerate Service 31/12/2012 3.42 01/03/2008 3.0 60 2218589 204467 7.0 24 20 - 30% 668,826.47£ 668,826.47£ 31 Personal Transportation 08/01/2022 12.44 01/03/2008 4.0 16218590 204467 7.0 24 20 - 30% 1,316,083.44£ 1,316,083.44£ 31 Personal Transportation 11/08/2021 12.03 01/03/2008 4.0 16218593 204696 8.0 12 10 - 20% 139,747.44£ 60,593.74£ 12 Ecological 31/10/2009 0.25 01/03/2008 8.0 15218596 204758 5.0 83 80 - 90% 180,985.43£ 180,985.43£ 17 Healthcare, Education and Childcare 16/11/2009 0.29 01/03/2008 5.0 28218599 204709 3.0 17 10 - 20% 464,354.79£ 464,354.79£ 7 Containers, Packaging and Glass 02/10/2023 14.17 01/03/2008 3.0 15218618 204512 8.0 17 10 - 20% 1,676,100.84£ 1,676,100.84£ 5 Buildings and Real Estate 31/10/2009 0.25 2 01/03/2008 4.0 15218620 204180 8.0 17 10 - 20% 914,990.07£ 914,990.07£ 5 Buildings and Real Estate 06/01/2010 0.43 1 01/03/2008 2.5 15218636 204698 8.0 24 20 - 30% 951,893.01£ 945,300.23£ 27 Cargo Transport 31/10/2009 0.25 01/03/2008 7.0 45 2218640 203322 6.0 21 20 - 30% 1,848,736.06£ 1,848,736.06£ 17 Healthcare, Education and Childcare 16/02/2021 11.54 01/03/2008 5.0 17218643 203328 6.0 38 30 - 40% 3,250,000.00£ 3,250,000.00£ 4 Beverage, Food and Tobacco 06/08/2012 3.01 1 01/03/2008 2.8 38218644 204760 6.0 5 0 - 10% 528,850.00£ 528,850.00£ 10 Diversified/Conglomerate Service 31/08/2010 1.08 01/03/2008 5.0 15218648 204761 5.0 10 0 - 10% 1,077,555.00£ 1,077,555.00£ 10 Diversified/Conglomerate Service 31/08/2010 1.08 01/03/2008 5.0 10218654 204699 7.0 13 10 - 20% 213,499.22£ 112,660.14£ 17 Healthcare, Education and Childcare 31/10/2009 0.25 01/03/2008 7.0 15218661 204260 4.0 19 10 - 20% 682,000.00£ 682,000.00£ 5 Buildings and Real Estate 31/10/2009 0.25 01/03/2008 5.0 39218676 204472 6.0 22 20 - 30% 543,858.27£ 543,858.27£ 25 Personal, Food and Miscellaneous 18/08/2021 12.05 01/03/2008 5.0 22218677 203580 8.0 56 50 - 60% 3,056,500.15£ 2,412,113.17£ 29 Telecommunications 31/07/2010 1.00 2 01/12/2008 7.0 75 2218682 204473 7.0 16 10 - 20% 555,686.08£ 555,686.08£ 9 Diversified/Conglomerate Manufacturing 24/08/2021 12.06 01/03/2008 7.0 23218684 204658 6.0 15 10 - 20% 35,000,000.00£ 8,500,000.00£ 19 Hotels, Motels, Inns and Gaming 20/10/2009 0.22 1 01/06/2009 5.0 18 1218685 204743 7.0 40 30 - 40% 1,094,024.18£ 867,888.25£ 21 Leisure, Amusement, Entertainment 31/10/2009 0.25 01/10/2008 7.0 83218688 204701 6.0 17 10 - 20% 1,762,935.14£ 1,762,935.14£ 18 Home and Office Furnishings, Housewares, and Durable Co 31/10/2009 0.25 01/06/2009 5.0 17218689 204603 6.0 11 10 - 20% 800,000.00£ 600,000.00£ 5 Buildings and Real Estate 31/10/2009 0.25 01/03/2008 3.0 12218692 204745 7.0 24 20 - 30% 552,100.00£ 550,000.00£ 21 Leisure, Amusement, Entertainment 15/10/2009 0.21 01/03/2008 3.0 23218693 204746 7.0 65 60 - 70% 250,000.00£ 250,000.00£ 10 Diversified/Conglomerate Service 31/10/2009 0.25 2 01/03/2008 3.0 44218696 204763 6.0 40 30 - 40% 891,500.00£ 891,500.00£ 9 Diversified/Conglomerate Manufacturing 30/06/2010 0.91 01/03/2008 4.0 34218714 200058 6.0 54 50 - 60% 682,792.20£ 474,190.38£ 24 Oil and Gas 31/10/2009 0.25 01/04/2008 6.0 65218745 204661 8.0 23 20 - 30% 661,242.69£ 661,242.69£ 22 Machinery (Non-Agriculture, Non-Construction, Non-Electro 10/12/2022 13.36 2 01/04/2008 4.0 74218785 200248 6.0 21 20 - 30% 770,000.00£ 584,500.00£ 5 Buildings and Real Estate 31/10/2009 0.25 2 01/04/2008 3.0 28218811 204822 5.0 7 0 - 10% 794,215.56£ 599,826.12£ 21 Leisure, Amusement, Entertainment 31/10/2009 0.25 01/04/2008 3.0 15218818 200309 5.0 16 10 - 20% 1,359,534.62£ 1,359,534.62£ 19 Hotels, Motels, Inns and Gaming 12/01/2023 13.45 01/04/2008 4.0 15218868 204436 6.0 57 50 - 60% 270,663.28£ 156,351.29£ 30 Textiles and Leather 31/07/2010 1.00 2 01/10/2008 5.0 57 2218918 204127 6.0 31 30 - 40% 395,355.58£ 395,355.58£ 30 Textiles and Leather 31/10/2009 0.25 01/11/2008 4.0 31218952 200964 5.0 8 0 - 10% 580,438.71£ 580,438.71£ 2 Automobile 30/04/2011 1.75 01/04/2008 2.8 19218964 201004 5.0 33 30 - 40% 2,303,814.54£ 2,303,814.54£ 2 Automobile 03/04/2018 8.67 01/04/2008 3.0 16218969 204293 5.0 12 10 - 20% 36,944.24£ 36,944.24£ 4 Beverage, Food and Tobacco 31/07/2010 1.00 01/04/2008 3.0 28219021 204721 2.8 11 10 - 20% 389,689.45£ 389,689.45£ 4 Beverage, Food and Tobacco 30/03/2020 10.66 01/04/2008 2.1 27219024 204751 3.0 56 50 - 60% 1,007,976.52£ 1,007,976.52£ 26 Printing and Publishing 03/04/2011 1.67 01/04/2008 2.1 59219026 201263 6.0 59 50 - 60% 782,553.97£ 287,518.02£ 17 Healthcare, Education and Childcare 31/10/2009 0.25 01/04/2008 4.0 39219029 201282 7.0 5 0 - 10% 1,584,310.90£ 1,584,310.90£ 2 Automobile 23/01/2019 9.48 01/04/2008 5.0 15219067 203893 5.0 51 50 - 60% 1,106,327.85£ 637,650.46£ 6 Chemicals, Plastics and Rubber 31/10/2009 0.25 1 01/06/2009 5.0 51 1219115 204386 6.0 25 20 - 30% 389,732.87£ 388,775.00£ 5 Buildings and Real Estate 31/10/2009 0.25 01/04/2008 3.0 15219128 204300 6.0 35 30 - 40% 450,000.00£ 450,000.00£ 22 Machinery (Non-Agriculture, Non-Construction, Non-Electro 16/04/2011 1.71 2 01/04/2008 4.0 58219129 204853 2.5 10 0 - 10% 1,015,339.11£ 1,015,339.11£ 17 Healthcare, Education and Childcare 18/12/2022 13.38 01/04/2008 2.1 12219130 204853 2.5 10 0 - 10% 1,043,174.58£ 1,043,174.58£ 17 Healthcare, Education and Childcare 30/11/2015 6.33 01/04/2008 2.1 12219145 201799 5.0 11 10 - 20% 938,172.39£ 566,064.76£ 5 Buildings and Real Estate 31/10/2009 0.25 01/04/2008 4.0 15219146 201799 5.0 11 10 - 20% 1,244,727.22£ 1,169,546.77£ 5 Buildings and Real Estate 31/10/2009 0.25 01/04/2008 4.0 15219152 201825 2.8 13 10 - 20% 306,970.32£ 306,970.32£ 5 Buildings and Real Estate 31/10/2009 0.25 01/04/2008 3.0 9219153 203778 4.0 25 20 - 30% 25,095,000.00£ 20,750,000.00£ 26 Printing and Publishing 02/04/2013 3.67 01/04/2008 4.0 31219168 201891 2.1 10 0 - 10% 918,723.01£ 843,951.77£ 15 Farming and Agriculture 31/01/2023 13.50 01/04/2008 2.1 15219179 201897 4.0 5 0 - 10% 1,683,008.00£ 1,683,008.00£ 5 Buildings and Real Estate 01/04/2010 0.67 01/04/2008 2.5 28219185 201926 8.0 23 20 - 30% 788,553.89£ 740,934.70£ 15 Farming and Agriculture 28/04/2018 8.74 2 01/04/2008 5.0 19 1219209 204830 4.0 24 20 - 30% 416,470.41£ 398,215.42£ 10 Diversified/Conglomerate Service 31/10/2009 0.25 01/04/2008 4.0 32219210 202061 3.0 18 10 - 20% 775,000.00£ 775,000.00£ 17 Healthcare, Education and Childcare 28/04/2018 8.74 01/04/2008 2.1 26219220 202113 5.0 18 10 - 20% 822,162.37£ 331,234.38£ 2 Automobile 31/10/2009 0.25 01/04/2008 4.0 40
Page 24 of 5730/06/2008

Data By Reference Obligation
Loan Number Borrower Number BBGBarclays Expected LossSeverity (%) Severity Band
Reference Obligation Outstanding Debt
Reference Obligation Notional Amount
Moody's Industry Sector Moody's Industry Sector Maturity Date
Remaining Term(Years) EWL Syndicated
Date of Entry into Pool
BBG Upon PoolEntry BELS Upon Pool Entry EWL Upon Pool Entry
219223 202138 5.0 13 10 - 20% 2,850,655.73£ 2,850,655.73£ 24 Oil and Gas 29/04/2014 4.74 01/04/2008 3.0 28 1219226 202156 6.0 33 30 - 40% 536,228.15£ 536,228.15£ 27 Cargo Transport 08/04/2018 8.69 01/04/2008 6.0 32219233 203786 7.0 13 10 - 20% 217,790.16£ 143,228.91£ 21 Leisure, Amusement, Entertainment 31/10/2009 0.25 01/04/2008 4.0 15219239 202237 6.0 10 0 - 10% 160,741.83£ 121,223.70£ 28 Retail Stores 31/10/2009 0.25 01/04/2008 5.0 15219240 203788 6.0 17 10 - 20% 502,500.00£ 502,500.00£ 4 Beverage, Food and Tobacco 24/04/2013 3.73 01/04/2008 6.0 15219241 202248 4.0 13 10 - 20% 808,720.22£ 808,720.22£ 21 Leisure, Amusement, Entertainment 08/01/2023 13.44 01/04/2008 4.0 15219250 202308 4.0 31 30 - 40% 508,749.74£ 508,749.74£ 28 Retail Stores 26/03/2016 6.65 01/04/2008 4.0 15 2219277 202479 2.5 56 50 - 60% 607,546.68£ 607,546.68£ 17 Healthcare, Education and Childcare 31/03/2011 1.67 01/04/2008 2.5 59219278 202479 2.5 56 50 - 60% 608,369.45£ 608,369.45£ 17 Healthcare, Education and Childcare 30/04/2011 1.75 01/04/2008 2.5 59219301 204794 5.0 9 0 - 10% 1,637,824.89£ 1,615,324.89£ 5 Buildings and Real Estate 31/10/2009 0.25 01/04/2008 7.0 15 2219320 202728 3.0 9 0 - 10% 1,650,000.00£ 1,400,000.00£ 30 Textiles and Leather 18/04/2013 3.71 01/04/2008 5.0 15219324 202744 5.0 13 10 - 20% 1,281,417.47£ 1,281,417.47£ 17 Healthcare, Education and Childcare 25/09/2021 12.15 01/04/2008 4.0 15219330 203705 5.0 8 0 - 10% 2,255,974.71£ 2,255,974.71£ 16 Grocery 07/06/2015 5.85 01/04/2008 5.0 28219332 204834 8.0 25 20 - 30% 447,014.93£ 254,284.00£ 2 Automobile 31/10/2009 0.25 2 01/04/2008 7.0 37219344 202876 6.0 11 10 - 20% 713,451.02£ 264,050.44£ 18 Home and Office Furnishings, Housewares, and Durable Co 31/10/2009 0.25 2 01/04/2008 3.0 23219365 203571 7.0 45 40 - 50% 23,000,000.00£ 22,020,000.00£ 4 Beverage, Food and Tobacco 06/09/2012 3.10 2 01/04/2008 2.8 49219367 203062 7.0 15 10 - 20% 468,258.37£ 468,258.37£ 28 Retail Stores 07/04/2015 5.68 01/04/2008 4.0 15219373 204467 7.0 24 20 - 30% 2,740,426.89£ 2,655,777.03£ 31 Personal Transportation 20/09/2022 13.14 01/04/2008 4.0 16219375 204696 8.0 12 10 - 20% 1,360,289.16£ 1,360,289.16£ 12 Ecological 16/04/2018 8.71 01/04/2008 8.0 27219392 204126 6.0 39 30 - 40% 12,400,000.00£ 12,400,000.00£ 25 Personal, Food and Miscellaneous 31/12/2010 1.42 1 01/04/2008 7.0 60 2219393 204126 6.0 39 30 - 40% 3,999,999.98£ 3,999,999.98£ 25 Personal, Food and Miscellaneous 31/12/2010 1.42 1 01/04/2008 7.0 60 2219398 204856 8.0 62 60 - 70% 1,052,788.61£ 1,021,394.99£ 25 Personal, Food and Miscellaneous 11/04/2014 4.69 2 01/04/2008 8.0 75 2219410 203242 5.0 8 0 - 10% 1,601,616.76£ 1,601,616.76£ 4 Beverage, Food and Tobacco 27/10/2015 6.24 01/04/2008 6.0 11219412 204857 8.0 14 10 - 20% 1,107,914.38£ 1,064,089.39£ 25 Personal, Food and Miscellaneous 17/09/2014 5.13 1 01/04/2008 7.0 15 2219415 204183 5.0 31 30 - 40% 693,446.13£ 685,017.76£ 5 Buildings and Real Estate 20/10/2009 0.22 01/04/2008 3.0 15219416 204345 8.0 18 10 - 20% 780,489.89£ 569,992.02£ 22 Machinery (Non-Agriculture, Non-Construction, Non-Electro 31/10/2009 0.25 01/04/2008 7.0 19219418 204838 6.0 18 10 - 20% 335,387.52£ 335,387.52£ 10 Diversified/Conglomerate Service 31/10/2009 0.25 01/04/2008 4.0 27219419 204600 8.0 19 10 - 20% 1,043,500.00£ 675,000.00£ 5 Buildings and Real Estate 31/10/2009 0.25 1 01/04/2008 8.0 15 1219422 204308 7.0 15 10 - 20% 539,319.17£ 539,319.17£ 28 Retail Stores 25/04/2018 8.73 01/04/2008 3.0 15219431 204839 8.0 49 40 - 50% 559,990.04£ 559,990.04£ 28 Retail Stores 08/12/2012 3.35 01/04/2008 8.0 23219456 203885 6.0 31 30 - 40% 393,003.14£ 393,003.14£ 6 Chemicals, Plastics and Rubber 31/10/2009 0.25 01/07/2008 4.0 54219457 204798 1.5 5 0 - 10% 1,000,000.00£ 1,000,000.00£ 5 Buildings and Real Estate 31/10/2009 0.25 01/04/2008 1.8 10219459 204862 8.0 15 10 - 20% 510,023.70£ 510,023.70£ 27 Cargo Transport 06/09/2016 7.10 2 01/04/2008 7.0 15 2219461 204473 7.0 16 10 - 20% 1,694,400.00£ 1,694,400.00£ 9 Diversified/Conglomerate Manufacturing 07/11/2022 13.27 01/04/2008 7.0 23219462 204646 5.0 14 10 - 20% 1,690,060.50£ 1,246,820.79£ 16 Grocery 06/07/2022 12.93 01/04/2008 7.0 15219495 204604 3.0 45 40 - 50% 541,000.00£ 541,000.00£ 5 Buildings and Real Estate 31/10/2009 0.25 01/05/2008 2.1 16219517 200168 5.0 6 0 - 10% 340,728.50£ 173,066.94£ 25 Personal, Food and Miscellaneous 31/10/2009 0.25 01/05/2008 3.0 7219586 204704 5.0 12 10 - 20% 8,566,403.40£ 8,566,403.40£ 17 Healthcare, Education and Childcare 30/04/2018 8.75 01/05/2008 2.8 14219629 203936 5.0 34 30 - 40% 1,413,315.25£ 1,101,575.68£ 30 Textiles and Leather 31/10/2009 0.25 01/03/2009 4.0 36219630 200531 5.0 13 10 - 20% 424,660.05£ 275,613.12£ 30 Textiles and Leather 31/10/2009 0.25 01/05/2008 4.0 9219634 200564 6.0 25 20 - 30% 636,300.00£ 630,000.00£ 5 Buildings and Real Estate 31/01/2010 0.50 2 01/05/2008 5.0 26219668 200693 6.0 38 30 - 40% 1,714,512.37£ 1,277,388.47£ 16 Grocery 31/10/2009 0.25 2 01/06/2008 3.0 42219917 204786 3.0 33 30 - 40% 703,355.27£ 703,355.27£ 5 Buildings and Real Estate 31/10/2009 0.25 01/05/2008 2.8 15219922 201851 5.0 13 10 - 20% 846,384.00£ 846,384.00£ 5 Buildings and Real Estate 31/10/2009 0.25 01/05/2008 5.0 15219949 203965 6.0 18 10 - 20% 387,044.50£ 387,044.50£ 5 Buildings and Real Estate 31/10/2009 0.25 01/05/2008 5.0 22219962 202027 2.1 9 0 - 10% 1,591,521.95£ 1,591,521.95£ 15 Farming and Agriculture 31/10/2009 0.25 01/05/2009 2.1 9219972 202088 4.0 32 30 - 40% 989,509.18£ 872,890.39£ 4 Beverage, Food and Tobacco 31/10/2009 0.25 01/05/2009 4.0 32219999 204057 7.0 75 70 - 80% 1,176,545.71£ 857,348.96£ 30 Textiles and Leather 31/10/2009 0.25 3 01/01/2009 6.0 75220012 202279 5.0 33 30 - 40% 681,807.22£ 406,569.77£ 16 Grocery 31/10/2009 0.25 01/11/2008 3.0 39220028 202365 8.0 27 20 - 30% 1,182,170.02£ 1,103,492.93£ 5 Buildings and Real Estate 31/10/2009 0.25 2 01/05/2008 6.0 15220044 204511 6.0 49 40 - 50% 533,901.99£ 525,000.00£ 5 Buildings and Real Estate 01/12/2009 0.33 2 01/05/2008 5.0 27220087 204795 8.0 17 10 - 20% 1,154,412.66£ 976,825.26£ 5 Buildings and Real Estate 31/10/2009 0.25 2 01/05/2008 7.0 15220118 204626 4.0 5 0 - 10% 193,583.26£ 184,706.48£ 5 Buildings and Real Estate 31/10/2009 0.25 01/05/2008 3.0 15220158 204003 4.0 81 80 - 90% 165,187.35£ 165,187.35£ 24 Oil and Gas 31/10/2009 0.25 01/05/2008 3.0 15220173 204629 4.0 29 20 - 30% 369,921.84£ 366,856.84£ 5 Buildings and Real Estate 31/10/2009 0.25 01/05/2008 6.0 15220182 204631 8.0 24 20 - 30% 690,924.22£ 629,862.74£ 5 Buildings and Real Estate 31/10/2009 0.25 2 01/05/2008 4.0 43220196 200027 3.0 58 50 - 60% 505,897.17£ 505,897.17£ 28 Retail Stores 31/10/2009 0.25 01/05/2009 5.0 58220219 200143 3.0 15 10 - 20% 387,106.97£ 387,106.97£ 5 Buildings and Real Estate 31/10/2009 0.25 01/06/2008 2.8 23220229 204775 6.0 19 10 - 20% 671,650.00£ 671,650.00£ 5 Buildings and Real Estate 31/10/2009 0.25 01/06/2008 5.0 9220278 200340 8.0 36 30 - 40% 441,527.62£ 320,009.62£ 5 Buildings and Real Estate 31/10/2009 0.25 2 01/06/2008 4.0 15 2220282 203640 6.0 34 30 - 40% 26,008.41£ 26,008.41£ 15 Farming and Agriculture 31/10/2009 0.25 01/12/2008 5.0 37220289 200404 6.0 7 0 - 10% 9,981,849.60£ 9,981,849.60£ 19 Hotels, Motels, Inns and Gaming 31/12/2025 16.42 1 01/06/2008 5.0 8220412 203902 5.0 10 0 - 10% 6,115,015.02£ 6,115,015.02£ 3 Banking 31/07/2010 1.00 01/06/2009 5.0 10220546 201484 8.0 19 10 - 20% 3,445,500.00£ 3,445,500.00£ 19 Hotels, Motels, Inns and Gaming 30/01/2025 15.50 2 01/06/2009 8.0 19 2220554 201538 2.8 48 40 - 50% 5,600,000.00£ 5,600,000.00£ 20 Insurance 09/06/2013 3.86 01/06/2008 1.2 58220558 201565 7.0 23 20 - 30% 470,120.00£ 436,120.00£ 5 Buildings and Real Estate 31/10/2009 0.25 01/06/2008 5.0 10220602 201719 3.0 20 10 - 20% 3,813,426.45£ 3,813,426.45£ 28 Retail Stores 01/05/2023 13.75 01/06/2008 3.0 15220631 203895 3.0 5 0 - 10% 4,364,524.76£ 4,364,524.76£ 17 Healthcare, Education and Childcare 25/05/2011 1.82 01/06/2008 2.1 28220632 201874 5.0 12 10 - 20% 600,657.31£ 581,933.60£ 5 Buildings and Real Estate 31/10/2009 0.25 01/06/2008 2.1 15220656 204360 6.0 14 10 - 20% 5,328,206.72£ 5,328,206.72£ 19 Hotels, Motels, Inns and Gaming 30/08/2026 17.08 2 01/06/2008 4.0 15220669 202062 6.0 11 10 - 20% 4,304,355.22£ 4,304,355.22£ 5 Buildings and Real Estate 31/10/2009 0.25 01/06/2009 5.0 11220771 204621 7.0 14 10 - 20% 346,237.50£ 346,237.50£ 5 Buildings and Real Estate 30/10/2009 0.25 01/06/2008 3.0 7220801 203047 5.0 38 30 - 40% 7,650,000.00£ 7,650,000.00£ 28 Retail Stores 25/06/2018 8.90 1 01/06/2008 3.0 8220803 203087 7.0 9 0 - 10% 5,763,214.30£ 5,763,214.30£ 17 Healthcare, Education and Childcare 01/03/2023 13.58 01/06/2008 5.0 15220836 203246 6.0 22 20 - 30% 395,087.53£ 380,393.18£ 6 Chemicals, Plastics and Rubber 31/10/2009 0.25 01/06/2008 5.0 15220837 203248 8.0 22 20 - 30% 911,330.17£ 864,533.02£ 19 Hotels, Motels, Inns and Gaming 16/10/2009 0.21 2 01/06/2008 5.0 16 2220856 204004 5.0 47 40 - 50% 4,795,451.86£ 4,795,451.86£ 20 Insurance 31/03/2013 3.67 1 01/06/2009 6.0 47220865 204395 5.0 13 10 - 20% 3,371,281.84£ 3,371,281.84£ 10 Diversified/Conglomerate Service 08/06/2026 16.85 01/06/2008 3.0 12 1220872 204745 7.0 24 20 - 30% 4,131,036.44£ 4,131,036.44£ 21 Leisure, Amusement, Entertainment 06/12/2023 14.35 01/06/2008 3.0 23220924 200226 5.0 25 20 - 30% 3,155,865.65£ 3,051,298.27£ 27 Cargo Transport 30/06/2023 13.91 01/07/2008 2.1 24220951 204187 8.0 9 0 - 10% 752,645.04£ 647,885.62£ 5 Buildings and Real Estate 10/12/2009 0.36 1 01/07/2008 4.0 15220997 204159 8.0 29 20 - 30% 2,560,200.00£ 2,560,200.00£ 2 Automobile 01/02/2023 13.50 2 01/07/2008 2.5 19221012 200579 4.0 12 10 - 20% 3,774,604.16£ 596,556.70£ 5 Buildings and Real Estate 01/01/2010 0.42 01/06/2009 4.0 12
Page 25 of 5730/06/2008

Data By Reference Obligation
Loan Number Borrower Number BBGBarclays Expected LossSeverity (%) Severity Band
Reference Obligation Outstanding Debt
Reference Obligation Notional Amount
Moody's Industry Sector Moody's Industry Sector Maturity Date
Remaining Term(Years) EWL Syndicated
Date of Entry into Pool
BBG Upon PoolEntry BELS Upon Pool Entry EWL Upon Pool Entry
221024 200603 3.0 6 0 - 10% 636,145.28£ 636,145.28£ 5 Buildings and Real Estate 31/10/2011 2.25 01/07/2008 2.1 15221066 200845 5.0 9 0 - 10% 2,703,250.00£ 2,703,250.00£ 7 Containers, Packaging and Glass 13/05/2018 8.78 01/06/2009 4.0 9221189 201368 5.0 5 0 - 10% 2,566,666.68£ 2,566,666.68£ 19 Hotels, Motels, Inns and Gaming 16/12/2015 6.38 01/07/2008 4.0 7221208 201444 4.0 12 10 - 20% 1,115,050.00£ 1,107,550.00£ 5 Buildings and Real Estate 31/10/2009 0.25 01/07/2008 2.1 12221218 201524 8.0 10 0 - 10% 2,305,000.00£ 2,305,000.00£ 5 Buildings and Real Estate 01/03/2010 0.58 2 01/07/2008 4.0 15221256 204387 8.0 22 20 - 30% 2,452,863.05£ 2,452,863.05£ 21 Leisure, Amusement, Entertainment 30/07/2018 9.00 2 01/07/2008 4.0 15221353 203613 5.0 32 30 - 40% 3,943,547.99£ 2,237,655.12£ 21 Leisure, Amusement, Entertainment 31/10/2009 0.25 1 01/09/2008 5.0 36221402 204040 5.0 9 0 - 10% 2,228,571.44£ 2,228,571.44£ 17 Healthcare, Education and Childcare 22/05/2015 5.81 01/07/2008 5.0 15221418 202644 4.0 17 10 - 20% 1,136,000.00£ 865,750.92£ 5 Buildings and Real Estate 23/10/2009 0.23 01/07/2008 4.0 9221457 203882 8.0 7 0 - 10% 842,749.28£ 842,749.28£ 17 Healthcare, Education and Childcare 31/10/2009 0.25 2 01/12/2008 6.0 7 2221482 204809 6.0 9 0 - 10% 886,587.21£ 883,837.21£ 5 Buildings and Real Estate 31/10/2009 0.25 01/07/2008 4.0 15221503 204518 6.0 20 10 - 20% 1,473,308.51£ 1,473,308.51£ 5 Buildings and Real Estate 31/10/2009 0.25 2 01/03/2009 5.0 20 2221504 204812 5.0 24 20 - 30% 1,750,000.00£ 1,750,000.00£ 5 Buildings and Real Estate 31/10/2009 0.25 01/07/2008 5.0 20221517 204010 5.0 12 10 - 20% 3,438,369.19£ 3,438,369.19£ 8 Personal and Non Durable Consumer Products (Manufactu 31/10/2009 0.25 1 01/06/2009 5.0 12 1221565 200145 8.0 27 20 - 30% 960,000.00£ 960,000.00£ 5 Buildings and Real Estate 31/10/2009 0.25 3 01/08/2008 5.0 15221578 200197 8.0 23 20 - 30% 2,137,065.24£ 2,137,065.24£ 19 Hotels, Motels, Inns and Gaming 27/07/2020 10.99 2 01/08/2008 4.0 19 1221635 200391 4.0 41 40 - 50% 3,463,842.13£ 3,463,842.13£ 13 Electronics 13/08/2015 6.03 1 01/10/2008 4.0 50221680 200585 6.0 28 20 - 30% 346,600.00£ 346,600.00£ 5 Buildings and Real Estate 31/10/2009 0.25 2 01/08/2008 3.0 15 2221681 200585 6.0 28 20 - 30% 548,000.00£ 548,000.00£ 5 Buildings and Real Estate 31/10/2009 0.25 2 01/08/2008 3.0 15 2221683 200585 6.0 28 20 - 30% 596,550.00£ 596,550.00£ 5 Buildings and Real Estate 31/10/2009 0.25 2 01/08/2008 3.0 15 2221684 200585 6.0 28 20 - 30% 443,315.00£ 443,315.00£ 5 Buildings and Real Estate 31/10/2009 0.25 2 01/08/2008 3.0 15 2221685 200585 6.0 28 20 - 30% 460,000.00£ 460,000.00£ 5 Buildings and Real Estate 31/10/2009 0.25 2 01/08/2008 3.0 15 2221686 200585 6.0 28 20 - 30% 743,980.00£ 743,980.00£ 5 Buildings and Real Estate 31/10/2009 0.25 2 01/08/2008 3.0 15 2221700 204140 4.0 14 10 - 20% 2,206,974.25£ 2,206,974.25£ 19 Hotels, Motels, Inns and Gaming 30/05/2024 14.83 01/08/2008 3.0 15221728 200831 6.0 15 10 - 20% 6,649,999.00£ 6,649,999.00£ 2 Automobile 07/08/2018 9.02 2 01/08/2008 4.0 14 2221785 204607 2.5 19 10 - 20% 1,312,221.95£ 1,251,818.09£ 5 Buildings and Real Estate 31/05/2010 0.83 01/08/2008 2.1 15221819 204086 4.0 8 0 - 10% 2,150,000.00£ 2,150,000.00£ 22 Machinery (Non-Agriculture, Non-Construction, Non-Electro 01/05/2015 5.75 01/08/2008 3.0 11221834 203841 8.0 21 20 - 30% 73,386.75£ 48,260.40£ 27 Cargo Transport 31/10/2009 0.25 01/08/2008 5.0 13 2221840 201332 6.0 61 60 - 70% 2,000,000.00£ 2,000,000.00£ 22 Machinery (Non-Agriculture, Non-Construction, Non-Electro 08/07/2013 3.94 2 01/08/2008 3.0 54221886 201537 6.0 30 20 - 30% 819,000.00£ 819,000.00£ 5 Buildings and Real Estate 31/10/2009 0.25 2 01/08/2008 6.0 18221933 203679 6.0 15 10 - 20% 590,797.64£ 554,945.32£ 22 Machinery (Non-Agriculture, Non-Construction, Non-Electro 31/10/2009 0.25 01/08/2008 6.0 15222052 201162 6.0 55 50 - 60% 1,785,668.34£ 1,785,668.34£ 10 Diversified/Conglomerate Service 12/03/2012 2.61 1 01/08/2008 3.0 75222101 204244 8.0 25 20 - 30% 393,631.35£ 114,519.28£ 10 Diversified/Conglomerate Service 31/10/2009 0.25 2 01/08/2008 7.0 36222145 204136 5.0 14 10 - 20% 2,115,834.42£ 2,115,834.42£ 19 Hotels, Motels, Inns and Gaming 13/05/2023 13.78 01/08/2008 5.0 18222146 203205 8.0 30 20 - 30% 1,858,947.54£ 1,792,296.94£ 5 Buildings and Real Estate 31/10/2009 0.25 2 01/08/2008 5.0 15 1222173 200020 8.0 17 10 - 20% 1,505,000.00£ 1,500,000.00£ 2 Automobile 01/05/2010 0.75 1 01/09/2008 1.8 21222178 203817 4.0 5 0 - 10% 518,555.33£ 518,555.33£ 28 Retail Stores 31/10/2009 0.25 01/11/2008 2.8 5222187 204262 8.0 20 10 - 20% 1,406,245.07£ 1,403,739.22£ 19 Hotels, Motels, Inns and Gaming 08/11/2024 15.27 01/09/2008 6.0 15222213 200188 4.0 10 0 - 10% 1,939,445.27£ 1,939,445.27£ 28 Retail Stores 26/02/2023 13.57 01/09/2008 2.5 10222225 204214 8.0 11 10 - 20% 987,390.21£ 957,871.90£ 5 Buildings and Real Estate 31/10/2009 0.25 2 01/09/2008 5.0 15222249 204665 3.0 22 20 - 30% 1,760,000.00£ 1,760,000.00£ 15 Farming and Agriculture 31/10/2009 0.25 01/09/2008 3.0 15222250 203750 4.0 66 60 - 70% 470,020.22£ 470,020.22£ 28 Retail Stores 31/10/2009 0.25 01/09/2008 2.1 67222266 200339 4.0 19 10 - 20% 601,000.00£ 600,000.00£ 5 Buildings and Real Estate 31/10/2009 0.25 2 01/09/2008 4.0 24 2222277 204274 7.0 31 30 - 40% 1,384,272.14£ 1,384,272.14£ 30 Textiles and Leather 04/08/2024 15.01 01/09/2008 7.0 23222278 200417 3.0 10 0 - 10% 1,812,272.71£ 1,684,470.86£ 18 Home and Office Furnishings, Housewares, and Durable Co 31/07/2010 1.00 01/09/2008 1.8 10222316 200579 4.0 12 10 - 20% 968,000.00£ 968,000.00£ 5 Buildings and Real Estate 01/01/2010 0.42 01/09/2008 4.0 18222317 200579 4.0 12 10 - 20% 522,760.00£ 522,760.00£ 5 Buildings and Real Estate 01/01/2010 0.42 01/09/2008 4.0 18222321 204234 3.0 23 20 - 30% 755,659.77£ 384,703.63£ 2 Automobile 31/10/2009 0.25 01/09/2008 2.1 21222350 200761 6.0 13 10 - 20% 1,465,637.31£ 1,465,637.31£ 27 Cargo Transport 07/07/2022 12.93 01/09/2008 3.0 22222357 204291 5.0 12 10 - 20% 304,470.72£ 149,400.38£ 9 Diversified/Conglomerate Manufacturing 31/10/2009 0.25 01/09/2008 3.0 5222380 203902 5.0 10 0 - 10% 1,788,814.70£ 1,708,086.36£ 3 Banking 31/07/2010 1.00 01/09/2008 5.0 10222393 204080 5.0 27 20 - 30% 1,464,632.46£ 1,299,137.39£ 6 Chemicals, Plastics and Rubber 31/10/2009 0.25 1 01/09/2008 4.0 25222418 200413 4.0 11 10 - 20% 28,127,142.47£ 24,500,000.00£ 10 Diversified/Conglomerate Service 03/07/2015 5.92 01/09/2008 2.1 16222425 201105 6.0 28 20 - 30% 1,786,392.74£ 1,786,392.74£ 17 Healthcare, Education and Childcare 12/01/2027 17.45 01/09/2008 2.1 16222444 201195 3.0 20 10 - 20% 1,618,232.11£ 1,459,974.74£ 25 Personal, Food and Miscellaneous 30/06/2018 8.91 01/09/2008 2.8 8222445 201195 3.0 20 10 - 20% 1,332,105.23£ 1,332,105.23£ 25 Personal, Food and Miscellaneous 30/06/2018 8.91 01/09/2008 2.8 8222452 201220 6.0 19 10 - 20% 606,000.00£ 606,000.00£ 5 Buildings and Real Estate 01/06/2010 0.83 2 01/09/2008 4.0 18222468 201299 4.0 47 40 - 50% 486,015.97£ 486,015.97£ 8 Personal and Non Durable Consumer Products (Manufactu 31/07/2010 1.00 01/09/2008 3.0 40222477 204366 8.0 16 10 - 20% 618,686.76£ 442,079.78£ 2 Automobile 31/10/2009 0.25 2 01/09/2008 5.0 16 2222479 201349 5.0 7 0 - 10% 594,833.34£ 594,833.34£ 5 Buildings and Real Estate 31/12/2009 0.42 01/09/2008 4.0 25222521 201553 7.0 32 30 - 40% 1,900,000.01£ 1,900,000.01£ 19 Hotels, Motels, Inns and Gaming 06/08/2013 4.01 1 01/09/2008 4.0 32222540 201641 7.0 30 20 - 30% 1,413,000.00£ 1,413,000.00£ 30 Textiles and Leather 18/07/2010 0.96 01/09/2008 6.0 31222544 201651 6.0 34 30 - 40% 841,547.00£ 826,432.15£ 24 Oil and Gas 31/07/2010 1.00 01/09/2008 6.0 36222554 201671 5.0 28 20 - 30% 1,791,666.70£ 1,791,666.70£ 10 Diversified/Conglomerate Service 03/09/2016 7.09 01/09/2008 5.0 34222560 204445 3.0 5 0 - 10% 2,639,466.64£ 1,165,907.49£ 13 Electronics 31/10/2009 0.25 01/12/2008 6.0 5222562 201718 8.0 14 10 - 20% 1,789,267.05£ 1,789,267.05£ 17 Healthcare, Education and Childcare 04/07/2024 14.93 1 01/09/2008 3.0 14222640 203870 6.0 18 10 - 20% 487,480.99£ 478,727.49£ 13 Electronics 31/10/2009 0.25 01/09/2008 4.0 26222649 204095 6.0 23 20 - 30% 2,040,600.00£ 1,879,000.00£ 22 Machinery (Non-Agriculture, Non-Construction, Non-Electro 09/05/2026 16.77 01/09/2008 4.0 21222711 202500 8.0 28 20 - 30% 2,362,500.00£ 2,362,500.00£ 17 Healthcare, Education and Childcare 30/01/2010 0.50 1 01/09/2008 2.1 30222736 204729 5.0 10 0 - 10% 1,741,734.67£ 1,741,734.67£ 17 Healthcare, Education and Childcare 21/05/2023 13.81 01/09/2008 2.5 10222741 203987 8.0 17 10 - 20% 1,113,516.00£ 1,081,975.83£ 5 Buildings and Real Estate 31/10/2009 0.25 2 01/09/2008 6.0 15222746 203707 6.0 24 20 - 30% 2,454,147.51£ 2,454,147.51£ 22 Machinery (Non-Agriculture, Non-Construction, Non-Electro 31/07/2010 1.00 01/06/2009 6.0 24222751 204108 3.0 25 20 - 30% 75,000,000.00£ 24,500,000.00£ 21 Leisure, Amusement, Entertainment 30/09/2023 14.16 01/09/2008 3.0 25222765 203064 8.0 15 10 - 20% 1,712,500.00£ 1,712,500.00£ 5 Buildings and Real Estate 31/10/2009 0.25 01/09/2008 7.0 15222784 203914 4.0 47 40 - 50% 14,482,412.34£ 9,215,890.59£ 25 Personal, Food and Miscellaneous 04/09/2013 4.09 01/06/2009 4.0 47222785 203914 4.0 47 40 - 50% 16,659,621.64£ 15,284,109.41£ 25 Personal, Food and Miscellaneous 04/09/2013 4.09 01/09/2008 3.0 49222789 204628 7.0 17 10 - 20% 626,838.10£ 609,401.74£ 5 Buildings and Real Estate 31/10/2009 0.25 01/09/2008 8.0 16222803 203717 8.0 18 10 - 20% 1,597,607.44£ 1,577,082.36£ 17 Healthcare, Education and Childcare 01/12/2026 17.33 1 01/09/2008 7.0 20222818 204699 7.0 13 10 - 20% 1,452,601.71£ 1,452,601.71£ 17 Healthcare, Education and Childcare 16/06/2021 11.88 01/09/2008 6.0 10222839 200047 6.0 11 10 - 20% 1,400,000.00£ 1,400,000.00£ 19 Hotels, Motels, Inns and Gaming 06/05/2023 13.76 01/10/2008 2.1 11222852 204554 4.0 6 0 - 10% 1,112,709.36£ 1,112,709.36£ 28 Retail Stores 25/06/2023 13.90 01/10/2008 5.0 20222856 200118 8.0 22 20 - 30% 192,379.42£ 168,966.05£ 21 Leisure, Amusement, Entertainment 31/07/2010 1.00 2 01/10/2008 3.0 18222859 200136 6.0 13 10 - 20% 1,182,079.19£ 1,006,169.90£ 19 Hotels, Motels, Inns and Gaming 31/10/2009 0.25 2 01/10/2008 4.0 12 2
Page 26 of 5730/06/2008

Data By Reference Obligation
Loan Number Borrower Number BBGBarclays Expected LossSeverity (%) Severity Band
Reference Obligation Outstanding Debt
Reference Obligation Notional Amount
Moody's Industry Sector Moody's Industry Sector Maturity Date
Remaining Term(Years) EWL Syndicated
Date of Entry into Pool
BBG Upon PoolEntry BELS Upon Pool Entry EWL Upon Pool Entry
222872 200204 8.0 24 20 - 30% 1,112,810.00£ 1,050,044.00£ 5 Buildings and Real Estate 31/10/2009 0.25 1 01/10/2008 3.0 22222888 200243 8.0 7 0 - 10% 1,002,626.47£ 1,002,626.47£ 17 Healthcare, Education and Childcare 14/08/2026 17.04 01/10/2008 6.0 15222932 200417 3.0 10 0 - 10% 360,667.70£ 215,630.88£ 18 Home and Office Furnishings, Housewares, and Durable Co 31/07/2010 1.00 01/10/2008 1.8 10222935 200430 4.0 74 70 - 80% 1,045,000.00£ 1,045,000.00£ 27 Cargo Transport 01/05/2018 8.75 01/10/2008 3.0 5222941 204479 8.0 22 20 - 30% 864,122.67£ 806,137.93£ 5 Buildings and Real Estate 31/10/2009 0.25 1 01/10/2008 3.0 15222948 204711 7.0 15 10 - 20% 1,103,523.09£ 1,103,523.09£ 17 Healthcare, Education and Childcare 04/11/2024 15.26 01/10/2008 3.0 15222960 200527 6.0 56 50 - 60% 195,744.14£ 195,744.14£ 28 Retail Stores 31/10/2009 0.25 2 01/03/2009 3.0 56 1222969 200578 8.0 38 30 - 40% 625,290.97£ 625,290.97£ 19 Hotels, Motels, Inns and Gaming 31/10/2009 0.25 2 01/10/2008 7.0 65 2222970 200587 4.0 39 30 - 40% 660,132.15£ 660,132.15£ 27 Cargo Transport 31/10/2009 0.25 01/10/2008 4.0 32222971 200613 3.0 24 20 - 30% 1,264,000.09£ 1,264,000.09£ 12 Ecological 02/02/2023 13.50 01/10/2008 2.5 17222989 200712 4.0 56 50 - 60% 399,511.13£ 399,511.13£ 18 Home and Office Furnishings, Housewares, and Durable Co 31/07/2010 1.00 01/10/2008 4.0 58223010 200829 4.0 24 20 - 30% 951,961.61£ 951,961.61£ 17 Healthcare, Education and Childcare 23/10/2023 14.23 01/10/2008 2.1 24223013 200861 8.0 43 40 - 50% 1,104,000.00£ 1,104,000.00£ 29 Telecommunications 02/05/2013 3.75 2 01/10/2008 4.0 43 2223029 203902 5.0 10 0 - 10% 4,005,387.66£ 4,005,387.66£ 3 Banking 31/07/2010 1.00 01/06/2009 5.0 10223052 201004 5.0 33 30 - 40% 819,219.51£ 452,132.68£ 2 Automobile 31/10/2009 0.25 01/10/2008 3.0 32223072 203762 4.0 36 30 - 40% 5,500,000.00£ 5,500,000.00£ 10 Diversified/Conglomerate Service 07/07/2011 1.93 01/06/2009 4.0 40223083 201137 8.0 23 20 - 30% 1,203,600.00£ 1,203,600.00£ 23 Mining, Steel, Iron and Non Precious Metals 12/09/2023 14.11 2 01/10/2008 5.0 21223113 201239 8.0 7 0 - 10% 1,554,974.63£ 1,517,335.93£ 21 Leisure, Amusement, Entertainment 31/10/2009 0.25 2 01/10/2008 5.0 15 2223114 201240 6.0 83 80 - 90% 524,553.08£ 395,234.98£ 2 Automobile 31/10/2009 0.25 01/10/2008 6.0 60223123 201300 2.8 39 30 - 40% 1,497,213.71£ 1,497,213.71£ 18 Home and Office Furnishings, Housewares, and Durable Co 31/10/2009 0.25 01/01/2009 5.0 41223149 204031 4.0 14 10 - 20% 631,871.60£ 214,406.50£ 18 Home and Office Furnishings, Housewares, and Durable Co 31/07/2010 1.00 01/10/2008 1.5 28223155 204705 5.0 14 10 - 20% 2,500,500.00£ 2,500,500.00£ 17 Healthcare, Education and Childcare 13/10/2023 14.20 01/10/2008 2.1 25223156 201418 8.0 8 0 - 10% 1,041,000.00£ 1,041,000.00£ 5 Buildings and Real Estate 15/01/2010 0.46 2 01/10/2008 6.0 8223183 201601 8.0 10 0 - 10% 1,126,645.56£ 1,126,645.56£ 10 Diversified/Conglomerate Service 29/11/2023 14.33 2 01/10/2008 5.0 10 2223209 201690 4.0 41 40 - 50% 2,387,567.18£ 2,387,567.18£ 8 Personal and Non Durable Consumer Products (Manufactu 31/10/2009 0.25 01/06/2009 3.0 41223225 203532 6.0 18 10 - 20% 17,943.32£ 17,943.32£ 5 Buildings and Real Estate 31/10/2009 0.25 2 01/10/2008 1.8 18 1223245 201838 3.0 23 20 - 30% 954,537.60£ 954,537.60£ 23 Mining, Steel, Iron and Non Precious Metals 05/06/2023 13.84 01/10/2008 3.0 20223246 201851 5.0 13 10 - 20% 665,016.00£ 665,016.00£ 5 Buildings and Real Estate 31/10/2009 0.25 01/10/2008 6.0 15223254 201888 5.0 10 0 - 10% 1,366,000.00£ 1,366,000.00£ 30 Textiles and Leather 10/07/2018 8.94 01/10/2008 3.0 10223273 204360 6.0 14 10 - 20% 123,930.49£ 123,930.49£ 19 Hotels, Motels, Inns and Gaming 31/10/2009 0.25 2 01/10/2008 3.0 14223287 203687 1.5 25 20 - 30% 1,368,271.58£ 1,368,271.58£ 15 Farming and Agriculture 22/08/2018 9.06 01/10/2008 1.5 28223307 202138 5.0 13 10 - 20% 5,133,332.00£ 5,133,332.00£ 24 Oil and Gas 09/03/2014 4.61 01/10/2008 4.0 11223319 202214 8.0 82 80 - 90% 1,151,263.99£ 1,151,263.99£ 19 Hotels, Motels, Inns and Gaming 24/05/2015 5.81 2 01/10/2008 6.0 100 2223321 203613 5.0 32 30 - 40% 10,000,000.00£ 10,000,000.00£ 21 Leisure, Amusement, Entertainment 31/10/2009 0.25 1 01/10/2008 5.0 33223333 202299 6.0 18 10 - 20% 1,154,180.96£ 1,154,180.96£ 13 Electronics 31/10/2022 13.25 01/10/2008 4.0 29223342 203877 6.0 35 30 - 40% 974,458.56£ 781,567.88£ 30 Textiles and Leather 31/10/2009 0.25 01/10/2008 2.1 29223351 202433 4.0 10 0 - 10% 955,543.71£ 955,543.71£ 16 Grocery 15/08/2018 9.04 01/10/2008 3.0 11223357 202476 4.0 29 20 - 30% 1,073,154.58£ 1,073,154.58£ 16 Grocery 22/10/2024 15.23 01/10/2008 2.5 27223359 202479 2.5 56 50 - 60% 769,104.00£ 728,248.05£ 17 Healthcare, Education and Childcare 21/08/2011 2.06 01/10/2008 2.5 56223394 202728 3.0 9 0 - 10% 2,000,000.00£ 2,000,000.00£ 30 Textiles and Leather 24/12/2009 0.40 01/06/2009 5.0 9223395 202785 7.0 45 40 - 50% 1,509,000.00£ 1,509,000.00£ 33 Broadcasting & Entertainment 22/10/2011 2.23 01/10/2008 5.0 40 2223396 204833 8.0 19 10 - 20% 1,005,000.00£ 1,005,000.00£ 21 Leisure, Amusement, Entertainment 04/09/2024 15.09 01/10/2008 7.0 20223401 202876 6.0 11 10 - 20% 1,760,000.00£ 1,760,000.00£ 18 Home and Office Furnishings, Housewares, and Durable Co 20/10/2009 0.22 2 01/10/2008 3.0 25223439 202682 7.0 16 10 - 20% 1,322,659.37£ 1,315,829.85£ 17 Healthcare, Education and Childcare 29/07/2026 16.99 01/10/2008 2.1 19223451 203716 7.0 11 10 - 20% 1,510,000.00£ 1,510,000.00£ 17 Healthcare, Education and Childcare 31/10/2023 14.25 01/10/2008 8.0 12223456 204145 6.0 19 10 - 20% 1,414,000.00£ 1,414,000.00£ 19 Hotels, Motels, Inns and Gaming 30/07/2025 16.00 01/10/2008 4.0 18223468 204544 7.0 16 10 - 20% 2,294,727.19£ 1,671,489.65£ 19 Hotels, Motels, Inns and Gaming 25/04/2010 0.73 01/10/2008 5.0 16223513 203922 4.0 65 60 - 70% 814,647.57£ 814,647.57£ 27 Cargo Transport 31/10/2009 0.25 01/06/2009 4.0 65223514 204555 8.0 30 20 - 30% 11,064,000.00£ 10,411,250.00£ 5 Buildings and Real Estate 31/10/2009 0.25 2 01/11/2008 4.0 16223537 204800 4.0 11 10 - 20% 250,000.00£ 250,000.00£ 5 Buildings and Real Estate 31/10/2009 0.25 01/11/2008 3.0 21223542 204214 8.0 11 10 - 20% 650,840.00£ 650,840.00£ 5 Buildings and Real Estate 31/10/2009 0.25 2 01/11/2008 5.0 15223562 204665 3.0 22 20 - 30% 465,178.05£ 367,527.97£ 15 Farming and Agriculture 31/10/2009 0.25 01/11/2008 3.0 15223578 200345 8.0 29 20 - 30% 554,190.00£ 546,000.00£ 5 Buildings and Real Estate 01/02/2010 0.50 2 01/11/2008 3.0 41223589 200399 5.0 9 0 - 10% 468,557.10£ 455,772.71£ 22 Machinery (Non-Agriculture, Non-Construction, Non-Electro 31/10/2009 0.25 01/11/2008 2.8 12223611 203824 1.5 82 80 - 90% 496,082.79£ 478,902.51£ 15 Farming and Agriculture 31/10/2009 0.25 01/11/2008 1.5 100223613 204072 5.0 12 10 - 20% 528,303.23£ 429,217.50£ 2 Automobile 31/10/2009 0.25 01/11/2008 3.0 12223637 200720 6.0 11 10 - 20% 187,928.99£ 170,915.37£ 30 Textiles and Leather 31/10/2009 0.25 01/11/2008 5.0 11223670 203513 1.5 39 30 - 40% 2,678,571.33£ 2,678,571.33£ 10 Diversified/Conglomerate Service 28/11/2010 1.33 01/11/2008 1.5 40223698 201000 8.0 17 10 - 20% 851,700.00£ 845,400.00£ 5 Buildings and Real Estate 31/10/2009 0.25 1 01/11/2008 6.0 33 1223733 204148 8.0 20 10 - 20% 801,885.00£ 797,900.00£ 5 Buildings and Real Estate 31/10/2009 0.25 2 01/11/2008 4.0 29 1223783 204734 4.0 39 30 - 40% 494,861.19£ 494,861.19£ 20 Insurance 31/10/2009 0.25 01/11/2008 1.5 39223795 204805 5.0 14 10 - 20% 600,675.00£ 595,600.00£ 5 Buildings and Real Estate 31/10/2009 0.25 01/11/2008 5.0 14223853 201749 7.0 66 60 - 70% 3,101,208.30£ 3,101,208.30£ 10 Diversified/Conglomerate Service 31/10/2012 3.25 2 01/11/2008 6.0 45 1223933 204790 5.0 11 10 - 20% 841,564.66£ 563,059.75£ 5 Buildings and Real Estate 31/10/2009 0.25 01/04/2009 5.0 12223961 204615 8.0 21 20 - 30% 779,450.00£ 769,000.00£ 5 Buildings and Real Estate 21/02/2010 0.56 2 01/11/2008 4.0 21223962 204615 8.0 21 20 - 30% 245,000.00£ 245,000.00£ 5 Buildings and Real Estate 21/02/2010 0.56 2 01/11/2008 4.0 21223987 204304 6.0 75 70 - 80% 252,510.34£ 174,019.30£ 10 Diversified/Conglomerate Service 31/10/2009 0.25 2 01/11/2008 5.0 75224081 203900 2.5 5 0 - 10% 1,002,559.85£ 583,951.82£ 15 Farming and Agriculture 31/10/2009 0.25 01/11/2008 1.5 5224109 204185 8.0 11 10 - 20% 630,515.00£ 630,515.00£ 5 Buildings and Real Estate 31/10/2009 0.25 2 01/11/2008 5.0 16224124 200713 4.0 41 40 - 50% 1,820,448.55£ 1,820,448.55£ 7 Containers, Packaging and Glass 31/10/2009 0.25 01/03/2009 6.0 41224126 200008 8.0 11 10 - 20% 1,085,000.00£ 1,085,000.00£ 5 Buildings and Real Estate 31/10/2009 0.25 1 01/12/2008 2.5 15 1224131 200008 8.0 11 10 - 20% 2,100,000.00£ 1,900,000.00£ 5 Buildings and Real Estate 31/10/2009 0.25 1 01/12/2008 2.5 15 1224202 204821 8.0 26 20 - 30% 786,574.39£ 731,868.80£ 18 Home and Office Furnishings, Housewares, and Durable Co 31/10/2009 0.25 2 01/12/2008 6.0 26 2224232 203752 3.0 17 10 - 20% 723,738.91£ 564,685.21£ 15 Farming and Agriculture 31/10/2009 0.25 01/12/2008 4.0 5224238 204372 8.0 16 10 - 20% 5,532,565.45£ 5,532,565.45£ 25 Personal, Food and Miscellaneous 27/02/2026 16.57 2 01/12/2008 6.0 16 2224244 200421 5.0 25 20 - 30% 903,137.41£ 900,750.00£ 2 Automobile 22/06/2024 14.89 01/12/2008 6.0 29 2224280 204208 1.5 39 30 - 40% 45,000,000.00£ 24,500,000.00£ 10 Diversified/Conglomerate Service 03/11/2011 2.26 01/12/2008 1.5 41224297 200707 6.0 23 20 - 30% 447,454.50£ 447,454.50£ 6 Chemicals, Plastics and Rubber 31/10/2009 0.25 01/12/2008 4.0 21224303 204824 3.0 16 10 - 20% 838,583.88£ 637,850.17£ 15 Farming and Agriculture 31/10/2009 0.25 01/12/2008 1.5 16224317 203512 3.0 8 0 - 10% 4,150,088.80£ 4,150,088.80£ 17 Healthcare, Education and Childcare 24/01/2026 16.48 01/12/2008 3.0 29224318 203512 3.0 8 0 - 10% 2,834,251.83£ 2,834,251.83£ 17 Healthcare, Education and Childcare 12/03/2027 17.61 01/12/2008 3.0 29224390 204328 8.0 6 0 - 10% 741,971.26£ 741,971.26£ 17 Healthcare, Education and Childcare 31/10/2009 0.25 1 01/12/2008 6.0 5224392 201109 6.0 37 30 - 40% 18,320,000.00£ 18,320,000.00£ 23 Mining, Steel, Iron and Non Precious Metals 30/06/2013 3.91 2 01/12/2008 4.0 37 2
Page 27 of 5730/06/2008

Data By Reference Obligation
Loan Number Borrower Number BBGBarclays Expected LossSeverity (%) Severity Band
Reference Obligation Outstanding Debt
Reference Obligation Notional Amount
Moody's Industry Sector Moody's Industry Sector Maturity Date
Remaining Term(Years) EWL Syndicated
Date of Entry into Pool
BBG Upon PoolEntry BELS Upon Pool Entry EWL Upon Pool Entry
224455 201382 4.0 27 20 - 30% 5,912,162.16£ 5,912,162.16£ 4 Beverage, Food and Tobacco 31/07/2010 1.00 01/12/2008 4.0 27224478 201471 6.0 56 50 - 60% 3,080,863.61£ 3,080,863.61£ 6 Chemicals, Plastics and Rubber 30/06/2010 0.91 2 01/12/2008 5.0 58 2224479 201471 6.0 56 50 - 60% 2,500,000.00£ 2,500,000.00£ 6 Chemicals, Plastics and Rubber 30/06/2010 0.91 2 01/06/2009 6.0 56 2224480 201471 6.0 56 50 - 60% 8,407,737.20£ 8,407,737.20£ 6 Chemicals, Plastics and Rubber 30/06/2010 0.91 2 01/12/2008 5.0 58 2224494 201564 6.0 24 20 - 30% 883,569.27£ 729,987.61£ 23 Mining, Steel, Iron and Non Precious Metals 31/10/2009 0.25 01/12/2008 5.0 24 2224533 200196 6.0 16 10 - 20% 4,020,000.00£ 4,020,000.00£ 19 Hotels, Motels, Inns and Gaming 11/04/2025 15.69 01/12/2008 6.0 13224551 201782 4.0 56 50 - 60% 3,498,559.93£ 3,498,559.93£ 21 Leisure, Amusement, Entertainment 26/11/2009 0.32 01/06/2009 4.0 56224695 202568 6.0 19 10 - 20% 5,407,271.92£ 5,344,616.11£ 17 Healthcare, Education and Childcare 13/09/2025 16.12 01/12/2008 7.0 19224729 202839 4.0 16 10 - 20% 4,929,467.42£ 4,929,467.42£ 19 Hotels, Motels, Inns and Gaming 23/03/2027 17.64 01/12/2008 6.0 18224772 203132 6.0 11 10 - 20% 828,052.92£ 526,092.60£ 7 Containers, Packaging and Glass 31/10/2009 0.25 01/12/2008 4.0 11224789 203327 2.8 47 40 - 50% 4,571,294.64£ 4,571,294.64£ 16 Grocery 31/10/2009 0.25 01/06/2009 2.8 47224794 204154 8.0 12 10 - 20% 3,821,546.22£ 3,821,546.22£ 26 Printing and Publishing 17/01/2026 16.46 2 01/12/2008 5.0 28224805 203474 6.0 66 60 - 70% 6,296,875.00£ 6,296,875.00£ 13 Electronics 02/12/2011 2.34 01/12/2008 4.0 66224812 204602 8.0 24 20 - 30% 4,354,975.00£ 4,354,975.00£ 17 Healthcare, Education and Childcare 06/07/2026 16.93 2 01/12/2008 5.0 24 2224824 204840 8.0 13 10 - 20% 2,980,000.00£ 2,980,000.00£ 17 Healthcare, Education and Childcare 25/10/2022 13.23 01/12/2008 6.0 15224825 204840 8.0 13 10 - 20% 2,397,749.74£ 2,357,374.74£ 17 Healthcare, Education and Childcare 31/10/2009 0.25 01/12/2008 6.0 15224830 200022 5.0 38 30 - 40% 166,758.18£ 166,758.18£ 22 Machinery (Non-Agriculture, Non-Construction, Non-Electro 31/07/2010 1.00 01/01/2009 4.0 38224836 204660 2.8 12 10 - 20% 864,269.96£ 864,269.96£ 17 Healthcare, Education and Childcare 21/02/2026 16.56 01/01/2009 3.0 12224850 200118 8.0 22 20 - 30% 1,792,828.33£ 1,618,988.30£ 21 Leisure, Amusement, Entertainment 31/07/2010 1.00 2 01/01/2009 4.0 22 2224852 200136 6.0 13 10 - 20% 3,249,976.33£ 3,249,976.33£ 19 Hotels, Motels, Inns and Gaming 27/09/2010 1.16 2 01/06/2009 6.0 13 2224854 204267 6.0 27 20 - 30% 1,283,232.05£ 1,283,232.05£ 25 Personal, Food and Miscellaneous 20/04/2019 9.72 01/01/2009 5.0 27 2224860 204842 8.0 19 10 - 20% 1,452,841.03£ 1,422,094.98£ 27 Cargo Transport 21/06/2015 5.89 2 01/01/2009 5.0 13 2224867 200195 5.0 21 20 - 30% 1,176,790.17£ 1,176,790.17£ 13 Electronics 19/11/2011 2.30 01/01/2009 4.0 21224883 204820 4.0 74 70 - 80% 874,996.00£ 874,996.00£ 6 Chemicals, Plastics and Rubber 11/01/2020 10.44 01/01/2009 4.0 78224896 204069 3.0 7 0 - 10% 100,000.00£ 100,000.00£ 21 Leisure, Amusement, Entertainment 06/03/2027 17.60 01/01/2009 4.0 8224924 204372 8.0 16 10 - 20% 1,208,030.90£ 1,208,030.90£ 25 Personal, Food and Miscellaneous 08/11/2026 17.27 2 01/01/2009 6.0 16 2224926 200417 3.0 10 0 - 10% 330,014.14£ 172,787.80£ 18 Home and Office Furnishings, Housewares, and Durable Co 31/07/2010 1.00 01/01/2009 3.0 10224928 200443 6.0 47 40 - 50% 4,494,582.78£ 4,494,582.78£ 23 Mining, Steel, Iron and Non Precious Metals 31/10/2009 0.25 2 01/06/2009 6.0 60224932 200464 4.0 66 60 - 70% 3,556,444.18£ 3,556,444.18£ 28 Retail Stores 31/10/2009 0.25 01/06/2009 4.0 66224972 203588 6.0 20 10 - 20% 2,866,534.20£ 2,866,534.20£ 15 Farming and Agriculture 31/07/2010 1.00 2 01/06/2009 6.0 20 2224982 204825 7.0 35 30 - 40% 1,087,450.00£ 1,087,450.00£ 18 Home and Office Furnishings, Housewares, and Durable Co 24/04/2025 15.73 01/01/2009 7.0 35224999 200748 7.0 18 10 - 20% 1,003,350.00£ 1,003,350.00£ 17 Healthcare, Education and Childcare 13/11/2018 9.28 01/01/2009 6.0 18225001 200904 5.0 45 40 - 50% 1,140,932.70£ 1,140,932.70£ 6 Chemicals, Plastics and Rubber 31/07/2010 1.00 01/01/2009 4.0 45225014 200958 6.0 16 10 - 20% 909,152.18£ 909,152.18£ 17 Healthcare, Education and Childcare 07/01/2021 11.43 01/01/2009 6.0 16225106 204564 3.0 30 20 - 30% 23,559,545.24£ 23,559,545.24£ 26 Printing and Publishing 30/07/2013 4.00 01/01/2009 2.1 30225108 204852 5.0 23 20 - 30% 2,446,560.99£ 2,446,560.99£ 17 Healthcare, Education and Childcare 20/10/2023 14.22 01/01/2009 5.0 23225109 204852 5.0 23 20 - 30% 2,446,560.99£ 2,446,560.99£ 17 Healthcare, Education and Childcare 20/10/2023 14.22 01/01/2009 5.0 23225121 201435 6.0 26 20 - 30% 1,078,579.28£ 1,078,579.28£ 28 Retail Stores 04/01/2025 15.43 01/01/2009 5.0 26225126 201462 5.0 13 10 - 20% 2,353,552.65£ 2,353,552.65£ 15 Farming and Agriculture 06/02/2027 17.51 01/01/2009 5.0 13225147 201609 4.0 27 20 - 30% 4,729,664.88£ 4,729,664.88£ 28 Retail Stores 31/07/2010 1.00 01/06/2009 4.0 27225148 201615 3.0 5 0 - 10% 760,408.29£ 760,408.29£ 11 Diversified Natural Resources, Precious 08/01/2011 1.44 01/01/2009 2.5 13225154 201637 3.0 22 20 - 30% 5,000,000.00£ 5,000,000.00£ 10 Diversified/Conglomerate Service 21/04/2013 3.72 Y 01/06/2009 3.0 22225169 201683 3.0 7 0 - 10% 691,788.94£ 691,788.94£ 18 Home and Office Furnishings, Housewares, and Durable Co 31/07/2010 1.00 01/01/2009 2.1 7225179 201740 5.0 5 0 - 10% 1,045,000.00£ 1,045,000.00£ 22 Machinery (Non-Agriculture, Non-Construction, Non-Electro 24/11/2011 2.31 01/01/2009 5.0 5225180 201751 8.0 13 10 - 20% 1,091,379.67£ 1,091,379.67£ 19 Hotels, Motels, Inns and Gaming 21/02/2027 17.56 2 01/01/2009 8.0 14225201 201831 5.0 22 20 - 30% 1,305,000.00£ 1,305,000.00£ 21 Leisure, Amusement, Entertainment 20/01/2014 4.47 01/01/2009 4.0 20 1225207 201859 6.0 12 10 - 20% 929,704.81£ 929,704.81£ 12 Ecological 04/11/2018 9.26 01/01/2009 5.0 12225219 201897 4.0 5 0 - 10% 591,443.00£ 591,443.00£ 5 Buildings and Real Estate 01/04/2010 0.67 01/01/2009 4.0 5 1225220 201897 4.0 5 0 - 10% 613,000.00£ 613,000.00£ 5 Buildings and Real Estate 01/04/2010 0.67 01/01/2009 4.0 5 1225223 201897 4.0 5 0 - 10% 557,333.00£ 557,333.00£ 5 Buildings and Real Estate 01/04/2010 0.67 01/01/2009 4.0 5 1225224 204094 3.0 5 0 - 10% 1,434,736.87£ 1,011,250.00£ 16 Grocery 20/01/2019 9.47 01/01/2009 3.0 5225225 204725 4.0 6 0 - 10% 1,163,536.72£ 1,163,536.72£ 25 Personal, Food and Miscellaneous 30/01/2016 6.50 01/01/2009 5.0 7225242 204037 5.0 8 0 - 10% 1,560,040.87£ 1,560,040.87£ 6 Chemicals, Plastics and Rubber 31/12/2018 9.42 01/01/2009 5.0 8225261 202098 5.0 18 10 - 20% 2,349,448.68£ 2,349,448.68£ 29 Telecommunications 31/10/2009 0.25 01/06/2009 5.0 21225263 204168 6.0 24 20 - 30% 907,771.72£ 906,994.56£ 30 Textiles and Leather 31/07/2010 1.00 01/01/2009 5.0 24225301 202400 4.0 53 50 - 60% 153,069.54£ 21,614.78£ 18 Home and Office Furnishings, Housewares, and Durable Co 31/07/2010 1.00 01/01/2009 3.0 65225308 203978 5.0 17 10 - 20% 879,350.94£ 874,213.62£ 22 Machinery (Non-Agriculture, Non-Construction, Non-Electro 30/03/2027 17.66 01/01/2009 4.0 20225333 202636 5.0 7 0 - 10% 877,179.87£ 877,179.87£ 30 Textiles and Leather 31/07/2010 1.00 01/01/2009 4.0 7225351 202851 8.0 20 10 - 20% 986,750.10£ 986,750.10£ 19 Hotels, Motels, Inns and Gaming 30/03/2025 15.66 01/01/2009 7.0 20225365 204152 8.0 22 20 - 30% 1,286,900.00£ 1,286,900.00£ 21 Leisure, Amusement, Entertainment 04/10/2009 0.18 2 01/01/2009 8.0 26225371 204696 8.0 12 10 - 20% 1,223,273.19£ 1,223,273.19£ 12 Ecological 23/04/2025 15.73 01/01/2009 8.0 28225375 204709 3.0 17 10 - 20% 1,106,530.94£ 1,106,530.94£ 7 Containers, Packaging and Glass 02/06/2025 15.84 01/01/2009 3.0 15225404 204202 8.0 41 40 - 50% 932,000.00£ 932,000.00£ 19 Hotels, Motels, Inns and Gaming 30/07/2010 1.00 2 01/01/2009 8.0 41 2225415 204005 5.0 8 0 - 10% 1,480,574.63£ 1,480,574.63£ 27 Cargo Transport 11/05/2026 16.78 01/01/2009 4.0 8 2225431 204659 5.0 47 40 - 50% 13,000,000.00£ 1,066,231.46£ 25 Personal, Food and Miscellaneous 30/09/2011 2.16 1 01/01/2009 4.0 49225432 204659 5.0 47 40 - 50% 17,500,000.00£ 17,500,000.00£ 25 Personal, Food and Miscellaneous 04/11/2010 1.26 1 01/06/2009 5.0 47 1225440 200026 7.0 16 10 - 20% 755,553.15£ 755,553.15£ 5 Buildings and Real Estate 31/10/2009 0.25 01/02/2009 8.0 16225501 200339 4.0 19 10 - 20% 1,302,500.00£ 1,302,500.00£ 5 Buildings and Real Estate 31/10/2009 0.25 2 01/02/2009 4.0 24 2225502 200339 4.0 19 10 - 20% 1,510,500.00£ 1,510,500.00£ 5 Buildings and Real Estate 31/10/2009 0.25 2 01/02/2009 4.0 24 2225504 200339 4.0 19 10 - 20% 1,752,900.00£ 1,752,900.00£ 5 Buildings and Real Estate 31/10/2009 0.25 2 01/02/2009 4.0 24 2225536 200536 7.0 60 50 - 60% 7,382,258.05£ 3,002,973.49£ 3 Banking 31/10/2009 0.25 01/02/2009 5.0 43225537 200536 7.0 60 50 - 60% 2,556,090.78£ 942,170.00£ 3 Banking 31/10/2009 0.25 01/02/2009 5.0 43225551 200667 4.0 12 10 - 20% 5,750,000.00£ 5,750,000.00£ 21 Leisure, Amusement, Entertainment 06/02/2014 4.51 01/02/2009 4.0 12225576 200771 5.0 12 10 - 20% 1,076,098.89£ 1,003,278.97£ 5 Buildings and Real Estate 31/10/2009 0.25 01/02/2009 4.0 13225608 203948 5.0 9 0 - 10% 14,500,000.00£ 14,500,000.00£ 6 Chemicals, Plastics and Rubber 31/01/2012 2.50 01/02/2009 5.0 8225640 204515 3.0 20 10 - 20% 1,274,927.65£ 1,237,290.57£ 5 Buildings and Real Estate 31/10/2009 0.25 01/05/2009 3.0 22225664 204380 5.0 10 0 - 10% 1,361,364.80£ 1,361,364.80£ 5 Buildings and Real Estate 31/10/2009 0.25 01/02/2009 6.0 10225707 204442 5.0 24 20 - 30% 12,352,495.23£ 12,352,495.23£ 28 Retail Stores 31/10/2009 0.25 1 01/05/2009 5.0 24 1225712 201479 7.0 83 80 - 90% 1,408,011.66£ 1,408,011.66£ 5 Buildings and Real Estate 31/10/2009 0.25 01/02/2009 6.0 83225730 200282 4.0 39 30 - 40% 25,000,000.00£ 24,500,000.00£ 28 Retail Stores 31/07/2010 1.00 1 01/02/2009 4.0 39 1225743 204444 3.0 49 40 - 50% 3,993,230.62£ 3,697,528.84£ 28 Retail Stores 31/10/2009 0.25 01/02/2009 3.0 49225745 201318 3.0 41 40 - 50% 35,823,574.61£ 24,499,991.13£ 13 Electronics 31/10/2009 0.25 01/02/2009 3.0 41225791 201902 6.0 15 10 - 20% 3,423,151.63£ 3,423,151.63£ 17 Healthcare, Education and Childcare 27/03/2023 13.66 2 01/02/2009 4.0 15
Page 28 of 5730/06/2008

Data By Reference Obligation
Loan Number Borrower Number BBGBarclays Expected LossSeverity (%) Severity Band
Reference Obligation Outstanding Debt
Reference Obligation Notional Amount
Moody's Industry Sector Moody's Industry Sector Maturity Date
Remaining Term(Years) EWL Syndicated
Date of Entry into Pool
BBG Upon PoolEntry BELS Upon Pool Entry EWL Upon Pool Entry
225799 201936 3.0 33 30 - 40% 5,847,709.30£ 5,360,636.49£ 3 Banking 31/10/2009 0.25 2 01/02/2009 2.1 29225808 204788 8.0 9 0 - 10% 1,085,000.00£ 1,085,000.00£ 5 Buildings and Real Estate 31/10/2009 0.25 3 01/02/2009 6.0 9 2225830 202112 8.0 59 50 - 60% 1,500,237.64£ 1,473,059.88£ 5 Buildings and Real Estate 31/10/2009 0.25 2 01/02/2009 5.0 59 2225856 204583 5.0 14 10 - 20% 622,000.00£ 622,000.00£ 5 Buildings and Real Estate 31/10/2009 0.25 01/02/2009 4.0 15225875 204039 1.8 66 60 - 70% 11,000,000.00£ 11,000,000.00£ 13 Electronics 26/07/2010 0.99 01/02/2009 1.8 66225936 200020 8.0 17 10 - 20% 207,889.78£ 207,027.46£ 2 Automobile 31/07/2010 1.00 1 01/03/2009 2.8 21 1225937 200020 8.0 17 10 - 20% 740,548.79£ 736,444.46£ 2 Automobile 31/07/2010 1.00 1 01/03/2009 2.8 21 1225940 200027 3.0 58 50 - 60% 1,000,000.00£ 1,000,000.00£ 28 Retail Stores 31/07/2010 1.00 01/03/2009 3.0 25225948 200078 4.0 5 0 - 10% 1,832,718.03£ 1,694,759.47£ 19 Hotels, Motels, Inns and Gaming 04/12/2023 14.34 01/03/2009 3.0 5225956 200109 6.0 6 0 - 10% 983,514.90£ 983,514.90£ 19 Hotels, Motels, Inns and Gaming 10/03/2024 14.61 01/03/2009 6.0 6225957 200113 4.0 56 50 - 60% 2,265,363.44£ 2,265,363.44£ 30 Textiles and Leather 31/07/2010 1.00 01/06/2009 4.0 56225961 200162 6.0 16 10 - 20% 2,910,416.65£ 2,910,416.65£ 2 Automobile 19/09/2022 13.13 2 01/03/2009 6.0 16 2225980 200247 8.0 5 0 - 10% 850,000.00£ 850,000.00£ 5 Buildings and Real Estate 31/10/2009 0.25 2 01/03/2009 6.0 5225983 200248 6.0 21 20 - 30% 972,945.55£ 972,945.55£ 5 Buildings and Real Estate 31/10/2009 0.25 2 01/03/2009 5.0 15 2225984 200248 6.0 21 20 - 30% 429,476.41£ 429,476.41£ 5 Buildings and Real Estate 31/10/2009 0.25 2 01/03/2009 5.0 15 2225993 203821 4.0 6 0 - 10% 1,142,374.09£ 1,136,240.98£ 16 Grocery 31/07/2010 1.00 01/03/2009 4.0 6226000 200320 7.0 28 20 - 30% 1,998,731.75£ 1,596,318.22£ 21 Leisure, Amusement, Entertainment 31/10/2009 0.25 2 01/03/2009 4.0 28 1226002 204634 7.0 9 0 - 10% 1,033,600.00£ 1,033,600.00£ 6 Chemicals, Plastics and Rubber 19/03/2010 0.63 01/03/2009 5.0 9226010 200364 5.0 45 40 - 50% 1,919,157.16£ 1,919,157.16£ 17 Healthcare, Education and Childcare 05/08/2013 4.01 01/03/2009 2.8 45226025 200429 8.0 18 10 - 20% 896,583.80£ 808,036.25£ 25 Personal, Food and Miscellaneous 31/10/2009 0.25 2 01/03/2009 8.0 18 2226036 200503 3.0 19 10 - 20% 677,050.00£ 677,050.00£ 5 Buildings and Real Estate 31/10/2009 0.25 01/03/2009 3.0 19226043 200572 4.0 83 80 - 90% 1,764,968.85£ 1,764,968.85£ 17 Healthcare, Education and Childcare 06/03/2019 9.60 01/03/2009 3.0 83226058 204779 8.0 14 10 - 20% 1,877,729.50£ 1,877,729.50£ 5 Buildings and Real Estate 31/10/2009 0.25 2 01/03/2009 5.0 14 2226063 203588 6.0 20 10 - 20% 480,651.66£ 386,183.51£ 15 Farming and Agriculture 31/10/2009 0.25 2 01/03/2009 6.0 20 2226065 200728 5.0 5 0 - 10% 3,262,000.00£ 3,262,000.00£ 25 Personal, Food and Miscellaneous 10/08/2022 13.03 01/03/2009 5.0 5226081 200810 6.0 5 0 - 10% 953,706.07£ 803,565.84£ 5 Buildings and Real Estate 31/10/2009 0.25 1 01/03/2009 6.0 5 2226082 200816 5.0 19 10 - 20% 1,863,207.14£ 1,390,433.15£ 11 Diversified Natural Resources, Precious 31/10/2009 0.25 01/03/2009 6.0 26226089 204439 6.0 6 0 - 10% 1,950,000.00£ 1,950,000.00£ 21 Leisure, Amusement, Entertainment 13/03/2014 4.62 01/03/2009 6.0 6226091 200903 4.0 9 0 - 10% 1,850,000.00£ 1,850,000.00£ 10 Diversified/Conglomerate Service 31/10/2010 1.25 01/03/2009 4.0 5226095 200932 6.0 37 30 - 40% 872,655.81£ 856,407.75£ 2 Automobile 31/07/2010 1.00 01/05/2009 6.0 37226106 203516 8.0 65 60 - 70% 916,666.67£ 916,666.67£ 6 Chemicals, Plastics and Rubber 27/02/2012 2.57 1 01/03/2009 5.0 65 1226110 200996 4.0 23 20 - 30% 1,995,000.00£ 1,995,000.00£ 6 Chemicals, Plastics and Rubber 24/02/2014 4.56 01/03/2009 4.0 23226120 201028 8.0 21 20 - 30% 2,464,783.49£ 2,113,203.87£ 5 Buildings and Real Estate 31/10/2009 0.25 2 01/03/2009 3.0 24 2226132 201080 5.0 14 10 - 20% 1,327,847.04£ 1,327,847.04£ 27 Cargo Transport 26/06/2026 16.90 01/03/2009 4.0 14226134 201103 4.0 39 30 - 40% 3,000,000.00£ 3,000,000.00£ 28 Retail Stores 19/10/2011 2.22 Y 01/06/2009 4.0 39226152 201160 5.0 15 10 - 20% 1,249,620.39£ 1,239,483.57£ 21 Leisure, Amusement, Entertainment 01/03/2010 0.58 01/03/2009 4.0 15226160 201224 5.0 14 10 - 20% 866,780.00£ 866,780.00£ 5 Buildings and Real Estate 31/10/2009 0.25 01/03/2009 5.0 14 1226166 203668 4.0 17 10 - 20% 1,156,143.24£ 1,156,143.24£ 22 Machinery (Non-Agriculture, Non-Construction, Non-Electro 23/10/2013 4.23 01/03/2009 4.0 17226168 201277 8.0 20 10 - 20% 263,382.47£ 263,382.47£ 30 Textiles and Leather 31/10/2009 0.25 2 01/03/2009 7.0 20 2226194 201394 5.0 15 10 - 20% 940,279.74£ 935,180.21£ 5 Buildings and Real Estate 01/01/2010 0.42 01/03/2009 4.0 15226199 201440 4.0 20 10 - 20% 5,229,387.65£ 5,229,387.65£ 22 Machinery (Non-Agriculture, Non-Construction, Non-Electro 31/07/2010 1.00 01/06/2009 4.0 20226201 201444 4.0 12 10 - 20% 1,170,000.00£ 905,611.00£ 5 Buildings and Real Estate 31/10/2009 0.25 01/03/2009 4.0 13226202 204032 8.0 10 0 - 10% 942,153.04£ 735,814.49£ 5 Buildings and Real Estate 31/10/2009 0.25 2 01/03/2009 5.0 10 2226234 201653 7.0 16 10 - 20% 749,320.44£ 441,033.05£ 5 Buildings and Real Estate 31/10/2009 0.25 01/03/2009 7.0 16226238 204444 3.0 49 40 - 50% 2,000,000.00£ 2,000,000.00£ 28 Retail Stores 31/07/2010 1.00 01/03/2009 3.0 49226244 201714 6.0 11 10 - 20% 2,451,241.00£ 2,451,241.00£ 19 Hotels, Motels, Inns and Gaming 10/03/2024 14.61 01/03/2009 7.0 11226246 200810 6.0 20 10 - 20% 996,910.58£ 917,658.50£ 5 Buildings and Real Estate 31/10/2009 0.25 1 01/03/2009 6.0 18 2226249 203776 5.0 12 10 - 20% 1,418,536.54£ 1,067,247.41£ 19 Hotels, Motels, Inns and Gaming 16/05/2025 15.79 01/03/2009 4.0 15226292 201935 8.0 11 10 - 20% 919,068.50£ 919,068.50£ 22 Machinery (Non-Agriculture, Non-Construction, Non-Electro 07/09/2020 11.10 1 01/03/2009 3.0 15226298 201957 1.5 48 40 - 50% 37,137.48£ 35,488.04£ 10 Diversified/Conglomerate Service 31/07/2010 1.00 01/03/2009 1.5 48226305 203869 3.0 6 0 - 10% 1,497,594.35£ 1,497,594.35£ 5 Buildings and Real Estate 31/10/2009 0.25 01/03/2009 3.0 6226311 202057 7.0 17 10 - 20% 2,000,000.00£ 2,000,000.00£ 21 Leisure, Amusement, Entertainment 05/02/2024 14.51 01/03/2009 6.0 17226321 202112 8.0 59 50 - 60% 748,781.00£ 748,781.00£ 5 Buildings and Real Estate 31/12/2009 0.42 2 01/03/2009 5.0 59 2226330 202135 5.0 19 10 - 20% 697,601.22£ 636,704.07£ 28 Retail Stores 31/07/2010 1.00 01/06/2009 4.0 19226335 202168 6.0 34 30 - 40% 378,682.90£ 7,684.31£ 13 Electronics 31/07/2010 1.00 2 01/03/2009 4.0 34226350 202355 1.8 35 30 - 40% 2,014,863.33£ 2,014,863.33£ 3 Banking 05/04/2018 8.68 01/03/2009 1.8 35226351 202355 1.8 35 30 - 40% 2,301,154.65£ 2,301,154.65£ 3 Banking 05/04/2018 8.68 01/03/2009 1.8 35226352 202355 1.8 35 30 - 40% 1,172,239.40£ 1,172,239.40£ 3 Banking 05/04/2018 8.68 01/03/2009 1.8 35226359 204304 6.0 75 70 - 80% 1,277,162.34£ 1,277,162.34£ 10 Diversified/Conglomerate Service 28/02/2011 1.58 2 01/03/2009 6.0 75226360 204304 6.0 75 70 - 80% 1,000,000.00£ 900,000.00£ 10 Diversified/Conglomerate Service 04/01/2011 1.43 2 01/03/2009 6.0 75226361 201162 6.0 55 50 - 60% 842,554.22£ 842,554.22£ 10 Diversified/Conglomerate Service 24/05/2013 3.81 1 01/03/2009 5.0 53226366 202452 8.0 5 0 - 10% 936,998.67£ 936,998.67£ 18 Home and Office Furnishings, Housewares, and Durable Co 25/06/2016 6.90 2 01/03/2009 4.0 100 2226397 202700 5.0 14 10 - 20% 2,401,201.00£ 2,237,137.05£ 5 Buildings and Real Estate 31/10/2009 0.25 1 01/03/2009 4.0 17226402 202810 8.0 35 30 - 40% 2,455,500.00£ 2,455,500.00£ 17 Healthcare, Education and Childcare 31/10/2009 0.25 2 01/03/2009 7.0 15 2226406 203567 6.0 47 40 - 50% 10,907,196.32£ 7,516,897.92£ 13 Electronics 12/07/2011 1.95 1 01/06/2009 6.0 47 1226425 203995 4.0 16 10 - 20% 1,463,779.48£ 1,463,779.48£ 28 Retail Stores 16/03/2019 9.63 01/03/2009 6.0 17226442 202788 8.0 22 20 - 30% 830,531.89£ 821,316.00£ 5 Buildings and Real Estate 31/10/2009 0.25 2 01/03/2009 3.0 19 2226445 203289 7.0 49 40 - 50% 1,116,666.72£ 1,116,666.72£ 13 Electronics 30/06/2011 1.91 1 01/03/2009 8.0 56226468 202322 6.0 27 20 - 30% 749,939.30£ 749,939.30£ 5 Buildings and Real Estate 31/10/2009 0.25 01/03/2009 5.0 27226469 202322 6.0 27 20 - 30% 757,500.00£ 757,500.00£ 5 Buildings and Real Estate 31/10/2009 0.25 01/03/2009 5.0 27226486 204504 4.0 15 10 - 20% 757,360.33£ 695,607.62£ 5 Buildings and Real Estate 31/10/2009 0.25 01/04/2009 4.0 15226512 204248 8.0 6 0 - 10% 1,272,000.00£ 1,272,000.00£ 21 Leisure, Amusement, Entertainment 27/03/2024 14.66 2 01/04/2009 6.0 6 2226524 204514 4.0 5 0 - 10% 6,250,000.00£ 6,250,000.00£ 5 Buildings and Real Estate 31/10/2009 0.25 01/04/2009 4.0 5226529 200339 4.0 19 10 - 20% 560,312.60£ 525,000.00£ 5 Buildings and Real Estate 31/10/2009 0.25 2 01/04/2009 4.0 24 2226545 200395 6.0 7 0 - 10% 1,453,500.00£ 1,453,500.00£ 27 Cargo Transport 01/04/2024 14.67 01/04/2009 6.0 7226558 203936 5.0 34 30 - 40% 2,300,500.00£ 2,300,500.00£ 30 Textiles and Leather 23/04/2024 14.73 01/04/2009 4.0 34226566 203558 2.8 28 20 - 30% 7,333,333.33£ 5,157,007.67£ 4 Beverage, Food and Tobacco 07/11/2010 1.27 01/06/2009 2.8 28226602 200884 4.0 16 10 - 20% 2,844,642.00£ 2,844,642.00£ 2 Automobile 02/04/2013 3.67 01/06/2009 4.0 16226623 201020 6.0 21 20 - 30% 659,544.75£ 657,900.00£ 5 Buildings and Real Estate 28/11/2009 0.33 01/04/2009 4.0 21226639 201104 3.0 9 0 - 10% 1,404,232.64£ 1,404,232.64£ 5 Buildings and Real Estate 31/10/2009 0.25 01/06/2009 2.1 9226644 203836 2.1 10 0 - 10% 3,300,000.00£ 3,300,000.00£ 5 Buildings and Real Estate 31/10/2009 0.25 01/04/2009 2.1 10226653 201182 1.2 56 50 - 60% 529,822.92£ 510,003.37£ 17 Healthcare, Education and Childcare 31/10/2009 0.25 01/04/2009 1.2 56226658 201212 3.0 5 0 - 10% 1,328,575.10£ 1,326,695.85£ 5 Buildings and Real Estate 31/10/2009 0.25 01/04/2009 2.8 5
Page 29 of 5730/06/2008
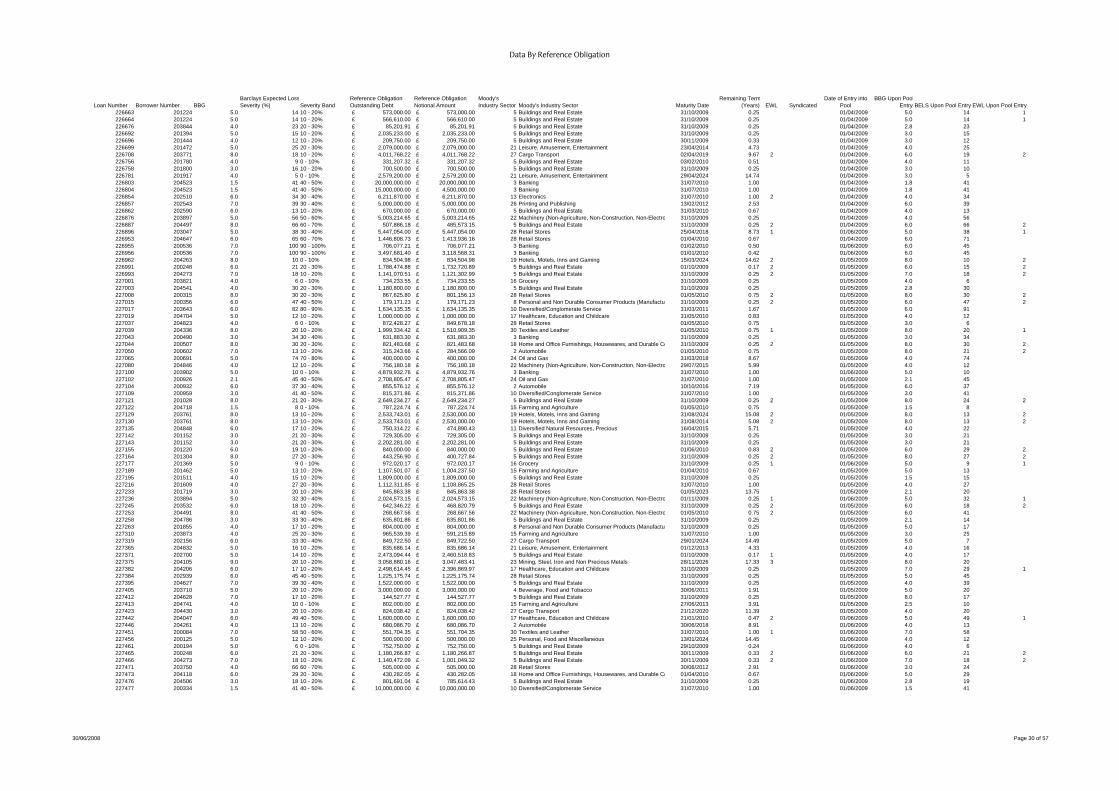
Data By Reference Obligation
Loan Number Borrower Number BBGBarclays Expected LossSeverity (%) Severity Band
Reference Obligation Outstanding Debt
Reference Obligation Notional Amount
Moody's Industry Sector Moody's Industry Sector Maturity Date
Remaining Term(Years) EWL Syndicated
Date of Entry into Pool
BBG Upon PoolEntry BELS Upon Pool Entry EWL Upon Pool Entry
226663 201224 5.0 14 10 - 20% 573,000.00£ 573,000.00£ 5 Buildings and Real Estate 31/10/2009 0.25 01/04/2009 5.0 14 1226664 201224 5.0 14 10 - 20% 566,610.00£ 566,610.00£ 5 Buildings and Real Estate 31/10/2009 0.25 01/04/2009 5.0 14 1226676 203844 4.0 23 20 - 30% 85,201.91£ 85,201.91£ 5 Buildings and Real Estate 31/10/2009 0.25 01/04/2009 2.8 23226692 201394 5.0 15 10 - 20% 2,035,233.00£ 2,035,233.00£ 5 Buildings and Real Estate 31/10/2009 0.25 01/04/2009 3.0 15226696 201444 4.0 12 10 - 20% 209,750.00£ 209,750.00£ 5 Buildings and Real Estate 30/11/2009 0.33 01/04/2009 3.0 12226699 201472 5.0 25 20 - 30% 2,079,000.00£ 2,079,000.00£ 21 Leisure, Amusement, Entertainment 23/04/2014 4.73 01/04/2009 4.0 25226708 203771 8.0 18 10 - 20% 4,011,768.22£ 4,011,768.22£ 27 Cargo Transport 02/04/2019 9.67 2 01/04/2009 6.0 19 2226756 201780 4.0 9 0 - 10% 331,207.32£ 331,207.32£ 5 Buildings and Real Estate 03/02/2010 0.51 01/04/2009 4.0 11226758 201800 3.0 16 10 - 20% 700,500.00£ 700,500.00£ 5 Buildings and Real Estate 31/10/2009 0.25 01/04/2009 3.0 10226781 201917 4.0 5 0 - 10% 2,579,200.00£ 2,579,200.00£ 21 Leisure, Amusement, Entertainment 29/04/2024 14.74 01/04/2009 3.0 5226803 204523 1.5 41 40 - 50% 20,000,000.00£ 20,000,000.00£ 3 Banking 31/07/2010 1.00 01/04/2009 1.8 41226804 204523 1.5 41 40 - 50% 15,000,000.00£ 4,500,000.00£ 3 Banking 31/07/2010 1.00 01/04/2009 1.8 41226854 202510 6.0 34 30 - 40% 6,211,870.00£ 6,211,870.00£ 13 Electronics 31/07/2010 1.00 2 01/04/2009 4.0 34226857 202543 7.0 39 30 - 40% 5,000,000.00£ 5,000,000.00£ 26 Printing and Publishing 13/02/2012 2.53 01/04/2009 6.0 39226862 202590 6.0 13 10 - 20% 670,000.00£ 670,000.00£ 5 Buildings and Real Estate 31/03/2010 0.67 01/04/2009 4.0 13226876 203897 5.0 56 50 - 60% 5,003,214.65£ 5,003,214.65£ 22 Machinery (Non-Agriculture, Non-Construction, Non-Electro 31/10/2009 0.25 01/04/2009 4.0 56226887 204497 8.0 66 60 - 70% 507,886.18£ 485,573.15£ 5 Buildings and Real Estate 31/10/2009 0.25 2 01/04/2009 6.0 66 2226896 203047 5.0 38 30 - 40% 5,447,054.00£ 5,447,054.00£ 28 Retail Stores 25/04/2018 8.73 1 01/06/2009 5.0 38 1226953 204647 6.0 65 60 - 70% 1,446,808.73£ 1,413,936.16£ 28 Retail Stores 01/04/2010 0.67 01/04/2009 6.0 71226955 200536 7.0 100 90 - 100% 706,077.21£ 706,077.21£ 3 Banking 01/02/2010 0.50 01/06/2009 6.0 45226956 200536 7.0 100 90 - 100% 3,497,681.40£ 3,118,568.31£ 3 Banking 01/01/2010 0.42 01/06/2009 6.0 45226962 204263 8.0 10 0 - 10% 834,504.98£ 834,504.98£ 19 Hotels, Motels, Inns and Gaming 15/03/2024 14.62 2 01/05/2009 8.0 10 2226991 200248 6.0 21 20 - 30% 1,788,474.88£ 1,732,720.89£ 5 Buildings and Real Estate 01/10/2009 0.17 2 01/05/2009 6.0 15 2226993 204273 7.0 18 10 - 20% 1,141,070.51£ 1,121,302.99£ 5 Buildings and Real Estate 31/10/2009 0.25 2 01/05/2009 7.0 18 2227001 203821 4.0 6 0 - 10% 734,233.55£ 734,233.55£ 16 Grocery 31/10/2009 0.25 01/05/2009 4.0 6227003 204541 4.0 30 20 - 30% 1,180,800.00£ 1,180,800.00£ 5 Buildings and Real Estate 31/10/2009 0.25 01/05/2009 2.8 30227008 200315 8.0 30 20 - 30% 867,625.80£ 801,156.13£ 28 Retail Stores 01/05/2010 0.75 2 01/05/2009 8.0 30 2227015 200356 6.0 47 40 - 50% 179,171.23£ 179,171.23£ 8 Personal and Non Durable Consumer Products (Manufactu 31/10/2009 0.25 2 01/05/2009 6.0 47 2227017 203643 6.0 82 80 - 90% 1,634,135.35£ 1,634,135.35£ 10 Diversified/Conglomerate Service 31/03/2011 1.67 01/05/2009 6.0 91227019 204704 5.0 12 10 - 20% 1,000,000.00£ 1,000,000.00£ 17 Healthcare, Education and Childcare 31/05/2010 0.83 01/05/2009 4.0 12227037 204823 4.0 6 0 - 10% 872,428.27£ 849,678.18£ 28 Retail Stores 01/05/2010 0.75 01/05/2009 3.0 6227039 204336 8.0 20 10 - 20% 1,999,334.42£ 1,510,909.35£ 30 Textiles and Leather 01/05/2010 0.75 1 01/05/2009 8.0 20 1227043 200490 3.0 34 30 - 40% 631,883.30£ 631,883.30£ 3 Banking 31/10/2009 0.25 01/05/2009 3.0 34227044 200507 8.0 30 20 - 30% 821,483.68£ 821,483.68£ 18 Home and Office Furnishings, Housewares, and Durable Co 31/10/2009 0.25 2 01/05/2009 8.0 30 2227050 200602 7.0 13 10 - 20% 315,243.66£ 284,566.09£ 2 Automobile 01/05/2010 0.75 01/05/2009 8.0 21 2227065 200691 5.0 74 70 - 80% 400,000.00£ 400,000.00£ 24 Oil and Gas 31/03/2018 8.67 01/05/2009 4.0 74227080 204846 4.0 12 10 - 20% 756,180.18£ 756,180.18£ 22 Machinery (Non-Agriculture, Non-Construction, Non-Electro 29/07/2015 5.99 01/05/2009 4.0 12227100 203902 5.0 10 0 - 10% 4,879,932.76£ 4,879,932.76£ 3 Banking 31/07/2010 1.00 01/06/2009 5.0 10227102 200926 2.1 45 40 - 50% 2,708,805.47£ 2,708,805.47£ 24 Oil and Gas 31/07/2010 1.00 01/05/2009 2.1 45227104 200932 6.0 37 30 - 40% 855,576.12£ 855,576.12£ 2 Automobile 10/10/2016 7.19 01/05/2009 6.0 37227109 200959 3.0 41 40 - 50% 815,371.86£ 815,371.86£ 10 Diversified/Conglomerate Service 31/07/2010 1.00 01/05/2009 3.0 41227121 201028 8.0 21 20 - 30% 2,649,234.27£ 2,649,234.27£ 5 Buildings and Real Estate 31/10/2009 0.25 2 01/05/2009 8.0 24 2227122 204718 1.5 8 0 - 10% 787,224.74£ 787,224.74£ 15 Farming and Agriculture 01/05/2010 0.75 01/05/2009 1.5 8227129 203761 8.0 13 10 - 20% 2,533,743.01£ 2,530,000.00£ 19 Hotels, Motels, Inns and Gaming 31/08/2024 15.08 2 01/05/2009 8.0 13 2227130 203761 8.0 13 10 - 20% 2,533,743.01£ 2,530,000.00£ 19 Hotels, Motels, Inns and Gaming 31/08/2014 5.08 2 01/05/2009 8.0 13 2227135 204848 6.0 17 10 - 20% 750,314.22£ 474,890.43£ 11 Diversified Natural Resources, Precious 16/04/2015 5.71 01/05/2009 4.0 22227142 201152 3.0 21 20 - 30% 729,305.00£ 729,305.00£ 5 Buildings and Real Estate 31/10/2009 0.25 01/05/2009 3.0 21227143 201152 3.0 21 20 - 30% 2,202,281.00£ 2,202,281.00£ 5 Buildings and Real Estate 31/10/2009 0.25 01/05/2009 3.0 21227155 201220 6.0 19 10 - 20% 840,000.00£ 840,000.00£ 5 Buildings and Real Estate 01/06/2010 0.83 2 01/05/2009 6.0 29 2227164 201304 8.0 27 20 - 30% 443,256.90£ 400,727.84£ 5 Buildings and Real Estate 31/10/2009 0.25 2 01/05/2009 8.0 27 2227177 201369 5.0 9 0 - 10% 972,020.17£ 972,020.17£ 16 Grocery 31/10/2009 0.25 1 01/06/2009 5.0 9 1227189 201462 5.0 13 10 - 20% 1,107,501.07£ 1,004,237.50£ 15 Farming and Agriculture 01/04/2010 0.67 01/05/2009 5.0 13227195 201511 4.0 15 10 - 20% 1,809,000.00£ 1,809,000.00£ 5 Buildings and Real Estate 31/10/2009 0.25 01/05/2009 1.5 15227216 201609 4.0 27 20 - 30% 1,112,311.85£ 1,108,865.25£ 28 Retail Stores 31/07/2010 1.00 01/05/2009 4.0 27227233 201719 3.0 20 10 - 20% 845,863.38£ 845,863.38£ 28 Retail Stores 01/05/2023 13.75 01/05/2009 2.1 20227236 203894 5.0 32 30 - 40% 2,024,573.15£ 2,024,573.15£ 22 Machinery (Non-Agriculture, Non-Construction, Non-Electro 01/11/2009 0.25 1 01/06/2009 5.0 32 1227245 203532 6.0 18 10 - 20% 642,346.22£ 468,820.79£ 5 Buildings and Real Estate 31/10/2009 0.25 2 01/05/2009 6.0 18 2227253 204491 8.0 41 40 - 50% 268,667.56£ 268,667.56£ 22 Machinery (Non-Agriculture, Non-Construction, Non-Electro 01/05/2010 0.75 2 01/05/2009 6.0 41227258 204786 3.0 33 30 - 40% 635,801.86£ 635,801.86£ 5 Buildings and Real Estate 31/10/2009 0.25 01/05/2009 2.1 14227263 201855 4.0 17 10 - 20% 804,000.00£ 804,000.00£ 8 Personal and Non Durable Consumer Products (Manufactu 31/10/2009 0.25 01/05/2009 5.0 17227310 203873 4.0 25 20 - 30% 965,539.39£ 591,215.89£ 15 Farming and Agriculture 31/07/2010 1.00 01/05/2009 3.0 25227319 202156 6.0 33 30 - 40% 849,722.50£ 849,722.50£ 27 Cargo Transport 29/01/2024 14.49 01/05/2009 5.0 7227365 204832 5.0 16 10 - 20% 835,686.14£ 835,686.14£ 21 Leisure, Amusement, Entertainment 01/12/2013 4.33 01/05/2009 4.0 16227371 202700 5.0 14 10 - 20% 2,473,094.44£ 2,460,518.83£ 5 Buildings and Real Estate 01/10/2009 0.17 1 01/05/2009 4.0 17227375 204105 9.0 20 10 - 20% 3,058,880.16£ 3,047,483.41£ 23 Mining, Steel, Iron and Non Precious Metals 28/11/2026 17.33 3 01/05/2009 8.0 20227382 204206 6.0 17 10 - 20% 2,498,614.45£ 2,396,869.97£ 17 Healthcare, Education and Childcare 31/10/2009 0.25 01/05/2009 7.0 29 1227384 202939 6.0 45 40 - 50% 1,225,175.74£ 1,225,175.74£ 28 Retail Stores 31/10/2009 0.25 01/05/2009 5.0 45227395 204627 7.0 39 30 - 40% 1,522,000.00£ 1,522,000.00£ 5 Buildings and Real Estate 31/10/2009 0.25 01/05/2009 4.0 39227405 203710 5.0 20 10 - 20% 3,000,000.00£ 3,000,000.00£ 4 Beverage, Food and Tobacco 30/06/2011 1.91 01/05/2009 5.0 20227412 204628 7.0 17 10 - 20% 144,527.77£ 144,527.77£ 5 Buildings and Real Estate 31/10/2009 0.25 01/05/2009 8.0 17227413 204741 4.0 10 0 - 10% 802,000.00£ 802,000.00£ 15 Farming and Agriculture 27/06/2013 3.91 01/05/2009 2.5 10227423 204430 3.0 20 10 - 20% 824,038.42£ 824,038.42£ 27 Cargo Transport 21/12/2020 11.39 01/05/2009 4.0 20227442 204047 6.0 49 40 - 50% 1,600,000.00£ 1,600,000.00£ 17 Healthcare, Education and Childcare 21/01/2010 0.47 2 01/06/2009 5.0 49 1227446 204261 4.0 13 10 - 20% 680,086.70£ 680,086.70£ 2 Automobile 30/06/2018 8.91 01/06/2009 4.0 13227451 200084 7.0 58 50 - 60% 551,704.35£ 551,704.35£ 30 Textiles and Leather 31/07/2010 1.00 1 01/06/2009 7.0 58227456 200125 5.0 12 10 - 20% 500,000.00£ 500,000.00£ 25 Personal, Food and Miscellaneous 13/01/2024 14.45 01/06/2009 4.0 12227461 200194 5.0 6 0 - 10% 752,750.00£ 752,750.00£ 5 Buildings and Real Estate 29/10/2009 0.24 01/06/2009 4.0 6227465 200248 6.0 21 20 - 30% 1,180,266.87£ 1,180,266.87£ 5 Buildings and Real Estate 30/11/2009 0.33 2 01/06/2009 6.0 21 2227466 204273 7.0 18 10 - 20% 1,140,472.09£ 1,001,049.32£ 5 Buildings and Real Estate 30/11/2009 0.33 2 01/06/2009 7.0 18 2227471 203750 4.0 66 60 - 70% 505,000.00£ 505,000.00£ 28 Retail Stores 30/06/2012 2.91 01/06/2009 3.0 24227473 204118 6.0 29 20 - 30% 430,282.05£ 430,282.05£ 18 Home and Office Furnishings, Housewares, and Durable Co 01/04/2010 0.67 01/06/2009 5.0 29227476 204506 3.0 18 10 - 20% 801,691.04£ 785,614.43£ 5 Buildings and Real Estate 31/10/2009 0.25 01/06/2009 2.8 19227477 200334 1.5 41 40 - 50% 10,000,000.00£ 10,000,000.00£ 10 Diversified/Conglomerate Service 31/07/2010 1.00 01/06/2009 1.5 41
Page 30 of 5730/06/2008

Data By Reference Obligation
Loan Number Borrower Number BBGBarclays Expected LossSeverity (%) Severity Band
Reference Obligation Outstanding Debt
Reference Obligation Notional Amount
Moody's Industry Sector Moody's Industry Sector Maturity Date
Remaining Term(Years) EWL Syndicated
Date of Entry into Pool
BBG Upon PoolEntry BELS Upon Pool Entry EWL Upon Pool Entry
227478 200342 6.0 56 50 - 60% 597,911.36£ 597,911.36£ 30 Textiles and Leather 04/11/2012 3.26 01/06/2009 6.0 56227482 200356 6.0 47 40 - 50% 3,624,545.42£ 3,624,545.42£ 8 Personal and Non Durable Consumer Products (Manufactu 31/07/2010 1.00 2 01/06/2009 6.0 47 2227483 203642 6.0 53 50 - 60% 701,655.51£ 701,655.51£ 18 Home and Office Furnishings, Housewares, and Durable Co 31/10/2009 0.25 01/06/2009 6.0 53227484 203822 1.8 60 50 - 60% 1,869,045.11£ 1,718,752.95£ 18 Home and Office Furnishings, Housewares, and Durable Co 31/10/2009 0.25 01/06/2009 1.8 60227495 200396 7.0 5 0 - 10% 1,712,229.31£ 1,712,229.31£ 28 Retail Stores 27/05/2014 4.82 2 01/06/2009 6.0 5 2227496 203932 4.0 11 10 - 20% 700,000.00£ 700,000.00£ 19 Hotels, Motels, Inns and Gaming 31/12/2010 1.42 01/06/2009 4.0 11227498 204372 8.0 16 10 - 20% 684,090.43£ 684,090.43£ 25 Personal, Food and Miscellaneous 30/11/2025 16.33 2 01/06/2009 8.0 16 2227500 204275 5.0 13 10 - 20% 878,524.78£ 728,524.78£ 27 Cargo Transport 27/03/2024 14.66 01/06/2009 4.0 11227504 200472 3.0 12 10 - 20% 770,900.00£ 670,900.00£ 17 Healthcare, Education and Childcare 02/02/2011 1.50 01/06/2009 2.5 12227505 204711 7.0 15 10 - 20% 696,482.75£ 696,482.75£ 17 Healthcare, Education and Childcare 22/10/2024 15.23 01/06/2009 6.0 15227506 204711 7.0 15 10 - 20% 581,719.70£ 581,719.70£ 17 Healthcare, Education and Childcare 23/06/2024 14.89 01/06/2009 6.0 15227508 200491 5.0 5 0 - 10% 2,644,796.88£ 2,644,796.88£ 5 Buildings and Real Estate 31/12/2009 0.42 2 01/06/2009 5.0 5 2227510 204845 4.0 14 10 - 20% 567,719.06£ 567,719.06£ 27 Cargo Transport 08/01/2016 6.44 01/06/2009 5.0 14227517 203652 4.0 17 10 - 20% 984,354.95£ 833,479.68£ 16 Grocery 01/05/2010 0.75 01/06/2009 3.0 17227519 200669 8.0 33 30 - 40% 770,964.73£ 770,964.73£ 28 Retail Stores 01/06/2010 0.83 2 01/06/2009 8.0 33 2227525 204074 6.0 55 50 - 60% 432,513.52£ 432,513.52£ 13 Electronics 01/05/2010 0.75 01/06/2009 5.0 55227526 204779 8.0 14 10 - 20% 2,116,988.81£ 2,116,988.81£ 5 Buildings and Real Estate 28/01/2010 0.49 2 01/06/2009 8.0 14 2227527 204858 6.0 18 10 - 20% 518,217.72£ 518,217.72£ 16 Grocery 24/05/2016 6.81 01/06/2009 5.0 18227528 204605 8.0 18 10 - 20% 1,025,000.00£ 1,025,000.00£ 5 Buildings and Real Estate 31/10/2009 0.25 2 01/06/2009 8.0 18 2227529 204605 8.0 18 10 - 20% 679,269.00£ 679,269.00£ 5 Buildings and Real Estate 31/10/2009 0.25 2 01/06/2009 8.0 18 2227532 203509 5.0 18 10 - 20% 561,000.00£ 561,000.00£ 5 Buildings and Real Estate 15/12/2009 0.37 01/06/2009 5.0 18227533 203509 5.0 18 10 - 20% 561,000.00£ 561,000.00£ 5 Buildings and Real Estate 15/12/2009 0.37 01/06/2009 5.0 18227535 203509 5.0 18 10 - 20% 775,000.00£ 721,610.00£ 5 Buildings and Real Estate 15/12/2009 0.37 01/06/2009 5.0 18227536 203509 5.0 18 10 - 20% 865,000.00£ 865,000.00£ 5 Buildings and Real Estate 15/12/2009 0.37 01/06/2009 5.0 18227537 204767 7.0 60 50 - 60% 882,489.08£ 882,489.08£ 30 Textiles and Leather 31/10/2009 0.25 3 01/06/2009 6.0 60 2227540 200783 5.0 17 10 - 20% 759,935.99£ 759,935.99£ 4 Beverage, Food and Tobacco 15/12/2018 9.37 01/06/2009 5.0 17227545 200824 7.0 66 60 - 70% 819,919.86£ 749,836.63£ 5 Buildings and Real Estate 20/10/2009 0.22 01/06/2009 6.0 66227546 200824 7.0 66 60 - 70% 616,675.40£ 610,429.90£ 5 Buildings and Real Estate 20/10/2009 0.22 01/06/2009 6.0 66227547 204486 5.0 16 10 - 20% 380,957.49£ 380,957.49£ 17 Healthcare, Education and Childcare 01/05/2010 0.75 01/06/2009 4.0 18227548 200854 4.0 53 50 - 60% 298,018.18£ 298,018.18£ 10 Diversified/Conglomerate Service 01/05/2010 0.75 2 01/06/2009 4.0 53 2227550 203891 3.0 60 50 - 60% 909,461.31£ 758,213.04£ 21 Leisure, Amusement, Entertainment 31/07/2010 1.00 01/06/2009 3.0 60227551 200883 8.0 32 30 - 40% 1,105,666.10£ 1,099,730.07£ 22 Machinery (Non-Agriculture, Non-Construction, Non-Electro 31/07/2010 1.00 1 01/06/2009 8.0 32 1227556 200916 4.0 8 0 - 10% 330,936.13£ 330,936.13£ 9 Diversified/Conglomerate Manufacturing 31/10/2009 0.25 01/06/2009 3.0 8227557 200918 4.0 12 10 - 20% 1,137,039.39£ 1,126,953.97£ 22 Machinery (Non-Agriculture, Non-Construction, Non-Electro 31/07/2010 1.00 01/06/2009 3.0 12227558 200926 2.1 45 40 - 50% 77,443.40£ 77,443.40£ 24 Oil and Gas 31/07/2010 1.00 01/06/2009 2.1 45227561 203760 4.0 13 10 - 20% 956,249.88£ 956,249.88£ 21 Leisure, Amusement, Entertainment 31/07/2010 1.00 01/06/2009 4.0 13227562 203760 4.0 13 10 - 20% 1,400,000.00£ 1,400,000.00£ 21 Leisure, Amusement, Entertainment 31/07/2010 1.00 01/06/2009 4.0 13227564 200964 5.0 8 0 - 10% 1,845,117.73£ 1,291,873.46£ 2 Automobile 31/10/2009 0.25 01/06/2009 5.0 8227565 203516 8.0 65 60 - 70% 534,535.74£ 534,535.74£ 6 Chemicals, Plastics and Rubber 31/07/2010 1.00 1 01/06/2009 7.0 65 1227568 201000 8.0 17 10 - 20% 715,163.76£ 657,874.44£ 5 Buildings and Real Estate 15/10/2009 0.21 1 01/06/2009 8.0 17 1227569 201000 8.0 17 10 - 20% 639,278.25£ 639,278.25£ 5 Buildings and Real Estate 15/10/2009 0.21 1 01/06/2009 8.0 17 1227570 201007 3.0 15 10 - 20% 1,250,000.00£ 1,250,000.00£ 2 Automobile 03/06/2010 0.84 01/06/2009 3.0 15227585 201109 6.0 37 30 - 40% 566,784.71£ 566,784.71£ 23 Mining, Steel, Iron and Non Precious Metals 31/07/2010 1.00 2 01/06/2009 6.0 37 2227594 201175 6.0 18 10 - 20% 805,000.00£ 805,000.00£ 5 Buildings and Real Estate 30/11/2009 0.33 01/06/2009 5.0 18227595 201176 8.0 19 10 - 20% 632,372.42£ 632,372.42£ 3 Banking 07/07/2023 13.93 2 01/06/2009 8.0 19 2227596 201178 6.0 17 10 - 20% 501,604.18£ 501,604.18£ 23 Mining, Steel, Iron and Non Precious Metals 18/06/2024 14.88 01/06/2009 6.0 17227597 204050 5.0 18 10 - 20% 972,194.54£ 655,134.45£ 22 Machinery (Non-Agriculture, Non-Construction, Non-Electro 01/05/2010 0.75 01/06/2009 5.0 18227599 201186 5.0 41 40 - 50% 371,947.33£ 341,789.52£ 15 Farming and Agriculture 31/10/2009 0.25 01/06/2009 4.0 41227602 201213 4.0 43 40 - 50% 1,087,363.63£ 1,087,363.63£ 10 Diversified/Conglomerate Service 31/07/2010 1.00 01/06/2009 4.0 39227604 204379 4.0 5 0 - 10% 689,953.40£ 689,953.40£ 17 Healthcare, Education and Childcare 24/09/2018 9.15 01/06/2009 2.1 5227605 201220 6.0 19 10 - 20% 435,000.00£ 435,000.00£ 5 Buildings and Real Estate 01/06/2010 0.83 2 01/06/2009 6.0 29 2227606 204851 6.0 21 20 - 30% 762,000.00£ 762,000.00£ 16 Grocery 28/01/2019 9.49 01/06/2009 6.0 21227616 201332 6.0 61 60 - 70% 3,020,454.52£ 3,020,454.52£ 22 Machinery (Non-Agriculture, Non-Construction, Non-Electro 13/12/2010 1.37 2 01/06/2009 6.0 61 2227617 201336 3.0 64 60 - 70% 1,020,000.00£ 1,020,000.00£ 5 Buildings and Real Estate 01/12/2009 0.33 01/06/2009 3.0 64227619 201342 1.5 39 30 - 40% 700,745.45£ 700,745.45£ 24 Oil and Gas 31/07/2010 1.00 01/06/2009 1.5 39227622 201349 5.0 7 0 - 10% 2,385,000.00£ 2,385,000.00£ 5 Buildings and Real Estate 31/10/2009 0.25 01/06/2009 5.0 7227623 201349 5.0 7 0 - 10% 536,333.34£ 533,333.34£ 5 Buildings and Real Estate 31/12/2009 0.42 01/06/2009 5.0 7227624 201349 5.0 7 0 - 10% 590,333.34£ 590,333.34£ 5 Buildings and Real Estate 31/12/2009 0.42 01/06/2009 5.0 7227627 203956 6.0 6 0 - 10% 734,746.24£ 716,490.14£ 19 Hotels, Motels, Inns and Gaming 11/02/2016 6.53 01/06/2009 6.0 6227628 204087 8.0 54 50 - 60% 570,370.43£ 561,386.54£ 22 Machinery (Non-Agriculture, Non-Construction, Non-Electro 01/06/2010 0.83 2 01/06/2009 8.0 54 2227630 204682 1.5 7 0 - 10% 500,000.00£ 500,000.00£ 15 Farming and Agriculture 16/02/2027 17.54 01/06/2009 1.5 15227632 201394 5.0 15 10 - 20% 711,691.57£ 688,234.31£ 5 Buildings and Real Estate 01/01/2010 0.42 01/06/2009 4.0 15227633 201474 6.0 58 50 - 60% 7,947.83£ 7,947.83£ 8 Personal and Non Durable Consumer Products (Manufactu 31/07/2010 1.00 2 01/06/2009 6.0 58 2227638 203850 5.0 13 10 - 20% 650,000.00£ 650,000.00£ 21 Leisure, Amusement, Entertainment 30/06/2016 6.91 01/06/2009 3.0 13227639 201524 8.0 10 0 - 10% 2,900,000.00£ 2,900,000.00£ 5 Buildings and Real Estate 22/12/2009 0.39 2 01/06/2009 8.0 10 2227642 201569 6.0 14 10 - 20% 1,417,184.22£ 1,417,184.22£ 5 Buildings and Real Estate 31/12/2009 0.42 01/06/2009 4.0 17227645 201597 6.0 17 10 - 20% 777,903.75£ 642,625.14£ 2 Automobile 31/10/2009 0.25 01/06/2009 6.0 17227646 204329 6.0 77 70 - 80% 704,282.09£ 704,282.09£ 22 Machinery (Non-Agriculture, Non-Construction, Non-Electro 01/06/2010 0.83 01/06/2009 4.0 77227649 201604 5.0 74 70 - 80% 845,727.27£ 845,727.27£ 29 Telecommunications 14/09/2010 1.12 1 01/06/2009 5.0 74 1227650 201609 4.0 27 20 - 30% 1,703,940.69£ 1,691,946.62£ 28 Retail Stores 31/07/2010 1.00 01/06/2009 4.0 27227652 204034 5.0 34 30 - 40% 630,530.86£ 630,530.86£ 16 Grocery 31/07/2010 1.00 01/06/2009 5.0 34227653 204591 3.0 20 10 - 20% 600,000.00£ 600,000.00£ 5 Buildings and Real Estate 27/12/2009 0.41 01/06/2009 3.0 20227658 204330 4.0 26 20 - 30% 427,922.69£ 427,922.69£ 30 Textiles and Leather 31/10/2009 0.25 01/06/2009 4.0 26227673 203861 5.0 26 20 - 30% 603,945.40£ 590,892.62£ 6 Chemicals, Plastics and Rubber 01/06/2010 0.83 01/06/2009 4.0 26227679 204516 5.0 13 10 - 20% 562,000.00£ 562,000.00£ 5 Buildings and Real Estate 31/12/2009 0.42 01/06/2009 4.0 21227680 204516 5.0 13 10 - 20% 570,000.00£ 570,000.00£ 5 Buildings and Real Estate 31/12/2009 0.42 01/06/2009 4.0 21227686 201859 6.0 12 10 - 20% 683,687.49£ 649,217.38£ 12 Ecological 31/10/2009 0.25 01/06/2009 6.0 12227687 201873 3.0 10 0 - 10% 2,100,000.00£ 2,100,000.00£ 5 Buildings and Real Estate 31/12/2009 0.42 01/06/2009 3.0 10227689 201878 5.0 50 40 - 50% 747,602.77£ 738,896.61£ 22 Machinery (Non-Agriculture, Non-Construction, Non-Electro 31/07/2010 1.00 01/06/2009 5.0 50227690 204736 8.0 21 20 - 30% 728,137.92£ 728,137.92£ 15 Farming and Agriculture 01/06/2010 0.83 2 01/06/2009 8.0 21 2227691 203867 3.0 37 30 - 40% 7,401,230.58£ 7,401,230.58£ 5 Buildings and Real Estate 16/11/2009 0.29 01/06/2009 3.0 37227692 203964 6.0 28 20 - 30% 3,823,533.86£ 3,773,279.98£ 4 Beverage, Food and Tobacco 31/10/2009 0.25 2 01/06/2009 5.0 28 1227703 201916 4.0 45 40 - 50% 639,750.22£ 639,750.22£ 30 Textiles and Leather 28/02/2023 13.58 01/06/2009 4.0 45
Page 31 of 5730/06/2008
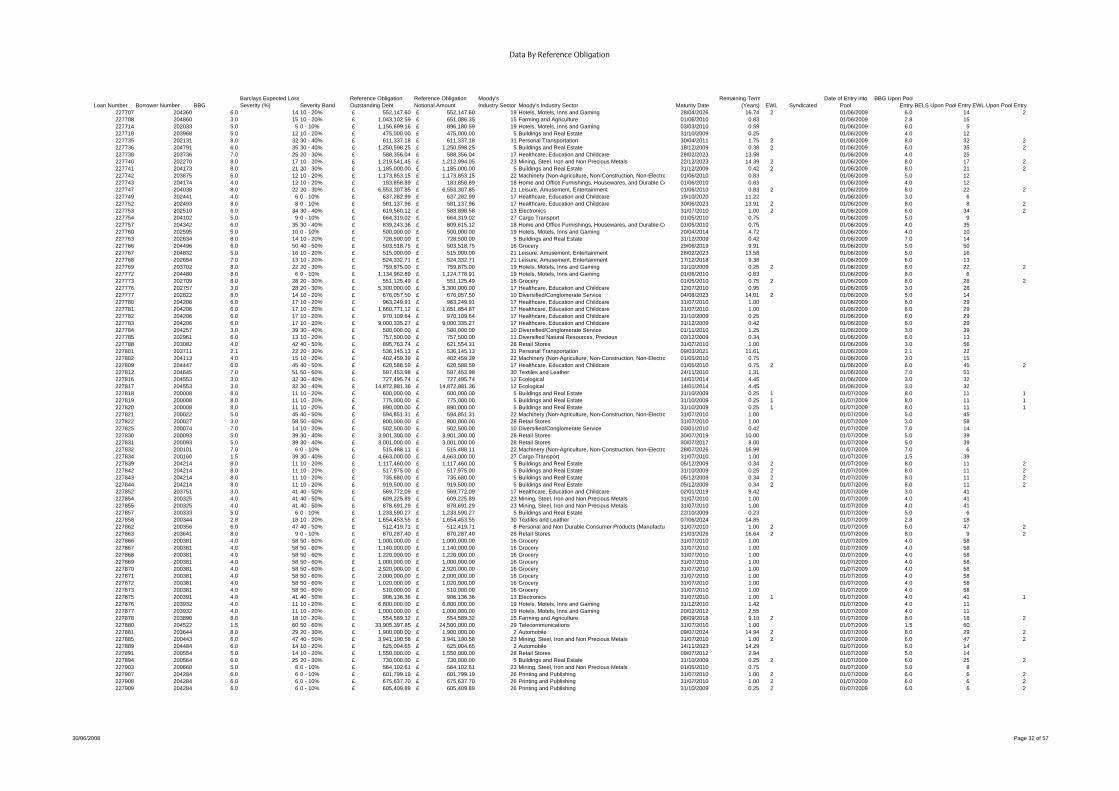
Data By Reference Obligation
Loan Number Borrower Number BBGBarclays Expected LossSeverity (%) Severity Band
Reference Obligation Outstanding Debt
Reference Obligation Notional Amount
Moody's Industry Sector Moody's Industry Sector Maturity Date
Remaining Term(Years) EWL Syndicated
Date of Entry into Pool
BBG Upon PoolEntry BELS Upon Pool Entry EWL Upon Pool Entry
227707 204360 6.0 14 10 - 20% 552,147.60£ 552,147.60£ 19 Hotels, Motels, Inns and Gaming 28/04/2026 16.74 2 01/06/2009 6.0 14 2227708 204860 3.0 15 10 - 20% 1,043,102.59£ 651,086.35£ 15 Farming and Agriculture 01/06/2010 0.83 01/06/2009 2.8 15227714 202033 5.0 5 0 - 10% 1,156,699.16£ 896,180.59£ 19 Hotels, Motels, Inns and Gaming 03/03/2010 0.59 01/06/2009 6.0 5227718 203968 5.0 12 10 - 20% 475,000.00£ 475,000.00£ 5 Buildings and Real Estate 31/10/2009 0.25 01/06/2009 4.0 12227735 202131 8.0 32 30 - 40% 611,337.18£ 611,337.18£ 31 Personal Transportation 30/04/2011 1.75 2 01/06/2009 8.0 32 2227736 204791 6.0 35 30 - 40% 1,250,598.25£ 1,250,598.25£ 5 Buildings and Real Estate 18/12/2009 0.38 2 01/06/2009 6.0 35 2227738 203736 7.0 25 20 - 30% 588,356.04£ 588,356.04£ 17 Healthcare, Education and Childcare 28/02/2023 13.58 01/06/2009 4.0 25227740 202270 8.0 17 10 - 20% 1,219,541.45£ 1,212,994.05£ 23 Mining, Steel, Iron and Non Precious Metals 22/12/2023 14.39 2 01/06/2009 8.0 17 2227741 204173 8.0 21 20 - 30% 1,185,000.00£ 1,185,000.00£ 5 Buildings and Real Estate 31/12/2009 0.42 2 01/06/2009 8.0 21 2227742 203875 6.0 12 10 - 20% 1,173,853.15£ 1,173,853.15£ 22 Machinery (Non-Agriculture, Non-Construction, Non-Electro 01/06/2010 0.83 01/06/2009 5.0 12227743 204174 4.0 12 10 - 20% 183,858.89£ 183,858.89£ 18 Home and Office Furnishings, Housewares, and Durable Co 01/06/2010 0.83 01/06/2009 4.0 12227747 204038 8.0 22 20 - 30% 6,553,307.85£ 6,553,307.85£ 21 Leisure, Amusement, Entertainment 01/06/2010 0.83 2 01/06/2009 8.0 22 2227749 202441 4.0 6 0 - 10% 637,282.99£ 637,282.99£ 17 Healthcare, Education and Childcare 19/10/2020 11.22 01/06/2009 3.0 6227752 202493 8.0 8 0 - 10% 581,137.96£ 581,137.96£ 17 Healthcare, Education and Childcare 30/06/2023 13.91 2 01/06/2009 8.0 8 2227753 202510 6.0 34 30 - 40% 619,560.12£ 583,898.58£ 13 Electronics 31/07/2010 1.00 2 01/06/2009 6.0 34 2227754 204102 5.0 9 0 - 10% 664,319.02£ 664,319.02£ 27 Cargo Transport 01/05/2010 0.75 01/06/2009 5.0 9227757 204342 6.0 35 30 - 40% 839,243.36£ 809,615.12£ 18 Home and Office Furnishings, Housewares, and Durable Co 01/05/2010 0.75 01/06/2009 4.0 35227760 202595 5.0 10 0 - 10% 500,000.00£ 500,000.00£ 19 Hotels, Motels, Inns and Gaming 20/04/2014 4.72 01/06/2009 4.0 10227763 202634 8.0 14 10 - 20% 728,500.00£ 728,500.00£ 5 Buildings and Real Estate 31/12/2009 0.42 01/06/2009 7.0 14227766 204496 6.0 50 40 - 50% 503,518.75£ 503,518.75£ 16 Grocery 29/06/2019 9.91 01/06/2009 5.0 50227767 204832 5.0 16 10 - 20% 515,000.00£ 515,000.00£ 21 Leisure, Amusement, Entertainment 28/02/2023 13.58 01/06/2009 5.0 16227768 202654 7.0 13 10 - 20% 524,332.71£ 524,332.71£ 21 Leisure, Amusement, Entertainment 17/12/2018 9.38 01/06/2009 6.0 13227769 203702 8.0 22 20 - 30% 759,875.00£ 759,875.00£ 19 Hotels, Motels, Inns and Gaming 31/10/2009 0.25 2 01/06/2009 8.0 22 2227772 204480 8.0 6 0 - 10% 1,134,962.89£ 1,124,778.91£ 19 Hotels, Motels, Inns and Gaming 01/06/2010 0.83 01/06/2009 8.0 6227773 202709 8.0 28 20 - 30% 551,125.49£ 551,125.49£ 16 Grocery 01/05/2010 0.75 2 01/06/2009 8.0 28 2227776 202757 3.0 28 20 - 30% 5,300,000.00£ 5,300,000.00£ 17 Healthcare, Education and Childcare 12/07/2010 0.95 01/06/2009 3.0 28227777 202822 8.0 14 10 - 20% 676,057.50£ 676,057.50£ 10 Diversified/Conglomerate Service 04/08/2023 14.01 2 01/06/2009 5.0 14227780 204206 6.0 17 10 - 20% 963,249.91£ 963,249.91£ 17 Healthcare, Education and Childcare 31/07/2010 1.00 01/06/2009 6.0 29227781 204206 6.0 17 10 - 20% 1,660,771.12£ 1,651,854.87£ 17 Healthcare, Education and Childcare 31/07/2010 1.00 01/06/2009 6.0 29227782 204206 6.0 17 10 - 20% 970,109.64£ 970,109.64£ 17 Healthcare, Education and Childcare 31/10/2009 0.25 01/06/2009 6.0 29227783 204206 6.0 17 10 - 20% 9,000,335.27£ 9,000,335.27£ 17 Healthcare, Education and Childcare 31/12/2009 0.42 01/06/2009 6.0 29227784 204257 3.0 39 30 - 40% 500,000.00£ 500,000.00£ 10 Diversified/Conglomerate Service 01/11/2010 1.25 01/06/2009 3.0 39227785 202961 6.0 13 10 - 20% 757,500.00£ 757,500.00£ 11 Diversified Natural Resources, Precious 03/12/2009 0.34 01/06/2009 6.0 13227788 203082 4.0 42 40 - 50% 895,763.74£ 621,554.31£ 28 Retail Stores 31/07/2010 1.00 01/06/2009 3.0 56227801 203711 2.1 22 20 - 30% 536,145.13£ 536,145.13£ 31 Personal Transportation 09/03/2021 11.61 01/06/2009 2.1 22227802 204113 4.0 15 10 - 20% 402,459.39£ 402,459.39£ 22 Machinery (Non-Agriculture, Non-Construction, Non-Electro 01/05/2010 0.75 01/06/2009 3.0 15227809 204447 6.0 45 40 - 50% 620,588.59£ 620,588.59£ 17 Healthcare, Education and Childcare 01/05/2010 0.75 2 01/06/2009 6.0 45 2227812 204645 7.0 51 50 - 60% 597,453.98£ 597,453.98£ 30 Textiles and Leather 24/11/2010 1.31 01/06/2009 7.0 51227816 204553 3.0 32 30 - 40% 727,495.74£ 727,495.74£ 12 Ecological 14/01/2014 4.45 01/06/2009 3.0 32227817 204553 3.0 32 30 - 40% 14,872,881.36£ 14,872,881.36£ 12 Ecological 14/01/2014 4.45 01/06/2009 3.0 32227818 200008 8.0 11 10 - 20% 600,000.00£ 600,000.00£ 5 Buildings and Real Estate 31/10/2009 0.25 1 01/07/2009 8.0 11 1227819 200008 8.0 11 10 - 20% 775,000.00£ 775,000.00£ 5 Buildings and Real Estate 31/10/2009 0.25 1 01/07/2009 8.0 11 1227820 200008 8.0 11 10 - 20% 890,000.00£ 890,000.00£ 5 Buildings and Real Estate 31/10/2009 0.25 1 01/07/2009 8.0 11 1227821 200022 5.0 45 40 - 50% 594,851.31£ 594,851.31£ 22 Machinery (Non-Agriculture, Non-Construction, Non-Electro 31/07/2010 1.00 01/07/2009 5.0 45227822 200027 3.0 58 50 - 60% 800,000.00£ 800,000.00£ 28 Retail Stores 31/07/2010 1.00 01/07/2009 3.0 58227825 200074 7.0 14 10 - 20% 502,500.00£ 502,500.00£ 10 Diversified/Conglomerate Service 03/01/2010 0.42 01/07/2009 7.0 14227830 200093 5.0 39 30 - 40% 3,901,300.00£ 3,901,300.00£ 28 Retail Stores 30/07/2019 10.00 01/07/2009 5.0 39227831 200093 5.0 39 30 - 40% 3,001,000.00£ 3,001,000.00£ 28 Retail Stores 30/07/2017 8.00 01/07/2009 5.0 39227832 200101 7.0 6 0 - 10% 515,488.11£ 515,488.11£ 22 Machinery (Non-Agriculture, Non-Construction, Non-Electro 28/07/2026 16.99 01/07/2009 7.0 6227834 200160 1.5 39 30 - 40% 4,663,000.00£ 4,663,000.00£ 27 Cargo Transport 31/07/2010 1.00 01/07/2009 1.5 39227839 204214 8.0 11 10 - 20% 1,117,460.00£ 1,117,460.00£ 5 Buildings and Real Estate 05/12/2009 0.34 2 01/07/2009 8.0 11 2227842 204214 8.0 11 10 - 20% 517,975.00£ 517,975.00£ 5 Buildings and Real Estate 31/10/2009 0.25 2 01/07/2009 8.0 11 2227843 204214 8.0 11 10 - 20% 735,680.00£ 735,680.00£ 5 Buildings and Real Estate 05/12/2009 0.34 2 01/07/2009 8.0 11 2227844 204214 8.0 11 10 - 20% 919,500.00£ 919,500.00£ 5 Buildings and Real Estate 05/12/2009 0.34 2 01/07/2009 8.0 11 2227852 203751 3.0 41 40 - 50% 569,772.09£ 569,772.09£ 17 Healthcare, Education and Childcare 02/01/2019 9.42 01/07/2009 3.0 41227854 200325 4.0 41 40 - 50% 609,225.89£ 609,225.89£ 23 Mining, Steel, Iron and Non Precious Metals 31/07/2010 1.00 01/07/2009 4.0 41227855 200325 4.0 41 40 - 50% 878,691.29£ 878,691.29£ 23 Mining, Steel, Iron and Non Precious Metals 31/07/2010 1.00 01/07/2009 4.0 41227857 200333 5.0 6 0 - 10% 1,233,590.27£ 1,233,590.27£ 5 Buildings and Real Estate 22/10/2009 0.23 01/07/2009 5.0 6227858 200344 2.8 18 10 - 20% 1,654,453.55£ 1,654,453.55£ 30 Textiles and Leather 07/06/2024 14.85 01/07/2009 2.8 18227862 200356 6.0 47 40 - 50% 512,419.71£ 512,419.71£ 8 Personal and Non Durable Consumer Products (Manufactu 31/07/2010 1.00 2 01/07/2009 6.0 47 2227863 203641 8.0 9 0 - 10% 870,287.40£ 870,287.40£ 28 Retail Stores 21/03/2026 16.64 2 01/07/2009 8.0 9 2227866 200381 4.0 58 50 - 60% 1,000,000.00£ 1,000,000.00£ 16 Grocery 31/07/2010 1.00 01/07/2009 4.0 58227867 200381 4.0 58 50 - 60% 1,140,000.00£ 1,140,000.00£ 16 Grocery 31/07/2010 1.00 01/07/2009 4.0 58227868 200381 4.0 58 50 - 60% 1,220,000.00£ 1,220,000.00£ 16 Grocery 31/07/2010 1.00 01/07/2009 4.0 58227869 200381 4.0 58 50 - 60% 1,000,000.00£ 1,000,000.00£ 16 Grocery 31/07/2010 1.00 01/07/2009 4.0 58227870 200381 4.0 58 50 - 60% 2,920,000.00£ 2,920,000.00£ 16 Grocery 31/07/2010 1.00 01/07/2009 4.0 58227871 200381 4.0 58 50 - 60% 2,000,000.00£ 2,000,000.00£ 16 Grocery 31/07/2010 1.00 01/07/2009 4.0 58227872 200381 4.0 58 50 - 60% 1,020,000.00£ 1,020,000.00£ 16 Grocery 31/07/2010 1.00 01/07/2009 4.0 58227873 200381 4.0 58 50 - 60% 510,000.00£ 510,000.00£ 16 Grocery 31/07/2010 1.00 01/07/2009 4.0 58227875 200391 4.0 41 40 - 50% 906,136.36£ 906,136.36£ 13 Electronics 31/07/2010 1.00 1 01/07/2009 4.0 41 1227876 203932 4.0 11 10 - 20% 6,800,000.00£ 6,800,000.00£ 19 Hotels, Motels, Inns and Gaming 31/12/2010 1.42 01/07/2009 4.0 11227877 203932 4.0 11 10 - 20% 1,000,000.00£ 1,000,000.00£ 19 Hotels, Motels, Inns and Gaming 20/02/2012 2.55 01/07/2009 4.0 11227878 203890 8.0 18 10 - 20% 554,589.32£ 554,589.32£ 15 Farming and Agriculture 08/09/2018 9.10 2 01/07/2009 8.0 18 2227880 204522 1.5 60 50 - 60% 33,905,397.85£ 24,500,000.00£ 29 Telecommunications 31/07/2010 1.00 01/07/2009 1.5 60227881 203644 8.0 29 20 - 30% 1,900,000.00£ 1,900,000.00£ 2 Automobile 09/07/2024 14.94 2 01/07/2009 8.0 29 2227885 200443 6.0 47 40 - 50% 3,941,190.58£ 3,941,190.58£ 23 Mining, Steel, Iron and Non Precious Metals 31/07/2010 1.00 2 01/07/2009 6.0 47 2227889 204484 6.0 14 10 - 20% 625,004.65£ 625,004.65£ 2 Automobile 14/11/2023 14.29 01/07/2009 6.0 14227891 200554 5.0 14 10 - 20% 1,550,000.00£ 1,550,000.00£ 28 Retail Stores 09/07/2012 2.94 01/07/2009 5.0 14227894 200564 6.0 25 20 - 30% 730,000.00£ 730,000.00£ 5 Buildings and Real Estate 31/10/2009 0.25 2 01/07/2009 6.0 25 2227903 200660 5.0 8 0 - 10% 564,102.61£ 564,102.61£ 23 Mining, Steel, Iron and Non Precious Metals 01/05/2010 0.75 01/07/2009 5.0 8227907 204284 6.0 6 0 - 10% 601,799.19£ 601,799.19£ 26 Printing and Publishing 31/07/2010 1.00 2 01/07/2009 6.0 6 2227908 204284 6.0 6 0 - 10% 675,637.70£ 675,637.70£ 26 Printing and Publishing 31/07/2010 1.00 2 01/07/2009 6.0 6 2227909 204284 6.0 6 0 - 10% 605,409.89£ 605,409.89£ 26 Printing and Publishing 31/10/2009 0.25 2 01/07/2009 6.0 6 2
Page 32 of 5730/06/2008
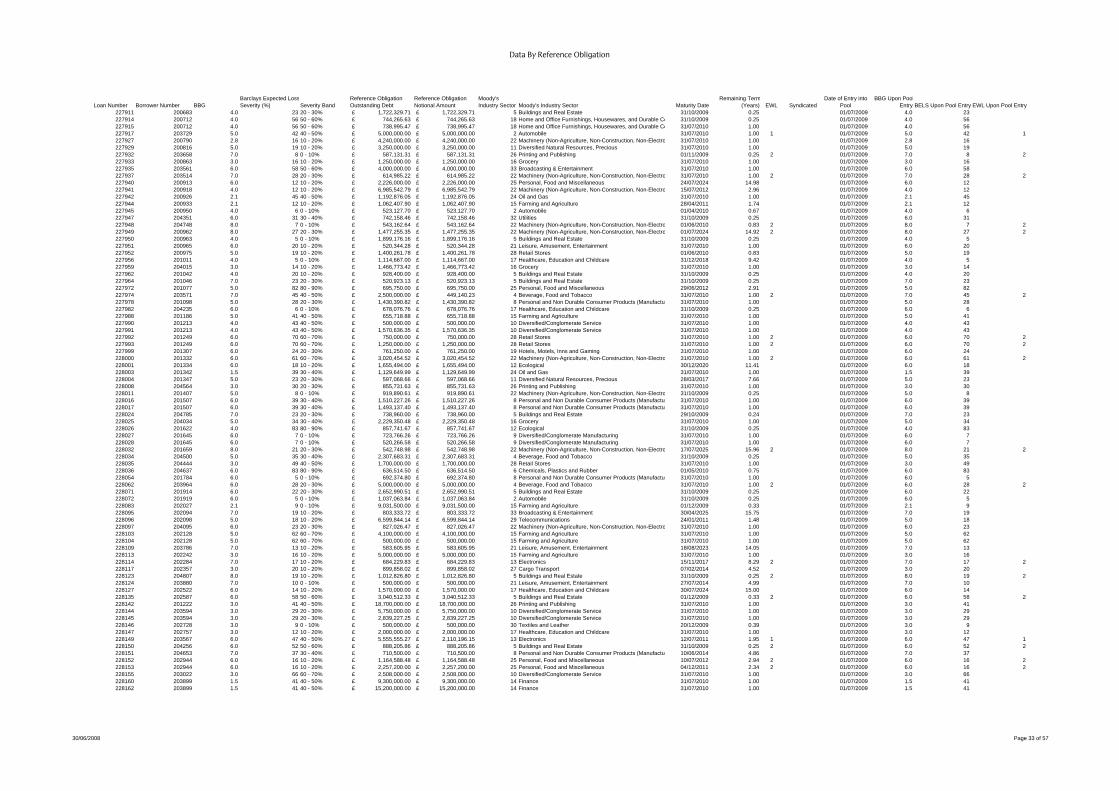
Data By Reference Obligation
Loan Number Borrower Number BBGBarclays Expected LossSeverity (%) Severity Band
Reference Obligation Outstanding Debt
Reference Obligation Notional Amount
Moody's Industry Sector Moody's Industry Sector Maturity Date
Remaining Term(Years) EWL Syndicated
Date of Entry into Pool
BBG Upon PoolEntry BELS Upon Pool Entry EWL Upon Pool Entry
227911 200683 4.0 23 20 - 30% 1,722,329.71£ 1,722,329.71£ 5 Buildings and Real Estate 31/10/2009 0.25 01/07/2009 4.0 23227914 200712 4.0 56 50 - 60% 744,265.63£ 744,265.63£ 18 Home and Office Furnishings, Housewares, and Durable Co 31/10/2009 0.25 01/07/2009 4.0 56227915 200712 4.0 56 50 - 60% 738,995.47£ 738,995.47£ 18 Home and Office Furnishings, Housewares, and Durable Co 31/07/2010 1.00 01/07/2009 4.0 56227917 203729 5.0 42 40 - 50% 5,000,000.00£ 5,000,000.00£ 2 Automobile 31/07/2010 1.00 1 01/07/2009 5.0 42 1227927 200790 2.8 16 10 - 20% 4,240,000.00£ 4,240,000.00£ 22 Machinery (Non-Agriculture, Non-Construction, Non-Electro 31/07/2010 1.00 01/07/2009 2.8 16227929 200816 5.0 19 10 - 20% 3,250,000.00£ 3,250,000.00£ 11 Diversified Natural Resources, Precious 31/07/2010 1.00 01/07/2009 5.0 19227932 203658 7.0 8 0 - 10% 587,131.31£ 587,131.31£ 26 Printing and Publishing 01/11/2009 0.25 2 01/07/2009 7.0 8 2227933 200863 3.0 16 10 - 20% 1,250,000.00£ 1,250,000.00£ 16 Grocery 31/07/2010 1.00 01/07/2009 3.0 16227935 203561 6.0 58 50 - 60% 4,000,000.00£ 4,000,000.00£ 33 Broadcasting & Entertainment 31/07/2010 1.00 01/07/2009 6.0 58227937 203514 7.0 28 20 - 30% 614,985.22£ 614,985.22£ 22 Machinery (Non-Agriculture, Non-Construction, Non-Electro 31/07/2010 1.00 2 01/07/2009 7.0 28 2227940 200913 6.0 12 10 - 20% 2,226,000.00£ 2,226,000.00£ 25 Personal, Food and Miscellaneous 24/07/2024 14.98 01/07/2009 6.0 12227941 200918 4.0 12 10 - 20% 6,985,542.79£ 6,985,542.79£ 22 Machinery (Non-Agriculture, Non-Construction, Non-Electro 15/07/2012 2.96 01/07/2009 4.0 12227942 200926 2.1 45 40 - 50% 1,192,876.05£ 1,192,876.05£ 24 Oil and Gas 31/07/2010 1.00 01/07/2009 2.1 45227944 200933 2.1 12 10 - 20% 1,062,407.90£ 1,062,407.90£ 15 Farming and Agriculture 28/04/2011 1.74 01/07/2009 2.1 12227945 200950 4.0 6 0 - 10% 523,127.70£ 523,127.70£ 2 Automobile 01/04/2010 0.67 01/07/2009 4.0 6227947 204351 6.0 31 30 - 40% 742,158.46£ 742,158.46£ 32 Utilities 31/10/2009 0.25 01/07/2009 6.0 31227948 204748 8.0 7 0 - 10% 543,162.64£ 543,162.64£ 22 Machinery (Non-Agriculture, Non-Construction, Non-Electro 01/06/2010 0.83 2 01/07/2009 8.0 7 2227949 200962 8.0 27 20 - 30% 1,477,255.35£ 1,477,255.35£ 22 Machinery (Non-Agriculture, Non-Construction, Non-Electro 01/07/2024 14.92 2 01/07/2009 8.0 27 2227950 200963 4.0 5 0 - 10% 1,899,176.16£ 1,899,176.16£ 5 Buildings and Real Estate 31/10/2009 0.25 01/07/2009 4.0 5227951 200965 6.0 20 10 - 20% 520,344.28£ 520,344.28£ 21 Leisure, Amusement, Entertainment 31/07/2010 1.00 01/07/2009 6.0 20227952 200975 5.0 19 10 - 20% 1,400,261.78£ 1,400,261.78£ 28 Retail Stores 01/06/2010 0.83 01/07/2009 5.0 19227956 201011 4.0 5 0 - 10% 1,114,667.00£ 1,114,667.00£ 17 Healthcare, Education and Childcare 31/12/2018 9.42 01/07/2009 4.0 5227959 204015 3.0 14 10 - 20% 1,466,773.42£ 1,466,773.42£ 16 Grocery 31/07/2010 1.00 01/07/2009 3.0 14227962 201042 4.0 20 10 - 20% 928,400.00£ 928,400.00£ 5 Buildings and Real Estate 31/10/2009 0.25 01/07/2009 4.0 20227964 201046 7.0 23 20 - 30% 520,923.13£ 520,923.13£ 5 Buildings and Real Estate 31/10/2009 0.25 01/07/2009 7.0 23227972 201077 5.0 82 80 - 90% 695,750.00£ 695,750.00£ 25 Personal, Food and Miscellaneous 29/06/2012 2.91 01/07/2009 5.0 82227974 203571 7.0 45 40 - 50% 2,500,000.00£ 449,140.23£ 4 Beverage, Food and Tobacco 31/07/2010 1.00 2 01/07/2009 7.0 45 2227978 201098 5.0 28 20 - 30% 1,430,390.82£ 1,430,390.82£ 8 Personal and Non Durable Consumer Products (Manufactu 31/07/2010 1.00 01/07/2009 5.0 28227982 204235 6.0 6 0 - 10% 678,076.76£ 678,076.76£ 17 Healthcare, Education and Childcare 31/10/2009 0.25 01/07/2009 6.0 6227988 201186 5.0 41 40 - 50% 655,718.88£ 655,718.88£ 15 Farming and Agriculture 31/07/2010 1.00 01/07/2009 5.0 41227990 201213 4.0 43 40 - 50% 500,000.00£ 500,000.00£ 10 Diversified/Conglomerate Service 31/07/2010 1.00 01/07/2009 4.0 43227991 201213 4.0 43 40 - 50% 1,570,636.35£ 1,570,636.35£ 10 Diversified/Conglomerate Service 31/07/2010 1.00 01/07/2009 4.0 43227992 201249 6.0 70 60 - 70% 750,000.00£ 750,000.00£ 28 Retail Stores 31/07/2010 1.00 2 01/07/2009 6.0 70 2227993 201249 6.0 70 60 - 70% 1,250,000.00£ 1,250,000.00£ 28 Retail Stores 31/07/2010 1.00 2 01/07/2009 6.0 70 2227999 201307 6.0 24 20 - 30% 761,250.00£ 761,250.00£ 19 Hotels, Motels, Inns and Gaming 31/07/2010 1.00 01/07/2009 6.0 24228000 201332 6.0 61 60 - 70% 3,020,454.52£ 3,020,454.52£ 22 Machinery (Non-Agriculture, Non-Construction, Non-Electro 31/07/2010 1.00 2 01/07/2009 6.0 61 2228001 201334 6.0 18 10 - 20% 1,655,494.00£ 1,655,494.00£ 12 Ecological 30/12/2020 11.41 01/07/2009 6.0 18228003 201342 1.5 39 30 - 40% 1,129,649.99£ 1,129,649.99£ 24 Oil and Gas 31/07/2010 1.00 01/07/2009 1.5 39228004 201347 5.0 23 20 - 30% 597,068.66£ 597,068.66£ 11 Diversified Natural Resources, Precious 28/03/2017 7.66 01/07/2009 5.0 23228008 204564 3.0 30 20 - 30% 855,731.63£ 855,731.63£ 26 Printing and Publishing 31/07/2010 1.00 01/07/2009 3.0 30228011 201407 5.0 8 0 - 10% 919,890.61£ 919,890.61£ 22 Machinery (Non-Agriculture, Non-Construction, Non-Electro 31/10/2009 0.25 01/07/2009 5.0 8228016 201507 6.0 39 30 - 40% 1,510,227.26£ 1,510,227.26£ 8 Personal and Non Durable Consumer Products (Manufactu 31/07/2010 1.00 01/07/2009 6.0 39228017 201507 6.0 39 30 - 40% 1,493,137.40£ 1,493,137.40£ 8 Personal and Non Durable Consumer Products (Manufactu 31/07/2010 1.00 01/07/2009 6.0 39228024 204785 7.0 23 20 - 30% 738,960.00£ 738,960.00£ 5 Buildings and Real Estate 29/10/2009 0.24 01/07/2009 7.0 23228025 204034 5.0 34 30 - 40% 2,229,350.48£ 2,229,350.48£ 16 Grocery 31/07/2010 1.00 01/07/2009 5.0 34228026 201622 4.0 83 80 - 90% 857,741.67£ 857,741.67£ 12 Ecological 31/10/2009 0.25 01/07/2009 4.0 83228027 201645 6.0 7 0 - 10% 723,766.26£ 723,766.26£ 9 Diversified/Conglomerate Manufacturing 31/07/2010 1.00 01/07/2009 6.0 7228028 201645 6.0 7 0 - 10% 520,266.58£ 520,266.58£ 9 Diversified/Conglomerate Manufacturing 31/07/2010 1.00 01/07/2009 6.0 7228032 201659 8.0 21 20 - 30% 542,748.98£ 542,748.98£ 22 Machinery (Non-Agriculture, Non-Construction, Non-Electro 17/07/2025 15.96 2 01/07/2009 8.0 21 2228034 204500 5.0 35 30 - 40% 2,307,683.31£ 2,307,683.31£ 4 Beverage, Food and Tobacco 31/10/2009 0.25 01/07/2009 5.0 35228035 204444 3.0 49 40 - 50% 1,700,000.00£ 1,700,000.00£ 28 Retail Stores 31/07/2010 1.00 01/07/2009 3.0 49228036 204637 6.0 83 80 - 90% 636,514.50£ 636,514.50£ 6 Chemicals, Plastics and Rubber 01/05/2010 0.75 01/07/2009 6.0 83228054 201784 6.0 5 0 - 10% 692,374.80£ 692,374.80£ 8 Personal and Non Durable Consumer Products (Manufactu 31/07/2010 1.00 01/07/2009 6.0 5228062 203964 6.0 28 20 - 30% 5,000,000.00£ 5,000,000.00£ 4 Beverage, Food and Tobacco 31/07/2010 1.00 2 01/07/2009 6.0 28 2228071 201914 6.0 22 20 - 30% 2,652,990.51£ 2,652,990.51£ 5 Buildings and Real Estate 31/10/2009 0.25 01/07/2009 6.0 22228072 201919 6.0 5 0 - 10% 1,037,063.84£ 1,037,063.84£ 2 Automobile 31/10/2009 0.25 01/07/2009 6.0 5228083 202027 2.1 9 0 - 10% 9,031,500.00£ 9,031,500.00£ 15 Farming and Agriculture 01/12/2009 0.33 01/07/2009 2.1 9228095 202094 7.0 19 10 - 20% 803,333.72£ 803,333.72£ 33 Broadcasting & Entertainment 30/04/2025 15.75 01/07/2009 7.0 19228096 202098 5.0 18 10 - 20% 6,599,844.14£ 6,599,844.14£ 29 Telecommunications 24/01/2011 1.48 01/07/2009 5.0 18228097 204095 6.0 23 20 - 30% 827,026.47£ 827,026.47£ 22 Machinery (Non-Agriculture, Non-Construction, Non-Electro 31/07/2010 1.00 01/07/2009 6.0 23228103 202128 5.0 62 60 - 70% 4,100,000.00£ 4,100,000.00£ 15 Farming and Agriculture 31/07/2010 1.00 01/07/2009 5.0 62228104 202128 5.0 62 60 - 70% 500,000.00£ 500,000.00£ 15 Farming and Agriculture 31/07/2010 1.00 01/07/2009 5.0 62228109 203786 7.0 13 10 - 20% 583,605.95£ 583,605.95£ 21 Leisure, Amusement, Entertainment 18/08/2023 14.05 01/07/2009 7.0 13228113 202242 3.0 16 10 - 20% 5,000,000.00£ 5,000,000.00£ 15 Farming and Agriculture 31/07/2010 1.00 01/07/2009 3.0 16228114 202284 7.0 17 10 - 20% 684,229.83£ 684,229.83£ 13 Electronics 15/11/2017 8.29 2 01/07/2009 7.0 17 2228117 202357 3.0 20 10 - 20% 899,858.02£ 899,858.02£ 27 Cargo Transport 07/02/2014 4.52 01/07/2009 3.0 20228123 204807 8.0 19 10 - 20% 1,012,826.80£ 1,012,826.80£ 5 Buildings and Real Estate 31/10/2009 0.25 2 01/07/2009 8.0 19 2228124 203880 7.0 10 0 - 10% 500,000.00£ 500,000.00£ 21 Leisure, Amusement, Entertainment 27/07/2014 4.99 01/07/2009 7.0 10228127 202522 6.0 14 10 - 20% 1,570,000.00£ 1,570,000.00£ 17 Healthcare, Education and Childcare 30/07/2024 15.00 01/07/2009 6.0 14228135 202587 6.0 58 50 - 60% 3,040,512.33£ 3,040,512.33£ 5 Buildings and Real Estate 01/12/2009 0.33 2 01/07/2009 6.0 58 2228142 201222 3.0 41 40 - 50% 18,700,000.00£ 18,700,000.00£ 26 Printing and Publishing 31/07/2010 1.00 01/07/2009 3.0 41228144 203594 3.0 29 20 - 30% 5,750,000.00£ 5,750,000.00£ 10 Diversified/Conglomerate Service 31/07/2010 1.00 01/07/2009 3.0 29228145 203594 3.0 29 20 - 30% 2,839,227.25£ 2,839,227.25£ 10 Diversified/Conglomerate Service 31/07/2010 1.00 01/07/2009 3.0 29228146 202728 3.0 9 0 - 10% 500,000.00£ 500,000.00£ 30 Textiles and Leather 20/12/2009 0.39 01/07/2009 3.0 9228147 202757 3.0 12 10 - 20% 2,000,000.00£ 2,000,000.00£ 17 Healthcare, Education and Childcare 31/07/2010 1.00 01/07/2009 3.0 12228149 203567 6.0 47 40 - 50% 5,555,555.27£ 2,110,196.15£ 13 Electronics 12/07/2011 1.95 1 01/07/2009 6.0 47 1228150 204256 6.0 52 50 - 60% 888,205.86£ 888,205.86£ 5 Buildings and Real Estate 31/10/2009 0.25 2 01/07/2009 6.0 52 2228151 204653 7.0 37 30 - 40% 710,500.00£ 710,500.00£ 8 Personal and Non Durable Consumer Products (Manufactu 10/06/2014 4.86 01/07/2009 7.0 37228152 202944 6.0 16 10 - 20% 1,164,588.48£ 1,164,588.48£ 25 Personal, Food and Miscellaneous 10/07/2012 2.94 2 01/07/2009 6.0 16 2228153 202944 6.0 16 10 - 20% 2,257,200.00£ 2,257,200.00£ 25 Personal, Food and Miscellaneous 04/12/2011 2.34 2 01/07/2009 6.0 16 2228155 203022 3.0 66 60 - 70% 2,508,000.00£ 2,508,000.00£ 10 Diversified/Conglomerate Service 31/07/2010 1.00 01/07/2009 3.0 66228160 203899 1.5 41 40 - 50% 9,300,000.00£ 9,300,000.00£ 14 Finance 31/07/2010 1.00 01/07/2009 1.5 41228162 203899 1.5 41 40 - 50% 15,200,000.00£ 15,200,000.00£ 14 Finance 31/07/2010 1.00 01/07/2009 1.5 41
Page 33 of 5730/06/2008

Data By Reference Obligation
Loan Number Borrower Number BBGBarclays Expected LossSeverity (%) Severity Band
Reference Obligation Outstanding Debt
Reference Obligation Notional Amount
Moody's Industry Sector Moody's Industry Sector Maturity Date
Remaining Term(Years) EWL Syndicated
Date of Entry into Pool
BBG Upon PoolEntry BELS Upon Pool Entry EWL Upon Pool Entry
228170 203575 6.0 17 10 - 20% 6,400,000.00£ 6,400,000.00£ 6 Chemicals, Plastics and Rubber 31/07/2010 1.00 2 01/07/2009 6.0 17 2228171 202682 7.0 16 10 - 20% 551,752.77£ 551,752.77£ 17 Healthcare, Education and Childcare 26/07/2024 14.99 01/07/2009 7.0 16228172 203813 5.0 6 0 - 10% 509,414.96£ 509,414.96£ 17 Healthcare, Education and Childcare 17/12/2009 0.38 01/07/2009 5.0 6228173 204741 4.0 10 0 - 10% 1,879,171.46£ 1,879,171.46£ 15 Farming and Agriculture 31/07/2010 1.00 01/07/2009 4.0 10228174 204181 7.0 45 40 - 50% 1,040,188.63£ 1,040,188.63£ 5 Buildings and Real Estate 31/10/2009 0.25 01/07/2009 7.0 45228176 204000 6.0 100 90 - 100% 2,950,000.00£ 2,950,000.00£ 10 Diversified/Conglomerate Service 31/07/2010 1.00 01/07/2009 6.0 100228177 203252 3.0 15 10 - 20% 500,035.50£ 500,035.50£ 15 Farming and Agriculture 31/07/2010 1.00 01/07/2009 3.0 15228178 204137 6.0 16 10 - 20% 2,019,850.00£ 2,019,850.00£ 19 Hotels, Motels, Inns and Gaming 03/01/2023 13.42 01/07/2009 6.0 16228179 203327 2.8 47 40 - 50% 3,500,000.00£ 3,500,000.00£ 16 Grocery 31/07/2010 1.00 01/07/2009 2.8 47228180 203328 6.0 38 30 - 40% 6,000,000.00£ 6,000,000.00£ 4 Beverage, Food and Tobacco 31/07/2010 1.00 1 01/07/2009 6.0 38 1228184 204503 5.0 20 10 - 20% 8,950,000.00£ 8,950,000.00£ 21 Leisure, Amusement, Entertainment 30/06/2014 4.91 01/07/2009 5.0 20228185 201553 7.0 32 30 - 40% 988,000.00£ 988,000.00£ 19 Hotels, Motels, Inns and Gaming 02/09/2013 4.09 1 01/07/2009 6.0 32 1228187 203626 4.0 45 40 - 50% 1,293,533.99£ 1,293,533.99£ 25 Personal, Food and Miscellaneous 31/10/2009 0.25 01/07/2009 4.0 45228192 204631 8.0 24 20 - 30% 1,222,000.00£ 1,222,000.00£ 5 Buildings and Real Estate 31/10/2009 0.25 2 01/07/2009 8.0 24 2228193 201085 6.0 48 40 - 50% 3,728,140.57£ 3,728,140.57£ 18 Home and Office Furnishings, Housewares, and Durable Co 31/12/2010 1.42 2 Y 01/07/2009 6.0 48 2228194 201085 6.0 48 40 - 50% 16,233,000.00£ 16,233,000.00£ 18 Home and Office Furnishings, Housewares, and Durable Co 23/03/2011 1.64 2 Y 01/07/2009 6.0 48 2228195 204868 4.0 11 10 - 20% 2,880,000.00£ 2,880,000.00£ 17 Healthcare, Education and Childcare 23/07/2012 2.98 01/07/2009 4.0 11228196 204868 4.0 11 10 - 20% 18,000,000.00£ 18,000,000.00£ 17 Healthcare, Education and Childcare 23/07/2012 2.98 01/07/2009 4.0 11228197 204659 5.0 47 40 - 50% 7,500,000.00£ 5,933,768.54£ 25 Personal, Food and Miscellaneous 04/11/2010 1.26 1 01/07/2009 5.0 47 1
Page 34 of 5730/06/2008

Data By Borrower
Borrower BBG Severity Severity Band RO Outstanding Debt RO Notional Balance
Moody's Industry Sector Moody's Industry Sector Maturity Date Remaining Term (Years) EWL Syndicated
200008 8.0 11 10 - 20% 5,450,000.00£ 5,250,000.00£ 5 Buildings and Real Estate 31/10/2009 0.25 1200010 5.0 14 10 - 20% 289,414.27£ 171,251.83£ 22 Machinery (Non-Agriculture, Non-Construction, Non-Electronic) 31/10/2009 0.25 1200012 3.0 39 30 - 40% 1,068,750.00£ 1,068,750.00£ 15 Farming and Agriculture 22/02/2014 4.56200013 3.0 19 10 - 20% 1,277,999.41£ 1,118,753.83£ 23 Mining, Steel, Iron and Non Precious Metals 30/01/2023 13.50200020 8.0 17 10 - 20% 2,453,438.57£ 2,443,471.92£ 2 Automobile 01/05/2010 0.75 1200022 5.0 45 40 - 50% 761,609.49£ 761,609.49£ 22 Machinery (Non-Agriculture, Non-Construction, Non-Electronic) 31/07/2010 1.00200024 1.2 10 0 - 10% 118,230.00£ 118,230.00£ 17 Healthcare, Education and Childcare 21/12/2009 0.39200025 5.0 51 50 - 60% 2,200,000.00£ 2,200,000.00£ 10 Diversified/Conglomerate Service 30/04/2011 1.75200026 7.0 16 10 - 20% 755,553.15£ 755,553.15£ 5 Buildings and Real Estate 31/10/2009 0.25200027 3.0 58 50 - 60% 3,180,897.17£ 3,180,897.17£ 28 Retail Stores 31/10/2009 0.25200033 3.0 12 10 - 20% 1,434,449.40£ 1,421,123.28£ 5 Buildings and Real Estate 07/07/2020 10.93200040 4.0 14 10 - 20% 1,883,788.16£ 1,883,788.16£ 21 Leisure, Amusement, Entertainment 24/02/2018 8.56200042 4.0 12 10 - 20% 2,500,000.00£ 1,725,000.00£ 5 Buildings and Real Estate 03/06/2019 9.84200043 5.0 7 0 - 10% 1,780,956.64£ 1,780,956.64£ 5 Buildings and Real Estate 31/10/2009 0.25200046 4.0 5 0 - 10% 607,243.98£ 607,243.98£ 27 Cargo Transport 09/02/2020 10.52200047 6.0 11 10 - 20% 1,400,000.00£ 1,400,000.00£ 19 Hotels, Motels, Inns and Gaming 06/05/2023 13.76200050 5.0 13 10 - 20% 721,836.02£ 719,636.02£ 17 Healthcare, Education and Childcare 04/03/2023 13.59200053 6.0 21 20 - 30% 496,513.50£ 496,513.50£ 28 Retail Stores 23/04/2024 14.73200058 6.0 54 50 - 60% 682,792.20£ 474,190.38£ 24 Oil and Gas 31/10/2009 0.25200060 3.0 10 0 - 10% 671,198.51£ 671,198.51£ 2 Automobile 03/01/2021 11.42200071 5.0 16 10 - 20% 549,849.92£ 549,849.92£ 12 Ecological 30/05/2017 7.83200074 7.0 14 10 - 20% 2,598,897.88£ 2,598,897.88£ 10 Diversified/Conglomerate Service 03/01/2010 0.42200077 6.0 19 10 - 20% 1,121,415.62£ 1,121,415.62£ 17 Healthcare, Education and Childcare 30/12/2020 11.41200078 4.0 5 0 - 10% 1,832,718.03£ 1,694,759.47£ 19 Hotels, Motels, Inns and Gaming 04/12/2023 14.34200079 8.0 9 0 - 10% 1,204,250.00£ 1,200,000.00£ 18 Home and Office Furnishings, Housewares, and Durable Consumer Products 31/10/2009 0.25 1200084 7.0 58 50 - 60% 551,704.35£ 551,704.35£ 30 Textiles and Leather 31/07/2010 1.00 1200085 4.0 46 40 - 50% 455,503.42£ 455,503.42£ 21 Leisure, Amusement, Entertainment 31/03/2021 11.67200093 5.0 39 30 - 40% 6,902,300.00£ 6,902,300.00£ 28 Retail Stores 30/07/2017 8.00200101 7.0 6 0 - 10% 515,488.11£ 515,488.11£ 22 Machinery (Non-Agriculture, Non-Construction, Non-Electronic) 28/07/2026 16.99200108 6.0 15 10 - 20% 5,999,999.20£ 3,988,892.70£ 5 Buildings and Real Estate 31/10/2009 0.25 2200109 6.0 6 0 - 10% 1,781,198.21£ 1,659,122.34£ 19 Hotels, Motels, Inns and Gaming 31/10/2009 0.25200112 7.0 13 10 - 20% 660,219.14£ 435,361.35£ 30 Textiles and Leather 31/10/2009 0.25200113 4.0 56 50 - 60% 2,265,363.44£ 2,265,363.44£ 30 Textiles and Leather 31/07/2010 1.00200118 8.0 22 20 - 30% 1,985,207.75£ 1,787,954.35£ 21 Leisure, Amusement, Entertainment 31/07/2010 1.00 2200125 5.0 12 10 - 20% 500,000.00£ 500,000.00£ 25 Personal, Food and Miscellaneous 13/01/2024 14.45200131 3.0 24 20 - 30% 6,057,516.32£ 4,716,900.68£ 5 Buildings and Real Estate 04/06/2022 12.84200136 6.0 13 10 - 20% 11,338,082.00£ 10,983,146.86£ 19 Hotels, Motels, Inns and Gaming 31/10/2009 0.25 2200143 3.0 15 10 - 20% 387,106.97£ 387,106.97£ 5 Buildings and Real Estate 31/10/2009 0.25200145 8.0 27 20 - 30% 960,000.00£ 960,000.00£ 5 Buildings and Real Estate 31/10/2009 0.25 3200148 4.0 22 20 - 30% 993,856.71£ 984,306.07£ 25 Personal, Food and Miscellaneous 17/09/2022 13.13200149 5.0 34 30 - 40% 253,771.57£ 108,260.17£ 10 Diversified/Conglomerate Service 31/10/2009 0.25200155 3.0 6 0 - 10% 627,030.19£ 627,030.19£ 19 Hotels, Motels, Inns and Gaming 15/10/2012 3.21200156 5.0 13 10 - 20% 4,405,317.70£ 4,405,317.70£ 5 Buildings and Real Estate 19/10/2021 12.22200158 3.0 5 0 - 10% 381,132.02£ 381,132.02£ 21 Leisure, Amusement, Entertainment 29/09/2012 3.16200160 1.5 39 30 - 40% 4,663,000.00£ 4,663,000.00£ 27 Cargo Transport 31/07/2010 1.00200161 2.8 30 20 - 30% 11,370,405.97£ 11,370,405.97£ 5 Buildings and Real Estate 26/04/2013 3.74200162 6.0 16 10 - 20% 2,910,416.65£ 2,910,416.65£ 2 Automobile 19/09/2022 13.13 2200168 5.0 6 0 - 10% 1,793,095.16£ 1,364,238.95£ 25 Personal, Food and Miscellaneous 31/10/2009 0.25200173 4.0 8 0 - 10% 650,523.56£ 650,523.56£ 25 Personal, Food and Miscellaneous 12/09/2012 3.11200185 8.0 12 10 - 20% 1,083,303.52£ 1,083,303.52£ 2 Automobile 11/12/2021 12.36 2200186 8.0 17 10 - 20% 3,340,888.39£ 3,165,199.45£ 17 Healthcare, Education and Childcare 27/06/2022 12.91 2200188 4.0 10 0 - 10% 2,423,409.45£ 2,423,409.45£ 28 Retail Stores 30/10/2017 8.25200190 2.8 16 10 - 20% 670,335.77£ 670,335.77£ 5 Buildings and Real Estate 31/10/2009 0.25200193 5.0 9 0 - 10% 1,042,641.92£ 1,042,641.92£ 21 Leisure, Amusement, Entertainment 10/06/2018 8.86200194 5.0 6 0 - 10% 752,750.00£ 752,750.00£ 5 Buildings and Real Estate 29/10/2009 0.24200195 5.0 21 20 - 30% 1,176,790.17£ 1,176,790.17£ 13 Electronics 19/11/2011 2.30200196 6.0 16 10 - 20% 4,020,000.00£ 4,020,000.00£ 19 Hotels, Motels, Inns and Gaming 11/04/2025 15.69200197 8.0 23 20 - 30% 2,905,563.17£ 2,905,563.17£ 19 Hotels, Motels, Inns and Gaming 21/07/2015 5.97 2200201 7.0 12 10 - 20% 494,057.42£ 494,057.42£ 10 Diversified/Conglomerate Service 13/09/2014 5.12 2200204 8.0 24 20 - 30% 1,112,810.00£ 1,050,044.00£ 5 Buildings and Real Estate 31/10/2009 0.25 1200205 5.0 19 10 - 20% 589,291.74£ 589,291.74£ 5 Buildings and Real Estate 01/12/2014 5.33200209 8.0 12 10 - 20% 1,171,684.78£ 1,160,418.00£ 2 Automobile 30/06/2020 10.91 2200211 4.0 7 0 - 10% 3,474,909.47£ 3,384,386.18£ 5 Buildings and Real Estate 02/07/2018 8.92200215 3.0 11 10 - 20% 577,986.90£ 577,986.90£ 25 Personal, Food and Miscellaneous 22/01/2019 9.48
Page 35 of 5730/06/2008

Data By Borrower
Borrower BBG Severity Severity Band RO Outstanding Debt RO Notional Balance
Moody's Industry Sector Moody's Industry Sector Maturity Date Remaining Term (Years) EWL Syndicated
200216 7.0 6 0 - 10% 420,000.00£ 420,000.00£ 10 Diversified/Conglomerate Service 03/01/2011 1.42200225 6.0 13 10 - 20% 807,571.23£ 807,571.23£ 27 Cargo Transport 31/10/2009 0.25200226 5.0 25 20 - 30% 3,155,865.65£ 3,051,298.27£ 27 Cargo Transport 30/06/2023 13.91200233 3.0 9 0 - 10% 410,753.34£ 410,753.34£ 26 Printing and Publishing 17/06/2017 7.88200238 6.0 16 10 - 20% 574,369.32£ 394,412.82£ 22 Machinery (Non-Agriculture, Non-Construction, Non-Electronic) 31/10/2009 0.25200240 8.0 12 10 - 20% 2,500,000.00£ 2,500,000.00£ 15 Farming and Agriculture 30/12/2025 16.41 2200243 8.0 7 0 - 10% 1,776,053.16£ 1,776,053.16£ 17 Healthcare, Education and Childcare 14/08/2026 17.04200247 8.0 5 0 - 10% 1,043,458.93£ 1,043,458.93£ 5 Buildings and Real Estate 31/10/2009 0.25 2200248 6.0 21 20 - 30% 5,141,163.71£ 4,899,909.72£ 5 Buildings and Real Estate 01/10/2009 0.17 2200251 4.0 6 0 - 10% 605,000.00£ 605,000.00£ 4 Beverage, Food and Tobacco 31/10/2009 0.25200259 4.0 6 0 - 10% 492,703.25£ 492,703.25£ 4 Beverage, Food and Tobacco 01/06/2013 3.83200262 6.0 16 10 - 20% 785,193.64£ 632,607.00£ 16 Grocery 12/06/2022 12.86200268 1.8 17 10 - 20% 1,605,465.69£ 1,605,465.69£ 5 Buildings and Real Estate 30/11/2019 10.33200277 4.0 52 50 - 60% 2,749,500.00£ 2,347,928.00£ 5 Buildings and Real Estate 31/10/2009 0.25200282 4.0 39 30 - 40% 25,000,000.00£ 24,500,000.00£ 28 Retail Stores 31/07/2010 1.00 1200284 4.0 29 20 - 30% 2,498,314.41£ 2,498,314.41£ 18 Home and Office Furnishings, Housewares, and Durable Consumer Products 06/08/2015 6.01200285 6.0 6 0 - 10% 513,520.31£ 513,520.31£ 31 Personal Transportation 07/03/2021 11.60 2200291 5.0 15 10 - 20% 852,765.64£ 852,765.64£ 17 Healthcare, Education and Childcare 19/01/2021 11.47200292 3.0 10 0 - 10% 2,658,300.00£ 2,658,300.00£ 25 Personal, Food and Miscellaneous 23/12/2024 15.39200293 4.0 5 0 - 10% 452,313.75£ 452,313.75£ 31 Personal Transportation 30/04/2024 14.75200296 8.0 15 10 - 20% 1,059,772.59£ 1,059,772.59£ 28 Retail Stores 01/12/2014 5.33 2200301 7.0 7 0 - 10% 720,336.46£ 403,769.10£ 2 Automobile 31/10/2009 0.25200309 5.0 16 10 - 20% 2,085,034.62£ 1,889,534.62£ 19 Hotels, Motels, Inns and Gaming 07/11/2012 3.27200313 6.0 6 0 - 10% 553,256.28£ 550,561.34£ 13 Electronics 22/08/2012 3.06200314 4.0 8 0 - 10% 1,431,855.26£ 1,431,855.26£ 5 Buildings and Real Estate 15/05/2021 11.79200315 8.0 30 20 - 30% 1,513,128.97£ 1,446,659.30£ 28 Retail Stores 01/05/2010 0.75 2200320 7.0 28 20 - 30% 1,998,731.75£ 1,596,318.22£ 21 Leisure, Amusement, Entertainment 31/10/2009 0.25 2200321 4.0 9 0 - 10% 401,362.78£ 401,362.78£ 28 Retail Stores 16/05/2013 3.79200325 4.0 41 40 - 50% 1,487,917.18£ 1,487,917.18£ 23 Mining, Steel, Iron and Non Precious Metals 31/07/2010 1.00200331 5.0 5 0 - 10% 499,927.55£ 499,927.55£ 2 Automobile 09/08/2010 1.02200333 5.0 6 0 - 10% 1,233,590.27£ 1,233,590.27£ 5 Buildings and Real Estate 22/10/2009 0.23200334 1.5 41 40 - 50% 10,000,000.00£ 10,000,000.00£ 10 Diversified/Conglomerate Service 31/07/2010 1.00200335 6.0 14 10 - 20% 925,000.00£ 750,000.00£ 2 Automobile 27/09/2018 9.16200338 4.0 11 10 - 20% 530,807.86£ 530,807.86£ 21 Leisure, Amusement, Entertainment 31/10/2015 6.25200339 4.0 19 10 - 20% 6,859,619.57£ 6,714,234.10£ 5 Buildings and Real Estate 31/10/2009 0.25 2200340 8.0 36 30 - 40% 2,361,194.52£ 2,201,076.52£ 5 Buildings and Real Estate 31/10/2009 0.25 2200342 6.0 56 50 - 60% 597,911.36£ 597,911.36£ 30 Textiles and Leather 04/11/2012 3.26200344 2.8 18 10 - 20% 1,654,453.55£ 1,654,453.55£ 30 Textiles and Leather 07/06/2024 14.85200345 8.0 29 20 - 30% 554,190.00£ 546,000.00£ 5 Buildings and Real Estate 01/02/2010 0.50 2200353 6.0 59 50 - 60% 460,950.13£ 460,950.13£ 2 Automobile 30/04/2009 0.00 3200354 3.0 15 10 - 20% 477,933.62£ 477,933.62£ 2 Automobile 27/05/2015 5.82200356 6.0 47 40 - 50% 4,316,136.36£ 4,316,136.36£ 8 Personal and Non Durable Consumer Products (Manufacturing Only) 31/10/2009 0.25 2200362 2.1 6 0 - 10% 2,309,775.91£ 2,309,775.91£ 5 Buildings and Real Estate 30/06/2015 5.91200363 8.0 18 10 - 20% 1,010,848.07£ 1,010,848.07£ 10 Diversified/Conglomerate Service 24/02/2018 8.56 2200364 5.0 45 40 - 50% 1,919,157.16£ 1,919,157.16£ 17 Healthcare, Education and Childcare 05/08/2013 4.01200366 7.0 14 10 - 20% 1,242,969.35£ 1,242,969.35£ 23 Mining, Steel, Iron and Non Precious Metals 21/12/2020 11.39200368 5.0 25 20 - 30% 518,379.68£ 518,379.68£ 17 Healthcare, Education and Childcare 24/11/2024 15.31200372 6.0 18 10 - 20% 280,000.00£ 280,000.00£ 2 Automobile 29/11/2011 2.33 2200381 4.0 58 50 - 60% 10,810,000.00£ 10,810,000.00£ 16 Grocery 31/07/2010 1.00200387 8.0 15 10 - 20% 2,665,587.60£ 2,665,587.60£ 26 Printing and Publishing 30/09/2015 6.16 2200391 4.0 41 40 - 50% 4,369,978.49£ 4,369,978.49£ 13 Electronics 31/07/2010 1.00 1200395 6.0 7 0 - 10% 1,453,500.00£ 1,453,500.00£ 27 Cargo Transport 01/04/2024 14.67200396 7.0 5 0 - 10% 1,712,229.31£ 1,712,229.31£ 28 Retail Stores 27/05/2014 4.82 2200399 5.0 9 0 - 10% 2,670,889.43£ 2,658,105.04£ 22 Machinery (Non-Agriculture, Non-Construction, Non-Electronic) 31/10/2009 0.25200401 5.0 24 20 - 30% 490,698.17£ 470,133.18£ 22 Machinery (Non-Agriculture, Non-Construction, Non-Electronic) 05/04/2021 11.68200404 6.0 7 0 - 10% 10,171,941.77£ 10,171,941.77£ 19 Hotels, Motels, Inns and Gaming 31/10/2009 0.25 1200410 5.0 82 80 - 90% 555,190.86£ 555,190.86£ 16 Grocery 22/05/2016 6.81200413 4.0 11 10 - 20% 28,127,142.47£ 24,500,000.00£ 10 Diversified/Conglomerate Service 03/07/2015 5.92200416 4.0 60 50 - 60% 650,000.00£ 650,000.00£ 11 Diversified Natural Resources, Precious 30/08/2012 3.08200417 3.0 10 0 - 10% 2,954,870.43£ 2,524,805.42£ 18 Home and Office Furnishings, Housewares, and Durable Consumer Products 31/07/2010 1.00200421 5.0 25 20 - 30% 903,137.41£ 900,750.00£ 2 Automobile 22/06/2024 14.89200425 6.0 8 0 - 10% 278,922.00£ 278,922.00£ 9 Diversified/Conglomerate Manufacturing 08/10/2011 2.19200427 5.0 29 20 - 30% 696,957.23£ 635,705.00£ 27 Cargo Transport 17/12/2019 10.38200429 8.0 18 10 - 20% 1,407,890.86£ 1,319,343.31£ 25 Personal, Food and Miscellaneous 31/10/2009 0.25 2200430 4.0 74 70 - 80% 2,029,000.84£ 2,029,000.84£ 27 Cargo Transport 28/12/2011 2.41
Page 36 of 5730/06/2008
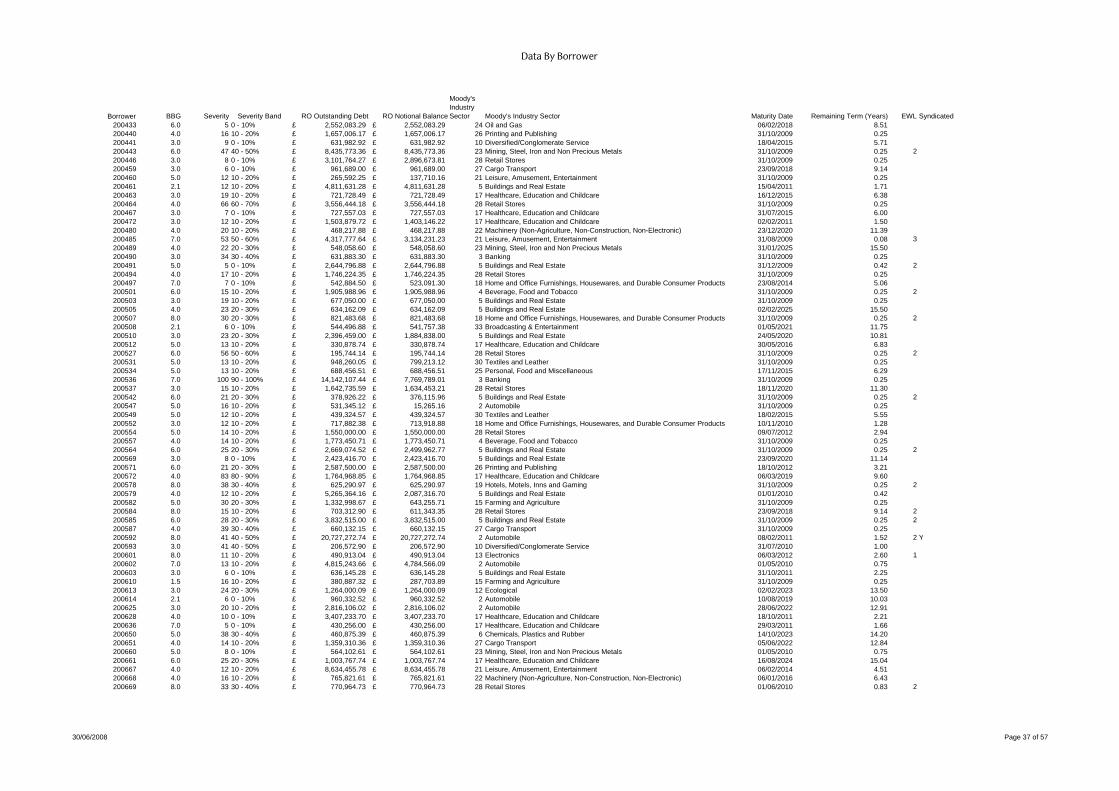
Data By Borrower
Borrower BBG Severity Severity Band RO Outstanding Debt RO Notional Balance
Moody's Industry Sector Moody's Industry Sector Maturity Date Remaining Term (Years) EWL Syndicated
200433 6.0 5 0 - 10% 2,552,083.29£ 2,552,083.29£ 24 Oil and Gas 06/02/2018 8.51200440 4.0 16 10 - 20% 1,657,006.17£ 1,657,006.17£ 26 Printing and Publishing 31/10/2009 0.25200441 3.0 9 0 - 10% 631,982.92£ 631,982.92£ 10 Diversified/Conglomerate Service 18/04/2015 5.71200443 6.0 47 40 - 50% 8,435,773.36£ 8,435,773.36£ 23 Mining, Steel, Iron and Non Precious Metals 31/10/2009 0.25 2200446 3.0 8 0 - 10% 3,101,764.27£ 2,896,673.81£ 28 Retail Stores 31/10/2009 0.25200459 3.0 6 0 - 10% 961,689.00£ 961,689.00£ 27 Cargo Transport 23/09/2018 9.14200460 5.0 12 10 - 20% 265,592.25£ 137,710.16£ 21 Leisure, Amusement, Entertainment 31/10/2009 0.25200461 2.1 12 10 - 20% 4,811,631.28£ 4,811,631.28£ 5 Buildings and Real Estate 15/04/2011 1.71200463 3.0 19 10 - 20% 721,728.49£ 721,728.49£ 17 Healthcare, Education and Childcare 16/12/2015 6.38200464 4.0 66 60 - 70% 3,556,444.18£ 3,556,444.18£ 28 Retail Stores 31/10/2009 0.25200467 3.0 7 0 - 10% 727,557.03£ 727,557.03£ 17 Healthcare, Education and Childcare 31/07/2015 6.00200472 3.0 12 10 - 20% 1,503,879.72£ 1,403,146.22£ 17 Healthcare, Education and Childcare 02/02/2011 1.50200480 4.0 20 10 - 20% 468,217.88£ 468,217.88£ 22 Machinery (Non-Agriculture, Non-Construction, Non-Electronic) 23/12/2020 11.39200485 7.0 53 50 - 60% 4,317,777.64£ 3,134,231.23£ 21 Leisure, Amusement, Entertainment 31/08/2009 0.08 3200489 4.0 22 20 - 30% 548,058.60£ 548,058.60£ 23 Mining, Steel, Iron and Non Precious Metals 31/01/2025 15.50200490 3.0 34 30 - 40% 631,883.30£ 631,883.30£ 3 Banking 31/10/2009 0.25200491 5.0 5 0 - 10% 2,644,796.88£ 2,644,796.88£ 5 Buildings and Real Estate 31/12/2009 0.42 2200494 4.0 17 10 - 20% 1,746,224.35£ 1,746,224.35£ 28 Retail Stores 31/10/2009 0.25200497 7.0 7 0 - 10% 542,884.50£ 523,091.30£ 18 Home and Office Furnishings, Housewares, and Durable Consumer Products 23/08/2014 5.06200501 6.0 15 10 - 20% 1,905,988.96£ 1,905,988.96£ 4 Beverage, Food and Tobacco 31/10/2009 0.25 2200503 3.0 19 10 - 20% 677,050.00£ 677,050.00£ 5 Buildings and Real Estate 31/10/2009 0.25200505 4.0 23 20 - 30% 634,162.09£ 634,162.09£ 5 Buildings and Real Estate 02/02/2025 15.50200507 8.0 30 20 - 30% 821,483.68£ 821,483.68£ 18 Home and Office Furnishings, Housewares, and Durable Consumer Products 31/10/2009 0.25 2200508 2.1 6 0 - 10% 544,496.88£ 541,757.38£ 33 Broadcasting & Entertainment 01/05/2021 11.75200510 3.0 23 20 - 30% 2,396,459.00£ 1,884,838.00£ 5 Buildings and Real Estate 24/05/2020 10.81200512 5.0 13 10 - 20% 330,878.74£ 330,878.74£ 17 Healthcare, Education and Childcare 30/05/2016 6.83200527 6.0 56 50 - 60% 195,744.14£ 195,744.14£ 28 Retail Stores 31/10/2009 0.25 2200531 5.0 13 10 - 20% 948,260.05£ 799,213.12£ 30 Textiles and Leather 31/10/2009 0.25200534 5.0 13 10 - 20% 688,456.51£ 688,456.51£ 25 Personal, Food and Miscellaneous 17/11/2015 6.29200536 7.0 100 90 - 100% 14,142,107.44£ 7,769,789.01£ 3 Banking 31/10/2009 0.25200537 3.0 15 10 - 20% 1,642,735.59£ 1,634,453.21£ 28 Retail Stores 18/11/2020 11.30200542 6.0 21 20 - 30% 378,926.22£ 376,115.96£ 5 Buildings and Real Estate 31/10/2009 0.25 2200547 5.0 16 10 - 20% 531,345.12£ 15,265.16£ 2 Automobile 31/10/2009 0.25200549 5.0 12 10 - 20% 439,324.57£ 439,324.57£ 30 Textiles and Leather 18/02/2015 5.55200552 3.0 12 10 - 20% 717,882.38£ 713,918.88£ 18 Home and Office Furnishings, Housewares, and Durable Consumer Products 10/11/2010 1.28200554 5.0 14 10 - 20% 1,550,000.00£ 1,550,000.00£ 28 Retail Stores 09/07/2012 2.94200557 4.0 14 10 - 20% 1,773,450.71£ 1,773,450.71£ 4 Beverage, Food and Tobacco 31/10/2009 0.25200564 6.0 25 20 - 30% 2,669,074.52£ 2,499,962.77£ 5 Buildings and Real Estate 31/10/2009 0.25 2200569 3.0 8 0 - 10% 2,423,416.70£ 2,423,416.70£ 5 Buildings and Real Estate 23/09/2020 11.14200571 6.0 21 20 - 30% 2,587,500.00£ 2,587,500.00£ 26 Printing and Publishing 18/10/2012 3.21200572 4.0 83 80 - 90% 1,764,968.85£ 1,764,968.85£ 17 Healthcare, Education and Childcare 06/03/2019 9.60200578 8.0 38 30 - 40% 625,290.97£ 625,290.97£ 19 Hotels, Motels, Inns and Gaming 31/10/2009 0.25 2200579 4.0 12 10 - 20% 5,265,364.16£ 2,087,316.70£ 5 Buildings and Real Estate 01/01/2010 0.42200582 5.0 30 20 - 30% 1,332,998.67£ 643,255.71£ 15 Farming and Agriculture 31/10/2009 0.25200584 8.0 15 10 - 20% 703,312.90£ 611,343.35£ 28 Retail Stores 23/09/2018 9.14 2200585 6.0 28 20 - 30% 3,832,515.00£ 3,832,515.00£ 5 Buildings and Real Estate 31/10/2009 0.25 2200587 4.0 39 30 - 40% 660,132.15£ 660,132.15£ 27 Cargo Transport 31/10/2009 0.25200592 8.0 41 40 - 50% 20,727,272.74£ 20,727,272.74£ 2 Automobile 08/02/2011 1.52 2 Y200593 3.0 41 40 - 50% 206,572.90£ 206,572.90£ 10 Diversified/Conglomerate Service 31/07/2010 1.00200601 8.0 11 10 - 20% 490,913.04£ 490,913.04£ 13 Electronics 06/03/2012 2.60 1200602 7.0 13 10 - 20% 4,815,243.66£ 4,784,566.09£ 2 Automobile 01/05/2010 0.75200603 3.0 6 0 - 10% 636,145.28£ 636,145.28£ 5 Buildings and Real Estate 31/10/2011 2.25200610 1.5 16 10 - 20% 380,887.32£ 287,703.89£ 15 Farming and Agriculture 31/10/2009 0.25200613 3.0 24 20 - 30% 1,264,000.09£ 1,264,000.09£ 12 Ecological 02/02/2023 13.50200614 2.1 6 0 - 10% 960,332.52£ 960,332.52£ 2 Automobile 10/08/2019 10.03200625 3.0 20 10 - 20% 2,816,106.02£ 2,816,106.02£ 2 Automobile 28/06/2022 12.91200628 4.0 10 0 - 10% 3,407,233.70£ 3,407,233.70£ 17 Healthcare, Education and Childcare 18/10/2011 2.21200636 7.0 5 0 - 10% 430,256.00£ 430,256.00£ 17 Healthcare, Education and Childcare 29/03/2011 1.66200650 5.0 38 30 - 40% 460,875.39£ 460,875.39£ 6 Chemicals, Plastics and Rubber 14/10/2023 14.20200651 4.0 14 10 - 20% 1,359,310.36£ 1,359,310.36£ 27 Cargo Transport 05/06/2022 12.84200660 5.0 8 0 - 10% 564,102.61£ 564,102.61£ 23 Mining, Steel, Iron and Non Precious Metals 01/05/2010 0.75200661 6.0 25 20 - 30% 1,003,767.74£ 1,003,767.74£ 17 Healthcare, Education and Childcare 16/08/2024 15.04200667 4.0 12 10 - 20% 8,634,455.78£ 8,634,455.78£ 21 Leisure, Amusement, Entertainment 06/02/2014 4.51200668 4.0 16 10 - 20% 765,821.61£ 765,821.61£ 22 Machinery (Non-Agriculture, Non-Construction, Non-Electronic) 06/01/2016 6.43200669 8.0 33 30 - 40% 770,964.73£ 770,964.73£ 28 Retail Stores 01/06/2010 0.83 2
Page 37 of 5730/06/2008

Data By Borrower
Borrower BBG Severity Severity Band RO Outstanding Debt RO Notional Balance
Moody's Industry Sector Moody's Industry Sector Maturity Date Remaining Term (Years) EWL Syndicated
200670 5.0 12 10 - 20% 2,850,000.00£ 2,772,000.00£ 5 Buildings and Real Estate 21/12/2009 0.39200682 6.0 13 10 - 20% 1,071,016.51£ 1,071,016.51£ 10 Diversified/Conglomerate Service 30/10/2009 0.25 2200683 4.0 23 20 - 30% 1,722,329.71£ 1,722,329.71£ 5 Buildings and Real Estate 31/10/2009 0.25200685 4.0 28 20 - 30% 885,000.00£ 616,400.00£ 5 Buildings and Real Estate 19/09/2020 11.13200689 8.0 12 10 - 20% 410,725.76£ 410,725.76£ 6 Chemicals, Plastics and Rubber 30/08/2018 9.08200691 5.0 74 70 - 80% 400,000.00£ 400,000.00£ 24 Oil and Gas 31/03/2018 8.67200693 6.0 38 30 - 40% 2,187,512.37£ 1,750,388.47£ 16 Grocery 31/10/2009 0.25 2200694 2.1 13 10 - 20% 2,800,000.00£ 2,800,000.00£ 5 Buildings and Real Estate 31/10/2009 0.25200707 6.0 23 20 - 30% 2,906,236.46£ 2,785,532.39£ 6 Chemicals, Plastics and Rubber 31/10/2009 0.25200712 4.0 56 50 - 60% 1,882,772.23£ 1,882,772.23£ 18 Home and Office Furnishings, Housewares, and Durable Consumer Products 31/10/2009 0.25200713 4.0 41 40 - 50% 1,820,448.55£ 1,820,448.55£ 7 Containers, Packaging and Glass 31/10/2009 0.25200718 2.1 16 10 - 20% 1,800,700.00£ 1,800,700.00£ 13 Electronics 31/08/2012 3.08200720 6.0 11 10 - 20% 749,725.19£ 732,711.57£ 30 Textiles and Leather 31/10/2009 0.25200721 3.0 82 80 - 90% 3,547,306.00£ 3,547,306.00£ 5 Buildings and Real Estate 31/10/2009 0.25200728 5.0 5 0 - 10% 5,235,120.69£ 5,235,120.69£ 25 Personal, Food and Miscellaneous 31/10/2009 0.25200730 4.0 8 0 - 10% 1,270,500.00£ 1,270,500.00£ 5 Buildings and Real Estate 08/07/2026 16.94200737 3.0 22 20 - 30% 7,750,000.00£ 6,007,812.00£ 5 Buildings and Real Estate 27/02/2011 1.57200741 4.0 10 0 - 10% 571,200.00£ 560,000.00£ 5 Buildings and Real Estate 30/10/2009 0.25200742 6.0 17 10 - 20% 541,193.50£ 541,193.50£ 28 Retail Stores 14/01/2015 5.45200745 6.0 19 10 - 20% 1,428,439.70£ 1,087,034.70£ 24 Oil and Gas 23/03/2021 11.64200748 7.0 18 10 - 20% 1,003,350.00£ 1,003,350.00£ 17 Healthcare, Education and Childcare 13/11/2018 9.28200749 3.0 16 10 - 20% 627,832.10£ 627,832.10£ 21 Leisure, Amusement, Entertainment 31/01/2020 10.50200752 4.0 5 0 - 10% 1,000,000.00£ 1,000,000.00£ 5 Buildings and Real Estate 27/10/2010 1.24200761 6.0 13 10 - 20% 1,465,637.31£ 1,465,637.31£ 27 Cargo Transport 07/07/2022 12.93200768 2.8 11 10 - 20% 5,002,500.00£ 5,002,500.00£ 5 Buildings and Real Estate 10/08/2012 3.03200771 5.0 12 10 - 20% 1,076,098.89£ 1,003,278.97£ 5 Buildings and Real Estate 31/10/2009 0.25200775 4.0 5 0 - 10% 426,222.00£ 426,222.00£ 17 Healthcare, Education and Childcare 17/11/2014 5.29200782 3.0 18 10 - 20% 703,000.00£ 671,344.83£ 5 Buildings and Real Estate 01/03/2011 1.58200783 5.0 17 10 - 20% 1,999,556.47£ 1,959,289.55£ 4 Beverage, Food and Tobacco 31/10/2009 0.25200785 5.0 20 10 - 20% 532,247.61£ 532,247.61£ 23 Mining, Steel, Iron and Non Precious Metals 19/02/2024 14.55200788 5.0 17 10 - 20% 549,195.40£ 549,195.40£ 6 Chemicals, Plastics and Rubber 04/07/2017 7.93200790 2.8 16 10 - 20% 4,240,000.00£ 4,240,000.00£ 22 Machinery (Non-Agriculture, Non-Construction, Non-Electronic) 31/07/2010 1.00200791 7.0 60 50 - 60% 517,254.07£ 517,254.07£ 10 Diversified/Conglomerate Service 18/09/2016 7.13200808 2.1 35 30 - 40% 2,267,082.97£ 2,267,082.97£ 5 Buildings and Real Estate 26/08/2019 10.07200810 6.0 20 10 - 20% 1,950,616.65£ 1,721,224.34£ 5 Buildings and Real Estate 31/10/2009 0.25 1200811 4.0 8 0 - 10% 501,629.36£ 501,629.36£ 19 Hotels, Motels, Inns and Gaming 02/09/2017 8.09200813 2.5 8 0 - 10% 1,952,422.03£ 1,952,422.03£ 5 Buildings and Real Estate 03/04/2017 7.67200814 4.0 5 0 - 10% 84,765.90£ 84,765.90£ 24 Oil and Gas 09/11/2009 0.27200816 5.0 19 10 - 20% 5,113,207.14£ 4,640,433.15£ 11 Diversified Natural Resources, Precious 31/10/2009 0.25200820 4.0 16 10 - 20% 689,759.99£ 660,781.81£ 17 Healthcare, Education and Childcare 24/12/2018 9.40200824 7.0 66 60 - 70% 1,436,595.26£ 1,360,266.53£ 5 Buildings and Real Estate 20/10/2009 0.22200828 3.0 33 30 - 40% 575,122.70£ 575,122.70£ 27 Cargo Transport 22/11/2020 11.31200829 4.0 24 20 - 30% 951,961.61£ 951,961.61£ 17 Healthcare, Education and Childcare 23/10/2023 14.23200831 6.0 15 10 - 20% 6,649,999.00£ 6,649,999.00£ 2 Automobile 07/08/2018 9.02 2200838 7.0 8 0 - 10% 1,126,222.83£ 1,063,019.38£ 22 Machinery (Non-Agriculture, Non-Construction, Non-Electronic) 24/11/2022 13.31200841 4.0 11 10 - 20% 367,469.19£ 342,920.17£ 22 Machinery (Non-Agriculture, Non-Construction, Non-Electronic) 31/10/2009 0.25200844 6.0 12 10 - 20% 1,937,161.21£ 1,937,161.21£ 6 Chemicals, Plastics and Rubber 04/07/2016 6.93200845 5.0 9 0 - 10% 2,703,250.00£ 2,703,250.00£ 7 Containers, Packaging and Glass 13/05/2018 8.78200847 8.0 14 10 - 20% 1,061,689.76£ 1,061,689.76£ 27 Cargo Transport 20/11/2023 14.30 2200854 4.0 53 50 - 60% 1,510,376.80£ 1,510,376.80£ 10 Diversified/Conglomerate Service 01/05/2010 0.75 2200858 7.0 19 10 - 20% 2,411,452.41£ 745,231.27£ 5 Buildings and Real Estate 01/01/2010 0.42200861 8.0 43 40 - 50% 2,743,376.32£ 2,743,376.32£ 29 Telecommunications 02/05/2013 3.75 2200863 3.0 16 10 - 20% 1,250,000.00£ 1,250,000.00£ 16 Grocery 31/07/2010 1.00200867 3.0 13 10 - 20% 2,850,000.00£ 2,850,000.00£ 5 Buildings and Real Estate 28/09/2010 1.16200868 5.0 10 0 - 10% 1,553,645.88£ 1,553,645.88£ 5 Buildings and Real Estate 21/04/2021 11.72200870 5.0 16 10 - 20% 890,852.65£ 890,852.65£ 18 Home and Office Furnishings, Housewares, and Durable Consumer Products 07/04/2024 14.68200883 8.0 32 30 - 40% 1,105,666.10£ 1,099,730.07£ 22 Machinery (Non-Agriculture, Non-Construction, Non-Electronic) 31/07/2010 1.00 1200884 4.0 16 10 - 20% 2,844,642.00£ 2,844,642.00£ 2 Automobile 02/04/2013 3.67200889 5.0 18 10 - 20% 2,256,025.00£ 2,256,025.00£ 13 Electronics 24/03/2011 1.65200894 6.0 38 30 - 40% 2,025,000.00£ 2,025,000.00£ 24 Oil and Gas 19/01/2014 4.47 2200900 8.0 29 20 - 30% 899,806.65£ 845,000.00£ 7 Containers, Packaging and Glass 17/01/2021 11.46 1200903 4.0 9 0 - 10% 4,310,600.81£ 4,310,600.81£ 10 Diversified/Conglomerate Service 01/08/2010 1.00200904 5.0 45 40 - 50% 1,140,932.70£ 1,140,932.70£ 6 Chemicals, Plastics and Rubber 31/07/2010 1.00200912 5.0 10 0 - 10% 5,002,500.00£ 5,002,500.00£ 19 Hotels, Motels, Inns and Gaming 30/06/2015 5.91200913 6.0 12 10 - 20% 2,226,000.00£ 2,226,000.00£ 25 Personal, Food and Miscellaneous 24/07/2024 14.98
Page 38 of 5730/06/2008

Data By Borrower
Borrower BBG Severity Severity Band RO Outstanding Debt RO Notional Balance
Moody's Industry Sector Moody's Industry Sector Maturity Date Remaining Term (Years) EWL Syndicated
200916 4.0 8 0 - 10% 330,936.13£ 330,936.13£ 9 Diversified/Conglomerate Manufacturing 31/10/2009 0.25200918 4.0 12 10 - 20% 8,122,582.18£ 8,112,496.76£ 22 Machinery (Non-Agriculture, Non-Construction, Non-Electronic) 31/07/2010 1.00200919 6.0 75 70 - 80% 2,064,989.47£ 2,064,989.47£ 21 Leisure, Amusement, Entertainment 07/11/2011 2.27200924 7.0 14 10 - 20% 2,150,000.00£ 2,150,000.00£ 21 Leisure, Amusement, Entertainment 07/07/2020 10.93200926 2.1 45 40 - 50% 3,979,124.92£ 3,979,124.92£ 24 Oil and Gas 31/07/2010 1.00200928 6.0 13 10 - 20% 5,450,000.00£ 5,450,000.00£ 5 Buildings and Real Estate 31/10/2009 0.25 2200930 3.0 9 0 - 10% 577,524.34£ 498,744.45£ 19 Hotels, Motels, Inns and Gaming 15/06/2023 13.87200931 3.0 10 0 - 10% 538,844.81£ 538,844.81£ 5 Buildings and Real Estate 09/02/2025 15.52200932 6.0 37 30 - 40% 1,728,231.93£ 1,711,983.87£ 2 Automobile 31/07/2010 1.00200933 2.1 12 10 - 20% 5,562,407.90£ 5,562,407.90£ 15 Farming and Agriculture 30/03/2011 1.66200935 7.0 12 10 - 20% 3,168,684.15£ 3,168,684.15£ 28 Retail Stores 31/10/2009 0.25200938 3.0 6 0 - 10% 975,000.00£ 975,000.00£ 18 Home and Office Furnishings, Housewares, and Durable Consumer Products 07/12/2015 6.35200939 6.0 9 0 - 10% 486,648.63£ 486,648.63£ 5 Buildings and Real Estate 31/03/2020 10.67200941 5.0 16 10 - 20% 24,362,000.00£ 24,362,000.00£ 5 Buildings and Real Estate 30/04/2014 4.75200950 4.0 6 0 - 10% 1,074,604.58£ 1,072,804.58£ 2 Automobile 01/04/2010 0.67200951 5.0 58 50 - 60% 878,262.93£ 878,262.93£ 18 Home and Office Furnishings, Housewares, and Durable Consumer Products 10/05/2012 2.78200953 6.0 18 10 - 20% 3,028,573.10£ 3,015,241.26£ 5 Buildings and Real Estate 08/08/2024 15.02200958 6.0 16 10 - 20% 1,965,532.85£ 1,965,532.85£ 17 Healthcare, Education and Childcare 19/09/2020 11.13200959 3.0 41 40 - 50% 815,371.86£ 815,371.86£ 10 Diversified/Conglomerate Service 31/07/2010 1.00200962 8.0 27 20 - 30% 1,477,255.35£ 1,477,255.35£ 22 Machinery (Non-Agriculture, Non-Construction, Non-Electronic) 01/07/2024 14.92 2200963 4.0 5 0 - 10% 5,789,100.23£ 5,650,857.87£ 5 Buildings and Real Estate 31/10/2009 0.25200964 5.0 8 0 - 10% 2,425,556.44£ 1,872,312.17£ 2 Automobile 31/10/2009 0.25200965 6.0 20 10 - 20% 764,300.30£ 764,300.30£ 21 Leisure, Amusement, Entertainment 31/07/2010 1.00200966 5.0 8 0 - 10% 344,858.35£ 344,858.35£ 27 Cargo Transport 13/06/2013 3.87200974 3.0 16 10 - 20% 901,529.25£ 901,529.25£ 18 Home and Office Furnishings, Housewares, and Durable Consumer Products 13/12/2022 13.37200975 5.0 19 10 - 20% 1,400,261.78£ 1,400,261.78£ 28 Retail Stores 01/06/2010 0.83200992 4.0 21 20 - 30% 10,031,792.41£ 8,393,392.94£ 5 Buildings and Real Estate 24/05/2010 0.81200996 4.0 23 20 - 30% 2,245,000.00£ 2,245,000.00£ 6 Chemicals, Plastics and Rubber 02/08/2010 1.00200999 6.0 44 40 - 50% 900,000.00£ 900,000.00£ 28 Retail Stores 10/12/2017 8.36 2201000 8.0 17 10 - 20% 2,206,142.01£ 2,142,552.69£ 5 Buildings and Real Estate 15/10/2009 0.21 1201003 8.0 11 10 - 20% 880,271.93£ 748,368.13£ 17 Healthcare, Education and Childcare 20/02/2019 9.55 2201004 5.0 33 30 - 40% 3,123,034.05£ 2,755,947.22£ 2 Automobile 31/10/2009 0.25201007 3.0 15 10 - 20% 1,250,000.00£ 1,250,000.00£ 2 Automobile 03/06/2010 0.84201011 4.0 5 0 - 10% 1,114,667.00£ 1,114,667.00£ 17 Healthcare, Education and Childcare 31/12/2018 9.42201016 7.0 100 90 - 100% 1,084,562.16£ 903,930.22£ 5 Buildings and Real Estate 31/10/2009 0.25201020 6.0 21 20 - 30% 659,544.75£ 657,900.00£ 5 Buildings and Real Estate 28/11/2009 0.33201023 4.0 15 10 - 20% 803,086.27£ 588,500.00£ 17 Healthcare, Education and Childcare 14/12/2022 13.37201028 8.0 21 20 - 30% 7,874,992.76£ 7,523,413.14£ 5 Buildings and Real Estate 31/10/2009 0.25 2201029 8.0 14 10 - 20% 953,029.85£ 942,338.66£ 25 Personal, Food and Miscellaneous 04/11/2021 12.26 2201030 2.1 39 30 - 40% 17,788,962.92£ 17,788,962.92£ 13 Electronics 06/02/2013 3.51201041 6.0 26 20 - 30% 313,056.54£ 313,056.54£ 13 Electronics 28/02/2016 6.58201042 4.0 20 10 - 20% 928,400.00£ 928,400.00£ 5 Buildings and Real Estate 31/10/2009 0.25201046 7.0 23 20 - 30% 1,703,434.12£ 1,703,434.12£ 5 Buildings and Real Estate 31/10/2009 0.25201048 6.0 10 0 - 10% 51,900.00£ 51,900.00£ 5 Buildings and Real Estate 04/11/2009 0.26201050 7.0 19 10 - 20% 572,692.23£ 568,449.09£ 18 Home and Office Furnishings, Housewares, and Durable Consumer Products 07/11/2021 12.27201051 3.0 5 0 - 10% 1,461,762.42£ 1,461,762.42£ 28 Retail Stores 01/06/2012 2.83201063 7.0 58 50 - 60% 1,600,000.04£ 1,600,000.04£ 5 Buildings and Real Estate 21/08/2021 12.06201068 1.5 47 40 - 50% 670,000.00£ 670,000.00£ 15 Farming and Agriculture 31/10/2009 0.25201073 3.0 11 10 - 20% 419,127.85£ 419,127.85£ 30 Textiles and Leather 02/07/2018 8.92201077 5.0 82 80 - 90% 695,750.00£ 695,750.00£ 25 Personal, Food and Miscellaneous 29/06/2012 2.91201079 2.1 7 0 - 10% 5,000,000.00£ 5,000,000.00£ 5 Buildings and Real Estate 28/01/2025 15.49201080 5.0 14 10 - 20% 1,327,847.04£ 1,327,847.04£ 27 Cargo Transport 26/06/2026 16.90201081 4.0 8 0 - 10% 520,028.81£ 256,905.60£ 25 Personal, Food and Miscellaneous 15/12/2017 8.37201084 5.0 23 20 - 30% 1,510,861.17£ 1,112,064.00£ 19 Hotels, Motels, Inns and Gaming 28/02/2023 13.58201085 6.0 48 40 - 50% 19,961,140.57£ 19,961,140.57£ 18 Home and Office Furnishings, Housewares, and Durable Consumer Products 31/12/2010 1.42 2 Y201098 5.0 28 20 - 30% 1,430,390.82£ 1,430,390.82£ 8 Personal and Non Durable Consumer Products (Manufacturing Only) 31/07/2010 1.00201099 1.5 8 0 - 10% 480,000.00£ 480,000.00£ 15 Farming and Agriculture 30/06/2013 3.91201100 4.0 14 10 - 20% 1,500,000.00£ 1,062,503.00£ 19 Hotels, Motels, Inns and Gaming 13/03/2011 1.62201103 4.0 39 30 - 40% 3,000,000.00£ 3,000,000.00£ 28 Retail Stores 19/10/2011 2.22 Y201104 3.0 9 0 - 10% 1,404,232.64£ 1,404,232.64£ 5 Buildings and Real Estate 31/10/2009 0.25201105 6.0 28 20 - 30% 1,786,392.74£ 1,786,392.74£ 17 Healthcare, Education and Childcare 12/01/2027 17.45201106 4.0 5 0 - 10% 728,951.83£ 728,951.83£ 17 Healthcare, Education and Childcare 13/07/2020 10.95201107 6.0 44 40 - 50% 399,375.82£ 399,375.82£ 18 Home and Office Furnishings, Housewares, and Durable Consumer Products 04/08/2019 10.01201109 6.0 37 30 - 40% 18,886,784.71£ 18,886,784.71£ 23 Mining, Steel, Iron and Non Precious Metals 31/07/2010 1.00 2201113 3.0 7 0 - 10% 370,725.46£ 370,725.46£ 22 Machinery (Non-Agriculture, Non-Construction, Non-Electronic) 02/04/2014 4.67
Page 39 of 5730/06/2008

Data By Borrower
Borrower BBG Severity Severity Band RO Outstanding Debt RO Notional Balance
Moody's Industry Sector Moody's Industry Sector Maturity Date Remaining Term (Years) EWL Syndicated
201115 6.0 6 0 - 10% 739,790.32£ 732,771.35£ 16 Grocery 10/12/2023 14.36201116 5.0 48 40 - 50% 677,082.15£ 677,082.15£ 21 Leisure, Amusement, Entertainment 11/03/2017 7.61201124 2.1 5 0 - 10% 550,579.96£ 550,579.96£ 5 Buildings and Real Estate 07/03/2020 10.60201129 3.0 15 10 - 20% 392,681.07£ 392,681.07£ 27 Cargo Transport 23/04/2017 7.73201136 8.0 12 10 - 20% 408,975.75£ 408,713.88£ 27 Cargo Transport 03/09/2014 5.09 2201137 8.0 23 20 - 30% 1,378,296.68£ 1,205,218.81£ 23 Mining, Steel, Iron and Non Precious Metals 31/10/2009 0.25 2201144 4.0 10 0 - 10% 796,031.76£ 448,000.00£ 25 Personal, Food and Miscellaneous 28/03/2024 14.66201147 6.0 5 0 - 10% 571,126.79£ 571,126.79£ 17 Healthcare, Education and Childcare 08/08/2017 8.02 2201149 4.0 24 20 - 30% 535,674.85£ 283,099.13£ 28 Retail Stores 31/10/2009 0.25201152 3.0 21 20 - 30% 2,931,586.00£ 2,931,586.00£ 5 Buildings and Real Estate 31/10/2009 0.25201156 6.0 5 0 - 10% 1,339,825.16£ 1,233,657.76£ 5 Buildings and Real Estate 31/10/2009 0.25201158 4.0 35 30 - 40% 2,550,000.00£ 2,055,000.00£ 21 Leisure, Amusement, Entertainment 06/02/2010 0.51201160 5.0 15 10 - 20% 1,249,620.39£ 1,239,483.57£ 21 Leisure, Amusement, Entertainment 01/03/2010 0.58201161 8.0 7 0 - 10% 2,223,685.13£ 1,667,317.41£ 15 Farming and Agriculture 31/10/2009 0.25 2201162 6.0 55 50 - 60% 2,628,222.56£ 2,628,222.56£ 10 Diversified/Conglomerate Service 12/03/2012 2.61 1201166 4.0 48 40 - 50% 316,069.06£ 297,742.62£ 22 Machinery (Non-Agriculture, Non-Construction, Non-Electronic) 31/10/2009 0.25201170 4.0 6 0 - 10% 2,313,731.33£ 2,313,731.33£ 17 Healthcare, Education and Childcare 07/12/2011 2.35201175 6.0 18 10 - 20% 805,000.00£ 805,000.00£ 5 Buildings and Real Estate 30/11/2009 0.33201176 8.0 19 10 - 20% 632,372.42£ 632,372.42£ 3 Banking 07/07/2023 13.93 2201178 6.0 17 10 - 20% 1,026,473.32£ 971,079.22£ 23 Mining, Steel, Iron and Non Precious Metals 31/10/2009 0.25201181 6.0 32 30 - 40% 241,798.80£ 241,798.80£ 2 Automobile 31/10/2009 0.25 2201182 1.2 56 50 - 60% 529,822.92£ 510,003.37£ 17 Healthcare, Education and Childcare 31/10/2009 0.25201184 3.0 6 0 - 10% 664,208.00£ 661,248.00£ 5 Buildings and Real Estate 20/07/2014 4.97201186 5.0 41 40 - 50% 1,027,666.21£ 997,508.40£ 15 Farming and Agriculture 31/10/2009 0.25201189 3.0 17 10 - 20% 516,777.21£ 516,777.21£ 28 Retail Stores 18/12/2023 14.38201190 3.0 9 0 - 10% 829,350.99£ 829,350.99£ 4 Beverage, Food and Tobacco 17/03/2011 1.63201195 3.0 20 10 - 20% 2,950,337.34£ 2,792,079.97£ 25 Personal, Food and Miscellaneous 30/06/2018 8.91201202 2.1 5 0 - 10% 736,384.08£ 736,384.08£ 5 Buildings and Real Estate 04/07/2018 8.93201212 3.0 5 0 - 10% 1,328,575.10£ 1,326,695.85£ 5 Buildings and Real Estate 31/10/2009 0.25201213 4.0 43 40 - 50% 3,157,999.98£ 3,157,999.98£ 10 Diversified/Conglomerate Service 31/07/2010 1.00201218 5.0 7 0 - 10% 963,198.00£ 960,501.00£ 19 Hotels, Motels, Inns and Gaming 08/10/2021 12.19201220 6.0 19 10 - 20% 1,881,000.00£ 1,881,000.00£ 5 Buildings and Real Estate 01/06/2010 0.83 2201222 3.0 41 40 - 50% 18,700,000.00£ 18,700,000.00£ 26 Printing and Publishing 31/07/2010 1.00201224 5.0 14 10 - 20% 2,631,751.94£ 2,611,778.00£ 5 Buildings and Real Estate 31/10/2009 0.25201229 5.0 13 10 - 20% 1,561,610.38£ 1,561,610.38£ 22 Machinery (Non-Agriculture, Non-Construction, Non-Electronic) 31/10/2009 0.25201235 5.0 18 10 - 20% 1,035,232.00£ 1,030,800.60£ 10 Diversified/Conglomerate Service 07/05/2020 10.77 1201239 8.0 36 30 - 40% 2,578,408.57£ 2,231,393.93£ 21 Leisure, Amusement, Entertainment 31/10/2009 0.25 2201240 6.0 83 80 - 90% 524,553.08£ 395,234.98£ 2 Automobile 31/10/2009 0.25201243 4.0 82 80 - 90% 225,500.00£ 225,500.00£ 17 Healthcare, Education and Childcare 08/11/2009 0.27201249 6.0 70 60 - 70% 3,050,000.00£ 3,050,000.00£ 28 Retail Stores 31/07/2010 1.00 2201250 3.0 5 0 - 10% 545,718.02£ 545,718.02£ 28 Retail Stores 03/04/2016 6.67201254 7.0 5 0 - 10% 879,207.81£ 598,667.12£ 8 Personal and Non Durable Consumer Products (Manufacturing Only) 31/10/2009 0.25201259 3.0 22 20 - 30% 979,870.68£ 717,308.24£ 15 Farming and Agriculture 02/12/2022 13.34201263 6.0 59 50 - 60% 1,192,553.97£ 697,518.02£ 17 Healthcare, Education and Childcare 31/10/2009 0.25201275 1.5 9 0 - 10% 2,955,749.47£ 2,955,749.47£ 5 Buildings and Real Estate 02/01/2014 4.42201277 8.0 20 10 - 20% 388,079.75£ 388,079.75£ 30 Textiles and Leather 31/10/2009 0.25 2201278 6.0 15 10 - 20% 522,999.65£ 522,999.65£ 27 Cargo Transport 22/02/2025 15.56201282 7.0 5 0 - 10% 1,584,310.90£ 1,584,310.90£ 2 Automobile 23/01/2019 9.48201288 6.0 9 0 - 10% 12,692,168.74£ 1,382,593.00£ 5 Buildings and Real Estate 01/08/2010 1.00201289 4.0 16 10 - 20% 603,019.15£ 603,019.15£ 18 Home and Office Furnishings, Housewares, and Durable Consumer Products 13/02/2024 14.53201299 4.0 47 40 - 50% 486,015.97£ 486,015.97£ 8 Personal and Non Durable Consumer Products (Manufacturing Only) 31/07/2010 1.00201300 2.8 39 30 - 40% 1,497,213.71£ 1,497,213.71£ 18 Home and Office Furnishings, Housewares, and Durable Consumer Products 31/10/2009 0.25201304 8.0 27 20 - 30% 443,256.90£ 400,727.84£ 5 Buildings and Real Estate 31/10/2009 0.25 2201307 6.0 24 20 - 30% 4,135,603.02£ 4,135,603.02£ 19 Hotels, Motels, Inns and Gaming 31/07/2010 1.00201315 5.0 23 20 - 30% 1,007,275.00£ 921,920.84£ 16 Grocery 20/02/2018 8.55201317 5.0 6 0 - 10% 837,500.00£ 837,500.00£ 10 Diversified/Conglomerate Service 08/10/2009 0.19201318 3.0 41 40 - 50% 35,823,574.61£ 24,499,991.13£ 13 Electronics 31/10/2009 0.25201320 4.0 20 10 - 20% 542,386.99£ 542,386.99£ 31 Personal Transportation 13/07/2017 7.95201326 5.0 17 10 - 20% 424,239.85£ 424,239.85£ 23 Mining, Steel, Iron and Non Precious Metals 10/04/2012 2.69201330 6.0 6 0 - 10% 555,900.79£ 555,900.79£ 25 Personal, Food and Miscellaneous 28/09/2012 3.16201332 6.0 61 60 - 70% 8,040,909.04£ 8,040,909.04£ 22 Machinery (Non-Agriculture, Non-Construction, Non-Electronic) 31/07/2010 1.00 2201334 6.0 18 10 - 20% 1,655,494.00£ 1,655,494.00£ 12 Ecological 30/12/2020 11.41201336 3.0 64 60 - 70% 1,020,000.00£ 1,020,000.00£ 5 Buildings and Real Estate 01/12/2009 0.33201342 1.5 39 30 - 40% 1,830,395.44£ 1,830,395.44£ 24 Oil and Gas 31/07/2010 1.00201346 6.0 28 20 - 30% 450,036.23£ 450,036.23£ 25 Personal, Food and Miscellaneous 18/03/2018 8.63
Page 40 of 5730/06/2008

Data By Borrower
Borrower BBG Severity Severity Band RO Outstanding Debt RO Notional Balance
Moody's Industry Sector Moody's Industry Sector Maturity Date Remaining Term (Years) EWL Syndicated
201347 5.0 23 20 - 30% 597,068.66£ 597,068.66£ 11 Diversified Natural Resources, Precious 28/03/2017 7.66201349 5.0 7 0 - 10% 4,106,500.02£ 4,103,500.02£ 5 Buildings and Real Estate 31/10/2009 0.25201354 4.0 28 20 - 30% 13,400,000.00£ 541,935.00£ 5 Buildings and Real Estate 09/01/2014 4.44201358 3.0 10 0 - 10% 262,150.00£ 262,150.00£ 13 Electronics 11/10/2010 1.19201365 5.0 5 0 - 10% 1,269,187.50£ 1,269,187.50£ 4 Beverage, Food and Tobacco 19/08/2014 5.05201368 5.0 5 0 - 10% 2,566,666.68£ 2,566,666.68£ 19 Hotels, Motels, Inns and Gaming 16/12/2015 6.38201369 5.0 9 0 - 10% 972,020.17£ 972,020.17£ 16 Grocery 31/10/2009 0.25 1201375 2.5 5 0 - 10% 378,514.95£ 377,572.45£ 15 Farming and Agriculture 30/12/2013 4.41201380 6.0 13 10 - 20% 291,943.77£ 291,943.77£ 6 Chemicals, Plastics and Rubber 30/05/2020 10.83201382 4.0 27 20 - 30% 5,912,162.16£ 5,912,162.16£ 4 Beverage, Food and Tobacco 31/07/2010 1.00201385 2.1 5 0 - 10% 2,232,700.00£ 2,232,700.00£ 5 Buildings and Real Estate 16/03/2016 6.63201387 3.0 19 10 - 20% 280,106.79£ 250,077.05£ 10 Diversified/Conglomerate Service 31/10/2009 0.25201389 4.0 8 0 - 10% 413,351.79£ 413,351.79£ 30 Textiles and Leather 11/05/2014 4.78201394 5.0 15 10 - 20% 3,687,204.31£ 3,658,647.52£ 5 Buildings and Real Estate 31/10/2009 0.25201397 7.0 6 0 - 10% 902,037.88£ 534,723.10£ 8 Personal and Non Durable Consumer Products (Manufacturing Only) 31/10/2009 0.25201402 4.0 13 10 - 20% 714,560.00£ 714,560.00£ 26 Printing and Publishing 14/08/2013 4.04201407 5.0 8 0 - 10% 919,890.61£ 919,890.61£ 22 Machinery (Non-Agriculture, Non-Construction, Non-Electronic) 31/10/2009 0.25201413 5.0 15 10 - 20% 3,208,040.28£ 2,106,659.85£ 5 Buildings and Real Estate 24/06/2010 0.90 2201418 8.0 8 0 - 10% 1,041,000.00£ 1,041,000.00£ 5 Buildings and Real Estate 15/01/2010 0.46 2201419 5.0 6 0 - 10% 1,032,793.00£ 1,032,793.00£ 6 Chemicals, Plastics and Rubber 27/01/2015 5.49201425 8.0 9 0 - 10% 1,319,666.78£ 1,319,666.78£ 22 Machinery (Non-Agriculture, Non-Construction, Non-Electronic) 02/08/2019 10.00 1201432 4.0 48 40 - 50% 400,000.00£ 400,000.00£ 4 Beverage, Food and Tobacco 27/05/2013 3.82201435 6.0 26 20 - 30% 1,078,579.28£ 1,078,579.28£ 28 Retail Stores 04/01/2025 15.43201440 4.0 20 10 - 20% 5,229,387.65£ 5,229,387.65£ 22 Machinery (Non-Agriculture, Non-Construction, Non-Electronic) 31/07/2010 1.00201444 4.0 12 10 - 20% 2,494,800.00£ 2,222,911.00£ 5 Buildings and Real Estate 31/10/2009 0.25201448 5.0 18 10 - 20% 3,250,000.00£ 3,250,000.00£ 19 Hotels, Motels, Inns and Gaming 31/07/2010 1.00201450 4.0 5 0 - 10% 1,080,000.00£ 1,080,000.00£ 25 Personal, Food and Miscellaneous 30/10/2012 3.25201462 5.0 13 10 - 20% 3,461,053.72£ 3,357,790.15£ 15 Farming and Agriculture 01/04/2010 0.67201465 5.0 36 30 - 40% 476,900.43£ 476,900.43£ 22 Machinery (Non-Agriculture, Non-Construction, Non-Electronic) 18/02/2022 12.55201470 5.0 12 10 - 20% 557,761.92£ 557,761.92£ 2 Automobile 13/09/2019 10.12201471 6.0 56 50 - 60% 13,988,600.81£ 13,988,600.81£ 6 Chemicals, Plastics and Rubber 30/06/2010 0.91 2201472 5.0 25 20 - 30% 2,079,000.00£ 2,079,000.00£ 21 Leisure, Amusement, Entertainment 23/04/2014 4.73201473 4.0 9 0 - 10% 478,613.34£ 420,621.93£ 22 Machinery (Non-Agriculture, Non-Construction, Non-Electronic) 31/10/2009 0.25201474 6.0 58 50 - 60% 7,947.83£ 7,947.83£ 8 Personal and Non Durable Consumer Products (Manufacturing Only) 31/07/2010 1.00 2201479 7.0 83 80 - 90% 1,408,011.66£ 1,408,011.66£ 5 Buildings and Real Estate 31/10/2009 0.25201481 5.0 15 10 - 20% 1,963,132.80£ 1,963,132.80£ 5 Buildings and Real Estate 30/04/2019 9.75201484 8.0 19 10 - 20% 3,445,500.00£ 3,445,500.00£ 19 Hotels, Motels, Inns and Gaming 30/01/2025 15.50 2201486 2.8 9 0 - 10% 761,562.18£ 761,562.18£ 24 Oil and Gas 30/01/2017 7.50201488 4.0 18 10 - 20% 650,889.52£ 650,889.52£ 17 Healthcare, Education and Childcare 26/06/2019 9.90201494 5.0 10 0 - 10% 667,843.73£ 559,665.00£ 6 Chemicals, Plastics and Rubber 31/10/2009 0.25201504 5.0 59 50 - 60% 450,000.00£ 450,000.00£ 4 Beverage, Food and Tobacco 20/08/2013 4.05201507 6.0 39 30 - 40% 3,003,364.66£ 3,003,364.66£ 8 Personal and Non Durable Consumer Products (Manufacturing Only) 31/07/2010 1.00201509 3.0 70 60 - 70% 1,292,902.25£ 1,292,902.25£ 5 Buildings and Real Estate 31/10/2009 0.25201511 4.0 15 10 - 20% 6,939,384.60£ 6,939,384.60£ 5 Buildings and Real Estate 31/10/2009 0.25201513 4.0 15 10 - 20% 1,236,861.09£ 1,236,861.09£ 5 Buildings and Real Estate 27/09/2024 15.16201521 4.0 5 0 - 10% 339,817.56£ 339,817.56£ 13 Electronics 30/11/2011 2.33201524 8.0 10 0 - 10% 8,212,458.76£ 8,212,458.76£ 5 Buildings and Real Estate 22/12/2009 0.39 2201529 4.0 17 10 - 20% 999,323.48£ 999,323.48£ 17 Healthcare, Education and Childcare 30/10/2023 14.25201531 4.0 20 10 - 20% 1,444,087.48£ 1,444,087.48£ 10 Diversified/Conglomerate Service 31/05/2024 14.83201533 3.0 20 10 - 20% 2,260,400.00£ 2,260,400.00£ 5 Buildings and Real Estate 25/05/2010 0.82201536 4.0 25 20 - 30% 633,003.29£ 633,003.29£ 16 Grocery 12/11/2023 14.28201537 6.0 30 20 - 30% 819,000.00£ 819,000.00£ 5 Buildings and Real Estate 31/10/2009 0.25 2201538 2.8 48 40 - 50% 5,600,000.00£ 5,600,000.00£ 20 Insurance 09/06/2013 3.86201547 5.0 20 10 - 20% 591,617.37£ 563,223.03£ 22 Machinery (Non-Agriculture, Non-Construction, Non-Electronic) 14/11/2017 8.29201550 4.0 59 50 - 60% 896,110.35£ 604,268.19£ 8 Personal and Non Durable Consumer Products (Manufacturing Only) 31/10/2009 0.25201553 7.0 32 30 - 40% 2,888,000.01£ 2,888,000.01£ 19 Hotels, Motels, Inns and Gaming 06/08/2013 4.01 1201559 3.0 7 0 - 10% 539,989.00£ 539,989.00£ 17 Healthcare, Education and Childcare 20/12/2015 6.39201561 4.0 9 0 - 10% 764,778.96£ 764,778.96£ 25 Personal, Food and Miscellaneous 29/10/2022 13.24201564 6.0 24 20 - 30% 2,324,286.68£ 2,072,262.95£ 23 Mining, Steel, Iron and Non Precious Metals 31/10/2009 0.25201565 7.0 23 20 - 30% 470,120.00£ 436,120.00£ 5 Buildings and Real Estate 31/10/2009 0.25201569 6.0 14 10 - 20% 1,644,113.08£ 1,644,113.08£ 5 Buildings and Real Estate 31/10/2009 0.25201574 3.0 20 10 - 20% 5,750,000.00£ 4,600,000.00£ 5 Buildings and Real Estate 28/06/2010 0.91201579 8.0 12 10 - 20% 1,468,894.59£ 1,444,158.50£ 28 Retail Stores 14/10/2020 11.20 2201596 8.0 17 10 - 20% 536,214.56£ 310,644.88£ 2 Automobile 31/10/2009 0.25 2201597 6.0 17 10 - 20% 5,113,464.87£ 4,978,186.26£ 2 Automobile 31/10/2009 0.25
Page 41 of 5730/06/2008

Data By Borrower
Borrower BBG Severity Severity Band RO Outstanding Debt RO Notional Balance
Moody's Industry Sector Moody's Industry Sector Maturity Date Remaining Term (Years) EWL Syndicated
201598 5.0 62 60 - 70% 2,415,175.27£ 2,269,157.52£ 16 Grocery 31/08/2020 11.08201601 8.0 10 0 - 10% 1,126,645.56£ 1,126,645.56£ 10 Diversified/Conglomerate Service 29/11/2023 14.33 2201602 3.0 15 10 - 20% 427,536.74£ 427,536.74£ 28 Retail Stores 16/06/2015 5.88201604 5.0 74 70 - 80% 845,727.27£ 845,727.27£ 29 Telecommunications 14/09/2010 1.12 1201606 7.0 23 20 - 30% 545,275.25£ 545,275.25£ 18 Home and Office Furnishings, Housewares, and Durable Consumer Products 03/01/2018 8.42201609 4.0 27 20 - 30% 7,545,917.42£ 7,530,476.75£ 28 Retail Stores 31/07/2010 1.00201612 6.0 58 50 - 60% 1,521,108.09£ 1,521,108.09£ 22 Machinery (Non-Agriculture, Non-Construction, Non-Electronic) 31/10/2009 0.25 2201615 3.0 5 0 - 10% 760,408.29£ 760,408.29£ 11 Diversified Natural Resources, Precious 08/01/2011 1.44201616 5.0 16 10 - 20% 506,773.20£ 506,773.20£ 24 Oil and Gas 08/09/2023 14.10201619 5.0 75 70 - 80% 400,000.00£ 400,000.00£ 10 Diversified/Conglomerate Service 30/09/2010 1.16201622 4.0 83 80 - 90% 857,741.67£ 857,741.67£ 12 Ecological 31/10/2009 0.25201623 4.0 21 20 - 30% 520,000.00£ 520,000.00£ 27 Cargo Transport 22/11/2015 6.31201629 8.0 12 10 - 20% 3,367,084.41£ 3,367,084.41£ 25 Personal, Food and Miscellaneous 31/10/2009 0.25 2201630 5.0 17 10 - 20% 1,857,169.24£ 1,857,169.24£ 10 Diversified/Conglomerate Service 12/07/2020 10.95201634 5.0 32 30 - 40% 1,462,211.83£ 1,150,479.33£ 33 Broadcasting & Entertainment 24/11/2024 15.31201637 3.0 22 20 - 30% 5,000,000.00£ 5,000,000.00£ 10 Diversified/Conglomerate Service 21/04/2013 3.72 Y201641 7.0 30 20 - 30% 1,413,000.00£ 1,413,000.00£ 30 Textiles and Leather 18/07/2010 0.96201643 5.0 14 10 - 20% 836,667.00£ 836,667.00£ 17 Healthcare, Education and Childcare 26/03/2019 9.65201644 4.0 5 0 - 10% 1,785,227.36£ 1,785,227.36£ 2 Automobile 01/07/2014 4.92201645 6.0 7 0 - 10% 1,244,032.84£ 1,244,032.84£ 9 Diversified/Conglomerate Manufacturing 31/07/2010 1.00201648 8.0 33 30 - 40% 776,371.81£ 494,999.40£ 15 Farming and Agriculture 31/10/2009 0.25 2201651 6.0 34 30 - 40% 841,547.00£ 826,432.15£ 24 Oil and Gas 31/07/2010 1.00201653 7.0 16 10 - 20% 749,320.44£ 441,033.05£ 5 Buildings and Real Estate 31/10/2009 0.25201656 2.8 22 20 - 30% 1,308,554.26£ 1,308,554.26£ 33 Broadcasting & Entertainment 10/08/2020 11.03201659 8.0 21 20 - 30% 1,239,675.82£ 1,028,210.29£ 22 Machinery (Non-Agriculture, Non-Construction, Non-Electronic) 31/10/2009 0.25 2201662 4.0 16 10 - 20% 655,188.01£ 534,198.53£ 5 Buildings and Real Estate 18/08/2021 12.05201669 6.0 35 30 - 40% 1,080,599.95£ 1,080,599.95£ 2 Automobile 25/01/2019 9.48201671 5.0 28 20 - 30% 1,791,666.70£ 1,791,666.70£ 10 Diversified/Conglomerate Service 03/09/2016 7.09201681 2.8 12 10 - 20% 1,803,049.19£ 1,803,049.19£ 5 Buildings and Real Estate 05/05/2021 11.76201683 3.0 7 0 - 10% 691,788.94£ 691,788.94£ 18 Home and Office Furnishings, Housewares, and Durable Consumer Products 31/07/2010 1.00201690 4.0 41 40 - 50% 2,387,567.18£ 2,387,567.18£ 8 Personal and Non Durable Consumer Products (Manufacturing Only) 31/10/2009 0.25201691 3.0 18 10 - 20% 484,158.31£ 484,158.31£ 5 Buildings and Real Estate 24/01/2022 12.48201692 2.1 8 0 - 10% 552,117.29£ 552,117.29£ 2 Automobile 07/11/2022 13.27201695 5.0 15 10 - 20% 390,204.52£ 390,204.52£ 2 Automobile 01/04/2013 3.67201701 3.0 16 10 - 20% 471,574.53£ 371,077.03£ 5 Buildings and Real Estate 17/12/2009 0.38201702 4.0 12 10 - 20% 1,245,936.71£ 1,245,936.71£ 6 Chemicals, Plastics and Rubber 26/03/2019 9.65201707 5.0 17 10 - 20% 479,216.64£ 479,216.64£ 28 Retail Stores 28/02/2023 13.58201712 4.0 17 10 - 20% 1,540,000.00£ 1,540,000.00£ 5 Buildings and Real Estate 12/12/2009 0.36201714 6.0 11 10 - 20% 5,118,981.20£ 5,118,981.20£ 19 Hotels, Motels, Inns and Gaming 17/02/2024 14.54201716 4.0 12 10 - 20% 500,000.00£ 500,000.00£ 27 Cargo Transport 30/06/2014 4.91201718 8.0 14 10 - 20% 1,789,267.05£ 1,789,267.05£ 17 Healthcare, Education and Childcare 04/07/2024 14.93 1201719 3.0 20 10 - 20% 4,659,289.83£ 4,659,289.83£ 28 Retail Stores 01/05/2023 13.75201726 6.0 13 10 - 20% 2,126,750.07£ 2,126,750.07£ 16 Grocery 16/10/2018 9.21201731 4.0 22 20 - 30% 859,616.62£ 859,616.62£ 17 Healthcare, Education and Childcare 31/12/2023 14.42201740 5.0 5 0 - 10% 1,045,000.00£ 1,045,000.00£ 22 Machinery (Non-Agriculture, Non-Construction, Non-Electronic) 24/11/2011 2.31201741 4.0 12 10 - 20% 599,346.92£ 598,746.92£ 17 Healthcare, Education and Childcare 03/12/2018 9.34201742 5.0 22 20 - 30% 1,922,173.87£ 1,922,173.87£ 4 Beverage, Food and Tobacco 31/10/2009 0.25201743 3.0 12 10 - 20% 1,701,722.04£ 1,701,722.04£ 5 Buildings and Real Estate 31/10/2009 0.25201746 5.0 9 0 - 10% 3,228,620.27£ 3,108,000.00£ 22 Machinery (Non-Agriculture, Non-Construction, Non-Electronic) 25/07/2010 0.98201748 4.0 18 10 - 20% 675,436.36£ 675,436.36£ 22 Machinery (Non-Agriculture, Non-Construction, Non-Electronic) 01/10/2016 7.17201749 7.0 66 60 - 70% 3,101,208.30£ 3,101,208.30£ 10 Diversified/Conglomerate Service 31/10/2012 3.25 2201750 4.0 6 0 - 10% 1,907,820.04£ 1,907,820.04£ 19 Hotels, Motels, Inns and Gaming 31/10/2009 0.25201751 8.0 13 10 - 20% 1,800,879.67£ 1,798,379.67£ 19 Hotels, Motels, Inns and Gaming 31/10/2009 0.25 2201754 6.0 8 0 - 10% 1,747,427.45£ 1,747,427.45£ 5 Buildings and Real Estate 14/04/2022 12.70201763 2.5 8 0 - 10% 322,176.25£ 322,176.25£ 25 Personal, Food and Miscellaneous 25/07/2018 8.98201765 8.0 41 40 - 50% 751,200.00£ 751,200.00£ 5 Buildings and Real Estate 31/01/2010 0.50 2201767 2.1 16 10 - 20% 6,996,091.78£ 6,985,832.10£ 5 Buildings and Real Estate 06/12/2014 5.35201772 8.0 16 10 - 20% 1,723,975.07£ 1,723,975.07£ 19 Hotels, Motels, Inns and Gaming 05/06/2017 7.84 2201780 4.0 9 0 - 10% 331,207.32£ 331,207.32£ 5 Buildings and Real Estate 03/02/2010 0.51201781 6.0 17 10 - 20% 317,700.00£ 317,700.00£ 2 Automobile 04/05/2019 9.76201782 4.0 56 50 - 60% 3,498,559.93£ 3,498,559.93£ 21 Leisure, Amusement, Entertainment 26/11/2009 0.32201783 4.0 20 10 - 20% 653,177.03£ 653,177.03£ 18 Home and Office Furnishings, Housewares, and Durable Consumer Products 21/12/2024 15.39201784 6.0 5 0 - 10% 692,374.80£ 692,374.80£ 8 Personal and Non Durable Consumer Products (Manufacturing Only) 31/07/2010 1.00201785 8.0 20 10 - 20% 900,696.98£ 900,696.98£ 33 Broadcasting & Entertainment 19/09/2026 17.13 2201789 6.0 23 20 - 30% 714,584.29£ 714,584.29£ 22 Machinery (Non-Agriculture, Non-Construction, Non-Electronic) 30/08/2022 13.08
Page 42 of 5730/06/2008
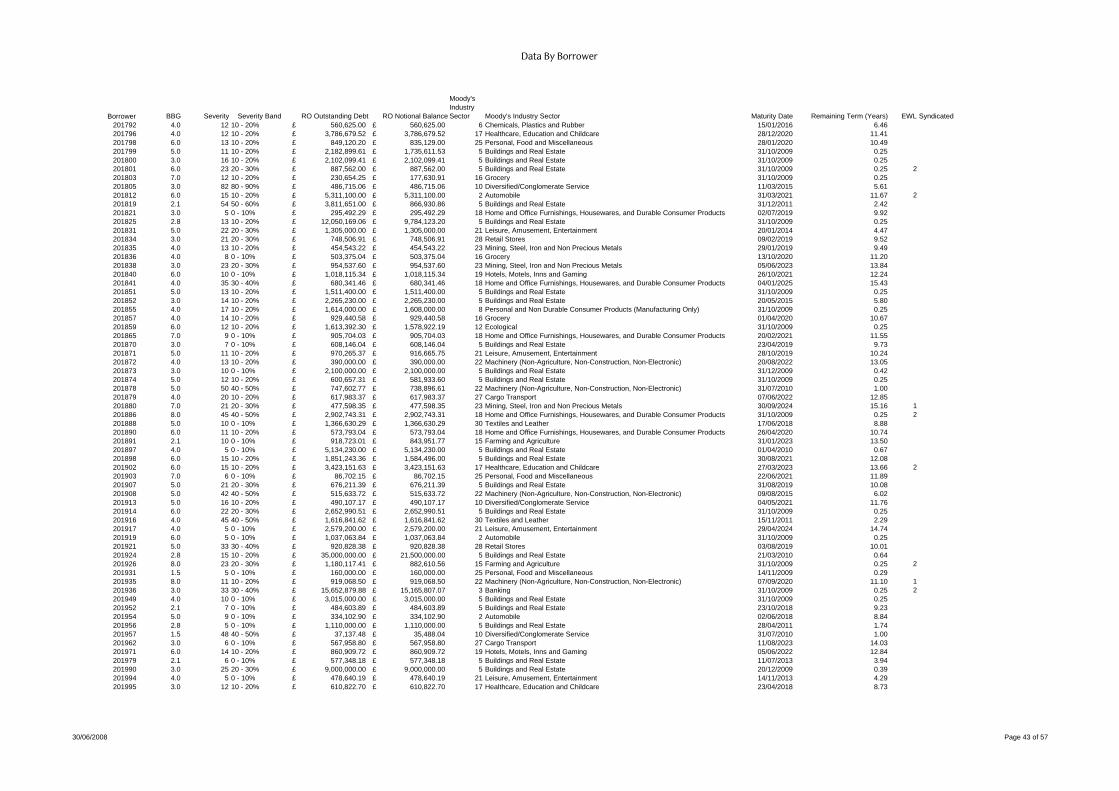
Data By Borrower
Borrower BBG Severity Severity Band RO Outstanding Debt RO Notional Balance
Moody's Industry Sector Moody's Industry Sector Maturity Date Remaining Term (Years) EWL Syndicated
201792 4.0 12 10 - 20% 560,625.00£ 560,625.00£ 6 Chemicals, Plastics and Rubber 15/01/2016 6.46201796 4.0 12 10 - 20% 3,786,679.52£ 3,786,679.52£ 17 Healthcare, Education and Childcare 28/12/2020 11.41201798 6.0 13 10 - 20% 849,120.20£ 835,129.00£ 25 Personal, Food and Miscellaneous 28/01/2020 10.49201799 5.0 11 10 - 20% 2,182,899.61£ 1,735,611.53£ 5 Buildings and Real Estate 31/10/2009 0.25201800 3.0 16 10 - 20% 2,102,099.41£ 2,102,099.41£ 5 Buildings and Real Estate 31/10/2009 0.25201801 6.0 23 20 - 30% 887,562.00£ 887,562.00£ 5 Buildings and Real Estate 31/10/2009 0.25 2201803 7.0 12 10 - 20% 230,654.25£ 177,630.91£ 16 Grocery 31/10/2009 0.25201805 3.0 82 80 - 90% 486,715.06£ 486,715.06£ 10 Diversified/Conglomerate Service 11/03/2015 5.61201812 6.0 15 10 - 20% 5,311,100.00£ 5,311,100.00£ 2 Automobile 31/03/2021 11.67 2201819 2.1 54 50 - 60% 3,811,651.00£ 866,930.86£ 5 Buildings and Real Estate 31/12/2011 2.42201821 3.0 5 0 - 10% 295,492.29£ 295,492.29£ 18 Home and Office Furnishings, Housewares, and Durable Consumer Products 02/07/2019 9.92201825 2.8 13 10 - 20% 12,050,169.06£ 9,784,123.20£ 5 Buildings and Real Estate 31/10/2009 0.25201831 5.0 22 20 - 30% 1,305,000.00£ 1,305,000.00£ 21 Leisure, Amusement, Entertainment 20/01/2014 4.47201834 3.0 21 20 - 30% 748,506.91£ 748,506.91£ 28 Retail Stores 09/02/2019 9.52201835 4.0 13 10 - 20% 454,543.22£ 454,543.22£ 23 Mining, Steel, Iron and Non Precious Metals 29/01/2019 9.49201836 4.0 8 0 - 10% 503,375.04£ 503,375.04£ 16 Grocery 13/10/2020 11.20201838 3.0 23 20 - 30% 954,537.60£ 954,537.60£ 23 Mining, Steel, Iron and Non Precious Metals 05/06/2023 13.84201840 6.0 10 0 - 10% 1,018,115.34£ 1,018,115.34£ 19 Hotels, Motels, Inns and Gaming 26/10/2021 12.24201841 4.0 35 30 - 40% 680,341.46£ 680,341.46£ 18 Home and Office Furnishings, Housewares, and Durable Consumer Products 04/01/2025 15.43201851 5.0 13 10 - 20% 1,511,400.00£ 1,511,400.00£ 5 Buildings and Real Estate 31/10/2009 0.25201852 3.0 14 10 - 20% 2,265,230.00£ 2,265,230.00£ 5 Buildings and Real Estate 20/05/2015 5.80201855 4.0 17 10 - 20% 1,614,000.00£ 1,608,000.00£ 8 Personal and Non Durable Consumer Products (Manufacturing Only) 31/10/2009 0.25201857 4.0 14 10 - 20% 929,440.58£ 929,440.58£ 16 Grocery 01/04/2020 10.67201859 6.0 12 10 - 20% 1,613,392.30£ 1,578,922.19£ 12 Ecological 31/10/2009 0.25201865 7.0 9 0 - 10% 905,704.03£ 905,704.03£ 18 Home and Office Furnishings, Housewares, and Durable Consumer Products 20/02/2021 11.55201870 3.0 7 0 - 10% 608,146.04£ 608,146.04£ 5 Buildings and Real Estate 23/04/2019 9.73201871 5.0 11 10 - 20% 970,265.37£ 916,665.75£ 21 Leisure, Amusement, Entertainment 28/10/2019 10.24201872 4.0 13 10 - 20% 390,000.00£ 390,000.00£ 22 Machinery (Non-Agriculture, Non-Construction, Non-Electronic) 20/08/2022 13.05201873 3.0 10 0 - 10% 2,100,000.00£ 2,100,000.00£ 5 Buildings and Real Estate 31/12/2009 0.42201874 5.0 12 10 - 20% 600,657.31£ 581,933.60£ 5 Buildings and Real Estate 31/10/2009 0.25201878 5.0 50 40 - 50% 747,602.77£ 738,896.61£ 22 Machinery (Non-Agriculture, Non-Construction, Non-Electronic) 31/07/2010 1.00201879 4.0 20 10 - 20% 617,983.37£ 617,983.37£ 27 Cargo Transport 07/06/2022 12.85201880 7.0 21 20 - 30% 477,598.35£ 477,598.35£ 23 Mining, Steel, Iron and Non Precious Metals 30/09/2024 15.16 1201886 8.0 45 40 - 50% 2,902,743.31£ 2,902,743.31£ 18 Home and Office Furnishings, Housewares, and Durable Consumer Products 31/10/2009 0.25 2201888 5.0 10 0 - 10% 1,366,630.29£ 1,366,630.29£ 30 Textiles and Leather 17/06/2018 8.88201890 6.0 11 10 - 20% 573,793.04£ 573,793.04£ 18 Home and Office Furnishings, Housewares, and Durable Consumer Products 26/04/2020 10.74201891 2.1 10 0 - 10% 918,723.01£ 843,951.77£ 15 Farming and Agriculture 31/01/2023 13.50201897 4.0 5 0 - 10% 5,134,230.00£ 5,134,230.00£ 5 Buildings and Real Estate 01/04/2010 0.67201898 6.0 15 10 - 20% 1,851,243.36£ 1,584,496.00£ 5 Buildings and Real Estate 30/08/2021 12.08201902 6.0 15 10 - 20% 3,423,151.63£ 3,423,151.63£ 17 Healthcare, Education and Childcare 27/03/2023 13.66 2201903 7.0 6 0 - 10% 86,702.15£ 86,702.15£ 25 Personal, Food and Miscellaneous 22/06/2021 11.89201907 5.0 21 20 - 30% 676,211.39£ 676,211.39£ 5 Buildings and Real Estate 31/08/2019 10.08201908 5.0 42 40 - 50% 515,633.72£ 515,633.72£ 22 Machinery (Non-Agriculture, Non-Construction, Non-Electronic) 09/08/2015 6.02201913 5.0 16 10 - 20% 490,107.17£ 490,107.17£ 10 Diversified/Conglomerate Service 04/05/2021 11.76201914 6.0 22 20 - 30% 2,652,990.51£ 2,652,990.51£ 5 Buildings and Real Estate 31/10/2009 0.25201916 4.0 45 40 - 50% 1,616,841.62£ 1,616,841.62£ 30 Textiles and Leather 15/11/2011 2.29201917 4.0 5 0 - 10% 2,579,200.00£ 2,579,200.00£ 21 Leisure, Amusement, Entertainment 29/04/2024 14.74201919 6.0 5 0 - 10% 1,037,063.84£ 1,037,063.84£ 2 Automobile 31/10/2009 0.25201921 5.0 33 30 - 40% 920,828.38£ 920,828.38£ 28 Retail Stores 03/08/2019 10.01201924 2.8 15 10 - 20% 35,000,000.00£ 21,500,000.00£ 5 Buildings and Real Estate 21/03/2010 0.64201926 8.0 23 20 - 30% 1,180,117.41£ 882,610.56£ 15 Farming and Agriculture 31/10/2009 0.25 2201931 1.5 5 0 - 10% 160,000.00£ 160,000.00£ 25 Personal, Food and Miscellaneous 14/11/2009 0.29201935 8.0 11 10 - 20% 919,068.50£ 919,068.50£ 22 Machinery (Non-Agriculture, Non-Construction, Non-Electronic) 07/09/2020 11.10 1201936 3.0 33 30 - 40% 15,652,879.88£ 15,165,807.07£ 3 Banking 31/10/2009 0.25 2201949 4.0 10 0 - 10% 3,015,000.00£ 3,015,000.00£ 5 Buildings and Real Estate 31/10/2009 0.25201952 2.1 7 0 - 10% 484,603.89£ 484,603.89£ 5 Buildings and Real Estate 23/10/2018 9.23201954 5.0 9 0 - 10% 334,102.90£ 334,102.90£ 2 Automobile 02/06/2018 8.84201956 2.8 5 0 - 10% 1,110,000.00£ 1,110,000.00£ 5 Buildings and Real Estate 28/04/2011 1.74201957 1.5 48 40 - 50% 37,137.48£ 35,488.04£ 10 Diversified/Conglomerate Service 31/07/2010 1.00201962 3.0 6 0 - 10% 567,958.80£ 567,958.80£ 27 Cargo Transport 11/08/2023 14.03201971 6.0 14 10 - 20% 860,909.72£ 860,909.72£ 19 Hotels, Motels, Inns and Gaming 05/06/2022 12.84201979 2.1 6 0 - 10% 577,348.18£ 577,348.18£ 5 Buildings and Real Estate 11/07/2013 3.94201990 3.0 25 20 - 30% 9,000,000.00£ 9,000,000.00£ 5 Buildings and Real Estate 20/12/2009 0.39201994 4.0 5 0 - 10% 478,640.19£ 478,640.19£ 21 Leisure, Amusement, Entertainment 14/11/2013 4.29201995 3.0 12 10 - 20% 610,822.70£ 610,822.70£ 17 Healthcare, Education and Childcare 23/04/2018 8.73
Page 43 of 5730/06/2008

Data By Borrower
Borrower BBG Severity Severity Band RO Outstanding Debt RO Notional Balance
Moody's Industry Sector Moody's Industry Sector Maturity Date Remaining Term (Years) EWL Syndicated
201997 6.0 84 80 - 90% 7,478,000.00£ 7,478,000.00£ 10 Diversified/Conglomerate Service 21/12/2011 2.39 2202002 4.0 17 10 - 20% 738,495.18£ 507,000.73£ 16 Grocery 20/11/2022 13.30202003 4.0 9 0 - 10% 3,253,871.09£ 3,253,871.09£ 19 Hotels, Motels, Inns and Gaming 31/10/2009 0.25202005 5.0 14 10 - 20% 564,847.02£ 564,847.02£ 19 Hotels, Motels, Inns and Gaming 01/12/2023 14.33202006 5.0 9 0 - 10% 477,266.98£ 477,266.98£ 22 Machinery (Non-Agriculture, Non-Construction, Non-Electronic) 19/01/2014 4.47202015 4.0 25 20 - 30% 829,745.97£ 829,745.97£ 28 Retail Stores 23/04/2013 3.73202021 2.1 10 0 - 10% 1,305,744.38£ 1,305,744.38£ 27 Cargo Transport 13/10/2020 11.20202025 3.0 11 10 - 20% 3,100,000.00£ 2,604,838.00£ 5 Buildings and Real Estate 19/04/2010 0.72202027 2.1 9 0 - 10% 10,623,021.95£ 10,623,021.95£ 15 Farming and Agriculture 31/10/2009 0.25202031 6.0 11 10 - 20% 553,756.45£ 553,756.45£ 21 Leisure, Amusement, Entertainment 23/03/2018 8.64202032 8.0 21 20 - 30% 1,352,392.13£ 1,352,392.13£ 18 Home and Office Furnishings, Housewares, and Durable Consumer Products 01/06/2019 9.83 1202033 5.0 5 0 - 10% 1,810,417.93£ 1,549,899.36£ 19 Hotels, Motels, Inns and Gaming 03/03/2010 0.59202034 1.8 18 10 - 20% 1,246,149.58£ 836,859.23£ 15 Farming and Agriculture 31/10/2009 0.25202043 7.0 7 0 - 10% 2,588,635.17£ 2,588,635.17£ 25 Personal, Food and Miscellaneous 31/01/2010 0.50202048 3.0 14 10 - 20% 10,600,000.00£ 4,780,926.00£ 5 Buildings and Real Estate 27/02/2019 9.57202055 4.0 19 10 - 20% 800,000.00£ 800,000.00£ 5 Buildings and Real Estate 31/10/2009 0.25202057 7.0 17 10 - 20% 4,180,321.45£ 4,180,321.45£ 21 Leisure, Amusement, Entertainment 31/10/2009 0.25202058 6.0 17 10 - 20% 2,407,041.03£ 2,191,823.76£ 10 Diversified/Conglomerate Service 31/10/2009 0.25202061 3.0 18 10 - 20% 775,000.00£ 775,000.00£ 17 Healthcare, Education and Childcare 28/04/2018 8.74202062 6.0 11 10 - 20% 4,304,355.22£ 4,304,355.22£ 5 Buildings and Real Estate 31/10/2009 0.25202064 6.0 81 80 - 90% 1,295,439.85£ 847,488.04£ 18 Home and Office Furnishings, Housewares, and Durable Consumer Products 31/10/2009 0.25202066 6.0 16 10 - 20% 979,725.61£ 979,725.61£ 26 Printing and Publishing 01/07/2023 13.92202074 7.0 19 10 - 20% 172,384.67£ 172,384.67£ 5 Buildings and Real Estate 01/03/2010 0.58202077 7.0 7 0 - 10% 2,999,999.92£ 1,676,816.00£ 5 Buildings and Real Estate 22/03/2012 2.64202084 4.0 14 10 - 20% 1,799,998.40£ 1,799,998.40£ 5 Buildings and Real Estate 02/07/2019 9.92202088 4.0 32 30 - 40% 1,639,509.18£ 1,522,890.39£ 4 Beverage, Food and Tobacco 31/10/2009 0.25202093 3.0 9 0 - 10% 856,211.72£ 719,451.41£ 22 Machinery (Non-Agriculture, Non-Construction, Non-Electronic) 07/09/2014 5.10202094 7.0 19 10 - 20% 803,333.72£ 803,333.72£ 33 Broadcasting & Entertainment 30/04/2025 15.75202096 3.0 12 10 - 20% 421,654.81£ 421,654.81£ 23 Mining, Steel, Iron and Non Precious Metals 24/12/2016 7.40202098 5.0 18 10 - 20% 11,865,962.82£ 11,865,962.82£ 29 Telecommunications 31/10/2009 0.25202102 5.0 11 10 - 20% 170,000.00£ 170,000.00£ 27 Cargo Transport 12/01/2013 3.45202104 4.0 12 10 - 20% 428,154.68£ 428,154.68£ 22 Machinery (Non-Agriculture, Non-Construction, Non-Electronic) 06/09/2017 8.10202112 8.0 59 50 - 60% 3,247,399.64£ 3,220,221.88£ 5 Buildings and Real Estate 31/10/2009 0.25 2202113 5.0 18 10 - 20% 822,162.37£ 331,234.38£ 2 Automobile 31/10/2009 0.25202116 4.0 14 10 - 20% 688,648.42£ 688,648.42£ 2 Automobile 30/12/2019 10.41202123 6.0 30 20 - 30% 680,030.49£ 680,030.49£ 31 Personal Transportation 28/09/2016 7.16 2202127 3.0 15 10 - 20% 34,656,724.01£ 24,500,000.00£ 19 Hotels, Motels, Inns and Gaming 19/12/2011 2.38 Y202128 5.0 62 60 - 70% 4,600,000.00£ 4,600,000.00£ 15 Farming and Agriculture 31/07/2010 1.00202129 2.5 15 10 - 20% 1,113,668.09£ 771,800.62£ 5 Buildings and Real Estate 31/10/2009 0.25202131 8.0 32 30 - 40% 1,303,176.90£ 1,303,176.90£ 31 Personal Transportation 30/04/2011 1.75 2202132 5.0 18 10 - 20% 6,641,627.20£ 6,641,627.20£ 5 Buildings and Real Estate 31/03/2014 4.67 2202134 5.0 13 10 - 20% 2,128,934.34£ 1,892,700.00£ 17 Healthcare, Education and Childcare 03/03/2018 8.59202135 5.0 19 10 - 20% 1,516,803.94£ 1,452,818.88£ 28 Retail Stores 31/07/2010 1.00202137 6.0 26 20 - 30% 1,500,885.74£ 1,423,717.93£ 12 Ecological 07/02/2023 13.52202138 5.0 13 10 - 20% 7,983,987.73£ 7,983,987.73£ 24 Oil and Gas 09/03/2014 4.61202143 5.0 68 60 - 70% 926,288.27£ 926,288.27£ 25 Personal, Food and Miscellaneous 24/01/2018 8.48202148 8.0 74 70 - 80% 2,642,235.55£ 2,642,232.80£ 31 Personal Transportation 25/11/2024 15.32202156 6.0 33 30 - 40% 2,404,374.93£ 2,404,374.93£ 27 Cargo Transport 08/04/2018 8.69202159 2.8 10 0 - 10% 2,200,000.00£ 2,200,000.00£ 5 Buildings and Real Estate 15/12/2011 2.37202168 6.0 34 30 - 40% 713,316.52£ 342,317.93£ 13 Electronics 28/05/2010 0.83 2202172 3.0 6 0 - 10% 1,313,515.40£ 1,313,515.40£ 17 Healthcare, Education and Childcare 12/09/2017 8.11202173 4.0 11 10 - 20% 1,578,120.00£ 1,578,120.00£ 17 Healthcare, Education and Childcare 06/12/2022 13.35202183 4.0 10 0 - 10% 581,250.00£ 581,250.00£ 21 Leisure, Amusement, Entertainment 30/04/2013 3.75202184 6.0 17 10 - 20% 877,373.05£ 877,373.05£ 28 Retail Stores 21/07/2026 16.97202190 6.0 17 10 - 20% 1,838,642.45£ 1,838,642.45£ 17 Healthcare, Education and Childcare 27/10/2021 12.24202198 4.0 9 0 - 10% 876,227.99£ 876,227.99£ 17 Healthcare, Education and Childcare 23/10/2022 13.23202200 5.0 7 0 - 10% 947,970.42£ 947,970.42£ 10 Diversified/Conglomerate Service 29/04/2020 10.74202214 8.0 82 80 - 90% 1,151,263.99£ 1,151,263.99£ 19 Hotels, Motels, Inns and Gaming 24/05/2015 5.81 2202218 6.0 22 20 - 30% 5,089,200.00£ 4,784,133.33£ 5 Buildings and Real Estate 30/10/2009 0.25 2202224 7.0 8 0 - 10% 712,812.77£ 712,812.77£ 13 Electronics 11/09/2014 5.11202233 3.0 66 60 - 70% 1,038,028.64£ 1,035,753.29£ 22 Machinery (Non-Agriculture, Non-Construction, Non-Electronic) 07/03/2013 3.60202237 6.0 10 0 - 10% 160,741.83£ 121,223.70£ 28 Retail Stores 31/10/2009 0.25202242 3.0 16 10 - 20% 7,261,721.81£ 7,261,721.81£ 15 Farming and Agriculture 31/10/2009 0.25202243 3.0 15 10 - 20% 2,466,904.34£ 2,466,904.34£ 28 Retail Stores 20/08/2017 8.05202248 4.0 13 10 - 20% 1,584,786.94£ 1,584,786.94£ 21 Leisure, Amusement, Entertainment 29/09/2019 10.16
Page 44 of 5730/06/2008

Data By Borrower
Borrower BBG Severity Severity Band RO Outstanding Debt RO Notional Balance
Moody's Industry Sector Moody's Industry Sector Maturity Date Remaining Term (Years) EWL Syndicated
202251 1.5 10 0 - 10% 2,017,182.68£ 2,017,182.68£ 5 Buildings and Real Estate 15/08/2022 13.04202255 5.0 31 30 - 40% 1,231,949.20£ 1,231,949.20£ 22 Machinery (Non-Agriculture, Non-Construction, Non-Electronic) 31/03/2016 6.67202256 4.0 23 20 - 30% 621,932.45£ 621,932.45£ 10 Diversified/Conglomerate Service 29/11/2024 15.33202260 5.0 18 10 - 20% 532,493.87£ 532,493.87£ 19 Hotels, Motels, Inns and Gaming 30/04/2017 7.75202270 8.0 17 10 - 20% 1,219,541.45£ 1,212,994.05£ 23 Mining, Steel, Iron and Non Precious Metals 22/12/2023 14.39 2202274 6.0 11 10 - 20% 822,788.83£ 822,788.83£ 5 Buildings and Real Estate 31/12/2009 0.42202279 5.0 33 30 - 40% 681,807.22£ 406,569.77£ 16 Grocery 31/10/2009 0.25202284 7.0 17 10 - 20% 1,109,910.75£ 1,109,910.75£ 13 Electronics 15/11/2017 8.29 2202297 8.0 14 10 - 20% 8,750,000.00£ 8,750,000.00£ 19 Hotels, Motels, Inns and Gaming 01/02/2010 0.50 2202299 6.0 18 10 - 20% 1,154,180.96£ 1,154,180.96£ 13 Electronics 31/10/2022 13.25202302 8.0 17 10 - 20% 694,001.97£ 694,001.97£ 18 Home and Office Furnishings, Housewares, and Durable Consumer Products 29/11/2017 8.33202303 6.0 14 10 - 20% 1,793,239.49£ 1,418,067.59£ 21 Leisure, Amusement, Entertainment 31/10/2009 0.25202308 4.0 31 30 - 40% 508,749.74£ 508,749.74£ 28 Retail Stores 26/03/2016 6.65202318 4.0 15 10 - 20% 902,925.70£ 902,925.70£ 5 Buildings and Real Estate 21/11/2022 13.31202322 6.0 27 20 - 30% 1,507,439.30£ 1,507,439.30£ 5 Buildings and Real Estate 31/10/2009 0.25202328 8.0 11 10 - 20% 446,504.90£ 434,879.58£ 28 Retail Stores 24/01/2014 4.48202343 6.0 5 0 - 10% 510,825.08£ 510,825.08£ 16 Grocery 12/10/2018 9.20202351 4.0 22 20 - 30% 1,314,423.52£ 1,314,423.52£ 5 Buildings and Real Estate 17/01/2023 13.46202355 1.8 35 30 - 40% 9,240,825.14£ 8,817,000.38£ 3 Banking 05/04/2018 8.68202356 3.0 8 0 - 10% 497,538.23£ 497,538.23£ 25 Personal, Food and Miscellaneous 07/01/2018 8.43202357 3.0 20 10 - 20% 899,858.02£ 899,858.02£ 27 Cargo Transport 07/02/2014 4.52202358 5.0 25 20 - 30% 787,500.00£ 787,500.00£ 30 Textiles and Leather 30/12/2017 8.41202365 8.0 27 20 - 30% 1,182,170.02£ 1,103,492.93£ 5 Buildings and Real Estate 31/10/2009 0.25 2202369 6.0 17 10 - 20% 8,495,000.00£ 8,495,000.00£ 5 Buildings and Real Estate 22/08/2012 3.06 2202392 6.0 28 20 - 30% 541,724.44£ 541,724.44£ 24 Oil and Gas 05/05/2018 8.76 2202393 5.0 17 10 - 20% 1,483,850.18£ 1,000,000.00£ 19 Hotels, Motels, Inns and Gaming 20/12/2022 13.39202396 6.0 10 0 - 10% 40,356,714.24£ 24,500,000.00£ 21 Leisure, Amusement, Entertainment 07/04/2010 0.68 2 Y202397 8.0 21 20 - 30% 843,559.43£ 843,559.43£ 5 Buildings and Real Estate 25/11/2023 14.32 1202400 4.0 53 50 - 60% 153,069.54£ 21,614.78£ 18 Home and Office Furnishings, Housewares, and Durable Consumer Products 31/07/2010 1.00202406 6.0 23 20 - 30% 494,164.41£ 494,164.41£ 18 Home and Office Furnishings, Housewares, and Durable Consumer Products 12/05/2021 11.78202417 7.0 9 0 - 10% 459,374.89£ 459,374.89£ 22 Machinery (Non-Agriculture, Non-Construction, Non-Electronic) 22/11/2014 5.31202424 3.0 15 10 - 20% 579,349.36£ 579,349.36£ 19 Hotels, Motels, Inns and Gaming 03/04/2023 13.67202426 6.0 56 50 - 60% 14,150,542.62£ 14,150,542.62£ 17 Healthcare, Education and Childcare 31/12/2011 2.42 1202433 4.0 10 0 - 10% 2,388,221.61£ 2,388,221.61£ 16 Grocery 15/08/2018 9.04202439 7.0 34 30 - 40% 712,953.06£ 712,953.06£ 22 Machinery (Non-Agriculture, Non-Construction, Non-Electronic) 24/02/2016 6.56202441 4.0 6 0 - 10% 637,282.99£ 637,282.99£ 17 Healthcare, Education and Childcare 19/10/2020 11.22202444 7.0 6 0 - 10% 1,701,944.21£ 1,701,944.21£ 19 Hotels, Motels, Inns and Gaming 27/06/2013 3.91202445 6.0 6 0 - 10% 354,864.02£ 354,864.02£ 27 Cargo Transport 30/09/2013 4.16202448 4.0 13 10 - 20% 551,778.26£ 551,778.26£ 2 Automobile 22/05/2018 8.81202452 8.0 5 0 - 10% 936,998.67£ 936,998.67£ 18 Home and Office Furnishings, Housewares, and Durable Consumer Products 25/06/2016 6.90 2202454 3.0 5 0 - 10% 1,614,813.99£ 1,614,813.99£ 21 Leisure, Amusement, Entertainment 29/10/2013 4.24202463 6.0 65 60 - 70% 214,082.78£ 214,082.78£ 31 Personal Transportation 29/07/2010 0.99 2202467 2.5 22 20 - 30% 1,234,998.89£ 909,629.00£ 5 Buildings and Real Estate 01/05/2018 8.75202476 4.0 29 20 - 30% 1,073,154.58£ 1,073,154.58£ 16 Grocery 22/10/2024 15.23202479 2.5 56 50 - 60% 4,298,886.51£ 4,258,030.56£ 17 Healthcare, Education and Childcare 31/10/2009 0.25202483 5.0 16 10 - 20% 1,871,152.74£ 1,465,677.06£ 10 Diversified/Conglomerate Service 30/12/2024 15.41202488 7.0 43 40 - 50% 3,284,134.74£ 3,284,134.74£ 3 Banking 31/10/2009 0.25 2202493 8.0 8 0 - 10% 581,137.96£ 581,137.96£ 17 Healthcare, Education and Childcare 30/06/2023 13.91 2202500 8.0 28 20 - 30% 2,362,500.00£ 2,362,500.00£ 17 Healthcare, Education and Childcare 30/01/2010 0.50 1202510 6.0 34 30 - 40% 9,937,365.12£ 9,901,703.58£ 13 Electronics 31/07/2010 1.00 2202517 5.0 12 10 - 20% 517,238.62£ 517,238.62£ 18 Home and Office Furnishings, Housewares, and Durable Consumer Products 28/11/2023 14.33202522 6.0 14 10 - 20% 2,728,759.79£ 2,728,759.79£ 17 Healthcare, Education and Childcare 01/06/2020 10.83202526 7.0 37 30 - 40% 9,252,776.70£ 9,252,776.70£ 5 Buildings and Real Estate 22/01/2010 0.48202528 4.0 18 10 - 20% 953,518.85£ 953,518.85£ 19 Hotels, Motels, Inns and Gaming 10/08/2026 17.03202533 6.0 24 20 - 30% 3,955,218.67£ 3,919,981.67£ 5 Buildings and Real Estate 16/03/2013 3.63 2202537 3.0 5 0 - 10% 520,000.00£ 520,000.00£ 5 Buildings and Real Estate 31/10/2009 0.25202539 5.0 26 20 - 30% 1,343,650.07£ 1,343,650.07£ 5 Buildings and Real Estate 31/03/2013 3.67202543 7.0 39 30 - 40% 5,000,000.00£ 5,000,000.00£ 26 Printing and Publishing 13/02/2012 2.53202546 6.0 7 0 - 10% 433,902.94£ 433,902.94£ 4 Beverage, Food and Tobacco 15/11/2021 12.29202554 3.0 29 20 - 30% 1,113,000.00£ 1,113,000.00£ 27 Cargo Transport 16/10/2009 0.21202556 6.0 17 10 - 20% 1,429,930.37£ 1,429,930.37£ 27 Cargo Transport 09/10/2013 4.19202563 4.0 10 0 - 10% 591,087.50£ 591,087.50£ 17 Healthcare, Education and Childcare 04/11/2023 14.26202568 6.0 19 10 - 20% 5,407,271.92£ 5,344,616.11£ 17 Healthcare, Education and Childcare 13/09/2025 16.12202584 5.0 12 10 - 20% 811,954.24£ 811,954.24£ 17 Healthcare, Education and Childcare 14/01/2024 14.45202587 6.0 58 50 - 60% 16,684,979.78£ 16,508,912.33£ 5 Buildings and Real Estate 01/12/2009 0.33 2
Page 45 of 5730/06/2008

Data By Borrower
Borrower BBG Severity Severity Band RO Outstanding Debt RO Notional Balance
Moody's Industry Sector Moody's Industry Sector Maturity Date Remaining Term (Years) EWL Syndicated
202588 6.0 21 20 - 30% 1,200,959.19£ 1,200,959.19£ 22 Machinery (Non-Agriculture, Non-Construction, Non-Electronic) 23/12/2017 8.39202590 6.0 13 10 - 20% 670,000.00£ 670,000.00£ 5 Buildings and Real Estate 31/03/2010 0.67202591 2.1 10 0 - 10% 1,800,000.00£ 1,800,000.00£ 10 Diversified/Conglomerate Service 28/10/2018 9.24202593 3.0 15 10 - 20% 1,467,252.79£ 1,467,252.79£ 5 Buildings and Real Estate 17/10/2013 4.21202595 5.0 10 0 - 10% 1,370,000.00£ 1,060,095.95£ 19 Hotels, Motels, Inns and Gaming 20/04/2014 4.72202600 6.0 8 0 - 10% 893,253.13£ 730,787.00£ 33 Broadcasting & Entertainment 18/12/2009 0.38202618 6.0 5 0 - 10% 740,000.00£ 740,000.00£ 28 Retail Stores 01/10/2010 1.17 2202634 8.0 14 10 - 20% 728,500.00£ 728,500.00£ 5 Buildings and Real Estate 31/12/2009 0.42202636 5.0 7 0 - 10% 1,294,783.86£ 1,294,783.86£ 30 Textiles and Leather 31/07/2010 1.00202637 5.0 5 0 - 10% 471,875.10£ 471,875.10£ 16 Grocery 19/12/2013 4.38202644 4.0 17 10 - 20% 1,136,000.00£ 865,750.92£ 5 Buildings and Real Estate 23/10/2009 0.23202654 7.0 13 10 - 20% 524,332.71£ 524,332.71£ 21 Leisure, Amusement, Entertainment 17/12/2018 9.38202670 7.0 10 0 - 10% 1,965,646.87£ 1,965,646.87£ 27 Cargo Transport 21/01/2020 10.47202679 8.0 24 20 - 30% 701,613.45£ 701,613.45£ 6 Chemicals, Plastics and Rubber 16/02/2020 10.54 2202682 7.0 16 10 - 20% 1,874,412.14£ 1,867,582.62£ 17 Healthcare, Education and Childcare 26/07/2024 14.99202686 8.0 25 20 - 30% 722,661.00£ 698,909.79£ 26 Printing and Publishing 31/03/2024 14.67 1202700 5.0 14 10 - 20% 7,327,195.44£ 7,150,555.88£ 5 Buildings and Real Estate 01/10/2009 0.17 1202709 8.0 28 20 - 30% 551,125.49£ 551,125.49£ 16 Grocery 01/05/2010 0.75 2202710 2.5 11 10 - 20% 1,639,000.00£ 1,639,000.00£ 27 Cargo Transport 01/03/2017 7.58202714 8.0 14 10 - 20% 606,700.90£ 606,700.90£ 5 Buildings and Real Estate 17/07/2016 6.96 2202725 6.0 17 10 - 20% 4,933,654.85£ 4,933,654.85£ 10 Diversified/Conglomerate Service 02/04/2023 13.67202728 3.0 9 0 - 10% 4,150,000.00£ 3,900,000.00£ 30 Textiles and Leather 20/12/2009 0.39202738 8.0 13 10 - 20% 1,460,877.12£ 1,460,877.12£ 2 Automobile 26/03/2024 14.65 2202744 5.0 13 10 - 20% 1,281,417.47£ 1,281,417.47£ 17 Healthcare, Education and Childcare 25/09/2021 12.15202751 6.0 11 10 - 20% 2,417,538.64£ 2,417,538.64£ 19 Hotels, Motels, Inns and Gaming 05/03/2020 10.59202752 8.0 15 10 - 20% 877,375.00£ 861,375.00£ 5 Buildings and Real Estate 31/10/2009 0.25 2202756 5.0 12 10 - 20% 653,328.71£ 653,328.71£ 5 Buildings and Real Estate 02/04/2019 9.67202757 3.0 28 20 - 30% 7,300,000.00£ 7,300,000.00£ 17 Healthcare, Education and Childcare 12/07/2010 0.95202760 3.0 65 60 - 70% 4,000,000.00£ 4,000,000.00£ 13 Electronics 31/05/2013 3.83202766 7.0 20 10 - 20% 1,000,000.00£ 1,000,000.00£ 5 Buildings and Real Estate 31/10/2009 0.25202785 7.0 45 40 - 50% 1,509,000.00£ 1,509,000.00£ 33 Broadcasting & Entertainment 22/10/2011 2.23202788 8.0 22 20 - 30% 2,653,656.90£ 2,644,441.01£ 5 Buildings and Real Estate 31/10/2009 0.25 2202789 5.0 20 10 - 20% 4,600,000.00£ 4,600,000.00£ 5 Buildings and Real Estate 23/04/2014 4.73202794 4.0 15 10 - 20% 2,595,829.00£ 2,595,829.00£ 2 Automobile 10/04/2018 8.69202800 6.0 20 10 - 20% 1,363,579.78£ 1,362,182.56£ 17 Healthcare, Education and Childcare 01/10/2019 10.17202802 6.0 9 0 - 10% 1,886,393.95£ 538,247.61£ 26 Printing and Publishing 31/10/2009 0.25202805 6.0 21 20 - 30% 3,630,365.53£ 3,630,365.53£ 5 Buildings and Real Estate 10/01/2016 6.44 2202810 8.0 35 30 - 40% 2,559,157.54£ 2,481,370.71£ 17 Healthcare, Education and Childcare 31/10/2009 0.25 2202813 3.0 6 0 - 10% 453,167.42£ 453,167.42£ 23 Mining, Steel, Iron and Non Precious Metals 15/09/2019 10.12202822 8.0 14 10 - 20% 676,057.50£ 676,057.50£ 10 Diversified/Conglomerate Service 04/08/2023 14.01 2202831 4.0 36 30 - 40% 2,584,988.30£ 2,584,988.30£ 5 Buildings and Real Estate 18/06/2018 8.88202833 2.5 18 10 - 20% 2,830,280.62£ 2,830,280.62£ 5 Buildings and Real Estate 22/07/2020 10.98202837 6.0 14 10 - 20% 426,266.87£ 426,266.87£ 22 Machinery (Non-Agriculture, Non-Construction, Non-Electronic) 22/11/2024 15.31202839 4.0 16 10 - 20% 4,929,467.42£ 4,929,467.42£ 19 Hotels, Motels, Inns and Gaming 23/03/2027 17.64202851 8.0 20 10 - 20% 2,274,912.73£ 2,274,912.73£ 19 Hotels, Motels, Inns and Gaming 01/03/2025 15.58202862 3.0 8 0 - 10% 341,491.95£ 341,491.95£ 5 Buildings and Real Estate 01/10/2013 4.17202876 6.0 11 10 - 20% 2,473,451.02£ 2,024,050.44£ 18 Home and Office Furnishings, Housewares, and Durable Consumer Products 20/10/2009 0.22 2202877 6.0 18 10 - 20% 5,247,199.96£ 4,796,248.40£ 5 Buildings and Real Estate 30/07/2013 4.00 2202901 6.0 15 10 - 20% 943,462.48£ 603,217.60£ 19 Hotels, Motels, Inns and Gaming 01/09/2024 15.08202903 2.8 11 10 - 20% 1,278,059.25£ 1,038,166.15£ 27 Cargo Transport 27/01/2025 15.49202912 4.0 5 0 - 10% 736,329.00£ 736,329.00£ 13 Electronics 06/04/2011 1.68202917 5.0 22 20 - 30% 1,521,000.00£ 1,521,000.00£ 30 Textiles and Leather 14/10/2019 10.20202939 6.0 45 40 - 50% 1,225,175.74£ 1,225,175.74£ 28 Retail Stores 31/10/2009 0.25202940 6.0 43 40 - 50% 720,927.71£ 632,469.22£ 17 Healthcare, Education and Childcare 25/01/2021 11.48202943 5.0 11 10 - 20% 947,981.50£ 947,981.50£ 13 Electronics 16/05/2020 10.79202944 6.0 16 10 - 20% 4,746,125.23£ 4,464,572.93£ 25 Personal, Food and Miscellaneous 31/10/2009 0.25 2202961 6.0 13 10 - 20% 1,347,754.60£ 1,315,475.00£ 11 Diversified Natural Resources, Precious 03/12/2009 0.34202962 4.0 19 10 - 20% 2,197,500.00£ 2,197,500.00£ 5 Buildings and Real Estate 31/10/2009 0.25202981 7.0 14 10 - 20% 1,241,456.76£ 1,241,456.76£ 7 Containers, Packaging and Glass 29/10/2019 10.24202990 3.0 24 20 - 30% 1,222,512.65£ 1,222,512.65£ 5 Buildings and Real Estate 11/01/2020 10.44203012 5.0 19 10 - 20% 520,328.84£ 520,328.84£ 6 Chemicals, Plastics and Rubber 04/02/2025 15.51203013 5.0 19 10 - 20% 461,313.74£ 461,273.91£ 27 Cargo Transport 25/02/2025 15.57203014 7.0 7 0 - 10% 2,321,080.00£ 2,321,080.00£ 21 Leisure, Amusement, Entertainment 30/03/2012 2.66 2203020 8.0 23 20 - 30% 1,252,828.16£ 1,252,828.16£ 26 Printing and Publishing 04/01/2025 15.43 2203022 3.0 66 60 - 70% 5,716,258.06£ 5,716,258.06£ 10 Diversified/Conglomerate Service 31/07/2010 1.00
Page 46 of 5730/06/2008

Data By Borrower
Borrower BBG Severity Severity Band RO Outstanding Debt RO Notional Balance
Moody's Industry Sector Moody's Industry Sector Maturity Date Remaining Term (Years) EWL Syndicated
203031 6.0 30 20 - 30% 5,819,128.95£ 5,819,128.95£ 30 Textiles and Leather 31/10/2009 0.25 2203033 5.0 19 10 - 20% 447,558.56£ 447,558.56£ 2 Automobile 28/02/2020 10.58203047 5.0 38 30 - 40% 13,097,054.00£ 13,097,054.00£ 28 Retail Stores 25/04/2018 8.73 1203062 7.0 15 10 - 20% 468,258.37£ 468,258.37£ 28 Retail Stores 07/04/2015 5.68203064 8.0 15 10 - 20% 1,712,500.00£ 1,712,500.00£ 5 Buildings and Real Estate 31/10/2009 0.25203079 6.0 22 20 - 30% 1,271,995.14£ 1,200,930.75£ 33 Broadcasting & Entertainment 19/07/2017 7.97 1203082 4.0 42 40 - 50% 895,763.74£ 621,554.31£ 28 Retail Stores 31/07/2010 1.00203087 7.0 9 0 - 10% 5,763,214.30£ 5,763,214.30£ 17 Healthcare, Education and Childcare 01/03/2023 13.58203099 5.0 17 10 - 20% 546,908.07£ 546,908.07£ 15 Farming and Agriculture 24/03/2025 15.65203101 7.0 24 20 - 30% 1,300,000.00£ 1,192,243.02£ 5 Buildings and Real Estate 30/09/2011 2.16 2203132 6.0 11 10 - 20% 2,203,272.74£ 1,901,312.42£ 7 Containers, Packaging and Glass 31/10/2009 0.25203157 6.0 39 30 - 40% 1,659,146.25£ 1,659,146.25£ 9 Diversified/Conglomerate Manufacturing 31/03/2025 15.67203165 8.0 19 10 - 20% 629,390.32£ 629,390.32£ 4 Beverage, Food and Tobacco 06/07/2012 2.93203177 4.0 16 10 - 20% 464,954.49£ 464,954.49£ 6 Chemicals, Plastics and Rubber 29/09/2014 5.16203205 8.0 30 20 - 30% 1,858,947.54£ 1,792,296.94£ 5 Buildings and Real Estate 31/10/2009 0.25 2203225 6.0 15 10 - 20% 1,057,610.19£ 921,265.50£ 7 Containers, Packaging and Glass 31/10/2009 0.25203237 7.0 15 10 - 20% 2,408,922.90£ 2,408,922.90£ 17 Healthcare, Education and Childcare 30/03/2011 1.66203242 5.0 8 0 - 10% 1,601,616.76£ 1,601,616.76£ 4 Beverage, Food and Tobacco 27/10/2015 6.24203246 6.0 22 20 - 30% 1,058,618.24£ 1,043,923.89£ 6 Chemicals, Plastics and Rubber 31/10/2009 0.25203248 8.0 22 20 - 30% 4,929,330.17£ 4,882,533.02£ 19 Hotels, Motels, Inns and Gaming 16/10/2009 0.21 2203251 6.0 11 10 - 20% 2,303,664.06£ 2,100,315.00£ 5 Buildings and Real Estate 31/10/2009 0.25203252 3.0 15 10 - 20% 1,400,035.50£ 1,400,035.50£ 15 Farming and Agriculture 31/07/2010 1.00203258 7.0 20 10 - 20% 877,755.61£ 877,755.61£ 25 Personal, Food and Miscellaneous 07/10/2020 11.18203289 7.0 49 40 - 50% 3,675,944.51£ 3,675,944.51£ 13 Electronics 31/10/2009 0.25 1203298 5.0 12 10 - 20% 5,400,393.68£ 5,400,393.68£ 19 Hotels, Motels, Inns and Gaming 11/10/2020 11.19203308 7.0 11 10 - 20% 514,623.21£ 514,623.21£ 28 Retail Stores 21/11/2015 6.31203322 6.0 21 20 - 30% 1,848,736.06£ 1,848,736.06£ 17 Healthcare, Education and Childcare 16/02/2021 11.54203327 2.8 47 40 - 50% 8,071,294.64£ 8,071,294.64£ 16 Grocery 31/10/2009 0.25203328 6.0 58 50 - 60% 10,723,750.00£ 10,723,750.00£ 4 Beverage, Food and Tobacco 31/07/2010 1.00 1203339 7.0 12 10 - 20% 500,965.94£ 500,965.94£ 5 Buildings and Real Estate 19/12/2021 12.38203346 4.0 24 20 - 30% 8,009,617.00£ 7,891,936.00£ 19 Hotels, Motels, Inns and Gaming 31/12/2021 12.42203368 8.0 5 0 - 10% 458,392.88£ 458,392.88£ 25 Personal, Food and Miscellaneous 13/02/2019 9.53 2203373 8.0 16 10 - 20% 1,731,971.22£ 1,688,340.20£ 27 Cargo Transport 24/03/2024 14.65203382 4.0 49 40 - 50% 20,000,000.00£ 20,000,000.00£ 25 Personal, Food and Miscellaneous 29/11/2011 2.33203395 6.0 40 30 - 40% 5,000,000.00£ 5,000,000.00£ 5 Buildings and Real Estate 31/10/2009 0.25203433 6.0 15 10 - 20% 889,158.21£ 889,158.21£ 28 Retail Stores 03/03/2016 6.59203443 6.0 19 10 - 20% 1,946,287.84£ 1,946,287.84£ 2 Automobile 27/10/2015 6.24 2203447 7.0 26 20 - 30% 5,539,000.00£ 5,271,000.00£ 25 Personal, Food and Miscellaneous 07/04/2026 16.68 2203450 5.0 31 30 - 40% 902,400.00£ 854,107.40£ 17 Healthcare, Education and Childcare 30/06/2018 8.91203454 3.0 9 0 - 10% 1,331,727.91£ 1,306,525.97£ 5 Buildings and Real Estate 11/05/2021 11.78203462 7.0 14 10 - 20% 1,920,656.25£ 1,886,666.67£ 25 Personal, Food and Miscellaneous 18/04/2021 11.71203474 6.0 66 60 - 70% 6,296,875.00£ 6,296,875.00£ 13 Electronics 02/12/2011 2.34203478 5.0 5 0 - 10% 314,789.00£ 314,789.00£ 2 Automobile 19/04/2021 11.72203509 5.0 18 10 - 20% 3,475,000.00£ 3,421,610.00£ 5 Buildings and Real Estate 15/12/2009 0.37203512 3.0 8 0 - 10% 8,706,355.07£ 8,706,355.07£ 17 Healthcare, Education and Childcare 29/11/2016 7.33203513 1.5 39 30 - 40% 2,678,571.33£ 2,678,571.33£ 10 Diversified/Conglomerate Service 28/11/2010 1.33203514 7.0 28 20 - 30% 5,594,078.90£ 5,594,078.90£ 22 Machinery (Non-Agriculture, Non-Construction, Non-Electronic) 31/10/2009 0.25 2203516 8.0 65 60 - 70% 1,451,202.41£ 1,451,202.41£ 6 Chemicals, Plastics and Rubber 31/07/2010 1.00 1203517 6.0 5 0 - 10% 922,091.82£ 922,091.82£ 31 Personal Transportation 18/10/2019 10.21 2203532 6.0 18 10 - 20% 2,955,289.54£ 2,781,764.11£ 5 Buildings and Real Estate 31/10/2009 0.25 2203557 4.0 39 30 - 40% 25,075,386.82£ 16,141,537.73£ 10 Diversified/Conglomerate Service 14/05/2012 2.79203558 2.8 28 20 - 30% 26,999,999.66£ 24,500,000.00£ 4 Beverage, Food and Tobacco 07/11/2010 1.27203560 3.0 41 40 - 50% 4,702,270.68£ 4,702,270.68£ 5 Buildings and Real Estate 07/06/2012 2.85 Y203561 6.0 58 50 - 60% 18,400,000.00£ 18,400,000.00£ 33 Broadcasting & Entertainment 31/07/2010 1.00203567 6.0 47 40 - 50% 36,032,635.24£ 24,500,000.00£ 13 Electronics 12/07/2011 1.95 1203571 7.0 45 40 - 50% 28,106,038.46£ 24,500,000.00£ 4 Beverage, Food and Tobacco 31/10/2009 0.25 2203573 6.0 45 40 - 50% 65,833,333.17£ 12,600,709.17£ 28 Retail Stores 31/12/2012 3.42 1203575 6.0 17 10 - 20% 8,900,000.00£ 8,900,000.00£ 6 Chemicals, Plastics and Rubber 16/06/2010 0.88 2203578 5.0 7 0 - 10% 19,437,500.00£ 19,437,500.00£ 21 Leisure, Amusement, Entertainment 23/11/2011 2.31 1203579 3.0 34 30 - 40% 13,713,333.00£ 2,541,038.27£ 10 Diversified/Conglomerate Service 31/08/2012 3.08203580 8.0 56 50 - 60% 24,788,539.68£ 22,073,008.40£ 29 Telecommunications 31/07/2010 1.00 2203586 7.0 28 20 - 30% 615,778.22£ 609,787.79£ 18 Home and Office Furnishings, Housewares, and Durable Consumer Products 03/10/2021 12.17203588 6.0 20 10 - 20% 3,347,185.86£ 3,252,717.71£ 15 Farming and Agriculture 31/10/2009 0.25 2203589 6.0 12 10 - 20% 727,755.46£ 727,755.46£ 22 Machinery (Non-Agriculture, Non-Construction, Non-Electronic) 21/12/2012 3.39203591 3.0 17 10 - 20% 1,340,541.12£ 1,340,541.12£ 19 Hotels, Motels, Inns and Gaming 25/10/2019 10.23
Page 47 of 5730/06/2008

Data By Borrower
Borrower BBG Severity Severity Band RO Outstanding Debt RO Notional Balance
Moody's Industry Sector Moody's Industry Sector Maturity Date Remaining Term (Years) EWL Syndicated
203594 3.0 29 20 - 30% 8,589,227.25£ 8,589,227.25£ 10 Diversified/Conglomerate Service 31/07/2010 1.00203595 6.0 16 10 - 20% 1,329,697.09£ 1,329,697.09£ 5 Buildings and Real Estate 31/10/2009 0.25203598 7.0 9 0 - 10% 2,552,167.65£ 2,552,167.65£ 28 Retail Stores 16/01/2015 5.46203600 8.0 61 60 - 70% 2,750,000.00£ 2,550,000.00£ 10 Diversified/Conglomerate Service 05/11/2010 1.26 2203602 4.0 26 20 - 30% 1,733,980.70£ 1,733,980.70£ 17 Healthcare, Education and Childcare 21/06/2017 7.89203605 7.0 26 20 - 30% 6,032,433.43£ 6,032,433.43£ 13 Electronics 23/04/2019 9.73 2203609 4.0 8 0 - 10% 2,263,157.86£ 2,263,157.86£ 5 Buildings and Real Estate 19/05/2020 10.80203613 5.0 32 30 - 40% 13,943,547.99£ 12,237,655.12£ 21 Leisure, Amusement, Entertainment 31/10/2009 0.25 1203620 7.0 26 20 - 30% 2,703,204.56£ 2,703,203.64£ 17 Healthcare, Education and Childcare 30/06/2010 0.91203626 4.0 45 40 - 50% 14,743,533.99£ 14,743,533.99£ 25 Personal, Food and Miscellaneous 31/10/2009 0.25203629 5.0 22 20 - 30% 440,332.89£ 440,332.89£ 16 Grocery 20/07/2025 15.97203630 3.0 31 30 - 40% 1,362,988.69£ 1,317,858.60£ 30 Textiles and Leather 27/02/2026 16.57203632 6.0 18 10 - 20% 1,010,270.23£ 1,010,270.23£ 26 Printing and Publishing 14/09/2026 17.12203635 5.0 27 20 - 30% 904,818.33£ 710,474.00£ 2 Automobile 15/05/2026 16.79203636 6.0 10 0 - 10% 840,807.24£ 840,807.24£ 8 Personal and Non Durable Consumer Products (Manufacturing Only) 15/02/2021 11.54 2203637 5.0 28 20 - 30% 412,676.57£ 412,676.57£ 5 Buildings and Real Estate 07/08/2016 7.02203638 4.0 12 10 - 20% 1,260,000.00£ 1,260,000.00£ 29 Telecommunications 09/06/2016 6.86203640 6.0 34 30 - 40% 2,449,587.43£ 2,434,904.46£ 15 Farming and Agriculture 31/10/2009 0.25203641 8.0 9 0 - 10% 1,231,487.46£ 1,231,487.46£ 28 Retail Stores 31/10/2009 0.25 2203642 6.0 53 50 - 60% 701,655.51£ 701,655.51£ 18 Home and Office Furnishings, Housewares, and Durable Consumer Products 31/10/2009 0.25203643 6.0 82 80 - 90% 1,634,135.35£ 1,634,135.35£ 10 Diversified/Conglomerate Service 31/03/2011 1.67203644 8.0 29 20 - 30% 1,903,755.62£ 1,903,755.62£ 2 Automobile 31/10/2009 0.25 2203645 7.0 45 40 - 50% 1,835,416.00£ 1,435,416.00£ 28 Retail Stores 31/03/2012 2.67 2203646 6.0 5 0 - 10% 811,088.21£ 811,088.21£ 4 Beverage, Food and Tobacco 13/09/2026 17.12203649 3.0 18 10 - 20% 713,975.73£ 713,975.73£ 33 Broadcasting & Entertainment 17/07/2021 11.96203651 4.0 11 10 - 20% 386,824.99£ 386,824.99£ 2 Automobile 04/08/2013 4.01203652 4.0 17 10 - 20% 1,730,050.08£ 1,579,174.81£ 16 Grocery 01/05/2010 0.75203654 6.0 11 10 - 20% 1,168,736.48£ 1,168,736.48£ 19 Hotels, Motels, Inns and Gaming 20/04/2025 15.72203657 3.0 15 10 - 20% 673,753.22£ 673,753.22£ 28 Retail Stores 19/07/2016 6.97203658 7.0 8 0 - 10% 587,131.31£ 587,131.31£ 26 Printing and Publishing 01/11/2009 0.25 2203659 4.0 11 10 - 20% 583,000.01£ 583,000.01£ 19 Hotels, Motels, Inns and Gaming 09/05/2026 16.77203660 4.0 14 10 - 20% 718,864.77£ 718,864.77£ 25 Personal, Food and Miscellaneous 08/03/2016 6.60203662 8.0 38 30 - 40% 791,086.98£ 791,086.98£ 12 Ecological 13/07/2024 14.95 2203667 9.0 27 20 - 30% 802,276.68£ 787,301.99£ 26 Printing and Publishing 01/11/2008 0.00203668 4.0 17 10 - 20% 3,434,175.60£ 3,434,175.60£ 22 Machinery (Non-Agriculture, Non-Construction, Non-Electronic) 23/10/2013 4.23203669 4.0 74 70 - 80% 666,398.33£ 666,398.33£ 22 Machinery (Non-Agriculture, Non-Construction, Non-Electronic) 11/08/2013 4.03203672 6.0 56 50 - 60% 1,575,000.00£ 1,575,000.00£ 16 Grocery 31/08/2011 2.08203673 3.0 13 10 - 20% 735,617.70£ 735,617.70£ 22 Machinery (Non-Agriculture, Non-Construction, Non-Electronic) 09/02/2026 16.52203676 4.0 20 10 - 20% 2,892,985.81£ 2,496,772.92£ 27 Cargo Transport 31/10/2009 0.25203678 8.0 57 50 - 60% 1,220,448.97£ 1,203,751.88£ 30 Textiles and Leather 31/10/2009 0.25 3203679 6.0 15 10 - 20% 590,797.64£ 554,945.32£ 22 Machinery (Non-Agriculture, Non-Construction, Non-Electronic) 31/10/2009 0.25203682 3.0 8 0 - 10% 766,827.00£ 766,827.00£ 2 Automobile 16/06/2022 12.88203683 5.0 6 0 - 10% 414,735.49£ 412,933.85£ 15 Farming and Agriculture 05/06/2016 6.84203684 3.0 9 0 - 10% 1,541,990.11£ 1,541,990.11£ 28 Retail Stores 20/06/2026 16.89203686 6.0 20 10 - 20% 284,717.80£ 284,717.80£ 22 Machinery (Non-Agriculture, Non-Construction, Non-Electronic) 07/07/2011 1.93203687 1.5 25 20 - 30% 1,368,271.58£ 1,368,271.58£ 15 Farming and Agriculture 22/08/2018 9.06203688 4.0 27 20 - 30% 1,100,633.49£ 1,100,633.49£ 28 Retail Stores 11/08/2026 17.03203690 8.0 9 0 - 10% 442,387.65£ 442,387.65£ 23 Mining, Steel, Iron and Non Precious Metals 29/10/2014 5.24203691 5.0 30 20 - 30% 2,363,615.15£ 2,363,615.15£ 27 Cargo Transport 31/03/2026 16.67203692 3.0 11 10 - 20% 1,042,835.79£ 1,042,835.79£ 25 Personal, Food and Miscellaneous 01/02/2027 17.50203693 6.0 11 10 - 20% 761,885.82£ 761,885.82£ 21 Leisure, Amusement, Entertainment 09/08/2021 12.02203698 5.0 5 0 - 10% 164,135.67£ 164,135.67£ 19 Hotels, Motels, Inns and Gaming 30/06/2026 16.91203700 5.0 31 30 - 40% 482,068.45£ 481,820.77£ 10 Diversified/Conglomerate Service 20/02/2026 16.55203702 8.0 22 20 - 30% 2,931,080.42£ 2,919,488.94£ 19 Hotels, Motels, Inns and Gaming 31/10/2009 0.25 2203703 5.0 15 10 - 20% 700,250.00£ 673,057.72£ 28 Retail Stores 30/06/2023 13.91203704 6.0 9 0 - 10% 1,226,614.71£ 1,226,614.71£ 19 Hotels, Motels, Inns and Gaming 14/09/2021 12.12203705 5.0 8 0 - 10% 2,622,304.00£ 2,622,304.00£ 16 Grocery 19/03/2013 3.63203707 6.0 24 20 - 30% 2,454,147.51£ 2,454,147.51£ 22 Machinery (Non-Agriculture, Non-Construction, Non-Electronic) 31/07/2010 1.00203709 5.0 14 10 - 20% 1,345,556.02£ 1,345,556.02£ 2 Automobile 07/06/2021 11.85203710 5.0 20 10 - 20% 11,437,500.00£ 11,437,500.00£ 4 Beverage, Food and Tobacco 30/06/2011 1.91203711 2.1 22 20 - 30% 536,145.13£ 536,145.13£ 31 Personal Transportation 09/03/2021 11.61203713 8.0 22 20 - 30% 382,214.25£ 382,214.25£ 27 Cargo Transport 25/10/2015 6.23 2203716 7.0 11 10 - 20% 1,510,000.00£ 1,510,000.00£ 17 Healthcare, Education and Childcare 31/10/2023 14.25203717 8.0 18 10 - 20% 4,392,123.74£ 4,371,598.66£ 17 Healthcare, Education and Childcare 17/03/2026 16.63 1203718 7.0 12 10 - 20% 764,107.36£ 764,107.36£ 17 Healthcare, Education and Childcare 11/01/2026 16.44
Page 48 of 5730/06/2008

Data By Borrower
Borrower BBG Severity Severity Band RO Outstanding Debt RO Notional Balance
Moody's Industry Sector Moody's Industry Sector Maturity Date Remaining Term (Years) EWL Syndicated
203722 8.0 10 0 - 10% 2,226,884.97£ 2,111,000.00£ 19 Hotels, Motels, Inns and Gaming 30/03/2026 16.66 2203723 7.0 22 20 - 30% 1,429,863.32£ 1,302,800.00£ 25 Personal, Food and Miscellaneous 30/06/2022 12.91203725 8.0 10 0 - 10% 1,000,000.00£ 1,000,000.00£ 2 Automobile 20/05/2010 0.80 2203726 8.0 20 10 - 20% 621,517.90£ 621,517.90£ 18 Home and Office Furnishings, Housewares, and Durable Consumer Products 02/06/2026 16.84 1203729 5.0 42 40 - 50% 6,400,000.00£ 6,400,000.00£ 2 Automobile 31/12/2009 0.42 1203734 3.0 21 20 - 30% 2,048,711.01£ 2,048,711.01£ 17 Healthcare, Education and Childcare 29/01/2019 9.49203736 7.0 25 20 - 30% 1,938,356.04£ 1,938,356.04£ 17 Healthcare, Education and Childcare 31/05/2022 12.83203737 6.0 60 50 - 60% 4,000,000.00£ 4,000,000.00£ 33 Broadcasting & Entertainment 31/03/2011 1.67 1203743 5.0 75 70 - 80% 9,669,704.34£ 6,865,704.34£ 26 Printing and Publishing 28/09/2012 3.16203745 8.0 48 40 - 50% 6,400,000.00£ 6,400,000.00£ 10 Diversified/Conglomerate Service 30/04/2010 0.75 2203748 7.0 9 0 - 10% 2,682,053.92£ 2,682,053.92£ 2 Automobile 31/12/2024 15.42 2203750 4.0 66 60 - 70% 975,020.22£ 975,020.22£ 28 Retail Stores 31/10/2009 0.25203751 3.0 41 40 - 50% 4,093,077.13£ 4,051,702.53£ 17 Healthcare, Education and Childcare 13/11/2010 1.28203752 3.0 17 10 - 20% 2,939,226.60£ 2,780,172.90£ 15 Farming and Agriculture 31/10/2009 0.25203753 7.0 32 30 - 40% 2,180,036.87£ 2,180,036.87£ 18 Home and Office Furnishings, Housewares, and Durable Consumer Products 18/06/2014 4.88 2203754 3.0 10 0 - 10% 747,760.14£ 747,760.14£ 28 Retail Stores 10/10/2025 16.19203755 7.0 6 0 - 10% 314,827.15£ 314,827.15£ 2 Automobile 15/06/2011 1.87 1203756 6.0 35 30 - 40% 1,074,231.50£ 1,074,231.50£ 10 Diversified/Conglomerate Service 31/10/2009 0.25 2203758 7.0 14 10 - 20% 151,664.30£ 11,683.14£ 4 Beverage, Food and Tobacco 31/10/2009 0.25203760 4.0 13 10 - 20% 2,356,249.88£ 2,356,249.88£ 21 Leisure, Amusement, Entertainment 31/07/2010 1.00203761 8.0 13 10 - 20% 5,067,486.02£ 5,060,000.00£ 19 Hotels, Motels, Inns and Gaming 31/08/2014 5.08 2203762 4.0 36 30 - 40% 8,564,733.22£ 8,067,472.02£ 10 Diversified/Conglomerate Service 31/10/2009 0.25203767 4.0 5 0 - 10% 742,033.77£ 738,751.95£ 17 Healthcare, Education and Childcare 27/08/2024 15.07203769 5.0 11 10 - 20% 347,568.84£ 347,568.84£ 25 Personal, Food and Miscellaneous 16/12/2025 16.38203770 8.0 17 10 - 20% 3,816,517.83£ 3,816,517.83£ 17 Healthcare, Education and Childcare 11/11/2025 16.28 2203771 8.0 18 10 - 20% 4,011,768.22£ 4,011,768.22£ 27 Cargo Transport 02/04/2019 9.67 2203773 6.0 23 20 - 30% 2,477,670.84£ 2,042,211.49£ 28 Retail Stores 31/10/2009 0.25203775 4.0 46 40 - 50% 1,528,727.48£ 989,137.27£ 18 Home and Office Furnishings, Housewares, and Durable Consumer Products 31/10/2009 0.25203776 5.0 12 10 - 20% 1,418,536.54£ 1,067,247.41£ 19 Hotels, Motels, Inns and Gaming 16/05/2025 15.79203777 2.1 21 20 - 30% 2,500,000.00£ 2,481,822.00£ 28 Retail Stores 22/04/2025 15.73203778 4.0 25 20 - 30% 25,095,000.00£ 20,750,000.00£ 26 Printing and Publishing 02/04/2013 3.67203780 4.0 22 20 - 30% 635,283.40£ 635,283.40£ 10 Diversified/Conglomerate Service 17/06/2025 15.88203781 8.0 15 10 - 20% 380,228.78£ 380,228.78£ 18 Home and Office Furnishings, Housewares, and Durable Consumer Products 03/03/2014 4.59 2203784 6.0 18 10 - 20% 1,226,671.75£ 1,217,139.74£ 26 Printing and Publishing 04/02/2020 10.51203785 6.0 13 10 - 20% 1,524,608.33£ 1,469,344.15£ 17 Healthcare, Education and Childcare 22/02/2023 13.56203786 7.0 13 10 - 20% 1,496,395.39£ 1,417,240.45£ 21 Leisure, Amusement, Entertainment 31/10/2009 0.25203787 6.0 21 20 - 30% 1,156,250.00£ 750,000.00£ 4 Beverage, Food and Tobacco 29/12/2017 8.41203788 6.0 17 10 - 20% 1,443,414.97£ 1,443,414.97£ 4 Beverage, Food and Tobacco 24/04/2013 3.73203791 6.0 61 60 - 70% 870,984.56£ 552,000.00£ 10 Diversified/Conglomerate Service 18/02/2013 3.55 2203794 4.0 12 10 - 20% 69,393.59£ 60,679.12£ 10 Diversified/Conglomerate Service 31/10/2009 0.25203796 3.0 15 10 - 20% 3,132,454.79£ 3,132,454.79£ 2 Automobile 01/12/2021 12.33203801 8.0 19 10 - 20% 2,246,617.43£ 2,246,617.43£ 21 Leisure, Amusement, Entertainment 02/09/2025 16.09 2203805 5.0 5 0 - 10% 568,988.23£ 568,988.23£ 17 Healthcare, Education and Childcare 29/12/2024 15.41203808 7.0 89 80 - 90% 2,653,693.00£ 2,653,693.00£ 13 Electronics 31/07/2010 1.00 2203811 7.0 14 10 - 20% 2,118,317.87£ 2,066,106.71£ 25 Personal, Food and Miscellaneous 02/12/2009 0.34203813 5.0 6 0 - 10% 1,115,775.92£ 1,115,775.92£ 17 Healthcare, Education and Childcare 17/12/2009 0.38203814 8.0 12 10 - 20% 1,756,300.00£ 1,756,300.00£ 19 Hotels, Motels, Inns and Gaming 05/09/2015 6.09 2203816 5.0 41 40 - 50% 101,982,202.03£ 17,856,089.66£ 28 Retail Stores 19/04/2011 1.72203817 4.0 5 0 - 10% 518,555.33£ 518,555.33£ 28 Retail Stores 31/10/2009 0.25203819 2.1 5 0 - 10% 3,311,350.64£ 3,311,350.64£ 5 Buildings and Real Estate 30/09/2013 4.16203821 4.0 6 0 - 10% 1,876,607.64£ 1,870,474.53£ 16 Grocery 31/10/2009 0.25203822 1.8 60 50 - 60% 1,869,045.11£ 1,718,752.95£ 18 Home and Office Furnishings, Housewares, and Durable Consumer Products 31/10/2009 0.25203824 1.5 82 80 - 90% 496,082.79£ 478,902.51£ 15 Farming and Agriculture 31/10/2009 0.25203826 4.0 12 10 - 20% 355,635.61£ 262,692.91£ 28 Retail Stores 31/10/2009 0.25203829 6.0 65 60 - 70% 1,976,748.00£ 1,779,873.00£ 18 Home and Office Furnishings, Housewares, and Durable Consumer Products 27/06/2011 1.91 2203834 5.0 20 10 - 20% 5,169,000.00£ 4,214,596.00£ 5 Buildings and Real Estate 31/08/2011 2.08203835 8.0 8 0 - 10% 809,096.32£ 716,235.50£ 5 Buildings and Real Estate 31/10/2009 0.25 2203836 2.1 10 0 - 10% 3,300,000.00£ 3,300,000.00£ 5 Buildings and Real Estate 31/10/2009 0.25203841 8.0 21 20 - 30% 73,386.75£ 48,260.40£ 27 Cargo Transport 31/10/2009 0.25203844 4.0 23 20 - 30% 7,126,385.56£ 3,839,385.56£ 5 Buildings and Real Estate 31/10/2009 0.25203845 3.0 20 10 - 20% 800,000.00£ 800,000.00£ 25 Personal, Food and Miscellaneous 29/08/2011 2.08203847 3.0 5 0 - 10% 1,255,882.36£ 1,050,000.00£ 21 Leisure, Amusement, Entertainment 29/01/2017 7.49203849 4.0 50 40 - 50% 3,825,771.74£ 3,825,771.74£ 25 Personal, Food and Miscellaneous 31/10/2009 0.25203850 5.0 13 10 - 20% 1,562,554.30£ 1,075,913.07£ 21 Leisure, Amusement, Entertainment 31/10/2009 0.25203854 3.0 6 0 - 10% 1,087,252.79£ 1,087,252.79£ 17 Healthcare, Education and Childcare 02/09/2011 2.09
Page 49 of 5730/06/2008

Data By Borrower
Borrower BBG Severity Severity Band RO Outstanding Debt RO Notional Balance
Moody's Industry Sector Moody's Industry Sector Maturity Date Remaining Term (Years) EWL Syndicated
203860 1.5 8 0 - 10% 1,068,528.98£ 506,280.00£ 15 Farming and Agriculture 31/10/2009 0.25203861 5.0 26 20 - 30% 1,057,236.16£ 1,044,183.38£ 6 Chemicals, Plastics and Rubber 01/06/2010 0.83203866 3.0 9 0 - 10% 2,250,000.00£ 2,250,000.00£ 5 Buildings and Real Estate 07/11/2013 4.27203867 3.0 37 30 - 40% 7,401,230.58£ 7,401,230.58£ 5 Buildings and Real Estate 16/11/2009 0.29203869 3.0 6 0 - 10% 1,497,594.35£ 1,497,594.35£ 5 Buildings and Real Estate 31/10/2009 0.25203870 6.0 18 10 - 20% 1,996,326.88£ 1,987,573.38£ 13 Electronics 31/10/2009 0.25203872 7.0 18 10 - 20% 323,993.64£ 157,480.79£ 18 Home and Office Furnishings, Housewares, and Durable Consumer Products 31/10/2009 0.25203873 4.0 25 20 - 30% 965,539.39£ 591,215.89£ 15 Farming and Agriculture 31/07/2010 1.00203875 6.0 12 10 - 20% 1,173,853.15£ 1,173,853.15£ 22 Machinery (Non-Agriculture, Non-Construction, Non-Electronic) 01/06/2010 0.83203877 6.0 35 30 - 40% 974,458.56£ 781,567.88£ 30 Textiles and Leather 31/10/2009 0.25203878 4.0 38 30 - 40% 3,066,732.00£ 2,561,732.00£ 5 Buildings and Real Estate 30/04/2011 1.75203879 2.5 8 0 - 10% 574,958.02£ 456,121.42£ 15 Farming and Agriculture 31/10/2009 0.25203880 7.0 10 0 - 10% 500,000.00£ 500,000.00£ 21 Leisure, Amusement, Entertainment 27/07/2014 4.99203881 4.0 21 20 - 30% 936,971.09£ 579,881.84£ 31 Personal Transportation 31/10/2009 0.25 1203882 8.0 7 0 - 10% 842,749.28£ 842,749.28£ 17 Healthcare, Education and Childcare 31/10/2009 0.25 2203885 6.0 31 30 - 40% 1,010,726.59£ 1,010,726.59£ 6 Chemicals, Plastics and Rubber 31/10/2009 0.25203886 4.0 28 20 - 30% 1,400,000.00£ 1,400,000.00£ 5 Buildings and Real Estate 31/10/2009 0.25203890 8.0 18 10 - 20% 4,001,120.32£ 3,947,047.25£ 15 Farming and Agriculture 31/10/2009 0.25 2203891 3.0 60 50 - 60% 909,461.31£ 758,213.04£ 21 Leisure, Amusement, Entertainment 31/07/2010 1.00203893 5.0 51 50 - 60% 1,106,327.85£ 637,650.46£ 6 Chemicals, Plastics and Rubber 31/10/2009 0.25 1203894 5.0 32 30 - 40% 2,024,573.15£ 2,024,573.15£ 22 Machinery (Non-Agriculture, Non-Construction, Non-Electronic) 01/11/2009 0.25 1203895 3.0 5 0 - 10% 4,364,524.76£ 4,364,524.76£ 17 Healthcare, Education and Childcare 25/05/2011 1.82203897 5.0 56 50 - 60% 5,003,214.65£ 5,003,214.65£ 22 Machinery (Non-Agriculture, Non-Construction, Non-Electronic) 31/10/2009 0.25203898 7.0 48 40 - 50% 18,219,261.40£ 18,219,261.40£ 2 Automobile 30/04/2012 2.75 2203899 1.5 41 40 - 50% 24,500,000.00£ 24,500,000.00£ 14 Finance 31/07/2010 1.00203900 2.5 5 0 - 10% 1,002,559.85£ 583,951.82£ 15 Farming and Agriculture 31/10/2009 0.25203901 3.0 39 30 - 40% 26,229,237.92£ 21,049,652.34£ 6 Chemicals, Plastics and Rubber 29/06/2011 1.91203902 5.0 10 0 - 10% 16,789,150.14£ 16,708,421.80£ 3 Banking 31/07/2010 1.00203905 9.0 54 50 - 60% 15,000,000.00£ 17,973.42£ 4 Beverage, Food and Tobacco 24/07/2011 1.98203906 4.0 8 0 - 10% 3,124,752.39£ 3,124,752.39£ 5 Buildings and Real Estate 31/10/2009 0.25203914 4.0 47 40 - 50% 31,142,033.98£ 24,500,000.00£ 25 Personal, Food and Miscellaneous 04/09/2013 4.09203922 4.0 65 60 - 70% 814,647.57£ 814,647.57£ 27 Cargo Transport 31/10/2009 0.25203924 5.0 20 10 - 20% 590,678.08£ 398,298.36£ 22 Machinery (Non-Agriculture, Non-Construction, Non-Electronic) 31/10/2009 0.25203929 7.0 13 10 - 20% 691,844.12£ 363,866.18£ 22 Machinery (Non-Agriculture, Non-Construction, Non-Electronic) 31/10/2009 0.25203932 4.0 11 10 - 20% 11,983,629.40£ 11,554,318.34£ 19 Hotels, Motels, Inns and Gaming 31/10/2009 0.25203933 3.0 5 0 - 10% 300,000.00£ 300,000.00£ 4 Beverage, Food and Tobacco 11/05/2012 2.78203936 5.0 34 30 - 40% 3,713,815.25£ 3,402,075.68£ 30 Textiles and Leather 31/10/2009 0.25203939 2.5 5 0 - 10% 768,856.34£ 763,910.90£ 5 Buildings and Real Estate 22/03/2017 7.64203940 5.0 19 10 - 20% 540,950.20£ 38,439.65£ 2 Automobile 31/10/2009 0.25203945 5.0 82 80 - 90% 278,830.79£ 218,012.50£ 3 Banking 31/10/2009 0.25 1203948 5.0 9 0 - 10% 14,500,000.00£ 14,500,000.00£ 6 Chemicals, Plastics and Rubber 31/01/2012 2.50203952 8.0 75 70 - 80% 225,000.00£ 225,000.00£ 25 Personal, Food and Miscellaneous 28/10/2010 1.24203954 5.0 82 80 - 90% 711,731.63£ 329,125.78£ 30 Textiles and Leather 31/10/2009 0.25203956 6.0 6 0 - 10% 734,746.24£ 716,490.14£ 19 Hotels, Motels, Inns and Gaming 11/02/2016 6.53203964 6.0 28 20 - 30% 8,823,533.86£ 8,773,279.98£ 4 Beverage, Food and Tobacco 31/10/2009 0.25 2203965 6.0 18 10 - 20% 387,044.50£ 387,044.50£ 5 Buildings and Real Estate 31/10/2009 0.25203966 5.0 10 0 - 10% 345,686.36£ 342,096.36£ 10 Diversified/Conglomerate Service 31/10/2009 0.25203968 5.0 12 10 - 20% 475,000.00£ 475,000.00£ 5 Buildings and Real Estate 31/10/2009 0.25203977 4.0 27 20 - 30% 1,097,863.33£ 645,014.99£ 17 Healthcare, Education and Childcare 31/10/2009 0.25203978 5.0 17 10 - 20% 1,575,407.76£ 1,570,270.44£ 22 Machinery (Non-Agriculture, Non-Construction, Non-Electronic) 20/05/2018 8.80203987 8.0 17 10 - 20% 1,113,516.00£ 1,081,975.83£ 5 Buildings and Real Estate 31/10/2009 0.25 2203991 3.0 6 0 - 10% 928,336.61£ 928,336.61£ 5 Buildings and Real Estate 31/10/2009 0.25203995 4.0 16 10 - 20% 2,696,133.91£ 2,696,133.91£ 28 Retail Stores 16/03/2019 9.63203996 4.0 58 50 - 60% 1,400,000.00£ 1,400,000.00£ 13 Electronics 21/07/2011 1.97204000 6.0 100 90 - 100% 5,850,000.00£ 5,850,000.00£ 10 Diversified/Conglomerate Service 31/07/2010 1.00204003 4.0 81 80 - 90% 165,187.35£ 165,187.35£ 24 Oil and Gas 31/10/2009 0.25204004 5.0 47 40 - 50% 11,729,249.00£ 11,729,249.00£ 20 Insurance 31/03/2013 3.67 1204005 5.0 8 0 - 10% 2,129,609.03£ 2,122,575.00£ 27 Cargo Transport 31/10/2009 0.25204006 6.0 34 30 - 40% 7,943,679.85£ 7,943,679.85£ 10 Diversified/Conglomerate Service 31/03/2011 1.67 1204007 6.0 48 40 - 50% 785,155.20£ 785,155.20£ 26 Printing and Publishing 28/07/2013 3.99204009 4.0 5 0 - 10% 28,416,666.35£ 24,500,000.00£ 19 Hotels, Motels, Inns and Gaming 06/06/2011 1.85 Y204010 5.0 12 10 - 20% 4,938,369.21£ 4,938,369.21£ 8 Personal and Non Durable Consumer Products (Manufacturing Only) 31/10/2009 0.25 1204012 3.0 12 10 - 20% 9,106,886.77£ 8,915,339.29£ 5 Buildings and Real Estate 16/01/2018 8.46204013 8.0 18 10 - 20% 528,312.30£ 248,203.45£ 2 Automobile 31/10/2009 0.25 1204015 3.0 14 10 - 20% 1,466,773.42£ 1,466,773.42£ 16 Grocery 31/07/2010 1.00
Page 50 of 5730/06/2008

Data By Borrower
Borrower BBG Severity Severity Band RO Outstanding Debt RO Notional Balance
Moody's Industry Sector Moody's Industry Sector Maturity Date Remaining Term (Years) EWL Syndicated
204018 4.0 100 90 - 100% 1,790,223.58£ 1,790,223.58£ 10 Diversified/Conglomerate Service 31/10/2009 0.25204020 8.0 24 20 - 30% 1,271,524.42£ 1,127,295.39£ 10 Diversified/Conglomerate Service 03/06/2017 7.84 2204024 5.0 23 20 - 30% 750,000.00£ 750,000.00£ 30 Textiles and Leather 17/11/2016 7.29204026 4.0 5 0 - 10% 427,681.48£ 427,681.48£ 19 Hotels, Motels, Inns and Gaming 02/08/2015 6.00204029 6.0 12 10 - 20% 7,873,437.48£ 7,710,546.85£ 25 Personal, Food and Miscellaneous 25/10/2011 2.23 2204030 4.0 19 10 - 20% 685,823.83£ 685,823.83£ 22 Machinery (Non-Agriculture, Non-Construction, Non-Electronic) 27/07/2016 6.99204031 4.0 14 10 - 20% 631,871.60£ 214,406.50£ 18 Home and Office Furnishings, Housewares, and Durable Consumer Products 31/07/2010 1.00204032 8.0 10 0 - 10% 942,153.04£ 735,814.49£ 5 Buildings and Real Estate 31/10/2009 0.25 2204033 8.0 38 30 - 40% 3,283,720.05£ 2,995,356.11£ 17 Healthcare, Education and Childcare 31/10/2009 0.25 2204034 5.0 34 30 - 40% 2,859,881.34£ 2,859,881.34£ 16 Grocery 31/07/2010 1.00204035 3.0 17 10 - 20% 1,730,365.78£ 1,730,365.78£ 6 Chemicals, Plastics and Rubber 22/07/2017 7.98204037 5.0 8 0 - 10% 1,560,040.87£ 1,560,040.87£ 6 Chemicals, Plastics and Rubber 31/12/2018 9.42204038 8.0 22 20 - 30% 6,553,307.85£ 6,553,307.85£ 21 Leisure, Amusement, Entertainment 01/06/2010 0.83 2204039 1.8 66 60 - 70% 11,000,000.00£ 11,000,000.00£ 13 Electronics 26/07/2010 0.99204040 5.0 9 0 - 10% 3,547,383.24£ 3,547,383.24£ 17 Healthcare, Education and Childcare 22/07/2013 3.98204041 6.0 5 0 - 10% 518,766.76£ 518,766.76£ 10 Diversified/Conglomerate Service 28/08/2013 4.08204043 3.0 34 30 - 40% 12,333,333.33£ 12,333,333.33£ 27 Cargo Transport 30/06/2011 1.91204047 6.0 49 40 - 50% 6,509,000.00£ 6,509,000.00£ 17 Healthcare, Education and Childcare 21/01/2010 0.47 2204050 5.0 18 10 - 20% 972,194.54£ 655,134.45£ 22 Machinery (Non-Agriculture, Non-Construction, Non-Electronic) 01/05/2010 0.75204052 6.0 8 0 - 10% 910,507.36£ 910,507.36£ 13 Electronics 01/12/2016 7.33204054 6.0 5 0 - 10% 4,006,640.76£ 4,006,640.76£ 19 Hotels, Motels, Inns and Gaming 31/12/2009 0.42 2204055 4.0 74 70 - 80% 945,664.22£ 945,664.22£ 33 Broadcasting & Entertainment 30/06/2011 1.91204057 7.0 75 70 - 80% 1,176,545.71£ 857,348.96£ 30 Textiles and Leather 31/10/2009 0.25 3204063 8.0 42 40 - 50% 462,964.44£ 462,964.44£ 26 Printing and Publishing 31/10/2009 0.25 2204066 6.0 22 20 - 30% 2,344,383.98£ 2,344,383.98£ 9 Diversified/Conglomerate Manufacturing 31/10/2009 0.25 2204067 3.0 26 20 - 30% 269,191.40£ 269,191.40£ 26 Printing and Publishing 29/12/2011 2.41204069 3.0 7 0 - 10% 100,000.00£ 100,000.00£ 21 Leisure, Amusement, Entertainment 06/03/2027 17.60204072 5.0 12 10 - 20% 528,303.23£ 429,217.50£ 2 Automobile 31/10/2009 0.25204074 6.0 55 50 - 60% 432,513.52£ 432,513.52£ 13 Electronics 01/05/2010 0.75204080 5.0 27 20 - 30% 1,464,632.46£ 1,299,137.39£ 6 Chemicals, Plastics and Rubber 31/10/2009 0.25 1204086 4.0 8 0 - 10% 2,150,000.00£ 2,150,000.00£ 22 Machinery (Non-Agriculture, Non-Construction, Non-Electronic) 01/05/2015 5.75204087 8.0 54 50 - 60% 570,370.43£ 561,386.54£ 22 Machinery (Non-Agriculture, Non-Construction, Non-Electronic) 01/06/2010 0.83 2204091 8.0 17 10 - 20% 582,646.30£ 323,660.76£ 2 Automobile 31/10/2009 0.25 2204094 3.0 5 0 - 10% 1,434,736.87£ 1,011,250.00£ 16 Grocery 20/01/2019 9.47204095 6.0 23 20 - 30% 2,867,626.47£ 2,706,026.47£ 22 Machinery (Non-Agriculture, Non-Construction, Non-Electronic) 31/07/2010 1.00204096 5.0 43 40 - 50% 402,887.48£ 325,883.46£ 28 Retail Stores 31/10/2009 0.25204098 4.0 81 80 - 90% 312,382.86£ 312,382.86£ 17 Healthcare, Education and Childcare 13/11/2010 1.28204099 8.0 51 50 - 60% 774,889.30£ 613,528.31£ 2 Automobile 31/10/2009 0.25 2204102 5.0 9 0 - 10% 664,319.02£ 664,319.02£ 27 Cargo Transport 01/05/2010 0.75204104 8.0 24 20 - 30% 406,346.80£ 391,691.85£ 30 Textiles and Leather 31/10/2009 0.25 2204105 9.0 20 10 - 20% 3,058,880.16£ 3,047,483.41£ 23 Mining, Steel, Iron and Non Precious Metals 28/11/2026 17.33 3204108 3.0 25 20 - 30% 75,000,000.00£ 24,500,000.00£ 21 Leisure, Amusement, Entertainment 30/09/2023 14.16204112 4.0 28 20 - 30% 11,040,356.90£ 11,040,356.90£ 32 Utilities 31/12/2016 7.42204113 4.0 15 10 - 20% 402,459.39£ 402,459.39£ 22 Machinery (Non-Agriculture, Non-Construction, Non-Electronic) 01/05/2010 0.75204114 6.0 5 0 - 10% 470,886.20£ 470,886.20£ 2 Automobile 31/10/2009 0.25 2204115 4.0 12 10 - 20% 828,307.50£ 828,307.50£ 5 Buildings and Real Estate 22/04/2014 4.73204118 6.0 29 20 - 30% 430,282.05£ 430,282.05£ 18 Home and Office Furnishings, Housewares, and Durable Consumer Products 01/04/2010 0.67204119 3.0 5 0 - 10% 3,312,400.00£ 3,312,400.00£ 5 Buildings and Real Estate 31/08/2015 6.08204123 2.1 13 10 - 20% 1,970,000.00£ 1,970,000.00£ 5 Buildings and Real Estate 31/01/2014 4.50204125 6.0 36 30 - 40% 2,698,040.81£ 2,664,000.00£ 5 Buildings and Real Estate 01/12/2009 0.33 2204126 6.0 39 30 - 40% 16,399,999.98£ 16,399,999.98£ 25 Personal, Food and Miscellaneous 31/12/2010 1.42 1204127 6.0 31 30 - 40% 395,355.58£ 395,355.58£ 30 Textiles and Leather 31/10/2009 0.25204128 5.0 13 10 - 20% 4,595,786.72£ 4,476,792.31£ 5 Buildings and Real Estate 26/03/2023 13.65204129 2.1 6 0 - 10% 1,859,615.35£ 1,859,615.35£ 21 Leisure, Amusement, Entertainment 27/04/2021 11.74204130 5.0 16 10 - 20% 2,824,482.78£ 2,824,482.78£ 17 Healthcare, Education and Childcare 21/11/2018 9.31204132 5.0 12 10 - 20% 3,235,288.00£ 2,897,056.00£ 5 Buildings and Real Estate 03/03/2023 13.59204134 1.8 13 10 - 20% 4,325,180.60£ 4,325,180.60£ 5 Buildings and Real Estate 05/08/2020 11.01204135 4.0 14 10 - 20% 5,416,666.70£ 5,416,666.70£ 28 Retail Stores 26/02/2021 11.57204136 5.0 14 10 - 20% 2,115,834.42£ 2,115,834.42£ 19 Hotels, Motels, Inns and Gaming 13/05/2023 13.78204137 6.0 16 10 - 20% 2,019,850.00£ 2,019,850.00£ 19 Hotels, Motels, Inns and Gaming 03/01/2023 13.42204140 4.0 14 10 - 20% 2,532,414.40£ 2,532,414.40£ 19 Hotels, Motels, Inns and Gaming 17/08/2011 2.04204141 4.0 82 80 - 90% 3,542,742.43£ 3,498,404.79£ 5 Buildings and Real Estate 06/05/2019 9.76204145 6.0 19 10 - 20% 9,063,005.48£ 9,063,005.48£ 19 Hotels, Motels, Inns and Gaming 20/07/2022 12.97204148 8.0 20 10 - 20% 801,885.00£ 797,900.00£ 5 Buildings and Real Estate 31/10/2009 0.25 2204152 8.0 22 20 - 30% 1,286,900.00£ 1,286,900.00£ 21 Leisure, Amusement, Entertainment 04/10/2009 0.18 2
Page 51 of 5730/06/2008

Data By Borrower
Borrower BBG Severity Severity Band RO Outstanding Debt RO Notional Balance
Moody's Industry Sector Moody's Industry Sector Maturity Date Remaining Term (Years) EWL Syndicated
204154 8.0 12 10 - 20% 3,821,546.22£ 3,821,546.22£ 26 Printing and Publishing 17/01/2026 16.46 2204156 4.0 6 0 - 10% 548,258.39£ 201,928.39£ 18 Home and Office Furnishings, Housewares, and Durable Consumer Products 31/10/2009 0.25204158 7.0 31 30 - 40% 48,244.72£ 48,244.72£ 5 Buildings and Real Estate 31/10/2009 0.25204159 8.0 29 20 - 30% 2,560,200.00£ 2,560,200.00£ 2 Automobile 01/02/2023 13.50 2204164 2.1 19 10 - 20% 617,560.16£ 154,150.25£ 15 Farming and Agriculture 31/10/2009 0.25204168 6.0 24 20 - 30% 907,771.72£ 906,994.56£ 30 Textiles and Leather 31/07/2010 1.00204169 7.0 5 0 - 10% 301,275.00£ 301,275.00£ 10 Diversified/Conglomerate Service 30/06/2010 0.91204172 6.0 81 80 - 90% 412,500.00£ 412,500.00£ 17 Healthcare, Education and Childcare 09/01/2012 2.44204173 8.0 21 20 - 30% 1,185,000.00£ 1,185,000.00£ 5 Buildings and Real Estate 31/12/2009 0.42 2204174 4.0 12 10 - 20% 183,858.89£ 183,858.89£ 18 Home and Office Furnishings, Housewares, and Durable Consumer Products 01/06/2010 0.83204180 8.0 17 10 - 20% 914,990.07£ 914,990.07£ 5 Buildings and Real Estate 06/01/2010 0.43 1204181 7.0 45 40 - 50% 1,040,188.63£ 1,040,188.63£ 5 Buildings and Real Estate 31/10/2009 0.25204183 5.0 31 30 - 40% 693,446.13£ 685,017.76£ 5 Buildings and Real Estate 20/10/2009 0.22204185 8.0 11 10 - 20% 630,515.00£ 630,515.00£ 5 Buildings and Real Estate 31/10/2009 0.25 2204186 8.0 25 20 - 30% 463,461.40£ 463,461.40£ 33 Broadcasting & Entertainment 04/10/2012 3.18 2204187 8.0 9 0 - 10% 752,645.04£ 647,885.62£ 5 Buildings and Real Estate 10/12/2009 0.36 1204189 4.0 10 0 - 10% 382,546.20£ 380,089.50£ 10 Diversified/Conglomerate Service 09/11/2013 4.27204190 5.0 9 0 - 10% 367,750.21£ 367,750.21£ 30 Textiles and Leather 24/11/2011 2.31204191 4.0 6 0 - 10% 454,507.95£ 417,004.19£ 29 Telecommunications 12/07/2012 2.95204202 8.0 41 40 - 50% 932,000.00£ 932,000.00£ 19 Hotels, Motels, Inns and Gaming 30/07/2010 1.00 2204203 8.0 15 10 - 20% 1,424,471.49£ 1,421,671.49£ 5 Buildings and Real Estate 31/10/2009 0.25 3204204 4.0 7 0 - 10% 483,323.96£ 483,323.96£ 5 Buildings and Real Estate 08/12/2009 0.35204206 6.0 17 10 - 20% 15,093,080.39£ 14,982,419.66£ 17 Healthcare, Education and Childcare 31/10/2009 0.25204208 1.5 39 30 - 40% 45,000,000.00£ 24,500,000.00£ 10 Diversified/Conglomerate Service 03/11/2011 2.26204209 4.0 48 40 - 50% 69,675,000.00£ 24,500,000.00£ 5 Buildings and Real Estate 15/12/2014 5.37204211 4.0 15 10 - 20% 4,965,111.02£ 4,965,111.02£ 19 Hotels, Motels, Inns and Gaming 31/12/2022 13.42204214 8.0 11 10 - 20% 10,496,845.21£ 10,467,326.90£ 5 Buildings and Real Estate 31/10/2009 0.25 2204216 8.0 14 10 - 20% 3,817,937.59£ 3,526,644.50£ 10 Diversified/Conglomerate Service 30/03/2022 12.66204220 6.0 10 0 - 10% 938,233.48£ 938,233.48£ 17 Healthcare, Education and Childcare 15/07/2018 8.96204223 8.0 12 10 - 20% 1,982,272.51£ 1,981,325.05£ 19 Hotels, Motels, Inns and Gaming 01/07/2019 9.92 1204224 8.0 15 10 - 20% 1,427,700.00£ 1,427,700.00£ 5 Buildings and Real Estate 31/10/2009 0.25 3204225 8.0 14 10 - 20% 1,305,000.00£ 1,305,000.00£ 21 Leisure, Amusement, Entertainment 30/12/2011 2.41204227 6.0 21 20 - 30% 1,392,119.11£ 1,392,119.11£ 28 Retail Stores 10/07/2019 9.94204228 4.0 12 10 - 20% 887,337.21£ 887,337.21£ 17 Healthcare, Education and Childcare 31/08/2019 10.08204229 6.0 75 70 - 80% 1,700,000.00£ 1,700,000.00£ 9 Diversified/Conglomerate Manufacturing 28/04/2011 1.74 1204230 6.0 21 20 - 30% 588,731.30£ 588,731.30£ 21 Leisure, Amusement, Entertainment 01/03/2014 4.58204232 5.0 12 10 - 20% 485,194.94£ 485,194.94£ 18 Home and Office Furnishings, Housewares, and Durable Consumer Products 24/03/2014 4.65204234 3.0 23 20 - 30% 1,200,913.95£ 829,957.81£ 2 Automobile 31/10/2009 0.25204235 6.0 6 0 - 10% 678,076.76£ 678,076.76£ 17 Healthcare, Education and Childcare 31/10/2009 0.25204236 7.0 25 20 - 30% 298,881.15£ 60,594.77£ 13 Electronics 31/10/2009 0.25204239 8.0 22 20 - 30% 557,915.88£ 557,915.88£ 13 Electronics 23/10/2016 7.23 2204242 7.0 22 20 - 30% 428,093.23£ 428,093.23£ 31 Personal Transportation 26/10/2014 5.24204244 8.0 25 20 - 30% 393,631.35£ 114,519.28£ 10 Diversified/Conglomerate Service 31/10/2009 0.25 2204245 3.0 15 10 - 20% 6,098,320.00£ 6,098,320.00£ 5 Buildings and Real Estate 18/12/2009 0.38204248 8.0 6 0 - 10% 1,272,000.00£ 1,272,000.00£ 21 Leisure, Amusement, Entertainment 27/03/2024 14.66 2204256 6.0 52 50 - 60% 888,205.86£ 888,205.86£ 5 Buildings and Real Estate 31/10/2009 0.25 2204257 3.0 39 30 - 40% 500,000.00£ 500,000.00£ 10 Diversified/Conglomerate Service 01/11/2010 1.25204260 4.0 19 10 - 20% 682,000.00£ 682,000.00£ 5 Buildings and Real Estate 31/10/2009 0.25204261 4.0 13 10 - 20% 1,349,011.73£ 1,349,011.73£ 2 Automobile 30/06/2018 8.91204262 8.0 20 10 - 20% 1,406,245.07£ 1,403,739.22£ 19 Hotels, Motels, Inns and Gaming 08/11/2024 15.27204263 8.0 10 0 - 10% 834,504.98£ 834,504.98£ 19 Hotels, Motels, Inns and Gaming 15/03/2024 14.62 2204267 6.0 27 20 - 30% 1,283,232.05£ 1,283,232.05£ 25 Personal, Food and Miscellaneous 20/04/2019 9.72204271 6.0 6 0 - 10% 722,470.69£ 722,470.69£ 12 Ecological 04/08/2021 12.01204273 7.0 18 10 - 20% 2,281,542.60£ 2,122,352.31£ 5 Buildings and Real Estate 31/10/2009 0.25 2204274 7.0 31 30 - 40% 1,384,272.14£ 1,384,272.14£ 30 Textiles and Leather 04/08/2024 15.01204275 5.0 13 10 - 20% 878,524.78£ 728,524.78£ 27 Cargo Transport 27/03/2024 14.66204281 8.0 26 20 - 30% 676,388.46£ 643,384.35£ 10 Diversified/Conglomerate Service 22/11/2017 8.31204283 2.1 10 0 - 10% 660,569.63£ 630,594.04£ 17 Healthcare, Education and Childcare 27/01/2015 5.49204284 6.0 6 0 - 10% 1,882,846.78£ 1,882,846.78£ 26 Printing and Publishing 31/10/2009 0.25 2204286 1.5 28 20 - 30% 3,853,329.00£ 3,633,200.09£ 17 Healthcare, Education and Childcare 20/07/2020 10.97204287 5.0 17 10 - 20% 589,902.02£ 589,902.02£ 18 Home and Office Furnishings, Housewares, and Durable Consumer Products 31/08/2018 9.08204288 5.0 10 0 - 10% 410,980.08£ 410,980.08£ 28 Retail Stores 05/12/2015 6.34204291 5.0 12 10 - 20% 304,470.72£ 149,400.38£ 9 Diversified/Conglomerate Manufacturing 31/10/2009 0.25204293 5.0 12 10 - 20% 36,944.24£ 36,944.24£ 4 Beverage, Food and Tobacco 31/07/2010 1.00204298 6.0 43 40 - 50% 9,999.22£ 9,999.22£ 24 Oil and Gas 31/10/2009 0.25
Page 52 of 5730/06/2008

Data By Borrower
Borrower BBG Severity Severity Band RO Outstanding Debt RO Notional Balance
Moody's Industry Sector Moody's Industry Sector Maturity Date Remaining Term (Years) EWL Syndicated
204300 6.0 35 30 - 40% 1,000,000.00£ 1,000,000.00£ 22 Machinery (Non-Agriculture, Non-Construction, Non-Electronic) 16/04/2011 1.71 2204301 4.0 6 0 - 10% 1,075,193.59£ 1,075,193.59£ 24 Oil and Gas 16/12/2015 6.38204304 6.0 75 70 - 80% 2,529,672.68£ 2,351,181.64£ 10 Diversified/Conglomerate Service 31/10/2009 0.25 2204307 7.0 7 0 - 10% 641,112.13£ 641,112.13£ 25 Personal, Food and Miscellaneous 23/11/2015 6.31204308 7.0 15 10 - 20% 539,319.17£ 539,319.17£ 28 Retail Stores 25/04/2018 8.73204311 6.0 35 30 - 40% 3,632,555.78£ 1,677,529.15£ 8 Personal and Non Durable Consumer Products (Manufacturing Only) 31/07/2010 1.00 2204312 8.0 11 10 - 20% 7,100,000.00£ 7,000,000.00£ 19 Hotels, Motels, Inns and Gaming 31/10/2009 0.25 2204314 4.0 24 20 - 30% 3,255,000.00£ 3,255,000.00£ 15 Farming and Agriculture 31/12/2010 1.42204315 4.0 15 10 - 20% 1,871,756.11£ 1,043,485.58£ 15 Farming and Agriculture 31/10/2009 0.25204316 2.8 19 10 - 20% 4,550,000.00£ 4,550,000.00£ 15 Farming and Agriculture 01/09/2013 4.08204320 4.0 53 50 - 60% 1,400,000.00£ 1,400,000.00£ 28 Retail Stores 18/02/2011 1.55 2204328 8.0 6 0 - 10% 741,971.26£ 741,971.26£ 17 Healthcare, Education and Childcare 31/10/2009 0.25 1204329 6.0 77 70 - 80% 704,282.09£ 704,282.09£ 22 Machinery (Non-Agriculture, Non-Construction, Non-Electronic) 01/06/2010 0.83204330 4.0 26 20 - 30% 427,922.69£ 427,922.69£ 30 Textiles and Leather 31/10/2009 0.25204335 5.0 8 0 - 10% 206,813.44£ 8,411.20£ 2 Automobile 31/10/2009 0.25204336 8.0 20 10 - 20% 1,999,334.42£ 1,510,909.35£ 30 Textiles and Leather 01/05/2010 0.75 1204338 5.0 7 0 - 10% 822,057.55£ 569,432.79£ 12 Ecological 31/10/2009 0.25204341 8.0 39 30 - 40% 878,600.00£ 618,600.00£ 5 Buildings and Real Estate 31/10/2009 0.25 2204342 6.0 35 30 - 40% 839,243.36£ 809,615.12£ 18 Home and Office Furnishings, Housewares, and Durable Consumer Products 01/05/2010 0.75204343 8.0 69 60 - 70% 535,066.92£ 368,278.13£ 10 Diversified/Conglomerate Service 31/10/2009 0.25204345 8.0 18 10 - 20% 780,489.89£ 569,992.02£ 22 Machinery (Non-Agriculture, Non-Construction, Non-Electronic) 31/10/2009 0.25204346 5.0 18 10 - 20% 501,261.89£ 501,261.89£ 23 Mining, Steel, Iron and Non Precious Metals 18/04/2011 1.71204350 6.0 46 40 - 50% 513,095.68£ 349,075.55£ 2 Automobile 31/10/2009 0.25204351 6.0 31 30 - 40% 742,158.46£ 742,158.46£ 32 Utilities 31/10/2009 0.25204353 5.0 19 10 - 20% 116,392.23£ 116,392.23£ 28 Retail Stores 31/10/2009 0.25204357 5.0 26 20 - 30% 548,149.38£ 548,149.38£ 26 Printing and Publishing 20/03/2016 6.64204360 6.0 14 10 - 20% 7,093,449.03£ 7,093,449.03£ 19 Hotels, Motels, Inns and Gaming 31/10/2009 0.25 2204361 7.0 13 10 - 20% 550,086.10£ 534,391.32£ 27 Cargo Transport 21/12/2015 6.39204362 5.0 33 30 - 40% 498,460.10£ 498,460.10£ 10 Diversified/Conglomerate Service 29/09/2016 7.16204363 2.5 11 10 - 20% 629,066.84£ 629,066.84£ 5 Buildings and Real Estate 12/05/2016 6.78204364 4.0 11 10 - 20% 580,433.44£ 580,433.44£ 28 Retail Stores 17/08/2016 7.04204365 6.0 14 10 - 20% 459,909.16£ 459,909.16£ 17 Healthcare, Education and Childcare 05/10/2016 7.18204366 8.0 16 10 - 20% 1,138,952.12£ 962,345.14£ 2 Automobile 31/10/2009 0.25 2204367 3.0 27 20 - 30% 472,500.00£ 472,500.00£ 24 Oil and Gas 30/11/2016 7.33204369 6.0 82 80 - 90% 1,205,547.91£ 1,205,547.91£ 10 Diversified/Conglomerate Service 01/08/2016 7.00204371 6.0 15 10 - 20% 702,776.31£ 702,776.31£ 2 Automobile 10/12/2016 7.36204372 8.0 16 10 - 20% 7,424,686.78£ 7,424,686.78£ 25 Personal, Food and Miscellaneous 30/11/2025 16.33 2204375 5.0 24 20 - 30% 588,797.86£ 569,058.14£ 22 Machinery (Non-Agriculture, Non-Construction, Non-Electronic) 20/07/2012 2.97204379 4.0 5 0 - 10% 689,953.40£ 689,953.40£ 17 Healthcare, Education and Childcare 24/09/2018 9.15204380 5.0 10 0 - 10% 1,361,364.80£ 1,361,364.80£ 5 Buildings and Real Estate 31/10/2009 0.25204381 3.0 33 30 - 40% 616,250.00£ 616,250.00£ 30 Textiles and Leather 31/10/2018 9.25204382 3.0 15 10 - 20% 477,903.70£ 477,903.70£ 22 Machinery (Non-Agriculture, Non-Construction, Non-Electronic) 25/07/2018 8.98204386 6.0 25 20 - 30% 389,732.87£ 388,775.00£ 5 Buildings and Real Estate 31/10/2009 0.25204387 8.0 22 20 - 30% 2,452,863.05£ 2,452,863.05£ 21 Leisure, Amusement, Entertainment 30/07/2018 9.00 2204388 4.0 12 10 - 20% 615,999.49£ 615,999.49£ 16 Grocery 27/07/2017 7.99204389 8.0 12 10 - 20% 1,175,415.24£ 690,941.52£ 22 Machinery (Non-Agriculture, Non-Construction, Non-Electronic) 31/10/2009 0.25 2204395 5.0 13 10 - 20% 3,799,099.92£ 3,799,099.92£ 10 Diversified/Conglomerate Service 30/07/2017 8.00204396 3.0 9 0 - 10% 524,592.32£ 524,592.32£ 30 Textiles and Leather 28/05/2019 9.83204397 3.0 19 10 - 20% 742,247.01£ 742,247.01£ 25 Personal, Food and Miscellaneous 26/06/2020 10.90204398 3.0 21 20 - 30% 557,851.15£ 557,851.15£ 25 Personal, Food and Miscellaneous 27/06/2020 10.91204401 5.0 82 80 - 90% 457,197.37£ 457,197.37£ 17 Healthcare, Education and Childcare 27/11/2020 11.32204407 4.0 28 20 - 30% 495,559.50£ 495,559.50£ 17 Healthcare, Education and Childcare 30/06/2020 10.91204408 4.0 7 0 - 10% 610,948.53£ 610,948.53£ 10 Diversified/Conglomerate Service 27/12/2017 8.41204412 5.0 22 20 - 30% 755,625.00£ 679,997.85£ 28 Retail Stores 14/01/2019 9.45204413 8.0 13 10 - 20% 610,409.14£ 603,141.63£ 23 Mining, Steel, Iron and Non Precious Metals 20/01/2020 10.47204415 4.0 5 0 - 10% 797,355.78£ 797,355.78£ 30 Textiles and Leather 15/03/2020 10.62204417 7.0 10 0 - 10% 1,439,571.52£ 1,439,571.52£ 19 Hotels, Motels, Inns and Gaming 14/07/2019 9.95204418 8.0 13 10 - 20% 849,146.36£ 709,932.71£ 10 Diversified/Conglomerate Service 24/06/2020 10.90204421 5.0 21 20 - 30% 474,888.02£ 474,888.02£ 10 Diversified/Conglomerate Service 22/12/2019 10.39204422 7.0 9 0 - 10% 470,669.23£ 470,669.23£ 25 Personal, Food and Miscellaneous 01/07/2020 10.92204423 6.0 15 10 - 20% 911,353.00£ 911,353.00£ 21 Leisure, Amusement, Entertainment 25/03/2020 10.65204424 5.0 7 0 - 10% 479,077.94£ 479,077.94£ 23 Mining, Steel, Iron and Non Precious Metals 11/02/2020 10.53204425 6.0 13 10 - 20% 719,274.63£ 715,931.22£ 28 Retail Stores 06/06/2020 10.85204426 6.0 9 0 - 10% 564,876.24£ 563,599.23£ 21 Leisure, Amusement, Entertainment 09/08/2020 11.02204427 8.0 21 20 - 30% 598,235.93£ 598,235.93£ 25 Personal, Food and Miscellaneous 30/08/2020 11.08
Page 53 of 5730/06/2008

Data By Borrower
Borrower BBG Severity Severity Band RO Outstanding Debt RO Notional Balance
Moody's Industry Sector Moody's Industry Sector Maturity Date Remaining Term (Years) EWL Syndicated
204428 5.0 13 10 - 20% 481,980.94£ 481,980.94£ 17 Healthcare, Education and Childcare 29/09/2020 11.16204429 8.0 19 10 - 20% 1,012,368.43£ 1,012,368.43£ 21 Leisure, Amusement, Entertainment 20/12/2020 11.39 2204430 3.0 20 10 - 20% 824,038.42£ 824,038.42£ 27 Cargo Transport 21/12/2020 11.39204432 5.0 10 0 - 10% 703,500.00£ 693,729.17£ 19 Hotels, Motels, Inns and Gaming 11/06/2012 2.86204434 6.0 12 10 - 20% 649,889.00£ 649,889.00£ 25 Personal, Food and Miscellaneous 29/06/2011 1.91 2204436 6.0 57 50 - 60% 270,663.28£ 156,351.29£ 30 Textiles and Leather 31/07/2010 1.00 2204438 5.0 10 0 - 10% 305,035.16£ 305,035.16£ 19 Hotels, Motels, Inns and Gaming 31/10/2009 0.25204439 6.0 6 0 - 10% 1,950,000.00£ 1,950,000.00£ 21 Leisure, Amusement, Entertainment 13/03/2014 4.62204440 6.0 48 40 - 50% 648,083.28£ 648,083.28£ 30 Textiles and Leather 31/07/2010 1.00 2204442 5.0 24 20 - 30% 16,852,495.23£ 16,852,495.23£ 28 Retail Stores 31/10/2009 0.25 1204444 3.0 49 40 - 50% 7,693,230.62£ 7,397,528.84£ 28 Retail Stores 31/10/2009 0.25204445 3.0 5 0 - 10% 2,639,466.64£ 1,165,907.49£ 13 Electronics 31/10/2009 0.25204447 6.0 45 40 - 50% 620,588.59£ 620,588.59£ 17 Healthcare, Education and Childcare 01/05/2010 0.75 2204449 5.0 6 0 - 10% 537,567.74£ 537,567.74£ 2 Automobile 04/04/2017 7.68204450 5.0 14 10 - 20% 526,995.06£ 526,995.06£ 10 Diversified/Conglomerate Service 17/05/2021 11.79204452 7.0 16 10 - 20% 686,617.24£ 686,617.24£ 5 Buildings and Real Estate 29/05/2021 11.83204453 6.0 26 20 - 30% 587,842.31£ 587,842.31£ 21 Leisure, Amusement, Entertainment 09/02/2016 6.52 2204454 7.0 17 10 - 20% 1,767,222.71£ 1,767,222.71£ 22 Machinery (Non-Agriculture, Non-Construction, Non-Electronic) 30/06/2021 11.91204459 4.0 15 10 - 20% 471,342.10£ 471,342.10£ 27 Cargo Transport 16/06/2021 11.88204460 4.0 15 10 - 20% 1,267,304.35£ 1,267,304.35£ 27 Cargo Transport 23/06/2021 11.89204461 4.0 20 10 - 20% 1,316,397.16£ 1,316,397.16£ 21 Leisure, Amusement, Entertainment 17/04/2021 11.71204462 7.0 14 10 - 20% 460,189.21£ 460,189.21£ 19 Hotels, Motels, Inns and Gaming 17/03/2021 11.63204463 7.0 18 10 - 20% 914,518.35£ 901,175.16£ 17 Healthcare, Education and Childcare 15/09/2021 12.12204464 6.0 15 10 - 20% 1,101,460.83£ 1,101,460.83£ 19 Hotels, Motels, Inns and Gaming 02/06/2021 11.84204467 7.0 24 20 - 30% 4,725,336.80£ 4,640,686.94£ 31 Personal Transportation 11/08/2021 12.03204468 8.0 19 10 - 20% 1,156,412.50£ 1,146,163.42£ 21 Leisure, Amusement, Entertainment 26/01/2021 11.49 2204469 8.0 19 10 - 20% 1,588,503.62£ 1,588,503.62£ 21 Leisure, Amusement, Entertainment 12/04/2021 11.70 2204470 6.0 16 10 - 20% 1,250,800.00£ 1,250,800.00£ 27 Cargo Transport 19/05/2021 11.80204472 6.0 22 20 - 30% 543,858.27£ 543,858.27£ 25 Personal, Food and Miscellaneous 18/08/2021 12.05204473 7.0 16 10 - 20% 2,250,086.08£ 2,250,086.08£ 9 Diversified/Conglomerate Manufacturing 24/08/2021 12.06204479 8.0 22 20 - 30% 864,122.67£ 806,137.93£ 5 Buildings and Real Estate 31/10/2009 0.25 1204480 8.0 6 0 - 10% 1,134,962.89£ 1,124,778.91£ 19 Hotels, Motels, Inns and Gaming 01/06/2010 0.83204483 5.0 82 80 - 90% 237,779.29£ 124,630.40£ 28 Retail Stores 31/10/2009 0.25 1204484 6.0 14 10 - 20% 625,004.65£ 625,004.65£ 2 Automobile 14/11/2023 14.29204486 5.0 16 10 - 20% 380,957.49£ 380,957.49£ 17 Healthcare, Education and Childcare 01/05/2010 0.75204489 5.0 19 10 - 20% 592,506.51£ 439,047.77£ 21 Leisure, Amusement, Entertainment 31/10/2009 0.25204491 8.0 41 40 - 50% 268,667.56£ 268,667.56£ 22 Machinery (Non-Agriculture, Non-Construction, Non-Electronic) 01/05/2010 0.75 2204495 8.0 75 70 - 80% 159,284.42£ 159,284.42£ 27 Cargo Transport 31/10/2009 0.25 2204496 6.0 50 40 - 50% 607,311.69£ 540,818.15£ 16 Grocery 31/10/2009 0.25204497 8.0 66 60 - 70% 507,886.18£ 485,573.15£ 5 Buildings and Real Estate 31/10/2009 0.25 2204499 8.0 65 60 - 70% 1,225,986.69£ 1,225,986.69£ 18 Home and Office Furnishings, Housewares, and Durable Consumer Products 28/03/2018 8.66 2204500 5.0 35 30 - 40% 2,766,960.03£ 2,766,960.03£ 4 Beverage, Food and Tobacco 31/10/2009 0.25204502 4.0 24 20 - 30% 574,818.28£ 574,818.28£ 25 Personal, Food and Miscellaneous 01/06/2015 5.83204503 5.0 20 10 - 20% 8,950,000.00£ 8,950,000.00£ 21 Leisure, Amusement, Entertainment 30/06/2014 4.91204504 4.0 15 10 - 20% 757,360.33£ 695,607.62£ 5 Buildings and Real Estate 31/10/2009 0.25204506 3.0 18 10 - 20% 801,691.04£ 785,614.43£ 5 Buildings and Real Estate 31/10/2009 0.25204508 5.0 16 10 - 20% 763,197.01£ 763,197.01£ 5 Buildings and Real Estate 31/10/2009 0.25204511 6.0 49 40 - 50% 533,901.99£ 525,000.00£ 5 Buildings and Real Estate 01/12/2009 0.33 2204512 8.0 17 10 - 20% 1,676,100.84£ 1,676,100.84£ 5 Buildings and Real Estate 31/10/2009 0.25 2204514 4.0 5 0 - 10% 6,250,000.00£ 6,250,000.00£ 5 Buildings and Real Estate 31/10/2009 0.25204515 3.0 20 10 - 20% 1,274,927.65£ 1,237,290.57£ 5 Buildings and Real Estate 31/10/2009 0.25204516 5.0 13 10 - 20% 1,132,000.00£ 1,132,000.00£ 5 Buildings and Real Estate 31/12/2009 0.42204518 6.0 20 10 - 20% 1,473,308.51£ 1,473,308.51£ 5 Buildings and Real Estate 31/10/2009 0.25 2204522 1.5 60 50 - 60% 33,905,397.85£ 24,500,000.00£ 29 Telecommunications 31/07/2010 1.00204523 1.5 41 40 - 50% 35,000,000.00£ 24,500,000.00£ 3 Banking 31/07/2010 1.00204527 2.1 13 10 - 20% 1,023,110.45£ 514,982.88£ 5 Buildings and Real Estate 04/06/2010 0.84204529 4.0 9 0 - 10% 6,500,000.00£ 6,500,000.00£ 16 Grocery 13/11/2011 2.28204531 2.1 30 20 - 30% 3,375,000.00£ 3,375,000.00£ 4 Beverage, Food and Tobacco 01/02/2012 2.50204532 1.5 39 30 - 40% 16,333,333.33£ 16,333,333.33£ 31 Personal Transportation 19/07/2011 1.97204537 6.0 82 80 - 90% 544,500.00£ 544,500.00£ 27 Cargo Transport 03/05/2011 1.76 2204541 4.0 30 20 - 30% 1,180,800.00£ 1,180,800.00£ 5 Buildings and Real Estate 31/10/2009 0.25204544 7.0 16 10 - 20% 2,294,727.19£ 1,671,489.65£ 19 Hotels, Motels, Inns and Gaming 25/04/2010 0.73204545 4.0 10 0 - 10% 699,445.93£ 699,445.93£ 17 Healthcare, Education and Childcare 24/11/2014 5.31204551 2.5 69 60 - 70% 220,220.96£ 220,220.96£ 23 Mining, Steel, Iron and Non Precious Metals 31/10/2009 0.25204552 4.0 15 10 - 20% 504,077.53£ 504,077.53£ 28 Retail Stores 01/03/2015 5.58
Page 54 of 5730/06/2008
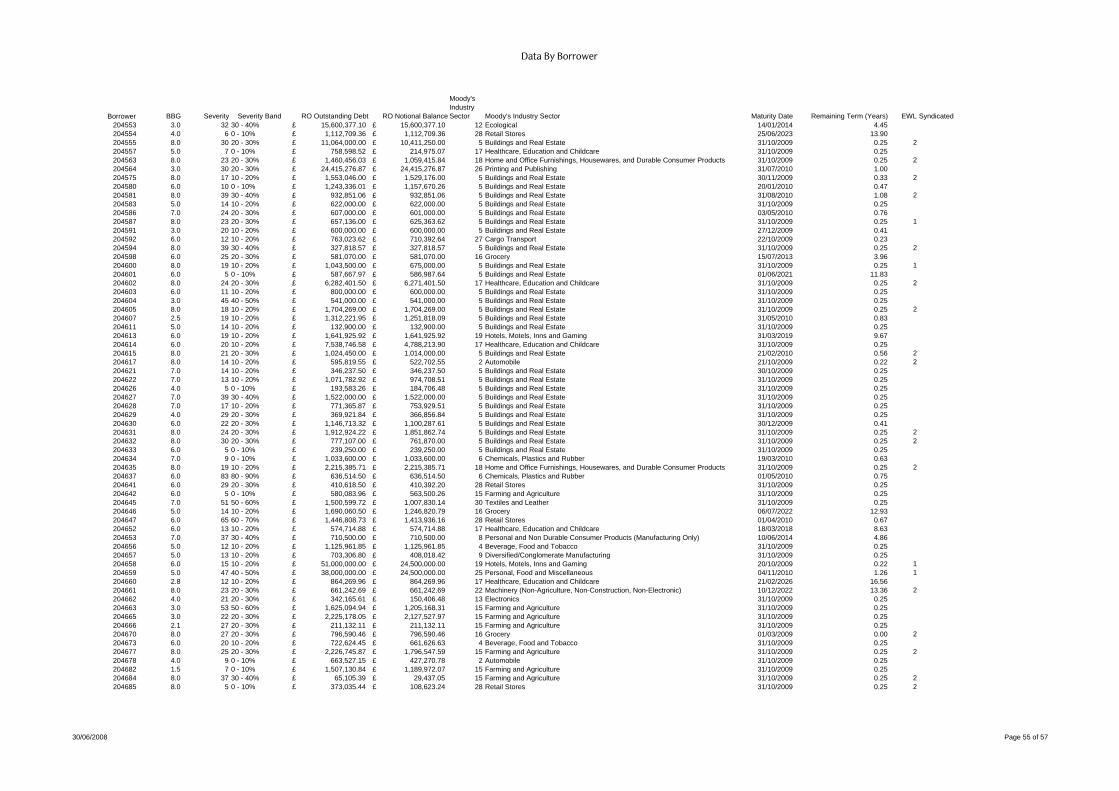
Data By Borrower
Borrower BBG Severity Severity Band RO Outstanding Debt RO Notional Balance
Moody's Industry Sector Moody's Industry Sector Maturity Date Remaining Term (Years) EWL Syndicated
204553 3.0 32 30 - 40% 15,600,377.10£ 15,600,377.10£ 12 Ecological 14/01/2014 4.45204554 4.0 6 0 - 10% 1,112,709.36£ 1,112,709.36£ 28 Retail Stores 25/06/2023 13.90204555 8.0 30 20 - 30% 11,064,000.00£ 10,411,250.00£ 5 Buildings and Real Estate 31/10/2009 0.25 2204557 5.0 7 0 - 10% 758,598.52£ 214,975.07£ 17 Healthcare, Education and Childcare 31/10/2009 0.25204563 8.0 23 20 - 30% 1,460,456.03£ 1,059,415.84£ 18 Home and Office Furnishings, Housewares, and Durable Consumer Products 31/10/2009 0.25 2204564 3.0 30 20 - 30% 24,415,276.87£ 24,415,276.87£ 26 Printing and Publishing 31/07/2010 1.00204575 8.0 17 10 - 20% 1,553,046.00£ 1,529,176.00£ 5 Buildings and Real Estate 30/11/2009 0.33 2204580 6.0 10 0 - 10% 1,243,336.01£ 1,157,670.26£ 5 Buildings and Real Estate 20/01/2010 0.47204581 8.0 39 30 - 40% 932,851.06£ 932,851.06£ 5 Buildings and Real Estate 31/08/2010 1.08 2204583 5.0 14 10 - 20% 622,000.00£ 622,000.00£ 5 Buildings and Real Estate 31/10/2009 0.25204586 7.0 24 20 - 30% 607,000.00£ 601,000.00£ 5 Buildings and Real Estate 03/05/2010 0.76204587 8.0 23 20 - 30% 657,136.00£ 625,363.62£ 5 Buildings and Real Estate 31/10/2009 0.25 1204591 3.0 20 10 - 20% 600,000.00£ 600,000.00£ 5 Buildings and Real Estate 27/12/2009 0.41204592 6.0 12 10 - 20% 763,023.62£ 710,392.64£ 27 Cargo Transport 22/10/2009 0.23204594 8.0 39 30 - 40% 327,818.57£ 327,818.57£ 5 Buildings and Real Estate 31/10/2009 0.25 2204598 6.0 25 20 - 30% 581,070.00£ 581,070.00£ 16 Grocery 15/07/2013 3.96204600 8.0 19 10 - 20% 1,043,500.00£ 675,000.00£ 5 Buildings and Real Estate 31/10/2009 0.25 1204601 6.0 5 0 - 10% 587,667.97£ 586,987.64£ 5 Buildings and Real Estate 01/06/2021 11.83204602 8.0 24 20 - 30% 6,282,401.50£ 6,271,401.50£ 17 Healthcare, Education and Childcare 31/10/2009 0.25 2204603 6.0 11 10 - 20% 800,000.00£ 600,000.00£ 5 Buildings and Real Estate 31/10/2009 0.25204604 3.0 45 40 - 50% 541,000.00£ 541,000.00£ 5 Buildings and Real Estate 31/10/2009 0.25204605 8.0 18 10 - 20% 1,704,269.00£ 1,704,269.00£ 5 Buildings and Real Estate 31/10/2009 0.25 2204607 2.5 19 10 - 20% 1,312,221.95£ 1,251,818.09£ 5 Buildings and Real Estate 31/05/2010 0.83204611 5.0 14 10 - 20% 132,900.00£ 132,900.00£ 5 Buildings and Real Estate 31/10/2009 0.25204613 6.0 19 10 - 20% 1,641,925.92£ 1,641,925.92£ 19 Hotels, Motels, Inns and Gaming 31/03/2019 9.67204614 6.0 20 10 - 20% 7,538,746.58£ 4,788,213.90£ 17 Healthcare, Education and Childcare 31/10/2009 0.25204615 8.0 21 20 - 30% 1,024,450.00£ 1,014,000.00£ 5 Buildings and Real Estate 21/02/2010 0.56 2204617 8.0 14 10 - 20% 595,819.55£ 522,702.55£ 2 Automobile 21/10/2009 0.22 2204621 7.0 14 10 - 20% 346,237.50£ 346,237.50£ 5 Buildings and Real Estate 30/10/2009 0.25204622 7.0 13 10 - 20% 1,071,782.92£ 974,708.51£ 5 Buildings and Real Estate 31/10/2009 0.25204626 4.0 5 0 - 10% 193,583.26£ 184,706.48£ 5 Buildings and Real Estate 31/10/2009 0.25204627 7.0 39 30 - 40% 1,522,000.00£ 1,522,000.00£ 5 Buildings and Real Estate 31/10/2009 0.25204628 7.0 17 10 - 20% 771,365.87£ 753,929.51£ 5 Buildings and Real Estate 31/10/2009 0.25204629 4.0 29 20 - 30% 369,921.84£ 366,856.84£ 5 Buildings and Real Estate 31/10/2009 0.25204630 6.0 22 20 - 30% 1,146,713.32£ 1,100,287.61£ 5 Buildings and Real Estate 30/12/2009 0.41204631 8.0 24 20 - 30% 1,912,924.22£ 1,851,862.74£ 5 Buildings and Real Estate 31/10/2009 0.25 2204632 8.0 30 20 - 30% 777,107.00£ 761,870.00£ 5 Buildings and Real Estate 31/10/2009 0.25 2204633 6.0 5 0 - 10% 239,250.00£ 239,250.00£ 5 Buildings and Real Estate 31/10/2009 0.25204634 7.0 9 0 - 10% 1,033,600.00£ 1,033,600.00£ 6 Chemicals, Plastics and Rubber 19/03/2010 0.63204635 8.0 19 10 - 20% 2,215,385.71£ 2,215,385.71£ 18 Home and Office Furnishings, Housewares, and Durable Consumer Products 31/10/2009 0.25 2204637 6.0 83 80 - 90% 636,514.50£ 636,514.50£ 6 Chemicals, Plastics and Rubber 01/05/2010 0.75204641 6.0 29 20 - 30% 410,618.50£ 410,392.20£ 28 Retail Stores 31/10/2009 0.25204642 6.0 5 0 - 10% 580,083.96£ 563,500.26£ 15 Farming and Agriculture 31/10/2009 0.25204645 7.0 51 50 - 60% 1,500,599.72£ 1,007,830.14£ 30 Textiles and Leather 31/10/2009 0.25204646 5.0 14 10 - 20% 1,690,060.50£ 1,246,820.79£ 16 Grocery 06/07/2022 12.93204647 6.0 65 60 - 70% 1,446,808.73£ 1,413,936.16£ 28 Retail Stores 01/04/2010 0.67204652 6.0 13 10 - 20% 574,714.88£ 574,714.88£ 17 Healthcare, Education and Childcare 18/03/2018 8.63204653 7.0 37 30 - 40% 710,500.00£ 710,500.00£ 8 Personal and Non Durable Consumer Products (Manufacturing Only) 10/06/2014 4.86204656 5.0 12 10 - 20% 1,125,961.85£ 1,125,961.85£ 4 Beverage, Food and Tobacco 31/10/2009 0.25204657 5.0 13 10 - 20% 703,306.80£ 408,018.42£ 9 Diversified/Conglomerate Manufacturing 31/10/2009 0.25204658 6.0 15 10 - 20% 51,000,000.00£ 24,500,000.00£ 19 Hotels, Motels, Inns and Gaming 20/10/2009 0.22 1204659 5.0 47 40 - 50% 38,000,000.00£ 24,500,000.00£ 25 Personal, Food and Miscellaneous 04/11/2010 1.26 1204660 2.8 12 10 - 20% 864,269.96£ 864,269.96£ 17 Healthcare, Education and Childcare 21/02/2026 16.56204661 8.0 23 20 - 30% 661,242.69£ 661,242.69£ 22 Machinery (Non-Agriculture, Non-Construction, Non-Electronic) 10/12/2022 13.36 2204662 4.0 21 20 - 30% 342,165.61£ 150,406.48£ 13 Electronics 31/10/2009 0.25204663 3.0 53 50 - 60% 1,625,094.94£ 1,205,168.31£ 15 Farming and Agriculture 31/10/2009 0.25204665 3.0 22 20 - 30% 2,225,178.05£ 2,127,527.97£ 15 Farming and Agriculture 31/10/2009 0.25204666 2.1 27 20 - 30% 211,132.11£ 211,132.11£ 15 Farming and Agriculture 31/10/2009 0.25204670 8.0 27 20 - 30% 796,590.46£ 796,590.46£ 16 Grocery 01/03/2009 0.00 2204673 6.0 20 10 - 20% 722,624.45£ 661,626.63£ 4 Beverage, Food and Tobacco 31/10/2009 0.25204677 8.0 25 20 - 30% 2,226,745.87£ 1,796,547.59£ 15 Farming and Agriculture 31/10/2009 0.25 2204678 4.0 9 0 - 10% 663,527.15£ 427,270.78£ 2 Automobile 31/10/2009 0.25204682 1.5 7 0 - 10% 1,507,130.84£ 1,189,972.07£ 15 Farming and Agriculture 31/10/2009 0.25204684 8.0 37 30 - 40% 65,105.39£ 29,437.05£ 15 Farming and Agriculture 31/10/2009 0.25 2204685 8.0 5 0 - 10% 373,035.44£ 108,623.24£ 28 Retail Stores 31/10/2009 0.25 2
Page 55 of 5730/06/2008

Data By Borrower
Borrower BBG Severity Severity Band RO Outstanding Debt RO Notional Balance
Moody's Industry Sector Moody's Industry Sector Maturity Date Remaining Term (Years) EWL Syndicated
204686 8.0 82 80 - 90% 701,108.92£ 529,269.27£ 22 Machinery (Non-Agriculture, Non-Construction, Non-Electronic) 31/10/2009 0.25 2204688 3.0 15 10 - 20% 2,122,586.50£ 1,899,443.51£ 15 Farming and Agriculture 31/10/2009 0.25204689 5.0 5 0 - 10% 962,066.46£ 428,088.08£ 17 Healthcare, Education and Childcare 31/10/2009 0.25 1204690 4.0 7 0 - 10% 673,938.87£ 673,938.87£ 15 Farming and Agriculture 22/12/2010 1.39204691 8.0 12 10 - 20% 1,608,974.90£ 1,308,974.90£ 17 Healthcare, Education and Childcare 31/10/2009 0.25 2204696 8.0 12 10 - 20% 2,723,309.79£ 2,644,156.09£ 12 Ecological 31/10/2009 0.25204698 8.0 24 20 - 30% 951,893.01£ 945,300.23£ 27 Cargo Transport 31/10/2009 0.25204699 7.0 13 10 - 20% 1,666,100.93£ 1,565,261.85£ 17 Healthcare, Education and Childcare 31/10/2009 0.25204701 6.0 17 10 - 20% 1,762,935.14£ 1,762,935.14£ 18 Home and Office Furnishings, Housewares, and Durable Consumer Products 31/10/2009 0.25204704 5.0 12 10 - 20% 9,566,403.40£ 9,566,403.40£ 17 Healthcare, Education and Childcare 31/05/2010 0.83204705 5.0 14 10 - 20% 2,500,500.00£ 2,500,500.00£ 17 Healthcare, Education and Childcare 13/10/2023 14.20204708 3.0 12 10 - 20% 2,500,000.00£ 2,500,000.00£ 19 Hotels, Motels, Inns and Gaming 13/02/2011 1.53204709 3.0 17 10 - 20% 1,570,885.73£ 1,570,885.73£ 7 Containers, Packaging and Glass 02/10/2023 14.17204710 8.0 29 20 - 30% 498,037.09£ 373,903.63£ 2 Automobile 31/10/2009 0.25 2204711 7.0 15 10 - 20% 2,381,725.54£ 2,381,725.54£ 17 Healthcare, Education and Childcare 23/06/2024 14.89204712 4.0 5 0 - 10% 462,052.07£ 393,131.23£ 10 Diversified/Conglomerate Service 31/10/2009 0.25204714 1.5 9 0 - 10% 777,810.41£ 772,020.41£ 15 Farming and Agriculture 03/12/2009 0.34204718 1.5 8 0 - 10% 2,502,842.91£ 2,477,111.34£ 15 Farming and Agriculture 01/05/2010 0.75204719 1.5 12 10 - 20% 862,709.48£ 862,709.48£ 15 Farming and Agriculture 31/10/2009 0.25204721 2.8 11 10 - 20% 389,689.45£ 389,689.45£ 4 Beverage, Food and Tobacco 30/03/2020 10.66204722 1.5 17 10 - 20% 445,862.50£ 398,654.28£ 15 Farming and Agriculture 31/10/2009 0.25204725 4.0 6 0 - 10% 1,962,506.01£ 1,962,506.01£ 25 Personal, Food and Miscellaneous 14/02/2011 1.54204728 3.0 16 10 - 20% 759,123.97£ 504,623.97£ 15 Farming and Agriculture 19/01/2012 2.47204729 5.0 10 0 - 10% 2,194,118.67£ 2,194,118.67£ 17 Healthcare, Education and Childcare 19/05/2019 9.80204734 4.0 39 30 - 40% 494,861.19£ 494,861.19£ 20 Insurance 31/10/2009 0.25204736 8.0 21 20 - 30% 728,137.92£ 728,137.92£ 15 Farming and Agriculture 01/06/2010 0.83 2204737 8.0 30 20 - 30% 1,595,085.30£ 1,595,085.30£ 21 Leisure, Amusement, Entertainment 31/10/2009 0.25 2204738 8.0 16 10 - 20% 844,047.19£ 716,290.31£ 6 Chemicals, Plastics and Rubber 31/10/2009 0.25 2204739 2.1 11 10 - 20% 506,268.75£ 502,500.00£ 15 Farming and Agriculture 02/03/2010 0.59204741 4.0 10 0 - 10% 2,681,171.46£ 2,681,171.46£ 15 Farming and Agriculture 31/07/2010 1.00204743 7.0 40 30 - 40% 1,094,024.18£ 867,888.25£ 21 Leisure, Amusement, Entertainment 31/10/2009 0.25204745 7.0 24 20 - 30% 4,683,136.44£ 4,681,036.44£ 21 Leisure, Amusement, Entertainment 15/10/2009 0.21204746 7.0 65 60 - 70% 250,000.00£ 250,000.00£ 10 Diversified/Conglomerate Service 31/10/2009 0.25 2204747 3.0 16 10 - 20% 1,485,541.35£ 1,485,541.35£ 19 Hotels, Motels, Inns and Gaming 07/05/2013 3.77204748 8.0 7 0 - 10% 855,665.55£ 855,665.55£ 22 Machinery (Non-Agriculture, Non-Construction, Non-Electronic) 01/06/2010 0.83 2204749 6.0 20 10 - 20% 416,387.95£ 416,387.95£ 21 Leisure, Amusement, Entertainment 13/03/2011 1.62 2204750 5.0 60 50 - 60% 235,882.19£ 235,882.19£ 3 Banking 12/07/2010 0.95204751 3.0 56 50 - 60% 1,880,265.18£ 1,880,265.18£ 26 Printing and Publishing 03/04/2011 1.67204752 7.0 18 10 - 20% 585,761.23£ 585,761.23£ 12 Ecological 18/12/2011 2.38204753 3.0 44 40 - 50% 300,000.00£ 300,000.00£ 28 Retail Stores 18/10/2009 0.21204754 7.0 34 30 - 40% 342,175.05£ 342,175.05£ 10 Diversified/Conglomerate Service 20/04/2011 1.72204758 5.0 83 80 - 90% 180,985.43£ 180,985.43£ 17 Healthcare, Education and Childcare 16/11/2009 0.29204760 6.0 5 0 - 10% 528,850.00£ 528,850.00£ 10 Diversified/Conglomerate Service 31/08/2010 1.08204761 5.0 10 0 - 10% 1,077,555.00£ 1,077,555.00£ 10 Diversified/Conglomerate Service 31/08/2010 1.08204763 6.0 40 30 - 40% 891,500.00£ 891,500.00£ 9 Diversified/Conglomerate Manufacturing 30/06/2010 0.91204764 3.0 46 40 - 50% 1,500,000.00£ 1,500,000.00£ 28 Retail Stores 05/02/2013 3.51204765 4.0 20 10 - 20% 2,700,000.00£ 2,700,000.00£ 28 Retail Stores 11/06/2012 2.86204766 5.0 15 10 - 20% 1,008,000.00£ 981,397.46£ 18 Home and Office Furnishings, Housewares, and Durable Consumer Products 05/01/2012 2.43204767 7.0 60 50 - 60% 1,226,239.08£ 1,226,239.08£ 30 Textiles and Leather 31/10/2009 0.25 3204768 6.0 7 0 - 10% 618,750.00£ 618,750.00£ 23 Mining, Steel, Iron and Non Precious Metals 30/08/2012 3.08204770 6.0 16 10 - 20% 9,100,000.00£ 9,100,000.00£ 7 Containers, Packaging and Glass 11/03/2013 3.61204771 4.0 8 0 - 10% 36,066,670.54£ 24,500,000.00£ 19 Hotels, Motels, Inns and Gaming 25/05/2012 2.82 Y204772 6.0 35 30 - 40% 863,656.19£ 863,656.19£ 18 Home and Office Furnishings, Housewares, and Durable Consumer Products 19/08/2019 10.05 2204775 6.0 19 10 - 20% 671,650.00£ 671,650.00£ 5 Buildings and Real Estate 31/10/2009 0.25204779 8.0 14 10 - 20% 3,994,718.31£ 3,994,718.31£ 5 Buildings and Real Estate 31/10/2009 0.25 2204785 7.0 23 20 - 30% 738,960.00£ 738,960.00£ 5 Buildings and Real Estate 29/10/2009 0.24204786 3.0 33 30 - 40% 1,339,157.13£ 1,339,157.13£ 5 Buildings and Real Estate 31/10/2009 0.25204788 8.0 9 0 - 10% 1,085,000.00£ 1,085,000.00£ 5 Buildings and Real Estate 31/10/2009 0.25 3204790 5.0 11 10 - 20% 841,564.66£ 563,059.75£ 5 Buildings and Real Estate 31/10/2009 0.25204791 6.0 35 30 - 40% 1,250,598.25£ 1,250,598.25£ 5 Buildings and Real Estate 18/12/2009 0.38 2204794 5.0 9 0 - 10% 1,637,824.89£ 1,615,324.89£ 5 Buildings and Real Estate 31/10/2009 0.25204795 8.0 17 10 - 20% 1,154,412.66£ 976,825.26£ 5 Buildings and Real Estate 31/10/2009 0.25 2204798 1.5 5 0 - 10% 1,000,000.00£ 1,000,000.00£ 5 Buildings and Real Estate 31/10/2009 0.25204800 4.0 11 10 - 20% 250,000.00£ 250,000.00£ 5 Buildings and Real Estate 31/10/2009 0.25204805 5.0 14 10 - 20% 600,675.00£ 595,600.00£ 5 Buildings and Real Estate 31/10/2009 0.25
Page 56 of 5730/06/2008

Data By Borrower
Borrower BBG Severity Severity Band RO Outstanding Debt RO Notional Balance
Moody's Industry Sector Moody's Industry Sector Maturity Date Remaining Term (Years) EWL Syndicated
204807 8.0 19 10 - 20% 1,012,826.80£ 1,012,826.80£ 5 Buildings and Real Estate 31/10/2009 0.25 2204809 6.0 9 0 - 10% 886,587.21£ 883,837.21£ 5 Buildings and Real Estate 31/10/2009 0.25204812 5.0 24 20 - 30% 1,750,000.00£ 1,750,000.00£ 5 Buildings and Real Estate 31/10/2009 0.25204820 4.0 74 70 - 80% 874,996.00£ 874,996.00£ 6 Chemicals, Plastics and Rubber 11/01/2020 10.44204821 8.0 26 20 - 30% 786,574.39£ 731,868.80£ 18 Home and Office Furnishings, Housewares, and Durable Consumer Products 31/10/2009 0.25 2204822 5.0 7 0 - 10% 794,215.56£ 599,826.12£ 21 Leisure, Amusement, Entertainment 31/10/2009 0.25204823 4.0 6 0 - 10% 872,428.27£ 849,678.18£ 28 Retail Stores 01/05/2010 0.75204824 3.0 16 10 - 20% 838,583.88£ 637,850.17£ 15 Farming and Agriculture 31/10/2009 0.25204825 7.0 35 30 - 40% 1,087,450.00£ 1,087,450.00£ 18 Home and Office Furnishings, Housewares, and Durable Consumer Products 24/04/2025 15.73204830 4.0 24 20 - 30% 416,470.41£ 398,215.42£ 10 Diversified/Conglomerate Service 31/10/2009 0.25204832 5.0 16 10 - 20% 1,350,686.14£ 1,350,686.14£ 21 Leisure, Amusement, Entertainment 01/12/2013 4.33204833 8.0 19 10 - 20% 1,005,000.00£ 1,005,000.00£ 21 Leisure, Amusement, Entertainment 04/09/2024 15.09204834 8.0 25 20 - 30% 447,014.93£ 254,284.00£ 2 Automobile 31/10/2009 0.25 2204838 6.0 18 10 - 20% 335,387.52£ 335,387.52£ 10 Diversified/Conglomerate Service 31/10/2009 0.25204839 8.0 49 40 - 50% 559,990.04£ 559,990.04£ 28 Retail Stores 08/12/2012 3.35204840 8.0 13 10 - 20% 5,377,749.74£ 5,337,374.74£ 17 Healthcare, Education and Childcare 31/10/2009 0.25204842 8.0 19 10 - 20% 1,452,841.03£ 1,422,094.98£ 27 Cargo Transport 21/06/2015 5.89 2204845 4.0 14 10 - 20% 567,719.06£ 567,719.06£ 27 Cargo Transport 08/01/2016 6.44204846 4.0 12 10 - 20% 756,180.18£ 756,180.18£ 22 Machinery (Non-Agriculture, Non-Construction, Non-Electronic) 29/07/2015 5.99204848 6.0 17 10 - 20% 750,314.22£ 474,890.43£ 11 Diversified Natural Resources, Precious 16/04/2015 5.71204851 6.0 21 20 - 30% 762,000.00£ 762,000.00£ 16 Grocery 28/01/2019 9.49204852 5.0 23 20 - 30% 4,893,121.98£ 4,893,121.98£ 17 Healthcare, Education and Childcare 20/10/2023 14.22204853 2.5 10 0 - 10% 2,058,513.69£ 2,058,513.69£ 17 Healthcare, Education and Childcare 30/11/2015 6.33204856 8.0 62 60 - 70% 1,052,788.61£ 1,021,394.99£ 25 Personal, Food and Miscellaneous 11/04/2014 4.69 2204857 8.0 14 10 - 20% 1,107,914.38£ 1,064,089.39£ 25 Personal, Food and Miscellaneous 17/09/2014 5.13 1204858 6.0 18 10 - 20% 518,217.72£ 518,217.72£ 16 Grocery 24/05/2016 6.81204860 3.0 15 10 - 20% 1,043,102.59£ 651,086.35£ 15 Farming and Agriculture 01/06/2010 0.83204862 8.0 15 10 - 20% 510,023.70£ 510,023.70£ 27 Cargo Transport 06/09/2016 7.10 2204868 4.0 11 10 - 20% 20,880,000.00£ 20,880,000.00£ 17 Healthcare, Education and Childcare 23/07/2012 2.98
Page 57 of 5730/06/2008