
GPR- 93 FC Dr. MCRHRDI 11 Sep-14 Sep 2019
56
GPR- 93 FC Dr. MCRHRDI 11 Sep-14 Sep 2019
Transcript of GPR- 93 FC Dr. MCRHRDI 11 Sep-14 Sep 2019
GPR- 93 FC
Dr. MCRHRDI
11 Sep-14 Sep
2019


Essential questions to be asked for Transformation
Why do we transform?
What do we need to transform?
When should we begin?

Are we ready for the transformation ?
• Transformation Plan- a Framework to work on
• Is the Infrastructure ready for transformation
• Organizational readiness
• Readiness factors

Slide 5
Problem Statement
The Problem is that
we are governing in the 21st century
with Processes and Organizations
designed in the 19th Century
to work well in the 20th Century!
We need entirely different
PROCESSES & ORGANIZATIONS
for Governance in the 21st Century
Slide Courtesy : J Satyanarayana, on BPR
Slide 6
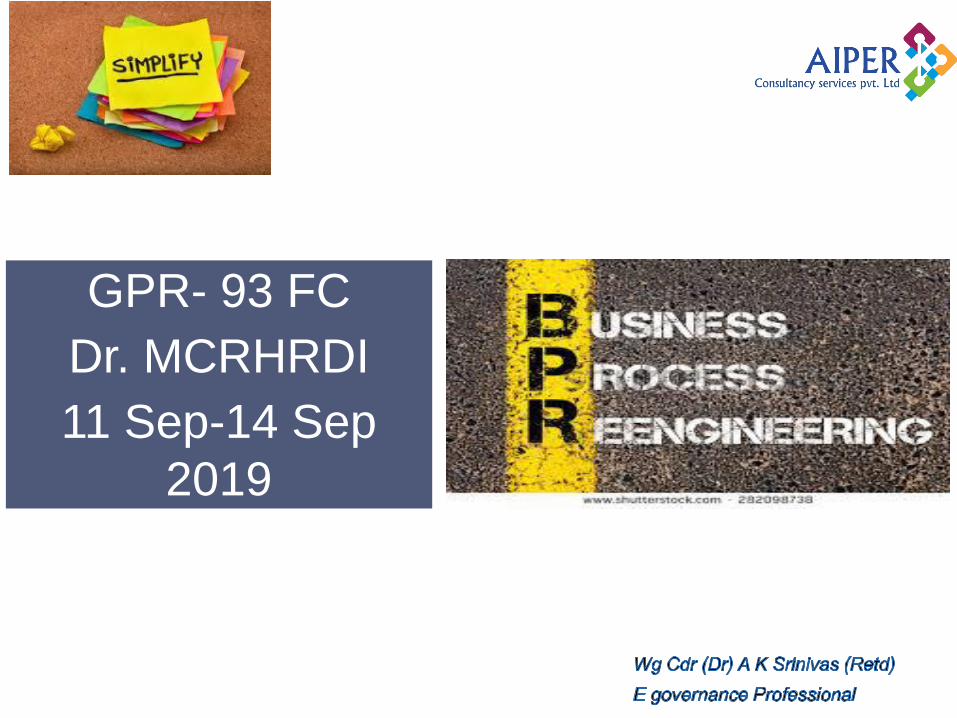
Root Cause
Legislative Intent Process Problems Delivery Channel
Problems Delivery Problems
• Legislation was well
intentioned and
relevant at the time it
was drafted
• Focused more on
control and
ensuring
compliance, rather
than service delivery
• Rules added along
the way, making the
legal framework
complex and
tedious
• Asking for too much
information
• Burden of proof
thrown on Citizen
• Complexity of rules
& regulations
(Anything to do with
money is more
complex!)
• Heavy reliance on
manual systems
• No concept of
Quality Assurance
• Jurisdiction (too many
‘narrow domestic
walls!’)
• Restricted timings
• Disparate and sub-
optimal delivery
networks
• No choice of
delivery channels
• Process & Delivery
Channel often
combined resulting
in delay, malpractice
• Mindset & attitudinal
problems
• Delivery Agents
unsuitable
• Lack of empowerment
of front-end people
• Lack of dedicated
delivery teams
• Delivery is handled on
a part-time basis
• Lack of service
levels, measurement
systems

Slide 7
Launched on 02 Jul 2015
To connect Rural India
with High speed internet
and to improve digital
Literacy

Slide 8
In Line
On Line

Slide 9
Our country -Today
• Islands of work noticed
• NeGP 1.0
• e Kranti- NeGP 2.0
• Awareness and Understanding not complete
• IT Act 2000/ 2008
• Number of projects in India
• Number of players- SI’s and Consultants
• Capacity Building programmes
• Reinvention of wheel
• Tight RFP’s
• Scope creep

Slide 10
Joined Up Services
• Transformation of governance
• Mind boggling exercise
• Join up vertically, Horizontally and Functionally.
Technology; Legislation; Process; Standard
Formats
Joined up at Front end; joined up at Middle level
and joined up at Back end.

Slide 11
New Paradigm shift
• Enterprise Architecture- e Pragati
−35 Depts,315 agencies,745 services
−4 waves, 14 packages, 72 projects
• Modular way of doing things
Important Question
Solution lies in
• Organization Culture, Governance Hierarchy,
Process Reengineering and Change Management
Slide 12
Government Processes – Unique Attributes
• Processes are usually derived from the underlying
set of laws and regulations
• Compliance and control requirements are higher
than in business processes, due to increased
levels of accountability and need for transparency
• Changing processes radically might take longer
timeframe than in business processes, as it may
require legal & regulatory changes

Slide 13
Defining Business Process Reengineering
(BPR)
• BPR is fundamental rethinking and radical redesign of
business processes to achieve dramatic improvements in
critical, contemporary measures of performance, such as cost,
quality, service and speed
Michael Hammer and James Champy
− ‘Changing’/’redesigning’/’replacing’/’eliminating’ the activities and/or sub-
processes and/or processes related to a service to improve service quality
i.e.
• Minimize Time, Cost, Complexity
• Improve Transparency, Convenience and Experience
− GPR may address all or some of the service quality attributes
− Government Process Re-engineering (GPR) has evolved from applying
Business Process Re-engineering (BPR) concepts to Government Services
Slide 14
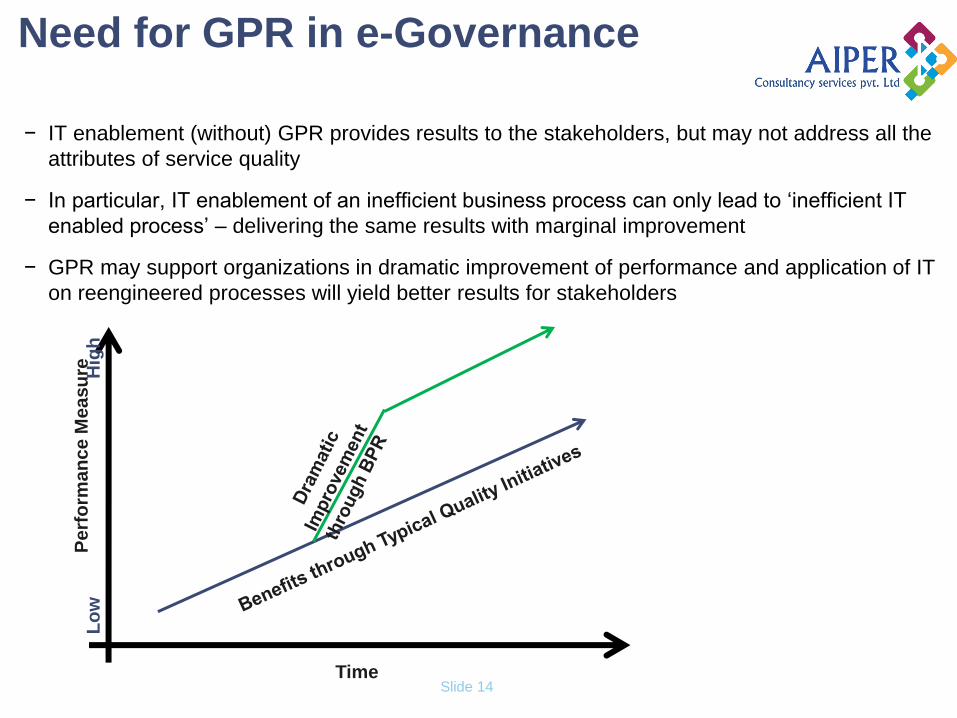
Need for GPR in e-Governance
− IT enablement (without) GPR provides results to the stakeholders, but may not address all the
attributes of service quality
− In particular, IT enablement of an inefficient business process can only lead to ‘inefficient IT
enabled process’ – delivering the same results with marginal improvement
− GPR may support organizations in dramatic improvement of performance and application of IT
on reengineered processes will yield better results for stakeholders
Pe
rfo
rma
nc
e M
ea
su
re
Hig
h
Lo
w
Time
Slide 15
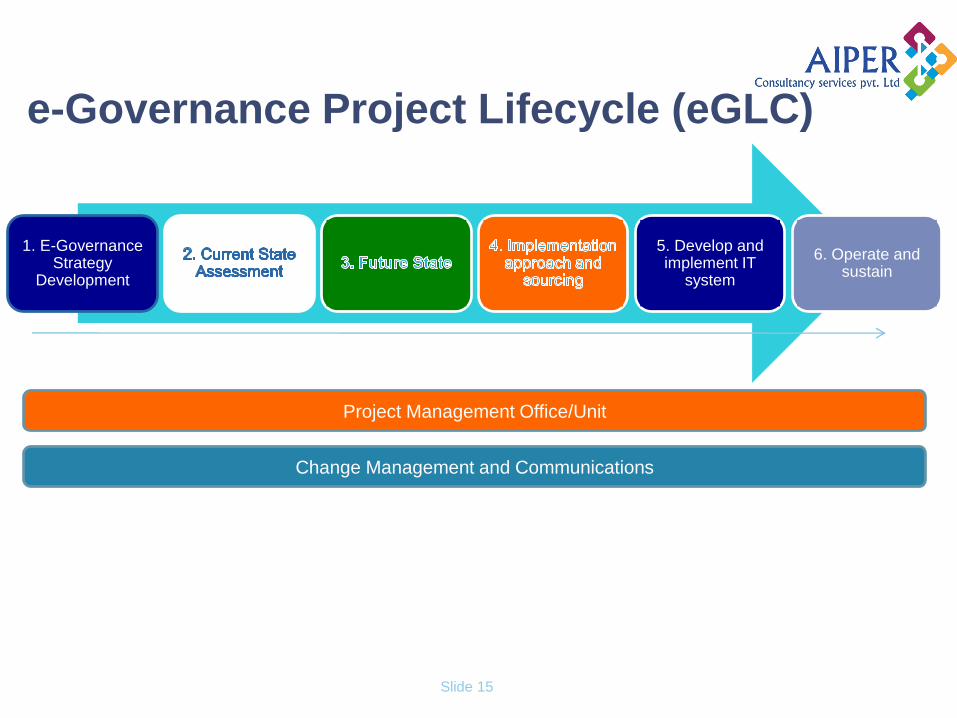
e-Governance Project Lifecycle (eGLC)
1. E-Governance Strategy
Development
5. Develop and implement IT
system
6. Operate and sustain
Project Management Office/Unit
Change Management and Communications

Slide 16
e-Governance Project Lifecycle (eGLC)
E-Governance Strategy
Development
Develop and implement T
system
Operate and sustain

Slide 17
Approach to GPR
Problem Identification and Definition
Define vision and objectives
for GPR
Process Study and
Documentation
Process Analysis
Analysis of citizen grievances
& complaints and pro-active
Voice of Customer surveys
Analysis of issues raised
Identification of problem and
defining unambiguous
problem statements
Problem
Identification
and Definition
Slide 18
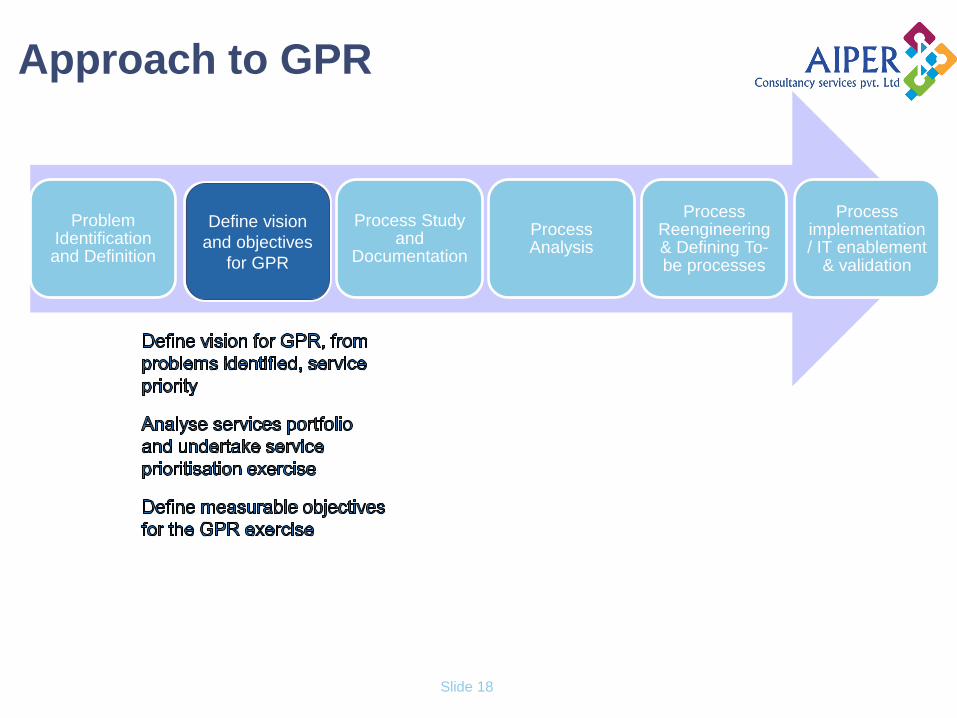
Approach to GPR
Problem Identification and Definition
Define vision and objectives
for GPR
Process Study and
Documentation
Process Analysis
Process Reengineering & Defining To-be processes
Process implementation / IT enablement
& validation
Define vision
and objectives
for GPR

Slide 19
Approach to GPR
Problem Identification and Definition
Define vision and objectives
for GPR
Process Study and
Documentation
Process Analysis
Process Reengineering & Defining To-be processes
Process implementation / IT enablement
& validation
Process Study
and
Documentation
Slide 20
Process re-engineering is a necessity
Registration of land
Provision of certificates
Mutation of titles
Knowing your farmers and providing subsidies
Carrying out health programmes
Tourism
Revenue
Urban and Rural Municipal Administration
Slide 21
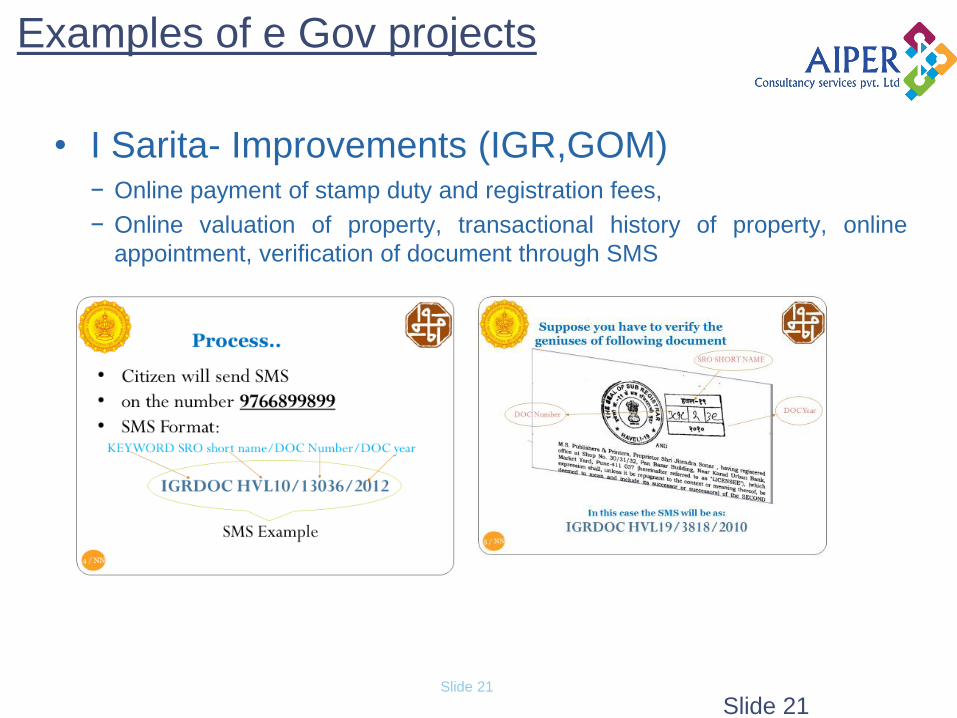
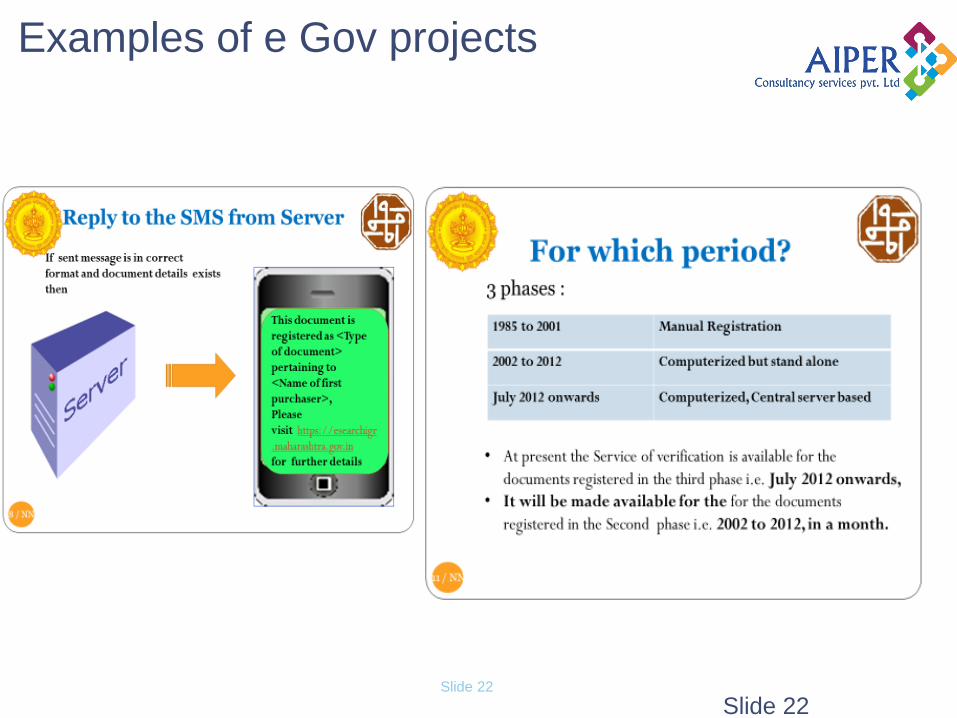
Examples of e Gov projects
• I Sarita- Improvements (IGR,GOM) − Online payment of stamp duty and registration fees,
− Online valuation of property, transactional history of property, online
appointment, verification of document through SMS
Slide 21
Slide 22
Slide 22
Examples of e Gov projects

Slide 23
Examples of e Gov projects
e Pass- Re-engineering + Improvements (Dept of Social Welfare,
GOAP)
A comprehensive e-Governance Project Transforms the paradigm of scholarship administration
Envisages changed roles of departments
G2C; G2B; G2G
Integrates complex operations of different departments: Welfare, Education,
Treasury & Banks
Assistance given to all communities to pursue post Intermediate courses Scheduled Caste – Social Welfare Department
Scheduled Tribe – Tribal Welfare Department
Backward Class – BC Welfare Department
Disabled groups – Women & Child Welfare Department
Economically Backward Classes: BC Welfare Department
Minorities – Minority Welfare Department
Large volume disbursement – 26.00 Lakh Students; Rs. 3,700 Crores/year
Social Welfare Department is the Nodal Agency

Slide 24
Examples of e Gov projects
e BRC (Part of eTrade)
One of the main compliances required from exporters in implementing the Foreign
Trade Policy and its various Export Promotion schemes, is to realize foreign
exchange against the exports made as per the stipulated guidelines and time
frame of the Reserve Bank of India (RBI).
The major stake holders of this project are:
Foreign Trade Regulatory/Facilitating Agencies like Customs, Directorate General
of Foreign Trade (DGFT)
Seaports, Airports
Container Corporation of India (CONCOR)
Inland container Depots (ICDs)
Container Freight Stations (CFSs)
Banks
Importers/Exporters
Custom House Agents (CHA’s)
Airlines/Shipping lines
Directorate General of Commercial Intelligence and Statistics (DGCIS).
Inter-Organizational
Transformation
Adoption of Standards
Leadership
Change Management
Process
convergence
Slide 25
Process Redesign Example
Integrated Land Information System in AP
• In erstwhile Andhra Pradesh (as in most other states), the maintenance of
records/information relating to land and property ownership is done under the auspices of
four different departments:
Survey and Land Records Department, which conducts cadastral surveys and
creates and maintains basic records for each village
The Revenue Department which administers Land Records by way of updating of
titles
The Registration Department, which undertakes registration of deeds pertaining to
transactions of land involving sale, purchase, gift etc
The Urban and Rural Local Bodies, which maintain ownership information
necessary to collect property taxes, and undertake planning and developmental
activities within Panchayat and municipal towns.
• This situation led to a lot of hardships to citizens planning to get their property
transactions legalized…

Slide 26
A case of non-continuous flow…
• The complete process of property transaction involved visits to
different departments…
Buyer obtains encumbrance certificate from Registration
department to check previous transactions on property
Registration of property deed at the Registration
department and obtaining proof of transaction
Changing of ownership at Land Title Office after buyer
produces proof of transaction
Sub-division and boundary information recording by Land
Surveyor
• In many cases, one or more steps are not completed resulting in
records being out of sync

Slide 27
Completing a process in a continuous flow
helps reduce turnaround time significantly

Slide 28
Existing System – Land Transactions
Buyer & Seller
Complete
Documents
Pay fees
Submit Appln.
Registration of deeds
Verify and change records
Buyer & Seller
Buyer Complete
application
Submit
Appln for
Mutation.
Verify documents and register
Buyer
Submit
Appln for
Sub-division
Complete
appl.
Land Title Office
Sub-divide the parcel and change records
Land Surveyor
Buyer
Buyer
Buyer gets proof of transaction
Buyer gets ownership records
Buyer gets boundary info.
Cannot / need
not verify
ownership

Slide 29
Issues with the current process
• A large number of survey records (field maps) were missing and many were in poor
condition rendering them unusable
• Delays in updating of survey and ownership records, leading to records not in
synchronization with the correct picture on ground
• Resurveys not conducted for long periods (more than 40 years) rendering survey
records obsolete
• Registration process does not have legal obligation to check ownership resulting in
fraud transactions
• Property valuation process not scientific
• Revenue department records relate only to agricultural land. Property tax registers
used as proof of ownership in urban areas
• Change of records in one entity not necessarily reflected in the other entities,
resulting lack of a holistic view

Slide 30
Process Re-design objectives
• To provide a single source of truth for land records which is secure & enjoys public confidence
• Deliver all land related services through a dedicated agency which will also maintain the land
records system
• Maintain all records in integrated digital form in a central repository
• Maintain and disseminate authentic and real-time land related information to assist in
developmental planning, welfare activities and levy of land related taxation
• Implement systems & processes for maintenance & auto-updating of data
• Have a self sustaining operating model
• Provide services in a cost effective manner with easy accessibility
• Provide services to the customers through a unified interface, which requires only a single visit
by the citizen
• Provide a transparent property valuation system that will help in better property assessment

Slide 31
Creating a single source of truth for land
records…
Arial Photography
Bromide Prints & DEM
Ortho Rectification
Demarcation of Boundaries
Publish Provisional
Register of Titles
Link LPM with owner
Generation of Land Parcel Map
Title Enquiry
Disputes Settlement
Publish Final Register of
Titles
Final Register of Titles
Creating a single source of truth for all land related information (ownership, extent etc) is
the first step in providing integrated service delivery…

Slide 32
ILIS – Re-engineered Scenario
TRANSFORMATION
Survey
DepartmentSurvey & Land
Records
Departmet
Registration &
Stamps Dept.
Stakeholder
Presumptive Ownership
of Property
Inter - departmental
co-ordination
issues
Need to approach four
different entities for
property services
Poor state of
existing records &
services
Conveyance
Sub-division
Information Search
Ownership
Land use
Graphical
Market Valuation
Value Added
Services
Citizen
Business
Integrated Land Information System (ILIS)
Ownership
Info
Graphical
record
Land Use
Info
Geodetic
Network
Other Info
Layers
Integrated Land Information
Repository
Web Based
Service
Provider
ILIS Office
Stakeholders Services Delivery Channels
Local Bodies
Revenue
Department
Current Situation
Govt.

Slide 33
Re-designed process for ILIS
• Single visit by buyer and seller to the agency dedicated for
property transactions
• Conclusive and unambiguous ownership
• Real time update of all information related to the
transaction in the system
• Provision of information services as self service to citizens:
− Encumbrance search
− Property value calculation from guidance rates
• Better realization of taxes by government agencies, Urban
Local Bodies
• The process which took days previously, is completed in a
single day…
This is a perfect
example for use of
technology in process
re-design (Arial
photography, GPS
based surveys, single
shared database..)
Slide 34
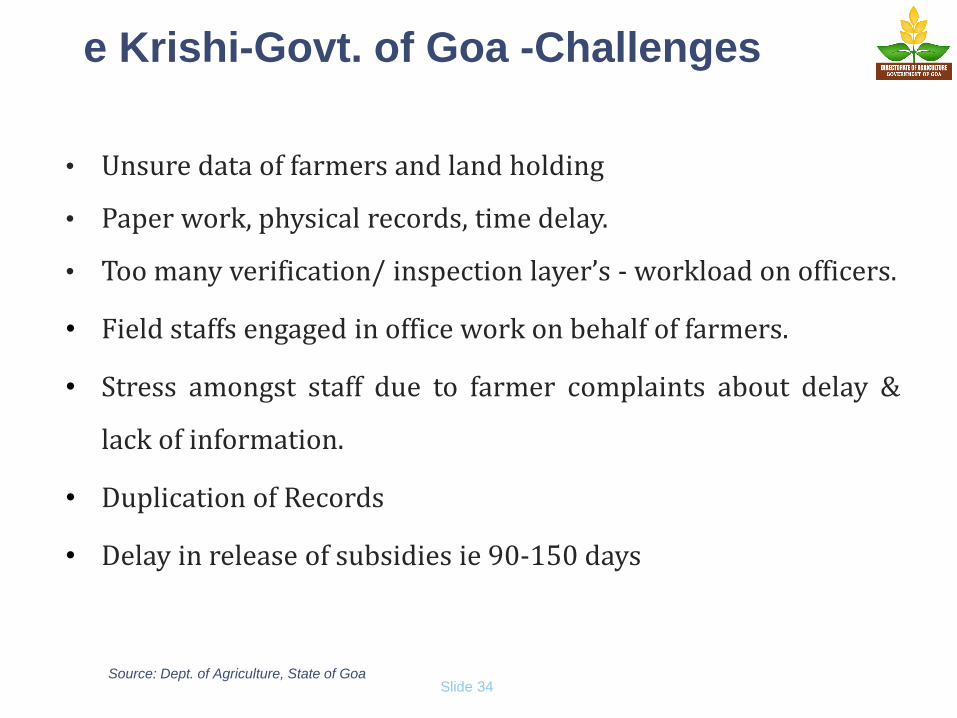
e Krishi-Govt. of Goa -Challenges
• Unsure data of farmers and land holding
• Paper work, physical records, time delay.
• Too many verification/ inspection layer’s - workload on officers.
• Field staffs engaged in office work on behalf of farmers.
• Stress amongst staff due to farmer complaints about delay &
lack of information.
• Duplication of Records
• Delay in release of subsidies ie 90-150 days
Source: Dept. of Agriculture, State of Goa
Slide 35
Solution to overcome the challenges
• Launch of 1st phase of e-Krishi application in May 2013
• One time registration of farmers of Goa and providing them with a
smart card viz KRISHI CARD
• Re-engineer the internal processes of the department to make
them leaner, simpler, and standardised all the process across
schemes.
Source: Dept. of Agriculture, State of Goa

Slide 36
Krishi Card Extract
Source: Dept. of Agriculture, State of Goa
Slide 37
Parivartan-Process Re-engineering
• The department officials understood first hand the necessity of GPR.
• All the processes were comprehensively studied
• Created As-Is Maps and vetted by GPR Consultant and re-designed
the To-Be processes by eliminating the bottlenecks
• Eliminated every time requirement of the 25- pages documents from farmer.
• The cost of delivery of service has also reduced by 1/ 3 rd
• The applicant file was physically scrutinized at 12 levels with 60 touch points with a average of TAT of 60-120 days. This was re-engineered and now there are 8 touch points and the number of days reduced to 35 days.
Source: Dept. of Agriculture, State of Goa
Slide 38
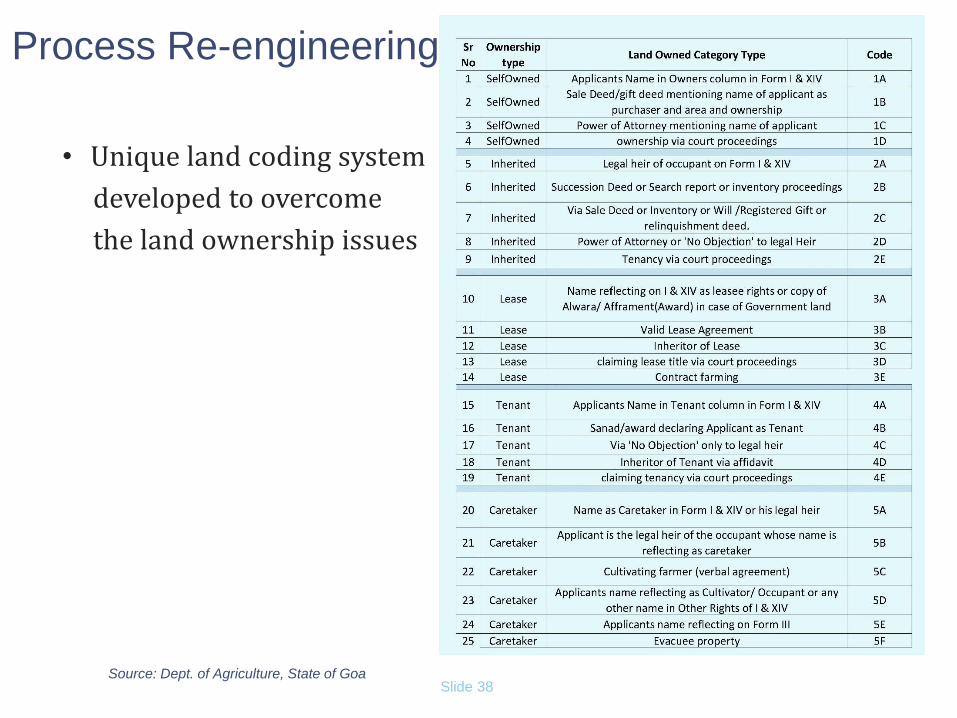
Process Re-engineering
• Unique land coding system
developed to overcome
the land ownership issues
Source: Dept. of Agriculture, State of Goa
Slide 39
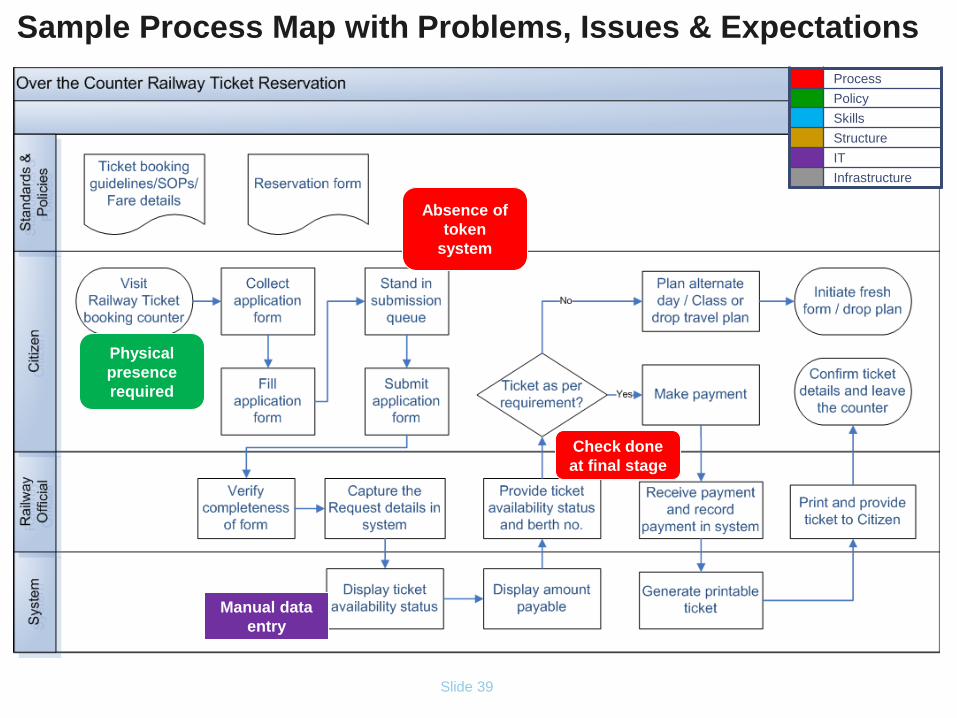
Sample Process Map with Problems, Issues & Expectations
Process
Policy
Skills
Structure
IT
Infrastructure
Check done
at final stage
Manual data
entry
Absence of
token
system
Physical
presence
required
Slide 40
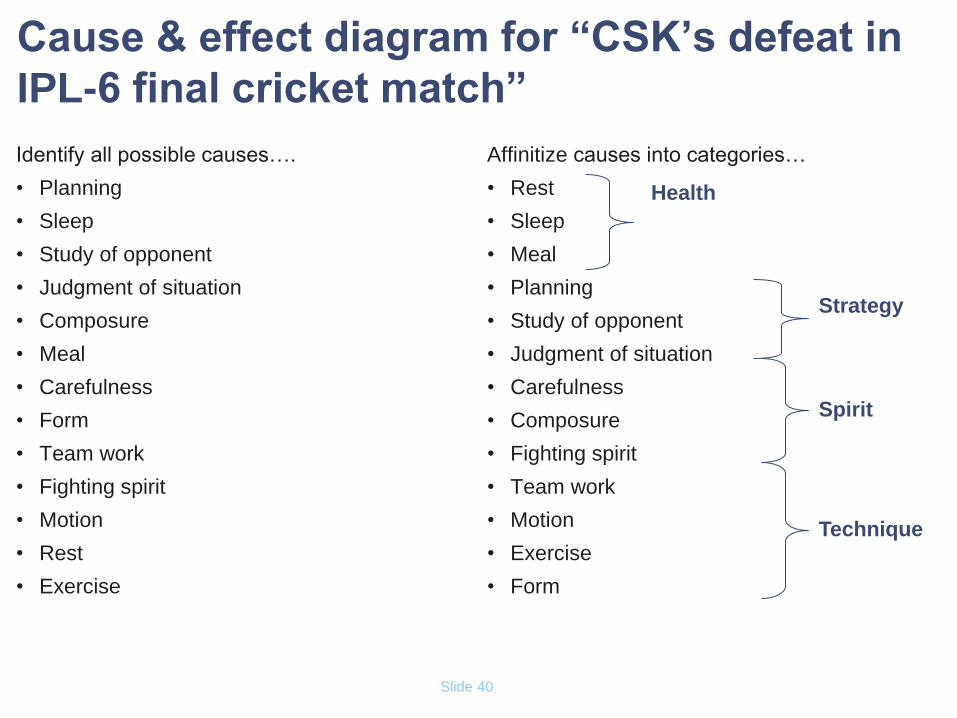
Cause & effect diagram for “CSK’s defeat in
IPL-6 final cricket match”
Identify all possible causes….
• Planning
• Sleep
• Study of opponent
• Judgment of situation
• Composure
• Meal
• Carefulness
• Form
• Team work
• Fighting spirit
• Motion
• Rest
• Exercise
Affinitize causes into categories…
• Rest
• Sleep
• Meal
• Planning
• Study of opponent
• Judgment of situation
• Carefulness
• Composure
• Fighting spirit
• Team work
• Motion
• Exercise
• Form
Health
Strategy
Spirit
Technique
Slide 41
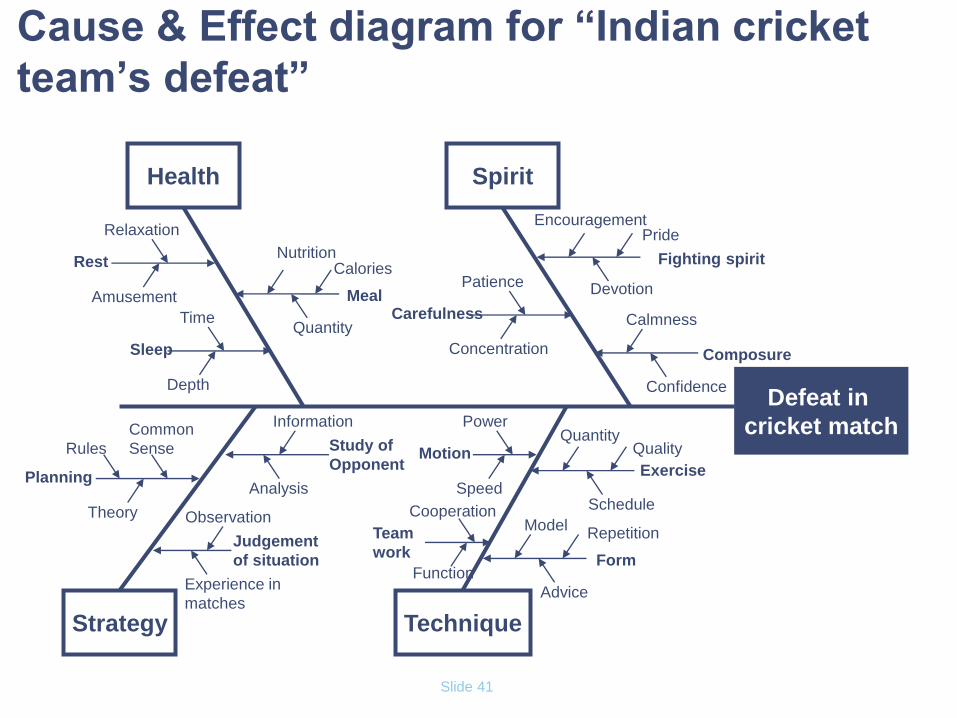
Defeat in
cricket match
Spirit Health
Technique Strategy
Planning
Rules
Theory
Common
Sense
Composure
Confidence
Calmness Carefulness
Concentration
Patience Meal
Calories
Quantity
Nutrition Rest
Amusement
Relaxation
Sleep
Depth
Time
Study of
Opponent
Information
Analysis
Judgement
of situation
Observation
Experience in
matches
Fighting spirit
Pride
Devotion
Encouragement
Exercise
Quality
Schedule
Quantity
Form
Repetition
Advice
Model Team
work
Cooperation
Function
Motion
Power
Speed
Cause & Effect diagram for “Indian cricket
team’s defeat”

Slide 42
Brainstorming tool – 5 Whys approach
• The 5 Whys is a question-asking method used to explore the cause / effect
relationships underlying a particular problem
• Used to come up with the root causes for the problem at hand
• Continue asking Why till you get to a root cause (need not necessarily be at the 5th
Why…)
• Continue with the 5 whys process till all the possible root causes are covered

Slide 43
5 Whys approach – Example 1
• The following example demonstrates the basic process of 5 Whys:
• My car will not start. (the effect)
− Why? - The battery is dead. (first why)
− Why? - The alternator is not functioning. (second why)
− Why? - The alternator belt has broken. (third why)
− Why? - The alternator belt was well beyond its useful service life and has never
been replaced. (fourth why)
− Why? - I have not been maintaining my car according to the recommended
service schedule. (fifth why, a root cause)
− Why? - Replacement parts are not available because of the extreme age of my
vehicle.(sixth why, optional footnote)
Slide 44
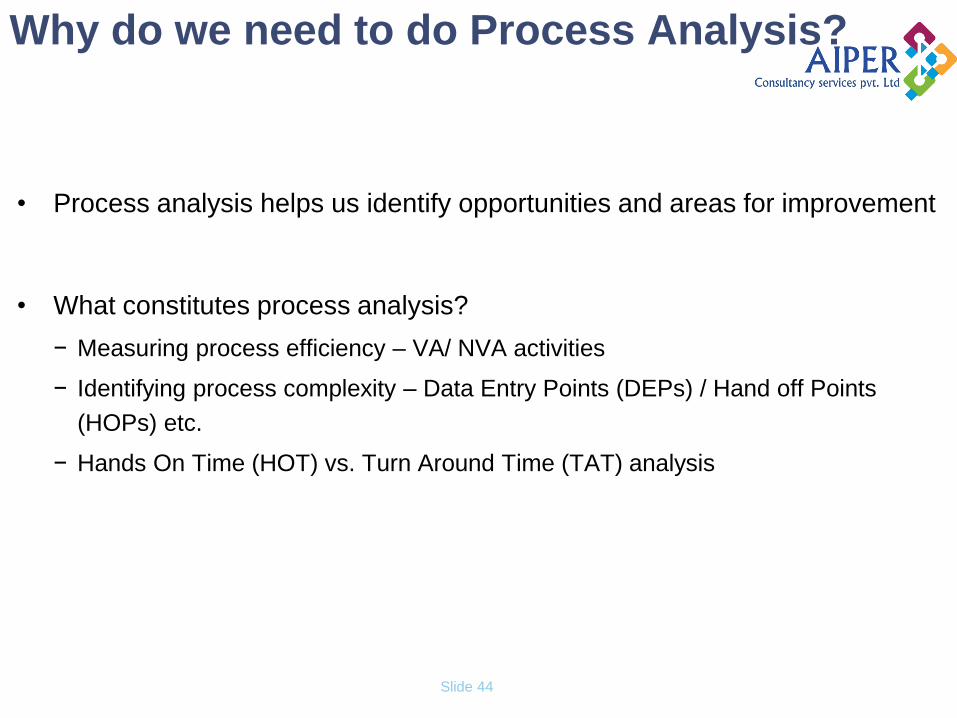
Why do we need to do Process Analysis?
• Process analysis helps us identify opportunities and areas for improvement
• What constitutes process analysis?
− Measuring process efficiency – VA/ NVA activities
− Identifying process complexity – Data Entry Points (DEPs) / Hand off Points
(HOPs) etc.
− Hands On Time (HOT) vs. Turn Around Time (TAT) analysis

Slide 45
Classifying process activities in VA/ NVA
• An activity that provides the process with no competitive advantage and
which can be discarded without influencing the final outcome
− It includes any of the following activities – rework, multiple signatures, counting,
handling, checking, inspecting, transporting, down-time, delaying, storing
• e.g.: Standing in queue to submit an application form
Getting ready to perform a task / Prepare to do work
Moving people, information and/or things from one location to
another
Ensuring a task was performed correctly / Checking / Reviewing
Rework; unnecessary or duplicate performance of a task
Preparation P
I
Transport /
Handling
Inspect ion /
Verification
Redundancy /
Duplication
Slide 46
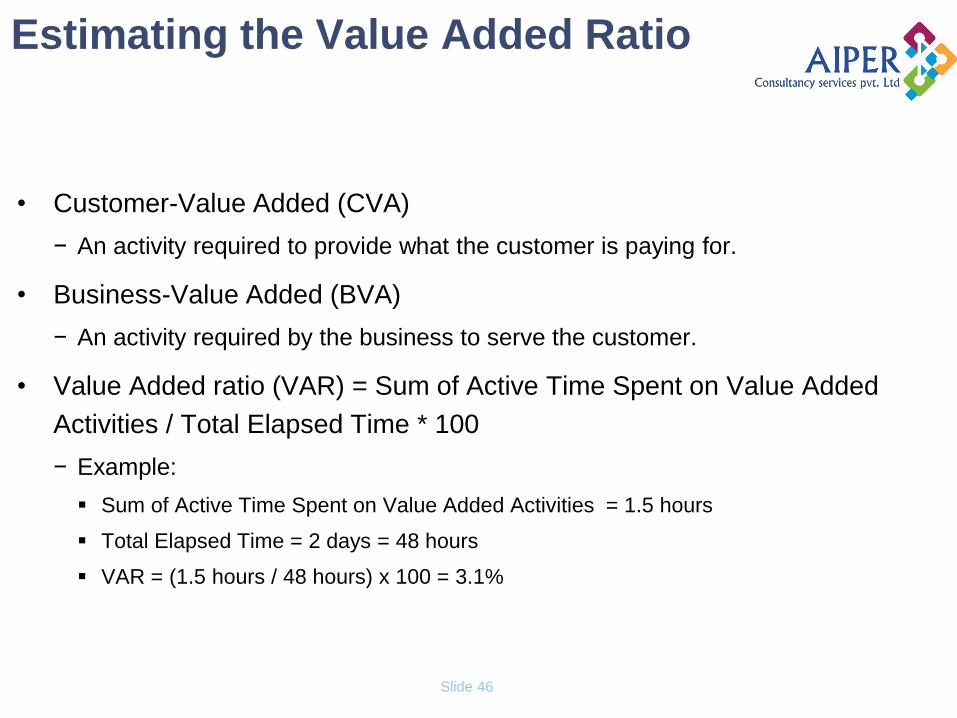
Estimating the Value Added Ratio
• Customer-Value Added (CVA)
− An activity required to provide what the customer is paying for.
• Business-Value Added (BVA)
− An activity required by the business to serve the customer.
• Value Added ratio (VAR) = Sum of Active Time Spent on Value Added
Activities / Total Elapsed Time * 100
− Example:
Sum of Active Time Spent on Value Added Activities = 1.5 hours
Total Elapsed Time = 2 days = 48 hours
VAR = (1.5 hours / 48 hours) x 100 = 3.1%

Slide 50
Process complexity analysis
• Facilitates identification of those elements in the process that can be
eliminated
• Process Complexity Analysis documents the following:
− Number of data entry points (DEP)
− Number of hand-off points (HOP)
− Number of systems used
• More number of DEPs, HOPs and systems indicate a complex process

Slide 51
HOT & TAT
• HANDS ON TIME (HOT)
− The time during which material or information is actually handled or action is
taken on them in a process for changing its shape or form
• Turn around time (TAT)
− The total time taken for material or information to move across in a process from
the start point to the end point
• TAT = HOT+ Queue time + Changeover time(if any) + transportation time
• Time other than HOT can be focused upon for improvement
Slide 52
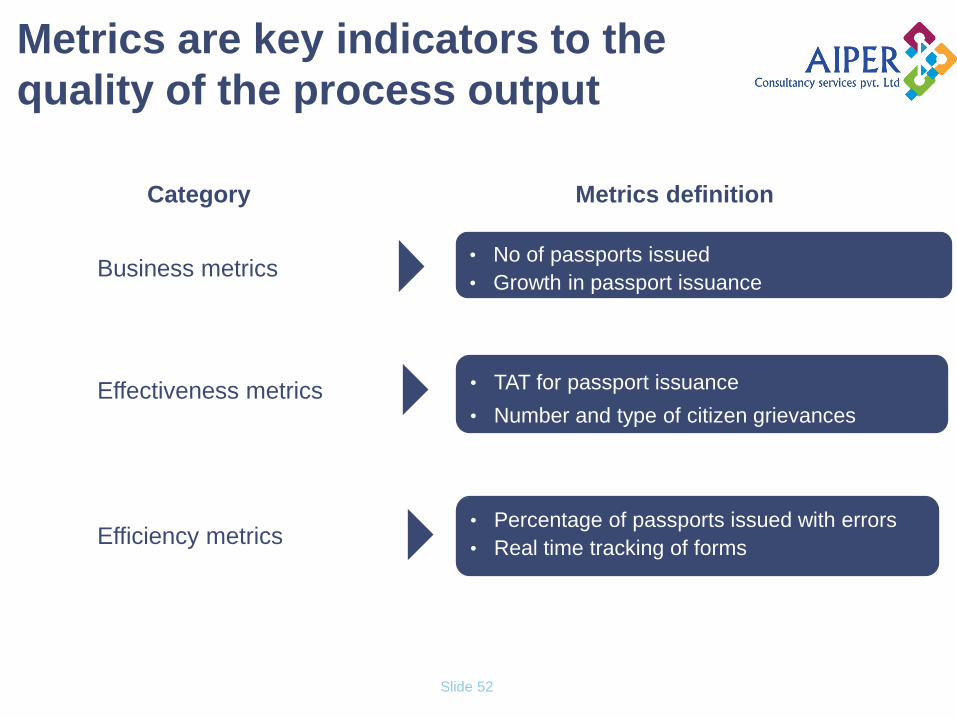
Metrics are key indicators to the
quality of the process output
Business metrics
Effectiveness metrics
Efficiency metrics
• No of passports issued
• Growth in passport issuance
• TAT for passport issuance
• Number and type of citizen grievances
• Percentage of passports issued with errors
• Real time tracking of forms
Category Metrics definition

Slide 53
Redesigning existing processes
• The main objective of redesign is to improve performance measures – CTPs and
CTQs identified during the process mapping phase
• Redesign can be carried out by looking at the following items identified during
process analysis:
Redundancies
Duplications
Inefficiencies
Bottlenecks
Unnecessary activities
Non value-adding activities
• Redesign should take into account legal issues, IT / Technology opportunities and
organizational constraints of the process

Slide 54
Some principles of process re-design
• Eliminate waste or non-value added activities as much as possible
• Organise around outcomes - treat geographically dispersed resources as though
centrally located
• Build quality in at the source - mistake proof the process, standardize on best
practices, capture information in digital form at the source
• Find opportunities to cross train and use multifunctional workers
• Reduce preparation and waiting times
• Use parallel processing
• Apply automation and appropriate technologies
• Use visual process control systems
• Establish a continuous improvement capability and mindset

Slide 55
Hierarchy of Domain Legislation
Constitution
Laws enacted by Parliament, State and
UT Legislatures
Subordinate Legislation
(Rules, Regulations, Codes, by-laws made by authorities identified
and delegated in the law) E
ase o
f M
odific
ation
Laws are enacted by Central
or State government
depending on whether State /
Central subject
Subordinate legislation
enacted by authorities
identified under the law
Manuals, Guidelines etc (advisory status, based on
Laws and subordinate legislation)

Slide 56
Incorporating legal changes
Undertake GPR Amend Laws to bring in enabling provisions
Amend sub-ordinate legislation to
incorporate specific changes

Slide 57
Managing People Change

Slide 58
Almost 92 % of the challenges in a transformation
exercise are around people issues
• Lack of Participation
•Ineffective Communication
• Lack of ownership
• Limited endorsement/ support
• Poor planning & Control
• Lack of involvement
• Lack of Readiness
• Lack of understanding
• Lack of strategic alignment
• Fear of Job loss/Change
• Inadequate Skill development/
Training / Lack of resources
• Unclear Roles and Responsibilities
• Lack of user buy-in
• Weak / inadequate processes
• Poor process alignment
• Faulty data
• Faulty data
• Integration Issues
• Configuration Issues
• Over complex technology
Leadership 42%
Organizational &
Cultural Issues 27%
User Issues 23%
People
Process
Technology
Process Issues 4%
Technology Issues 4%