Government of the Cooperative Republic of Guyana in ...
41
Government of the Cooperative Republic of Guyana in Partnership with UNICEF Knowledge Attitude and Practice (KAP) Survey - COVID-19 Response in Guyana Report May 2020
Transcript of Government of the Cooperative Republic of Guyana in ...

Government of the Cooperative Republic of Guyana
in Partnership with UNICEF
Knowledge Attitude and Practice (KAP)
Survey - COVID-19 Response in Guyana
Report May 2020
1 | P a g e
Contents Executive Summary ...................................................................................................................................... 1
Background ................................................................................................................................................... 7
Introduction .............................................................................................................................................. 7
Objectives of the Survey .......................................................................................................................... 8
SCOPE OF THE SURVEY ............................................................................................................................. 8
Methodology ................................................................................................................................................ 9
Research Design ....................................................................................................................................... 9
Survey Population .................................................................................................................................... 9
Sampling ................................................................................................................................................... 9
Data Collection ....................................................................................................................................... 10
Ethics and Quality Control ...................................................................................................................... 12
Survey Limitation and Mitigation Measures ........................................................................................... 12
Survey Results ............................................................................................................................................ 13
Demography ........................................................................................................................................... 13
Knowledge .............................................................................................................................................. 16
Attitude ................................................................................................................................................... 22
Practice ................................................................................................................................................... 24
Inferences ............................................................................................................................................... 27
Conclusions and Recommendations ............................................................................................................. 0
References .................................................................................................................................................... 0
Appendix A: Distribution of Sample by Sector of Employment .................................................................... 1
Appendix B: Regional Map of Guyana .......................................................................................................... 2
Appendix C: Survey Team ……………………………………………………………………………………………………………………….3
Executive Summary Introduction

2 | P a g e
The rapid spread of the corona disease, COVID-19, has precipitated fears globally. Apart from a
few territorial successes, there is little evidence showing decelerating coronavirus infection rates
across the world. The numbers in Guyana have increased over the last months. Addressing this
public health crisis requires data driven, targeted actions such efficiently allocating scarce
resources, building awareness, focusing on infection clusters, and enforcing population
guidelines on preventative measures. One basis for taking these actions is the availability of the
right data. This assessment then seeks to fill the current data gap in Guyana by exploring how
individuals perceive the situation and behave in response to it with an aim to provide a better
understanding of how people in Guyana experience the crisis caused by the coronavirus.
Objectives of the Survey
The Ministry of Public Health (MoPH) and the United Nations Children’s Fund (UNICEF) is working
jointly to implement a Knowledge, Attitude and Practices (KAP) survey which will garner
information on misconceptions or misunderstandings that may represent obstacles to the
measures the authority would like to implement and potential barriers to behaviour change.
The COVID-19 KAP survey helps to:
(i) Measure the extent of a known situation; and provide new tangents of a situation
reality;
(ii) Enhance the knowledge, attitude, and practices of specific COVID-19 themes;
(iii) identify what is known and done about various COVID-19-related subjects;
(iv) Establish the baseline (reference value) for use in future assessments
(v) Suggest an intervention strategy that is context specific
(vi) plan activities that are suited to the respective population involved.
Scope of the Survey
To achieve the objectives, this survey addresses key questions regarding the benchmark values
for indicators of COVID-19. The data collected serve as baseline, mid-line and end-line values
depending on the specific interventions. The survey focuses on identifying the risks associated
with knowledge, attitudes and practices pertaining to the saving of lives under threat from
COVID-19.
Survey Method

3 | P a g e
The survey population consists of children, youth, women and men, residing in the 10
administrative regions, as all regions are engaged in the COVID-19 response programming. The
targeted sample size of 664 persons was determined using a sampling table at the 99 %
confidence level and 1 % margin of error.
The survey employed a multi-stage sampling method involving both probability and non-
probability designs. The survey design combined proportional probability sampling along with
consecutive sampling involving systematic random selection. Three approaches were adopted
i.e. Telephone interviews in the coastal regions; client initiated face-to-face interviews in the
hinterland and a self-administer questionnaire in a Survey Monkey platform.
Ethics and quality assurance
Each potential respondent was given full information about the survey including the purpose and
potential benefits, their rights, and how the information collected will be used. They were also
be informed that all data will be kept confidentially being only accessible by members of the
survey team. Further, verbal consent was collected from all those who agreed to participate. Data
checking and validation for completeness and consistency were carried out on a daily basis and
corrections were done in real time.
Key Findings
1. The survey found that 99.1% of respondents heard about the Coronavirus and 96.4% heard
message(s) on the Coronavirus.
2. Facebook (55.8%) and other social media (77.1%) were the main sources of information on the
coronavirus for most respondents.
3. Forty three point nine percent (43.9%) of respondents either agreed or strongly agreed that it
was difficult deciding which information on the Coronavirus was real, false or rumour.
4. Hinterland respondents’ main source of information on the coronavirus is from overseas
television (55.1%) and Facebook (52.8%).
5. Fever (80.4%), coughing (78.0%), difficulty breathing (70.1%), headache (57.7%), and sneezing
(52.3%) were the top five signs and symptoms respondents associated with the Coronavirus
6. Just over 84% of respondents were of the view that COVID-19 was serious or extremely serious
problem.
7. 68.1% correctly stated that asymptomatic people can spread the COVID 19.
8. The data show that 81.6% of the respondents said they were either fearful or very fearful of
COVID-19 disease
9. 74.1% of respondents felt that people should be willing to give up their usual (daily) activities to
prevent the spread of the coronavirus.
10. 20.5% of respondents said there were not able to fully protect themselves from the Coronavirus.
The barriers to fully protecting themselves were: (i) unavailability of these items in some area
(33.3%); (ii) loss/decrease of wages (33.3%); (iii) increasing prices of items in the market (29.8%);

4 | P a g e
(iv) shortage of Hand sanitizer (29.8%); (v) shortage masks (28.1%); (vi) insufficient information
(26.3%); (vii) shortage of gloves (15.8%); and (viii) shortage of soaps 12.3%).
11. 92.1% of respondents reported being indoors during the evening curfew hours and 7.9%
reporting being out of their house during the curfew time. Table
12. There is a significant positive association between age and recognition of symptoms of Covid-19
(Fisher’s test results, p=0.001).
Conclusions
1. There is widespread awareness of and messaging on the Coronavirus across the country.
Social media appear to be the main sources of information on the coronavirus.
2. A significant amount of respondents were uncertain of the veracity of the information received
on the coronavirus.
3. The survey note the main source of information on the coronavirus is foreign television and
therefore local messaging and information on the coronavirus are probably not reaching
hinterland residents.
4. The majority of respondents were able to correctly identify the main symptoms of the
coronavirus. The fact that more than half the respondents claimed that sneezing is a symptom
of coronavirus confirms that there are some amount of misinformation on the coronavirus
existing.
5. In the main, respondents recognised the seriousness of COVID-19 as a highly infectious disease.
The associated finding demonstrate the high level of concern people have with respect to
COVID-19 as a health risk.
6. Just under 1 in 3 respondents were unaware that asymptomatic persons infected with COVID-19
can spread the disease.
7. Understandably there is a high level of fear in the Guyanese society with regard to COVID-19.
8. Almost three in four persons are will to disrupt their usual daily activities to prevent the spread
of COVID-19.
9. Approximately 1 in 5 respondents said there were important barriers to them fully protect
themselves and family from the Coronavirus of the main obstacles were unavailability of
protective items in some areas, loss or reduction in wages, shortage of hand sanitizers and
masks and insufficient information.
10. There is reported high level of compliance for curfew measures.
11. One can conclude that younger respondents were less aware of the symptoms of COVID -19.
Recommendations
1. Social media platforms have played a crucial role in disseminating news about the spread of the
coronavirus and as such efforts should be directed at providing broad based credible
information on the coronavirus using social media platform.
2. Specific actions should be taken to counteract misinformation on the coronavirus. An example
of such action is a collaboration among WhatsApp, WHO, UNICEF, and UNDP to provide
WhatsApp users with a space where they can receive up-to-date information regarding the
coronavirus. In this vein the MoPH and UNICEF can partner to set up WHO has also launched a

5 | P a g e
chatbot on WhatsApp to share reliable information on the coronavirus and help users to
authenticate information in the public domain.
3. Messages should be consistent with what respondents said they wanted to hear which include:
(i) Updates and statistics on the cases and the regions and areas most affected
(ii) Estimated time when the Coronavirus will end and what measures are being put in
place should it go on for an extended period
(iii) Stricter lockdown measures
(iv) Measures to protect oneself and family include correct way to put on and remove
face masks, gloves etc…
4. The MoPH can work with local authorities and media houses to disseminate reliable information
on the coronavirus. There is also need for brainstorming sessions with local groups on how the
authorities can better share information and clear up misconceptions on the coronavirus.
5. Messaging on symptoms should compare the symptoms related to the common cold, flu,
allergies and the coronavirus. Further, symptoms on the coronavirus can be presented under
three headings as is itemised by the WHO: (i) main symptoms; (ii) serious symptoms; less
common symptoms.
6. The authorities should design programmes and messages that effectively communicate risk
associated with this highly infectious pathogen. Effective health risk communication can result
in accurate public risk perceptions which are important determinants of the public’s willingness
to cooperate and adopt health-protective behaviours during pandemics, including frequent
hand washing, physical distancing, avoiding public places, and wearing face masks. Another
implications of health risk communication is that they should include information about the
effectiveness of measures designed to protect people from the disease at both a personal and
societal level, since they gave the impression that the authorities are concerned of their
wellbeing.
7. Risk communication messages should alert individuals of the virulence of COVID-19 and to the
fact that asymptomatic persons can transmit the virus.
8. The authorities should pay keen attention to the level of fear in society relating to COVID-19.
The reason being is that fear associated with infectious pandemic can make people more
worried than they ought to be about contracting the disease, more vulnerable to embracing
misinformation and prone to adopting hostile or fearful attitudes toward people considered
high risk such as health workers. It means therefore that public health messages on COVID-19
should keep people informed with stocking fear. Personal stories from recovered persons can
help people understand the seriousness of the pathogen without fuelling fear. Additionally, the
authorities can share common sense precautionary steps that people can take to reduce their
vulnerability to the disease, such as, social distancing, self-isolating and monitoring one’s
temperature if sick, washing hands regularly with soap and water.
9. Special attention should also be given to concerns of people with pre-existing mental health
conditions like anxiety or obsessive-compulsive disorder. MoPH can collaborate with NGOs and
faith based groups to provide social support networks to help people prone to anxiety to
connect and find support.
10. It is important that the MoPH provide data on how the sacrifices made by citizens is helping in
curbing the spread of the disease.

6 | P a g e
11. Interventions to remove barriers to individuals fully protecting themselves should consider the
most prominent barriers
12. In light of the level of compliance the MoPH should evaluate the weekly incidence of COVID-19
to determine whether more stringent arrangements are required.
13. COVID-19 messaging should target persons below 35 years old into improve their awareness of
the disease and its symptoms.

7 | P a g e
Background
Introduction The rapid spread of the Corona disease, COVID-19 has precipitated fears globally. Between
January and April 2020, turned into a global pandemic having reached most countries around the
world. Apart from a few territorial successes, there is little evidence showing decelerating
coronavirus infection rates across the world. The numbers in Guyana have increased over the
last months. Addressing this public health crisis requires data driven targeted actions including
efficiently allocating scarce resources, building awareness, focusing on infection clusters, and
enforcing population guidelines on preventative measures. One basis for taking these actions is
the availability of the right data. This assessment then seeks to fill the current data gap in Guyana
by exploring how individuals perceive the situation and behave in response to it with an aim to
provide a better understanding of how people in Guyana experience the crisis caused by the
coronavirus.
Guyana is a middle-income country with a per-capita income of US$5,194 (World Bank 2019).
Guyana lies on the north-eastern coast of South America. The country borders Suriname,
Venezuela, and Brazil. It comprises an area of 215,000 km2 and is divided administratively into
10 regions. This country is a member of the Caribbean Community (CARICOM) and has strong
historical and cultural ties to the English-speaking Caribbean. The CARICOM Secretariat is located
in Guyana.
Guyana is a sparsely populated country totalling 746,955 inhabitants, of whom 89% live mostly
along a narrow coastal strip (Guyana Bureau of Statistics 2014). This narrow coastal strip is flat
and stands about 2.4 metres below the sea’s high tide level mark. It requires the construction
and maintenance of a complex sea-defence system to avoid catastrophic flooding. Guyana’s small
population size results in a constrained fiscal envelope, which negatively affects public service
provision in the areas of health, education, national security, public safety, environmental
protection, and infrastructure services.
In the main, public sector health services are free in Guyana. Notwithstanding, there are private
sector entities in the sector that operates on a fee-for-service basis. Available data estimates the
physician to population ratio is 8 for every 10,000 persons, the nurses and midwives to
population ratio is 13 for every 10,000 persons, and Hospital beds to population ratio is 16 for
every 10,000 persons. In fact, Guyana is assessed medium level prepared based on a new United
Nations Development Programme (UNDP) preparedness to respond and cope with the impacts

8 | P a g e
of COVID-19 crisis. This new index includes the nation’s level of human development, healthcare
system capacity and internet access (UNDP 2020).
Measure Guyana’s Score Level of Preparedness
Human development Index 0.670 Medium
Physicians per 10,000 people 8 medium
Nurses and midwifes per 10,000 people 13 Low
Hospital beds per 10,000 people 16 Medium
Current health expenditure (% of GDP), Year 2016 4.2% Low
Multidimensional poverty 3.4% High
Vulnerability to multidimensional poverty 5.8% High
Mobile phone subscription (per 100 people) 83 High
Fixed broadband subscriptions (per 100 people) 8.4 High
Objectives of the Survey The Ministry of Health and the United Nations Children’s Fund (UNICEF) are working jointly to
implement a Knowledge, Attitude and Practices (KAP) survey which will garner information on
misconceptions or misunderstandings that may represent obstacles to the measures the
authority would like to implement and potential barriers to behaviour change.
A COVID-19 KAP survey will help to:
(vii) Measure the extent of a known situation and provide new tangents of a situation
reality;
(viii) Enhance the knowledge, attitude, and practices of specific COVID-19 themes;
(ix) identify what is known and done about various COVID-19-related subjects;
(x) Establish the baseline (reference value) for use in future assessments
(xi) Suggest an intervention strategy that is context specific
(xii) plan activities that are suited to the respective population involved.
SCOPE OF THE SURVEY The survey is national in scope i.e. implemented in all ten regions. To achieve the objectives, this
survey addresses key questions regarding the benchmark values for indicators of COVID-19. The
data collected serve as baseline, mid-line and end-line values depending on the specific
interventions. The survey focuses on identifying the risks associated with knowledge, attitudes
and pertaining to the saving of lives under threat from COVID-19.

9 | P a g e
Methodology
Research Design Survey method is used primarily in non-experimental correlational studies. It is convenient in
obtaining information about people’s actions, knowledge, intentions, opinions, and attitudes by
means of self-report (Polit and Beck 2010, p. 294). For this reason this approach was adopted to
achieve the proposed objectives.
Survey Population
The survey population consists of children, youth, women and men, residing in the 10 regions as
all regions are engaged in the COVID-19 response programming. The targeted sample size of 664
persons was determined using a sample size table. Sample size was determined independently
using a 99 % confidence level and 1 % margin of error.
Table 1: Population and Sample by Region
Sampling The survey employed a multistage sampling method involving both probability and non-
probability designs. The survey design combined proportional probability sampling along with
consecutive sampling involving systematic random selection (see table 1). The size of the primary
sampling units were based on proportional population to size calculation. Each of the 10 clusters
corresponded to the Regional Administrative Boundaries (see Appendix B). Secondary sampling
Regions Population % of total Pop # at 99% Conf.
Barima-Waini 27,643 4 25
Pomeroon-Supenaam 46,810 6 42
Essequibo Islands-West
Demerara107,785 14 96
Demerara-Mahaica 311,563 42 277
Mahaica-Berbice 49,820 7 44
East Berbice-Corentyne 109,652 15 97
Cuyuni-Mazaruni 18,375 2 16
Potaro-Siparuni 11,077 1 10
Upper Takutu-Upper
Essequibo24,238 3 22
Upper Demerara-Berbice 39,992 5 35
746,955 664

10 | P a g e
units were based on the list of individuals selected at random from the telephone directory using
a predefined, computer-based algorithm or through consecutive sampling in areas where there
are no land line telephone service.1
Consecutive sampling was employed to survey residents in hinterland communities who do not
have access to landline telephone service. The sampling frame was compiled from persons
visiting health facilities over a two-week period along with staff from the facilities. From the
frame constructed respondents’ selection was based on a random process (systematic random
sampling).
Data Collection Guyana is a geographically diverse country and therefore data collection methods were adopted
based on the specific areas/regions. The exercise therefore sustained the disadvantage of
excluding persons who the chosen method is not able to capture for instance persons without
telephones.
Data was collected from all ten regions. The regions were divided into two clusters: coastal and
hinterland clusters. The Coastal cluster of regions comprised regions 3, 4, 5, 6 & 10 and the
hinterland cluster comprised regions 1, 2, 7, 8, and 9 . Three approaches were adopted i.e.
Telephone interviews in the coastal regions; client initiated face-to-face interviews in the
hinterland and a self-administer questionnaire in a Survey Monkey platform.
1. Telephone interviews – Household numbers were randomly selected from Guyana’s
2019 telephone directory. The entire directory was downloaded in PDF and then
exported to excel. A new excel sheet was prepared for each list of Surname under the
individual letters (A, B, C, D, etc.) letter. Each row of each sheet was considered, random
rows were selected and the numbers for that region in those rows were highlighted to
be called.
A data collection team was established for each region and teams were asked to
randomly select from a bag with the 26 letters of the alphabet, the Surnames (starting
with the selected letters) they will call in round one of the survey. Over sampling was
done in region 4 as this region has almost 42% of Guyana’s population. The number of
interviews needed for each region was divided among the selected letters for that
region. Please see example below.
1 In many of these Regions mobile phones are ubiquitous, however, because of privacy issues it was not possible to build a sample frame using mobile phone users.

11 | P a g e
The questionnaire for the telephone interviews were place in the Kobo toolbox online
platform and placed on the interviewers’ tablets. The interviewers recorded the
responses in the Kobo toolbox and submitted in real time for analysis. This process
eliminated the data entry process.
2. Client initiated visits (Face-to-face): Respondents from the hinterland cluster of regions
were engaged face-to-face. (when persons visited Social, health care and Community
workers, every 3rd person as asked to participate in the survey, with replacement). The
responses were also recorded in Kobo toolbox and submitted in real time to a central
repository.
3. Survey Monkey: A link with the survey was shared on the websites of Ministry of Public
Health and UNICEF and circulated by email and WhatsApp.
Fifty-one (51) interviewers were recruited and trained to capture survey data. Twenty-five-
interviewers, based in Georgetown, and twenty-six in the hinterland.
Table 2: Number of Interviewees and Interviewers
WK 1 letters # of Resp. WK 1 letters # of Resp. WK 1 letters # of Resp. WK 1 letters # of Resp. WK 1 letters # of Resp. WK 1 letters # of Resp.
G 10 N 24 F 46 M 36 S 24 J 15
P 12 V 24 Y 46 Z 4 B 24 I 10
E 10 L 24 A 71 U 4 H 24 D 10
K 10 T 24 Q 40 W 25
42 96 X 2 44 97 35C 72
277
Region 10Region 2 Region 3 Region 4 Region 5 Region 6
Region
# Regions
# of persons
in
Georgetown
# of Persons on
Ground
1 Barima-Waini 1 3
2 Pomeroon-Supenaam 2 13
3 Essequibo Islands-West
Demerara 3
4 Demerara-Mahaica 10
5 Mahaica-Berbice 2
6 East Berbice-Corentyne 3
7 Cuyuni-Mazaruni 1 3
8 Potaro-Siparuni 1 3
9 Upper Takutu-Upper
Essequibo 1 4
10 Upper Demerara-Berbice 1
25 26

12 | P a g e
Ethics and Quality Control To ensure that the key ethical principles for the conduct of evaluation involving human subjects
are followed, each potential respondent were given full information about the survey including
the purpose and potential benefits, their rights, and how the information collected will be used.
They were also be informed that all data will be kept confidentially being only accessible by
members of the survey team.
Further, verbal consent was collected from all those who agreed to participate. All participants
were also informed of their right to discontinue their participation at any point and approaches
for ensuring confidentiality were be described. The responder name was not required.
Quality Control
Data checking and validation for completeness and consistency were carried out daily from
downloads from KoBo Toolbox, based on the uploaded entries to KoBo collect from the tablets.
Data that were deemed inconsistent were highlighted and shared with the relevant coordination
team for rectification and cleaning. However, quality control were ensured on a daily basis, with
corrections carried out on a real-time basis within the first 48 hours of data collection.
Data Management and Analysis Plan
All quantitative data were analysed using Excel and Statistical Package for the Social Sciences
(SPSS. Based on the raw data, available for download from KoBo Toolbox, a master database was
developed, and further data cleaning were carried out. A quantitative data framework was set
up in Excel for all validated data. A series of frequencies count, percentage, ratios and other
statistical methods will be employed in the analysis of the data.
Survey Limitation and Mitigation Measures Owing to the difficulty in collecting data from hinterland and remote regions a non-probability
approach was introduced. The limitation here is that there is no way to estimate the probability of
including each person in a nonprobability sample, therefore every person usually does not have a chance
for inclusion. Nevertheless, most research samples in medicine, psychology and other disciplines are
nonprobability samples (Polit and Beck 2010; Howit and Cramer 2011). To improve on this sampling
technique the survey utilized a random approach to select respondents.
Another limitation of the survey is the use of telephone interviews. When using this method it is
observed that respondents are often uncooperative on the phone when the interviewer is unknown.

13 | P a g e
However, it is believed that the use of experience researchers along with pre-survey training mitigated
this challenge.
Survey Results
Demography In total 1,246 individuals were sampled. In relation the distribution of the sample by sex, 72.3%
of the respondents were females and 27.7% of the respondents were males. This sizeable
difference in male-female ratio do not reflect the national population distribution.
Table 3: Sample distribution by gender
Gender Frequency Percent
Male 345 27.7
Female 901 72.3
Total 1246 100.0
With respect to age composition, 3.5% of the respondents were below age 18; 37.1% were from
the 18 to 34 years age group, 38.2% were from the 35 to 54 years age group, 21.1% were from
the 55 years and older age group (table 4). The data also show that 5.1% of males in the sample
were below 18 years old, 34.2% were in the 18-34 years old age category, 37.5% were in the 35-
54 years old age category and 23.2% in the 55 years and older age category. Only 2.9% of females
in the sample were below 18 years old, 38.2% were in the 18-34 years old age category, 38.5%
were in the 35-54 years old age category and 21.1% were in 55 years old and above age category.
The modal age category for both males and females in the sample is the 35-54 years old age
category.

14 | P a g e
Table 4: Sample distribution by age category and Gender
The minimum age for participants in the survey was 13 years old and the maximum age was 85
years old. The mean age of survey participants was 41 years and the standard deviation was 16
years.
Table 5: Age: descriptive statistics
# of Respondents 1217
Minimum 13
Maximum 85
Mean 40.90
Std. Deviation 16.332
Variance 266.740
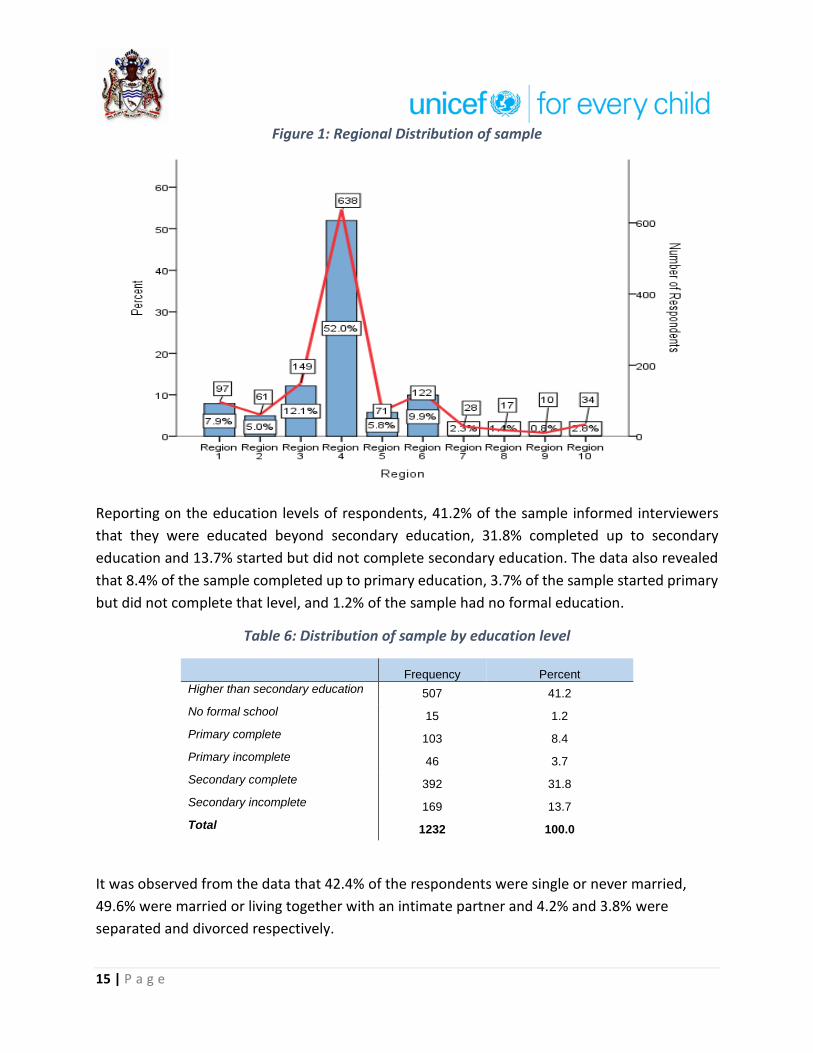
For the coastland clusters, figure 1 shows that 52.0% of the sample were from Region 4, 12.1%
from Region 3, 9.9% from Region 6, 5.8% from Region 5 and 2.8% from region 10. For the
hinterland regions, 7.9% of the overall sample was from Region 1, 5.0% from Region 2, 2.3% from
Region 7, 1.4% from Region 8 and 0.8% From Region 9.
15 | P a g e
Figure 1: Regional Distribution of sample
Reporting on the education levels of respondents, 41.2% of the sample informed interviewers
that they were educated beyond secondary education, 31.8% completed up to secondary
education and 13.7% started but did not complete secondary education. The data also revealed
that 8.4% of the sample completed up to primary education, 3.7% of the sample started primary
but did not complete that level, and 1.2% of the sample had no formal education.
Table 6: Distribution of sample by education level
Frequency Percent
Higher than secondary education 507 41.2
No formal school 15 1.2
Primary complete 103 8.4
Primary incomplete 46 3.7
Secondary complete 392 31.8
Secondary incomplete 169 13.7
Total 1232 100.0
It was observed from the data that 42.4% of the respondents were single or never married,
49.6% were married or living together with an intimate partner and 4.2% and 3.8% were
separated and divorced respectively.

16 | P a g e
Table 7: Sample distribution by marital status
Variables Categories Number of
Respondents Percentage
Marital Status (n=1216)
Single or never married 516 42.4%
Married or living together 603 49.6%
Separated 51 4.2%
Divorced 46 3.8%
The survey sought information on the number of persons below 18 years old living in households
with respondents. They survey found that seven hundred and twenty one (721) or 59.3% of
respondents sampled (n=1216) had at least one person below 18 years old living in their
households. Six hundred and nineteen (619) respondents had 1-3 persons below 18 years old
living in their households, 91 respondents had 4-6 persons below 18 years old living in their
households and 11 respondents had 7 or more persons below 18 years old living in their
households.
Table 8: Households with Persons less than 18 years old
How many persons less than 18 years old live in your household
Gender Total
# of Male Respondents
# of Female Respondents
1-3 163 456 619
4-6 19 72 91
≥ 7 3 8 11
Total 185 536 721
The modal sector from which respondents were employed prior to the Covid-19 outbreak was
health care (10.5% of respondents). Education (9.1%) and entrepreneurs (8.1%) were two other
sectors with values close to the modal value (see Appendix A).
Knowledge
Word on the Coronavirus is widespread across the country. The data revealed that 99.1% of
respondents heard about the Coronavirus. Further, 96.4% of respondents reported that they had
heard message(s) on the Coronavirus (figure 2 and 3).

17 | P a g e
Figure 2: Proportion of sample who heard about the Coronavirus (n=1198)
Figure 3: Proportion of sample who heard message(s) on the Coronavirus (n=1198)
Facebook (55.8%) and other social media (77.1%) were the main sources of information on the
coronavirus for most respondents. A larger proportion of respondents received messages from
overseas television (43.4%) than from local newspapers (33.6%) and television (28.9%). Other
sources of information on the Coronavirus reported by respondents include WhatsApp (21.4%),
Government’s website (10.8%), twitter 3.0$ and local and overseas radio 7.0% and 9.0%
respectively. Assessing the data for the hinterland cluster (Regions 1, 7, 8, & 9), it is observed that
their main sources of messages on the Coronavirus is from overseas television (55.1%) and
Facebook (52.8%).

18 | P a g e
Figure 4: Media from which respondents heard messages on Corona virus (multiple response set)
Figure 5: Media from which hinterland respondents heard messages on Corona virus (multiple response set)
With information on the Coronavirus coming from various sources both formal and informal the
survey examined whether respondents felt it was difficult to determine which information was
real, fake or rumours. The analysis revealed that 43.9% agree or strongly agree that it was difficult
deciding which information on the Coronavirus was real, false or rumour. On the other hand,

19 | P a g e
38.9% of respondents either disagree or strongly disagree that it was difficult deciding which
information on the Coronavirus was real, false or rumour. This analysis points to the fact that a
greater number of respondents find it difficult to determine which information on the
Coronavirus is true and which is false.
Figure 6: Respondents' perception on the difficulty in deciding which information is real or fake
Fever (80.4%), coughing (78.0%), difficulty breathing (70.1%), headache (57.7%), and sneezing
(52.3%) were the top five signs and symptoms respondents associated with the Coronavirus. Less
than half of respondents listed fatigue/tiredness (42.8%), runny nose/nasal congestion (34.5%),
muscle pain (34.3%), diarrhea (33.5%), loss of appetite (32.7%) and joint pain (29.7%), among the
signs and symptoms of the Corona virus. The World Health Organisation (WHO) lists the main
symptoms of the Coronavirus as:
1. fever,
2. dry cough, and
3. tiredness.
Less common symptoms:
1. aches and pains,
2. sore throat,
3. diarrhea,
4. conjunctivitis,
5. headache,

20 | P a g e
6. loss of taste or smell, and
7. a rash on skin, or discolouration of fingers or toes.
Serious symptoms:
1. difficulty breathing or shortness of breath,
2. chest pain or pressure, and
3. loss of speech or movement.2
It is important to note that sneezing is not listed among the WHO’s signs and symptoms.
Figure 7: Respondents who can recognise signs and symptoms believed to be associated with the Coronavirus
Survey participants’ perception on how serious a problem the Coronavirus is was assessed on a
scale of one to ten with one being not serious at all and 10 being extremely serious. Using eight
as cut off point, more than eight in ten respondents felt that the Coronavirus is a serious problem
(figure 8).
2 WHO. (2020). Coronavirus. Online: https://www.who.int/health-topics/coronavirus#tab=tab_3

21 | P a g e
Figure 8: Perceptions how serious a problem the Corona Virus is
Moreover, the analysis revealed that 23.3% of respondents had views congruent with the
misconception that a person who do not show symptoms of an infectious disease cannot spread
that infection. Notwithstanding, the majority of respondents disagreed or strongly disagreed
(68.1%) that an asymptomatic individual cannot spread the virus.
Figure 9: Perceptions on whether an asymptomatic individual can spread the Coronavirus

22 | P a g e
Attitude
In assessing respondents’ attitude to the Coronavirus, they were questioned on how they felt
about the disease. The data show that 81.6% of the respondents said they were either fearful or
very fearful (figure 10) of the disease. Further, as depicted in figure 11, 74.1% of respondents felt
that people should be willing to give up their usual (daily) activities to prevent the spread of the
Coronavirus.
Figure 10: How respondents feel about the Coronavirus
Figure 11: Perception on whether people should be willing to give up their usual (daily) activities to prevent the spread of the Coronavirus.

23 | P a g e
When asked whether they were able to fully protect themselves from the Coronavirus, 79.5%
of respondents said yes; while 20.5% said ‘no’ there were not able to fully protect themselves
from the Coronavirus. The survey examined the barriers resulting in the latter group not being
able to fully protect themselves. The perceived barriers included:
• Unavailability of these items in some area (33.3%)
• Loss/Decrease of wages (33.3%)
• Increasing of the price of items in the market (29.8%)
• Shortage of Hand sanitizer (29.8%)
• Shortage masks (28.1%)
• Insufficient information (26.3%)
• Shortage of gloves (15.8%)
• Shortage of soaps 12.3%)
Table 9: Respondents' view on whether they are able to fully protect themselves against the Coronavirus

24 | P a g e
Figure 12: Perceived barriers to Respondents fully protecting themselves from the Coronavirus
Practice
The data show that an overwhelming majority of respondents (99.1%) indicated that they had
done something during the past two weeks to protect themselves and family from the
Coronavirus (table 10). Respondents itemised the following actions as measures taken to protect
themselves and family from the Coronavirus:
• Washing my hands for 20 second with soap and water (88.7%)
• Wearing a mask to cover my nose and chin when out of the house
(86.3%)
• Using Sanitizers (83.6%)
• Staying at home (unless it is absolutely necessary to go out) (81.3%)
• Standing 6 feet apart from people (57.0%)
• Not touching my face (26.3%)
• Changing my diet (19.0%)
• Taking medicines without doctor's prescription (8.6%)

25 | P a g e
Table 10: During the past two weeks, have you done anything to protect you and/or your family from the Coronavirus?
Frequency Percent
Yes 1113 99.1
No 10 .9
Total 1123 100.0
The survey also examined individual practices in relation to government’s Coronavirus
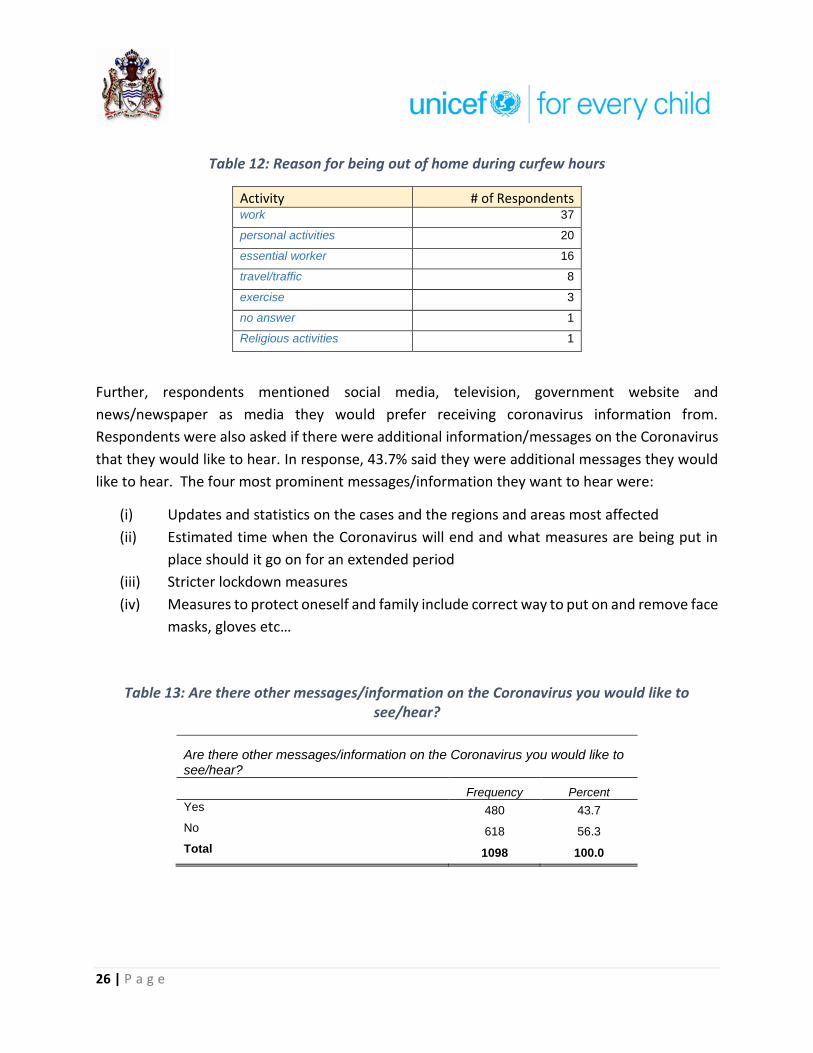
prevention curfew and found that 92.1% of respondents reported being indoors during the
evening curfew hours and 7.9% reporting being out of their house during the curfew time. Table
12 below relates the reasons respondents reported why they were out during the curfew hours.
Among the four main reasons were work, personal activities, an essential worker and
travel/traffic problems.
Table 11: Are you always in your house by 6pm (Curfew time)?
Frequency Percent
Yes 1023 92.1 No 88 7.9 Total 1111 100.0
26 | P a g e
Table 12: Reason for being out of home during curfew hours
Activity # of Respondents work 37
personal activities 20
essential worker 16
travel/traffic 8
exercise 3
no answer 1
Religious activities 1
Further, respondents mentioned social media, television, government website and
news/newspaper as media they would prefer receiving coronavirus information from.
Respondents were also asked if there were additional information/messages on the Coronavirus
that they would like to hear. In response, 43.7% said they were additional messages they would
like to hear. The four most prominent messages/information they want to hear were:
(i) Updates and statistics on the cases and the regions and areas most affected
(ii) Estimated time when the Coronavirus will end and what measures are being put in
place should it go on for an extended period
(iii) Stricter lockdown measures
(iv) Measures to protect oneself and family include correct way to put on and remove face
masks, gloves etc…
Table 13: Are there other messages/information on the Coronavirus you would like to see/hear?
Are there other messages/information on the Coronavirus you would like to see/hear?
Frequency Percent
Yes 480 43.7
No 618 56.3
Total 1098 100.0

27 | P a g e
Inferences Does knowledge of COVID =19 symptoms have any association with respondents’ age? The
survey examines this association by cross tabulating the two variables and using fisher’s exact
test to test the null hypothesis of no association between the variables. The case processing
summary indicates that the analysis comprised 1,217 cases. Fisher’s test results, p=0.001,
suggests that we cannot accept the null hypothesis of no association between age and
recognition of symptoms of Covid-19. In fact, the crosstabulation tables reveals that the two
younger age categories (below 18 years and 18-34 years) had lower ratios of recognition of
COVID19 -19 symptoms than their older counterparts.
Case Processing Summary
Cases
Valid Missing Total
N Percent N Percent N Percent
Recognized a symptom of Covid-19_symp *
Age category 1217 97.7% 29 2.3% 1246 100.0%
Recognized a symptom of Covid-19_symp * Age category
Crosstabulation
Count
Age
Total
Below 18
years 18-34 years
35 to 54
years
55 years
and older
Recognised a symptom of Covid-19_symp No 26a 246a 190b 52c 514
Yes 14a 207a 276b 206c 703
Total 40 453 466 258 1217
Each subscript letter denotes a subset of Age categories whose column proportions do not differ significantly from each
other at the .05 level.
Chi-Square Tests
Value df
Asymp. Sig.
(2-sided)
Exact Sig.
(2-sided)
Exact Sig.
(1-sided)
Point
Probability
Pearson Chi-Square 87.510a 3 .000 .000
Likelihood Ratio 91.861 3 .000 .000
Fisher's Exact Test 91.401 .000
Linear-by-Linear Association 85.377b 1 .000 .000 .000 .000
N of Valid Cases 1217
a. 0 cells (.0%) have expected count less than 5. The minimum expected count is 16.89.

28 | P a g e
b. The standardized statistic is 9.240.
The analysis then examines if there is any link between recognition of Covid-19 symptoms and
gender using crosstabulation and testing the hypothesis of no link between the variables using
Fisher’s exact test. The case processing summary indicates that the analysis comprised 1,246
cases.
Fisher’s test results, p=0.084, suggests that we must accept the null hypothesis of no association
between gender and recognition of symptoms of Covid-19 (p> 0.05).
Case Processing Summary
Cases
Valid Missing Total
N Percent N Percent N Percent
Case Processing Summary
Recognition of Covid-19 symptoms *
Gender
1246 100.0% 0 0.0% 1246 100.0%
Recognition of Covid-19 symptoms * Gender Crosstabulation
Count
Gender
Total Male Female
Recognised Covid-19 symptoms No 158a 372a 530
Yes 187a 529a 716
Total 345 901 1246
Each subscript letter denotes a subset of Gender categories whose column
proportions do not differ significantly from each other at the .05 level.
Chi-Square Tests
Value df
Asymp. Sig.
(2-sided)
Exact Sig.
(2-sided)
Exact Sig.
(1-sided)
Point
Probability
Pearson Chi-Square 2.076a 1 .150 .159 .084
Continuity Correctionb 1.895 1 .169
Likelihood Ratio 2.068 1 .150 .159 .084
Fisher's Exact Test .159 .084
Linear-by-Linear Association 2.074c 1 .150 .159 .084 .018
N of Valid Cases 1246

29 | P a g e
a. 0 cells (.0%) have expected count less than 5. The minimum expected count is 146.75.
b. Computed only for a 2x2 table
c. The standardized statistic is 1.440.
Another association examined by the survey was whether Knowledge of how dangerous COVID-
19 is perceived depends on education level. The Chart below indicates that one must accept the
null hypothesis of no association between education level and respondents’ perception of how
dangerous Covid-19 is (95% C.I). In fact, the overlapping error bars shows that we must accept
the null hypothesis at 95% confidence interval.
Figure 13: Mean scores on respondents' perception on how dangerous Covid-19 is by
Education level
The analysis assessed whether the number of children in the household influenced observance
of preventives measures. Bivariate correlation analysis was adopted for this test. In specific, the
null hypothesis is the number of children in the household did not influence the number
preventative measures taken. The correlation coefficient of the variables is positive but very
weak. Notwithstanding, the result suggest that we must accept the null hypothesis of no bivariate
association between the variables (p=.956).

30 | P a g e
Correlations
How many persons less than 18
years old live in your household
Preventative
practices
How many persons less than 18
years old live in your household
Pearson Correlation 1 .002
Sig. (2-tailed) .956
N 1216 685
Number of Preventive practices
adopted
Pearson Correlation .002 1
Sig. (2-tailed) .956
N 685 688
Finally, the survey assessed the relationship between observance of the curfew measures and
marital status. The specific null hypothesis is that there is no association between the variables.
The variable on marital status is dichotomised to give categories: not married or living with an
intimate partner and married or living with an intimate partner. The test statistic used for this
analysis is the Fisher’s exact test. The results are presented below. The results indicate that we
cannot accept the null hypothesis of no association between the variable (p=.035). One therefore
can conclude the marital status influences observance of curfew regulation in that the data
predict that persons married or living with an intimate partner are more likely to observe curfew
regulations.
Case Processing Summary
Cases
Valid Missing Total
N Percent N Percent N Percent
Are you always in your house
by 6pm (Curfew time)? *
Marital Status
1099 88.2% 147 11.8% 1246 100.0%

31 | P a g e
Observance of curfew * Marital Status Crosstabulation
Count
Marital Status
Total
Not married or
living with an
Intimate partner
Married or living
with an intimate
partner
Are you always in your house
by 6pm (Curfew time)?
Yes 488 523 1011
No 53 35 88
Total 541 558 1099
Chi-Square Tests
Value Df
Asymptotic
Significance (2-
sided)
Exact Sig. (2-
sided)
Exact Sig. (1-
sided)
Point
Probability
Pearson Chi-Square 4.632a 1 .031 .035 .020
Continuity Correctionb 4.166 1 .041
Likelihood Ratio 4.657 1 .031 .035 .020
Fisher's Exact Test .035 .020
Linear-by-Linear
Association
4.627c 1 .031 .035 .020 .009
N of Valid Cases 1099
a. 0 cells (0.0%) have expected count less than 5. The minimum expected count is 43.32.
b. Computed only for a 2x2 table
c. The standardized statistic is -2.151.

Conclusions and Recommendations
Key Findings Conclusion Recommendation 1. The survey found that 99.1% of respondents heard about the Coronavirus and 96.4% heard message(s) on the Coronavirus.
2. Facebook (55.8%) and other social media (77.1%) were the main sources of information on the coronavirus for most respondents. 3. Forty three point nine percent (43.9%) of respondents either agreed or strongly agreed that it was difficult deciding which information on the Coronavirus was real, false or rumour.
There are widespread awareness of and messaging on the Coronavirus across the country. Social media appear to be the main sources of information on the coronavirus. A significant amount of respondents were uncertain of the veracity of the information received on the
coronavirus.
Social media platforms have played a crucial role in disseminating news about the spread of the coronavirus and as such efforts should be directed at providing broad based credible information on the coronavirus using social media platform. Specific actions should be taken to counteract misinformation on the coronavirus. An example of such action is a collaboration among WhatsApp, WHO, UNICEF, and UNDP to provide WhatsApp users with a space where they can receive up-to-date information regarding the coronavirus. In this vein the MoPH and UNICEF can partner to set up WHO has also launched a chatbot on WhatsApp to share reliable information on the coronavirus and help users to authenticate information in the public domain. Messages respondents said they wanted to hear
(i) Updates and statistics on the cases and the regions and areas most affected (ii) Estimated time when the Coronavirus will end and what measures are being put in place should it go on for an extended period (iii) Stricter lockdown measures (iv) Measures to protect oneself and family include correct way to put on and remove face masks, gloves etc…

1 | P a g e
Hinterland respondents’ main source of information on the coronavirus is from overseas television (55.1%) and Facebook (52.8%).
The survey note the main source of information on the coronavirus is foreign television and therefore local messaging and information on the coronavirus are probably not reaching hinterland residents.
The MoPH can work with local authorities and media houses to disseminate reliable information on the coronavirus. There is also need for brainstorming sessions with local groups on how the authorities can better share information and clear up misconceptions on the coronavirus.
Fever (80.4%), coughing (78.0%), difficulty breathing (70.1%), headache (57.7%), and sneezing (52.3%) were the top five signs and symptoms respondents associated with the Coronavirus
The majority of respondents were able to correctly identify the main symptoms of the coronavirus. The fact that more than half the respondents claimed that sneezing is a symptom of coronavirus confirms that there are some amount of misinformation on the coronavirus existing.
Messaging on symptoms should compare the symptoms related to the common cold, flu, allergies and the coronavirus. Further, symptoms on the coronavirus can be presented under three headings as is itemised by the WHO: (i) main symptoms; (ii) serious symptoms; less common symptoms.
Just over 84% of respondents were of the view that COVID-19 was serious or extremely serious problem.
In the main, respondents recognised the seriousness of COVID-19 as a highly infectious disease. The associated finding demonstrate the high level of concern people have with respect to COVID-19 as a health risk.
The authorities should design programmes and messages that effectively communicate risk associated with this highly infectious pathogen. Effective health risk communication can result in accurate public risk perceptions which are important determinants of the public’s willingness to cooperate and adopt health-protective behaviours during pandemics, including frequent hand washing, physical distancing, avoiding public places, and wearing face masks. Another implications of health risk communication is that they should include information about the effectiveness of measures designed to protect people from the disease at both a personal and societal level, since they gave the impression that the authorities are concerned of their wellbeing.

2 | P a g e
68.1% correctly stated that asymptomatic people can spread the COVID 19.
Just under 1 in 3 respondents were unaware that asymptomatic persons infected with COVID-19 can spread the disease.
Risk communication messages should alert individuals of the virulence of COVID-19 and to the fact that asymptomatic persons can transmit the virus.
The data show that 81.6% of the respondents said they were either fearful or very fearful of COVID-19 disease
Understandably there is a high level of fear in the Guyanese society with regard to COVID-19.
The authorities should pay keen attention to the level of fear in society relating to COVID-19. The reason being is that fear associated with infectious pandemic can make people more worried than they ought to be about contracting the disease, more vulnerable to embracing misinformation and prone to adopting hostile or fearful attitudes toward people considered high risk such as health workers. It means therefore that public health messages on COVID-19 should keep people informed with stocking fear. Personal stories from recovered persons can help people understand the seriousness of the pathogen without fuelling fear. Additionally, the authorities can share common sense precautionary steps that people can take to reduce their vulnerability to the disease, such as, social distancing, self-isolating and monitoring one’s temperature if sick, washing hands regularly with soap and water. Special attention should also be given to concerns of people with pre-existing mental health conditions like anxiety or obsessive-compulsive disorder. MoPH can collaborate with NGOs and faith based groups to provide social support networks to help people prone to anxiety to connect and find support.
74.1% of respondents felt that people should be willing to give up their usual (daily) activities to prevent the spread of the coronavirus.
Almost three in four persons are will to disrupt their usual daily activities to prevent the spread of COVID-19.
It is important that the MoPH provide data on how the sacrifices made by citizens is helping in curbing the spread of the disease.

3 | P a g e
20.5% of respondents said there were not able to fully protect themselves from the Coronavirus. The barriers to fully protecting themselves were: (i) unavailability of these items in some area (33.3%); (ii) loss/decrease of wages (33.3%); (iii) increasing prices of items in the market (29.8%); (iv) shortage of Hand sanitizer (29.8%); (v) shortage masks (28.1%); (vi) insufficient information (26.3%); (vii) shortage of gloves (15.8%); and (viii) shortage of soaps 12.3%).
Approximately 1 in 5 respondents said there were important barriers to them fully protect themselves and family from the Coronavirus of the main obstacles were unavailability of protective items in some areas, loss or reduction in wages, shortage of hand sanitizers and masks and insufficient information.
Interventions to remove barriers to individuals fully protecting themselves should consider the most prominent barriers
92.1% of respondents reported being indoors during the evening curfew hours and 7.9% reporting being out of their house during the curfew time. Table
There is reported high level of compliance for curfew measures.
In light of the level of compliance the MoPH should evaluate the weekly incidence of COVID-19 to determine whether more stringent arrangements are required.
There is a significant positive association between age and recognition of symptoms of Covid-19 (Fisher’s test results, p=0.001).
One can conclude that younger respondents were less aware of the symptoms of COVID -19.
COVID-19 messaging should target persons below 35 years old into improve their awareness of the disease and its symptoms.

References Guyana Bureau of Statistics. (2014). Guyana Population and Housing Census 2012 Prelininary Report.
Georgetown: Guyana Bureau of Statistics.
Howitt, D., & Cramer, D. (2011). Introduction to Research Methods in Psychology. Harlow: Pearson.
Polit, D., & Beck, C. (2010). Essentials of Nursing Research: Appraising Evidence for Nursing Practice.
Baltimore: Lippincott Williams and Wilkins.
UNDP. (2020). COVID-19 and Human Development: Exploring global preparedness and vulnerability.
Retrieved May 19, 2020, from http://hdr.undp.org/sites/default/files/covid-
19_and_human_development.pdf
WHO. (2020). Coronavirus. Retrieved from https://www.who.int/health-topics/coronavirus#tab=tab_3
World Bank. (2019). The World Bank in the Caribbean. Retrieved from
https://www.worldbank.org/en/country/caribbean/overview

1 | P a g e
Appendix A: Distribution of Sample by Sector of Employment
Area of Employment Frequency Percent
Disciplined Forces 24 2.0
Education 117 9.7
Entrepreneur 98 8.1
Farming crop 50 4.1
Financial services 19 1.6
Fishery 6 0.5
Forestry 3 0.2
Gathering of forest products including hunting 2 0.2
Grocery store, supermarket 15 1.2
Health care 127 10.5
Hotel or B&B 13 1.1
Import, export 6 0.5
Information technology 17 1.4
Manufacturing 18 1.5
Mining 14 1.2
No answer 336 27.8
Open market vending 19 1.6
other 96 7.9
other public service 75 6.2
other shop or store 39 3.2
Pharmacy 13 1.1
Restaurant 17 1.4
Tourism 6 0.5
Transportation 37 3.1
Unemployed 43 3.6
Total 1210 100.0

2 | P a g e
Appendix B: Regional Map of Guyana

3 | P a g e
Appendix C: Survey Team
Survey Team Function
MoPH and UNICEF team
Hon. Minister of Public Health Ms. Volda Lawrence
Oversight team UNICEF Representative Ms. Sylvie Fouet
UNICEF Deputy Representative Mr. Irfan Akhtar
Dr. Ertenisa Hamilton Survey Managers
Mr. Michael Gillis
Dr. Clement Henry Sampling, Data Analysis and report writing team Mr. Michael Gillis
Mr. Ato Heyliger Sampling support
Dr. Patrick Matala Technical Support
Ms. Jewel Crosse Communication for Development support
Mr. Frank Robinson External Communication Support
Mr. Kelvin Daly Information Technology support
Ms. Melissa Joseph-Wade Logistics support
Dr. Umadai Rattan Supervisor
Dr. Lauren Bancroft Supervisor
Ms. Tandica Marshall Supervisor
Medex Wilton Benn Supervisor
Dr. Farrah December Supervisor
Ms. Nickishaw Khan Supervisor
Dr. Delroy Pyle Supervisor
Dr. Samantha Kennedy Supervisor
Ms. Kewana Carrington Supervisor
Mr. Ato Heyligar Supervisor
Ms. Shivhana Bruce Supervisor
Ms. Sheneca Castello Supervisor
Mr. Sylvester Nanan Interviewer
Mr. Odley Paul Interviewer
Ms. Noelene Siland Interviewer
Mr. Kevin Johnson Interviewer
Ms. Amanda Scott Interviewer
Ms. Shemika Smartt Interviewer
Ms. Debra Pollard Interviewer

4 | P a g e
Ms. Collet Baird Interviewer
Mr. Michael O'Donoghue Interviewer
Ms. Shandel Archer Interviewer
Ms. Alicia Singh Interviewer
Ms. Nichelle Cadogan Interviewer
Ms. Adrion Sukhdeo Interviewer
Ms. Sharon Hope Interviewer
Ms. Hannah Smith Interviewer
Ms. Auvrel Lyte Interviewer
Ms. Alicia McLeod Interviewer
Ms. Nicolette Thomas Interviewer
Ms. Candacy Gonputh Interviewer
Medex Anasha Venture Interviewer
Ms. Natasha Layne Interviewer
Mr. Neala Misir Interviewer
Ms. Leauta Hubbard Interviewer
Ms. Dawn Pearson Interviewer
Ms. Dhanwanttie Ramdeholl Interviewer
Ms. Basantie Lallbachan Interviewer
Ms. Patricia Ramnauth Interviewer
Mr. Lenski Henry Interviewer
Mr. Balraj Sanase Interviewer
Ms. Leandre Stellingburg Interviewer
Ms. Vanessa Wong Interviewer