
2018...6 Notice of Meeting ANNUAL MEETING NOTICE is hereby given that the Thirty-fourth Annual...
133
1 2018 Annual Report
Transcript of 2018...6 Notice of Meeting ANNUAL MEETING NOTICE is hereby given that the Thirty-fourth Annual...

1
2018Annual Reportwww.republicguyana.com
REPUBLIC BANK GUYANA ANNUAL REPORT 2018 COVER.indd 1 10/28/18 11:15 AM

1
Making a difference
To provide hope for those in need and empowerment for those who
are disenfranchised. To stay human and personal in our day to day
service so that customers feel safe in our hands. To drive business
with leading-edge technology. To stay the course and to thrive, no
matter the economic climate. To change a life for the better. These
are privileges we have earned on our journey of over 181 years and
we will continue to do all that we can to make a positive difference
in the lives of those we serve.
2018Annual Report

2
The Bank at a Glance
Established in 1836, Republic Bank (Guyana) Limited is one of Guyana’s longest-serving institutions and is a recognised leader in the provision of financial
services. Over the past year, the Bank has concentrated on growing its lending portfolio, with particular emphasis on Small and Medium Enterprises.
The Bank remains committed to providing customised, efficient and competitively priced financial services, and to maintaining a philosophy of social
investment in Guyana. Over the past year, in a challenging economy, the Bank has managed to grow its market share in loans and deposits. Republic
Bank (Guyana) Limited remains the largest commercial bank in the country with an asset base at $168.2 billion.
About Us
Republic Bank,
the Caribbean Financial
Institution of Choice
for our Staff, Customers
and Shareholders.
We set the Standard of Excellence
in Customer Satisfaction,
Employee Engagement,
Social Responsibility and Shareholder Value,
while building successful societies.
Our mission is to provide Personalised,
Efficient and Competitively-priced
Financial Services
and to implement Sound Policies
which will redound to the benefit
of our Customers, Staff, Shareholders
and the Communities we serve.
Customer Focus
Integrity
Respect for the Individual
Professionalism
Results Orientation
Our Vision
Our Mission
Core Values
Total Assets ($Billions)
Profit After Tax ($Million)
180
120
60
0
4,000
3,000
2,000
1,000
0
2018 2017 2016 2015 2014
2018 2017 2016 2015 2014
146.
22,
739
168.
23,
134
151.6
2,70
3
142.
42,
816
129.
02,
339

3
Sources of Revenue
Branches 12
FinancialProducts & Services
ATMs 47
Employees 681
Through our social investment initiative, the Power to Make a Difference, we
have formed powerful connections across Guyana within the communities
we serve with the aim of safeguarding the welfare and ensuring the
sustainable success of this beautiful nation.
For more than a decade, through relationships with Non-Governmental
Organisations (NGOs) and Community Based Organisations (CBOs), we
have worked together to; support healthcare programmes and disability
awareness initiatives; provide opportunities for young people to realise their
truest potential through sport, education, culture and the arts; and raise the
bar for community investment through a wide-reaching, comprehensive
staff volunteerism programme.
Corporate Social Responsibility
Shares 2017 - 2018
2017 $115 2018 $208
2017 3.58% 2018 2.06%
2017 $9.13 2018 $10.45
2017 12.6 2018 19.9
32
Loans & Advances 62%
Foreign Business 13%
Investments 9%
Other 16%
Network Operating Branches
Earnings per Share
PE Ratio
Share Price
Dividend Yield 62%13%
16%
9%
The Bank at a Glance
Anna Regina
Vreed-En-HoopCamp Street
Water StreetTriumph
D’EdwardCorriverton
New AmsterdamDiamond
Rose Hall
Linden
Lethem

4
Table of Contents
01Corporate Information
02Board of Directors and Management
03Corporate Social Responsibility
04Financial Statements
Notice of Meeting 6
Corporate Information 7
Bank Profile 8
Financial Summary 10
Financial Highlights 11
Board of Directors 14
Directors’ Report 18
Chairman’s Review 21
Managing Director’s Discussion and Analysis 24
Senior Management 35
Management 36
Statement of Corporate Governance Practices 41
Power to Make A Difference 44
Financial Reporting Requirements 50
Independent Auditors’ Report 52
Statement of Financial Position 58
Statement of Income 60
Statement of Comprehensive Income 61
Statement of Changes In Equity 62
Statement of Cash Flows 63
Notes to the Financial Statements 65

5
01Corporate Information
Making the difference through Culture
Across the Group, keeping tradition alive has stood
paramount in working with diverse communities
to preserve, protect, and promote various cultural
aspects, with their development therefore
positioned as yet another dimension through
which young minds are challenged and awakened.

6
Notice of MeetingANNUAL MEETING
NOTICE is hereby given that the Thirty-fourth Annual
General Meeting of Republic Bank (Guyana) Limited will
be held at Pegasus Hotel Guyana, Seawall Road, Monday,
December 10, 2018 at 15:00 hours (3:00 p.m.) for the following
purposes:
1 To receive the Report of the Directors and the Auditors and to
approve the Audited Accounts for the year ended September 30,
2018.
2 To re-elect three Directors to fill offices vacated by those retiring
from the Board by rotation in accordance with the By-Laws namely;
Anna-María García-Brooks, John G. Carpenter and Nigel M. Baptiste.
3 To reappoint the Auditors, Messrs Ram & McRae.
And the following special business namely:
4 To consider and, if thought fit, pass resolutions relating to:
a Dividends;
b Directors’ service agreements providing for their
remuneration; and
c Remuneration of the auditors.
5 To consider any other business that may be conducted at an
Annual General Meeting.
By order of the Board
Christine A. Mc Gowan
Corporate Secretary
October 22, 2018
REGISTERED OFFICE
155-156 New Market Street
North Cummingsburg
Georgetown, Guyana
NOTES
• Only stockholders may attend.
• Any member entitled to attend and to vote is entitled to appoint a
proxy to attend and vote instead of him/her.
• A proxy need not be a member of the Company. The instrument
appointing a proxy must bear a G$10 revenue stamp and be
deposited at the Registered Office of the Company not less than 48
hours before the time for holding the meeting.
• Any Corporation, which is a member of the Company may, by
resolution of its Directors or other governing body, authorise such
person as it thinks fit to act as its representative at the meeting (By-
Law 86).
Corporate Information

7
Corporate InformationDIRECTORS
Chairman
President, Republic Financial Holdings Limited
Nigel M. Baptiste, BSc (Hons.) (Econ.), MSc (Econ.), ACIB
Managing Director
Richard S. Sammy, BSc Mgmt. Studies (Hons.) MBA
Corporate Secretary
Christine A. Mc Gowan, LLM (Merit), LLB (Dist.), LEC (Hons.), AMLCA, CPAML
Non-Executive Directors
John G. Carpenter, AA, BSc (Food Sciences)
Roy E. Cheong, AA, FCII, FLMI, CLU
Yolande M. Foo, AICB
Anna-María García-Brooks, Dip. (Mass Media and Comm.), Dip. (Business Mgmt.),
EMBA
Shameer Hoosein, FCCA
Richard M. Lewis, HBA
Richard I. Vasconcellos
REGISTERED OFFICE
Promenade Court
155-156 New Market Street
North Cummingsburg
Georgetown, Guyana
South America
Email: [email protected]
Website: www.republicguyana.com
ATTORNEYS-AT-LAW
Messrs. Cameron & Shepherd
2 Avenue Of The Republic
Robbstown
Georgetown, Guyana
South America
AUDITORS
Messrs. Ram & McRae
Chartered Accountants
157 ‘C’ Waterloo Street
North Cummingsburg
Georgetown, Guyana
South America
Corporate Information

8
Republic Bank Promenade Court
155-156 New Market Street
North Cummingsburg
Georgetown, Guyana
Telephone: (592) 223-7938-49
Fax: (592) 233-5007
E-mail: [email protected]
Website: www.republicguyana.com
SENIOR MANAGEMENT
Managing Director
Richard S. Sammy, BSc Mgmt. Studies (Hons.) MBA
General Manager, Credit
Parbatie Khan, Dip. (Business Mgmt.), ACIB, MBA
General Manager, Operations
Denise Hobbs, Dip. (Business Mgmt.)
MANAGERS
Senior Manager, Corporate and Commercial Credit
Sasenarain Jagnanan, AICB, Dip. (Bkg. and Fin.)
Manager, Branch Operations
Jadoonauth Persaud, Dip. (Bkg. and Fin.), MBA
Assistant Manager, Branch Operations
Gail Harding, AICB
Corporate Manager, Corporate and Commercial Credit
Carla Roberts, BSc (Accountancy)
Credit Manager, Corporate and Commercial Credit
Diane Yhun
Manager, Finance and Planning
Vanessa Thompson, BSocSc (Mgmt.), FCCA, MBA
Manager, Human Resources
Shrimanie Mendonca, BSc (Biology), PG Dip. (Education), MEd
Assistant Manager, Human Resources
Joann Williams, BA (English)
Manager, Corporate Operations
Denys Benjamin, AICB
Manager, Legal Services
Christine McGowan, LLM (Merit), LLB (Dist.), LEC (Hons.), AMLCA, CPAML
Bank Prof ileSenior Manager, Head Office
Ndidi Jones, Dip. (Sociology), LLB, LEC, LLM (Merit), CPAML
Manager, Marketing and Communications
Michelle Johnson, MCIPR, MACC (Dist.), PG Dip. CIPR, BSocSc Mgmt. (Credit)
Manager, Branch Support Services
Erica Jeffrey, ICB - Letter of Accomplishment
Manager, Information Technology
Yonnette Greaves, Dip. (Mgmt. Info. Systems) LIMIS
Assistant Manager, Information Technology
Yugisther Mohabir, MCSA
Manager, Internal Audit,
Seconded to Republic Bank (Suriname) N.V.
Stanton Grant, BSc (Econ.), AICB
Manager, Internal Audit
Oral Rose, Dip. (Marketing), BSocSc (Mgmt.) (Dist.), AMLCA
Manager, Enterprise Risk Management
Michael Ram, AICB
Manager, Special Unit
Karen Assanah, AAT, AICB, BSocSc (Mgmt.) (Dist.), MSc. (Fin. Mgmt.)
BANKING OFFICES
ANNA REGINA BRANCH
Manager
Guitree Ramsamooj, CAT, Certified Credit Professional
CAMP STREET BRANCH
Manager
Harry Dass Ghaness, ICB - Letter of Accomplishment, Certified Credit Professional
CORRIVERTON BRANCH
Manager
Doodmattee Bhollaram, AICB, Certified Credit Professional
D’EDWARD BRANCH
Manager
Imran Saccoor, Dip. (Marketing), MBA
DIAMOND BRANCH
Officer-in-Charge
Allison Mc Lean-King, AICB, Certified Credit Professional
Corporate Information

9
Bank Prof ileLETHEM BRANCH
Officer-in-Charge
Sasenarine Bindranath, Dip. (Business Law) (ICM), AICB
LINDEN BRANCH
Manager
Joel Singh, AICB
NEW AMSTERDAM BRANCH
Manager
Randulph Sears, Business Group Cert. (ICM), Dip. (Marketing), Certified Credit
Professional, Wharton Leadership Programme Certificate, ABA Stonier Graduate
School of Banking Diploma, MCIM, MBA
ROSE HALL BRANCH
Manager
Eon Grant, BComm., AICB
TRIUMPH BRANCH
Officer-in-Charge
Bibi Shaliza Seepersaud, AICB, Certified Credit Professional, MBA
VREED-EN-HOOP BRANCH
Manager
Shridath Patandin, AICB, Certified Credit Professional
WATER STREET BRANCH
Manager
Celine Davis, ICB- Letter of Accomplishment, BSocSc (Mgmt.), PG Dip. (Dev. Studies),
MSc (Human Resource Mgmt.), Certified Credit Professional
Corporate Information

10
Financial SummaryAll figures are in thousands of Guyana dollars ($’000)
2018 2017 2016 2015 2014
Cash resources 40,078,184 27,829,221 30,963,960 32,271,117 22,989,659
Investment securities 15,694,193 7,440,987 7,882,243 6,318,344 5,414,804
Loans and advances 69,747,950 60,791,257 58,417,974 52,362,418 50,496,947
Total assets 168,183,290 146,229,495 151,574,139 142,362,955 128,986,527
Total deposits 144,654,913 124,879,378 131,186,957 123,701,186 112,551,760
Stockholders’ equity 20,164,281 18,300,481 16,715,394 15,223,604 13,563,521
Net profit after taxation 3,134,004 2,738,939 2,703,041 2,815,938 2,339,428
Total comprehensive income 3,206,844 2,820,087 2,726,690 2,690,083 2,343,628
Earnings per stock unit in dollars ($) 10.45 9.13 9.01 9.39 7.80
Return on average assets (%) 2.02 1.83 1.82 2.03 1.78
Return on average equity (%) 16.48 15.69 16.88 19.78 18.16
Corporate Information

11
Financial HighlightsAll figures are in thousands of Guyana dollars ($’000)
2018 2017 Change % Change
Statement of Income
Interest and other income 11,127,806 10,227,640 900,166 8.8
Interest and non-interest expenses (6,463,209) (5,998,836) (464,373) (7.7)
Net Income before taxation 4,664,597 4,228,804 435,793 10.3
Taxation charge (1,530,593) (1,489,865) (40,728) (2.7)
Net Income after taxation 3,134,004 2,738,939 395,065 14.4
Statement of Financial Position
Loans and advances 69,747,950 60,791,257 8,956,693 14.7
Total assets 168,183,290 146,229,495 21,953,795 15.0
Average assets 155,412,880 149,660,022 5,752,858 3.8
Deposits 144,654,913 124,879,378 19,775,535 15.8
Equity (capital and reserves) 20,164,281 18,300,481 1,863,800 10.2
Average outstanding equity 19,019,725 17,454,245 1,565,479 9.0
Common stock
Earnings in dollars per Stock Unit 10.45 9.13 1.32 14.4
Dividend for the year (in thousands) 1,285,000 1,235,000 50,000 4.0
Stock Units (in thousands) 300,000 300,000 – –
General
Number of:
Stockholders 1,371 1,362 9 0.7
Common stock outstanding (in thousands) 300,000 300,000 – –
Active savings, chequing and deposit accounts 153,826 162,240 (8,414) (5.2)
Employees 681 708 (27) (3.8)
Banking offices 12 12 – –
Corporate Information
2018 2017 2016 2015 2014
Cash resources 40,078,184 27,829,221 30,963,960 32,271,117 22,989,659
Investment securities 15,694,193 7,440,987 7,882,243 6,318,344 5,414,804
Loans and advances 69,747,950 60,791,257 58,417,974 52,362,418 50,496,947
Total assets 168,183,290 146,229,495 151,574,139 142,362,955 128,986,527
Total deposits 144,654,913 124,879,378 131,186,957 123,701,186 112,551,760
Stockholders’ equity 20,164,281 18,300,481 16,715,394 15,223,604 13,563,521
Net profit after taxation 3,134,004 2,738,939 2,703,041 2,815,938 2,339,428
Total comprehensive income 3,206,844 2,820,087 2,726,690 2,690,083 2,343,628
Earnings per stock unit in dollars ($) 10.45 9.13 9.01 9.39 7.80
Return on average assets (%) 2.02 1.83 1.82 2.03 1.78
Return on average equity (%) 16.48 15.69 16.88 19.78 18.16

12

13
Making the difference to the Environment
The pursuit of protecting our environment continues to bring
us closer with a diverse array of communities throughout the
nation, joining forces as, together, we champion an ongoing
drive of conservation, inclusion, and responsibility in the
hearts and minds of many. In spreading greater awareness of
the world around us and the roles we each play in its survival,
we continue to focus on creativity and expression as the best
means of laying the right foundation and setting a good
example for future generations to aspire toward and emulate
in safeguarding our fragile natural resources and moving closer
to true sustainable development.
02Board of Directorsand Management

14 Board of Directors and Management
Board of Directors
NIGEL M. BAPTISTEBSc (Econ.) (Hons.), MSc (Econ.), ACIB President,Republic Financial Holdings LimitedManaging Director,Republic Bank LimitedChairman,Republic Bank (Guyana) Limited
RICHARD S. SAMMYBSc (Mgmt. Studies) (Hons.) MBA Managing Director,Republic Bank (Guyana) Limited
JOHN G. CARPENTERAA, BSc (Food Sciences) Chairman,Hand-in-Hand Group of Companies
ROY E. CHEONGAA, FCII, FLMI, CLU Chartered Insurer
YOLANDE M. FOOAICB Retired Senior Banking Executive,Republic Bank (Guyana) Limited
ANNA-MARÍA GARCÍA-BROOKSDip. (Mass Media and Comm.),
Dip. (Business Mgmt.), EMBA General Manager, Group Human Resources, Republic Bank Limited

15Board of Directors and Management
Board of Directors
SHAMEER HOOSEINFCCA Chief Executive Officer, Massy Gas Products (Guyana) Limited
RICHARD M. LEWISHBA Executive Chairman,Label House Group Limited
RICHARD I. VASCONCELLOS Chairman,
A.N.K. Enterprises Inc.
ANNA-MARÍA GARCÍA-BROOKSDip. (Mass Media and Comm.),
Dip. (Business Mgmt.), EMBA General Manager, Group Human Resources, Republic Bank Limited

16
NIGEL M. BAPTISTE
BSc (Econ.) (Hons.), MSc (Econ.) ACIB
President, Republic Financial Holdings Limited
Managing Director, Republic Bank Limited
Chairman, Republic Bank (Guyana) Limited
Nigel M. Baptiste was appointed Chairman of Republic Bank (Guyana)
Limited in 2013. He is the President of Republic Financial Holdings
Limited and Managing Director of Republic Bank Limited. Mr. Baptiste
previously served as Managing Director of Republic Bank (Guyana)
Limited. He holds an MSc in Economics and has successfully completed
the Harvard Business School’s Advanced Management Programme.
He is a graduate of the Stonier Graduate School of Banking and an
Associate of the Chartered Institute of Banking in England.
External Appointments
Mr. Baptiste is also Chairman of the Board of Republic Bank (Barbados)
Limited and a Director of HFC Bank, Ghana.
RICHARD S. SAMMY
BSc (Mgmt. Studies) (Hons.) MBA
Managing Director, Republic Bank (Guyana) Limited
Richard S. Sammy was appointed Managing Director, Republic Bank
(Guyana) Limited in 2015. A distinguished banker with significant
regional experience in risk management, corporate and investment
banking, Mr. Sammy previously served as the Regional Manager,
Corporate Business Centre-South, and as Regional Manager, Investment
Banking Division at Republic Bank Limited, Trinidad. Mr. Sammy holds
an MBA from the Warwick Business School in the United Kingdom and
a BSc (Hons.) in Management Studies from the University of the West
Indies, St. Augustine.
External Appointments
Mr. Sammy is a Director of the Caribbean Association of Banks Inc., the
American Chamber of Commerce – Guyana and is the current Chairman
of the Guyana Association of Bankers.
JOHN G. CARPENTER
AA, BSc (Food Sciences)
Chairman, Hand-in-Hand Group of Companies
John G. Carpenter was appointed to the Board of Republic Bank
(Guyana) Limited in 2005. He has extensive leadership experience and
knowledge of the local and regional commercial industry having been
involved in the management and directorship of several successful
Board of Directorsbusinesses. He holds a BSc in Food Sciences from Cornell University and
has a keen interest in the sustainable development of business in Guyana.
Mr. Carpenter is a recipient of the Golden Arrow of Achievement.
External Appointments
Mr. Carpenter is the Chairman of Hand-in-Hand Fire and Life Insurance
Group of Companies and a Director of Republic Bank (Suriname) N.V.,
Wieting and Richter Limited, Industrial Safety Equipment Inc., and
Cellsmart Inc.
ROY E. CHEONG
AA, FCII, FLMI, CLU
Chartered Insurer
Roy E. Cheong is a Chartered Insurer with vast management and
financial matters expertise. Mr. Cheong has worked for many years in the
Insurance Industry, serving as President of the Insurance Association of
the Caribbean and the Insurance Association of Guyana before retiring
as Managing Director of the GTM Group of Companies in Guyana. He is
a Fellow of the Life Management Institute, a Chartered Life Underwriter,
and a recipient of the Golden Arrow of Achievement.
External Appointments
Mr. Cheong serves on a number of boards, including the GTM Group of
Companies and Banks DIH Limited.
YOLANDE FOO
AICB
Retired Senior Banking Executive,
Republic Bank (Guyana) Limited
Yolande Foo was appointed to the Board of Republic Bank (Guyana)
Limited as a non-Executive Director in 2008. Mrs. Foo is a retired
career banker with 45 years’ experience in the fields of banking, human
resource management, training, and governance. She is a former
Director of the St. Joseph Mercy Hospital, a past President of the Rotary
Club of Demerara, former member of the National Tripartite Committee’s
sub-committee on HIV/AIDS – Workplace Education Programme, and a
former Trustee of the Guyana Girl Guides Association. Mrs. Foo served as
a councillor of the Consultative Association of Guyanese Industry. She
continues to be actively involved in a number of humanitarian efforts
and charitable ventures.
Board of Directors and Management

17
Board of DirectorsANNA-MARÍA GARCÍA-BROOKS
Dip. (Mass Media and Comm.), Dip. (Business Mgmt.), EMBA
General Manager, Group Human Resources,
Republic Bank Limited
Anna-María García-Brooks was appointed to the Board of Republic Bank
(Guyana) Limited in 2016 and is the General Manager, Group Human
Resources, Republic Bank Limited. Mrs. García-Brooks is a graduate of
the University of the West Indies (UWI) (Mass Communications) and
winner of the Pro Vice Chancellor’s Prize for General Proficiency, First
Place. She holds an MBA from the Arthur Lok Jack Graduate School
of Business (UWI), a post-graduate Diploma in Business Management
from the UWI, and has completed executive management programmes
at the University of Michigan Business School, the Wharton Business
School at the University of Pennsylvania, Harvard Business School and
Stanford University. In 2014, Mrs. García-Brooks was named as one of
the UWI’s Distinguished Alumni.
External Appointments
Mrs. García-Brooks serves as Chairman of the Board of Catholic Media
Services Limited.
SHAMEER HOOSEIN
FCCA
Chief Executive Officer,
Massy Gas Products (Guyana) Limited
Shameer Hoosein was appointed to the Board of Republic Bank
(Guyana) Limited in 2015 and is an accomplished business leader with
more than 20 years’ experience in management. Mr. Hoosein is the
Chief Executive Officer of Massy Gas Products (Guyana) Ltd (formerly
Demerara Oxygen Company Limited), a position he has held since
1995 having previously served as the Finance Director of Associated
Industries Limited. He is a graduate of the Richard Ivey School of
Business, completing the Executive Development Program in 2005, and
a Fellow of the Association of Chartered Certified Accountants.
External Appointments
Mr. Hoosein is the Chairman of Massy Security (Guyana) Incorporated
and the Chairman of the Management Committee of Massy Pension
Fund Plan for Guyana. He also holds several directorships in the Massy
Group of Companies in Guyana and Jamaica.
RICHARD M. LEWIS
HBA
General Manager/Director, Label House Group Limited
Richard M. Lewis was appointed to the Board of Republic Bank (Guyana)
Limited in 2014 and is the Executive Chairman of Label House Group
Limited, the largest specialist label and packaging printer in the
Caribbean. Mr. Lewis holds a BA with Honours from the University of
Western Ontario Richard Ivey School of Business and is a graduate of the
Newcastle Institute of Technology. He is also a Director of Republic Bank
(Grenada) Limited and Republic Securities Limited.
External Appointments
Mr. Lewis is the Chairman for Prestige Business Publications, Ceramic
Trinidad Limited and The Beacon Insurance Company Limited.
RICHARD I. VASCONCELLOS
Chairman, A.N.K. Enterprises Inc.
Richard Vasconcellos has significant expertise in banking, having been
involved in international banking for more than 15 years, during which
he held many senior management positions including that of Senior
Vice President of Commerce Bank NA.
External Appointments
Mr. Vasconcellos is the President of A.N.K. Enterprises, incorporated
in Miami, Florida, and a shareholder and Managing Partner of Carib
Hibiscus Development (USA). Locally, he serves on the Board of
Cellsmart Inc. and Santa Fe (Guyana) Limited.
Board of Directors and Management

18
Directors’ ReportThe Directors have pleasure in submitting their Report and Audited Financial Statements for the year ended September 30, 2018.
PRINCIPAL ACTIVITIES
The Bank provides a comprehensive range of commercial banking services at twelve locations throughout Guyana.
FINANCIAL RESULTS
(in thousands of Guyana Dollars)
2018 2017
Net income after taxation 3,134,004 2,738,939
Interim dividend paid 385,000 385,000
Retained earnings 2,749,004 2,353,939
Final dividend proposed 900,000 850,000
DIVIDENDS
An interim dividend of $1.28 per stock unit ($385 million) was paid during the year and a final dividend of $3.00 per stock unit ($900 million) for the year
ended September 30, 2018 is recommended. This, if approved, will bring the total payout for the year to $1,285 million.
CAPITAL AND RESERVES
Capital and reserves other than retained earnings totalled $1,395.4 million as shown in the Statement of Changes in Equity.
Retained earnings at September 30, 2018 is $18,768.9 million (2017 - $14,170.2 million) after a transfer of $2,717.1 million from the General Banking Risk
Reserve, $1,285 million paid out as dividends (final 2018 - $900 million, interim 2018 - $385 million), and $3,134 million transferred from the Statement
of Income for 2018.
DONATIONS
In addition to the Bank’s Power to Make a Difference investment initiatives (see pages 43 to 48), general donations to charitable or public causes for the
year were $7.2 million (2017 - $7.6 million), emphasising the Bank’s strong social investment policy.
SUBSTANTIAL STOCKHOLDING (UNITS OF STOCK)
A substantial stockholder for the purposes of the Securities Industry Act Cap. 73:04 is one who controls five percent or more of the voting power at a
General Meeting. The following are the substantial stockholders of the Bank:
Number of Stock Units Number of Stock Units 2018 % held 2017 % held
Republic Financial Holdings Limited 152,898,395 50.97 152,898,395 50.97
Demerara Mutual Life Assurance Society Limited 16,306,080 5.43 16,306,080 5.44
Guyana and Trinidad Mutual Fire and Life Group of Companies 15,798,760 5.27 15,798,760 5.27
Trust Company (Guyana) Limited 19,617,755 6.54 19,617,755 6.54
Hand-in-Hand Mutual Fire & Life Group of Companies 16,524,875 5.50 15,022,967 5.01
DIRECTORS
In accordance with the Bank’s By-Laws, Anna-María García-Brooks, John G. Carpenter and Nigel M. Baptiste retire from the Board by rotation and being
eligible, offer themselves for re-election.
Board of Directors and Management

19
Directors’ ReportAUDITORS
Messrs. Ram & McRae, Chartered Accountants, have informed the Bank of their willingness to continue in office as Auditors. A resolution proposing
their re-appointment and authorising the Directors to fix their remuneration will be submitted to the Annual General Meeting.
CONTRIBUTION OF EACH ACTIVITY TO OPERATING PROFIT
Banking operations is considered as a single business operation which includes lending, investments, foreign exchange trading and deposit taking. The
contribution or cost from these activities to operating profit is disclosed in the Statement of Income.
GEOGRAPHIC ANALYSIS OF TURNOVER AND CONTRIBUTION TO RESULTS
The Bank operates only in Guyana but several investments are held overseas for which income of $134.8 million (2017 - $280.6 million) was earned
during the year. Please refer to note 23 of the financial statements for further information.
INTEREST OF DIRECTORS AND CHIEF EXECUTIVE AND THEIR ASSOCIATES
Of these categories, only the following persons held stocks in the company, all of which were held beneficially:
Number of stock units 2018 2017
John G. Carpenter 150,000 150,000
Roy E. Cheong 87,000 87,000
(75,000 held jointly with an associate, and 12,000 held by an associate)
Yolande M. Foo 315,000 315,000
(held jointly with associates)
Richard I. Vasconcellos 15,000 15,000
Richard M. Lewis 17,850 _
DIRECTORS’ FEES ($)
2018 2017
Nigel M. Baptiste 2,550,000 2,520,000
John G. Carpenter 1,530,000 1,440,000
Roy E. Cheong 1,710,000 1,680,000
Shameer Hoosein 1,470,000 1,410,000
Richard I. Vasconcellos 1,350,000 1,350,000
Richard M. Lewis 1,380,000 1,320,000
Yolande M. Foo 1,560,000 1,560,000
Anna-María García-Brooks 1,500,000 1,530,000
DIRECTORS’ SERVICE CONTRACTS
There are no service contracts with the directors proposed for election at the forthcoming Annual General Meeting, or with any other directors, which
are not determinable within one year without payment of compensation.
CONTRACTS WITH DIRECTORS
Other than normal banking and employment contracts, there were no contracts between the Bank and its directors or in which the directors were
materially interested.
Board of Directors and Management

20
Directors’ ReportCONTRACT OF SIGNIFICANCE WITH STOCKHOLDER OR ITS SUBSIDIARY
The Bank expended the sum of $106.9 million (2017 - $96.5 million) in fees and expenses under a Technical Services Agreement with Republic Bank
Limited for the provision of management, credit analysis, internal audit and other services. Technical Service fees are determined with reference to the
Bank’s net interest and other income.
Board of Directors and Management

21
Chairman’s Review
NIGEL M. BAPTISTE
Board of Directors and Management

22
Chairman’s ReviewDuring the first six months of 2018, the Guyanese economy grew by
4.5%; a commendable increase above the revised growth rate of 2.9%.
This was fuelled by favourable performances in agriculture, fishing and
forestry (3.4% growth), services (8.2%), and construction (13.4%). There
was also an increased pace in the execution of the Government’s Public
Sector Investment Programme (PSIP), increased importation of building
imports (by 24.7%) and real estate mortgages (5.0%). The Consumer
Price Index (CPI) continued to increase (1.3% as at June 2018) due to
rising food prices, transportation, and communication costs.
Overall, the net domestic credit of the banking system grew by 24.5%,
June on June, because of increases in loans and advances to the private
and public sectors. Loans and advances to the private sector expanded
by 4.1%. Of concern, however, is the increasing proportion of non-
performing loans within the financial institutions’ total loan portfolio.
As a share of total public debt, external debt increased by 3.4% while
domestic debt decreased by 23.3% as at June 2018 relative to the
position at June, 2017.
GROUP DEVELOPMENTS
The Group’s profitability is contingent upon the performance of the
respective territories. While each market experiences unique challenges,
the combined business and growth opportunities across our footprint is
what will enable our success and strengthen our financial performance.
Over the past year, Republic Financial Holdings Limited (RFHL)
commissioned a fully secure Group Data Centre in Trinidad, which
is poised to become the Information Technology hub of our global
operations, enhancing our capabilities and operational efficiencies. This
Data Centre was the first step towards the consolidation of IT activities
across the Group. A major exercise is currently underway between teams
in Guyana and Trinidad and Tobago to harmonise the IT platforms. This
project is expected to be completed in Fiscal 2019 and will generate
improved efficiencies, wider client offerings, including more advanced
mobile products, seamless and consistent client experiences and the
opportunities for skills transfers throughout the Group.
FUTURE OUTLOOK
The economic indicators for the first half of 2018 reflect generally
positive developments in critical growth areas.
We anticipate continuation of this trend for the realisation of the
3.7% growth rate projected for 2018 through the implementation
of the Government-led Public Sector Investment Programme (PSIP),
supplemented by infrastructural development in readiness for the
emerging Oil and Gas sector.
FINANCIAL PERFORMANCE
Stockholders and fellow Directors, I am pleased to advise that for the
year ended September 30, 2018, the Bank recorded another satisfactory
performance, achieving profit after tax of $3,134 million, representing a
14.4% increase over the previous year’s results.
As a result, your Directors have recommended a final dividend of $3.00
($900 million) per stock unit, which, if approved at the Annual General
Meeting, will bring the total dividend for the year to $1,285 million
(2017 - $1,235 million).
ECONOMIC REVIEW
Increases in global demands, supported by accommodative fiscal and
monetary policies, propelled advanced economies to record growth
of 3.8% in 2017, up from 3.2% in 2016. In Emerging and Developing
Economies, growth also improved as a result of increased trade
relationships and domestic demand. There were unpredictable changes
in commodity prices and international financial market disruptions that
resulted in higher inflation rates, though unemployment rates were
unchanged in most world economies. For 2017, growth in Latin America
and the Caribbean was 0.8%, driven largely by private domestic demand.
In Guyana, by the end of 2017, the Gross Domestic Product recorded
2.1% growth, below the revised growth target of 3.1% and below
the 3.4% registered in 2016. Consumer Price Index (CPI) increased
incrementally by 1.5%. The domestic economy was characterised by
several challenges including adverse weather conditions, increased
operational costs and economic uncertainty which impacted key
sectors. The trend, which commenced in 2016, continued in 2017, with
declines in sugar, gold, bauxite and diamond output, and weakened
performances in financial and insurance activities. Growth in the local
economy was therefore driven by increases in rice, forestry, fishing
production and manufactured products, as well as increased activities
in construction, transportation and storage and wholesale and retail
trade.
The banking system’s net domestic credit increased by 9.9% due to
increased borrowing in both the public and private sectors. There
was growth of 2.3% in credit to the private sector when compared
to December, 2016. Notably, there were increases in all sectors of the
economy with the exception of manufacturing, construction and
engineering.
For 2017, the total public debt-to-GDP ratio rose marginally by 0.9% to
46.1% from the projected 2017 figure of 45.2%. External public debt
accounted for 74.3% of the total public debt stock as at December 31,
2017. Total volume of foreign exchange transactions increased by 3.2%
while there was also an increase of 47.9% above the 2016 level of money
transfer transactions.
Board of Directors and Management

23
As Guyana prepares for first oil in 2020, Republic Bank is committed to
supporting this emerging sector as well as Government-led initiatives
to diversify some of the traditional sectors of the economy. International
Oil and Gas companies are committed to further exploration which will
require mobilisation of both foreign and local resources. This is expected
to bolster positive relationships with Small and Medium Enterprises
and further enhance prospects and perspectives of Guyana’s natural
resource potential.
Republic Bank remains committed to the long term sustainable
development of the financial sector through enabling greater access to
affordable financing options across all segments, improved deployment
of technological solutions and meeting the market at the point of need,
while at the same time supporting opportunities for economic growth.
A related ongoing focus is the reorganisation of the Credit and Sales
functions and the development of the teams to understand, anticipate
and meet emerging needs for a much improved customer experience.
Notwithstanding the challenges faced by the economy, Republic Bank
(Guyana) Limited stands well positioned to play a key supporting role in
the Nation’s continuing development.
ACKNOWLEDGEMENTS
I wish to express my sincere thanks to the management and staff for
their diligence and steadfast contribution over the past fiscal year. I am
also grateful to our customers, business partners, stockholders and my
fellow Directors for their confidence and support throughout the year.
Chairman’s Review
Board of Directors and Management

24
Managing Director’s Discussion and Analysis
RICHARD S. SAMMY
Board of Directors and Management

25
INTRODUCTION
In this my fourth year as Managing Director, I am pleased to report that Republic Bank (Guyana) Limited enjoyed another year of satisfactory
performance.
The Bank achieved a profit after tax of $3,134 million, compared to $2,738.9 million in 2017. Apart from the normal banking operations which accounted
for $2,951.4 million, the increase was due to an extraordinary gain realised from the sale of a fixed asset.
Return on Assets increased to 2.02% and Return on Equity to 16.48%. Earnings per Stock unit increased from $9.13 to $10.45.
Against a challenging external environment, the Bank focussed on improving its operational efficiency by aggressively managing costs, restructuring
workflow processes, and reviewing systems and procedures. A key project, which commenced in 2018 and will be completed in 2019, is the Information
Technology Consolidation Initiative that will harmonise the Bank’s IT platforms with other members within the Republic Group, ultimately advancing
our technology and improving our product and service offerings to our customers.
CUSTOMER SERVICE
What matters ultimately to our customers is how we make them feel. Experience is everything and remains the distinguishing factor that sets us apart,
fosters loyalty and promotes advocacy. Customer-obsession is a key strategic pillar at Republic Bank, and we are passionate about delivering high
quality customer service and experience.
In addition to our suite of convenience offers, we are constantly engaging our customers in person, and via traditional and digital media to enable
insight-driven relationships and service delivery that align with our vision and customers’ expectations.
Internally, we have maintained the development of our teams as a key strategy for strengthening this core competency. Training, guidance,
engagement, and nurturing are among our non-traditional offers to existing and prospective customers across our communities aimed at building
capacity and knowledge. Through our Group Innovate initiative, there is deepened employee focus on identifying unique approaches to improve the
customer experience.
In a 2018 independent Customer Service satisfaction survey of the banking sector, Republic Bank (Guyana) Limited received confirmation of our strong
standing in a highly competitive environment. Our outlook for 2019 is one of positive anticipation of even stronger and more rewarding relationships
across all customer segments.
HUMAN RESOURCES
The Bank recognises that our most valuable asset is our human resource. In this regard, we continue to focus on enhancing working relationships across
all levels by fostering a climate of open communication, respect, and trust.
Efforts are ongoing to ensure that employees have a connection with their work and colleagues. To this end, the Bank’s emphasis on employee
engagement has intensified with several human resource initiatives implemented during the fiscal year including setting the stage for a Mentorship
Programme and the phased introduction of a new Performance Management System which incorporates a 360-Degree Feedback component.
Training and development of our staff remain a major priority, with emphasis on Credit Training as we continually seek to enhance knowledge and
capacity in our lending activities. We have also conducted staff sensitisation sessions relevant to the emerging Oil and Gas Sector and have a customised
approach to this industry as the Bank positions itself for business opportunities. Training specific to the Group’s Information Technology Consolidation
Initiative also commenced and will continue into the new fiscal year.
Fourteen students from several regions benefited from seven months of exposure to various aspects of the Bank’s operations under our 2017/2018
Youth Link Apprenticeship Programme. These graduates remain appreciative of the opportunity, especially given the Caribbean Vocational Qualification
status of the Programme.
Managing Director’s Discussion and Analysis
Board of Directors and Management

26
Managing Director’s Discussion and AnalysisINFORMATION TECHNOLOGY
Our electronic banking platforms afford customers transaction convenience, whether they are on the go or in the comfort of their homes or offices
conducting daily business.
The use of the Republic Visa OneCard expanded over the past year as an increasing number of this card base transitioned to less cash-based
transactions. In our customer education efforts to support this thrust, social media communication has been an effective means of engagement and
encouragement.
As the face of banking continues to evolve, our commitment is to improve the Bank’s technological capabilities via upgrades to our primary computing
systems, network infrastructure, and ancillary systems.
As previously stated, during the year, we commenced work in preparation for significant new Information Technology improvements in core
functionality and deployment of new emerging technologies for leading edge IT efficiencies. Among the anticipated benefits are improved digital
services and an overall seamless digital customer experience.
PREMISES
The Bank remained steadfast in its focus on customer convenience. Reorganisation and expansion of our Linden and New Amsterdam branches were
completed, resulting in a significantly positive impact on customer service and efficiency. Similar upgrades are planned for our Vreed-en-Hoop Branch
in the new fiscal, with infrastructure plans in train to accommodate Personal and Private Banking at specific locations.
EMPOWERING COMMUNITIES
Nation building through social investment has been a legacy of Republic Bank for more than 180 years, and remains a key cornerstone of the Bank’s
mission.
Over the past year, several important milestones were celebrated and stories shared about the life-changing, community-altering, nation-building
impact of our signature Power to Make A Difference initiative.
Republic Bank’s intervention and contribution to Steel Pan over of the past decade has created an upsurge and a revival of the art form that have
positively touched lives in central and remote communities. Through empowerment and meaningful strategic partnerships with the Department of
Culture and the National School of Music, skilled, energetic, and enthusiastic youths now dominate the art form, enlivening the now much anticipated
Republic Bank Mashramani Panorama Steel Band competition, and providing entertainment and year-round displays both at home and abroad. Several
beneficiaries have spoken of skills learnt and discipline honed during their journey in Pan that will benefit them for a lifetime.
The Bank’s Youth Link Apprenticeship programme has also seen a decade of growth and is viewed as a life changing opportunity to which many of
Guyana’s youth now aspire.
Our Staff Volunteerism Programme is another success story that is largely focussed on improving literacy and wellbeing among youth in the
communities we serve.
Republic Bank’s vision and effort to increase Autism awareness have attracted wider support and ongoing advocacy. Notable strides were also made in
improving capabilities among the students of the Step by Step Foundation.
Through continuing partnership with Women Across Differences (WAD), we have seen wider support for the causal and impacting issues affecting teen
mothers. We celebrate an emerging empowered cadre of beneficiaries who volunteer to assist those experiencing similar issues. This, combined with
support and favourable Government intervention, has strengthened and motivated the affected; giving them a voice, purpose, hope, and the will to
rise above their circumstances.
An ongoing highpoint of our social investment is our flagship environmental project: Maintenance of the Promenade Gardens – a heritage site and
venue for a variety of cultural and national events.
Board of Directors and Management

27
Managing Director’s Discussion and AnalysisThe upcoming five-year phase of the Power to Make A Difference will seek to expand on the successes achieved in previous years with a pronounced
emphasis on building and developing entrepreneurs, empowering SMEs and promoting a greener Guyana through conservation awareness.
REGULATORY COMPLIANCE
Guyana continues to implement and improve its regulatory framework in order to establish robust enforcement units to counter the growing threats
of money laundering and terrorist financing. Consistent with this, local regulatory bodies with oversight of financial institutions provide the necessary
guidance to ensure compliance by all relevant persons and entities with legislative requirements.
Republic Bank (Guyana) Limited, through its various systems and procedures, is committed to the ongoing fight against money laundering and terrorist
financing and, in this regard, has continued to embrace local and international best practices. Among a host of other initiatives, the Bank has continued
with its staff awareness and customer engagement initiatives and plans to implement AML/CFT software within Fiscal 2019 to further strengthen its
compliance.
The Bank is fully compliant with the US Foreign Account Taxation Compliance Act (FATCA) enacted by the United States Government in 2010 and is
committed to ensuring timely submission of information.
We present below a discussion and analysis of the financial position and performance of the Bank for the year ended September 30, 2018 to be read in
conjunction with the Directors’ report and audited financial statements presented on pages 18 to 20 and pages 50 to 131 respectively.
These statements are published in Guyana dollars. Foreign amounts have been converted to Guyana dollars at the prevailing mid-rate on September
30, for each financial year. The following are the mid-rates for the major currencies as at September 30, 2018:
2018 2017
United States dollars 210.00 209.25
Pounds Sterling 261.50 250.75
Canadian dollars 156.50 150.75
Euro 234.50 215.75
STATEMENT OF INCOME REVIEW
Financial Summary
After tax profit of $3,134 million represents an increase in profitability of $395.1 million or 14.42% compared with 2017. This increase in profitability
resulted largely from the sale of a fixed asset. Focus on improving credit assessment, lendings and debt recovery will continue in the new fiscal.
Corporation Tax paid amounted to $1,423.7 million compared with $1,705.8 million in 2017.
Board of Directors and Management

28
The Bank’s return on average assets (2.02%) increased year-on-year, and its return on average stockholders’ equity also increased (16.48%). Earnings
per stock unit moved from $9.13 in 2017 to $10.45 in 2018.
Managing Director’s Discussion and AnalysisProfit Before Tax ($Millions) Profit After Tax ($Millions)
5,500
5,000
4,500
4,000
3,500
3,000
2,500
2,000
1,500
1,000
500
0
3,500
3,000
2,500
2,000
1,500
1,000
500
02018 2017 2016 2015 2014 2018 2017 2016 2015 2014
4,22
8.8
2,73
8.9
4,66
4.6
3,13
4.0
4,26
0.9
2,70
3.0
4,30
2.4
2,81
5.9
3623
.4
2,33
9.4
Return on Average Assets (%) Return on Average Outstanding Equity (%)
25.00
20.00
15.00
10.00
5.00
0
2.50
2.00
1.50
1.00
0.50
02018 2017 2016 2015 2014 2018 2017 2016 2015 2014
1.83
15.6
92.02
16.4
81.82
16.8
82.03
19.7
81.78
18.16
Board of Directors and Management
29
8,500
8,000
7,000
6,000
5,000
4,000
3,000
2,000
1,000
0
800
700
600
500
400
300
200
100
02018 2017 2016 2015 2014 2018 2017 2016 2015 2014
7,705
.1
575.
0
7,97
4.5
570.
0
7,671
.4
603.
5
7,130
.6
589.
8
6,80
5.7
657.3
Managing Director’s Discussion and Analysis
Board of Directors and Management
Interest Income ($Millions) Interest Expenses ($Millions)
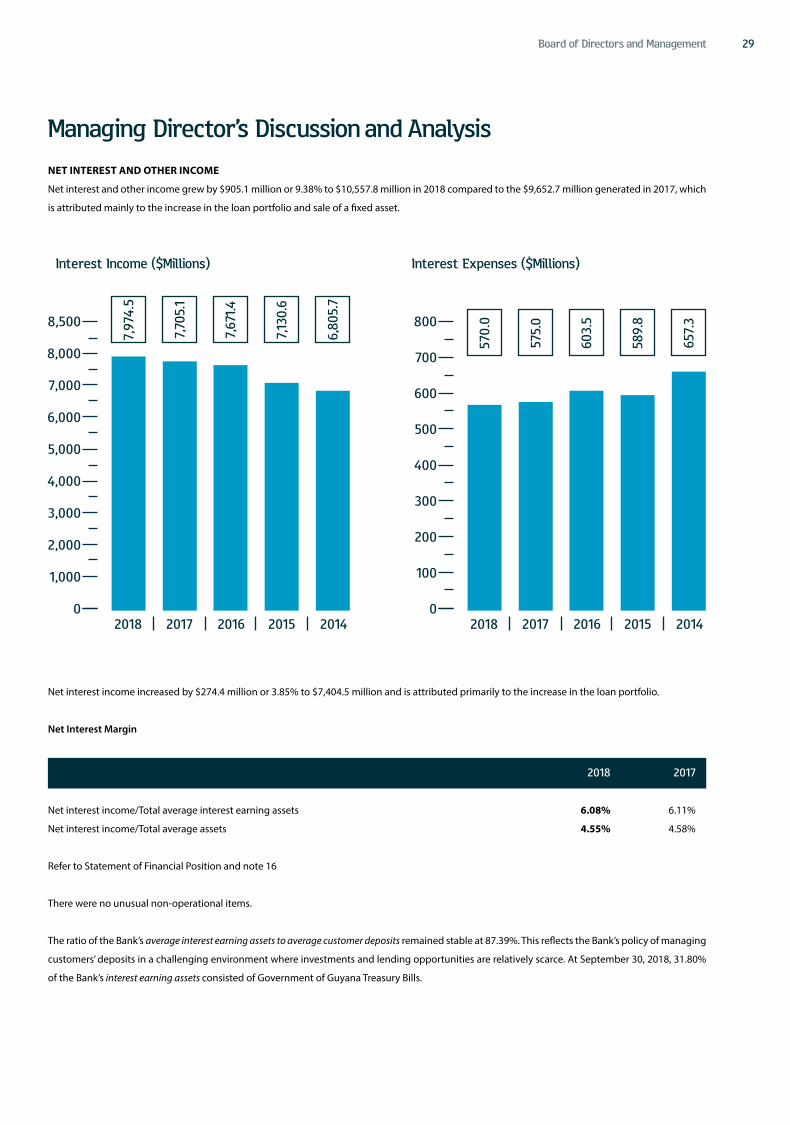
NET INTEREST AND OTHER INCOME
Net interest and other income grew by $905.1 million or 9.38% to $10,557.8 million in 2018 compared to the $9,652.7 million generated in 2017, which
is attributed mainly to the increase in the loan portfolio and sale of a fixed asset.
Net interest income increased by $274.4 million or 3.85% to $7,404.5 million and is attributed primarily to the increase in the loan portfolio.
Net Interest Margin
2018 2017
Net interest income/Total average interest earning assets 6.08% 6.11%
Net interest income/Total average assets 4.55% 4.58%
Refer to Statement of Financial Position and note 16
There were no unusual non-operational items.
The ratio of the Bank’s average interest earning assets to average customer deposits remained stable at 87.39%. This reflects the Bank’s policy of managing
customers’ deposits in a challenging environment where investments and lending opportunities are relatively scarce. At September 30, 2018, 31.80%
of the Bank’s interest earning assets consisted of Government of Guyana Treasury Bills.

30
Interest paid on deposits for 2018 at $570 million was below that of 2017 ($575 million) as the Bank continued to manage its assets and liabilities in an
environment of inadequate investment opportunities. It is recognised, however, that customers simultaneously use a range of products and the Bank
strives to ensure that rates (deposit and lending) are competitive with the rest of the industry and attractive to existing and potential customers.
Other Income, which amounted to $3,153.3 million and contributed 28.34% to total income, was above the 2017 amount by $630.7 million, or 25%.
With continued emphasis, foreign exchange trading increased, resulting in exchange gains for 2018 of $1,399.4 million, representing an increase of
$204.8 million or 17.15% over 2017. Exchange earnings continue to be the major source of Other Income, contributing 44.38% (2017 - 47.36%) of the
total.
Non-interest Expenses
Non-interest expenditure, which comprises operating expenses and provision for expected credit losses, increased by $469.3 million or 8.65% over
2017, mainly as a result of staff cost, which increased to $2,415.2 million. There was an increase in depreciation charges ($61.7 million), resulting from
the capitalisation of new assets. There was a significant increase in expected credit losses net of recoveries of $234.6 million, resulting from an increase
in expected credit losses, as the Bank early adopted IFRS 9: Financial Instruments and now makes provision for all expected credit losses.
The Bank’s productivity/efficiency ratio, which is non-interest expenses to net interest income and other income, decreased to 47.43% from 49.19% in
2017.
As permitted, the Bank early adopted IFRS 9 - Financial Instruments, which replaces IAS 39. The adoption of IFRS 9 has fundamentally changed the Bank’s
accounting for financial asset impairments by replacing IAS 39’s incurred loss approach with a forward-looking expected credit loss (ECL) approach.
IFRS 9 requires the Bank to record an allowance for ECLs for all loans and other debt financial assets not held at FVPL, together with loan commitments
and financial guarantee contracts. The allowance is based on the ECLs associated with the probability of default in the next twelve months unless there
has been a significant increase in credit risk since origination.
The financial statements include expected credit loss provision made on its performing portfolio of $319.5 million at September 30, 2018.
Sources of Revenue (%) Revenue Distribution (%)
Salaries/Staff Cost 22%
Other Non-Interest Expenses 21%
Reserve and Retained Earnings 17%
Taxation 14%
Dividends 11%
Premises and Equipment 10%
Interest Expense 5%
Loans & Advances 62%
Other 16%
Foreign Business 13%
Investments 9%
22%
62%
17%
14% 21%16%
11%13%
10%9% 5%
Managing Director’s Discussion and Analysis
Board of Directors and Management

31
At September 30, 2018, specific provision on non-performing loans amounted to $482.7 million, a decrease of $106.7 million over 2017. Overall in 2018,
expenses related to expected credit loss provisioning amounted to $885.4 million against a provision of $675.7 million in 2017. The Bank continues
to strive to maintain a prudent policy especially on its unsecured consumer lending portfolio. Recoveries on loans that were previously written-off
amounted to $206.9 million in 2018 (2017 - $231.8 million).
The Bank’s ratio of non-performing to performing loans, as at September 30, 2018, declined to 5.77% from 6.96% in 2017, and its ratio of specific
provision for loan losses to non-performing loans, from 14.37% at September 30, 2017, to 12.26% at September 30, 2018.
STATEMENT OF FINANCIAL POSITION REVIEW
Cash and Cash Equivalents
Cash and cash equivalents, which include cash-on-hand, deposits held with correspondent banks, claims on other banks and balances in excess of the
statutory deposit increased by $10 billion year-on-year. This increase was mainly in the Bank’s statutory deposit balance with the Bank of Guyana, which
grew by $9.5 billion over the same period, resulting from the inability to fully re-invest in Treasury Bills upon maturity.
Investment Securities
Investment securities, including Government of Guyana Treasury Bills, increased by 2.76% during the year ($1.3 billion). The increase arose mainly in
the Bank’s investment in other investments which moved from $7.4 billion in 2017 to $15.7 billion in 2018 or 110.92%. There was a decrease in Treasury
Bills by $6.9 million, or 17.34%, to $33.1 billion. The Bank aggressively competes for the limited investment opportunities even as there is continuous
growth in the liquidity of the country’s financial houses relative to those investments.
Advances
Advances grew by $8.9 billion to $69.7 billion, an increase of 14.73%. The concentration by sector in the loans and advances portfolio, a function of the
Bank’s Credit Risk Management process, remained fairly constant during the year. The Bank’s investment in agriculture remained at a minimum as it
continues to reassess the position as circumstances change.
Significantly, however, the Demand Loans sub-sector recorded a 20.53%
increase in value from $31.2 billion to $37.6 billion. The Mortgages sub-
sector recorded a 9.53% increase from $23.2 billion to $25.4 billion;
the Bank continues to aggressively support the government’s home
ownership thrust.
As a percentage of total assets, loans and advances accounted for
41.47%.
Total Assets
The Bank’s total assets of $168.2 billion represent an increase of $21.9
billion or 15.01% above 2017. This increase is attributed mainly to
cash resources, investment securities, and loans and advances, which
accounted for an increase of $8.9 billion. Over the past three years,
net investment in loans and advances grew by $6.1 billion, $2.7
billion and $8.9 billion year-on-year. In a challenging and competitive
environment for sound economic projects, the Bank continues to seek
and attract new and remunerative investments, even as it honours its
obligation to protect depositors’ funds.
Total Assets ($Billion)
180
150
120
90
60
30
02018 2017 2016 2015 2014
146.
2
168.
2
151.6
142.
4
129.
0
Managing Director’s Discussion and Analysis
Board of Directors and Management

32
Deposits
The increase in assets resulted from an increase in deposits, which moved to $144.7 billion from $124.9 billion in 2017; an increase of $19.8 billion or
15.84%. Our depositors remain confident in the Bank as it continues to focus on providing quality products and services. Savings deposits, the most
stable category of deposits at 70.88% of the deposit portfolio, increased by $19.5 billion or 23.47%. The Certificates of Deposit portfolio increased
marginally by $114.5 million or 1.88%.
CAPITAL STRUCTURE AND RESOURCES
The Bank’s policy is to maintain capital adequacy, ensure capital growth and minimise capital impairment. The governing Financial Institutions Act Cap.
85:03 restricts a single or group borrower loan to defined percentages of the Bank’s capital base. From the after tax profits of $3,134 million, $1,285
million is being proposed as dividends and $1,849 million transferred from the Statement of Income to stockholders’ equity. At September 30, 2018,
the book value of stockholders’ equity amounted to $20.2 billion.
Total dividends paid and proposed for fiscal 2018 amount to $1,285 million and equates to a dividend payout ratio of 42.92% (2017 - 45.18%).
There was an increase in the price at which the Bank’s stock traded on the Guyana Stock Exchange with a spread of 144.7% between the highest price
of $208 and lowest price of $85 with an average weighted price of $137.5 per stock unit. In terms of volume, most trades were done at a unit price of
$137.5. Using the Market Weighted Average Price of $137.5 from the last trade date (September 17, 2017) for the Bank’s stock, the price/earnings ratio
increased to 19.9 from 12.6 in 2017. The net asset value of one unit is $67.2 (2017 - $61) which, with a price of $208, gives a price/book ratio of 3.09:1
(2017 - 1.89:1).
Regulatory Capital
Capital adequacy is monitored by the Bank on a monthly basis and computed based on guidelines developed by the Basel Committee on Banking
Regulations and Supervisory Practice (the Basel Committee), as implemented by the Bank of Guyana under the Financial Institutions Act Cap. 85:03.
Total Deposits ($Billion)
160
120
80
40
0
25,000
20,000
15,000
10,000
5,000
02018 2017 2016 2015 2014 2018 2017 2016 2015 2014
124.
9
18,30
0.5144.
7
20,16
4.3131.2
16,71
5.4123.
7
15,22
3.6112.
6
13,56
3.5
Managing Director’s Discussion and Analysis
Board of Directors and Management
Stockholders’ Equity ($Million)

33
The risk-based capital guidelines require a minimum ratio of capital to risk-weighted assets of 8%. The results for this year have further strengthened
the Bank, with its capital base growing from $18.3 billion to $20.2 billion year-on-year. The capital adequacy ratio increased, moving to 26.10%
at September 30, 2018, from 25.53% at September 30, 2017. This increase is attributable to an increase in total risk-weighted assets.
RISK MANAGEMENT
Overview
Banking is about risks and their management. These are discussed extensively on pages 107 to 122 of this Annual Report.
Having established an Enterprise Risk Management Unit in fiscal 2017, the Bank remains focussed on continuously monitoring its operating environment
and practices to ensure requisite identification, mitigation, and management of risks. The Bank also benefits from the continuous guidance and services
of the Group’s Enterprise Risk Unit and, during the year, implemented several measures to reduce the inherent risks in its business model.
The Bank’s Internal Audit Department is also integrally involved in reviewing and implementing systems and procedures aimed at mitigating risk.
The Department, through its random audits and internal verification processes, is tasked with ensuring that the integrity of the Bank’s operations is
maintained.
FUTURE OUTLOOK
Notwithstanding the ongoing challenges in certain key sectors of the economy, we are confident in the plans and possibilities for Guyana’s accelerated
economic, infrastructural and social development. The demonstrated growth in investor confidence augurs well for the nation’s future outlook and
Republic Bank’s integral support and contribution are assured.
Republic Bank (Guyana) Limited remains cognizant of the critical importance of stability and compliance and we welcome advances that enable and
foster integrity of systems, uniform standards and internationally accepted controls. The Bank will continue to implement policies and strategies in
support of this thrust.
Capital Adequacy (%)
28.00
24.00
20.00
16.00
12.00
8.00
4.00
02018 2017 2016 2015 2014
25.5
3
26.10
24.0
7
23.5
4
21.18
Managing Director’s Discussion and Analysis
Board of Directors and Management

34
Managing Director’s Discussion and Analysis
Over the coming year, we shall deepen our focus on delighting key segments, offering a seamless and consistently satisfactory customer experience
supported by enhanced information technology, making employee engagement our culture, maximising efficiency, and investing socially for greatest
impact.
Our stakeholders can therefore look forward to stronger partnerships, quality service and impactful initiatives for long-term national benefit.
ACKNOWLEDGEMENTS
On behalf of the Bank’s Senior Management, I am pleased to extend my sincerest gratitude to all of the Bank’s valued stakeholders. We also extend
gratitude to our Management and Staff for yet another year of strong commitment.
We especially wish to thank the Chairman and Board of Directors for their guidance, our stockholders for the confidence reposed in us, and loyal
customers – our reasons for being here.
To all of you, your continued support is sincerely appreciated.
Board of Directors and Management

35
Senior Management
PARBATIE KHAN General Manager, Credit
DENISE HOBBS General Manager, Operations
RICHARD S. SAMMY Managing Director,Republic Bank (Guyana) Limited
Board of Directors and Management

36
KAREN ASSANAH Manager, Special Unit
DENYS BENJAMIN Manager, Corporate Operations
DOODMATEE BHOLLARAM Manager,Corriverton Branch
CELINE DAVIS Manager,Water Street Operations
HARRY DASS GHANESS Manager,Camp Street Branch
STANTON GRANT Manager, Internal Audit
Management
Board of Directors and Management

37
EON GRANT Manager,Rose Hall Branch
YONNETTE GREAVES Manager, Information Technology
GAIL HARDING Assistant Manager, Branch Operations
SASENARAIN JAGNANAN Senior Manager, Corporate and Commercial Credit
ERICA JEFFREY Manager, Branch Support Services
MICHELLE JOHNSON Manager, Marketing and Communications
Management
Board of Directors and Management
DENYS BENJAMIN Manager, Corporate Operations
STANTON GRANT Manager, Internal Audit

38
Management
NDIDI JONES Senior Manager, Head Office
CHRISTINE MC GOWAN Manager, Legal Services
SHRIMANIE MENDONCA Manager, Human Resources
YUGISTHER MOHABIR Assistant Manager, Information Technology
SHRIDATH PATANDIN Manager, Vreed-En-Hoop Branch
JADOONAUTH PERSAUD Manager, Branch Operations
Board of Directors and Management

39
Management
MICHAEL RAM Manager, Enterprise Risk Management
GUITREE RAMSAMOOJ Manager, Anna Regina Branch
CARLA ROBERTS Corporate Manager, Corporate and Commercial Credit
ORAL ROSE Manager,
Internal Audit
IMRAN SACCOOR Manager, D’Edward Branch
RANDULPH SEARS Manager,New Amsterdam Branch
Board of Directors and Management
JADOONAUTH PERSAUD Manager, Branch Operations

40
Management
JOEL SINGH Manager, Linden Branch
VANESSA THOMPSON Manager, Finance and Planning
JOANN WILLIAMS Assistant Manager, Human Resources
DIANE YHUN Credit Manager, Corporate andCommercial Credit
Board of Directors and Management

41
The rules and systems by which companies are directed and controlled
are referred to as corporate governance. In recent times, corporate
governance has become of greater significance especially since it usually
has a direct effect on the strength of an entity and its ability to withstand
the challenges of doing business. For this reason, shareholders and
stakeholders of companies pay greater attention to whether companies
have good corporate governance principles. From the perspective of a
company, the adoption and practice of good corporate governance can
assist in balancing conflicting stakeholder interests.
Republic Bank (Guyana) Limited recognises the importance of good
corporate governance and its Board of Directors is committed to
consistently maintaining corporate governance at the highest standards.
In keeping with this commitment, Republic Bank continuously monitors
its systems and procedures to ensure that all standards are in keeping
with the best practices as determined by the principles of Corporate
Governance. The Bank is also guided by the Recommendations for a
Code of Corporate Governance issued by the Guyana Securities Council,
and Supervision Guideline No. 8 on Corporate Governance issued by
the Bank of Guyana under the authority of the Financial Institutions Act
Cap. 85:03. The Bank has adopted the recommendations contained in
that Guideline. This statement is made pursuant to the abovementioned
Supervision Guideline No. 8. In addition, the Bank is compliant with
Supervision Guideline No. 10 on the Public Disclosure of Information.
The Board of Directors comprises nine directors including one executive
director. The non-executive directors, six of whom are independent,
comprise persons with extensive experience in business, management
and finance, and provide invaluable input at meetings through their
personal values and standards arising from their varied and distinct
backgrounds. Together, the Board members provide entrepreneurial
leadership within a framework of prudent and effective controls. In
keeping with the Bank’s culture of broad disclosure, the Executive
Director ensures that all pertinent information relevant to the Bank’s
operations is provided to members of the Board of Directors. This
allows the Board of Directors to make informed decisions and provide
the necessary leadership to promote and protect the interests of all
stakeholders.
In keeping with its mandate to lead the Bank, the Board directs the Bank
along a path of greater profitability while taking appropriate steps to
ensure that the Bank’s sound financial position is not compromised
and all applicable laws adhered to. The Board is guided by a
philosophy based on good governance, transparency, accountability
and responsibility. Of critical importance to the Board of Directors is
Statement of Corporate Governance Practicesthe responsibility to approve and review the Bank’s Strategic Plan
and, within this context, to approve Annual Budgets, including capital
expenditure. The Board retains the responsibility for reviewing and
approving credit applications above a specified limit. Pursuant to the
mandate to ensure that the interests of the various stakeholders are
considered, the Board of Directors meets, at a minimum, on a quarterly
basis while the Executive Sub-Committee of the Board, chaired by
Mr. Roy E. Cheong, comprising seven Board members, meets monthly
for the remaining months.
In accordance with the Bank’s By-Laws, three directors retire from the
Board annually and may offer themselves for re-election at the Bank’s
Annual General Meeting.
The following Board committees exist to ensure the Bank’s commitment
to maintaining the highest standards of Corporate Governance:
AUDIT COMMITTEE
The members of the Audit Committee are:
Chairman
Mr. Roy E. Cheong
Members
Mr. Shameer Hoosein
Mr. Richard M. Lewis
Mr. Richard I. Vasconcellos
Mrs. Yolande M. Foo
Alternate Member
Mr. John G. Carpenter
The Audit Committee of the Board meets at least quarterly to review
the Bank’s system of internal control, financial reporting process,
audit and examination process, and compliance with statutory and
regulatory laws. When necessary, the Audit Committee is responsible
for reviewing the independence, competence and qualifications of
the External Auditors. The External Auditors have full and free access
to, and meet, when necessary, with the Audit Committee to discuss
their audit and findings as to the integrity of the Bank’s financial and
accounting reporting and the adequacy of the system of internal
controls. The External Auditors receive notice of every meeting of the
Audit Committee and may attend as of right. The head of the Bank’s
Internal Audit Department reports directly to the Audit Committee.
The Internal Audit Department conducts periodic examinations of all
aspects of the Bank’s operations to ensure that management’s controls
for the integrity and fairness of the financial statement and accounting
systems are adequate and are complied with.
Board of Directors and Management

42
COMPENSATION COMMITTEE
The members of the Compensation Committee are:
Chairperson
Mrs. Anna-María García-Brooks
Members
Mr. Shameer Hoosein
Mr. Roy E. Cheong
Alternate Member
Mrs. Yolande M. Foo
This Committee, which meets at minimum once per year, is responsible
for formalising the Bank’s remuneration policy for staff.
ENTERPRISE RISK COMMITTEE
The members of the Enterprise Risk Committee are:
Chairman
Mr. John G. Carpenter
Members
Mr. Roy E. Cheong
Mrs. Anna-María García-Brooks
Alternate Member
Mr. Richard M. Lewis
This committee, which meets quarterly, is responsible for reviewing
policies and procedures and ensuring that all risks arising across the
wide spectrum of the Bank’s activities are identified and adequate
systems have been implemented in order to mitigate those risks.
The Enterprise Risk Committee is also responsible for overseeing the
management of the Bank’s Anti-Money Laundering and Countering
the Financing of Terrorism (AML/CFT) Programme, and ensuring that
adequate systems and procedures are implemented to prevent and
detect attempts to launder money and/or finance terrorism.
The Board of Directors has approved an organisational structure for the
Bank which ensures a reporting structure with prudent and effective
controls. The Managing Director and management team are appointed
by the Board of Directors. Each Management Officer has a written
mandate and is required to execute the stated functions as outlined
therein. Key areas of responsibility are outlined and adherence to the
Bank’s core values is mandatory.
The Managing Director’s duties and authorities are documented and
approved by the Board of Directors. Limits on credit dispensation, capital
and operating expenditure are stated specifically in the Managing
Director’s authorities. In keeping with good corporate governance
principles, the Managing Director is charged with the day-to-day
management of the Bank’s business and is ably assisted by a competent
and experienced management team. The Bank’s two General Managers
report directly to the Managing Director. Senior Management, which
has a combined banking experience of more than ninety years, has
general oversight of the Bank’s credit portfolio, branch network and
general operations. Two members of Senior Management have a
Masters Degree in Business Administration, while the other is qualified
in Business Management, making the team extremely qualified to offer
leadership to the management team.
The Board of Directors ensures that the compensation package for staff
is competitive. The package consists of basic salary and performance
based incentives. In determining the basic salary to be paid to officers of
the Bank, including Management Officers, the responsibilities attached
to the position are assessed. This forms the core basis for the basic
salary of each employee.
The performance of each staff member is evaluated annually based
on individual and collective performance criteria. In keeping with
the expectation of the Board of Directors, the performance of each
Management Officer is also assessed against all Key Performance
Areas which, among other things, may include financial targets. The
performance of all Management Officers is reviewed by the Board of
Directors on an annual basis.
Cognizant of the need to monitor transactions with related parties, the
Bank has approved a Related Party Policy which is consistent with the
requirements of the Financial Institutions Act Cap. 85:03.
The Bank’s Related Party Policy underscores the need for all transactions
done with related parties and affiliates to be done on the same terms
and conditions as with a non-related party. Directors are required
to disclose their interest in related party transactions and to recuse
themselves from considering or approving transactions in which
they have an interest. All material related party transactions must be
approved by the Board of Directors. On an annual basis the Board of
Directors reviews a report on related party transactions in order to
ensure compliance with the Bank’s Related Party Policy.
The Bank regards its business and the banking affairs of its customers
and clients as confidential, and has established rules to ensure the
highest ethical standards in this regard. These rules pertain to honesty
and integrity, integrity of records, client privacy, proprietary bank
information, insider information, and non-discrimination among others.
The Bank encourages its stockholders to communicate all issues of
concern orally or in writing. All stockholder concerns are addressed in a
prompt and efficient manner by Management.
Signed on behalf of the Board
Nigel M. Baptiste
Chairman
Statement of Corporate Governance Practices
Board of Directors and Management

43Board of Directors and Management
Making the difference to the Dif ferently Able
Far too often, people with physical and learning
disabilities have less access to education, personal
and professional development, and a better quality of
life. Any effort to empower those with special needs
must have at its heart the commitment to draw closer
in solidarity, as well as the drive to work together to
promote a culture of fellowship and inclusion through
respect and equality.
03Corporate Social Responsibility

44
RIGHT
Excellence in
education! The
University of Guyana
Best Graduating Student
with a Diploma in Banking
and Finance being rewarded at
the annual Power to Make A Difference
Academic Achievement Awards
BELOW
First Aid Training — Youth Link Apprentices
practice CPR techniques and learn life-
saving measures during their
Care-A-Van Project

45Corporate Social Responsibility
The Power to Make A Dif ferenceTEAMWORK IN BUILDING STRONGER COMMUNITIES
The promise of the Power to Make A Difference is its ability to unite
many people across boundaries of space and culture in the pursuit of
building stronger, more sustainable communities.
Since its inception in 2003, that promise has consistently gained
momentum as a growing corporate social responsibility movement,
taking the shape of a significant investment of financial and human
resources in programmes that challenge young minds and bodies, give
hope to and empower thousands with special needs, preserve and
promote cultural traditions, protect the environment, and embolden
hundreds of staff volunteers.
This has been the narrative of the Power to Make A Difference – an
ongoing journey to unlock the potential of the people we serve. It
stands today as an extension of the Bank’s commitment to do good by
doing better – doing good by pledging support to noble causes; doing
better in the service of others.
As we look back on that journey, working with diverse communities
through the years, the way forward is as clear as the path taken. It has
been a path full of unforgettable experiences, challenges, and triumphs;
one that serves well as a reminder of what worked well in the past and
encouragement to search for new avenues in the future.
Through one partnership, one commitment, and one goal at a time, the
Power to Make A Difference has grown stronger. It has evolved through
the years to represent the Group’s longstanding promise to help build
communities in the Caribbean, South America, and Ghana. In entering
this new phase, the Power to Make A Difference remains driven by a
renewed sense of purpose and greater acceptance of the multinational
responsibility that comes with strategic social investment and the
pursuit of sustainable development.
THE FOUNDATION (Phase I)
“The Republic Group believes that all of our Caribbean citizens deserve a
better quality of life and we owe it to them to harness the power that we
possess to make a positive difference in their lives. The voiceless should
not be silenced behind statistics. The helpless must not be bogged down
by apathy and an unwillingness to assist. The destitute cannot be swept
to the wayside because of greed and selfishness. These are our people
and we must do something to alleviate their condition.”
– Ronald F. deC. Harford
The special needs child able to experience more of the world around
them, the dyslexic student learning alongside peers, the young
footballer pursuing a future through scholarship, the senior citizen who
now has a comfortable place to sleep – their well-being, their successes,
their smiles – these are the reasons the Power to Make A Difference
exists.
Starting out from the Make a Difference Fund, founded in 1998 in
Trinidad and Tobago, the Power to Make A Difference programme took
its first steps in 2007 with sights set on supporting initiatives based
on poverty alleviation, social development, and youth development
through education, sport, culture and the arts.
Built upon four pillars – The Power to Care, The Power to Help, The
Power to Learn, and The Power to Succeed – the Power to Make
A Difference would quickly add to the Bank’s history of successful
partnership with advocacy groups, welcoming new and long-time allies
to the fold.
During this first phase, several partnerships were formed with a diverse
array of NGOs and CBOs whose projects and initiatives showed the most
promise in building successful societies and empowering individuals.
The Bank charted forward on the Republic RightStart Under-15 Cricket
Series, which, in helping develop the national cricket programme, also
created an invaluable opportunity for young achievers to hone their
cricketing skills, and learn more about integrity, discipline, team spirit,
dedication and perseverance; skills that would serve them not only in
the game of cricket, but in the game of life.
A new partnership with the University of Guyana Scholarship paved
the way for the Bank to focus further on youth development through
education, giving many students the tools to succeed through training
and scholarship programmes, and thereby sowing the seeds for future
leaders to blossom.
Through funding a scholarship programme as well as awards for
the best graduating students in Social Sciences and Banking and
Finance and the sponsorship of the Ministry of Education’s Academic
Achievement Awards, the Bank celebrated academic excellence as a
way of motivating young achievers to aspire to more.
Community outreach programmes like the much-needed refurbishment
and maintenance of the Promenade Gardens helped preserve a unique
and historical space for the benefit of thousands within the nation
and visitors alike. Collaboration on the Theatre Guild Rehabilitation
project to build a new theatre to allow local talent to blossom and
grow, as well as sponsorship of a room at the St. Joseph Mercy Hospital
for patients in dire need of care furthered the programme’s ongoing
history of strategic community investment as a major aspect in driving
sustainable development.
The achievements of this first phase in turn set the proper backdrop
as the Bank entered into Deeds of Covenant with a variety of advocate
agencies dedicated to the aged, orphaned, and differently able.

46 Corporate Social Responsibility
The foundation having been firmly set, the focus then turned outward
as the Republic Group continued its evolution as a truly Caribbean
organisation; one intent on making good on the promise of building
successful, sustainable societies, not just locally but across borders.
BUILDING A FOLLOWING (Phase II)
“The Power to Make A Difference celebrates that which sets us apart
and that which holds us together. Diversity and inclusion. It celebrates
that fact that we each possess and have an obligation to use the power
to make a real difference in our own lives and in the lives of others.” –
Michael Archibald
Across the region, the Group had already been doing its part in the
pursuit of sustainable development. Not surprisingly, as the Group’s
footprint grew, so too did its outreach to even more members of
society and the Power to Make A Difference quickly took root locally
and across the region.
With a focus on youth empowerment, flagship programmes the
Republic RightStart Under-15 Cricket Series Scholarship Programme
continued to be well received; giving hundreds of young achievers
alternative means for self-development and the impetus to realise the
tremendous potential that abounds within.
Additionally, the ongoing partnership with the University of Guyana
and Ministry of Education continued to grow stronger through
the extension of the University of Guyana Scholarship Programme,
maintenance of the University Library Business Journal Subscription,
and sponsorship of the University of Guyana and Ministry of Education
Academic Achievement Awards.
During this phase, the Republic Bank Pan Minors Music Literacy
Programme achieved significant success as it came into its own in
successfully challenging hundreds of young minds across the nation to
discover more about the steel pan’s history while developing skills and
techniques in a fun-filled and safe learning environment.
Similarly, the Republic Bank Mashramani Steel Band Competition
quickly rose to the fore as a unique way of actively promoting steel
pan’s popularity within the nation, leveraging the Bank’s resources to
encourage greater community involvement and interest.
The Republic Bank Youth Link Apprenticeship Programme, already
a staple in Trinidad and Tobago for many decades, took its first steps
too, training scores of driven young adults in the spirit of developing
personal, social, and professional skills.
However, the thrust was always on doing more, on finding ways in
which to leverage local knowledge with regional reach.
In the second phase of the Power to Make A Difference, the momentum
built up over the first phase led to a broader focus on social development
issues, including finding innovative ways of engaging more diverse
communities and empowering the socially marginalised and more
vulnerable, specifically, the at-risk, and the differently able.
In seeking to provide more access to education, personal and
professional development and a better quality of life to those with
special needs, the emphasis remained on close collaboration with their
biggest advocates as the most effective way of achieving shared goals.
There was a strong focus on providing physical facilities for differently
able persons, as well as training opportunities for them to assist in
their adaptation and in raising general education and awareness of
their special needs. Some of the projects under this phase included a
successful partnership to maintain a 15-seater reconditioned minibus
with the Guyana Community Based Rehabilitation Programme – a
much-needed initiative that provides transportation facilities for
differently able persons to learning workshops.
Bit by bit, each partnership during this phase signalled the Group’s
resolve to engage diverse communities in the pursuit of sustainable
development through inclusion across various levels; further adding to
the narrative of responsible social investment through a dynamic mix of
investment, advocacy and teamwork.
A FOUNDATION OF ENTERPRISE (Phase III)
“Our programme continues to evolve; not as an ad hoc dispensation of
sponsorships but rather as the building of bridges. These are bridges
between Republic Bank and the wider community; ones that pave
the way forward as examples of powerful partnerships and must be
continually sustained as an example of how our organisation can
continue to do the people’s work for the benefit of many.”
– Edwin Gooding
The journey that started more than a decade ago continued to define
the Group as a socially responsible corporate citizen and the Power to
Make A Difference as the kind of investment initiative that is welcomed
in homes and hearts within the Caribbean region.
At the time of the programme’s third phase, the Group’s footprint had
extended to comprise neighbours in South America and Ghana in
addition to those already existing in the Caribbean and the Power to
Make a Difference was now a household name across many borders.
In this new phase, the Bank more than doubled the previous social
investment outlay; a clear signal of a deepened focus on existing
issues of youth empowerment, environmental preservation, cultural
The Power to Make A Dif ference

47
literacy awareness, advocacy of the rights of the differently able, and
broadening the shape and scope of staff volunteerism programmes.
It was also during this critical phase that the Bank stepped up its ongoing
drive to give many a greater sense of agency in shaping their destinies
as a way of further creating unique opportunities to encourage many
within society to become more self-reliant and community-focussed;
setting in play the opportunity for them to pass this knowledge to
others.
Guided by the belief in drawing closer in solidarity, using the Power to
Make A Difference to make these connections fostered a Group-wide
drive to promote a culture of fellowship and inclusion that quickly
led to finding new allies and new pursuits. Key to that belief was the
commitment to promote a message of respect and equality and to
become more vocal in adding the Group’s part to the discourse of
raising awareness, understanding, tolerance and acceptance, not just
within society but also within our Republic family.
This would provide the bedrock for the staff volunteerism programme
whereby staff avail themselves to help enrich the lives of residents of
senior citizen homes, orphanages and disability centres around the
country.
The relationships forged along this leg of the journey continued in the
same vein through successful collaborations with disability advocacy
groups like the Step-By-Step School for Autistic Children and the Step-
by-Step Foundation; safe havens for many young achievers along
the Autism spectrum. These partnerships simultaneously helped
empower these special children and brought the Bank even closer to
understanding their needs.
Youth empowerment continued to be one of the main areas of focus;
occupying Group-wide attention as one of the most sustainable means
of building successful societies. With literacy and education at the
forefront of youth empowerment, the Bank maintained the course of its
existing partnerships with the University of Guyana and sponsorships
of the Youth Link programme, the Mashramani Steel Band Competition,
and the Pan Minors Music Literacy programme as ways of continuing to
present opportunities to challenge future leaders to succeed.
Building on the drive for empowerment through culture and the
arts, sponsorships of the Biennial National Drawing Competition
and the Theatre Guild Playhouse created additional opportunities for
participants to develop their skills and showcase their creativity and
talent.
Extending even further into the community, collaboration with Women
Across Differences (WAD), a dynamic NGO focused on the empowerment
of women and girls, on a comprehensive empowerment programme
for adolescent mothers, helped build momentum in advocating sexual
reproductive health and family planning education, self-development
training and vocational skills building while promoting positive lifestyle
choices.
Community development and environmental preservation were
maintained through ongoing maintenance of the beloved Promenade
Gardens as well as through sponsorship of the internationally-
recognised Iwokrama programme to raise awareness of the local
rainforest, promote greater literacy among thousands, and further
the national conversation on the protection and preservation of our
country’s natural resources.
LENDING A HAND, GIVING HOPE
“We recognise that the social needs of our people are many. More
importantly, we also recognise that our ability as a people to fulfil these
needs is far greater. As we work together to create solutions for the
future, the Power to Make A Difference continues to be an example of
our commitment to unearthing Guyana’s great potential to succeed.” –
John Alves
Staff volunteerism, a hallmark of the Group’s sustained social investment
drive, continued to play a pivotal role in ensuring the ongoing success
of the Power to Make A Difference from the programme’s inception.
Staying the course of earnest social partnership, underscored by a basic
commitment to serve, throughout the entire Group, staff members
turned out in their numbers, answering the call to become involved
with a signature style that can only be described as the “True Blue Spirit”.
Encouraged to give of their time and energy to assist individuals and
groups in need, staff volunteers added invaluable sweat equity to
causes like the St. Ann’s Orphanage and the Diamond Special School.
Across the nation, volunteers also routinely support their communities
through reading programmes, library visits, renovations and book
donations along with bringing cheer to orphans and the differently able
at Christmas time.
THE POWER OF ONE SERVING MANY; THE POWER OF MANY
SERVING OTHERS
“Social Investment is founded on the philosophy that working together
with partners across various sectors would make a difference in the lives
of many. Through the Power to Make A Difference, we will continue to
The Power to Make A Dif ference
Corporate Social Responsibility

48
awaken and challenge young minds to aspire for higher, to reach out to
and support programmes and people that provide that crucial hope to
others, and challenge ourselves, as a corporate citizen, to invest more
than just money. Through our actions, we aim to become even more
holistically invested in the direction and speed with which our beautiful
nation develops.” – Richard S. Sammy
In celebrating the Power to Make A Difference, we are grateful for
being part of a remarkable journey of sacrifice, accomplishment, and
discovery. As we look back, we look ahead; humbled by the successes,
yet encouraged by opportunities to achieve even more. Above all, we
are continually inspired by the alliances we have made and the stories
of the people whose lives have been changed for the better. Without
question, the next phase promises even greater chances to build on the
foundation we have set together.
Our path forward, much like the path behind, has been met with
challenges and victories, each making us stronger in its own way. In
looking toward the future, we stand fast and true to our belief that each
individual has the ability to make a lasting contribution to the overall
good of the nation.
Guided by this belief, we recommit to the Power to Make A Difference,
even more focussed on those we serve locally and regionally, and
excited by the possibilities that abound whereby we can demonstrate
the Power of One serving Many and the Power of Many serving Others.
The Power to Make A Dif ference
Corporate Social Responsibilities

49
04Financial Statements
Making the difference through Volunteerism
The pursuit of Strength, Stability, Success, and Self-Reliance
revealed invaluable opportunities to do even more with new allies
and go even further with existing ones. The relationships forged
along this journey and the rare experiences undergone tell the tale
of staying the course of responsible social investment through a
dynamic mix of investment, advocacy and teamwork.

50
Financial Reporting Requirements
Financial Statements
The Directors of Republic Bank (Guyana) Limited are responsible for
the preparation and fair presentation of the financial statements
and other financial information contained in this Annual Report. The
accompanying financial statements have been prepared in conformity
with International Financial Reporting Standards and present a true and
fair view of the financial affairs of the company. Where amounts are
based on estimates and judgments, these represent the best estimate
and judgment of the Directors.
General responsibilities include:
• establishing and maintaining effective internal controls and
procedures for financial reporting;
• safeguarding of assets; and
• prevention and detection of fraud and other irregularities.
The financial information appearing throughout this Annual Report
is consistent with that in the financial statements. Directors have a
responsibility for ensuring that the Bank keeps accounting records
which disclose with reasonable accuracy the financial position of the
Bank.
The Directors have always recognised the importance of the Bank
maintaining and reinforcing the highest possible standards of conduct
in all of its actions, including the preparation and dissemination
of statements presenting fairly the financial condition of the Bank.
In this regard, the Directors have developed and maintained a
system of accounting and reporting which provides the necessary
internal controls to ensure that transactions are properly authorised
and recorded, assets are safeguarded against unauthorised use or
disposition and liabilities are recognised. The system is augmented
by written policies and procedures, the careful selection and training
of qualified staff, the establishment of an organisational structure that
provides an appropriate and well-defined division of responsibility,
and the communication of policies and guidelines of business conduct
throughout the Bank.
The system of internal control is further supported by a professional
staff of Internal Auditors who conduct periodic audits of all aspects of
the Bank’s operations. External Auditors have full and free access to,
and meet periodically with, the Audit Committee to discuss their audit
and findings as to the integrity of the Bank’s accounting and financial
reporting and the adequacy of the system of internal controls.
Signed on behalf of the Board
Richard S. Sammy Christine Mc Gowan
Managing Director Company Secretary

51
Table of ContentsIndependent Auditors’ Report 52
Statement of Financial Position 58
Statement of Income 60
Statement of Comprehensive Income 61
Statement of Changes in Equity 62
Statement of Cash Flows 63
Notes to the Financial Statements 65
1 Corporate Information 65
2 Significant accounting policies 65
a Basis of preparation 65
b Changes in accounting policies 65
c Cash and cash equivalents 73
d Statutory deposit with Bank of Guyana 73
e Financial instruments – initial recognition 73
f Financial assets and liabilities 74
g Reclassification of financial assets and liabilities 76
h Derecognition of financial assets and liabilities 76
i Impairment of financial assets (Policy applicable from October 1, 2017) 78
j Collateral valuation 81
k Collateral repossessed 81
l Write-offs 81
m Impairment of financial assets (Policy applicable before October 1, 2017) 81
n Leases 82
o Premises and equipment 83
p Intangible assets 83
q Goodwill 83
r Employee benefits 84
s Taxation 84
t Statutory reserves 85
u Earnings per stock unit 85
v Foreign currency translation 85
w Revenue recognition 85
x Fee and commission income 86
y Segment reporting 86
z Customers’ liability under acceptances, guarantees, indemnities and letters of credit 86
aa Assets classified as held-for-sale 86
ab Comparatives 86
ac Equity reserves 86
3 Significant accounting judgements and estimates in applying the Bank’s accounting
policies 87
4 Due from Banks 88
5 Advances 88
6 Investment securities 94
7 Premises and equipment 96
8 Goodwill 97
9 Employee benefits 98
10 Deferred tax assets and liabilities 101
11 Other assets 102
12 Customers’ chequing, savings and deposit accounts 102
13 Other liabilities 103
14 Stated capital 103
15 Other reserves 103
16 Operating profit 104
17 Credit loss expense 105
18 Taxation expense 105
19 Related parties 106
20 Risk management 107
21 Capital management 122
22 Fair value 123
23 Segmental information 127
24 Maturity analysis of assets and liabilities 128
25 Dividends paid and proposed 129
26 Contingent liabilities 130
27 External payment deposit scheme 131
Financial Statements

52
Independent Auditors’ Report
Financial Statements
OPINION
We have audited the financial statements of Republic Bank (Guyana) Limited (“the Bank”), which comprise the statement of financial position as at
September 30, 2018, and the statements of income, comprehensive income, changes in equity and cash flows for the year then ended, and notes to
the financial statements, including a summary of significant accounting policies.
In our opinion, the accompanying financial statements present fairly, in all material respects, the financial position of the Bank as at 30 September
2018, and its financial performance and its cash flows for the year then ended in accordance with International Financial Reporting Standards (“IFRSs”),
the Financial Institutions Act Cap. 85:03 and guidelines issued thereunder, the Companies Act Cap. 89:01 and the Securities Industry Act Cap. 73:04.
BASIS FOR OPINION
We conducted our audit in accordance with International Standards on Auditing (“ISAs”). Our responsibilities under those standards are further
described in the Auditor’s Responsibilities for the Audit of the Financial Statements section of our report. We are independent of the Bank in accordance
with the International Ethics Standards Board for Accountants’ Code of Ethics for Professional Accountants (“IESBA Code”), and we have fulfilled our
other ethical responsibilities in accordance with the IESBA Code. We believe that the audit evidence we have obtained is sufficient and appropriate to
provide a basis for our opinion.
KEY AUDIT MATTERS
Key audit matters are those matters that, in our professional judgement, were of most significance in our audit of the financial statements for the year
ended September 30, 2018. These matters were addressed in the context of our audit of the financial statements as a whole, and in forming our opinion
thereon, and we do not provide a separate opinion on these matters.
HOW OUR AUDIT ADDRESSED THE KEY AUDIT MATTERS
Early adoption of IFRS 9
In order to address this new and complex accounting standard:
We read the Bank’s IFRS 9 based classification and measurement of
financial assets and financial liabilities policy and compared it with the
requirements of IFRS 9;
We assessed and tested the design and effectiveness of the key
controls that management has established in relation to meeting the
classification and measurement requirements under IFRS 9;
We independently assessed the assumptions used, business model
documentation and tested a sample of advances and investments to
assess if those pass the solely payment of principal and interest criteria;
For expected credit loss (ECL) calculations, we also assessed and
tested the design and operating effectiveness of the key controls that
management has established. This includes testing the key controls
over governance and model development;
For a sample of exposures, we checked the appropriateness of the
Bank’s staging;
We checked the appropriateness of the opening balance adjustments
and the completeness of advances and investments included in the ECL
calculations as of October 1, 2017 and September 30, 2018; and
KEY AUDIT MATTERS
Early adoption of IFRS 9
Effective for the fiscal year ended September 30, 2018 the Bank early
adopted International Financial Reporting Standard (IFRS) 9 – “Financial
Instruments” issued in July 2014 partially replacing “IAS 39 – Financial
Instruments”. IFRS 9 which came into mandatory effect from January 1,
2018 was issued in three phases of which only Phases 1 and 2 apply to
the Bank as follows:
Phase 1 – classification and measurement of financial assets and
financial liabilities;
Phase 2 – impairment methodology.
The key changes arising from early adoption of IFRS 9 are that the
Bank’s credit losses are now based on expected losses rather than an
incurred loss model, and the new classification and measurement of the
Bank’s financial assets and liabilities, which are detailed in note 2 to the
financial statements.
Differences between previously reported carrying amounts and revised
carrying amounts under IFRS 9 as of September 30, 2017 and October 1,
2017 amounting to $108 million have been recognised in opening retained
earnings. As permitted by IFRS 9, the requirements of the Standard have
been applied retrospectively without restating comparatives.

53
Independent Auditors’ Report
Financial Statements
HOW OUR AUDIT ADDRESSED THE KEY AUDIT MATTERS
Assessed the financial statement disclosures arising on early adoption of
IFRS 9 to determine if they were in accordance with the requirements of
the Standard. Please refer to the accounting policies, critical accounting
estimates and judgements, disclosures of advances, investment and
credit risk management in notes 2, 5, 6 and 20 to the financial statements.
We evaluated and tested the Bank’s process and documented policy for
credit loss provisioning.
For credit loss provisions calculated on an individual basis we tested
the factors underlying the impairment identification and quantification
including forecasts of future cash flows, valuation of underlying
collateral and estimates of recovery on default;
We performed an independent assessment of a sample of commercial
loan files to assess accurate and timely assignment of risk ratings and
compliance with management’s rating policy; and
We also tested the aging of the loan portfolios and considered the
completeness of the loan book assessed for impairment.
For credit loss provisions calculated on a collective basis, we performed
the following:
The model used to compute Stages 1 and 2 provisions were reviewed
for inconsistencies in data and formulas checked for accuracy;
Customers’ risk ratings were reviewed to ensure accuracy of ratings;
The models prepared were reviewed to ensure compliance with the
Manual governing the models and IFRS 9;
Information in the model loads and portfolio loads (worksheet in the
ECL models) were compared for consistency;
Total loans and investment securities as per the models were compared
to the management accounts to ensure accuracy; and
Finally, we focused on the adequacy of the Bank’s financial statement
disclosures regarding advances and investment securities and the
related credit loss provisions.
KEY AUDIT MATTERS
Credit loss provisions
Advances, net of credit loss provisions, comprise 42% of the Bank’s total
assets – refer to note 5; while Investment securities, net of credit loss
provisions, comprise 9% of the Bank’s total assets – refer to note 6.
The appropriateness of credit loss provisions is a key area of
judgement for management. The identification of impairment and
the determination of the recoverable amount are inherently uncertain
processes involving various assumptions and factors including the
probability of default, financial condition of the counterparty, expected
future cash flows, observable market prices and expected net selling
prices. The use of different modelling techniques and assumptions
could produce significantly different estimates of credit loss provisions.
The disclosures relating to these assets and related credit loss provisions
are considered important to users of the financial statements given the
estimation uncertainty and sensitivity of the valuations.

54 Financial Statements
HOW OUR AUDIT ADDRESSED THE KEY AUDIT MATTERS
We independently tested the pricing on quoted securities, and used
valuation specialists to assess the appropriateness of pricing models
used by the Bank. This included:
An assessment of the pricing model methodologies and assumptions
against industry practice and valuation guidelines;
Testing of the inputs used, including cash flows and other market based
data;
An evaluation of the reasonableness of other assumptions applied such
as credit spreads;
The re-performance of valuation calculations on a sample basis of
internally priced securities that were classified as higher risk and
estimation;
An assessment of management’s impairment analysis; and
Finally, we assessed whether the financial statement disclosures,
including sensitivity to key inputs and the IFRS fair value hierarchy,
appropriately reflect the Bank’s exposure to financial instrument
valuation risk.
Regulatory environment
We evaluated and tested the Bank’s internal controls with a specific
emphasis on compliance with AML/CFT policies. This included:
A review of the policies and procedures in place including approval of
those policies by those charged with governance;
A review of training completed by Bank personnel including those
charged with governance;
Testing of customer documentation and transactions; and
Review of the Bank’s compliance with reporting requirements.
Finally, we reviewed compliance with relevant provisions of other
legislation including the Financial Institutions Act Cap. 85:03 and the
Securities Industry Act Cap. 73:04.
KEY AUDIT MATTERS
Fair value disclosures for investments securities
Investment securities, related interest receivable and Government
treasury bills comprise 29% of the Bank’s total assets - refer to note 6.
Investment securities are carried at historical cost while fair values
have been disclosed in note 22. Of these assets, $14,026 million relates
to investments for which no published prices in active markets are
available and which have been classified as Level 2 in the IFRS fair value
hierarchy.
Valuation techniques for these investments can be subjective in nature
and involve various assumptions regarding pricing factors. Associated
risk management disclosure is complex and dependent on high quality
data. A specific area of focus includes the determination of fair value
where valuation techniques are applied in which unobservable inputs
are used.
For Level 2 assets, these techniques include the use of recent arm’s
length transactions, reference to other instruments that are substantially
the same and discounted cash flow analyses making maximum use of
market inputs, such as the market risk free yield curve.
Regulatory environment
The Bank operates in a highly regulated environment and non-
compliance with laws and regulations, particularly the Anti-Money
Laundering and Countering the Financing of Terrorism (AML/CFT) Act
Cap. 10:11, could result in serious monetary or other penalties.
The Bank has assigned the responsibility of AML/CFT to officers
throughout its network and established various controls to ensure AML/
CFT compliance.
The Bank’s Internal Audit Department also reviews compliance with the
Bank’s established policies.
Independent Auditors’ Report

55Financial Statements
Independent Auditors’ Report
OTHER INFORMATION IN THE ANNUAL REPORT
Management is responsible for the other information. The other information comprises all the information disclosed in the annual report but does not
include the financial statements including the notes thereon and our auditor’s report.
Our opinion on the financial statements does not cover the other information and we do not express any form of assurance conclusion thereon.
In connection with our audit of the financial statements, our responsibility is to read the other information and, in doing so, consider whether the other
information is materially inconsistent with the financial statements or our knowledge obtained during the audit, or otherwise appears to be materially
misstated. If, based on the work we have performed, we conclude that there is a material misstatement of this other information, we are required to
report that fact. We have nothing to report in this regard.
RESPONSIBILITIES OF MANAGEMENT AND THOSE CHARGED WITH GOVERNANCE FOR THE FINANCIAL STATEMENTS
Management is responsible for the preparation and fair presentation of the financial statements in accordance with IFRSs, and for such internal control
as management determines is necessary to enable the preparation of financial statements that are free from material misstatement, whether due to
fraud or error.
In preparing the financial statements, Management is responsible for assessing the Bank’s ability to continue as a going concern, disclosing, as
applicable, matters related to going concern and using the going concern basis of accounting unless management either intends to liquidate the Bank
or to cease operations, or has no realistic alternative but to do so.
Those charged with governance are responsible for overseeing the Bank’s financial reporting process.
AUDITORS’ RESPONSIBILITIES FOR THE AUDIT OF THE FINANCIAL STATEMENTS
Our objectives are to obtain reasonable assurance about whether the financial statements as a whole are free from material misstatement, whether
due to fraud or error, and to issue an auditor’s report that includes our opinion. Reasonable assurance is a high level of assurance, but is not a guarantee
that an audit conducted in accordance with ISAs will always detect a material misstatement when it exists. Misstatements can arise from fraud or error
and are considered material if, individually or in the aggregate, they could reasonably be expected to influence the economic decisions of users taken
on the basis of these financial statements.
As part of an audit in accordance with ISAs, we exercise professional judgment and maintain professional scepticism throughout the audit. We also:
• Identify and assess the risks of material misstatement of the financial statements, whether due to fraud or error, design and perform audit
procedures responsive to those risks, and obtain audit evidence that is sufficient and appropriate to provide a basis for our opinion. The risk of
not detecting a material misstatement resulting from fraud is higher than for one resulting from error, as fraud may involve collusion, forgery,
intentional omissions, misrepresentations, or the override of internal control.
• Obtain an understanding of internal control relevant to the audit in order to design audit procedures that are appropriate in the circumstances,
but not for the purpose of expressing an opinion on the effectiveness of the Bank’s internal control.
• Evaluate the appropriateness of accounting policies used and the reasonableness of accounting estimates and related disclosures made by
management.
• Conclude on the appropriateness of management’s use of the going concern basis of accounting and based on the audit evidence obtained,
whether a material uncertainty exists related to events or conditions that may cast significant doubt on the Bank’s ability to continue as a going
concern. If we conclude that a material uncertainty exists, we are required to draw attention in our auditor’s report to the related disclosures in
the financial statements or, if such disclosures are inadequate, to modify our opinion. Our conclusions are based on the audit evidence obtained
up to the date of our auditor’s report. However, future events or conditions may cause the Bank to cease to continue as a going concern.

56
Independent Auditors’ Report
Financial Statements
• Evaluate the overall presentation, structure and content of the financial statements, including the disclosures, and whether the financial
statements represent the underlying transactions and events in a manner that achieves fair presentation.
We communicate with those charged with governance regarding, among other matters, the planned scope and timing of the audit and significant
audit findings, including any significant deficiencies in internal control that we identify during our audit.
We also provide those charged with governance with a statement that we have complied with relevant ethical requirements regarding independence,
and to communicate with them all relationships and other matters that may reasonably be thought to bear on our independence, and where applicable,
related safeguards.
From the matters communicated with those charged with governance, we determine those matters that were of most significance in the audit of the
financial statement of the year ended 30 September 2018 and are therefore the key audit matters. We describe these matters in our auditor’s report
unless law or regulation precludes public disclosure about the matter or when, in extremely rare circumstances, we determine that a matter should not
be communicated in our report because the adverse consequences of doing so would reasonably be expected to outweigh the public interest benefits
of such communication.
The engagement partner responsible for the audit resulting in this auditors’ report is Christopher Ram.
Ram & McRae
Chartered Accountants
Professional Services Firm
157 ‘C’ Waterloo Street,
Georgetown
October 22, 2018

57Financial Statements

58
As at September 30, 2018. Expressed in thousands of Guyana dollars ($’000)
Statement of Financial Position
Financial Statements
Notes 2018 2017
ASSETS
Cash 2,661,598 2,408,902
Statutory deposit with Bank of Guyana 16,178,382 13,967,485
Due from banks 4 21,238,204 11,452,834
Treasury Bills 6 (c) 33,096,297 40,039,152
Investment interest receivable 225,236 67,034
Advances 5 69,747,950 60,791,257
Investment securities 6 (a) 15,694,193 7,440,987
Premises and equipment 7 (a) 7,070,772 7,246,831
Intangible assets 7 (b) 94,770 130,207
Goodwill 8 1,228,222 1,228,222
Pension assets 9 (a) 13,700 –
Deferred tax assets 10 (a) 428,118 186,362
Other assets 11 505,848 1,270,222
TOTAL ASSETS 168,183,290 146,229,495
LIABILITIES AND EQUITY
LIABILITIES
Due to banks 117,037 127,988
Customers’ chequing, savings and deposit accounts 12 (a) 144,654,913 124,879,378
Pension liability 9 (a) – 135,200
Taxation payable 651,621 313,841
Deferred tax liabilities 10 (b) 378,906 355,590
Accrued interest payable 18,850 17,772
Other liabilities 13 2,197,682 2,099,245
TOTAL LIABILITIES 148,019,009 127,929,014
The accompanying notes on pages 65 to 131 form an integral part of these financial statements.

59Financial Statements
As at September 30, 2018. Expressed in thousands of Guyana dollars ($’000)
Statement of Financial Position
Notes 2018 2017
EQUITY
Stated capital 14 300,000 300,000
Statutory reserves 15 (a) 300,000 300,000
Net unrealised gains 15 (b) – 17,730
General banking risk reserve 15 (c) 795,389 3,512,532
Retained earnings 18,768,892 14,170,219
TOTAL EQUITY 20,164,281 18,300,481
TOTAL LIABILITIES AND EQUITY 168,183,290 146,229,495
The accompanying notes on pages 65 to 131 form an integral part of these financial statements.
These financial statements were approved by the Board of Directors on October 22, 2018, and signed on its behalf by:
RICHARD S. SAMMY CHRISTINE MC GOWAN ROY E. CHEONG
Managing Director Corporate Secretary Director, Chairman of Audit Committee

60 Financial Statements
Notes 2018 2017
Interest income 16 (a) 7,974,508 7,705,055
Interest expense 16 (b) (570,015) (574,961)
Net interest income 7,404,493 7,130,094
Other income 16 (c) 3,153,298 2,522,585
10,557,791 9,652,679
Credit loss expense on financial assets 17 (885,398) (675,749)
Operating expenses 16 (d) (5,007,796) (4,748,126)
Profit before taxation 4,664,597 4,228,804
Taxation - Current (1,585,314) (1,480,299)
Taxation - Deferred 54,721 (9,566)
Total taxation expense 18 (1,530,593) (1,489,865)
Net profit after taxation 3,134,004 2,738,939
Earnings per stock unit ($) 10.45 9.13
The accompanying notes on pages 65 to 131 form an integral part of these financial statements.
For the year ended September 30, 2018. Expressed in thousands of Guyana dollars ($’000)
Statement of Income

61Financial Statements
2018 2017
Net profit after taxation 3,134,004 2,738,939
Other comprehensive income:
Items of other comprehensive income that will be reclassified to
the statement of income in subsequent periods (net of tax):
Gains on available-for-sale investments – 113,047
Income tax related to above – (45,219)
Total items that will be reclassified to the income statement
in subsequent periods: – 67,828
Items of other comprehensive income that will not be reclassified to
the statement of income in subsequent periods (net of tax):
Re-measurement gain on defined benefit plans 121,400 22,200
Income tax related to above (48,560) (8,880)
Total items that will not be reclassified to the income statement
in subsequent periods: 72,840 13,320
Other comprehensive income for the year, net of tax 72,840 81,148
Total comprehensive income for the year, net of tax 3,206,844 2,820,087
The accompanying notes on pages 65 to 131 form an integral part of these financial statements.
For the year ended September 30, 2018. Expressed in thousands of Guyana dollars ($’000)
Statement of Comprehensive Income

62 Financial Statements
For the year ended September 30, 2018. Expressed in thousands of Guyana dollars ($’000)
Statement of Changes in Equity
Net General unrealised banking Stated Statutory gains/ risk Retained Total capital reserve (losses) reserve earnings equity
Balance at September 30, 2016 300,000 300,000 (50,098) 2,895,525 13,269,967 16,715,394
Profit for the year – – – – 2,738,939 2,738,939
Other comprehensive income – – 67,828 – 13,320 81,148
Total comprehensive income for the year – – 67,828 – 2,752,259 2,820,087
Transfer to general banking risk reserve – – – 617,007 (617,007) –
Dividends – – – – (1,235,000) (1,235,000)
Balance at September 30, 2017 300,000 300,000 17,730 3,512,532 14,170,219 18,300,481
Net impact of adopting IFRS 9 (Note 2b) – – (17,730) – (90,314) (108,044)
Restated opening balance under IFRS 9 300,000 300,000 – 3,512,532 14,079,905 18,192,437
Profit for the year – – – – 3,134,004 3,134,004
Other comprehensive income – – – – 72,840 72,840
Total comprehensive income for the year – – – – 3,206,844 3,206,844
Transfer from general banking risk reserve (Note 2b) – – – (2,717,143) 2,717,143 –
Dividends – – – – (1,235,000) (1,235,000)
Balance at September 30, 2018 300,000 300,000 – 795,389 18,768,892 20,164,281
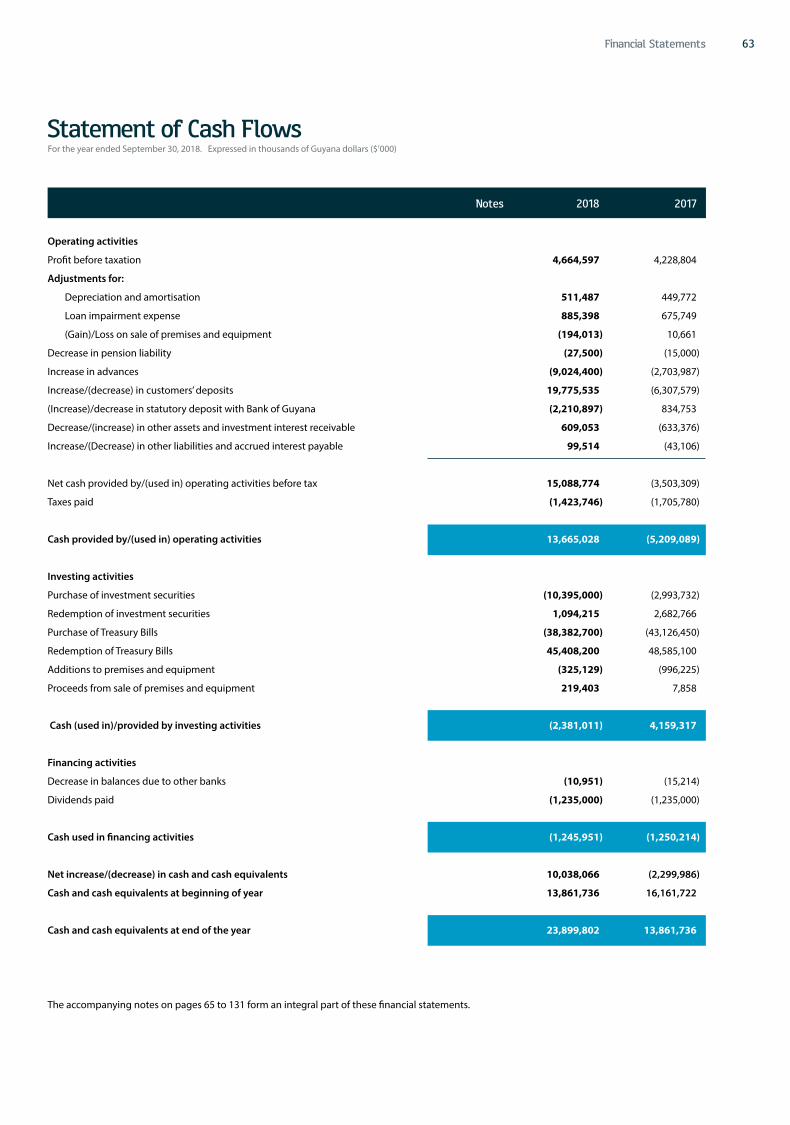
63Financial Statements
Notes 2018 2017
Operating activities
Profit before taxation 4,664,597 4,228,804
Adjustments for:
Depreciation and amortisation 511,487 449,772
Loan impairment expense 885,398 675,749
(Gain)/Loss on sale of premises and equipment (194,013) 10,661
Decrease in pension liability (27,500) (15,000)
Increase in advances (9,024,400) (2,703,987)
Increase/(decrease) in customers’ deposits 19,775,535 (6,307,579)
(Increase)/decrease in statutory deposit with Bank of Guyana (2,210,897) 834,753
Decrease/(increase) in other assets and investment interest receivable 609,053 (633,376)
Increase/(Decrease) in other liabilities and accrued interest payable 99,514 (43,106)
Net cash provided by/(used in) operating activities before tax 15,088,774 (3,503,309)
Taxes paid (1,423,746) (1,705,780)
Cash provided by/(used in) operating activities 13,665,028 (5,209,089)
Investing activities
Purchase of investment securities (10,395,000) (2,993,732)
Redemption of investment securities 1,094,215 2,682,766
Purchase of Treasury Bills (38,382,700) (43,126,450)
Redemption of Treasury Bills 45,408,200 48,585,100
Additions to premises and equipment (325,129) (996,225)
Proceeds from sale of premises and equipment 219,403 7,858
Cash (used in)/provided by investing activities (2,381,011) 4,159,317
Financing activities
Decrease in balances due to other banks (10,951) (15,214)
Dividends paid (1,235,000) (1,235,000)
Cash used in financing activities (1,245,951) (1,250,214)
Net increase/(decrease) in cash and cash equivalents 10,038,066 (2,299,986)
Cash and cash equivalents at beginning of year 13,861,736 16,161,722
Cash and cash equivalents at end of the year 23,899,802 13,861,736
The accompanying notes on pages 65 to 131 form an integral part of these financial statements.
For the year ended September 30, 2018. Expressed in thousands of Guyana dollars ($’000)
Statement of Cash Flows

64 Financial Statements
For the year ended September 30, 2018. Expressed in thousands of Guyana dollars ($’000)
Statement of Cash Flows
Notes 2018 2017
Cash and cash equivalents at September 30 are represented by:
Cash on hand 2,661,598 2,408,902
Due from banks 4 21,238,204 11,452,834
23,899,802 13,861,736
Supplemental information:
Interest received during the year 7,810,406 7,611,980
Interest paid during the year 568,937 575,178
Dividends received 9,704 9,424
The accompanying notes on pages 65 to 131 form an integral part of these financial statements.

65Financial Statements
For the year ended September 30, 2018. Expressed in thousands of Guyana dollars ($’000) except where otherwise stated
Notes to the Financial Statements
1 CORPORATE INFORMATION
The Bank was incorporated in the Co-operative Republic of Guyana on November 20, 1984, as a limited liability company and continued under
the Companies Act Cap. 89:01 on May 16, 1997, and is licensed as Bankers under the Financial Institutions Act Cap. 85:03.
The Bank was registered as a reporting issuer under the Securities Industry Act Cap. 73:04 on April 7, 2003. It was designated as an approved
mortgage finance company by the Minister of Finance on September 2, 2003, under section 15 of the Income Tax Act Cap. 81:01.
Banking operations began on February 16, 1837 by the British Guiana Bank which had been incorporated on November 11, 1836. On November
17, 1913, operations were sold to the Royal Bank of Canada. Assets and Liabilities of the Guyana operations of the Royal Bank of Canada were
acquired by the Government of Guyana on November 29, 1984 and vested in the National Bank of Industry and Commerce Limited on December
1, 1984. In October 1997, the Bank became a subsidiary of Republic Bank Limited of Trinidad and Tobago, now Republic Financial Holdings Limited
and subsequently changed its name to Republic Bank (Guyana) Limited on June 5, 2006. As at September 30, 2018, the stockholdings of Republic
Financial Holdings Limited in the Bank were 50.97%.
Republic Financial Holdings Limited, the financial holding company for the Republic Group, is incorporated in the Republic of Trinidad and Tobago
and its registered office is located at Republic House, 9-17 Park Street, Port of Spain. Republic Financial Holdings Limited is listed on the Trinidad
and Tobago Stock Exchange.
The Republic Group (the ‘Group’) is a financial services group comprising several subsidiaries and associated companies. The Group is engaged in
a wide range of banking, financial and related activities in the CARICOM region and Ghana.
2 SIGNIFICANT ACCOUNTING POLICIES
The principal accounting policies applied in the preparation of these financial statements are set out below.
a Basis of preparation
The financial statements of the Bank are prepared in accordance with International Financial Reporting Standards (IFRS), the Financial
Institutions Act Cap. 85:03 and guidelines issued thereunder, the Companies Act Cap. 89:01 and the Securities Industry Act Cap. 73:04. and
are stated in Guyana Dollars. These financial statements have been prepared on a historical cost basis, except for the measurement at fair
value of investment securities classified as available-for-sale and at fair value through profit or loss and derivative financial instruments. The
preparation of financial statements in conformity with International Financial Reporting Standards requires management to make estimates
and assumptions. Actual results could differ from those estimates. Significant accounting judgements and estimates in applying the Bank’s
accounting policies have been described in Note 3.
b Changes in accounting policies
i New accounting standards/improvements adopted
The accounting policies adopted in the preparation of the financial statements are consistent with those followed in the preparation of the
Bank’s annual financial statements for the year ended September 30, 2017, except for the adoption of new standards and interpretations
below.
IAS 7 Disclosure Initiative – Amendments to IAS 7 (effective January 1, 2017)
The amendments to IAS 7 Statement of Cash Flows are part of the IASB’s Disclosure Initiative and require an entity to provide disclosures
that enable users of financial statements to evaluate changes in liabilities arising from financing activities, including both changes
arising from cash flows and non-cash changes. The adoption and amendment to this Standard had no impact on the Bank.

66 Financial Statements
For the year ended September 30, 2018. Expressed in thousands of Guyana dollars ($’000) except where otherwise stated
Notes to the Financial Statements
2 SIGNIFICANT ACCOUNTING POLICIES (continued)
b Changes in accounting policies (continued)
i New accounting standards/improvements adopted (continued)
IAS 12 Recognition of Deferred Tax Assets for Unrealised Losses – Amendments to IAS 12 (effective January 1, 2017)
The IASB issued the amendments to IAS 12 Income Taxes to clarify the accounting for deferred tax assets for unrealised losses on debt
instruments measured at fair value. The amendments require an entity to consider whether the applicable tax laws restrict the sources
of taxable profits against which it may make deductions on the reversal of that deductible temporary difference. Furthermore, the
amendments provide guidance on how an entity should determine future taxable profits and explain the circumstances in which
taxable profit may include the recovery of some assets for more than their carrying amount. The adoption and amendment to this
Standard had no impact on the Bank.
IFRS 12 Disclosure of Interest in Other Entities – Clarification of the scope of the disclosure requirements in IFRS 12 (effective January 1,
2017)
The amendments clarify that the disclosure requirements in IFRS 12, other than those in paragraphs B10–B16, apply to an entity’s
interest in a subsidiary, a joint venture or an associate (or a portion of its interest in a joint venture or an associate) that is classified (or
included in a disposal group that is classified) as held for sale. The amendments are effective from January 1, 2017, and must be applied
retrospectively. The adoption and amendment to this standard had no impact on the Bank.
As permitted, the Bank early adopted IFRS 9 - Financial Instruments and IFRS 7R - Financial instruments: Disclosures Revised in the
third quarter of 2018 with effect from October 1, 2017, in advance of the effective mandatory date required by the International
Accounting Standards Board (IASB). The Bank has not early adopted any other standard, interpretation or amendment that has been
issued but is not yet effective.
IFRS 9 Financial Instruments
IFRS 9 replaces IAS 39 for annual periods on or after January 1, 2018. The Bank was not required to and has not restated comparative
information for 2017 for financial instruments in the scope of IFRS 9. Therefore, the comparative information for 2017, is reported
under IAS 39 and is not comparable to the information presented for 2018. Differences arising from the adoption of IFRS 9 have been
recognised directly in retained earnings as of October 1, 2017, and are disclosed in the transition disclosures on pages 67 to 70 and
policy Note 2 (ac).
Changes to classification and measurement
To determine their classification and measurement category, IFRS 9 requires all financial assets, except equity instruments and
derivatives, to be assessed based on a combination of the entity’s business model for managing the assets and the instruments’
contractual cash flow characteristics.
The IAS 39 measurement categories of financial assets (fair value through profit or loss (FVPL), available for sale (AFS), held-to-maturity
and amortised cost) have been replaced by:
• Debt instruments at amortised cost
• Debt instruments at fair value through other comprehensive income (FVOCI), with gains or losses recycled to profit or loss on
derecognition
• Equity instruments at FVOCI, with no recycling of gains or losses to profit or loss on derecognition
• Financial assets at FVPL
The accounting for financial liabilities remains largely the same as it was under IAS 39.
The Bank’s classification of its financial assets and liabilities is explained in Notes 2 (e) (iii) and 2 (f ). The quantitative impact of
applying IFRS 9, as at October 1, 2017, is disclosed in the transition disclosures on pages 67 to 70.

67Financial Statements
For the year ended September 30, 2018. Expressed in thousands of Guyana dollars ($’000) except where otherwise stated
Notes to the Financial Statements
2 SIGNIFICANT ACCOUNTING POLICIES (continued)
b Changes in accounting policies (continued)
i New accounting standards/improvements adopted (continued)
Changes to impairment calculation
The adoption of IFRS 9 has fundamentally changed the Bank’s accounting for financial asset impairments by replacing IAS 39’s
incurred loss approach with a forward-looking expected credit loss (ECL) approach. IFRS 9 requires the Bank to record an allowance
for ECLs for all loans and other debt financial assets not held at FVPL, together with loan commitments and financial guarantee
contracts. The allowance is based on the ECLs associated with the probability of default in the next twelve months unless there has
been a significant increase in credit risk since origination.
Details of the Bank’s impairment methodology are disclosed in Note 2 (i). The quantitative impact of applying IFRS 9 as at October 1,
2017, is disclosed in the transition disclosures below.
IFRS 7R Financial Instruments: Disclosures Revised
To reflect the differences between IFRS 9 and IAS 39, IFRS 7 Financial Instruments: Disclosures was updated and the Bank has
adopted it, together with IFRS 9, for the year beginning October 1, 2017. Changes include transition disclosures as shown
below.
Reconciliations from opening to closing ECL allowances are presented in Notes 5 (c) and 6 (d).
Transition disclosures
The following sets out the impact of adopting IFRS 9 on the statement of financial position and retained earnings including the effect
of replacing IAS 39’s incurred credit loss calculations with IFRS 9’s ECLs.

68 Financial Statements
For the year ended September 30, 2018. Expressed in thousands of Guyana dollars ($’000) except where otherwise stated
Notes to the Financial Statements
2 SIGNIFICANT ACCOUNTING POLICIES (continued)
b Changes in accounting policies (continued)
i New accounting standards/improvements adopted (continued)
Transition disclosures (continued)
IAS 39 measurement Reclassification Remeasurement IFRS 9 Category 4 Amount ECL Other Amount Category 4
Financial assets
Cash and cash equivalents L&R 2,408,902 – – – 2,408,902 AC
Statutory deposits with Central Banks L&R 13,967,485 – – – 13,967,485 AC
Due from banks L&R 11,452,834 – – – 11,452,834 AC
Treasury Bills L&R 40,039,152 – – – 40,039,152 AC
Investment interest receivable L&R 67,034 – – – 67,034 AC
Advances L&R 60,791,257 – (67,708) – 60,723,549 AC
128,726,664 – (67,708) – 128,658,956
Debt instruments – amortised cost
From investment securities – AFS 1 – 7,420,987 (222,776) (17,730) 7,180,481
– 7,420,987 (222,776) (17,730) 7,180,481 AC
Investment securities – AFS 7,440,987 – – – –
To debt instruments - amortised cost 1 – (7,420,987) – – –
To equity instruments FVPL 3 – (20,000) – – –
7,440,987 (7,440,987) – – –
Financial Assets at FVPL FVPL – – – – -
From investment securities – AFS 3 – 20,000 – – 20,000
– 20,000 – – 20,000 FVPL
Total Financial Assets 136,167,651 – (290,484) (17,730) 135,859,437
Non-financial assets
Deferred tax assets 186,362 – – 200,170 386,532
Total Assets 136,354,013 - (290,484) 182,440 136,245,969

69Financial Statements
2 SIGNIFICANT ACCOUNTING POLICIES (continued)
b Changes in accounting policies (continued)
i New accounting standards/improvements adopted (continued)
Transition disclosures (continued)
IAS 39 measurement Reclassification Remeasurement IFRS 9 Category 4 Amount ECL Other Amount Category 4
Financial liabilities
Due to banks AC 127,988 – – – 127,988 AC
Customers’ current, savings
and deposit accounts AC 124,879,378 – – – 124,879,378 AC
Accrued interest payable AC 17,772 – – – 17,772 AC
Total Financial Liabilities 125,025,138 – – – 125,025,138
Non-financial liabilities
Deferred tax liabilities 355,590 – – (12,111) 343,479
Total Liabilities 125,380,728 – – (12,111) 125,368,617
1
As of October 1, 2017, the Bank has reclassified a portion of its previous AFS portfolio as debt instruments at amortised cost.
These instruments met the Solely Payments of Principal and Interest (SPPI) criterion, were not actively traded, and were held with
the intention to collect cash flows and without the intention to sell. The fair value of these instruments that the Bank still held at
September 30, 2018, was $19,933 million. Their change in fair value over 2018, which would have been recorded in OCI had these
instruments continued to be revalued through OCI, would have been $84.6 million.
2
As of October 1, 2017, the Bank did not have any debt instruments that did not meet the SPPI criterion within its held-to-maturity
portfolio. Therefore, it elected to classify all of these instruments as debt instruments measured at amortised cost.
3
The Bank has elected the option to irrevocably designate some of its previous AFS equity instruments as equity instruments at FVPL
since the portfolio is small and there would be minimal differences when accounting for these at FVOCI.
4
IAS 39 categories include Loans and receivables (L&R), Available for sale (AFS), Held to maturity (HTM) and Fair Value through P&L
(FVPL). IFRS 9 categories include Amortised cost (AC) and Fair Value through P&L (FVPL).
For the year ended September 30, 2018. Expressed in thousands of Guyana dollars ($’000) except where otherwise stated
Notes to the Financial Statements

70 Financial Statements
For the year ended September 30, 2018. Expressed in thousands of Guyana dollars ($’000) except where otherwise stated
Notes to the Financial Statements
2 SIGNIFICANT ACCOUNTING POLICIES (continued)
b Changes in accounting policies (continued)
i New accounting standards/improvements adopted (continued)
Transition disclosures (continued)
The impact of transition to IFRS 9 on reserves and retained earnings is, as follows:
Stated Capital and Other Statutory Reserves Retained Reserve (Note 15) Earnings Total
Closing balance under IAS 39 (September 30, 2017) 600,000 3,530,262 14,170,219 18,300,481
Reclassification of investment securities from
available-for-sale to amortised cost – (17,730) – (17,730)
Initial recognition of IFRS 9 ECLs – – (290,484) (290,484)
Deferred tax in relation to the above – – 200,170 200,170
Opening balance under IFRS 9 (October 1, 2017) 600,000 3,512,532 14,079,905 18,192,437
The following table reconciles the aggregate opening financial asset impairments under IAS 39 and provisions for loan commitments
and financial guarantee contracts in accordance with IAS 37 Provisions Contingent Liabilities and Contingent Assets to the ECL
allowances for financial assets under IFRS 9. Further details are disclosed in Notes 5 (c) and 6 (d).
Financial asset impairment ECLs under under IAS 39 IFRS 9 at September 30, Remeasure- at October 1, 2017 ment 2017
Impairment allowance for
Loans and receivables per IAS 39/ financial assets at
amortised cost under IFRS 9 799,343 67,708 867,051
Available-for-sale debt investment securities per IAS 39/
Debt instruments at amortised cost under IFRS 9: – 222,776 222,776
799,343 290,484 1,089,827
ii Standards in issue not yet effective
The following is a list of standards and interpretations that are not yet effective up to the date of issuance of the Bank’s financial
statements. These standards and interpretations will be applicable to the Bank at a future date and will be adopted when
they become effective. The Bank is currently assessing the impact of adopting these standards and interpretations.

71Financial Statements
2 SIGNIFICANT ACCOUNTING POLICIES (continued)
b Changes in accounting policies (continued)
ii Standards in issue not yet effective (continued)
IFRS 15 Revenue from Contracts with Customers (effective January 1, 2018)
IFRS 15 replaces all existing revenue requirements in IFRS (IAS 11 Construction Contracts, IAS 18 Revenue, IFRIC 13 Customer Loyalty
Programmes, IFRIC 15 Agreements for the Construction of Real Estate, IFRIC 18 Transfers of Assets from Customers and SIC 31 Revenue
– Barter Transactions Involving Advertising Services) and applies to all revenue arising from contracts with customers. It also provides a
model for the recognition and measurement of disposal of certain non-financial assets including property, equipment and intangible
assets.
The standard outlines the principles an entity must apply to measure and recognise revenue. The core principle is that an entity will
recognise revenue at an amount that reflects the consideration to which the entity expects to be entitled in exchange for transferring
goods or services to a customer.
The standard requires entities to exercise judgement, taking into consideration all of the relevant facts and circumstances, when
applying each step of the model to contracts with their customers.
The standard also specifies how to account for the incremental costs of obtaining a contract and the costs directly related to fulfilling
a contract.
The standard will affect entities across all industries. Adoption will be a significant undertaking for most entities with potential
changes to an entity’s current accounting, systems and processes.
IAS 40 Investment Property: Transfers of Investment Properties - Amendments to IAS 40 (effective January 1, 2018)
The amendments clarify when an entity should transfer property, including property under construction or development into, or out of
investment property. The amendments state that a change in use occurs when the property meets, or ceases to meet, the definition of
investment property and there is evidence of the change in use. A mere change in management’s intentions for the use of the property
does not provide evidence of a change in use.
IFRIC Interpretation 22 Foreign Currency Transactions and Advance Consideration (effective January 1, 2018)
The interpretation clarifies that in determining the spot exchange rate to use on initial recognition of the related asset, expense or
income (or part of it) on the derecognition of a non-monetary asset or non-monetary liability relating to advance consideration, the date
of the transaction is the date on which an entity initially recognises the non-monetary asset or non-monetary liability arising from the
advance consideration. If there are multiple payments or receipts in advance, then the entity must determine a date of the transactions
for each payment or receipt of advance consideration.
Entities may apply the amendments on a fully retrospective basis. Alternatively, an entity may apply the interpretation prospectively to
all assets, expenses and income in its scope that are initially recognised on or after:
i The beginning of the reporting period in which the entity first applies the interpretation
OR
ii The beginning of a prior reporting period presented as comparative information in the financial statements of the reporting
period in which the entity first applies the interpretation.
For the year ended September 30, 2018. Expressed in thousands of Guyana dollars ($’000) except where otherwise stated
Notes to the Financial Statements

72 Financial Statements
For the year ended September 30, 2018. Expressed in thousands of Guyana dollars ($’000) except where otherwise stated
Notes to the Financial Statements
2 SIGNIFICANT ACCOUNTING POLICIES (continued)
b Changes in accounting policies (continued)
ii Standards in issue not yet effective (continued)
IFRS 16 Leases (effective January 1, 2019)
IFRS 16 requires lessees to account for all leases under a single on-balance sheet model in a similar way to finance leases under IAS 17.
The standard includes two recognition exemptions for lessees – leases of ‘low-value’ assets (e.g., personal computers) and short-term
leases (i.e., leases with a lease term of 12 months or less). At the commencement date of a lease, a lessee will recognise a liability to
make lease payments (i.e., the lease liability) and an asset representing the right to use the underlying asset during the lease term (i.e.,
the right-of-use asset).
Lessees will be required to separately recognise the interest expense on the lease liability and the depreciation expense on the right-
of-use asset.
Lessees will be required to remeasure the lease liability upon the occurrence of certain events (e.g., a change in the lease term, a change
in future lease payments resulting from a change in an index or rate used to determine those payments). The lessee will generally
recognise the amount of the remeasurement of the lease liability as an adjustment to the right-of-use asset.
Lessor accounting is substantially unchanged from today’s accounting under IAS 17. Lessors will continue to classify all leases using the
same classification principle as in IAS 17 and distinguish between two types of leases: operating and finance leases.
IFRIC Interpretation 23 Uncertainty over Income Tax Treatments (effective January 1, 2019)
The interpretation addresses the accounting for income taxes when tax treatments involve uncertainty that affects the application of
IAS 12. The interpretation specifically addresses the following:
• Whether an entity considers uncertain tax treatments separately
• The assumptions an entity makes about the examination of tax treatments by taxation authorities
• How an entity determines taxable profit (tax loss), tax bases, unused tax losses, unused tax credits and tax rates
• How an entity considers changes in facts and circumstances
An entity has to determine whether to consider each uncertain tax treatment separately or together with one or more other uncertain
tax treatments. The approach that better predicts the resolution of the uncertainty should be followed.
IAS 19 Employee Benefits - Amendments to IAS 19 (effective January 1, 2019)
The amendments to IAS 19 Employee Benefits address the accounting when a plan amendment, curtailment or settlement occurs
during a reporting period.
The amendments specify that when a plan amendment, curtailment or settlement occurs during the annual reporting period, an entity
is required to:
• Determine current service cost for the remainder of the period after the plan amendment, curtailment or settlement, using the
actuarial assumptions used to remeasure the net defined benefit liability (asset) reflecting the benefits offered under the plan and
the plan assets after that event
• Determine net interest for the remainder of the period after the plan amendment, curtailment or settlement using: the net defined
benefit liability (asset) reflecting the benefits offered under the plan and the plan assets after that event; and the discount rate used
to remeasure that net defined benefit liability (asset)

73Financial Statements
2 SIGNIFICANT ACCOUNTING POLICIES (continued)
b Changes in accounting policies (continued)
ii Standards in issue not yet effective (continued)
IAS 19 Employee Benefits - Amendments to IAS 19 (effective January 1, 2019) (continued)
The amendments clarify that an entity first determines any past service cost, or a gain or loss on settlement, without considering the
effect of the asset ceiling. This amount is recognised in profit or loss. An entity then determines the effect of the asset ceiling after the
plan amendment, curtailment or settlement. Any change in that effect, excluding amounts included in the net interest, is recognised
in other comprehensive income.
This clarification provides that entities might have to recognise a past service cost, or a gain or loss on settlement, that reduces a surplus
that was not recognised before. Changes in the effect of the asset ceiling are not netted with such amounts.
iii Improvements to International Financial Reporting Standards
The annual improvements process of the International Accounting Standards Board deals with non-urgent but necessary
clarifications and amendments to IFRS. The following amendments are applicable to annual periods beginning on or after
January 1, 2018.
IFRS Subject of Amendment
IFRS 1 First-time Adoption of International Financial Reporting Standards - Deletion of short-term exemptions for first-
time adopters (effective January 1, 2018)
IAS 28 Investments in Associates and Joint Ventures - Clarification that measuring investees at fair value through profit or
loss is an investment-by-investment choice (effective January 1, 2018)
IFRS 3 Business Combinations - Previously held Interests in a joint operation (effective January 1, 2019)
IFRS 11 Joint Arrangements - Previously held Interests in a joint operation (effective January 1, 2019)
IAS 12 Income Taxes - Income tax consequences of payments on financial instruments classified as equity (effective
January 1, 2019)
IAS 23 Borrowing Costs - Borrowing costs eligible for capitalisation (effective January 1, 2019)
c Cash and cash equivalents
For the purpose of presentation in the Statement of Cash Flows, cash and cash equivalents consist of highly liquid investments, cash on
hand and at bank, Treasury Bills, bills discounted, and bankers’ acceptances with original maturities of three months or less.
d Statutory deposit with Bank of Guyana
Pursuant to the Financial Institutions Act Cap. 85:03, the Bank is required to maintain with the Bank of Guyana a statutory
reserve balance in relation to the deposit liabilities of the institution.
e Financial instruments – initial recognition
i Date of recognition
Financial assets and liabilities, with the exception of loans and advances to customers and balances due to customers, are initially
recognised on the trade date, i.e. the date that the Bank becomes a party to the contractual provisions of the instrument. This includes
regular way trades: purchases or sales of financial assets that require delivery of assets within the time frame generally established
by regulation or convention in the market place. Loans and advances to customers are recognised when funds are transferred to the
customers’ accounts. The Bank recognises balances due to customers when funds are transferred to the Bank.
For the year ended September 30, 2018. Expressed in thousands of Guyana dollars ($’000) except where otherwise stated
Notes to the Financial Statements

74 Financial Statements
For the year ended September 30, 2018. Expressed in thousands of Guyana dollars ($’000) except where otherwise stated
Notes to the Financial Statements
2 SIGNIFICANT ACCOUNTING POLICIES (continued)
e Financial instruments – initial recognition (continued)
ii Initial measurement of financial instruments
The classification of financial instruments at initial recognition depends on their contractual terms and the business model for managing
the instruments, as described in Note 2 (f ) (i). Financial instruments are initially measured at their fair value, except in the case of financial
assets and financial liabilities recorded at FVPL, transaction costs are added to, or subtracted from, this amount.
iii Measurement categories of financial assets and liabilities
From October 1, 2017, the Bank classifies all of its financial assets based on the business model for managing the assets and the assets’
contractual terms, measured at either:
• Amortised cost, as explained in Note 2 (f ) (i)
• FVPL, as explained in Note 2 (f ) (ii)
Before October 1, 2017, the Bank classified its financial assets as loans and receivables (amortised cost), FVPL, available-for-sale or held-
to-maturity (amortised cost), as explained in Notes 2 (f ) (i), 2 (f ) (v) and 2 (f ) (vi).
Financial liabilities, other than loan commitments and financial guarantees, are measured at amortised cost.
f Financial assets and liabilities
Under IFRS 9 (Policy applicable from October 1, 2017)
i Due from banks, Treasury Bills, Advances and Investment securities
Before October 1, 2017, Due from banks, Treasury Bills, Advances to customers and Investment securities included non–derivative
financial assets with fixed or determinable payments that were not quoted in an active market, other than those:
• That the Bank intended to sell immediately or in the near term
• That the Bank, upon initial recognition, designated as at FVPL or as available-for-sale
• For which the Bank may not recover substantially all of its initial investment, other than because of credit deterioration, which
were designated as available-for-sale.
From October 1, 2017, the Bank only measures Due from banks, Treasury Bills, Advances to customers and Investment securities at
amortised cost if both of the following conditions are met:
• The financial asset is held within a business model with the objective to hold financial assets in order to collect contractual cash
flows and
• The contractual terms of the financial asset give rise, on specified dates, to cash flows that are Solely Payments of Principal and
Interest (SPPI) on the principal amount outstanding.
The details of these conditions are outlined below.
The SPPI test
For the first step of its classification process, the Bank assesses the contractual terms of financial assets to identify whether they meet
the SPPI test.
‘Principal’ for the purpose of this test is defined as the fair value of the financial asset at initial recognition and may change over the life
of the financial asset (for example, if there are repayments of principal or amortisation of the premium / discount).
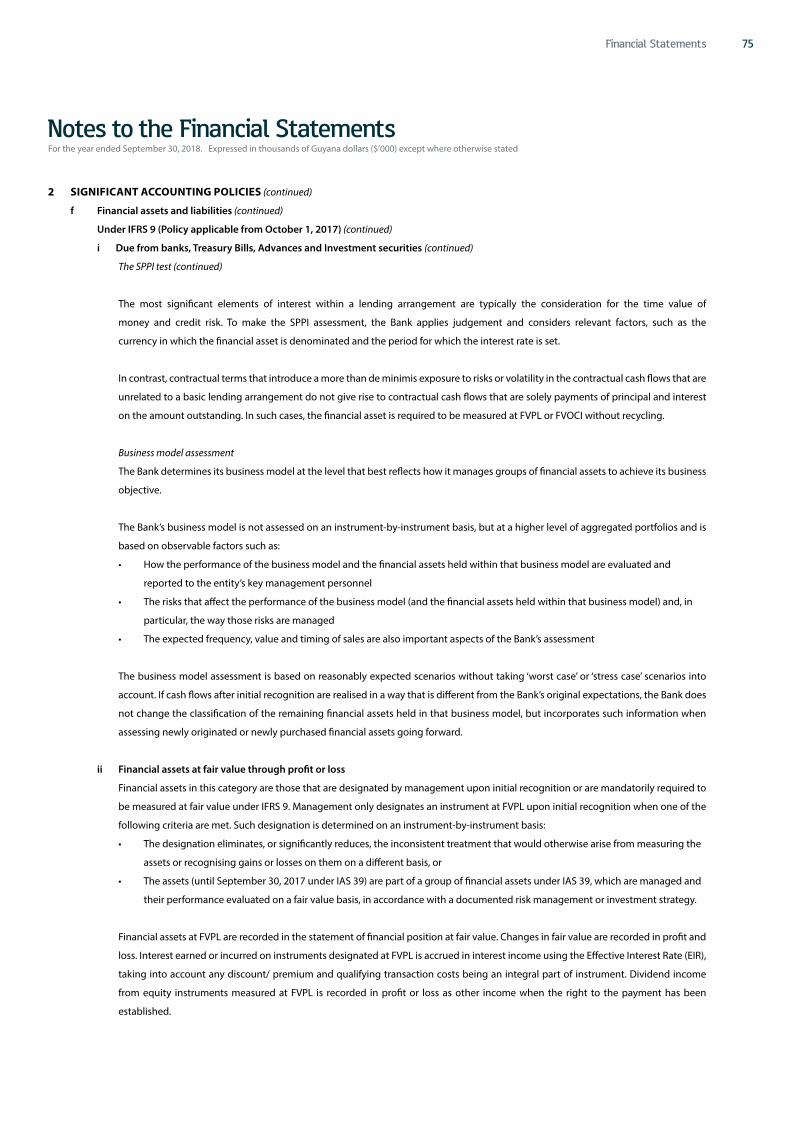
75Financial Statements
2 SIGNIFICANT ACCOUNTING POLICIES (continued)
f Financial assets and liabilities (continued)
Under IFRS 9 (Policy applicable from October 1, 2017) (continued)
i Due from banks, Treasury Bills, Advances and Investment securities (continued)
The SPPI test (continued)
The most significant elements of interest within a lending arrangement are typically the consideration for the time value of
money and credit risk. To make the SPPI assessment, the Bank applies judgement and considers relevant factors, such as the
currency in which the financial asset is denominated and the period for which the interest rate is set.
In contrast, contractual terms that introduce a more than de minimis exposure to risks or volatility in the contractual cash flows that are
unrelated to a basic lending arrangement do not give rise to contractual cash flows that are solely payments of principal and interest
on the amount outstanding. In such cases, the financial asset is required to be measured at FVPL or FVOCI without recycling.
Business model assessment
The Bank determines its business model at the level that best reflects how it manages groups of financial assets to achieve its business
objective.
The Bank’s business model is not assessed on an instrument-by-instrument basis, but at a higher level of aggregated portfolios and is
based on observable factors such as:
• How the performance of the business model and the financial assets held within that business model are evaluated and
reported to the entity’s key management personnel
• The risks that affect the performance of the business model (and the financial assets held within that business model) and, in
particular, the way those risks are managed
• The expected frequency, value and timing of sales are also important aspects of the Bank’s assessment
The business model assessment is based on reasonably expected scenarios without taking ‘worst case’ or ‘stress case’ scenarios into
account. If cash flows after initial recognition are realised in a way that is different from the Bank’s original expectations, the Bank does
not change the classification of the remaining financial assets held in that business model, but incorporates such information when
assessing newly originated or newly purchased financial assets going forward.
ii Financial assets at fair value through profit or loss
Financial assets in this category are those that are designated by management upon initial recognition or are mandatorily required to
be measured at fair value under IFRS 9. Management only designates an instrument at FVPL upon initial recognition when one of the
following criteria are met. Such designation is determined on an instrument-by-instrument basis:
• The designation eliminates, or significantly reduces, the inconsistent treatment that would otherwise arise from measuring the
assets or recognising gains or losses on them on a different basis, or
• The assets (until September 30, 2017 under IAS 39) are part of a group of financial assets under IAS 39, which are managed and
their performance evaluated on a fair value basis, in accordance with a documented risk management or investment strategy.
Financial assets at FVPL are recorded in the statement of financial position at fair value. Changes in fair value are recorded in profit and
loss. Interest earned or incurred on instruments designated at FVPL is accrued in interest income using the Effective Interest Rate (EIR),
taking into account any discount/ premium and qualifying transaction costs being an integral part of instrument. Dividend income
from equity instruments measured at FVPL is recorded in profit or loss as other income when the right to the payment has been
established.
For the year ended September 30, 2018. Expressed in thousands of Guyana dollars ($’000) except where otherwise stated
Notes to the Financial Statements

76 Financial Statements
For the year ended September 30, 2018. Expressed in thousands of Guyana dollars ($’000) except where otherwise stated
Notes to the Financial Statements
2 SIGNIFICANT ACCOUNTING POLICIES (continued)
f Financial assets and liabilities (continued)
Under IFRS 9 (Policy applicable from October 1, 2017) (continued)
iii Undrawn loan commitments
Undrawn loan commitments and letters of credit are commitments under which, over the duration of the commitment, the Bank is
required to provide a loan with pre-specified terms to the customer. These contracts are in the scope of the ECL requirements but no
ECL was determined based on historical observation of defaults.
iv Debt securities and other fund raising instruments
Financial liabilities issued by the Bank that are designated at FVPL, are classified as liabilities under Debt securities in issue and
Other fund raising instruments, where the substance of the contractual arrangement results in the Bank having an obligation to
deliver cash to satisfy the obligation. These are initially recognised at fair value net of transaction costs and subsequently measured
at amortised cost using the effective interest rate method.
Under IAS 39 (Policy applicable before October 1, 2017)
v Available-for-sale financial investments
Available-for-sale investments are securities intended to be held for an indefinite period of time, but may be sold in response to needs
for liquidity or changes in interest rates, exchange rates or equity prices. Securities held as available-for-sale are initially recognised
at fair value plus transaction costs and are continuously remeasured at fair value based on quoted market prices where available or
discounted cash flow models. Unquoted equity instruments are recognised at cost, being the fair value of the consideration paid for
the acquisition of the investment. Unrealised gains and losses arising from changes in the fair value of securities classified as available-
for-sale are recognised in other comprehensive income net of applicable deferred tax. When the securities are disposed of, the related
accumulated fair value adjustments are included in other income. When securities become impaired, the related accumulated fair
value adjustments previously recognised in equity are included in the statement of income as an impairment expense on investment
securities.
g Reclassification of financial assets and liabilities
From October 1, 2017, the Bank ceased reclassifying its financial assets subsequent to their initial recognition, apart from the exceptional
circumstances in which the Bank acquires, disposes of, or terminates a business line. Financial liabilities are never reclassified. The Bank did not
reclassify any of its financial assets or liabilities in 2018, except on the initial adoption of IFRS 9 as required. On adoption, the Bank classified
its financial assets and liabilities in accordance with its existing business models.
h Derecognition of financial assets and liabilities
Derecognition due to substantial modification of terms and conditions
The Bank derecognises a financial asset, such as a loan to a customer, to facilitate changes to the original loan agreement or arrangement
due to weaknesses in the borrower’s financial position and/or non-repayment of the debt as arranged and terms and conditions
have been restructured to the extent that, substantially, it becomes a new loan, with the difference recognised as an impairment loss.
The newly recognised loans are classified as Stage 2 for ECL measurement purposes.
When assessing whether or not to derecognise a loan to a customer, amongst others, the Bank considers the following factors:
• Change in currency of the loan
• Change in counterparty
• If the modification is such that the instrument would no longer meet the SPPI criterion

77Financial Statements
2 SIGNIFICANT ACCOUNTING POLICIES (continued)
h Derecognition of financial assets and liabilities (continued)
Derecognition due to substantial modification of terms and conditions (continued)
If the modification does not result in cash flows that are substantially different, the modification does not result in derecognition. Based on
the change in cash flows discounted at the original rate, the Bank records a modification gain or loss to the extent that an impairment loss
has not already been recorded.
Derecognition other than for substantial modification
Financial assets
A financial asset (or, where applicable, a part of a financial asset or part of a group of similar financial assets) is derecognised when the
rights to receive cash flows from the financial asset have expired. The Bank also derecognises the financial asset if it has both transferred the
financial asset and the transfer qualifies for derecognition.
The Bank has transferred the financial asset if, and only if, either:
• The Bank has transferred its contractual rights to receive cash flows from the financial asset, or
• It retains the rights to the cash flows, but has assumed an obligation to pay the received cash flows in full without material delay to a
third party under a ‘pass–through’ arrangement.
Pass-through arrangements are transactions whereby the Bank retains the contractual rights to receive the cash flows of a financial asset
(the ‘original asset’), but assumes a contractual obligation to pay those cash flows to one or more entities (the ‘eventual recipients’), when
all of the following three conditions are met:
• The Bank has no obligation to pay amounts to the eventual recipients unless it has collected equivalent amounts from the original
asset, excluding short-term advances with the right to full recovery of the amount lent plus accrued interest at market rates
• The Bank cannot sell or pledge the original asset other than as security to the eventual recipients
• The Bank has to remit any cash flows it collects on behalf of the eventual recipients without material delay. In addition, the Bank is not
entitled to reinvest such cash flows, except for investments in cash or cash equivalents including interest earned, during the period
between the collection date and the date of required remittance to the eventual recipients.
A transfer only qualifies for derecognition if either:
• The Bank has transferred substantially all the risks and rewards of the asset, or
• The Bank has neither transferred nor retained substantially all the risks and rewards of the asset, but has transferred control of the asset
The Bank considers control to be transferred if and only if, the transferee has the practical ability to sell the asset in its entirety to an
unrelated third party and is able to exercise that ability unilaterally and without imposing additional restrictions on the transfer.
When the Bank has neither transferred nor retained substantially all the risks and rewards and has retained control of the asset, the asset
continues to be recognised only to the extent of the Bank’s continuing involvement, in which case, the Bank also recognises an associated
liability. The transferred asset and the associated liability are measured on a basis that reflects the rights and obligations that the Bank
has retained.
Continuing involvement that takes the form of a guarantee over the transferred asset is measured at the lower of the original carrying
amount of the asset and the maximum amount of consideration the Bank could be required to pay.
Financial liabilities
A financial liability is derecognised when the obligation under the liability is discharged, cancelled or expires. Where an existing financial
liability is replaced by another from the same lender on substantially different terms, or the terms of an existing liability are substantially
modified, such an exchange or modification is treated as a derecognition of the original liability and the recognition of a new liability. The
difference between the carrying value of the original financial liability and the consideration paid is recognised in profit or loss.
For the year ended September 30, 2018. Expressed in thousands of Guyana dollars ($’000) except where otherwise stated
Notes to the Financial Statements

78 Financial Statements
For the year ended September 30, 2018. Expressed in thousands of Guyana dollars ($’000) except where otherwise stated
Notes to the Financial Statements
2 SIGNIFICANT ACCOUNTING POLICIES (continued)
i Impairment of financial assets (Policy applicable from October 1, 2017)
i Overview of the ECL principles
As described in Note 2 (b) (i) New accounting policies/improvements adopted, the adoption of IFRS 9 has fundamentally changed the
Bank’s financial asset impairment methodologies by replacing IAS 39’s incurred loss approach with a forward-looking ECL approach.
From October 1, 2017, the Bank has been recording the allowance for expected credit losses for all loans and other debt financial
assets not held at FVPL, together with loan commitments and financial guarantee contracts, in this section all referred to as ‘financial
instruments’. Equity instruments are not subject to impairment under IFRS 9.
The Bank uses the general probability of default approach when calculating ECLs. The ECL allowance is based on the credit losses
expected to arise over the life of the asset (the lifetime expected credit loss or (LTECL), unless there has been no significant increase in
credit risk since origination, in which case, the allowance is based on the 12 months’ expected credit loss (12mECL) as outlined in Note
20.2.7). The Bank’s policies for determining if there has been a significant increase in credit risk are set out in Note 20.2
The 12mECL is the portion of LTECLs that represent the ECLs that result from default events on a financial instrument that are possible
within the 12 months after the reporting date.
Both LTECLs and 12mECLs are calculated on either an individual basis or a collective basis, depending on the size and nature of the
underlying portfolio of financial instruments. The Bank’s policy for grouping financial assets measured on a collective basis is explained
in Note 20.2.7.
The Bank has established a policy to perform an assessment, at the end of each reporting period, of whether a financial instrument’s
credit risk has increased significantly since initial recognition, by considering the change in the risk of default occurring over the
remaining life of the financial instrument.
Based on the above process, the Bank classifies its loans and investments into Stage 1, Stage 2 and Stage 3 as described below:
Stage 1
When loans and investments are first recognised, the Bank recognises an allowance based on 12mECLs. Stage 1 loans and investments
also include facilities where the credit risk has improved and the loan has been reclassified from Stage 2.
Stage 2
When a loan or investment has shown a significant increase in credit risk since origination, the Bank records an allowance for the
LTECLs. Stage 2 loans and investments also include facilities where the credit risk has improved and the loan or investment has been
reclassified from Stage 3.
Stage 3
Loans and investments considered credit-impaired (as outlined in Note 20.2). The Bank records an allowance for the LTECLs.
For financial assets for which the Bank has no reasonable expectations of recovering either the entire outstanding amount, or a
proportion thereof, the gross carrying amount of the financial asset is reduced. This is considered a (partial) derecognition of the
financial asset.

79Financial Statements
2 SIGNIFICANT ACCOUNTING POLICIES (continued)
i Impairment of financial assets (Policy applicable from October 1, 2017) (continued)
ii The calculation of ECLs
The Bank calculates ECLs based on the historical measure of cash shortfalls, discounted at the instrument’s coupon rate. A cash shortfall
is the difference between the cash flows that are due to an entity in accordance with the contract and the cash flows that the entity
expects to receive.
The mechanics of the ECL calculations are outlined below and the key elements are as follows:
PD The Probability of Default is an estimate of the likelihood of default over a given period of time. A default may only happen at a
certain time over the assessed period, if the facility has not been previously derecognised and is still in the portfolio. The concept of PDs
is further explained in Note 20.2.5.
EAD The Exposure at Default is an estimate of the exposure at a future default date, taking into account expected changes in the
exposure after the reporting date, including repayments of principal and interest, whether scheduled by contract or otherwise,
expected drawdowns on committed facilities, and accrued interest from missed payments.
LGD The Loss Given Default is an estimate of the loss arising in the case where a default occurs at a given time. It is based on the
difference between the contractual cash flows due and those that the lender would expect to receive, including from the realisation of
any collateral. It is usually expressed as a percentage of the EAD.
When estimating the ECLs, the Bank considers among other factors the risk rating category and aging of the financial asset. Each of these
is associated with different PDs, EADs and LGDs. When relevant, it also incorporates how defaulted loans and investments are expected
to be recovered, including the value of collateral or the amount that might be received for selling the asset.
With the exception of credit cards and other revolving facilities, for which the treatment is separately set out, the maximum period for
which the credit losses are determined is the contractual life of a financial instrument.
Impairment losses and recoveries are accounted for and disclosed separately.
The mechanics of the ECL method are summarised below:
Stage 1
The 12mECL is calculated as the portion of LTECLs that represent the ECLs that result from default events on a financial instrument
that are possible within the 12 months after the reporting date. The Bank calculates the 12mECL allowance based on the expectation
of a default occurring in the 12 months following the reporting date. These expected 12-month default probabilities are applied to a
forecast EAD and multiplied by the expected LGD which are derived as explained under Stage 3 for loans and using Global Credit Loss
tables for traded investments and modified with management overlays when not traded.
Stage 2
When a loan or investment has shown a significant increase in credit risk since origination, the Bank records an allowance for the
LTECLs. The mechanics are similar to those explained above, but PDs and LGDs are estimated over the lifetime of the instrument. The
LGDs are derived, as explained under Stage 3, for loans and using Global Credit Loss tables for traded investments and modified with
management overlays when not traded.
For the year ended September 30, 2018. Expressed in thousands of Guyana dollars ($’000) except where otherwise stated
Notes to the Financial Statements

80 Financial Statements
For the year ended September 30, 2018. Expressed in thousands of Guyana dollars ($’000) except where otherwise stated
Notes to the Financial Statements
2 SIGNIFICANT ACCOUNTING POLICIES (continued)
i Impairment of financial assets (Policy applicable from October 1, 2017) (continued)
ii The calculation of ECLs (continued)
The mechanics of the ECL method are summarised below: (continued)
Stage 3
For loans and investments considered credit-impaired (as defined in Note 20.2.8), the Bank recognises the lifetime expected credit
losses for these loans and investments. The method is similar to that for Stage 2 assets, with the PD set at 100%.
In most instances, LGDs are determined on an individual loan or investment basis, including discounting the expected cash flows at the
original EIR. Stage 3 LGDs are grouped by similar types to provide percentage averages to be applied for Stage 1 and Stage 2 loans.
In limited circumstances within the Bank, where portfolios were small and the products homogenous with minimal history of defaults, a
simplified ECL approach was applied using historical loss rates and staged based on the sovereign rating of the residence of the loan.
iii Revolving facilities
The Bank’s product offering includes a variety of corporate and retail overdraft facilities, in which the Bank has the right to cancel and/
or reduce the facilities. The Bank limits its exposure to credit losses on overdraft facilities to the outstanding balance.
The ongoing assessment of whether a significant increase in credit risk has occurred for revolving facilities is similar to other lending
products. This is based on shifts in the customer’s internal credit grade, as explained in Note 20.2.5, but emphasis is also
given to qualitative factors such as changes in usage and repayment patterns.
iv Treasury Bills, Statutory deposits with Central Banks and Due from banks
Treasury Bills, Statutory deposits with Central Banks and Due from banks are short-term funds placed with Central Banks in the countries
where the Bank is engaged in the full range of banking and financial activities and correspondent banks and the Bank therefore considers
the risk of default to be very low. The ECL on these instruments was determined to be zero, with the exception of the Bank’s exposure
to the Government of Barbados.
v Financial guarantees, letters of credit and undrawn loan commitments
The Bank issues financial guarantees, letters of credit and loan commitments.
Financial guarantees, letters of credit and loan commitments are off-balance sheet instruments and have no history of default.
As a result, the Bank considers the risk of default to be very low and the ECLs on these instruments were determined to be
zero.
vi Forward looking information
In its ECL models, the Bank considers a broad range of forward looking information as economic inputs, such as:
• Currency rates
• GDP growth
• Unemployment rates
• Industry risk
• Real estate price trends
• Commodity price inflation rates
Within the countries in which the Bank operates, there was little correlation between the overall performance of the economies and
historic loss trends. It was therefore not possible to directly correlate macroeconomic expectations to adjustments within the ECL
models.

81Financial Statements
2 SIGNIFICANT ACCOUNTING POLICIES (continued)
i Impairment of financial assets (Policy applicable from October 1, 2017) (continued)
vi Forward looking information (continued)
The Bank, however, recognised that the inputs and models used for calculating ECLs may not always capture all characteristics and
expectations of the market at the date of the financial statements. To reflect this, management adjustments or overlays are occasionally
made based on judgements as temporary adjustments when such differences are significantly material.
j Collateral valuation
To mitigate its credit risks on financial assets, the Bank seeks to use collateral, where possible. The collateral comes in various forms, such as
cash, securities, letters of credit/guarantees, real estate, receivables, inventories and other non-financial assets. The Bank’s accounting policy
for collateral assigned to it through its lending arrangements under IFRS 9 is the same as it was under IAS 39. Collateral, unless repossessed,
is not recorded on the Bank’s statement of financial position. However, the fair value of collateral affects the calculation of ECLs. It is generally
assessed at inception and re-assessed on a periodic basis.
To the extent possible, the Bank uses active market data for valuing financial assets held as collateral. Other financial assets, which do
not have readily determinable market values, are valued using models. Non-financial collateral, such as real estate, is valued based on
independent valuations and other data provided by third parties.
k Collateral repossessed
The Bank’s accounting policy under IFRS 9 remains the same as it was under IAS 39. The Bank’s policy is for a repossessed asset to be sold.
Assets to be sold are transferred to assets held for sale at their fair value (if financial assets) and fair value less cost to sell for non-financial
assets at the repossession date, in line with the Bank’s policy.
In its normal course of business, should the Bank repossess properties or other assets in its retail portfolio, it sometimes engages external
agents to assist in the sale of these assets to settle outstanding debt. Any surplus funds are returned to the customers/obligors. As a result
of this practice, the residential properties under legal repossession processes are not recorded on the statement of financial position.
l Write-offs
The Bank’s accounting policy under IFRS 9 remains the same as it was under IAS 39. Financial assets are written off either partially or in
their entirety only when the Bank has stopped pursuing the recovery. If the amount to be written off is greater than the accumulated
loss allowance, the difference is first treated as an addition to the allowance that is then applied against the gross carrying amount. Any
subsequent recoveries are credited to other income.
m Impairment of financial assets (policy applicable before October 1, 2017)
The Bank assesses at each reporting date whether there is any objective evidence that a financial asset or group of financial assets is
impaired. A financial asset or group of financial assets is impaired when the carrying value is greater than the recoverable amount and there
is objective evidence of impairment. The recoverable amount is the present value of the future cash flows.
For the year ended September 30, 2018. Expressed in thousands of Guyana dollars ($’000) except where otherwise stated
Notes to the Financial Statements

82 Financial Statements
For the year ended September 30, 2018. Expressed in thousands of Guyana dollars ($’000) except where otherwise stated
Notes to the Financial Statements
2 SIGNIFICANT ACCOUNTING POLICIES (continued)
m Impairment of financial assets (policy applicable before October 1, 2017) (continued)
i Advances
All non-performing and individually significant advances are individually reviewed and specific provisions made for the impaired
portion based on the realisable value of the loan collateral and discounted by the original effective interest rate of the loan. The provision
made is the difference between the loan balance and the discounted value of the collateral. Previously accrued income is reversed and
further interest income is not accrued. Individually insignificant loans with similar characteristics are assessed for impairment on a
group basis. Where possible, the Bank seeks to restructure loans instead of taking possession of collateral. This may involve extending
the payment arrangements and the agreement of new loan conditions. Once the terms are renegotiated, any impairment is measured
using the original effective interest rate and the loan is no longer considered past due. Management continually reviews renegotiated
loans to ensure that all criteria are met and future payments likely to occur. The loans continue to be subject to an individual or
collective impairment assessment.
Regulatory and other loan loss requirements that exceed these amounts are dealt with in the general banking risk reserve as an
appropriation of retained earnings.
When all efforts have been exhausted to recover a non-performing loan, that loan is deemed uncollectible and written off against the
related provision for loan losses.
ii Investment securities
The Bank individually assesses each investment security for objective evidence of impairment. If an impaired instrument has been
renegotiated, interest continues to be accrued at the original effective interest rate on the reduced carrying amount of the asset and is
recorded as part of “interest income”. If the fair value of the instrument increases in a subsequent year, the impairment loss is reversed
through the Statement of Income.
If there is objective evidence that the cost of an available-for-sale equity security may not be recovered, the security is considered to
be impaired. Objective evidence that the cost may not be recovered includes qualitative impairment criteria as well as a significant
or prolonged decline in the fair value below cost. The Bank’s policy considers a significant decline to be one in which the fair value is
below the weighted-average cost by more than 30%, and a prolonged decline to be one in which fair value is below the weighted-
average cost for greater than one year. This policy is applied at the individual security level.
If an available-for-sale equity security is impaired based upon the Bank’s qualitative or quantitative impairment criteria, any further
declines in the fair value at subsequent reporting dates are recognised as impairments. Therefore, at each reporting period, for an
equity security that is determined to be impaired based upon the Bank’s impairment criteria, an impairment is recognised for the
difference between the fair value and the original cost basis, less any previously recognised impairments.
Any subsequent increases in value of previously impaired securities are taken to OCI.
n Leases
The leases entered into by the Bank as lessee are all operating leases. Operating lease payments are recognised as an expense in the
Statement of Income on a straight-line basis over the lease term.

83Financial Statements
2 SIGNIFICANT ACCOUNTING POLICIES (continued)
o Premises and equipment
Premises and equipment are stated at cost less accumulated depreciation.
Subsequent costs are included in the asset’s carrying amount or recognised as a separate asset, as appropriate, only when it is probable that
future economic benefits associated with the item will flow to the Bank and the cost of the item can be measured reliably. All other repairs
and maintenance are charged to the Statement of Income during the financial period in which they are incurred.
The assets’ residual values and useful lives are reviewed, and adjusted if appropriate, at each reporting date. Gains and losses on disposals
are determined by comparing proceeds with carrying amounts. These are included in the Statement of Income.
Leasehold buildings and leased equipment are depreciated over the period of the lease. Depreciation other than on leasehold buildings
and leased equipment is computed on the declining balance method at rates expected to apportion the cost of the assets over their
estimated useful lives as follows:
Buildings 30 to 75 years
Security equipment 6 to 15 years
Computer equipment 4 to 10 years
Furniture, fixtures and other equipment 4 to 15 years
Land and work-in-progress are not depreciated.
p Intangible assets
The Bank’s intangible assets comprise the value of computer software. An intangible asset is recognised only when its cost can be measured
reliably and it is probable that the expected future economic benefits that are attributable to it will flow to the Bank.
Intangible assets are measured on initial recognition at cost. Following initial recognition, intangible assets are carried at cost less any
accumulated amortisation.
Amortisation is calculated using the reducing balance method over their estimated useful lives of three to five years.
Subsequent expenditure on intangible assets is capitalised only when there is an increase in the future economic benefits inherent in the
specific assets to which it relates. All other expenditure is expensed as incurred.
q Goodwill
Goodwill on acquisition is initially measured at cost being the excess of the cost of the business combination over the Bank’s interest
in the net fair value of the identifiable assets, liabilities and contingent liabilities. Following initial recognition, goodwill is measured at
cost less any accumulated impairment losses. Goodwill is reviewed for impairment, annually or more frequently if events or changes in
circumstances indicate that the carrying value may be impaired.
As at acquisition date, any goodwill acquired is allocated to each of the cash-generating units expected to benefit from the combination’s
synergies. Impairment is determined by assessing the recoverable amount of the cash-generating unit, to which goodwill relates. Where
the recoverable amount of the cash-generating unit is less than the carrying amount, an impairment loss is recognised.
Where the Bank’s interest in the net fair value of the identifiable assets, liabilities and contingent liabilities exceeds the cost of the business
combination, this gain is recognised immediately in the Statement of Income as a credit to other income.
For the year ended September 30, 2018. Expressed in thousands of Guyana dollars ($’000) except where otherwise stated
Notes to the Financial Statements

84 Financial Statements
For the year ended September 30, 2018. Expressed in thousands of Guyana dollars ($’000) except where otherwise stated
Notes to the Financial Statements
2 SIGNIFICANT ACCOUNTING POLICIES (continued)
r Employee benefits
i Pension obligations
The Bank operates a defined benefit pension plan for qualifying employees. The Plan is funded and the Bank’s contribution is
determined by the independent actuaries. Annually, the Bank’s independent actuaries conduct a valuation exercise to measure the
effect of the employee benefit plan.
The liability recognised in the Statement of Financial Position in respect of the defined benefit pension plan is the present value of the
defined benefit obligation at the reporting date less the fair value of plan assets together with adjustments for unrecognised actuarial
gains and losses and past service costs.
The defined benefit obligation is calculated annually by the independent actuaries using the projected unit credit method. Under this
method, the cost of providing pensions is charged to the Statement of Income so as to spread regular costs over the service lives of
employees in accordance with the advice of the actuaries.
The pension obligation is measured as the present value of the estimated future cash outflows using interest rates of government
securities which have terms to maturity approximating the terms of the related liability. Remeasurements of the net defined benefit
liability, which comprise actuarial gains and losses and return on plan assets (excluding interest), are recognised immediately through
Other Comprehensive Income.
The defined benefit plans mainly expose the Bank to risks such as investment risk, interest rate risk, and longevity risk.
The above accounting requirement in no way affects the pension plan which continues to be governed by the approved Trust Deed
and Rules and remains under the full control of the appointed Trustees.
The full results of the valuation exercise are disclosed in note 9 to these financial statements.
ii Profit share scheme
The Bank operates an employee profit share scheme in accordance with terms outlined in the Human Resource Policy Guidelines. The
profit share to be distributed to employees each year is based on a specific formula outlined in these guidelines. Employees are paid
profit share in cash. The Bank accounts for the profit share as an expense through the Statement of Income.
s Taxation
Deferred income tax is provided in full, using the liability method, on temporary differences arising between the tax bases of assets and
liabilities and their carrying amounts in the financial statements. Deferred income tax is determined using tax rates (and laws) that have
been enacted or substantially enacted by the reporting date and are expected to apply when the related deferred income tax asset is
realised or the deferred income tax liability is settled.
Deferred tax assets are recognised where it is probable that future taxable profit will be available against which the temporary differences
can be utilised.
Income tax payable on profits, based on the applicable tax law in each jurisdiction, is recognised as an expense in the period in which profits
arise. The tax effects of income tax losses available for carry forward are recognised as an asset when it is probable that future taxable profits
will be available against which these losses can be utilised.

85Financial Statements
2 SIGNIFICANT ACCOUNTING POLICIES (continued)
t Statutory reserves
In accordance with the Financial Institutions Act Cap. 85:03, a minimum of 15.00% of the current year’s net profit must be transferred to
the Reserve Fund until the amount in the Fund is equal to the paid up Capital of the Bank. This reserve is non-distributable.
u Earnings per stock unit
Data on earnings per stock unit has been computed by dividing the net profit attributable to ordinary stockholders by the
weighted average number of ordinary stocks in issue during the year. The Bank has no dilutive ordinary stocks.
v Foreign currency translation
The financial statements are presented in Guyana dollars, which is the currency of the primary economic environment in which the Bank
operates (its functional currency).
Monetary assets and liabilities, which are denominated in foreign currencies, are expressed in Guyana dollars at rates of exchange ruling at
the reporting date. Non-monetary assets and liabilities denominated in foreign currencies are translated at historic rates. All revenue and
expenditure transactions denominated in foreign currencies are translated at mid-exchange rates and the resulting profits and losses on
exchange from these trading activities are dealt with in the Statement of Income.
w Revenue recognition
Revenue is recognised to the extent that it is probable that the economic benefits will flow to the Bank and the revenue can be reliably
measured, regardless of when the payment is being made. Revenue is measured at the fair value of the consideration received or receivable,
taking into account contractually defined terms of payment and excluding taxes or duty. The Bank has concluded that it is the principal in
all of its revenue arrangements since it is the primary obligor in all the revenue arrangements, has pricing latitude, and is also exposed to
credit risks.
The specific recognition criteria described below must also be met before revenue is recognised.
The effective interest rate method
Under both IFRS 9 and IAS 39, interest income and expense is recorded using the effective interest rate (EIR) method for all financial
instruments measured at amortised cost. The EIR is the rate that exactly discounts estimated future cash receipts through the expected life
of the financial instrument or, when appropriate, a shorter period, to the net carrying amount of the financial asset.
The EIR (and therefore, the amortised cost of the asset) is calculated by taking into account any discount or premium on acquisition, fees
and costs that are an integral part of the EIR. The Bank recognises interest income using a rate of return that represents the best estimate of
a constant rate of return over the expected life of the loan. Hence, it recognises the effect of potentially different interest rates charged at
various stages, and other characteristics of the product life cycle (including prepayments, penalty interest and charges).
Interest income and expense
The Bank calculates interest income and expense by applying the EIR to the gross carrying amount of financial assets and liabilities other
than credit-impaired assets.
When a financial asset becomes credit-impaired (as set out in Note 2 (i) (i)) and is, therefore, regarded as ‘Stage 3’, the Bank calculates interest
income by applying the effective interest rate to the net amortised cost of the financial asset. If the financial assets cures and is no longer
credit-impaired, the Bank reverts to calculating interest income on a gross basis.
Interest income on all trading assets and financial assets mandatorily required to be measured at FVPL is recognised using the contractual
interest rate in net trading income and Net gains/(losses) on financial assets at fair value through profit or loss, respectively.
For the year ended September 30, 2018. Expressed in thousands of Guyana dollars ($’000) except where otherwise stated
Notes to the Financial Statements

86 Financial Statements
For the year ended September 30, 2018. Expressed in thousands of Guyana dollars ($’000) except where otherwise stated
Notes to the Financial Statements
2 SIGNIFICANT ACCOUNTING POLICIES (continued)
w Revenue recognition (continued)
Dividends
Dividend income is recognised when the right to receive the payment is established.
x Fee and commission income
Unless included in the effective interest calculation, fees and commissions are recognised on an accruals basis as the service is
provided. Fees and commissions not integral to effective interest arising from negotiating, or participating in the negotiation of a
transaction from a third party, are recognised on completion of the underlying transaction.
y Segment reporting
Operating segments are reported in a manner consistent with the internal reporting provided to the chief operating decision-maker. The
chief operating decision-maker is the person or group that allocates resources to and assesses the performance of the operating segments
of an entity. The Bank has determined the Managing Director as its chief operating decision-maker.
Management considers its banking operation to be a single business unit. All business is conducted in Guyana with the exception of certain
investment activities.
z Customers’ liability under acceptances, guarantees, indemnities and letters of credit
These represent the Bank’s potential liability, for which there are equal and offsetting claims against its customer in the event of a call on
these commitments. These amounts are not recorded on the Bank’s Statement of Financial Position but set out in Note 26 (b) of these
financial statements.
aa Assets classified as held-for-sale
A non-current asset is classified as held-for-sale when: its carrying amount will be recovered principally through a sale transaction rather
than through continuing use; the asset is available for immediate sale in its present condition; and its sale is highly probable. Assets classified
as held-for-sale are not depreciated or amortised and are carried at the lower of the carrying amount and fair value less cost to sell.
ab Comparatives
Certain changes in presentation have been made in these financial statements. These changes had no effect on the operating results, profit
after tax or earnings per stock unit of the Bank for the previous year.
ac Equity reserves
The reserves recorded in equity on the Bank’s statement of financial position include:
Stated Capital – Ordinary stated capital is classified within equity and is recognised at the fair value of the consideration received by the Bank
at the date received.
General contingency reserves / Other reserves - prior to October 1, 2017, the General Contingency reserve was used as an appropriation of
retained earnings for the difference between specific provisions and the non-performing advances. From October 1, 2017, the balance on
this reserve represents the difference between IFRS 9 provision and regulatory requirement.
Net unrealised gains – prior to October 1, 2017, net unrealised gains comprised changes in fair value of available-for-sale
investments.
Other statutory reserves that qualify for treatment as equity are discussed in Note 2 t.

87Financial Statements
3 SIGNIFICANT ACCOUNTING JUDGEMENTS AND ESTIMATES IN APPLYING THE BANK’S ACCOUNTING POLICIES
Management has made the following judgements in its application of the Bank’s accounting policies which have the most significant effect on
the amounts reported in the financial statements:
Impairment losses on financial assets (Policy applicable under IFRS 9)
The measurement of impairment losses under IFRS 9 across all categories of financial assets requires judgement. These estimates are driven by a
number of factors, changes in which can result in different levels of allowances.
The Bank’s ECL calculations are outputs of complex models with a number of underlying assumptions regarding the choice of variable inputs and
their interdependencies. Elements of the ECL models that are considered accounting judgements and estimates include:
• The estimation of the amount and timing of future cash flows and collateral values when determining impairment losses
• The Bank’s internal credit grading model, which assigns PDs to the individual grades for corporate facilities
• The Bank’s criteria for assessing if there has been a significant increase in credit risk and so allowances for financial assets should be measured
on a LTECL basis and the qualitative assessment
• Development of ECL models, including the various formulas and the choice of inputs
• Determination of the existence of associations between macroeconomic scenarios and economic inputs, such as unemployment levels and
collateral values, and the effect on PDs, EADs and LGDs
• The inclusion of overlay adjustments based on judgement and future expectations
Impairment losses and investment valuation (Policy applicable under IAS 39)
Under IAS 39, financial assets are determined impaired when the carrying value is greater than the recoverable amount and there is objective
evidence of impairment. The recoverable amount is the present value of the future cash flows.
It has been the Bank’s policy to regularly review its models in the context of actual loss experience and adjust when necessary.
Inherent provisions on advances (note 5c) (Policy applicable under IAS 39)
Inherent provisions on advances are calculated on an estimate of impairment incurred but not reported, existing in assets as at the reporting
date. Estimated impairment incurred is determined by applying against performing loan balances, the average loan default rates and adjusting
this balance for current economic factors that affect loan performance. An anticipated recovery rate (determined from historical average) is then
applied to determine the value that is recoverable. This calculation is computed by product type.
Valuation of investments (note 6) (Policy applicable under IAS 39)
The Bank has applied IAS 39 in its classification of investment securities which requires measurement of securities at fair value. For unquoted
equity instruments and unlisted securities, fair values are estimated using price/earnings or price/cash flow ratios which have been refined to
accommodate the specific circumstances of the issuer.
Net pension asset/liability (note 9)
In conducting valuation exercises to measure the effect of the employee benefit plan, the Bank’s independent actuaries use judgement and
assumptions in determining discount rates, salary increases, NIS ceiling increases, pension increases, and the rate of return on the assets of the
Plan.
Goodwill (note 8)
The Bank’s financial statements include goodwill arising from acquisitions. In accordance with IFRS 3, goodwill was reviewed for impairment as
at September 30, 2018, using the ‘value in use’ method. This requires the use of estimates for determination of future cash flows expected to arise
from each cash-generating unit and an appropriate discount rate to calculate present value.
For the year ended September 30, 2018. Expressed in thousands of Guyana dollars ($’000) except where otherwise stated
Notes to the Financial Statements

88
Financial Statements
For the year ended September 30, 2018. Expressed in thousands of Guyana dollars ($’000) except where otherwise stated
Notes to the Financial Statements
3 SIGNIFICANT ACCOUNTING JUDGEMENTS AND ESTIMATES IN APPLYING THE BANK’S ACCOUNTING POLICIES (continued)
Deferred taxes (note 10)
In calculating the provision for deferred taxation, management uses judgement to determine the probability that future taxable profits will be
available to facilitate utilisation of temporary tax differences which may arise.
Premises and equipment and Intangible Assets (note 7)
Management exercises judgement in determining whether costs incurred can accrue sufficient future economic benefits to the Bank to enable
the value to be treated as a capital expense. Further judgement is used upon annual review of the residual values and useful lives of all capital
items to determine any necessary adjustments to carrying value.
4 DUE FROM BANKS
2018 2017
Bank of Guyana – excess of statutory deposit 19,490,715 9,995,975
Other banks 1,747,489 1,456,859
21,238,204 11,452,834
5 ADVANCES
a Advances
Commercial Retail and Corporate 2018 lending lending Mortgages Overdrafts Total
Performing advances 8,535,703 27,783,480 24,367,138 7,569,118 68,255,439
Non-performing advances 21,156 2,434,573 1,301,723 180,768 3,938,220
8,556,859 30,218,053 25,668,861 7,749,886 72,193,659
Unearned interest (1,614,317) – – – (1,614,317)
Accrued interest – 282,546 95,987 – 378,533
6,942,542 30,500,599 25,764,848 7,749,886 70,957,875
Allowance for ECLs - Note 5 (c) (63,793) (419,252) (255,129) (63,995) (802,169)
6,878,749 30,081,347 25,509,719 7,685,891 70,155,706
Unearned loan origination fees (208,890) (126,887) (71,979) – (407,756)
Net Advances 6,669,859 29,954,460 25,437,740 7,685,891 69,747,950
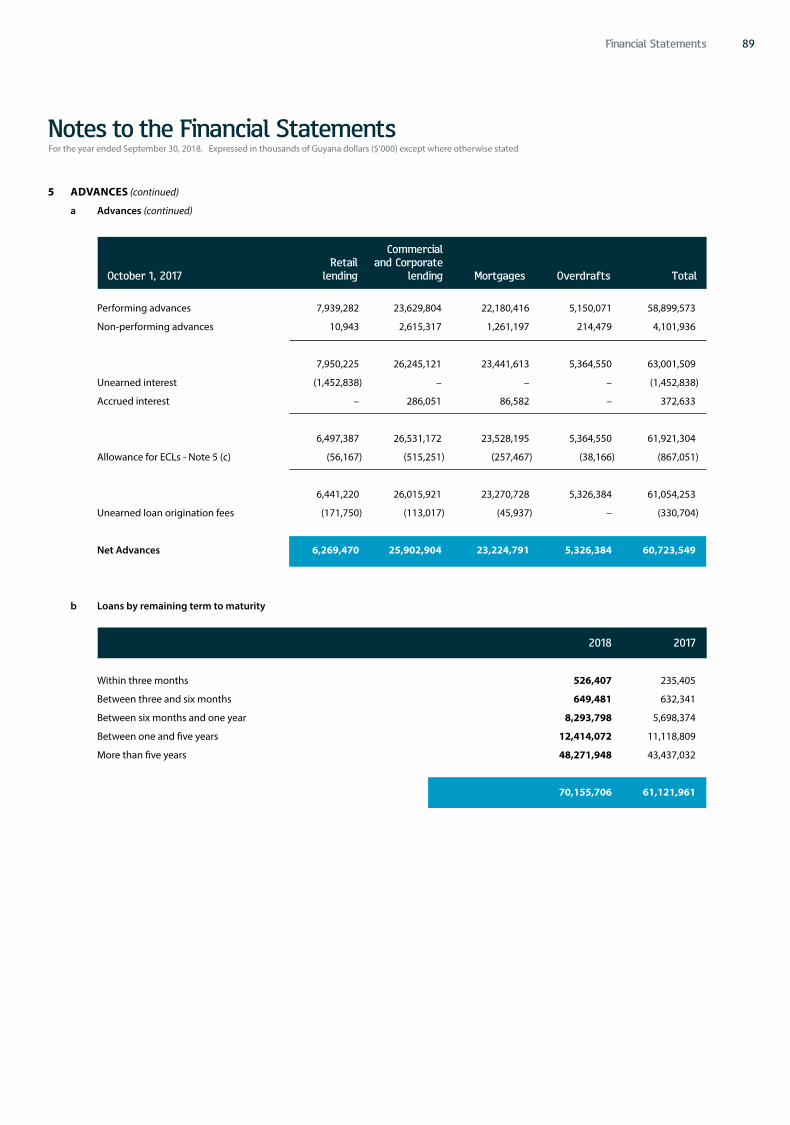
89
Financial Statements
5 ADVANCES (continued)
a Advances (continued)
Commercial Retail and Corporate October 1, 2017 lending lending Mortgages Overdrafts Total
Performing advances 7,939,282 23,629,804 22,180,416 5,150,071 58,899,573
Non-performing advances 10,943 2,615,317 1,261,197 214,479 4,101,936
7,950,225 26,245,121 23,441,613 5,364,550 63,001,509
Unearned interest (1,452,838) – – – (1,452,838)
Accrued interest – 286,051 86,582 – 372,633
6,497,387 26,531,172 23,528,195 5,364,550 61,921,304
Allowance for ECLs - Note 5 (c) (56,167) (515,251) (257,467) (38,166) (867,051)
6,441,220 26,015,921 23,270,728 5,326,384 61,054,253
Unearned loan origination fees (171,750) (113,017) (45,937) – (330,704)
Net Advances 6,269,470 25,902,904 23,224,791 5,326,384 60,723,549
b Loans by remaining term to maturity
2018 2017
Within three months 526,407 235,405
Between three and six months 649,481 632,341
Between six months and one year 8,293,798 5,698,374
Between one and five years 12,414,072 11,118,809
More than five years 48,271,948 43,437,032
70,155,706 61,121,961
For the year ended September 30, 2018. Expressed in thousands of Guyana dollars ($’000) except where otherwise stated
Notes to the Financial Statements

90
Financial Statements
For the year ended September 30, 2018. Expressed in thousands of Guyana dollars ($’000) except where otherwise stated
Notes to the Financial Statements
5 ADVANCES (continued)
c Impairment allowance for advances to customers
The table below shows the staging of advances and the related ECLs based on the Bank’s criteria as explained in Note 20.2.4 and policies on
whether ECL allowances are calculated on an individual or collective basis are set out in Note 20.2.6.
Commercial
Retail and Corporate 2018 lending lending Mortgages Overdrafts Total
Gross Loans 6,942,542 30,500,599 25,764,848 7,749,886 70,957,875
Stage 1: 12 Month ECL (55,678) (141,951) (59,116) (40,071) (296,816)
Stage 2: Lifetime ECL (1,869) (9,129) (10,594) (1,109) (22,701)
Stage 3: Credit Impaired Financial Assets -
Lifetime ECL (6,246) (268,172) (185,419) (22,815) (482,652)
6,878,749 30,081,347 25,509,719 7,685,891 70,155,706
Commercial Retail and Corporate 2017 lending lending Mortgages Overdrafts Total
Gross Loans 6,497,387 26,531,172 23,528,195 5,364,550 61,921,304
Stage 1: 12 Month ECL (42,438) (113,554) (53,725) (36,056) (245,773)
Stage 2: Lifetime ECL (2,586) (11,277) (16,576) (1,438) (31,877)
Stage 3: Credit Impaired Financial Assets -
Lifetime ECL (11,143) (390,420) (187,166) (672) (589,401)
6,441,220 26,015,921 23,270,728 5,326,384 61,054,253
Stage 1: 12 Month ECL
ECL allowance as at October 1, 2017
under IFRS 9 42,438 113,554 53,725 36,056 245,773
ECL on new instruments issued during the year 32,343 82,231 504 – 115,078
Other Credit Loss movements, repayments etc. (19,103) (53,834) 4,887 4,015 (64,035)
At September 30, 2018 55,678 141,951 59,116 40,071 296,816
Stage 2: Lifetime ECL
ECL allowance as at October 1, 2017
under IFRS 9 2,586 11,277 16,576 1,438 31,877
ECL on new instruments issued during the year 668 5,491 640 – 6,799
Other Credit Loss movements, repayments etc. (1,385) (7,639) (6,622) (329) (15,975)
At September 30, 2018 1,869 9,129 10,594 1,109 22,701

91
Financial Statements
5 ADVANCES (continued)
c Impairment allowance for advances to customers (continued)
Commercial
Retail and Corporate lending lending Mortgages Overdrafts Total
Stage 3: Credit Impaired Financial Assets -
Lifetime ECL
ECL allowance as at October 1, 2017 under IFRS 9 11,143 390,420 187,166 672 589,401
Charge-offs and write-offs (189,497) (59,885) (531,505) (49,145) (830,032)
Credit Loss Expense 41,932 (126,577) 529,758 71,288 516,401
Recoveries 142,668 64,214 – – 206,882
At September 30, 2018 6,246 268,172 185,419 22,815 482,652
Total 63,793 419,252 255,129 63,995 802,169
Of the Total ECL of $802.2 million, 39.8 % was on a collective basis and 60.2% was on an individual basis.
d Provision for loan losses by economic sectors
Gross Non- Specific Expected 2018 Amount Performing Provision Credit Loss Net Advances
Government and government bodies 109,382 – – – 109,382
Financial sector 72,489 – – (390) 72,099
Energy and mining 215,839 108,998 (35,163) (1,162) 288,512
Agriculture 3,131,837 437,089 (35,223) (16,867) 3,516,836
Electricity and water 565 – – (3) 562
Transport, storage and communication 1,345,720 153,845 – (7,247) 1,492,318
Distribution 10,103,591 1,326,335 (57,461) (54,414) 11,318,051
Real estate mortgages 24,463,125 1,301,723 (185,419) (69,711) 25,509,718
Manufacturing 4,050,273 178,669 (98,992) (21,812) 4,108,138
Construction 1,131,404 156,744 – (6,093) 1,282,055
Hotel and restaurant 47,507 – – (256) 47,251
Personal 6,747,893 21,156 (6,247) (57,547) 6,705,255
Non-residents 173,493 – - (934) 172,559
Other services 15,426,537 253,661 (64,147) (83,081) 15,532,970
67,019,655 3,938,220 (482,652) (319,517) 70,155,706
For the year ended September 30, 2018. Expressed in thousands of Guyana dollars ($’000) except where otherwise stated
Notes to the Financial Statements

92
Financial Statements
For the year ended September 30, 2018. Expressed in thousands of Guyana dollars ($’000) except where otherwise stated
Notes to the Financial Statements
5 ADVANCES (continued)
d Provision for loan losses by economic sectors (continued)
Gross Non- Specific Expected 2017 Amount Performing Provision Credit Loss Net Advances
Government and government bodies 95,277 – – – 95,277
Financial sector 85,252 – – (476) 84,776
Energy and mining 276,324 139,590 (40,720) (1,542) 373,652
Agriculture 3,002,996 871,708 (153,679) (16,763) 3,704,262
Electricity and water 2,702 – – (15) 2,687
Transport, storage and communication 1,408,378 147,425 – (7,862) 1,547,941
Distribution 6,874,900 979,995 (22,740) (38,376) 7,793,779
Real estate mortgages 22,266,998 1,261,197 (187,166) (70,301) 23,270,728
Manufacturing 2,837,625 210,328 (66,405) (15,840) 2,965,708
Construction 1,202,995 191,130 – (6,715) 1,387,410
Hotel and restaurant 62,250 47,511 – (347) 109,414
Personal 6,377,086 10,943 (11,143) (45,024) 6,331,862
Non-residents 109,358 – – (610) 108,748
Other services 13,217,227 242,109 (107,548) (73,779) 13,278,009
57,819,368 4,101,936 (589,401) (277,650) 61,054,253
e Advances to customers as at September 30, 2017
Advances as per IAS 39
Commercial
Retail and Corporate lending lending Mortgages Total
Performing advances 7,939,282 28,779,875 22,180,416 58,899,573
Non-performing advances 10,943 2,829,796 1,261,197 4,101,936
7,950,225 31,609,671 23,441,613 63,001,509
Unearned interest (1,452,838) – – (1,452,838)
Accrued interest – 286,051 86,582 372,633
6,497,387 31,895,722 23,528,195 61,921,304
Allowance for impairment losses - Note 5 (c) (48,544) (537,240) (213,559) (799,343)
Unearned loan origination fees (171,750) (113,017) (45,937) (330,704)
Net Advances 6,277,093 31,245,465 23,268,699 60,791,257

93
Financial Statements
5 ADVANCES (continued)
e Advances to customers as at September 30, 2017 (continued)
Impairment allowance as at September 30, 2017
An analysis of the allowance for impairment losses under IAS 39 for loans and advances, by class, for the year to September 30, 2017 is, as
follows:
Commercial
Retail and Corporate lending lending Mortgages Total
Balance brought forward (33,069) (665,905) (155,828) (854,802)
Charge-offs and write-offs 213,442 517,766 – 731,208
Loan impairment expense (427,790) (2,238,686) (328,113) (2,994,589)
Loan impairment recoveries 198,873 1,849,585 270,382 2,318,840
Balance carried forward (48,544) (537,240) (213,559) (799,343)
Individual impairment (11,143) (391,092) (187,166) (589,401)
Collective impairment (37,401) (146,148) (26,393) (209,942)
(48,544) (537,240) (213,559) (799,343)
Gross amount of loans individually
determined to be impaired, before
deducting any allowance 10,943 2,829,796 1,261,197 4,101,936
f Restructured / Modified Loans
Within the retail portfolio, management will, in the normal course of business, modify the terms and conditions of facilities in the case of
difficulties by the borrower. These modifications rarely result in an impairment loss, and if they do, they are not material.
The Bank occasionally makes modifications to the original terms of large commercial and corporate loans as a response to the borrower’s
financial difficulties, rather than taking possession or to otherwise enforce collection of collateral. These modifications are made only when
the Bank believes the borrower is likely to meet the modified terms and conditions. Indicators of financial difficulties include defaults on
covenants, overdue payments or significant concerns raised by the Credit Risk Department. Once the terms have been renegotiated, any
impairment is measured using the original EIR as calculated before the modification of terms.
Restructured loans are carefully monitored. Restructured large commercial and corporate loans are classified as Stage 2 and amounted to
$205.1 million, as at September 30, 2018, with a corresponding ECL of $2.3 million.
g The undiscounted fair value of collateral that the Bank holds relating to loans individually determined to be impaired, at September 30,
2018, amounts to $4,801.6 million (2017: $3,773.7 million). The collateral consists of cash, securities and properties.
h Collateral realised
During the year, the Bank realised collateral amounting to $28.4 million (2017: $24.2 million).
For the year ended September 30, 2018. Expressed in thousands of Guyana dollars ($’000) except where otherwise stated
Notes to the Financial Statements

94
Financial Statements
For the year ended September 30, 2018. Expressed in thousands of Guyana dollars ($’000) except where otherwise stated
Notes to the Financial Statements
5 ADVANCES (continued)
i Credit concentration by economic sector (facilities totalling 10% and above of Capital base for any one customer or group of closely related
customers).
2018 2017
Government 12,618,390 2,566,002
Distribution 2,683,053 –
Manufacturing 2,561,303 –
Other services 4,593,327 4,291,510
22,456,073 6,857,512
6 INVESTMENT SECURITIES
a Debt instruments at amortised cost
2018 2017
Government securities 12,911,496 3,591,972
State-owned company securities 1,245,245 1,004,850
Corporate bonds 1,517,452 2,824,165
15,674,193 7,420,987
Designated at fair value through profit or loss
Equity 20,000 20,000
Total investment securities 15,694,193 7,440,987
b Investment securities by remaining term to maturity
2018 2017
Within three months 154,578 27,245
Between three and six months – 488,256
Between six months and one year 2,294,022 741,138
Between one and five years 9,775,786 2,648,122
More than five years 3,469,807 3,536,226
15,694,193 7,440,987

95
Financial Statements
6 INVESTMENT SECURITIES (continued)
c Treasury Bills by remaining term to maturity
2018 2017
Within three months 14,194,574 14,659,358
Between three and six months 3,785,742 9,842,407
Between six months and one year 15,115,981 15,537,387
33,096,297 40,039,152
d Financial investment securities subject to impairment assessment
Debt instruments measured at amortised cost
The table below shows the credit quality and the maximum exposure to credit risk based on the Bank’s credit rating system, aging and
year-end stage classification.
Stage 1 Stage 2 Stage 3
12 Month ECL Lifetime ECL Credit Impaired Financial Assets
2018 -Lifetime ECL Total
Gross exposure – 16,017,217 – 16,017,217
ECL – (343,024) – (343,024)
Net Exposure – 15,674,193 – 15,674,193
Stage 1 Stage 2 Stage 3 12 Month ECL Lifetime ECL Credit Impaired
Financial Assets 2017 -Lifetime ECL Total
Gross exposure 1,390,000 6,001,146 – 7,391,146
ECL (2,033) (220,743) – (222,776)
Net Exposure 1,387,967 5,780,403 – 7,168,370
ECL allowance as at
October 1, 2017 under IFRS 9 2,033 220,743 – 222,776
ECL on new instruments issued
during the year – 227,346 – 227,346
Other Credit Loss movements,
repayments and maturities (2,033) (105,065) – (107,098)
At September 30, 2018 – 343,024 – 343,024
e Designated at fair value through profit or loss
For equity securities, cost is determined by the appropriate estimate of fair value since insufficient recent information is available to measure
fair value. Mutual fund securities are quoted and fair value is determined to be the quoted price at the reporting date.
For the year ended September 30, 2018. Expressed in thousands of Guyana dollars ($’000) except where otherwise stated
Notes to the Financial Statements

96
Financial Statements
For the year ended September 30, 2018. Expressed in thousands of Guyana dollars ($’000) except where otherwise stated
Notes to the Financial Statements
7 a Premises and equipment
Capital Equipment, works in Freehold furniture and 2018 progress premises fittings Total
Cost
At beginning of year 116,970 6,217,980 3,980,642 10,315,592
Additions at cost 15,001 80,091 223,657 318,749
Disposal of assets – (20,307) (105,460) (125,767)
Transfer of assets (116,387) 2,161 114,226 –
15,584 6,279,925 4,213,065 10,508,574
Accumulated depreciation
At beginning of year – 785,087 2,283,674 3,068,761
Charge for the year – 100,636 369,042 469,678
Disposal of assets – 7,583 (108,220) (100,637)
– 893,306 2,544,496 3,437,802
Net book value 15,584 5,386,619 1,668,569 7,070,772
Capital Equipment, works in Freehold furniture and 2017 progress premises fittings Total
Cost
At beginning of year 1,253,582 4,874,039 3,407,415 9,535,036
Additions at cost 104,663 230,738 602,974 938,375
Disposal of assets – (12,798) (145,021) (157,819)
Transfer of assets (1,241,275) 1,126,001 115,274 –
116,970 6,217,980 3,980,642 10,315,592
Accumulated depreciation
At beginning of year – 702,578 2,088,764 2,791,342
Charge for the year – 82,509 324,007 406,516
Disposal of assets – – (129,097) (129,097)
– 785,087 2,283,674 3,068,761
Net book value 116,970 5,432,893 1,696,968 7,246,831

97
Financial Statements
7 Premises and equipment (continued)
b Intangible assets
2018 2017
Cost
At beginning of year 671,830 618,099
Additions at cost 6,380 57,850
Disposal (9,804) (4,119)
668,406 671,830
Accumulated depreciation
At beginning of year 541,623 502,476
Charge for the year 41,809 43,256
Disposal (9,796) (4,109)
573,636 541,623
Net book value 94,770 130,207
c Capital commitments
2018 2017
Contracts for outstanding capital expenditure
not provided for in the financial statements 450,715 375,556
8 GOODWILL
2018 2017
Total unimpaired goodwill on acquisition 1,228,222 1,228,222
Impairment testing of goodwill
The residual balance of goodwill arising from business combinations was generated from the acquisition of certain assets and liabilities of the
Guyana National Cooperative Bank. In accordance with IFRS 3, all assets that gave rise to goodwill were reviewed for impairment, as at September
30, 2018, using the ‘value in use’ method. Based on the results of this review, no impairment expense was required.
For the year ended September 30, 2018. Expressed in thousands of Guyana dollars ($’000) except where otherwise stated
Notes to the Financial Statements

98
Financial Statements
For the year ended September 30, 2018. Expressed in thousands of Guyana dollars ($’000) except where otherwise stated
Notes to the Financial Statements
9 EMPLOYEE BENEFITS
a The amounts recognised in the Statement of Financial Position are as follows:
2018 2017
Present value of defined benefit obligation 1,943,300 1,731,300
Fair value of plan assets (1,957,000) (1,596,100)
Net (asset)/liability recognised in the Statement of Financial Position (13,700) 135,200
b Changes in the present value of the defined benefit obligation are as follows:
Opening defined benefit obligation 1,731,300 1,591,100
Current service cost 71,400 66,900
Interest cost 94,000 86,400
Members’ contributions 36,200 33,600
Re-measurements
- Experience adjustments 55,800 (6,900)
Benefits paid (45,400) (39,800)
Closing defined benefit obligation 1,943,300 1,731,300
c Changes in the fair value of plan assets are as follows:
2018 2017
Opening fair value of plan assets 1,596,100 1,418,700
Interest income 90,300 80,300
Return on plan assets, excluding interest income 177,200 15,300
Bank Contributions 107,700 92,800
Members’ contributions 36,200 33,600
Benefits paid (45,400) (39,800)
Expense allowance (5,100) (4,800)
Closing fair value of plan assets 1,957,000 1,596,100
Actual return on plan assets 267,500 95,600
d The amounts recognised in the Statement of Income are as follows:
2018 2017
Current service cost 71,400 66,900
Net interest on net defined benefit liability 3,700 6,100
Administration expenses 5,100 4,800
Net pension cost 80,200 77,800

99
Financial Statements
9 EMPLOYEE BENEFITS (continued)
e Reconciliation of opening and closing Statement of Financial Position entries:
2018 2017
Defined benefit obligation at prior year end 135,200 172,400
Unrecognised gain/(loss) charged to retained earnings – –
Opening defined benefit obligation 135,200 172,400
Net pension cost 80,200 77,800
Re-measurements recognised in other comprehensive income (121,400) (22,200)
Premiums paid by the Bank (107,700) (92,800)
Closing defined benefit (asset)/obligation (13,700) 135,200
f Liability profile
2018 2017
The defined benefit obligation is allocated between the Plan’s members as follows:
- Active members 76% 83%
- Deferred members 2% 4%
- Pensioners 22% 13%
The weighted duration of the defined benefit obligation at the year end 20.0 years 19.8 years
46% of the defined benefit obligation for active members is conditional on future salary increases
63% of the benefits for active members are vested
g Re-measurements recognised in Other Comprehensive Income
Experience gain (121,400) (22,200)
Total included in Other Comprehensive Income (121,400) (22,200)
For the year ended September 30, 2018. Expressed in thousands of Guyana dollars ($’000) except where otherwise stated
Notes to the Financial Statements

100
Financial Statements
For the year ended September 30, 2018. Expressed in thousands of Guyana dollars ($’000) except where otherwise stated
Notes to the Financial Statements
9 EMPLOYEE BENEFITS (continued)
h Sensitivity analysis
The calculation of the defined benefit obligation is sensitive to the assumptions used. The following table summarises how the defined
benefit obligation as at September 30, 2018 would have changed as a result of a change in the assumptions used.
1% per 1% per annum annum
decrease increase $’000 $’000
- Discount rate 423,000 (323,000)
- Future salary increases (223,000) 283,000
An increase of 1 year in the assumed life expectancies shown above would increase the defined benefit obligation at September 30, 2018,
by $50.0 million.
These sensitivities were calculated by recalculating the defined benefit obligations using the revised assumptions.
i Summary of principal actuarial assumptions as at September 30
2018 2017 % %
Discount rate 5.50 5.50
Rate of salary increase 5.50 5.50
NIS ceiling rates 5.00 5.00
Assumptions regarding future mortality are based on published mortality rates. The life expectancies underlying the value of the defined
benefit obligation, as at September 30, 2018, are as follows:
2018 2017
Life expectancy at age 65 for current pensioner in years:
- Male 14.6 14.6
- Female 18.4 18.4
Life expectancy at age 65 for current members age 40 in years:
- Male 14.6 14.6
- Female 18.4 18.4

101
Financial Statements
9 EMPLOYEE BENEFITS (continued)
j Plan asset allocation as at September 30
2018 2017
Local equities 378,500 173,600
Overseas equities 168,600 139,700
Local bonds – 90,900
Cash and cash equivalents 1,228,700 1,000,400
Mortgages 181,200 191,500
Fair value of scheme assets at end of year 1,957,000 1,596,100
k Funding
The Bank meets the balance of the cost of funding the defined benefit Pension Scheme and the Bank must pay contributions at least equal
to those paid by members, which are fixed. The funding requirements are based on regular (at least every 3 years) actuarial valuations of the
Scheme and the assumptions used to determine the funding required may differ from those set out above. The Bank expects to pay $111.0
million to the Pension Scheme during 2018/2019.
10 DEFERRED TAX ASSETS AND LIABILITIES
Components of deferred tax assets and liabilities
a Deferred tax assets
(Charge) / Credit Other Opening Impact Statement Comprehensive Closing
Balance of IFRS 9 of Income Income Balance 2017 2018
Pension liability 54,080 – (5,520) (48,560) –
Fee and commission income 132,282 – 30,820 – 163,102
ECL on loans and investments – 200,170 64,846 – 265,016
186,362 200,170 90,146 (48,560) 428,118
b Deferred tax liabilities
Credit
Other Opening Impact Statement Comprehensive Closing
Balance of IFRS 9 of Income Income Balance 2017 2018
Pension asset – – 5,480 – 5,480
Premises and equipment 343,479 – 29,947 – 373,426
Unrealised reserves 12,111 (12,111) – – –
355,590 (12,111) 35,427 – 378,906
For the year ended September 30, 2018. Expressed in thousands of Guyana dollars ($’000) except where otherwise stated
Notes to the Financial Statements

102
Financial Statements
11 OTHER ASSETS
2018 2017
Accounts receivable and prepayments 260,748 256,916
Items in transit 208,569 204,720
Other assets 36,531 808,586
505,848 1,270,222
12 CUSTOMERS’ CHEQUING, SAVINGS AND DEPOSIT ACCOUNTS
a Concentration of customers’ chequing, savings and deposit accounts
2018 Demand Savings Time Total
State 10,828,333 21,232,940 293,675 32,354,948
Corporate and commercial 13,053,098 3,263,375 274,355 16,590,828
Personal 6,156,546 75,235,351 4,987,084 86,378,981
Other financial institutions 1,085,383 2,295,737 415,812 3,796,932
Other 4,791,619 498,155 243,450 5,533,224
35,914,979 102,525,558 6,214,376 144,654,913
2017 Demand Savings Time Total
State 11,725,210 6,096,142 291,878 18,113,230
Corporate and commercial 11,769,160 3,187,710 273,552 15,230,422
Personal 7,018,646 71,766,427 5,031,644 83,816,717
Other financial institutions 1,381,640 1,793,007 244,698 3,419,345
Other 3,846,631 194,927 258,106 4,299,664
35,741,287 83,038,213 6,099,878 124,879,378
b Time deposits by remaining term to maturity
2018 2017
Within three months 2,278,936 2,326,234
Between three and six months 1,186,364 1,132,418
Between six months and one year 2,749,076 2,641,226
6,214,376 6,099,878
For the year ended September 30, 2018. Expressed in thousands of Guyana dollars ($’000) except where otherwise stated
Notes to the Financial Statements

103
Financial Statements
13 OTHER LIABILITIES
2018 2017
Drafts and settlements 1,470,792 1,163,237
Accrued expenses 116,259 163,132
Statutory liabilities 212,554 193,432
Deferred income 12,370 11,566
Dividends payable 107,422 111,819
Other 278,285 456,059
2,197,682 2,099,245
14 STATED CAPITAL
2018 2017
Authorised
300 million ordinary stock units of no par value
Issued and fully paid
300 million ordinary stock units of no par value 300,000 300,000
15 OTHER RESERVES
a Statutory reserves
In accordance with the Financial Institutions Act Cap. 85:03, a minimum of 15.00% of the current year’s net profit must be transferred to the
Reserve Fund until the amount in the Fund is equal to the paid up Capital of the Bank. This reserve is non-distributable.
b Net unrealised gains/(losses)
This represents the losses arising from remeasurement of available-for-sale investment securities to fair value as discussed in note 2 (e). This
reserve is non-distributable.
c General banking risk reserve/ Other reserves
Prior to the adoption of IFRS 9, a General Contingency Reserve was created as a voluntary appropriation of retained earnings, for the
difference between the specific provision and non-performing advances. With the adoption of IFRS 9 and the enhanced provisioning levels,
the Bank has opted to reduce the level of General Contingency Reserves held, and has included the transfer of a portion of these reserves
to retained earnings in the Statement of Change of Equity under “Net Impact of Adopting IFRS 9”. The remaining balance represents the
difference between IFRS 9 provision and regulatory reserve requirement.
For the year ended September 30, 2018. Expressed in thousands of Guyana dollars ($’000) except where otherwise stated
Notes to the Financial Statements

104
Financial Statements
For the year ended September 30, 2018. Expressed in thousands of Guyana dollars ($’000) except where otherwise stated
Notes to the Financial Statements
16 OPERATING PROFIT
a Interest income
2018 2017
Advances 6,931,329 6,404,803
Investment securities 545,563 443,020
Liquid assets 497,616 857,232
7,974,508 7,705,055
b Interest expense
Customers’ chequing, savings and deposit accounts 570,015 574,961
c Other income
Credit and related fees 112,813 114,079
Net exchange trading income 1,399,435 1,194,586
Loan recoveries 206,882 231,799
Dividends 9,704 9,424
Deposit and related fees 974,673 723,388
Payments and transfers 252,995 246,352
Gains from sale of premises and equipment 194,013 –
Other operating income 2,783 2,957
3,153,298 2,522,585
d Operating expenses
2018 2017
Staff costs 2,113,314 2,057,745
Staff profit share 301,881 258,442
General administrative expenses 845,417 791,090
Lease rental expenses 17,910 17,910
Property related expenses 658,755 653,180
Property tax 176,393 159,706
Loss on sale of premises and equipment – 10,661
Depreciation expense 511,487 449,772
Communication 119,538 102,429
Advertising and public relations expenses 228,046 212,954
Directors’ fees 15,210 14,970
Auditors’ fees 19,845 19,267
5,007,796 4,748,126

105
Financial Statements
17 CREDIT LOSS EXPENSE
2018 2017
Advances 765,150 743,457
Debt instruments measured at amortised cost 120,248 222,776
885,398 966,233
18 TAXATION EXPENSE
Reconciliation
Income taxes in the Statement of Income vary from amounts that would be computed by applying the statutory tax rate for the following reasons:
2018 2017
Accounting profit 4,664,597 4,228,804
Tax at applicable statutory tax rates (40%) 1,865,839 1,691,522
Tax effect of items that are adjustable in determining taxable profit:
Tax exempt income (365,754) (299,037)
Depreciation 204,595 179,907
Donations 1,300 1,531
Property tax 70,557 63,882
Wear and tear allowance (198,836) (172,003)
Inherent risk (general) provisions 64,847 9,199
(Gain)/Loss on sale of premises and equipment (77,055) 4,448
Defined benefit obligation (11,000) (14,880)
Deferred fee income 30,821 15,730
Current tax 1,585,314 1,480,299
Deferred tax (54,721) 9,566
Total taxation 1,530,593 1,489,865
For the year ended September 30, 2018. Expressed in thousands of Guyana dollars ($’000) except where otherwise stated
Notes to the Financial Statements

106
Financial Statements
For the year ended September 30, 2018. Expressed in thousands of Guyana dollars ($’000) except where otherwise stated
Notes to the Financial Statements
19 RELATED PARTIES
Parties are considered to be related if one party has the ability to control the other party or exercise significant influence over the other party in
making financial or operating decisions. A number of banking transactions are entered into with related parties in the normal course of business.
These transactions are both secured and unsecured and were carried out on commercial terms and conditions, at market rates.
2018 2017
Loans, investments and other assets
Fellow subsidiaries 132,410 20,801
Directors and key management personnel 76,552 63,993
Other related parties 289,828 419,786
498,790 504,580
No provisions have been made against amounts due from related parties.
Amounts due from the five parties with the highest exposures totalled $465.0 million (2017: $461.8 million) and represents 2.33% (2017: 2.52%)
of the Bank’s capital base.
2018 2017
Deposits and other liabilities
Fellow subsidiaries 217,485 256,692
Directors and key management personnel 163,715 143,076
Other related parties 2,979,660 2,833,114
3,360,860 3,232,882
Interest and other income
Directors and key management personnel 2,870 2,099
Other related parties 3,286 37,054
6,156 39,153
Interest and other expense (excluding key management compensation)
Fellow subsidiaries 106,510 96,937
Directors and key management personnel 7,818 7,418
Other related parties 7,770 7,585
122,098 111,940
Proportion of related parties exposure to total customer exposure 0.75% 0.86%
Key management personnel are those persons having authority and responsibility for planning, directing and controlling the activities of the
Bank.
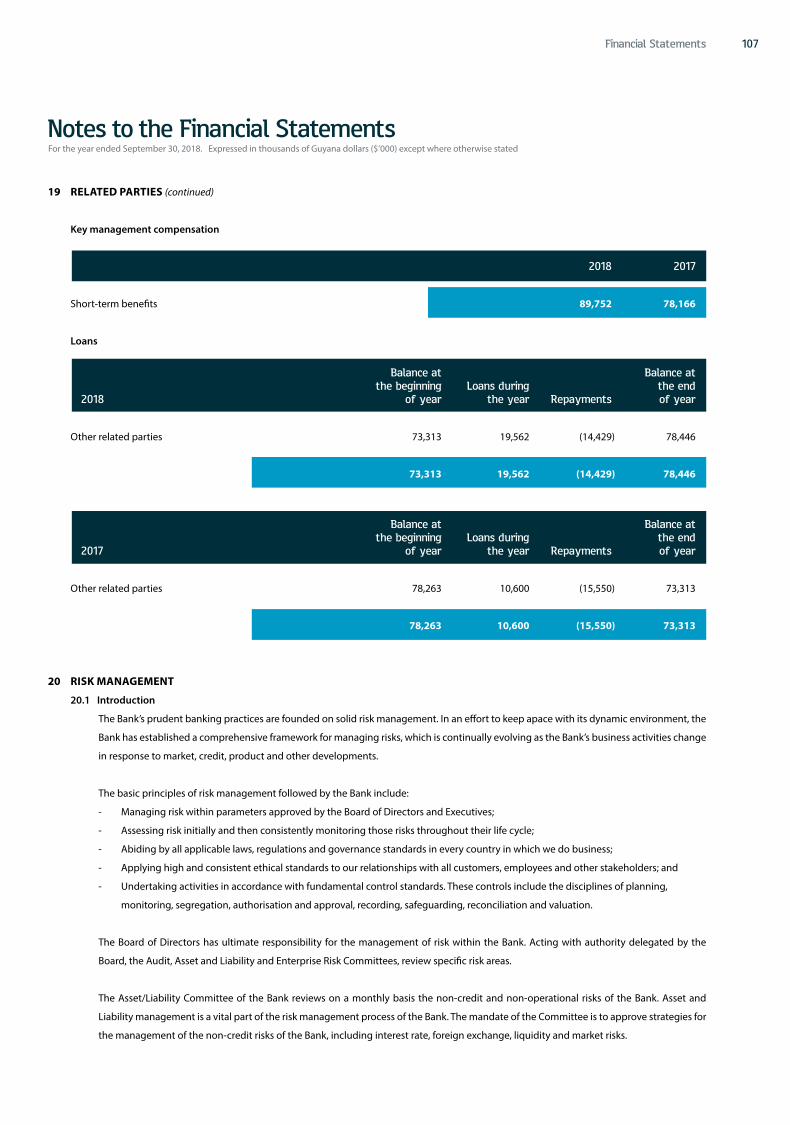
107
Financial Statements
19 RELATED PARTIES (continued)
Key management compensation
2018 2017
Short-term benefits 89,752 78,166
Loans
Balance at Balance at the beginning Loans during the end 2018 of year the year Repayments of year Other related parties 73,313 19,562 (14,429) 78,446
73,313 19,562 (14,429) 78,446
Balance at Balance at the beginning Loans during the end 2017 of year the year Repayments of year
Other related parties 78,263 10,600 (15,550) 73,313
78,263 10,600 (15,550) 73,313
20 RISK MANAGEMENT
20.1 Introduction
The Bank’s prudent banking practices are founded on solid risk management. In an effort to keep apace with its dynamic environment, the
Bank has established a comprehensive framework for managing risks, which is continually evolving as the Bank’s business activities change
in response to market, credit, product and other developments.
The basic principles of risk management followed by the Bank include:
- Managing risk within parameters approved by the Board of Directors and Executives;
- Assessing risk initially and then consistently monitoring those risks throughout their life cycle;
- Abiding by all applicable laws, regulations and governance standards in every country in which we do business;
- Applying high and consistent ethical standards to our relationships with all customers, employees and other stakeholders; and
- Undertaking activities in accordance with fundamental control standards. These controls include the disciplines of planning,
monitoring, segregation, authorisation and approval, recording, safeguarding, reconciliation and valuation.
The Board of Directors has ultimate responsibility for the management of risk within the Bank. Acting with authority delegated by the
Board, the Audit, Asset and Liability and Enterprise Risk Committees, review specific risk areas.
The Asset/Liability Committee of the Bank reviews on a monthly basis the non-credit and non-operational risks of the Bank. Asset and
Liability management is a vital part of the risk management process of the Bank. The mandate of the Committee is to approve strategies for
the management of the non-credit risks of the Bank, including interest rate, foreign exchange, liquidity and market risks.
For the year ended September 30, 2018. Expressed in thousands of Guyana dollars ($’000) except where otherwise stated
Notes to the Financial Statements

108 Financial Statements
For the year ended September 30, 2018. Expressed in thousands of Guyana dollars ($’000) except where otherwise stated
Notes to the Financial Statements
20 RISK MANAGEMENT (continued)
20.1 Introduction (continued)
The Internal Audit function audits Risk Management processes throughout the Bank by examining both the adequacy of the procedures
and the Bank’s compliance with these procedures. Internal Audit discusses the results of all assessments with Management and reports its
findings and recommendations to the Audit Committee.
The Bank’s activities are primarily related to the use of financial instruments. The Bank accepts funds from customers and seeks to earn above
average interest margins by investing in high quality assets such as government and corporate securities as well as equity investments and
seeks to increase these margins by lending for longer periods at higher rates, while maintaining sufficient liquidity to meet all claims that
might fall due.
The main risks arising from the Bank’s financial instruments are credit risk, interest rate and market risk, liquidity risk, foreign currency risk,
operational risk and country risk. The Bank reviews and agrees policies for managing each of these risks as follows:
20.2 Credit risk
Credit risk is the potential that a borrower or counterparty will fail to meet its stated obligations in accordance with agreed terms. The
objective of the Bank’s credit risk management function is to maximise the Bank’s risk-adjusted rate of return by maintaining credit risk
exposure within acceptable parameters. The effective management of credit risk is a key element of a comprehensive approach to risk
management and is considered essential to the long-term success of the Bank.
The Bank’s credit risk management process operates on the basis of a hierarchy of discretionary authorities. The Board has the final authority
on all risk management decisions.
The Risk Management Unit is accountable for the general management and administration of the Bank’s credit portfolio, ensuring that
lendings are made in accordance with current legislation, sound banking practice and in accordance with the applicable general policy of
the Board of Directors. The Risk Management function is kept separate from and independent of the business development aspect of the
operations.
The Bank uses a risk rating system which groups commercial/corporate accounts and overdrafts into various risk categories to facilitate the
management of risk on both an individual account and portfolio basis. Retail lending, mortgages and retail overdrafts are managed by
product type. Pre-set risk management criteria is in place at all branches to facilitate decision-making for all categories of loans including
credit cards. Trend indicators are also used to evaluate risk as improving, static or deteriorating. The evaluation of the risk and trend inform
the credit decision and determines the intensity of the monitoring process.
The debt securities within the Bank’s investment security portfolio are exposed to credit risk and are managed by investment grading or
country exposure with pre-set exposure limits as approved by the Board of Directors. The credit quality of each individual security is assessed
based on the financial strength, reputation and market position of the issuing entity and the ability of that entity to service the debt.
The Bank avoids exposure to undue concentrations of risk by placing limits on the amount of risk accepted from a number of borrowers
engaged in similar business activities, or activities in the same geographic region or with similar economic features that would cause
their ability to meet contractual obligations to be similarly affected by changes in economic, political or other conditions. Such risks are
controlled and monitored on a revolving basis and subject to an annual or more frequent review. Limits on the level of credit risk by
product, industry sector, client and geography are approved by the Board of Directors.
The Bank’s credit control processes emphasise early detection of deterioration and prompt implementation of remedial action and where it
is considered that recovery of the outstanding balance may be doubtful or unduly delayed, such accounts are transferred from performing
to non-performing status.

109
Financial Statements
20 RISK MANAGEMENT (continued)
20.2 Credit risk (continued)
20.2.1 Maximum exposure to credit risk without taking account of any collateral and other credit enhancements
The table below shows the Bank’s maximum exposure to credit risk:
2018 2017
Gross maximum exposure
Statutory deposit with Bank of Guyana 16,178,382 13,967,485
Due from banks 21,238,204 11,452,834
Treasury Bills 33,096,297 40,039,152
Investment interest receivable 225,236 67,034
Investment securities 15,674,193 7,420,987
Loans and advances to customers 69,747,950 60,791,257
Total 156,160,262 133,738,749
Undrawn commitments 10,540,301 7,546,009
Guarantees and indemnities 1,908,611 1,933,788
Letters of credit 195,625 181,175
Total 12,644,537 9,660,972
Total credit risk exposure 168,804,799 143,399,721
Where financial instruments are recorded at fair value, the amounts shown above represent the current credit risk exposure but
not the maximum risk exposure that could arise in the future as a result of changes in values.
Collateral and other credit enhancements
The Bank maintains credit risk exposure within acceptable parameters through the use of collateral as a risk-mitigation tool. The
amount and type of collateral required depends on an assessment of the credit risk of the counterparty. Guidelines are implemented
regarding the acceptability of types of collateral and valuation parameters.
The main types of collateral obtained are cash or securities, charges over real estate properties, inventories and trade receivables and
mortgages over residential properties and chattels. The Bank also obtains appropriate guarantees for loans from parent companies,
owners/stockholders, directors or other parties.
Management monitors the market value of collateral, requests additional collateral in accordance with the underlying agreement,
and monitors the market value of collateral obtained during its review of the adequacy of the allowance for impairment losses.
It is the Bank’s policy to dispose of repossessed properties in an orderly fashion. The proceeds are used to repay the outstanding
claim. In general, the Bank does not occupy repossessed properties for business use. As at September 30, 2018, $39.5 million (2017:
$29.3 million) in repossessed properties are still in the process of being disposed.
For the year ended September 30, 2018. Expressed in thousands of Guyana dollars ($’000) except where otherwise stated
Notes to the Financial Statements

110 Financial Statements
For the year ended September 30, 2018. Expressed in thousands of Guyana dollars ($’000) except where otherwise stated
Notes to the Financial Statements
20 RISK MANAGEMENT (continued)
20.2 Credit risk (continued)
20.2.2 Risk concentrations of the maximum exposure to credit risk
Concentration of risk is managed by client/counterparty, by geographical region and by industry sector as detailed in the following
tables:
a Geographical sectors
The Bank’s maximum credit exposure, after taking account of credit loss provisions established but before taking into account
any collateral held or other credit enhancements, can be analysed by the following geographical regions based on the country
of domicile of our counterparties:
2018 2017
Guyana 163,657,824 138,674,996
Trinidad and Tobago 2,718,539 2,409,050
Barbados 109,503 102,732
Eastern Caribbean 2,952 28,980
Suriname 1,334 1,080
United States 635,764 940,041
Other countries 1,678,883 1,242,842
168,804,799 143,399,721
b Industry sectors
The following table breaks down the Bank’s maximum credit exposure as categorised by the industry sectors of our
counterparties:
2018 2017
Government and government bodies 66,136,583 55,669,080
Financial sector 21,329,308 12,700,740
Energy and mining 349,130 221,099
Agriculture 3,600,246 2,855,070
Electricity and water 565 104,912
Transport, storage and communication 1,773,294 1,895,260
Distribution 12,408,877 11,978,504
Real estate mortgages 25,734,599 23,528,195
Other real estate – 276,816
Manufacturing 6,528,347 2,771,160
Construction 1,301,942 1,527,027
Hotel and restaurant 14,500 3,208,183
Personal 18,297,779 15,766,841
Non-residents 173,493 109,358
Other services 11,156,136 10,787,476
168,804,799 143,399,721
Included above is $4.9 million (2017: $2.9 million) representing Public Non-Financial Institutions.

111Financial Statements
20 RISK MANAGEMENT (continued)
20.2 Credit risk (continued)
20.2.2 Risk concentrations of the maximum exposure to credit risk (continued)
c Top five concentration (as a % of capital base)
2018 2017
Government 164.13% 282.56%
Central Bank 176.89% 169.11%
Counterparty 3 62.58% 18.11%
Counterparty 4 13.31% 16.40%
Counterparty 5 12.70% 13.89%
20.2.3 Impairment Assessment (Policy applicable from October 1, 2017)
Financial asset provisions are reviewed quarterly in accordance with established guidelines and recommended provisions arising
out of this review are submitted to the Board for approval. Non-performing debts recommended for write-off are also reviewed
annually and action taken in accordance with prescribed guidelines. The Bank’s impairment assessment and measurement
approach is set out below.
20.2.4 Default and cure
The Bank considers a financial instrument defaulted and therefore Stage 3 (credit-impaired) for ECL calculations in cases where the
borrower becomes 90 days past due on its contractual payments.
As a part of a qualitative assessment of whether a borrower is in default, the Bank also considers a variety of instances that may
indicate unlikeliness to pay. When such events occur, the Bank carefully considers whether the event should result in treating the
borrower as defaulted and therefore assessed as Stage 3 for ECL calculations or whether Stage 2 is appropriate.
It is the Bank’s policy to consider a financial instrument as ‘cured’ and therefore re-classified out of Stage 3 when none of the default
criteria have been present for at least six consecutive months. The decision whether to classify an asset as Stage 2 or Stage 1 once
cured depends on the updated credit grade, at the time of the cure, and whether this indicates there has been a significant increase
in credit risk compared to initial recognition.
20.2.5 The Bank’s internal rating and PD estimation process
Commercial and corporate lending
The Bank has an independent internal credit risk department. Risk ratings were selected as cohort for PD analyses. A retrospective
approach was applied looking at the movements of ratings over a period of time. Historical PDs were developed and there being
no correlation between macroeconomic trends and historical default rates, management applied judgmental overlays based
on expectations. As previously mentioned, LGD percentage estimates were developed based on historical loss trends for non-
performing loans which are assessed on an individual level including estimating the present value of future cash flows. EAD equals
the loan balance outstanding plus accrued interest.
Retail lending and mortgages
Product types were selected as cohort for PD analyses for retail lending and retail mortgages. A vintage approach was applied
looking at the number of defaults by segment over a period of time. Historical PDs were developed and there being no correlation
between macroeconomic trends, management applied judgmental overlays based on expectations. LGD percentage estimates
were developed based on historical loss trends for non-performing loans which are assessed on both an individual and collective
level. EAD equals the loan balance outstanding plus accrued interest.
For the year ended September 30, 2018. Expressed in thousands of Guyana dollars ($’000) except where otherwise stated
Notes to the Financial Statements

112 Financial Statements
For the year ended September 30, 2018. Expressed in thousands of Guyana dollars ($’000) except where otherwise stated
Notes to the Financial Statements
20 RISK MANAGEMENT (continued)
20.2 Credit risk (continued)
20.2.5 The Bank’s internal rating and PD estimation process (continued)
Overdrafts
PDs were developed for the Corporate portfolio and were applied to corporate customers to whom overdraft facilities were
extended. LGDs for the Corporate portfolio were also utilised for overdrafts. EADs were developed based on historical trends in
utilisation of overdraft limits. ECL percentages for the Retail portfolio were utilised for retail overdrafts.
Management judgmentally applied overlays as required as there was no noted correlation between macroeconomic trends and
historical default rates.
Investment securities
PDs and LGDs for traded instruments were based on the global credit ratings assigned to the instrument. PDs and LGDs for non
traded instruments were based on one notch below the credit rating of the sovereign in which the instrument is issued or on
company ratings where they existed. Management applied judgemental overlays based local debt instruments. EAD equals the
amortised security balance plus accrued interest.
Internal rating
The Bank’s internal credit ratings are correlated to stages as follows:
Rating Stage
Superior/Desirable < 30 days 1
Watch list 31 to 90 days 2
Credit Impaired/Non-performing loans > 90 days 3
A description of the internal credit ratings are noted below:
Superior/Desirable: These counterparties have a good financial position. Facilities are well secured or
reasonably well secured and underlying business is performing well.
Watch list: These counterparties are of average risk with a fair financial position. Business or
industry may be subject to more volatility and facilities typically have lower levels of
security.
Credit Impaired/Non-performing loans: Past due or individually impaired.
20.2.6 Significant increase in credit risk
The Bank continuously monitors all assets subject to ECLs. In order to determine whether an instrument or a portfolio of
instruments is subject to 12mECL or LTECL, the Bank assesses whether there has been a significant increase in credit risk since
initial recognition.
The Bank also applies a secondary qualitative method for triggering a significant increase in credit risk for an asset. Regardless of
the change in credit grades, if contractual payments are more than 30 days past due, the credit risk is deemed to have increased
significantly since initial recognition.
When estimating ECLs on a collective basis for a bank with similar assets (as set out in Note 20.2.7), the Bank applies the same
principles for assessing whether there has been a significant increase in credit risk since initial recognition.

113
Financial Statements
20 RISK MANAGEMENT (continued)
20.2 Credit risk (continued)
20.2.7 Grouping financial assets measured on a collective basis
As explained in Note 2 (i) (i) dependent on the factors below, the Bank calculates ECLs either on a collective or an individual basis.
Asset classes where the Bank calculates ECL on an individual basis include:
• All Stage 3 assets, regardless of the class of financial assets
• The Commercial and Corporate lending and overdraft portfolios
• The Mortgage portfolio
• The Retail lending portfolio
Asset classes where the Bank calculates ECL on a collective basis include:
• The Retail overdraft portfolio
• Subsidiaries with small, homogeneous retail portfolios
• Past due not yet relegated credit facilities
20.2.8 Analysis of Gross Carrying Amount and corresponding ECLs are as follows:
Advances
2018 2017 % %
Stage 1 5.07 4.67
Stage 2 89.38 88.70
Stage 3 5.55 6.63
Commercial
Retail and Corporate 2018 lending lending Mortgages Overdrafts Total
Stage 1
Gross Loans 302,380 1,076,969 1,989,587 228,837 3,597,773
ECL (55,678) (141,951) (59,116) (40,071) (296,816)
246,702 935,018 1,930,471 188,766 3,300,957
Percentage of
ECL/Gross Loans 18.4% 13.2% 3.0% 17.5% 8.2%
For the year ended September 30, 2018. Expressed in thousands of Guyana dollars ($’000) except where otherwise stated
Notes to the Financial Statements

114
Financial Statements
For the year ended September 30, 2018. Expressed in thousands of Guyana dollars ($’000) except where otherwise stated
Notes to the Financial Statements
20 RISK MANAGEMENT (continued)
20.2 Credit risk (continued)
20.2.8 Analysis of Gross Carrying Amount and corresponding ECLs are as follows: (continued)
Advances (continued)
Commercial Retail and Corporate 2017 lending lending Mortgages Overdrafts Total
Stage1
Gross Loans 519,158 630,450 1,470,457 274,025 2,894,090
ECL (42,438) (113,554) (53,725) (36,056) (245,773)
476,720 516,896 1,416,732 237,969 2,648,317
Percentage of
ECL/Gross Loans 8.2% 18.0% 3.7% 13.2% 8.5%
The increase in ECLs of Stage 1 portfolios was driven by a 24.3% increase in the gross size of the portfolio, and movements between
stages as a result of increases in credit risk.
Commercial Retail and Corporate 2018 lending lending Mortgages Overdrafts Total
Stage 2
Gross Loans 6,619,006 26,989,057 22,473,538 7,340,281 63,421,882
ECL (1,869) (9,129) (10,594) (1,109) (22,701)
6,617,137 26,979,928 22,462,944 7,339,172 63,399,181
Percentage of
ECL/Gross Loans 0.03% 0.03% 0.05% 0.02% 0.04%
Commercial Retail and Corporate 2017 lending lending Mortgages Overdrafts Total
Stage 2
Gross Loans 5,967,286 23,285,406 20,796,541 4,876,046 54,925,279
ECL (2,586) (11,277) (16,576) (1,438) (31,877)
5,964,700 23,274,129 20,779,965 4,874,608 54,893,402
Percentage of
ECL/Gross Loans 0.04% 0.05% 0.08% 0.03% 0.06%
The decrease in ECLs of Stage 2 portfolios was driven by movements between stages as a result of increases in credit risk.

115
Financial Statements
20 RISK MANAGEMENT (continued)
20.2 Credit risk (continued)
20.2.8 Analysis of Gross Carrying Amount and corresponding ECLs are as follows: (continued)
Advances (continued)
Commercial Retail and Corporate 2018 lending lending Mortgages Overdrafts Total
Stage 3
Gross Loans 21,156 2,434,573 1,301,723 180,768 3,938,220
ECL (6,246) (268,844) (185,419) (22,143) (482,652)
14,910 2,165,729 1,116,304 158,625 3,455,568
Percentage of
ECL/Gross Loans 29.5% 11.0% 14.2% 12.2% 12.3%
Commercial Retail and Corporate 2017 lending lending Mortgages Overdrafts Total
Stage 3
Gross Loans 10,943 2,615,317 1,261,197 214,479 4,101,936
ECL (11,143) (390,420) (187,166) (672) (589,401)
(200) 2,224,897 1,074,031 213,807 3,512,535
Percentage of
ECL/Gross Loans 101.8% 14.9% 14.8% 0.3% 14.4%
The decrease in ECLs of Stage 3 portfolios was driven by a 4.0% decrease in the gross size of the portfolio and movements between
stages as a result of increases in write-offs.
Investment Securities
2018 2017 % %
Stage 1 0.00 19.00
Stage 2 100.00 81.00
Stage 3 0.00 0.00
For the year ended September 30, 2018. Expressed in thousands of Guyana dollars ($’000) except where otherwise stated
Notes to the Financial Statements

116
Financial Statements
For the year ended September 30, 2018. Expressed in thousands of Guyana dollars ($’000) except where otherwise stated
Notes to the Financial Statements
20 RISK MANAGEMENT (continued)
20.2 Credit risk (continued)
20.2.8 Analysis of Gross Carrying Amount and corresponding ECLs are as follows: (continued)
Investment Securities (continued)
2018 2018 Stage 1 Stage 2 Stage 3 Total
Gross Balance – 16,017,218 – 16,017,218
ECL – (343,025) – (343,025)
– 15,674,193 – 15,674,193
Percentage of
ECL/Gross Balance – 2.14% – 2.14%
2017 Stage 1 Stage 2 Stage 3 Total
Gross Balance 1,390,000 6,001,146 – 7,391,146
ECL (2,033) (220,743) – (222,776)
1,387,967 5,780,403 – 7,168,370
Percentage of
ECL/Gross Balance 0.15% 3.68% – 3.01%
The increase in ECLs was driven by a 116.1% increase in the gross size of the portfolio - new investments.
20.3 Liquidity risk
Liquidity risk is defined as the risk that the Bank either does not have sufficient financial resources available to meet all its obligations and
commitments as they fall due, or can access these only at excessive cost.
The Bank’s liquidity management policy is formulated by the Board and Management to ensure that funding requirements can be
met, including the replacement of existing funds as they mature or are withdrawn, to satisfy the demands of customers for additional
borrowings or to meet undrawn commitments. Undrawn commitments are reviewed by the Asset/Liability Committee and are subject to
review by Management prior to disbursement. Liquidity management focuses on ensuring that the Bank has sufficient funds to meet all of
its obligations.
Periodic stress testing is conducted by the regulator and corrective action taken by the Bank, if deemed necessary.
Two primary sources of funds are used to provide liquidity – retail deposits and excess at central bank. A substantial portion of the Bank
is funded with “core deposits”. The Bank maintains a core base of retail funds, which can be drawn on to meet ongoing liquidity needs.
Facilities are also established with correspondent banks, which can provide additional liquidity as conditions demand.
The Asset/Liability Committee of the Bank (ALCO) sets targets for daily float, allowable liquid assets and funding diversification in line with
system liquidity trends. While the primary asset used for short-term liquidity management is the Treasury Bill, the Bank also holds significant
investments in other Government securities, which can be used for liquidity support. The Bank continually balances the need for short-term
assets, which have lower yields, with the need for higher asset returns.
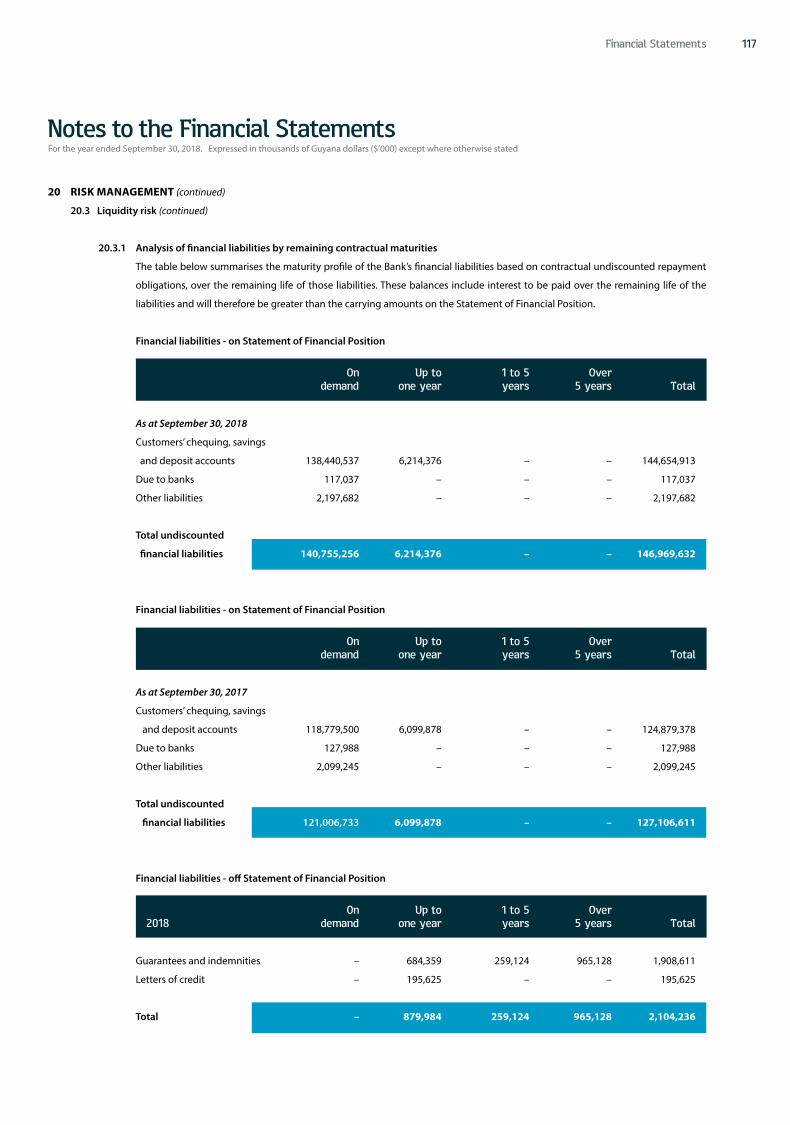
117
Financial Statements
20 RISK MANAGEMENT (continued)
20.3 Liquidity risk (continued)
20.3.1 Analysis of financial liabilities by remaining contractual maturities
The table below summarises the maturity profile of the Bank’s financial liabilities based on contractual undiscounted repayment
obligations, over the remaining life of those liabilities. These balances include interest to be paid over the remaining life of the
liabilities and will therefore be greater than the carrying amounts on the Statement of Financial Position.
Financial liabilities - on Statement of Financial Position
On Up to 1 to 5 Over demand one year years 5 years Total
As at September 30, 2018
Customers’ chequing, savings
and deposit accounts 138,440,537 6,214,376 – – 144,654,913
Due to banks 117,037 – – – 117,037
Other liabilities 2,197,682 – – – 2,197,682
Total undiscounted
financial liabilities 140,755,256 6,214,376 – – 146,969,632
Financial liabilities - on Statement of Financial Position
On Up to 1 to 5 Over demand one year years 5 years Total
As at September 30, 2017
Customers’ chequing, savings
and deposit accounts 118,779,500 6,099,878 – – 124,879,378
Due to banks 127,988 – – – 127,988
Other liabilities 2,099,245 – – – 2,099,245
Total undiscounted
financial liabilities 121,006,733 6,099,878 – – 127,106,611
Financial liabilities - off Statement of Financial Position
On Up to 1 to 5 Over 2018 demand one year years 5 years Total
Guarantees and indemnities – 684,359 259,124 965,128 1,908,611
Letters of credit – 195,625 – – 195,625
Total – 879,984 259,124 965,128 2,104,236
For the year ended September 30, 2018. Expressed in thousands of Guyana dollars ($’000) except where otherwise stated
Notes to the Financial Statements

118 Financial Statements
For the year ended September 30, 2018. Expressed in thousands of Guyana dollars ($’000) except where otherwise stated
Notes to the Financial Statements
20 RISK MANAGEMENT (continued)
20.3 Liquidity risk (continued)
20.3.1 Analysis of financial liabilities by remaining contractual maturities (continued)
Financial liabilities - off Statement of Financial Position (continued)
On Up to 1 to 5 Over 2017 demand one year years 5 years Total
Guarantees and indemnities – 758,224 269,641 905,923 1,933,788
Letters of credit – 181,175 – – 181,175
Total – 939,399 269,641 905,923 2,114,963
The Bank expects that not all of the contingent liabilities or commitments will be drawn before expiry of the commitments.
20.4 Market risk
Market risk is the risk that the fair value or future cash flows of financial instruments will fluctuate due to changes in market variables such
as interest rates, foreign exchange rates, and equity prices.
20.4.1 Interest rate risk
Interest rate risk arises from the possibility that changes in interest rates will affect future cash flows or the fair values of financial
instruments. Interest rate risk management is primarily designed by the Board and Management to ensure competitiveness and
maximise returns.
The primary tools currently in use by the Bank are gap analysis, interest rate sensitivity analysis and exposure limits for financial
instruments. The limits are defined in terms of amount, term, issuer, depositor and country. The Bank is committed to refining and
defining these tools to be in line with international best practice.
The following table summarises the interest-rate exposure of the Bank’s Statement of Financial Position. Interest on financial
instruments classified as floating is repriced at intervals of less than one year while interest on financial instruments classified as
“fixed” is fixed until the maturity of the instrument.
An interest rate sensitivity analysis was performed to determine the impact on net profit and equity of a reasonable possible
change in the interest rates prevailing as at September 30, 2018, with all other variables held constant. The impact on net profit is
the effect of changes in interest rates on the floating interest rates of financial assets and liabilities. The impact on net unrealised
gains is the effect of changes in interest rates on the fair value of available-for-sale financial assets. This impact is illustrated in the
table.

119
Financial Statements
20 RISK MANAGEMENT (continued)
20.4 Market risk (continued)
20.4.1 Interest rate risk (continued)
Impact on net profit Increase/ 2018 2017
decrease in Increase in Decrease in Increase in Decrease in in basis points basis points basis points basis points basis points
G$ Instruments +/- 50 -/+ 512,628 -/+ 415,191
US$ Instruments +/- 50 -/+ 36,347 -/+ 30,378
Other currency Instruments +/- 50 -/+ 4,332 -/+ 2,480
20.4.2 Currency risk
Currency risk is the risk that the value of a financial instrument will fluctuate due to changes in foreign exchange rates. The Bank’s
exposure to the effects of fluctuations in foreign currency exchange rates arises mainly from its investments. The Bank’s policy is
to match the initial net foreign currency investment with funding in the same currency. The Asset/Liability Committee and Foreign
Services Unit also monitor the Bank’s foreign currency position for both overnight and intra-day transactions based on limits set by
the Board.
Changes in foreign exchange rates affect the Bank’s earnings and equity through differences on the re-translation of monetary
assets and liabilities to Guyana dollars. Such gains or losses are recognised in the Statement of Income.
The principal currencies of the Bank’s investments are United States and Guyana dollars.
The following tables indicate the currencies to which the Bank had significant exposure at September 30, 2018, on its non-trading
monetary assets and liabilities and forecast cash flows. The analysis also calculates the effect of a reasonably possible movement of
each currency rate against the Guyana dollar, with all other variables held constant.
For the year ended September 30, 2018. Expressed in thousands of Guyana dollars ($’000) except where otherwise stated
Notes to the Financial Statements

120 Financial Statements
For the year ended September 30, 2018. Expressed in thousands of Guyana dollars ($’000) except where otherwise stated
Notes to the Financial Statements
20 RISK MANAGEMENT (continued)
20.4 Market risk (continued)
20.4.2 Currency risk (continued)
2018 GYD TTD USD STG OTHER Total
FINANCIAL ASSETS
Cash 2,563,858 331 88,451 3,631 5,327 2,661,598
Statutory deposit
with Bank of Guyana 16,178,382 – – – – 16,178,382
Due from banks 19,928,783 1,436 424,032 59,443 824,510 21,238,204
Treasury Bills 33,096,297 – – – – 33,096,297
Advances 68,656,549 – 1,091,401 – – 69,747,950
Investment securities 10,187,179 – 5,507,014 – – 15,694,193
Interest receivable 168,309 – 56,927 – – 225,236
TOTAL FINANCIAL
ASSETS 150,779,357 1,767 7,167,825 63,074 829,837 158,841,860
FINANCIAL LIABILITIES
Due to banks 31,963 149 74,422 2,302 8,201 117,037
Customers’ chequing, savings
and deposit accounts 137,328,678 – 7,269,334 56,901 – 144,654,913
Interest payable 18,850 – – – – 18,850
TOTAL FINANCIAL
LIABILITIES 137,379,491 149 7,343,756 59,203 8,201 144,790,800
NET CURRENCY
RISK EXPOSURE 13,399,866 1,618 (175,931) 3,871 821,636 14,051,060
Reasonably possible change
in currency rate (%) – 1% 1% 1% 1% –
Effect on profit before tax – 16 (1,759) 39 8,216 6,512

121Financial Statements
20 RISK MANAGEMENT (continued)
20.4 Market risk (continued)
20.4.2 Currency risk (continued)
2017 GYD TTD USD STG OTHER Total
FINANCIAL ASSETS
Cash 2,239,050 138 165,200 942 3,572 2,408,902
Statutory deposit
with Bank of Guyana 13,967,485 – – – – 13,967,485
Due from banks 10,108,144 3,386 825,043 28,434 487,827 11,452,834
Treasury Bills 40,039,152 – – – – 40,039,152
Advances 60,401,560 – 389,697 – – 60,791,257
Investment securities 1,756,294 – 5,684,693 – – 7,440,987
Interest receivable 22,565 – 44,469 – – 67,034
TOTAL FINANCIAL
ASSETS 128,534,250 3,524 7,109,102 29,376 491,399 136,167,651
FINANCIAL LIABILITIES
Due to banks – 163 69,317 2,279 56,229 127,988
Customers’ chequing, savings
and deposit accounts 117,384,766 – 7,475,568 19,044 – 124,879,378
Interest payable 17,772 – – – – 17,772
TOTAL FINANCIAL
LIABILITIES 117,402,538 163 7,544,885 21,323 56,229 125,025,138
NET CURRENCY
RISK EXPOSURE 11,131,712 3,361 (435,783) 8,053 435,170 11,142,513
Reasonably possible change
in currency rate (%) – 1% 1% 1% 1% –
Effect on profit before tax – 34 (4,358) 81 4,352 109
20.5 Operational Risk
The growing sophistication of the banking industry has made the Bank’s operational risk profile more complex. Operational risk is inherent
to all business activities and is the potential for financial or reputational loss arising from inadequate or failed internal controls, operational
processes or the systems that support them. It includes errors, omissions, disasters and deliberate acts such as fraud.
The Bank recognises that such risk can never be entirely eliminated and manages the risk through a combination of systems and procedures
to monitor and document transactions. The Bank’s Enterprise Risk Department oversees the operation of, conducts training on and makes
recommendations for the enhancement of internal controls. Where appropriate, risk is transferred by the placement of adequate insurance
coverage.
The Bank has developed contingency arrangements and established facilities to support operations in the event of disasters. Independent
checks on operational risk issues are also undertaken by the internal audit function.
For the year ended September 30, 2018. Expressed in thousands of Guyana dollars ($’000) except where otherwise stated
Notes to the Financial Statements

122 Financial Statements
For the year ended September 30, 2018. Expressed in thousands of Guyana dollars ($’000) except where otherwise stated
Notes to the Financial Statements
20 RISK MANAGEMENT (continued)
20.6 Country Risk
Country risk is the risk that an occurrence within a country could have an adverse effect on the Bank directly by impairing the value through
an obligor’s ability to meet its obligation to the Bank. The parent’s risk management unit monitors this risk by using the measures of risk
rating and the Board sets limits by country for investments.
21 CAPITAL MANAGEMENT
The Bank’s policy is to diversify its sources of capital, allocate capital within the Bank efficiently and maintain a prudent relationship between
capital resources and the risk of its underlying business. Equity increased by $1,863.8 million to $20,164.3 million during the year under review.
The Bank’s dividend policy is to distribute 40% to 50% of net earnings to stockholders. Similar to the criteria applied in previous years, the
distribution was based on core operating performance. Total proposed distribution based on the results for the financial year 2018 of $1,285.0
million represents 42.92% of core operating profit.
Capital adequacy is monitored by the Bank, employing techniques based on the guidelines developed by the Basel Committee on Banking
Regulations and Supervisory Practice (the Basel Committee), as implemented by the Bank of Guyana for supervisory purposes. The Basel risk-
based capital guidelines require a minimum ratio of core capital (Tier 1) to risk-weighted assets of 4%, with a minimum total qualifying capital
(Tier 2) ratio of 8%. Core capital (Tier 1) comprises mainly stockholders’ equity.
The Bank’s Tier 1 capital at September 30, 2018 is 25.17% (2017 - 24.53%) and its capital adequacy ratio (Tier 1 and Tier 2) is 26.10% (2017 - 25.53%).
At September 30, 2018 the Bank exceeded the minimum levels required.
The Bank’s Regulatory Capital is as follows:
2018 2017
Tier 1
Stated capital 300,000 300,000
Reserve fund 300,000 300,000
General banking risk reserves in excess of statutory requirement 157,527 2,883,245
Retained earnings 17,868,892 13,310,352
Goodwill (1,228,222) (1,228,222)
Total 17,398,197 15,565,375
Tier 2
Securities revaluation reserves – 17,730
General banking risk reserves - statutory requirement 637,862 629,289
Total 637,862 647,019
123Financial Statements
22 FAIR VALUE
In accordance with International Financial Reporting Standard No. 7 “Financial Instruments: Disclosures”, the Bank calculates the estimated fair
value of all financial instruments at the reporting date and separately discloses this information where these fair values are different from net book
values.
The Bank’s available-for-sale investments are not actively traded in organised financial markets, and fair value is determined using discounted
cash flow analysis, which requires considerable judgement in interpreting market data and developing estimates. Accordingly estimates
contained herein are not necessarily indicative of the amounts that the Bank could realise in a current market exchange. The use of different
assumptions and/or estimation methodologies may have a material effect on the estimated fair values. The fair value information for available-
for-sale investments is based on information available to management as at the dates presented. Management is not aware of any factors that
would significantly affect the estimated fair value amounts.
Investments classified as “at fair value through profit or loss” are actively traded in organised markets and fair value is determined by reference to
the market price at year end or on the last trade date prior to year end.
Financial instruments where carrying value is equal to fair value: owing to their short-term maturity, the carrying value of certain financial
instruments is assumed to approximate their fair values. These include cash and cash equivalents, investment interest receivable, customers’
deposit accounts, other fund raising instruments, other assets and other liabilities. The Bank is required to maintain with the Bank of Guyana,
statutory reserve balances in relation to deposit liabilities and the carrying value of these reserves is assumed to equal fair value.
Advances are net of specific and other provisions for impairment. The fair values of advances are based on a current yield curve appropriate for
the remaining term to maturity.
The fair values of the floating rate debt securities in issue are based on quoted market prices where available and where not available are based on
a current yield curve appropriate for the remaining term to maturity. For balances due to banks, where the maturity period is less than one year,
the fair value is assumed to equal carrying value. Where the maturity period is in excess of one year, these are primarily floating rate instruments,
the interest rates of which reset with market rates therefore the carrying values are assumed to equal fair values.
The fair value of fixed rate debt securities carried at amortised cost is estimated by comparing market interest rates when they were first
recognised with current market rates offered for similar financial instruments. The estimated fair value of fixed interest-bearing deposits is based
on discounted cash flows using prevailing money market interest rates for facilities with similar credit risk and maturity.
For the year ended September 30, 2018. Expressed in thousands of Guyana dollars ($’000) except where otherwise stated
Notes to the Financial Statements

124
Financial Statements
For the year ended September 30, 2018. Expressed in thousands of Guyana dollars ($’000) except where otherwise stated
Notes to the Financial Statements
22 FAIR VALUE (continued)
The following table summarises the carrying amounts and the fair values of the Bank’s financial assets and liabilities:
2018 Carrying Fair Unrecognised value value gain/(loss)
Financial assets
Cash, due from banks and Treasury Bills 56,996,099 56,996,099 –
Statutory deposit with Bank of Guyana 16,178,382 16,178,382 –
Investment securities 15,694,193 15,747,803 53,610
Advances 69,747,950 70,246,400 498,450
Investment interest receivable 225,236 225,236 –
Financial liabilities
Due to Banks 117,037 117,037 –
Customers’ chequing, savings and deposit accounts 144,654,913 144,610,259 (44,654)
Accrued interest payable 18,850 18,850 –
Total unrecognised change in unrealised fair value 507,406
2017 Carrying Fair Unrecognised value value gain/(loss)
Financial assets
Cash, due from banks and Treasury Bills 53,900,888 53,900,888 –
Statutory deposit with Bank of Guyana 13,967,485 13,967,485 –
Investment securities 7,440,987 7,440,987 –
Advances 60,791,257 61,255,095 463,838
Investment interest receivable 67,034 67,034 –
Financial liabilities
Due to Banks 127,988 127,988 –
Customers’ chequing, savings and deposit accounts 124,879,378 124,838,140 (41,238)
Accrued interest payable 17,772 17,772 –
Total unrecognised change in unrealised fair value 422,600

125
Financial Statements
22 FAIR VALUE (continued)
22.1 Fair value and fair value hierarchies
22.1.1 Determination of fair value and fair value hierarchies
The Bank uses the following hierarchy for determining and disclosing the fair value of financial instruments by valuation
techniques:
Level 1
Included in the Level 1 category are financial assets and liabilities that are measured in whole or in part by reference to published
quotes in an active market. A financial instrument is regarded as quoted in an active market if quoted prices are readily and regularly
available from an exchange, dealer, broker, industry group, pricing service or regulatory agency and those prices represent actual
and regularly occurring market transactions on an arm’s length basis.
Level 2
Included in the Level 2 category are financial assets and liabilities that are measured using a valuation technique based on
assumptions that are supported by prices from observable current market transactions and for which pricing is obtained via
pricing services, but where prices have not been determined in an active market. This includes financial assets with fair values
based on broker quotes, investments in private equity funds with fair values obtained via fund managers and assets that are valued
using the Bank’s own models whereby the majority of assumptions are market observable.
Level 3
Included in the Level 3 category are financial assets and liabilities that are not quoted as there are no active markets to determine
a price. These financial instruments are held at cost, being the fair value of the consideration paid for the acquisition of the
investment, and are regularly assessed for impairment.
The following table shows the fair value measurement hierarchy of the Bank’s assets and liabilities as at September 30, 2018.
Level 1 Level 2 Level 3 Total
Financial assets measured at fair value
Investment securities
2018 1,721,328 14,026,475 – 15,747,803
2017 1,664,886 5,776,101 – 7,440,987
Financial assets for which fair value is disclosed
Advances
2018 – – 69,747,950 69,747,950
2017 – – 60,791,257 60,791,257
Financial liabilities for which fair value is disclosed
Customers’ current, savings and deposit accounts
2018 – – 144,654,913 144,654,913
2017 – – 124,879,378 124,879,378
For the year ended September 30, 2018. Expressed in thousands of Guyana dollars ($’000) except where otherwise stated
Notes to the Financial Statements

126
Financial Statements
For the year ended September 30, 2018. Expressed in thousands of Guyana dollars ($’000) except where otherwise stated
Notes to the Financial Statements
22 FAIR VALUE (continued)
22.1 Fair value and fair value hierarchies (continued)
22.1.1 Determination of fair value and fair value hierarchies (continued)
The following table shows an analysis of financial instruments recorded at fair value categorised by hierarchy level.
Level 1 Level 2 Level 3 Total
2018
Financial assets designated at
fair value through profit or loss – 20,000 – 20,000
Debt instruments at amortised cost 1,721,328 14,026,475 – 15,747,803
1,721,328 14,046,475 – 15,767,803
2017
Financial investments -available-for-sale 1,664,886 5,776,101 – 7,440,987
Description of significant unobservable inputs to valuation
The significant unobservable inputs used in the fair value measurements categorised within Level 3 of the fair value hierarchy as at
September 30, 2018 are as shown below:
2018 2017
Significant Range Range unobservable (weighted (weighted
Valuation technique inputs average) average)
Advances Discounted Cash Flow Method Growth 10% - 14.5% 10% - 14.5%
rate for cash flows (12.1%) (12.1%)
for subsequent
years
Customers’ current, savings
and deposit accounts Discounted Cash Flow Method Growth 0.6% - 2.36% 0.6% - 2.36%
rate for cash flows (0.86%) (0.86%)
for subsequent
years
22.1.2 Transfers between Level 1 and 2
For the year ended September 30, 2018, no assets valued were transferred between Level 1 and Level 2.
22.1.3 Reconciliation of movements in Level 3 financial instruments measured at fair value.
For the year ended September 30, 2018, there were no Level 3 financial instruments measured at fair value.

127
Financial Statements
23 SEGMENTAL INFORMATION
23.1 Operating Segments
Operating segments are reported in a manner consistent with the internal reporting provided to the chief operating decision-maker. The
chief operating decision-maker is the person or group that allocates resources to and assesses the performance of the operating segments
of the entity. The Bank has determined the Managing Director as its chief operating decision-maker.
Management considers its banking operation to be a single business unit. All business is conducted in Guyana with the exception of
certain investment activities.
23.2 Geographical Information
The Bank operates only in Guyana but conducts investment and other correspondent banking business in other countries. The following
tables show the distribution of the Bank’s revenues, interest expenses, total assets and total liabilities allocated based on the location of
the customers and assets respectively:
Trinidad Other
2018 Guyana and Tobago countries Total
Interest income 7,839,667 111,590 23,251 7,974,508
Interest expense (570,015) – – (570,015)
Net interest income 7,269,652 111,590 23,251 7,404,493
Other income 3,153,298 – – 3,153,298
Net interest and other income 10,422,950 111,590 23,251 10,557,791
Total assets 163,930,466 2,627,177 1,625,647 168,183,290
Total liabilities 147,692,973 209,179 116,857 148,019,009
Cash flow from operating activities 13,665,028 – – 13,665,028
Cash flow from investing activities (2,286,110) (170,620) 75,719 (2,381,011)
Cash flow from financing activities (1,212,392) (25,309) (8,250) (1,245,951)
Trinidad Other 2017 Guyana and Tobago countries Total
Interest income 7,423,462 268,447 13,146 7,705,055
Interest expense (574,961) – – (574,961)
Net interest income 6,848,501 268,447 13,146 7,130,094
Other income 2,522,585 – – 2,522,585
Net interest and other income 9,371,086 268,447 13,146 9,652,679
Total assets 142,036,302 2,347,010 1,846,183 146,229,495
Total liabilities 127,566,687 234,502 127,825 127,929,014
Cash flow from operating activities (5,209,089) – – (5,209,089)
Cash flow from investing activities 946,970 3,133,457 78,890 4,159,317
Cash flow from financing activities (1,432,156) 158,417 23,525 (1,250,214)
For the year ended September 30, 2018. Expressed in thousands of Guyana dollars ($’000) except where otherwise stated
Notes to the Financial Statements

128
Financial Statements
For the year ended September 30, 2018. Expressed in thousands of Guyana dollars ($’000) except where otherwise stated
Notes to the Financial Statements
23 SEGMENTAL INFORMATION (continued)
23.3 Major Customers
There were no revenues derived from transactions with a single external customer or group of customers that amounted to 10% or more
of the Bank’s revenues.
24 MATURITY ANALYSIS OF ASSETS AND LIABILITIES
The table below analyses the assets and liabilities of the Bank based on the remaining period as at September 30 to the contractual maturity date.
See Note 20.3 - “Liquidity risk” - for an analysis of the financial liabilities based on contractual undiscounted repayment obligations.
Within After
2018 12 months 12 months Total
ASSETS
Cash 2,661,598 – 2,661,598
Statutory deposit with Bank of Guyana 16,178,382 – 16,178,382
Due from banks 21,238,204 – 21,238,204
Treasury Bills 33,096,297 – 33,096,297
Investment interest receivable 225,236 – 225,236
Advances 9,469,686 60,278,264 69,747,950
Investment securities 2,448,600 13,245,593 15,694,193
Premises and equipment – 7,070,772 7,070,772
Intangible assets – 94,770 94,770
Net pension asset – 13,700 13,700
Goodwill – 1,228,222 1,228,222
Deferred tax assets – 428,118 428,118
Other assets 505,848 – 505,848
85,823,851 82,359,439 168,183,290
LIABILITIES
Due to banks 117,037 – 117,037
Customers’ chequing, savings and deposit accounts 144,654,913 – 144,654,913
Taxation payable 651,621 – 651,621
Deferred tax liabilities – 378,906 378,906
Accrued interest payable 18,850 – 18,850
Other liabilities 2,197,682 – 2,197,682
147,640,103 378,906 148,019,009

129
Financial Statements
24 MATURITY ANALYSIS OF ASSETS AND LIABILITIES (continued)
Within After 2017 12 months 12 months Total
ASSETS
Cash 2,408,902 – 2,408,902
Statutory deposit with Bank of Guyana 13,967,485 – 13,967,485
Due from banks 11,452,834 – 11,452,834
Treasury Bills 40,039,152 – 40,039,152
Investment interest receivable 67,034 – 67,034
Advances 6,566,120 54,225,137 60,791,257
Investment securities 1,256,639 6,184,348 7,440,987
Premises and equipment – 7,246,831 7,246,831
Intangible assets – 130,207 130,207
Goodwill – 1,228,222 1,228,222
Deferred tax assets – 186,362 186,362
Other assets 1,270,222 – 1,270,222
77,028,388 69,201,107 146,229,495
LIABILITIES
Due to banks 127,988 – 127,988
Customers’ chequing, savings and deposit accounts 124,879,378 – 124,879,378
Net pension liability – 135,200 135,200
Taxation payable 313,841 – 313,841
Deferred tax liabilities – 355,590 355,590
Accrued interest payable 17,772 – 17,772
Other liabilities 2,099,245 – 2,099,245
127,438,224 490,790 127,929,014
25 DIVIDENDS PAID AND PROPOSED
2018 2017
Declared and paid during the year
Equity dividends on ordinary stock units:
Final dividend for 2017: $2.833 (2016: $2.833) 850,000 850,000
First dividend for 2018: $1.283 (2017: $1.283) 385,000 385,000
Total dividends paid 1,235,000 1,235,000
Proposed for approval at Annual General Meeting
(not recognised as a liability as at September 30)
Equity dividends on ordinary stock units:
Final dividend for 2018: $3.00 (2017: $2.833) 900,000 850,000
For the year ended September 30, 2018. Expressed in thousands of Guyana dollars ($’000) except where otherwise stated
Notes to the Financial Statements

130
Financial Statements
For the year ended September 30, 2018. Expressed in thousands of Guyana dollars ($’000) except where otherwise stated
Notes to the Financial Statements
26 CONTINGENT LIABILITIES
a Litigation
As at September 30, 2018, there were certain legal proceedings outstanding against the Bank. No provision has been made as professional
advice indicates that it is unlikely that any significant loss will arise or that it would be premature at this stage of the action to determine
that eventuality.
b Customers’ liability under acceptances, guarantees, indemnities and letters of credit
2018 2017
Guarantees and indemnities 1,908,611 1,933,788
Letters of credit 195,625 181,175
2,104,236 2,114,963
c Sectoral information
State 831,461 820,013
Corporate and commercial 1,272,775 1,294,950
2,104,236 2,114,963
d Pledged assets
Below illustrates the distribution of pledged assets in the Bank’s Statement of Financial Position:
Carrying Amount Related Liability 2018 2017 2018 2017
Statutory deposit 16,178,382 13,967,485 144,654,913 124,879,378
The statutory deposit is provided to the Bank of Guyana as a percentage of deposit liabilities under the Financial Institutions Act, Cap.
85:03.
e Non-cancellable operating lease commitments
2018 2017
Less than one year 7,603 17,910
Between one to five years 640 8,163
More than five years 2,867 2,947
11,110 29,020

131
Financial Statements
27 EXTERNAL PAYMENT DEPOSIT SCHEME
2018 2017
47,400 47,400
This represents monies received on behalf of customers and deposited in the External Payment Deposit Scheme with the Bank of Guyana, in
accordance with the terms of agreements signed with each customer which specifically exclude the Bank from any liability.
For the year ended September 30, 2018. Expressed in thousands of Guyana dollars ($’000) except where otherwise stated
Notes to the Financial Statements

132
2018Annual Reportwww.republicguyana.com
REPUBLIC BANK GUYANA ANNUAL REPORT 2018 COVER.indd 1 10/28/18 11:15 AM