Governance through Shame and Aspiration: Index Creation ...
58
Governance through Shame and Aspiration: Index Creation and Corporate Behavior Akash Chattopadhyay Matthew D. Shaffer Charles C.Y. Wang Working Paper 18-010
Transcript of Governance through Shame and Aspiration: Index Creation ...

Governance through Shame and Aspiration: Index Creation and Corporate Behavior
Akash Chattopadhyay Matthew D. Shaffer Charles C.Y. Wang
Working Paper 18-010

Working Paper 18-010
Copyright © 2017, 2018 by Akash Chattopadhyay, Matthew D. Shaffer, and Charles C.Y. Wang
Working papers are in draft form. This working paper is distributed for purposes of comment and discussion only. It may not be reproduced without permission of the copyright holder. Copies of working papers are available from the author.
Governance through Shame and Aspiration: Index Creation and Corporate Behavior
Akash Chattopadhyay University of Toronto
Matthew D. Shaffer Harvard Business School
Charles C.Y. Wang Harvard Business School

Governance through Shame and Aspiration:
Index Creation and Corporate Behavior
Akash ChattopadhyayUniversity of Toronto
Matthew D. ShafferHarvard Business School
Charles C.Y. Wang∗
Harvard Business School
November 2018Forthcoming, Journal of Financial Economics
Abstract
After decades of de-prioritizing shareholders’ economic interests and low corporate prof-itability, Japan introduced the JPX-Nikkei400 in 2014. The index highlighted the country’s“best-run” companies by annually selecting the 400 most profitable of its large and liquidfirms. We find that managers competed for inclusion in the index by significantly increasingROE, and they did so at least in part due to their reputational or status concerns. The ROEincrease was predominantly driven by improvements in margins, which were in turn partiallydriven by cutting R&D intensity. Our findings suggest that indexes can affect managerialbehavior through reputational or status incentives.
Keywords: JPX-Nikkei 400 index; Corporate governance; Index inclusion; Reputation in-centives; Status incentives; Return on equity; Capital efficiency; Social norms
JEL: G18, G34, G38, G41, L51, M14, M52
∗First draft: July 2017. Chattopadhyay ([email protected]) is an Assistant Professor of Accounting at the University of Toronto.
Shaffer ([email protected]) is a doctoral candidate at Harvard Business School. Wang ([email protected]) is the Glenn and Mary Jane CreamerAssociate Professor of Business Administration at Harvard Business School. We thank the Editor and an anonymous referee for their guidance. Weare grateful to Chad Cecere, Hideki Kanda, and Yasunori Nakagami for helpful insights on Japanese corporate governance. We thank Ray Ball, AlmaCohen, Vicente Cunat (GCGC discussant), Brandon Gipper (FARS discussant), Simon Glossner, Ian Gow (SOAR discussant), Jody Grewal, Paul Healy,Willian C. Johnson, Takuma Kochiyama (TJAR discussant), Ben Mathies, Pedro Matos, V.G. Narayannan, Gaizka Ormazabal (IMO discussant), KrishnaPalepu, Lee Radebaugh, George Serafeim, Doug Skinner, Eugene Soltes, Cong Wang (SFS discussant), and T.J. Wong as well as seminar participants atHarvard Business School, American University, University of Virginia, Georgetown University, George Washington University, University of Texas Austin,University of Chicago, Shanghai University of Finance and Economics, Fudan University, Suffolk University, UCLA, and conference participants at theFinancial Accounting and Reporting Section Midyear Meeting, the Global Corporate Governance Colloquia, the Hawaii Accounting Research Conference,the Harvard Business School IMO Conference, the Japanese Accounting Review International Conference, the Society for Financial Studies Cavalcade, theSOAR Accounting Symposium, and the Paris Financial Management Conference for helpful comments and suggestions. We also thank Raaj Zutshi forexcellent research assistance, Naoko Jinjo and Nobuo Sato for coordinating interviews in Japan, and Ann Goodsell for valuable editing advice. Commentsare welcome.

1. Introduction
How can persistent economic behavior be changed? The standard approach studied in
economics is the use of formal contracts or pecuniary rewards to incentivize the desired
behavior. Another approach—the use of non-pecuniary strategies or implicit incentives—
has increasingly attracted the attention of scholars in economics and adjacent fields (e.g.,
Goode, 1978; Masulis and Mobbs, 2014), and could be especially valuable in settings that
impose constraints on formal incentives or on their effectiveness.
A novel and increasingly salient mechanism for influencing the norms of corporate be-
havior is stock indexes. Over the last decade, stock indexes whose membership depends on
social, environmental, and corporate-governance attributes have proliferated. Perhaps the
most prominent examples are the decisions of the S&P500 Dow Jones and the FTSE Russell,
two of the world’s largest index providers, in mid-2017 to exclude certain firms with classified
shares—firms that deviate from the one-share/one-vote principle—from their main indexes,
an apparent attempt to reverse the trend toward adoption of such structures prior to initial
public offerings (Bebchuk and Kastiel, 2017).
But little is known about whether, how, or how effectively stock indexes can influence
corporate behavior. One theory is that stock indexes intensify the explicit incentives provided
by formal contracts by offering capital-market benefits—greater salience to investors, higher
liquidity, and lower cost of capital. Alternatively, by functioning as clubs of virtuous firms,
thematic stock indexes could promote certain behavior as a value or an ideal (e.g., Guiso,
Sapienza, and Zingales, 2015b), thus acting as an alternate governance mechanism that
leverages corporate managers’ reputational or status incentives.
We study a setting in which a central government deployed a stock index as a policy tool
to solve a longstanding and fundamental economic problem. Japan’s low corporate prof-
1

itability and capital efficiency—specifically, low return on equity (ROE)—became a primary
target of Prime Minister Shinzo Abe’s “Abenomics” policies and his administration’s efforts
to revitalize the economy and boost capital markets. (e.g., Ito, 2014, states that “ROE im-
provement can be regarded as the core of the third arrow of Abenomics.”)1 Formal incentives
have limited effectiveness in this setting, due both to a longstanding culture of de-prioritizing
shareholders’ economic interests relative to those of stakeholders (e.g., customers, suppliers,
and employees) and to strong corporate norms of relatively low executive compensation and
pay-to-performance sensitivities (Buchanan, Chai, and Deakin, 2013).
In 2014, the JPX-Nikei Index 400 (JPX400) was launched by the Japan Exchange Group.
Considered “the shiniest toy in the Abenomics box” (Lewis, 2017), this index showcased the
400 large and liquid Japanese firms that performed best in terms of profitability, capital
efficiency, and (by extension) corporate governance. Membership was considered highly
prestigious, a status attributable both to formal endorsement by the Government Pension
Investment Fund (GPIF) and to intense media coverage of its annual membership churn. The
JPX400’s status as the gauge of Japan’s best-run companies was evident in its colloquial
nickname, “the shame index,” in reference to the experience of excluded firms and their
managers.
This paper studies whether Japanese managers responded to ex ante JPX400-inclusion
incentives by improving corporate capital efficiency and, if so, why. Our identification strat-
egy is made possible by a unique feature of the JPX400: membership is determined each year
by a quantitative score based on operating income, ROE, and market capitalization. The
transparency of this ranking algorithm enables managers (and researchers) to assess firms’
1The report (e.g., Chart 3 of Ito, 2014) cites a 2012 average ROE of 5.3% among Japanese firms in theTOPIX500, or roughly one-quarter of average ROE at U.S. S&P500 firms and one-third of average ROE atthe firms in the Bloomberg European 500.
2

relative likelihood of inclusion, even though the Japan Exchange Group does not disclose
the official scores. Using publicly available information, we are able to generate synthetic
JPX400 rankings that predict actual membership with a high degree of accuracy and that
explain variation in the likelihood of index inclusion.
If managers are indeed motivated to attain JPX400 membership, these incentives can
be expected to be strongest at firms ranked near the margin of inclusion; all else equal,
managers at those firms are most likely to see their inclusion status change as a function of
their effort and performance. Thus, to study the effects on corporate performance generated
by the launch of the JPX400, we exploit variation in firms’ distance from the threshold of
inclusion. Our analysis focuses on ROE as the main outcome of interest because, among the
components of the JPX400 composite score, it is the most heavily weighted determinant,
the most directly controllable by managers, and the most directly related to policy makers’
goal.
Using synthetic JPX400 ranks, we employ a difference-in-differences (DID) design to
study the effects of index-inclusion incentives: “treated” firms are defined as those with syn-
thetic ranks near the inclusion threshold (ranks 301–500 in our main specification); “control”
firms are similar firms with a much lower probability of inclusion (firms ranked 501–800).
Our DID compares the difference in outcomes between these two groups in the post-period
(selection years 2014–2016) with their difference in the pre-period (2010–2012).2 A unique
feature of this design is that, unlike traditional DID designs, a firm’s treatment status varies
2For consistency, we use this as our main treatment and control definition throughout. But our result isnot sensitive to this choice. It remains stable when we use as a control group 200 or 300 firms on either sideof the treatment group, or on both sides, and it survives and varies predictably as we vary the “bandwidth”of our treatment group (e.g., becomes stronger if we use firms ranked 351–450 as treatment). We excludethe year 2013 because firms lacked sufficient time to respond in the first year of the index’s implementation.Nevertheless, including this year does not change our results qualitatively. The index and its implementationare described in detail in Section 3. and in Appendix B.
3

over time: its ranking, and thus its distance from the index-inclusion threshold, varies year
by year. No single manager has full control over a firm’s rank, which depends on the stochas-
tic nature of its performance and on the performance of other eligible firms. In effect, our
research design thus combines multiple “experiments” in the post-JPX400 period with mul-
tiple placebo “experiments” in the pre-period to infer the effect of inclusion incentives.
We document three main empirical findings. First, the firms closest to the inclusion
threshold achieved differential and economically significant improvement in ROE. We esti-
mate that, on average, these firms increased ROE by an economically significant 2.4 percent-
age points. A battery of tests supports the hypothesis that this effect is driven by inclusion
incentives—that is, by the firms’ efforts to improve ROE in order to be included in (or to
avoid exclusion from) the index. We document that the ROE improvements (1) do not
appear to be driven by differential trends, (2) are declining in a firm’s distance from the
threshold of inclusion, and (3) are not a realized consequence of index inclusion.
Second, we show that managers were motivated in part by status or reputational concerns.
We do not find that firms realized significant ex post capital-market, product-market, or
compensation benefits from inclusion in the JPX400 per se. We do find, however, that firms
who are added to or booted from the index attracted significantly greater media attention.
To distinguish whether firms were motivated by ex ante expectations of capital- or product-
market benefits or by reputational concerns, we exploit the differences between Nikkei225
and non-Nikkei225 firms. By virtue of their membership in a closely tracked and salient
market index, Nikkei225 firms already enjoyed the highest liquidity in the Japanese market;
thus the incremental capital-market benefits of inclusion in the JPX400 would presumably
be more valuable to non-Nikkei225 firms. But Nikkei225 firms would probably be more
sensitive to reputational concerns, and specifically to loss of status if they were excluded
4

from the new gauge of Japan’s best-run corporations. Consistent with this reasoning, we
find that media attention to added or booted firms was greater for Nikkei225 firms; we also
document that those firms exhibited significantly larger ROE responses than non-Nikkei225
firms.
Third, we find that firms on average improved ROE predominantly through improved
margins, in part by cutting discretionary expenses like research and development. Index-
inclusion incentives did not appear to lead firms to engage in accruals earnings management,
cut capital investments, or reduce employment or average employee pay. Overall, we find
that treated firms’ market valuations improved, suggesting that market participants viewed
the managerial activities that improved ROE as valuable to shareholders.
Our work makes several significant contributions. First, we contribute to the literature
on the effect of indexes. There has been abundant research on the performance and outcomes
of firms in response to inclusion in an index, including capital-market consequences (e.g.,
Shleifer, 1986; Harris and Gurel, 1986; Chen, Noronha, and Singal, 2004; Greenwood, 2008;
Doh, Howton, Howton, and Siegel, 2009; Boone and White, 2015; Appel, Gormley, and Keim,
2016). By contrast, our study provides large-sample evidence that the desire for inclusion
(or to avoid exclusion) can motivate changes in firm behavior.
Second, by showing that indexes can affect managerial behavior through managers’ status
or reputational concerns, we contribute to a small and growing empirical literature on the
role of reputation in corporate governance and in capital markets in general (e.g., Avery,
Chevalier, and Schaefer, 1998; Dyck, Volchkova, and Zingales, 2008; Malmendier and Tate,
2009; Masulis and Mobbs, 2014; Dai, Parwada, and Zhang, 2015; Raff and Siming, 2017;
Focke, Maug, and Niessen-Ruenzi, 2017). Of these, the papers closest to ours are those of
Dyck et al. (2008), who examine the influence of the media and of reputation concerns on
5
corporate governance in Russia; and Masulis and Mobbs (2014), who examine the effects of
firm prestige on independent directors’ performance and infer that reputational incentives
are powerful for directors. We extend this work by documenting, in a setting with relatively
strong empirical identification, how managers’ status concerns can be actively employed in
a novel governance tool to influence certain firms’ behavior.
Our findings also speak to a broad literature in economics and sociology on how per-
sistent behaviors or norms can be changed (Goode, 1978; Guiso, Sapienza, and Zingales,
2015a; Guiso et al., 2015b), and in particular on how the allocation of status can affect the
resource-allocation process (Zingales, 2015). Insights from our analyses could be valuable
to policy makers seeking alternative channels of influence on corporate managers; they may
be particularly relevant in light of increasing pressures, in the United States and abroad, to
limit executive compensation, and in developing-market contexts where there may be greater
constraints to contracting.
2. Background
This section discusses the factors that make the JPX400 a compelling setting in which
to study the role of indexes in changing longstanding corporate behavior.
2.1. Governance, Reform, and Corporate Culture in Japan
Today’s Japanese corporate culture emerged in a post-war period characterized by government-
led reconstruction and centralized industrial policy. Even early in the 21st century, coordi-
nation between Japanese corporations and government ministries remained close; managers
saw themselves as guardians of collective “corporate value” rather than of shareholder value
6

(Aoki, Jackson, and Miyajima, 2007). Thus the interests of employees, suppliers, customers,
and strategic stakeholders were prioritized over those of shareholders (e.g., Yoshimori, 1995;
Ito, 2014). Concurrently, strong norms of relatively low managerial compensation and of low
sensitivity of compensation to shareholder returns also took hold.
Although the Japanese legal system conferred increasing legal rights on shareholders over
the years, their de facto power to influence management remained weak. Many domestic
investors appeared unwilling to exercise their rights in a manner that could create conflict
with management, restricting the role of the market for corporate control—takeovers, private
equity, and shareholder activism—in resolving agency problems at Japanese firms.3 In 2014
Japanese managers rated shareholders as their companies’ fourth most important stakehold-
ers, behind customers, employees, and suppliers (see, e.g., Figure 1 of Toyoda, 2014).
Many observers, including Japanese policy makers, have pointed to the country’s stakeholder-
oriented culture as an explanation for its lagging corporate capital efficiency—its low return
on equity and return on assets—and for decades of economic stagnation since the bubble
economy of the 1980s (Ito, 2014). By 2013, many policy makers had come to believe that im-
proving corporations’ capital efficiency was vital to reviving the economy, an urgent concern
in light of Japan’s looming problems. That year, the Ministry of Economy, Trade, and In-
dustry commissioned a systematic review of ”competitiveness and incentives for sustainable
growth”; the result was the influential Ito Report (Ito, 2014), which asserts:
Japan faces a rapidly aging and declining population and a decreasing stock of
3For example, when activists or prospective acquirers turned hostile, they could rarely persuade domesticretail, strategic, or institutional investors to break the norm of siding with management (?), even when do-ing so was likely to confer economic benefits (Buchanan et al., 2013). As Buchanan et al. (2013) document,activist shareholders in the early 2000s were frequently able to force open shareholder votes on proposalsthat cash-rich Japanese firms increase their payouts—they faced no formal structural barriers from corpo-rate charters, classified shareholders, or courts)—but their proposals were voted down by investors loyal tomanagement.
7

labor and household financial assets. Japan has no room to waste its limitedresources and capital. Japan must effectively leverage the resources. . . . Inother words, increasing capital efficiency in the broadest sense is crucial fromthe perspective of Japan’s survival. Japanese companies—as a critical source ofvalue creation—must strive to increase capital efficiency through their dialoguewith investors, and contribute to the accumulation of a broad range of capitalstock that will serve as the foundation for future economic prosperity.
These concerns and goals were embodied in the Abe administration’s “third arrow” of
structural reforms—considered the most important component of Abenomics—which aimed
to increase corporate managers’ dialogue with and focus on shareholders.4 In its efforts to
boost capital markets and revitalize the economy, in short, Japan sought to change long-
standing corporate norms that de-prioritized shareholders’ economic interests.
2.2. The JPX-Nikkei 400 Index
In 2014, partly in response to these calls for reform, the Japan Exchange Group (JPX)—
the parent of Japan’s two largest stock exchanges (the Tokyo Stock Exchange and the Osaka
Stock Exchange)—and Nikkei Inc., Japan’s largest media company, launched a new stock
index, the JPX-Nikkei 400 (JPX400), designed to showcase the 400 large and liquid public
firms deemed best in terms of profitability, capital efficiency, and, by extension, corporate
governance. (See Section 3. for a full description of the algorithm.)
The index quickly became the new prestige index in Japanese equity markets, largely due
4Since his election in December 2012, Prime Minister Shinzo Abe has advocated an economic policy,dubbed “Abenomics” by economists and the media, with three main components (“three arrows”): the “firstarrow” of monetary easing, the “second arrow” of fiscal stimulus, and the “third arrow” of structural re-forms. Two 2014 reforms by the Financial Services Agency were designed to encourage manager–shareholderdialogue. The Stewardship Code encourages institutional investors to pursue long-term returns and to en-gage companies in constructive dialogue. The Corporate Governance Code, a “bill of rights” for shareholders(Gow, Wang, Jinjo, and Sato, 2017), urges companies to respect shareholder rights, improve capital efficiency,engage investors in dialogue on a regular basis, and appoint at least two external directors to their boards.Neither institutional investors nor companies are legally required to abide by all of the codes’ principles;they are required to comply or explain.
8

to formal endorsement by the Government Pension Investment Fund (GPIF)—the world’s
largest pension fund, run by the Japanese government—which decided in 2014 to use the
JPX400 as an equity benchmark for its passive investments. Historically, the GPIF’s invest-
ment approach was conservative and fixed-income-focused; thus its choice of the JPX400—
the only “thematic” equity index chosen as a benchmark—stunned market participants and
attracted substantial attention. The choice signaled that the fund would be paying closer
attention to the governance of the companies it invested in, consistent with the goals of Abe’s
“third arrow.” It also boosted the status of the JPX400 as a gauge of “well-run” companies
in the eyes of domestic institutional investors and the media.
Subsequent media coverage further elevated the JPX400’s status. Each summer, the
JPX reconstitutes its membership, booting firms that no longer make the cut and adding
firms that improved their (relative) performance. Although the index per se offers no direct
financial benefits to its constituent firms or their managers in the form of a direct monetary
award, its creation and its churn each August have generated substantial excitement and
media attention. Its colloquial nickname, “the shame index,” captures the experience of
firms that are excluded.
A unique feature of JPX400’s selection criterion is that its algorithm is explicit, trans-
parent, and, with the exception of a small number of “qualitative adjustments,” based on
publicly available financial performance data. Although the JPX does not publish the un-
derlying rankings, they are highly replicable. These features sharply distinguish the JPX400
from the Nikkei225—Japan’s traditional leading stock index and the oldest stock index in
Asia—whose selection criteria are opaque and determined by Japan’s top financial publica-
tion, owned by Nikkei Inc. The other major stock index tracked by institutional investors, the
TOPIX, consists of the largest firms listed on the Tokyo Stock Exchange. Thus—unlike the
9

traditional indexes, on whose composition corporate managers exert little or no influence—
the transparency and replicability of the JPX400 selection algorithm increases managers’
ability to influence the probability of their companies’ inclusion. Anecdotal evidence, news
reports, and interviews with top managers all suggest that many managers—both at firms
that were initially included and at those initially excluded—were motivated to improve their
firms’ capital efficiency. Many excluded firms aspired to gain entry; many included firms
feared future expulsion.5
The JPX400 index can be viewed as an effort to influence the norms of Japanese corporate
behavior by incentivizing efforts at inclusion in an index based on performance measures of
interest to policy makers and shareholders. The index is also notable as the first instance of
a central government deploying a stock index as a primary policy tool to change a persistent
behavioral outcome. It thus constitutes a unique laboratory in which to study the potential
incentive effects of this new alternate governance mechanism.
3. Empirical Design
We study how firms’ index-inclusion incentives affect their performance. We hypothesize
that, all else equal, firms closer to the threshold of inclusion will differentially improve
ROE.6 Our empirical strategy exploits the variation in index-inclusion incentives, which
is approximated by the variation in firms’ rankings. Our maintained assumption is that,
5When Amada, a 68-year-old toolmaker and member of the Nikkei225 index, was excluded from theinaugural JPX400 index in 2014, its president announced that the company intended to improve its capitalefficiency and shareholder returns and to appoint independent directors in order to gain membership. Sim-ilarly, some firms initially included in the index, such as Unicharm, announced measures aimed at securingtheir membership by further improving ROE (McLannahan, 2014).
6Firms nearer to the inclusion threshold are most likely to see their inclusion status change as a functionof their performance. This intuition resembles the theoretical and empirical finding of Casas-Arce andMartınez-Jerez (2009) that, in a multi-period tournament, agents who are either far ahead of or far behinda reward cutoff expend less effort than do agents closer to the margin between winning and losing.
10

though the JPX does not publish its rankings of firms, the transparency and replicability
of its selection algorithm make managers aware of (at least roughly) their firms’ relative
rankings and proximity to the threshold of inclusion. Thus our empirical strategy is anchored
in a synthetic replication of the JPX400’s rankings of eligible firms. We first validate these
synthetic rankings, and then use them as the basis of a difference-in-differences design to
infer how index-inclusion incentives affect firms’ subsequent ROE.
3.1. Synthetic JPX400 Ranks and Sample Construction
We obtain Worldscope data on annual fundamentals (including but not limited to all the
underlying variables listed in Appendix A) and Datastream data on monthly prices, volume,
outstanding shares, and returns for a comprehensive list of Japanese securities. We omit
observations that are missing returns, have an empty “data date” field for fundamentals
data, or have duplicate Datastream identifiers in the same year. We merge in executive-
compensation data from Toyo Kezai, information on media coverage from Ravenpack, and
indicators for Nikkei225 and JPX400 membership constructed using information obtained
from the indices’ websites.
We then employ the algorithm used by the Japan Exchange Group to replicate firms’
JPX400 rankings. The selection algorithm begins by filtering companies listed on the Tokyo
Stock Exchange (TSE) on several criteria. First, it excludes all companies that (1) have been
listed on the TSE fewer than three consecutive years, (2) have had negative book value in
any of the past three years, (3) have had negative operating income in all of the preceding
three years, or (4) are in the process of being de-listed. From this pool of eligible firms, the
JPX then selects the top 1,200 stocks by “trading value” (price times volume, or the total
value of transactions in the stock over the preceding year). Finally, these 1,200 stocks are
11

winnowed down to the top 1,000 by market capitalization.
These 1,000 firms, which we refer to collectively as “the ranked set,” are then ranked
using the following composite score (Total Score):
Total Scorei,t = .4 ×ROE Ranki,t + .4 ×OpΠ Ranki,t + .2 ×MCap Ranki,t, (1)
where ROE Ranki,t, OpΠ Ranki,t, and MCap Ranki,t are firm i’s ranks in the ranked set
on three-year average ROE, three-year total operating profit, and market capitalization
respectively.
Each year’s index members are chosen on the basis of the highest Total Score, with one
caveat: the JPX can make up to ten “qualitative adjustments” per year based on corporate-
governance and disclosure-related factors. These adjustments are not determined by observ-
able factors, but, according to our interviews with representatives of the Japan Exchange
Group (and empirical evidence presented below), they are insignificant. We treat these
adjustments as random noise in the index-inclusion rule. We follow the JPX400 selection
algorithm precisely, with the exception of the qualitative adjustments, to create synthetic
JPX400 ranks for each year from 1994 through 2016.
3.2. Research Design
We utilize these synthetic rankings to test how index-inclusion incentives affect firm
behavior. Our main dependent variable of interest is one-year-ahead (“forward”) ROE, the
outcome of interest to policy makers. As the only scaled measure, moreover, ROE is the
most controllable by managers.7
7Market capitalization and operating income are unscaled and thus largely driven by firm size. Managersmight be able to increase firm size via seasoned equity offerings or acquisitions, but such actions would be
12

We implement a difference-in-differences (DID) design using the synthetic rankings, where
“treated” firms are those close to the threshold of inclusion and “control” firms are those
further from the threshold. Our main tests estimate the following:
ROEi,t+1 = α + β1Treati,t × Postt + β2Treati,t + γXi,t + ft + εi,t, (2)
where Treati,t is an indicator equaling 1 for firms ranked 301–500 and 0 for firms ranked
501–800 in a given selection year t; ROEi,t+1 is a firm’s return on equity in the following
fiscal year; Postt is an indicator for the period after introduction of the inaugural JPX400
members, equaling 1 for years 2014–2016 and 0 for years 2010–2012; Xi,t is a vector of
contemporaneous firm controls; and ft represents time-fixed effects.
Note that the first difference compares the ROE of the firms closest to the threshold of
inclusion to that of firms outside the threshold in the three years after introduction of the
JPX400. (We exclude 2013 because the JPX400’s inaugural members were announced at the
end of that year, affording firms only three months to respond to index-inclusion incentives.)
The main coefficient of interest, β1, effectively benchmarks this first difference against the
baseline difference between similarly ranked firms in the three years prior to introduction of
the JPX400. This second difference accounts for baseline differences between our treatment
and control groups that are associated with rank but stable over time.
Unlike in traditional DID designs, in our setting a firm’s treatment status varies over
time: its rank, and thus its distance from the index-inclusion threshold, varies year by year.
Moreover, managers lack full control over these rankings, which depend on the stochastic
nature of a firm’s own performance and the performance of other JPX400-eligible firms.
likely to generate a competing effect on a firm’s rankings by increasing the equity base and, ceteris paribus,decreasing ROE. Thus we expect to observe the incentive effects of the JPX400 most cleanly in ROE.
13

To infer the effect of inclusion incentives, therefore, our research design in effect combines
multiple “experiments” in the post-JPX400 period with multiple placebo “experiments” in
the pre-period.
Our identifying assumption is that any counterfactual differences in future ROE—differences
that would exist in the absence of JPX400-inclusion incentives—between treated firms and
controls are stable over time and thus accounted for by pre-period differences between placebo
treatment and control firms. We believe that this assumption is most defensible when con-
ditioned on current ROE, an important predictor of future ROE, because the distribution of
ROE can change after introduction of the JPX400. Thus, our most robust specification—on
which we rely most heavily throughout our empirical analysis—includes current ROE (or
the lagged dependent variable more generally) as a control.
3.3. Validation of Synthetic Ranks
Because our research design relies on a synthetic replication of JPX400 ranks, we validate
them before proceeding to the DID analysis by examining how well they explain variation in
the likelihood of index inclusion. To ensure that this analysis includes all false negatives, our
analysis sample includes all firms in the top 2,000 by trading value, for the selection years
2013–2016.
Table 1 reports the results of an OLS regression of JPX400 Member—an indicator for
actual JPX400 membership—on ranges of firms’ synthetic ranks. Column 1 shows that a
synthetic rank of 400 or less (Above Cutoff ) is highly predictive of actual index inclusion.
This univariate regression generates anR2 of 87%. Column 2 adds firm-level controls to assess
the extent to which our prediction errors, such as those due to “qualitative adjustments,”
are systematically correlated with firms’ fundamentals. We find that Log Market Cap alone
14

exhibits a significant relationship with the likelihood of JPX400 inclusion; no other firm
attribute in this regression does. The loading on Log Market Cap is likely explained by the
JPX400’s weighting toward large firms; thus our false negatives are on average much larger
than the full sample of 2,000 firms.
Columns 3 and 4 use more granular synthetic rank ranges—1–200, 201–400, 401–600,
and over 800—as the main predictors of interest. (We omit an indicator for ranks 601–800,
which would induce perfect collinearity with the other indicators.) Column 3 shows that,
relative to the excluded category (601–800), being ranked 1–200, 201–400, or 401–600 implies
significantly greater likelihood of inclusion, with the incremental likelihood being largest for
firms ranked 1–200 and the smallest for firms ranked 401–600. We also find that firms ranked
outside 800 have greater likelihood of inclusion relative to the excluded category, although
the magnitude of the effect is small. This is again probably a result of the false negatives
that tend to be larger in size. Column 4 adds firm-level controls and we find, once again,
that the only firm-level control that additionally predicts inclusion is size. Collectively, these
results show that our synthetic rankings are highly valid, and that our prediction errors are
unlikely to cause systematic biases in our main results.
3.4. Summary Statistics
Table 2 reports pre-period summary statistics for the sample of firms used in our main
analyses (firms with synthetic ranks of 301–800). The first five columns report the distribu-
tional statistics (quartiles, mean, and standard deviation) of covariates for the full sample;
the rightmost three columns report the means for the treatment group (ranked 301–500) and
the control group (ranked 501–800) and the t-statistics from a test of their mean differences.
Definitions of covariates appear in Appendix A.
15

It is noteworthy that our treated and non-treated firms differ in their means on several
variables related to profitability and size, such as ROA, Asset Turnover, Log NOA, and Log
Market Cap. This pattern is to be expected, since the treatment firms are ranked higher
than the control firms, and the synthetic ranks are driven by size and profitability. These
differences motivate our inclusion of linear controls for firm characteristics.
Note that, though we could have included firms ranked 1–300 or 801–1,000 in our control
group, untabulated tests revealed that doing so would accentuate the degree of covariate
imbalance. Thus our baseline design combines a pre-estimation matching of similar firms
with linear controls to account for local differences. We will utilize the holdout sample of
firms later, however, in robustness tests to help rule out alternative hypotheses.
4. Empirical Analysis
This section presents empirical tests that examine whether, how effectively, and through
what incentive channels the JPX400 influenced corporate behavior.
4.1. The JPX400 Inclusion Threshold and Future ROE
Table 3 reports the results from estimating various versions of equation (2). Column
1 estimates a basic DID specification, without time- or industry-fixed effects and without
any firm-level controls. The DID estimate suggest that, compared to lower-ranked and less
affected firms, the firms most affected by index-inclusion incentives experienced a statistically
significant (at the 1% level) relative increase in ROE of 2.8 percentage points.
Noteworthy is the statistically insignificant coefficient (at the 10% level) on Treat, sug-
gesting that the treated and control firms are similar in mean Forward ROE during the pre
16

period. Also noteworthy is the positive and significant (at the 1% level) coefficient on Post,
an estimate of the secular trend in ROE, suggesting that control-group firms experienced a
1.8-percentage-point-higher ROE in the post period. One interpretation of this coefficient
is that it captures the effects of the other contemporaneous governance reforms, such as the
Corporate Governance Code and the Stewardship Code. If so, our DID estimate suggests
that the incremental effect on ROE of being close to the inclusion threshold is at least as
large as the effects of all other contemporaneous reform efforts. Alternatively, to the extent
that the Post coefficient reflects in part the effects of the inclusion incentives on firms ranked
501–800, our DID coefficient would be downward-biased.
Columns 2–5 present estimates from increasingly robust DID specifications relative to
Column 1. Column 2 replaces the Post indicator with time-fixed effects; Column 3 adds
industry-fixed effects; Column 4 adds linear controls for contemporaneous firm attributes
that can also potentially explain future ROE, specifically Log Market Cap, Log Book to
Market, Sales Growth, LT Debt to Equity, and Cash to Equity ; and Column 5 includes
contemporaneous ROE as an additional firm-level control.
Most notably, the coefficients on Treat×Post remain similar in magnitude and in statisti-
cal significance across Columns 2–5. By contrast, the adjusted R2 of the regression increases
from 2.19% in Column 2 to 30.31% in Column 5, mitigating concern about omitted-variable
biases (Oster, 2017).
Column 6 examines an alternative specification that substitutes the log of gross ROE for
ROE, both as the forward outcome variable of interest and as the contemporaneous control.
The DID coefficient remains statistically significant at the 1% level, suggesting that our
effects are not driven by a secular proportional increase in ROE in the post-period.
We offer several ways of interpreting the magnitude of these documented effects, and
17

in particular of the main effect documented in Column 5—the most robust specification.
First, in simulations, we find that this level of ROE improvement would make a significant
difference in marginal firms’ ranks and thus in their probability of inclusion. This is the case
in part because an improvement in ROE would affect firms’ rankings along all dimensions—
operating profits and market capitalization. We find that, for firms included in the index and
also in our treatment group, a reduction in profitability of this magnitude (i.e., dropping to
what the firm’s profitability would be absent the estimated average treatment effect of 2.4%
in ROE) would cost an average of 83 ranks, holding other firms’ behavior fixed.8 Another
benchmark is the pre-period treatment-group mean, against which the main effect of Column
5 indicates a 40% proportional increase. Although this finding suggests a very large effect
relative to the Japanese benchmark, it reflects the relatively low ROE and relatively large
amount of slack in Japan. Put differently, relative to the U.S. benchmark cited in the Ito
report (Ito, 2014), this main effect would close 15% of the ROE gap for our treatment firms.
4.2. Testing the Identifying Assumptions
Our empirical design relies on the identifying assumption that any counter-factual dif-
ferences in future ROE between the treated and control firms are stable over time (that is,
that they follow parallel trends). We provide two tests of this assumption. The first test
assesses whether there is evidence of differential pre-treatment trends in ROE between the
firms ranked 301–500 and those ranked 501–800. Table 4, Column 1, reports a specification
8We calculate this quantity by estimating a firm-level profitability treatment effect (2.4% times contem-poraneous common equity) and then recalculating the firm’s ranking after appropriately adjusting all of thecomponents of the overall rank. Specifically, we subtract the estimated profitability effect from contempora-neous net income to recalculate 3-year average ROE, subtract it after tax adjustment to recalculate 3-yeartotal operating income, and adjust the company’s market capitalization assuming its P/E ratio is held con-stant. We then re-rank each firm on each dimension and the composite score, holding all other companies’attributes fixed, and calculate and save each firm’s change in overall rank.
18

that augments the specification in Table 3, Column 5, with the following additional interac-
tion variables: Treat×(Y ear = 2011) and Treat×(Y ear = 2012), where Treat is defined as
in equation 2 and Y ear = 2011 and Y ear = 2012 are indicators for the selection years 2011
and 2012. These interaction coefficients are insignificant both economically and statistically
(at the 10% level), suggesting no evidence of differential pre-treatment trends and consistent
with the parallel-trends assumption.
We also test for evidence of differential pre-treatment trends by implementing placebo
tests using synthetically reconstructed ranks going back to 1994. Figure 1 graphs the results
of five placebo DID estimates for five sets of seven-year sample periods prior to introduction of
the JPX400. Following the precise setup and implementation of our main empirical test (see
Table 3, Column 5), in each year we rank firms based on the JPX400 selection algorithm and
on the composite score of equation (1) and create placebo treatment and control indicators
as in our main tests. Then we take seven-year samples, drop year 4 from the analysis, and
define the final three years of the sample as the post period; finally, we estimate the DID
specification. Under the identifying assumption, we expect to find placebo DID estimates
that are statistically no different from 0. Indeed, Figure 1 shows that none of our placebo
DID estimates are statistically different from 0, and that most of the point estimates are
close to 0, providing further support for the parallel-trends assumption.
Although we do not find evidence of differential pre-period trends, it is possible in the-
ory that the counter-factual trends between the treated and control firms diverged after
introduction of the index. For example, if an economy-wide shock in 2013 causes a secular
proportional increase in ROE in subsequent years, firms with higher pre-period ROE (i.e.,
higher JPX400 rank) would experience a larger increase in the level of ROE in the post
period. More generally, after 2013 some omitted variables could have changed in ways that
19

are correlated with the JPX400 rankings and thus explain the relative increase in ROE we
document in treated firms.
We note first that Table 3, Column 6, shows that our results also hold for forward log of
gross ROE, suggesting that our findings are not driven by proportional secular increase in
ROE. To address this possibility more generally, Table 4, Column 2, reports the estimates
from a specification in which we split our treatment indicator in two—one indicator for the
higher-ranked firms (with ranks within 301–400) and the other for those ranked lower (401–
500)—and compare the DID coefficients. If the treatment effects we document were due to
differential trends that were correlated with the JPX400 rankings after introduction of the
index, we would expect the treatment effect to be higher for those firms ranked 301–400. We
find, however, that the estimated DID coefficients for the two types of treatment firms are
nearly identical to (and statistically indistinguishable from) each other in magnitude, and
both statistically significant at the 5% level.
Column 3 provides an alternative test using firms ranked 1–300 as contemporaneous
placebo treatments. Again, we find that the coefficient on Rank 1–300×Post is (1) statisti-
cally no different from zero at the 10% level, and (2) statistically different, at the 1% level,
from the DID coefficient. Thus, firms ranked 1–300 exhibit no differential response in ROE
as compared to firms ranked 501–800.
Column 4 provides another alternative cross-sectional placebo test using firms outside of
the “ranked set” and thus ineligible for JPX400 selection. We rank these firms according
to equation 1, construct placebo treatment and control groups using these ranks—among
the ineligible firms, those ranked 301–500 are considered treated and those ranked 501–800
controls—and re-run our main test. The estimated coefficient on Placebo Group Treat×Post
is statistically no different from 0 at the 10% level. Consistent with the findings in Columns
20

2 and 3, and supportive of the parallel-trends assumption, these findings suggest that it
is unlikely that some omitted factor correlated with JPX400 rankings in the post period
confounds our main results.
These results also constitute evidence in support of a second critical assumption behind
our empirical strategy: that firms experience stronger incentives to improve ROE when
they are nearer the threshold of index inclusion. In particular, in Columns 2 and 3 we
show that firms on either side of the threshold of inclusion improved ROE by virtually
identical magnitudes. Moreover, firms further below the threshold (ranked 501–800) and
those ranked highest (1–300) exhibit similar ROE improvement, both significantly lower
than the improvement at firms near the threshold of inclusion.
Next, we create a more continuous measure of treatment intensity by sorting the 1,000
ranked-set firms into five quintiles, based on the negative of the absolute value of their
distance from the rank-400 cutoff. The resulting variable, Quintile(Closeness), ranges from
0 to 4 and is increasing in proximity to the JPX400 cutoff: higher values represent more
intense index-inclusion incentives. Column 5 reports the results of our estimates using the
entire ranked set and this alternative treatment measure. We find a positive and significant
coefficient (at the 5% level) on Quintile(Closeness)×Post. Together with the results in
Columns 1–4, these findings are consistent with the observed effects on ROE being driven
by firms’ desire to win, or to avoid losing, membership in the index.
4.3. Consequences of Index Inclusion
We next turn to examining why managers may have been motivated to pursue or maintain
membership in the JPX400. We begin by studying the consequences of realized inclusion
in the JPX400 in terms of firms’ ROE, Sales Growth, Executive Compensation, Employee
21

Compensation, Illiquidity, and BM.
Our empirical tests are motivated by the empirical design in Appel et al. (2016) but
tailored to our setting. In particular, we regress the outcome of interest on JPX400 Member,
an indicator of firms’ actual JPX400 membership status in a given year; Centered Rank, the
firm’s total rank minus 400; Log Market Cap; ROE ; and time and industry dummies. We
restrict our analysis to 50 firms on each side of the threshold for inclusion, i.e., firms ranked
351–450.9 Our identifying assumption is that, after controlling for the major determinants of
index inclusion (synthetic rank, Market Cap, and ROE), variation in JPX400 status within
this narrow bandwidth is plausibly exogenous to the outcome variables we examine, and
consequently that the coefficient on JPX400 Member identifies the effect of inclusion in the
index per se.
Table 5 tabulates the results of this analysis. Column 1 indicates that firms did not
enjoy a statistically measurable improvement in ROE simply as a result of index inclusion, a
finding consistent with the main ROE effect being a consequence of firms’ ex ante inclusion
incentives. Columns 2–6 all additionally report null results: there is no statistically measur-
able benefit of inclusion in sales, executive compensation, average employee pay, liquidity,
or book-to-market ratio.10
That firms and managers do not appear to derive any measurable benefits on those
dimensions from JPX400 inclusion may be surprising, but these results can be explained
9In one year, two firms are tied for rank 450 (each assigned the rank 450.5), and thus dropped by ourfilter, yielding 299 observations for each specification.
10In untabulated tests we find very similar results, both qualitatively and quantitatively, when we use widerbandwidths of 251-550 and 151-650. We also find very similar results using a “fuzzy” regression discontinuitydesign (FRD), using a larger bandwidth of firms around the rank threshold of 400, and instrumenting forJPX400 Member with an indicator for crossing the rank threshold. None of the coefficients on JPX400Member in the FRD are statistically significant at the 10% level. We choose the relatively simpler approachas our primary design because it allows us to restrict our test to a narrower bandwidth of firms around thethreshold, thus plausibly achieving a closer match between included and excluded firms, without encounteringweak-instrument problems that might affect a FRD in a narrow bandwidth (Appel et al., 2016).
22

by institutional factors or by recent work on the capital-market effects of ETFs. Though
the JPX400 is seen as highly prestigious by the Japanese business, finance, and political
communities, it is less salient for ordinary Japanese consumers. Thus it is not clear that
mere inclusion in the index would generate significant product-market benefits (such as
pricing-power and brand-value benefits) that could drive improvements in Sales Growth and
ROE. That we do not find significant effects on Executive Compensation can be explained
by the fact that CEO pay-to-performance sensitivity is very low in Japan, as has been
documented (Nakazato, Ramseyer, and Rasmusen, 2011; Kato and Kubo, 2006) and as we
confirmed in untabulated tests.11 Thus, even if shareholders and directors pushed managers
to pursue index inclusion, we would not expect success to yield significantly higher managerial
compensation.
The lack of direct capital-market benefits—in terms of Illiquidity and Book-to-Market—
may appear to be the most puzzling finding, particularly given evidence on the price effects
of index inclusion in the United States (e.g., Shleifer, 1986; Chang, Hong, and Liskovich,
2015). Again, closer examination of the institutional factors helps to explain these findings.
In theory, inclusion in a stock index would improve liquidity and valuation multiples to the
extent that it significantly changes relative demand for a stock. However, inclusion in the
JPX400 per se is unlikely to generate such a significant increase in relative demand. First,
since 2013 there has been a large secular increase in total demand for Japanese equities,
11Top managers at our treatment firms did not earn significantly more than their counterparts at controlfirms. In untabulated tests, we estimated a standard pay-to-performance regression using Log Avg Exec Payas the dependent variable and Annual Return as the main explanatory variable, and tested for differencesin this sensitivity between time periods and between treated and control firms. We found very low averagepay-to-stock-return-performance sensitivity in Japan. Among the control firms in the pre-period, a 100%increase in the stock price is associated with a mere 4.4% increase in pay. Estimating a similar specificationusing U.S. executive-compensation data, we found a pay-to-stock-return-performance sensitivity of 20%,about 4.5 times as large as in Japan. Finally, we did not find evidence that this sensitivity changed afterintroduction of the JPX400, for either the treatment or the control group.
23

driven by two factors: (1) the Bank of Japan’s (BOJ) quantitative-easing program, which
significantly increased domestic equity holdings by purchasing index-linked ETFs (in quan-
tities amounting by the end of 2016 to $16 trillion Yen); and (2) the GPIF’s decision to
increase the proportion of assets under management (more than $130 trillion Yen) allocated
to equity investments from a target of 12% to 25% (Barbon and Gianinazzi, 2017). In both
cases, the increase in total demand benefits all firms that belong to the TOPIX index, which
remains the Japanese index most frequently tracked by institutional investors, and which
especially benefits firms that belong to the Nikkei225, the index that the BOJ’s program
heavily targeted. Although the BOJ and the GPIF both allocated some of their capital to
the JPX400, the amounts are relatively insignificant. For example, only 4% of the BOJ’s
purchases flowed to ETFs tracking the JPX400; 53% flowed to ETFs tracking the Nikkei225
and 43% flowed to ETFs tracking the TOPIX (Barbon and Gianinazzi, 2017). Similarly, the
GPIF only benchmarked approximately 6% of its domestic equity portfolio to the JPX400
(vs. 74% benchmarked to the TOPIX).
These institutional factors imply insignificant changes in relative demand for JPX400
stocks, in light of the significant rise in total demand for Japanese stocks in the TOPIX
(which includes all of the JPX400 firms) and the Nikkei225. In fact, our computations
suggest that inclusion in the JPX per se contributed only approximately 14% of the total
increase in demand due to the BOJ’s quantitative easing and the GPIF’s increased allocation
to equity. Also, recent work on ETFs challenges the assertion that inclusion in an index leads
to capital-market benefits. For example, research has found that increased ownership due
to ETFs reduces liquidity (Hamm, 2014), increases non-fundamental volatility (Ben-David,
Franzoni, and Moussawi, 2018), reduces information-production incentives (Israeli, Lee, and
Sridharan, 2017), and creates excess co-movement in stock returns (Da and Shive, 2018).
24

Jointly, these patterns could explain why we do not observe empirical evidence of significant
capital-market benefits from inclusion in the JPX400 per se.
4.4. Media Attention to Inclusion and Exclusion
Given the absence of immediate financial or monetary benefits from realized inclusion in
the index, why were Japanese managers and firms motivated to pursue membership? One
possibility—consistent with our interviews with investors and with the JPX400’s nickname
(the “shame” index)—is that managers were motivated by reputation concerns: the prestige
of inclusion and fear of the shame of exclusion.
A long literature in finance and economics (e.g., Dyck et al., 2008; Dai et al., 2015)
has documented that media coverage can serve as an alternative mechanism for disciplining
managers’ behavior by influencing their reputation costs. In Table 6 we examine whether
media attention to firms responded to changes in their JPX400 membership status. Our
empirical design follows that of Table 5, but here the explanatory variables of interest are
Booted, an indicator that evaluates to 1 if a firm was included in the index in the previous
year and excluded in the current year; Added, which evaluates to 1 if a firm was previously
excluded and newly added; and Switch, which evaluates to 1 if the firm was either booted
or added. As in Table 5, the sample consists of firms ranked 351–450 in the years 2014-
2016; we include time- and industry-fixed effects as well as linear controls for the primary
determinants of JPX membership status: Centered Rank, Log Market Cap, and ROE. (We
drop 2013 because the status of all 400 included firms changed, and none were booted, in
that year.)
In Columns 1-3, the dependent variable is No. of Media Articles, a simple count of unique
(“full”) articles identified by Ravenpack in which given firm was mentioned between July and
25

September of each year.12 The positive and significant loading on Switch reported in Column
1 indicates that changes in firms’ inclusion status generated greater media attention. The
estimated effect size—an additional 36 articles mentioning the firm in news sources tracked by
Ravenpack—is substantial, representing an 82% increase relative to the 2013 mean for firms
ranked 351-450. Column 2 reports the results of a specification that replaces Switch with
separate indicators for Added and Booted ; our results suggest that media coverage of JPX400
inclusion and exclusion respectively is not statistically distinguishable. Finally, Column 3
examines differential media attention to firms in the Nikkei225—historically Japan’s leading
stock index, closely tracked by institutional investors, and consisting of the largest, best-
known, and most liquid firms in 36 industries. This specification interacts Switch with
an indicator for Nikkei225 firms and includes a Nikkei-specific intercept. The estimated
coefficient on Nikkei225 × Switch is large—representing 132 additional media mentions—
and statistically significant.
Columns 4-6 examine an alternative measure of media attention, Weighted No. of Me-
dia Articles, which relaxes the relevance criterion and instead weights each article by the
relevance score. The results using this alternative measure are qualitatively similar though
statistically stronger: once again, there is a large, significant coefficient on Switch; we cannot
statistically distinguish whether being Booted or Added generated a larger media response.
The media response to Switch is notably higher for Nikkei225 firms.13
12To capture media attention in anticipation of the index turnover, we begin counting articles in July, whenall information necessary to predict index inclusion is publicly available. To capture articles that respondto the index turnover, we also count articles in the two months after the August 1 announcement date. Toensure that we identify articles directly related to the firm in question, we restrict ourselves in Columns 1-3to articles with a Ravenpack relevance score greater than 75.
13In untabulated tests, we verify that these results are not sensitive to the choice of bandwidth and persistwhen we use samples of firms ranked 251-550 or 151-650. Moreover, using data from 2010-2012 and defininga placebo Switch measure, which switches on when firms cross the rank-threshold of 400, we do not find apositive and significant coefficient on Switch from estimating the specification in Column1, Table 6. Similarly,we do not find a positive and significant coefficient on Nikkei225×Switch from estimating the specification
26

Collectively, these results suggest that inclusion in the JPX400 had implications for the
reputations of firms and their managers: media outlets reported on which firms were booted
out and newly included. This scrutiny was especially pronounced for Nikkei225 firms.
4.5. Exploring Incentive Channels: Nikkei vs. Non-Nikkei
The findings reported in Sections 4.3. and 4.4. suggest that the ex-post consequences
of JPX400 inclusion were reputation-related. But it remains possible that firms coveted
membership in the index because they expected to realize benefits such as greater liquidity
or lower cost of capital ex ante—both realistic expectations, given that the GPIF promised
to track the index and that other institutional investors could be expected to follow suit.
For example, firms may have expected capital-market or product-market benefits to manifest
over the longer term, as the index became more popular.
To distinguish between these two possibilities, we examine cross-sectional variation in the
treatment response in ROE between Nikkei225 and non-Nikkei225 firms. As we document
above, the inclusion status of Nikkei225 firms is likely to elicit greater public scrutiny; thus
Nikkei225 firms are more likely to be attuned to status or reputation concerns. On the other
hand, because Nikkei225 firms already enjoyed the highest liquidity in the Japanese mar-
ket, the incremental capital-market benefits of inclusion in the JPX400 would presumably
be more salient for, and appear greater to, non-Nikkei225 firms. Thus we would interpret
a higher treatment response from Nikkei225 firms as evidence for the status-incentives hy-
pothesis; a higher treatment response from non-Nikkei225 firms would be evidence for the
expected capital-market benefits hypothesis.14
in Column 3, Table 6 using the pre-period sample. Placebo test results are again similar when we examinea wider bandwidth of firms ranked 251-550 or 151-650.
14One way to think about this is that the treatment effect on non-Nikkei225 firms represents an upper-
27

We estimate a difference-in-difference-in-differences (DDD) specification to examine the
differential responses in ROE between Nikkei225 and Non-Nikkei225 firms:
ROEi,t+1 = α + β1Ti,t ×Nikkei225i,t × Postt + β2Ti,t × Postt + β3Ti,t ×Nikkei225i,t
+ β4Nikkei225i,t × Postt + β5Nikkei225i,t + β6Ti,t + γXi,t + ft + εi,t. (3)
Here, Ti,t denotes the treatment variable of interest; we use the two treatment-intensity mea-
sures in prior analyses, the binary Treat measure and the more continuous Quintile(Closeness)
measure. In this regression, we are interested in the sign and significance of the triple-
interaction coefficient. Under the status-incentive hypothesis, β1 should be positive and
statistically significant.
Table 7 reports the results of our empirical tests. Column 1 estimates equation 3 using
our original sample (i.e., in Table 3) and treatment and control definitions. We find a positive
DDD coefficient of 0.038, but it is not statistically significant at the 10% level (with a p-value
of 13%). This is unsurprising given the relatively sparse presence of Nikkei225 firms in the
control group (firms ranked 500-800) and the demanding DDD estimation.
To increase the statistical power of our tests, Column 2 enlarges the sample to include
firms ranked 1–300 as controls (as in Table 4, Column 3); Column 3 incrementally includes
firms ranked 801–1,000 as controls (as in Table 4, Column 5). With the larger estimation
samples we obtain a positive and statistically significant (at the 10% and 5% levels) DDD
coefficient, suggesting a stronger ROE response for Nikkei225 firms close to the threshold of
bound estimate of the treatment response from Nikkei225 firms that could have resulted from expectedcapital-market benefits alone, because (a) non-Nikkei225 firms probably also have status concerns and (b)non-Nikkei225 firms’ expected capital-market benefits from inclusion are probably greater than those ofNikkei225 firms. Conversely, the treatment effect on Nikkei225 firms represents an upper-bound estimate ofthe treatment response from non-Nikkei225 firms that could have resulted from status concerns alone.
28

index inclusion.
Finally, Column 4 repeats the estimation using the more continuous Quintile(Closeness)
treatment measure and the sample of firms ranked 1-1000 (as in Table 4, Column 5). Again,
we find a positive and significant (at the 10% level) coefficient on the triple interaction term,
further evidence of a stronger ROE response for Nikkei225 firms due to stronger index-
inclusion incentives.
Collectively, our results support the hypothesis that managers’ concerns for status and
reputation play an important role in explaining why certain managers (e.g., those in Nikkei225
firms) were incentivized to obtain JPX400 membership. However, our findings do not nec-
essarily rule out the expected capital market benefit hypothesis, in particular for explaining
why other managers (e.g., in non-Nikkei225 firms) may have been motivated to get into the
index. We believe this could be a fruitful avenue of research as data on long-run consequences
of JPX400 inclusion become available.
4.6. Drivers of the ROE Response
Next we study which levers managers pull to generate the improvement in ROE that we
document. Table 8 reports the results of regressions examining the behavior of the major
drivers of ROE. Columns 1-6 replicate our main baseline specification (Table 3, Column 5)
but use forward Sales Growth, ROA, Profit Margin, Asset Turnover, Leverage, and Share-
holder Payouts, respectively, as dependent variables.
The results in Table 8 suggest that improvement in ROE is predominantly driven by
improvements in operational efficiency (as measured by ROA) rather than changes in capital
structure. Improvements in ROA, in turn, appear to be on average driven by increased
margins rather than by asset turnover or sales growth.
29

Column 1 shows no significant treatment effect (at the 10% level) on Sales Growth.
Column 2 reports a statistically significant (at the 5% level) treatment effect on ROA of
0.53 percentage points, a 17% increase over the treatment group’s pre-period mean of 3.1%.
Column 3 suggests that this increase in ROA is primarily driven by improved Profit Margin:
the statistically significant (at the 5% level) treatment effect estimate of 0.0074 constitutes
a 15.3% increase in margins relative to their pre-period average of 4.9%. Column 4 reports
no statistically measurable treatment effect on Asset Turnover, suggesting that it was not a
dominant channel for the documented improvement in ROA. In untabulated tests, however,
we find that treatment firms with more slack in this dimension—those with below-median
asset turnover—did improve their efficiency. But even for this subsample, the effect on asset
efficiency is much smaller than the treatment effect on profit margin.
In Column 5, we do not find evidence that financial leverage was impacted by firms’
JPX400-inclusion incentives. This finding is not entirely surprising, since the ranking algo-
rithm does not necessarily incentivize firms to increase leverage per se. Under Modigliani
and Miller (1958) assumptions, a profitable firm making a simple ceteris paribus increase in
financial leverage—such as by issuing debt and repurchasing shares—might increase its ROE
but would decrease its total market capitalization, a component of the selection algorithm.
It is also possible that our measure of financial leverage (net debt over equity) is too noisy
to capture the JPX400’s potential effects on firms’ capital-structure decisions. Thus we sup-
plement our analysis of financial leverage by examining payout policy, using shareholder
payout ratio (i.e., dividends plus repurchases divided by shareholder’s equity) as the depen-
dent variable of interest. Treated firms could increase shareholder payouts to boost their
ROE by reducing retained earnings and the book value of shareholders’ equity, particularly
if doing so leads shareholders to increase valuation multiples (thus dampening the potential
30

tradeoff in market capitalization). In this way we can interpret shareholder payouts as a
financing choice that firms can employ to boost ROE, but where we are more likely to find
a statistically measurable effect than in leverage. This variable is also of interest given that,
as Ito (2014) asserts, Japanese policy makers were eager to change Japanese corporations’
cash-hoarding cultures.
Column 6 reports that treated firms increased payouts by 0.59 percentage points. This
is large relative to the baseline, representing approximately a 21% increase relative to the
pre-period treatment-group mean. Relative to total cash on treatment firms’ balance sheets,
however, the magnitude of the effect is quite small, representing only 1.5% of the baseline.
This finding might explain why an effect driven through the shareholder-payouts channel is
statistically difficult to detect by examining financial leverage. Another possibility is that
the JPX400’s positive effects on earnings had a countervailing and positive effect on total
cash, lowering financial leverage.
Table 9 further examines whether managers attempted to improve ROE by managing
accruals or by cutting productive investments (e.g., Stein, 1989; Healy, 1985). We explore
these possibilities by estimating the incentive effects of the JPX400 on six different forward
outcome variables of interest: Accruals to Assets, Log NOA, R&D to Sales, Log Employees,
Log Average Employee Pay, and Log Book to Market. Each regression in the table employs
the main specification from Table 3, Column 5: DID in the dependent variable of interest
with firm-level controls and a control for the lagged dependent variable.
We do not find evidence in Column 1 that managers increased accruals in response to
their index-inclusion incentives. To the extent that such accrual-based earnings management
is expected to reverse, however, we would not necessarily expect a manager to boost ROE
in this way if the ultimate objective is to maximize the duration of the company’s JPX400
31

membership.
Alternatively, managers may be incentivized to change their real investments, such as
by shedding loss-making divisions, increasing market capitalization through acquisitions,
or reducing R&D expenses. In Column 2, we do not find evidence that index-inclusion
incentives drove managers to change firms’ net operating assets. Together with our evidence
on net shareholder payouts, firms did not appear to seek increasing market capitalization as a
primary means of attaining index inclusion. Column 3 shows, however, that index-inclusion
incentives are associated with a decline in R&D. The point estimate of -.0011 is significant
at the 10% level and indicates a 7.05% reduction in R&D intensity relative to the treatment
group’s pre-period mean. We are unable to ascertain whether these cuts represent a form
of real earnings management or an improvement in R&D discipline. Nevertheless, cutting
discretionary expenses like R&D does not appear to be the main driver of companies’ efforts
to improve margins and ROE: this effect explains about 15% of the average treatment effect
on profit-margin improvement.
Columns 4 and 5 examine firm-level employment and employee pay. We do not find ev-
idence of significant changes in either of these variables as a result of firms’ index-inclusion
incentives. That managers did not improve ROE by cutting employees or employee compen-
sation is consistent with the stickiness of wages and the tradition of long-term employment
in Japan.
Finally, Column 6 examines the market’s assessment of the activities that managers en-
gaged in to improve ROE—namely, improving ROA and profit margins, in part by cutting
R&D intensity. We do so by estimating the treatment effect on Log Book to Market. The
point estimate of -.028 represents a 2.8% improvement in book-to-market relative to the
pre-period treatment-group mean, and is statistically significant at the 10% level. In con-
32

junction with Table 5, our finding supports the hypothesis that improvement in ROE for
treatment firms, not inclusion in the index per se, led to an upward revision in the market’s
expectations about their future cash flows, in spite of the decline in R&D intensity. These
results also suggest that this revision was not compensated for by a commensurate increase
in expectations of firm risk.
5. Discussion
We synthesize and provide a discussion of the empirical results in the paper.
5.1. Overall Evaluation of the Index
We begin with the aggregate effect of the index. For this purpose, we estimate a simple
DID in forward net income using our baseline treatment and control groups, and find an on-
average annual firm-level improvement in net income of JPY6.0 billion, which is significant at
the 5% level. Aggregating across the 200 firms in the treatment group implies an aggregate
net income effect of JPY1.2 trillion per year. This amount represents an 8.9% increase
relative to pre-period aggregate income across all Japanese public firms, and about 16% of
the overall increase in corporate profits over our post-period.
To estimate total shareholder-wealth effects, we multiply this estimated net-income effect
by a range of incremental price-to-earnings (P/E) multiples. A very conservative ratio on the
new profits generated by the JPX400 would be 1. Under this assumption, the total wealth
effect for the three years in our post-period would be JPY3.6 trillion, or a 0.77% increase
relative to overall market capitalization in 2014. A less conservative incremental P/E ratio
33

would be the treatment firms’ cash-adjusted P/E ratio: (MCap − Cash)/NetIncome.15
This would imply a valuation impact of JPY61.45 trillion, or approximately 13.10% of total
market capitalization in June 2014. The midpoint between those two estimates, 6.94%,
would account for about 20% of overall market-capitalization growth in Japan since the
introduction of the index. These back-of-the-envelope estimates are assumption-dependent,
and as such only approximations of the magnitude of the JPX400’s effects. At face value,
they suggest that the creation of the JPX400 had a meaningful aggregate impact.
However, our findings also suggest possible flaws or tradeoffs in the design of the JPX400
index. First, only a limited number of Japanese firms were “in the mix” and thus incentivized
to compete for inclusion each year. We find that firms’ efforts to improve ROE decline with
their distance from the threshold of inclusion/exclusion (see Table 3, Column 5), and that,
using firms ranked 501–800 as a benchmark, “safe” included firms (ranked 1–300) generated
no measurable improvement in ROE (Table 3, Column 3). If the regulators had designed the
index rules so that more firms had a realistic probability of winning or losing inclusion, more
firms might have exerted effort to improve their performance. (Although widening the “in-
centive bandwidth” in this way could also generate undesirable tradeoffs.) Second, although
the market-valuation results show that the market did not perceive treated firms’ overall
efforts as shareholder-value-destructive, competition for inclusion over a longer time horizon
might induce firms to seek undesirable channels to boost ROE as they exhaust relatively
easy avenues for improving profitability. In other words, although the index appears to be
15Applying an incremental P/E of 1 to the new profits would be appropriate if the markets perceived theearnings boost as completely unsustainable and unlikely to generate any internal alpha if reinvested. Thealternative, firms’ cash-adjusted P/E, is justified under the assumptions that (a) the market values Japanesecorporations’ cash holdings 1-for-1, such that the cash-adjusted P/E ratio captures the market’s valuationof the companies’ earnings; and (b) because the market perceives the income effect as sustainable, expectedgrowth of and discount rates on the incremental profitability remain fixed. The average cash-adjusted P/Emultiple for treated firms in the post period is 17.07.
34

effective at incentivizing managers to change behavior, the focus on ROE as a performance
metric could ultimately lead managers to respond in value destructive ways.
5.2. External Validity of Findings
The JPX400 appears to have been effective at motivating managers to improve ROE,
but the extent to which these findings apply to other indices and to non-Japanese settings
remains an open question. The notion that a stock index serving as a gauge of virtuous
firms could incentivize managers to change behavior is, we believe, at minimum applicable
to East Asian economies, such as China, Korea, Singapore, or Taiwan, that share cultural
roots with Japan (as well as patterns of low capital efficiency and weak de facto shareholder
rights).
Whether such incentive effects can be expected in Western economies is more speculative.
Decisions by the S&P Dow Jones and the FTSE Russell in mid-2017 to exclude certain firms
with classified shares from their main indexes, and the increasing number of stock indexes
based on Environmental, Social, and Governance themes, suggest a hope that the promise
of index inclusion—when it can be influenced by direct managerial action—can motivate
managers to change their behavior. And in the West, as in Japan, status and reputation
could be important reasons why managers do so. In an interview with one of us, David
Blitzer—the head of the Index Committee at S&P Dow Jones—cited two main reasons why
he believes U.S. managers might be willing to change corporate policies to gain S&P500
membership: “managerial ego” and “a stable shareholder base.”
Our finding that managers respond to status incentives is, we believe, broadly general-
izeable. This idea is not new: Adam Smith famously wrote that “rank among our equals, is,
perhaps, the strongest of all our desires” (Smith, 1759). Recent empirical evidence confirms
35

that this desire explains significant managerial decisions. For example, examining a sample
of U.S. executives who engaged in large acquisitions between 1986 to 1988, Avery et al.
(1998) suggests that CEOs’ acquisitions are rewarded not with compensation gains but with
enhanced prestige and standing in the business community. The more recent work of Focke
et al. (2017) documents that U.S. CEOs working at more prestigious firms (firms on For-
tune’s most admired companies list) receive on average 8% lower compensation, and suggests
that U.S. CEOs are willing to trade off monetary compensation for the status of working for
a publicly admired company. Masulis and Mobbs (2014) shows that independent directors
care more about and pay greater attention to their more prestigious directorships. This
evidence, to which we contribute, implies that status incentives can be actively employed to
influence the behavior of corporate managers.
6. Conclusion
This paper provides evidence that the JPX400 was effective at changing certain firms’
behavior. The index—thanks to the certification provided by the GPIF and reinforced by the
media—came to be seen as a virtuous club of Japan’s best-run companies. And managers
competed to be included by improving their profitability and capital efficiency, due in part
to reputational concerns: the prestige of inclusion and fear of the shame of exclusion.
The long-run effects of the JPX400 on Japanese corporations remain to be seen. Goode
(1978) observes that changes in social norms tend to be precipitated by a shift in the behavior
of a small group of respected elites. Thus one possibility is that, by incentivizing some of
the most respected firms in the Japanese market (e.g., those in the Nikkei225) to change
their behavior, the JPX400 could instigate a broader shift in corporate norms toward more
36
shareholder-friendly policies and improved capital efficiency. Another possibility is that the
index’s focus on ROE could lead to perverse and myopic behavior that harms aggregate
economic growth in the long run.
But the surprising efficacy of the index to date points to the potential of this alternative
corporate-governance mechanism. Given growing calls in the United States and Europe to
limit executive compensation, a move that could constrain formal incentives, it may become
increasingly important to understand and develop novel mechanisms for shaping corporate
behavior. We look forward to further research in this area.
37

References
Amihud, Y. (2002). Illiquidity and stock returns: Cross-section and time-series effects.Journal of Financial Markets 5 (1), 31–56.
Aoki, M., G. Jackson, and H. Miyajima (2007). Corporate Governance in Japan: InstitutionalChange and Organizational Diversity (1 ed.). Oxford, U.K.: Oxford University Press.
Appel, I. R., T. A. Gormley, and D. B. Keim (2016). Passive Investors, Not Passive Owners.Journal of Financial Economics 121 (215), 111–141.
Avery, C., J. A. Chevalier, and S. Schaefer (1998). Why Do Managers Undertake Acquisi-tions? An Analysis of Internal and External Rewards for Acquisitiveness. Journal of Law,Economics, & Organization 14 (1), 24–43.
Barbon, A. and V. Gianinazzi (2017). Quantitative Easing and Equity Prices: Evidencefrom the ETF Program of the Bank of Japan. Working Paper .
Bebchuk, L. A. and K. Kastiel (2017). The Untenable Case for Perpetual Dual-Class Stock.Virginia Law Review 103, 585–631.
Ben-David, I., F. Franzoni, and R. Moussawi (2018). Do ETFs Increase Volatility? Journalof Finance (Forthcoming).
Boone, A. L. and J. T. White (2015). The effect of institutional ownership on firm trans-parency and information production. Journal of Financial Economics 117 (3), 508–533.
Buchanan, J., D. H. Chai, and S. Deakin (2013). Hedge Fund Activism in Japan: The Limitsof Shareholder Primacy (1 ed.). Cambridge, UK: Cambridge University Press.
Casas-Arce, P. and F. A. Martınez-Jerez (2009). Relative Performance Compensation, Con-tests, and Dynamic Incentives. Management Science 55 (8), 1306–1320.
Chang, Y.-C., H. Hong, and I. Liskovich (2015). Regression Discontinuity and the PriceEffects of Stock Market Indexing. Rev. Financ. Stud. 28 (1), 212–246.
Chen, H., G. Noronha, and V. Singal (2004). The price response to S&P 500 index additionsand deletions: Evidence of asymmetry and a new explanation. Journal of Finance 59 (4),1901–1929.
Da, Z. and S. Shive (2018). Exchange traded funds and asset return correlations. EuropeanFinancial Management 24 (1), 136–168.
38

Dai, L., J. T. Parwada, and B. Zhang (2015). The governance effect of the media’s newsdissemination role: Evidence from insider trading. Journal of Accounting Research 53 (2),331–366.
Doh, J. P., S. D. Howton, S. W. Howton, and D. S. Siegel (2009). Does the Market Respondto an Endorsement of Social Responsibility? The Role of Institutions, Information, andLegitimacy. Journal of Management 36 (6), 1461–1485.
Dyck, A., N. Volchkova, and L. Zingales (2008). The Corporate Governance Role of theMedia: Evidence from Russia. Journal of Finance 63 (3), 1093–1135.
Focke, F., E. Maug, and A. Niessen-Ruenzi (2017). The impact of firm prestige on executivecompensation. Journal of Financial Economics 123 (2), 313–336.
Goode, W. J. (1978). The celebration of heroes: Prestige as a social control system. Universityof California Press.
Gow, I., C. C. Wang, N. Jinjo, and N. Sato (2017). Misaki Capital and Sangetsu Corporation.Harvard Business School Case 9-117-007 , 1–26.
Greenwood, R. (2008). Excess comovement of stock returns: Evidence from cross-sectionalvariation in Nikkei 225 weights. Review of Financial Studies 21 (3), 1153–1186.
Guiso, L., P. Sapienza, and L. Zingales (2015a). Corporate Culture, Societal Culture, andInstitutions. American Economic Review: Papers & Proceedings 105 (5), 336–339.
Guiso, L., P. Sapienza, and L. Zingales (2015b). The value of corporate culture. Journal ofFinancial Economics 117 (1), 60–76.
Hamm, S. J. W. (2014). The Effect of ETFs on Stock Liquidity. Working Paper .
Harris, L. and E. Gurel (1986). Price and Volume Effects Associated with Changes in the S&P500 List: New Evidence for the Existence of Price Pressures. Journal of Finance 41 (4),815–829.
Healy, P. M. (1985). The effect of bonus schemes on accounting decisions. Journal ofAccounting and Economics 7, 85–107.
Israeli, D., C. M. Lee, and S. A. Sridharan (2017). Is There a Dark Side to Exchange TradedFunds (ETFs)? An Information Perspective. Review of Accounting Studies 22, 1048–1083.
Ito, K. (2014). Ito Review of Competitiveness and Incentives for Sustainable Growth. Tech-nical report.
39

Kato, T. and K. Kubo (2006). CEO compensation and firm performance in Japan: Evidencefrom new panel data on individual CEO pay. Journal of the Japanese and InternationalEconomies 20 (1), 1–19.
Lewis, L. (2017). Sony’s re-entry to JPX-Nikkei 400 exposes flaws of club rules. FinancialTimes (August 9).
Malmendier, U. and G. Tate (2009). Superstar CEOs. Quarterly Journal of Eco-nomics 124 (4), 1593–1638.
Masulis, R. W. and S. Mobbs (2014). Independent director incentives: Where do talenteddirectors spend their limited time and energy. Journal of Financial Economics 111 (2),406–429.
McLannahan, B. (2014). Japan groups take a shine to JPX-Nikkei 400 index. FinancialTimes (June 14).
Modigliani, F. and M. H. Miller (1958). The Cost of Capital, Corporation Finance and theTheory of Investment. American Economic Review 48 (3), 261–297.
Nakazato, M., J. M. Ramseyer, and E. B. Rasmusen (2011). Executive Compensation inJapan: Estimating Levels and Determinants from Tax Records. Journal of Economics andManagement Strategy 20 (3), 843–885.
Oster, E. (2017). Unobservable Selection and Coefficient Stability: Theory and Validation.Journal of Business & Economic Statistics , 1–18.
Raff, K. and L. Siming (2017). Knighthoods, damehoods, and CEO behaviour. Journal ofCorporate Finance, Forthcoming .
Shleifer, A. (1986). Do Demand Curves for Stocks Slope Down? Journal of Finance 41 (3),579–590.
Smith, A. (1759). The Theory of Moral Sentiments. London: Printed for A. Millar, and A.Kincaid and J. Bell.
Stein, J. C. (1989). Efficient capital markets, inefficient firms: a model of myopic corporatebehavior. Quarterly Journal of Economics November, 655–669.
Toyoda, K. (2014). Change for the Better: Corporate Governance in Japan. SchrodersTalkingPoint .
Yoshimori, M. (1995). Whose company is it? The concept of the corporation in Japan andthe west. Long Range Planning 28 (4).
40

Zingales, L. (2015). Presidential Address: Does Finance Benefit Society? Journal of Fi-nance 70 (4), 1327–1363.
41

Fig. 1. Placebo Tests by Time
Figure 1 displays the results of placebo versions of our main analysis. We use historical data dating back to1991 to synthetically create JPX400 ranks and implement our main difference-in-differences test for six setsof years prior to the launch of the JPX400 in 2013. We mimic the temporal structure of our main analyses,and include seven years for each placebo test: three pre-treatment years and three post-treatment years; thetreatment year is excluded. The figure reports the point estimate and the 95% confidence intervals for sixplacebo tests. The y-axis reports the magnitudes of the estimated treatment effect; the x-axis reports themid-point or the dropout year of the seven-year window around which the treatment effect is estimated. Thefirst placebo test uses data from 1994–2000, with 1994–1996 as the pre-placebo-treatment period, 1998–1999as the post-placebo-treatment period, and 1997 as the midpoint and dropout year. The remaining placebotests roll forward the window of examination by three years so that the three-year pre-placebo-treatmentwindows are non-overlapping.
-0.1
-0.0
50
0.05
0.1
Coe
ffici
ent o
n Tr
eat x
Pos
t
1997 2000 2003 2006 2009
Post-period indicator in time-placebo test
42

Appendix A Description of Variables
This table defines variables used in our analysis. Nikkei membership data is taken from https://
indexes.nikkei.co.jp/en/nkave/index/component. Average employee compensation and average execu-tive officers and directors compensation are drawn from a proprietary dataset collected by Toyo Kezai. Allother data are obtained from the Thomson Reuters Datastream database: Datastream variable codes arespecified in brackets in the Computation column.
Variable Description Computation
Accruals to Assets Ratio of total accruals to to-tal assets
(Net Income [WC07250] – Funds from Opera-tions [WC04201]) / Total Assets [WC02999]
Asset Turnover Asset turnover ratio Revenues [WC07240] / Total Assets[WC02999]
Cash to Equity Ratio of cash to total equity Cash & Short-Term Investments [WC02001] /Total Shareholders’ Equity [WC03995]
Dividends to Equity Ratio of dividends to equity Cash Dividends Paid [WC04551] / TotalShareholders’ Equity [WC03995]
Leverage Financial leverage (Long Term Debt [WC03251] - Cash & Short-Term Investments [WC02001]) / Total Share-holders’ Equity [WC03995]
Log Avg EE Pay Natural logarithm of the av-erage employee pay
ln(Average Employee Pay)
Log Avg Exec Pay Natural logarithm of the av-erage pay for executives anddirectors
ln(Average Executive Pay)
Log Book to Market Natural logarithm of book-to-market ratio
ln(Total Shareholders’ Equity [WC03995] /Market Value [MV])
Log Employees Natural logarithm of thenumber of employees
ln(Employees [WC07011])
Log Gross ROE Natural logarithm of gross re-turn on equity
ln(1 + ROE)
Log Illiquidity Natural logarithm of theAmihud (2002) illiquiditymeasure
ln(Daily Average of Absolute Return [RE-TURN] / Volume [VO])
43

Appendix A Continued
Variable Description Computation
Log Market Cap Natural logarithm of marketcapitalization
ln(Market Value [MV])
Log NOA Natural logarithm of net op-erating assets
ln(Long-Term Debt [WC03251] – Cash &Short-Term Investments [WC02001] + TotalShareholders’ Equity [WC03995])
LT Debt to Equity LT debt leverage Long-Term Debt [WC03251] / Total Share-holders’ Equity [WC03995]
Nikkei225 Nikkei225 indicator Indicator for a company’s inclusion in theNikkei225 index at the time of the JPX400 se-lection in the given year
No. of Media Articles Media mentions from Julythrough September
Unique number of “full articles” in Ravenpackwith a Relevance of more than 75 (as coded byRavenpack) in which the firm is indicated asreferenced
Profit Margin Net profit margin Net income [WC07250] / Revenues [WC07240]
R&D to Sales R&D intensity R&D Expenses [WC01201] / Revenues[WC07240]
Repurchases Estimated repurchases Funds to Decrease Common or PreferredStock [WC04751] – Change in Preferred Stock[WC03451]
ROA Return on assets Net Income [WC07250] / Total Assets[WC02999]
ROE Return on equity Net Income [WC07250] / Total Shareholders’Equity [WC03995]
Sales Growth Sales growth Revenues [WC07240] / Lagged Revenues[WC07240]
Shareholder Payouts Shareholder payout ratio (Repurchases + Cash Dividends Paid) / TotalShareholders’ Equity [WC03995]
Weighted No. of MediaArticles
Unique number of “full articles” in Ravenpackwith a Relevance of more than 25 (as coded byRavenpack) weighted by the Relevance
44

Appendix B Timeline, Selection of JPX400 Index Con-
stituents
This figure is a schematic representation of the timeline for the selection of JPX400’s constituent firms,relative to firm-level information, for each year of the index’s existence. Panel A traces the initial constructionof the index in 2013; Panel B traces the annual rebalancing from 2014 onward. Vertical lines indicateimportant dates.
Panel A: 2013
March
FundamentalsData Fixed
Data for InitialConstruction of the Index︷ ︸︸ ︷
June
Mcap and LiquidityData Fixed
November
OfficialAnnouncement
of the Creation ofthe JPX400
January, 2014
IndexCreation
Panel B: 2014+
March
FundamentalsData Fixed
Data forIndex Rebalancing︷ ︸︸ ︷
June
Mcap and LiquidityData Fixed
Selection
August
IndexRebalance
45

Appendix C Sample Construction
This figure is a schematic representation of the process we use to construct our baseline analysis sample.Steps 1 and 2 mimic the JPX400 selection algorithm, which we follow as closely as possible using the JPX’sdescription of its ranking process. For each sample year, we first identiy the top 1,200 firms by “tradingvalue” (share volume scaled by price per share), and then select the 1,000 largest by market capitalization.We then follow the JPX400 ranking algorithm to compute a synthetic JPX400 rank for each of the 1,000firms. Step 3 describes how we assign treatment status based on this synthetic JPX400 ranking. The top400 firms are our predicted JPX400 constituents. For our baseline analysis, we classify firms with ranks of301–500 as the treatment group, and firms with ranks of 501–800 as the control group. We do not includefirms with ranks of 1–300 or 801–1,000 in our baseline analysis but do include them in robustness tests.
Step 1: Each June, select the top 1,000 firms, by market capitalization, from the top 1,200 firmsby “trading value.”
Step 2: Predict JPX400 ranks using fundamental data available as of March and market dataavailable as of June.
Step 3: Construct baseline treatment and control sample.
1 100 200
︷ ︸︸ ︷Predicted JPX400 Constituents
︸ ︷︷ ︸Dropped
300 400︸ ︷︷ ︸Treat = 1
500 600︸ ︷︷ ︸Treat = 0
700 800 900 1,000︸ ︷︷ ︸Dropped
46

Table 1. Predicting JPX400 Membership
Columns 1 and 2 report estimates from OLS regressions of JPX400 Member—an indicator for whether a firmis selected for the JPX400—on Above Cutoff, an indicator for whether a firm’s synthetic rank falls between1 and 400. In Columns 3 and 4, Above Cutoff is disaggregated into two indicators, which specify whether afirm’s synthetic rank falls within 1–200 or within 201–400. Two other indicators—for ranks within 401–600and over 800—are also included in these regressions. Columns 2 and 4 include other specified firm-levelcontrols. The sample consists of firms with synthetic ranks of 1–2,000 in the years 2013–2016. Standarderrors, clustered at the firm level, are reported in parentheses. Significance levels are indicated by ∗, ∗∗, and∗∗∗ for 10%, 5%, and 1% respectively.
(1) (2) (3) (4)JPX400 Member JPX400 Member JPX400 Member JPX400 Member
Above Cutoff 0.923∗∗∗ 0.864∗∗∗
(0.01) (0.01)Rank 1–200 0.991∗∗∗ 0.949∗∗∗
(0.00) (0.01)Rank 201 – 400 0.879∗∗∗ 0.857∗∗∗
(0.01) (0.02)Rank 401 – 600 0.0542∗∗∗ 0.0457∗∗∗
(0.01) (0.01)Rank outside 800 0.00488∗∗∗ 0.0315∗∗∗
(0.00) (0.01)Log Market Cap 0.0217∗∗∗ 0.0185∗∗∗
(0.00) (0.00)Log Book to Market -0.00180 -0.000153
(0.00) (0.00)Sales Growth -0.000275 0.00115
(0.01) (0.01)LT Debt to Equity -0.00120 -0.000453
(0.00) (0.00)Cash to Equity 0.00134 -0.0000954
(0.00) (0.00)Observations 7,110 7,110 7,110 7,110R2 0.869 0.872 0.874 0.876
47
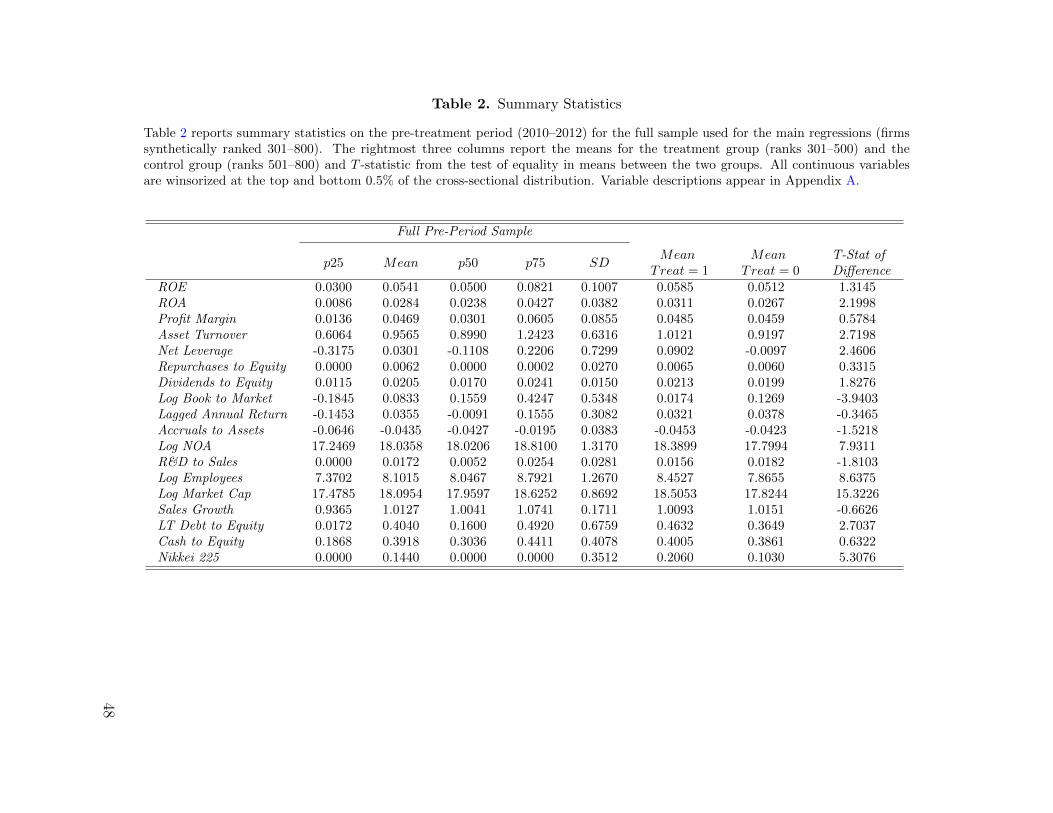
Table 2. Summary Statistics
Table 2 reports summary statistics on the pre-treatment period (2010–2012) for the full sample used for the main regressions (firmssynthetically ranked 301–800). The rightmost three columns report the means for the treatment group (ranks 301–500) and thecontrol group (ranks 501–800) and T -statistic from the test of equality in means between the two groups. All continuous variablesare winsorized at the top and bottom 0.5% of the cross-sectional distribution. Variable descriptions appear in Appendix A.
Full Pre-Period Sample
p25 Mean p50 p75 SDMean
Treat = 1Mean
Treat = 0T-Stat ofDifference
ROE 0.0300 0.0541 0.0500 0.0821 0.1007 0.0585 0.0512 1.3145ROA 0.0086 0.0284 0.0238 0.0427 0.0382 0.0311 0.0267 2.1998Profit Margin 0.0136 0.0469 0.0301 0.0605 0.0855 0.0485 0.0459 0.5784Asset Turnover 0.6064 0.9565 0.8990 1.2423 0.6316 1.0121 0.9197 2.7198Net Leverage -0.3175 0.0301 -0.1108 0.2206 0.7299 0.0902 -0.0097 2.4606Repurchases to Equity 0.0000 0.0062 0.0000 0.0002 0.0270 0.0065 0.0060 0.3315Dividends to Equity 0.0115 0.0205 0.0170 0.0241 0.0150 0.0213 0.0199 1.8276Log Book to Market -0.1845 0.0833 0.1559 0.4247 0.5348 0.0174 0.1269 -3.9403Lagged Annual Return -0.1453 0.0355 -0.0091 0.1555 0.3082 0.0321 0.0378 -0.3465Accruals to Assets -0.0646 -0.0435 -0.0427 -0.0195 0.0383 -0.0453 -0.0423 -1.5218Log NOA 17.2469 18.0358 18.0206 18.8100 1.3170 18.3899 17.7994 7.9311R&D to Sales 0.0000 0.0172 0.0052 0.0254 0.0281 0.0156 0.0182 -1.8103Log Employees 7.3702 8.1015 8.0467 8.7921 1.2670 8.4527 7.8655 8.6375Log Market Cap 17.4785 18.0954 17.9597 18.6252 0.8692 18.5053 17.8244 15.3226Sales Growth 0.9365 1.0127 1.0041 1.0741 0.1711 1.0093 1.0151 -0.6626LT Debt to Equity 0.0172 0.4040 0.1600 0.4920 0.6759 0.4632 0.3649 2.7037Cash to Equity 0.1868 0.3918 0.3036 0.4411 0.4078 0.4005 0.3861 0.6322Nikkei 225 0.0000 0.1440 0.0000 0.0000 0.3512 0.2060 0.1030 5.3076
48

Table 3. Treatment Effects in ROE
Table 3 reports the estimates of DID regressions using Forward ROE as the dependent variable. Treat is an indicator variablethat evaluates to one for firms ranked 301–500 under our replication of the JPX400 ranking algorithm and to zero for firms ranked501–800; Post is an indicator variable that evaluates to one for the years 2014–2016 and to zero for the pre-treatment period,2010–2012. Column 1 reports a baseline specification with no controls or fixed effects; Column 2 adds year-fixed effects; and Column3 adds industry-fixed effects, where industry is defined by Datastream’s Industry Level 3 Name (INDM3). Column 4 adds specifiedfirm-level controls; Column 5 adds firm-level contemporaneous ROE as a control; and Column 6 substitutes the log of ROE for ROE,both as the forward outcome variable of interest and the contemporaneous control. All firm-level control variables are defined inAppendix A. Standard errors, clustered at the firm level, are reported in parentheses. Significance levels are indicated by ∗, ∗∗, and∗∗∗ for 10%, 5%, and 1% respectively.
(1) (2) (3) (4) (5) (6)Forward ROE Forward ROE Forward ROE Forward ROE Forward ROE Log gross forward ROE
Treat x Post 0.028∗∗∗ 0.028∗∗∗ 0.025∗∗∗ 0.025∗∗∗ 0.024∗∗∗ 0.040∗∗∗
(0.01) (0.01) (0.01) (0.01) (0.01) (0.01)Treat -0.006 -0.006 -0.005 0.007 -0.005 -0.009
(0.01) (0.01) (0.01) (0.01) (0.01) (0.01)Post 0.018∗∗∗
(0.01)ROE 0.384∗∗
(0.15)Log gross ROE 0.240∗
(0.15)Log market cap -0.026∗∗∗ -0.013∗∗ -0.021∗∗
(0.00) (0.01) (0.01)Log book to market -0.069∗∗∗ -0.045∗∗∗ -0.047∗∗∗
(0.01) (0.01) (0.01)Sales growth 0.038∗∗ -0.011 0.005
(0.02) (0.02) (0.04)LT debt to equity -0.013∗ -0.007 -0.034∗
(0.01) (0.00) (0.02)Cash to equity -0.016 -0.001 -0.014
(0.01) (0.01) (0.01)Time FE No Yes Yes Yes Yes YesIndustry FE No No Yes Yes No NoObservations 2,783 2,783 2,783 2,783 2,783 2,778R2 0.0221 0.0219 0.0514 0.2472 0.3031 0.1455
49

Table 4. Testing the Identifying Assumption
Table 4 reports the results of various regressions testing the identifying assumption of our main tests in Table3. Column 1 adds two additional interaction terms—Treat x (Year = 2011) and Treat x (Year = 2012)—tothe main DID specification (Table 3), Column 5, to test differences in pre-treatment trends. Column 2estimates the main DID specification but splits Treat into two types—firms ranked 301–400 (Rank 301–400 )and 401-500 (Rank 401–500 )—and estimates separate treatment effects. The F -statistic and correspondingp-value for a test of equality of the two DID coefficients are reported in the bottom two rows. Column3 estimates the main DID specification using an expanded sample that includes firms ranked 1–300 andestimates a separate treatment effect for these firms. The F -statistic, and its corresponding p-value, from atest of equality between the two DID coefficients are reported in the bottom two rows. Column 4 estimatesthe main DID specification using a sample of firms ranked 1301–1800, where the treatment firms are thoseranked 1301–1500 and the control firms are those ranked 1501–1800. Column 5 expands the Column 2 sampleto include all the top 1000 firms and uses an alternative, more continuous, treatment intensity variable—Quintile(Closeness)— indicating which quintile a firm falls into in terms of its closeness to the rank of 400.All firm-level control variables are defined in Appendix A. Standard errors, clustered at the firm level, arereported in parentheses. Significance levels are indicated by ∗, ∗∗, and ∗∗∗ for 10%, 5%, and 1% respectively.
(1) (2) (3) (4) (5)Forward
ROEForward
ROEForward
ROEForward
ROEForward
ROETreat x Post 0.022∗∗ 0.023∗∗∗
(0.01) (0.01)Treat x (Year = 2011) -0.005
(0.01)Treat x (Year = 2012) -0.000
(0.01)Treat -0.003 -0.009
(0.01) (0.01)Treat x Rank 301-400 x Post 0.027∗∗∗
(0.01)Treat x Rank 401-500 x Post 0.024∗∗
(0.01)Treat x Rank 301-400 0.000
(0.01)Treat x Rank 401-500 -0.008
(0.01)Rank 1-300 x Post 0.006
(0.01)Rank 1-300 0.014
(0.01)Placebo Group Treat x Post 0.002
(0.01)Placebo Group Treat 0.020∗∗∗
(0.01)Quintile(Closeness) x Post 0.006∗∗
(0.00)Quintile(Closeness) -0.000
(0.00)ROE 0.384∗∗ 0.379∗∗ 0.439∗∗∗ 0.171∗∗ 0.373∗∗∗
(0.15) (0.15) (0.12) (0.07) (0.05)Time FE Yes Yes Yes Yes YesFirm Controls Yes Yes Yes Yes YesObservations 2,783 2,783 4,462 2,885 5,546R2 0.3026 0.3040 0.3532 0.1196 0.2630F-stat 0.059 7.719p-value 0.808 0.006
50

Table 5. Consequences of Index Inclusion: Performance, Compensation, and Capital Market Outcomes
Table 5 reports the results of regressions estimating the effect of realized index inclusion on a variety of monetary and financialoutcome variables. For these tests, the sample consists of firms that are tightly ranked around the threshold of inclusion, firms ranked351-450. Since we are interested in the effects of realized inclusion, and our dependent variables are forward variables measured at anannual horizon, we use only our post-period, years 2014-2016. The independent variable of interest is JPX400 Member, an indicatorfor whether the firm was actually included in the index in that year. We use the same controls for each regression in this table:Centered Rank, which is equal to the firm’s synthetic rank minus 400, Log Market Cap, and ROE. We include time and industryfixed effects throughout. The dependent variables in Columns 1 through 6 are Forward ROE, Forward Sales Growth, Forward LogExecutive Compensation, Forward Log Average Employee Compensation, Forward Log Illiquidity, and Forward Log BM, respectively.All firm-level controls and outcome variables are defined in Appendix A. Standard errors, clustered at the firm level, are reported inparentheses. Significance levels are indicated by ∗, ∗∗, and ∗∗∗ for 10%, 5%, and 1% respectively.
(1) (2) (3) (4) (5) (6)Forward Forward Forward Log Forward Log Forward Log Forward Log
ROE Sales Growth Exec Comp EE Comp Illiquidity BMJPX400 Member -0.003 0.020 0.077 0.006 0.064 0.032
(0.01) (0.02) (0.08) (0.03) (0.13) (0.08)Centered Rank -0.000 0.000 -0.000 -0.000 0.001 0.001
(0.00) (0.00) (0.00) (0.00) (0.00) (0.00)Log Market Cap 0.011*** 0.006 0.270*** 0.065*** -1.111*** -0.217***
(0.00) (0.01) (0.04) (0.02) (0.10) (0.05)ROE 0.871*** 0.172 0.180 -0.228 -1.098 -6.029***
(0.09) (0.23) (0.66) (0.26) (1.21) (0.93)Time FE Yes Yes Yes Yes Yes YesInd FE Yes Yes Yes Yes Yes YesObservations 299 299 299 299 299 299R2 0.4914 0.2171 0.2182 0.2411 0.6013 0.4421
51
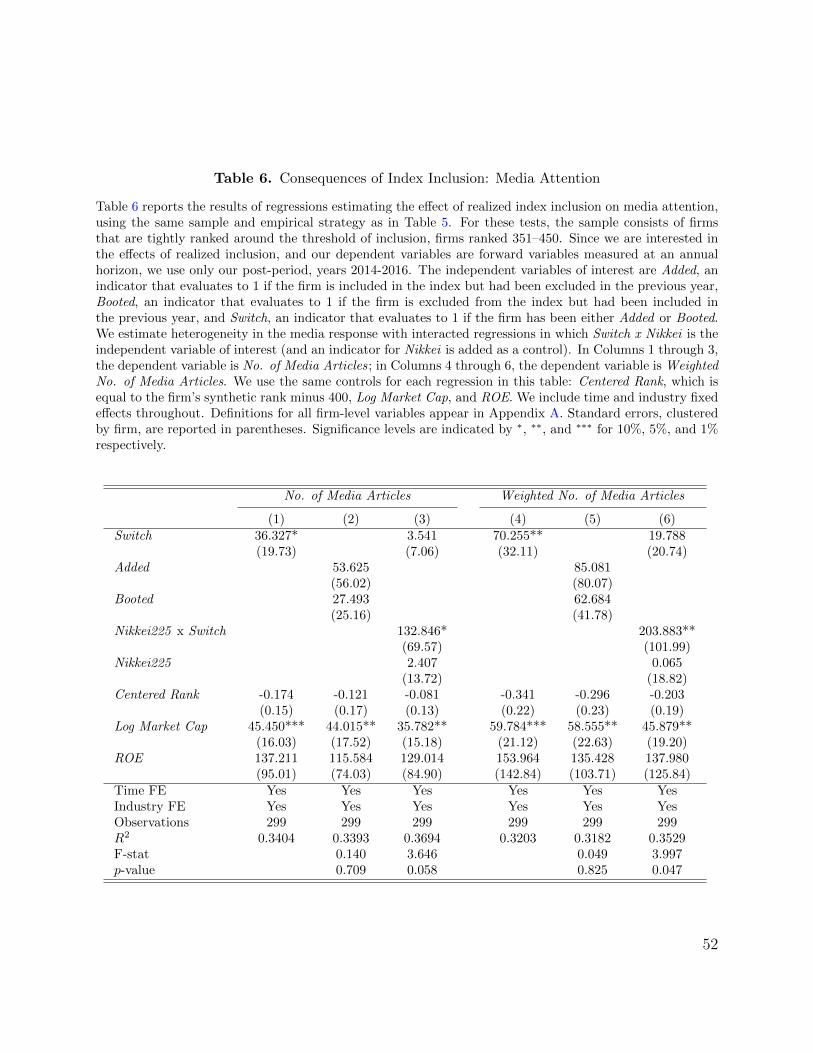
Table 6. Consequences of Index Inclusion: Media Attention
Table 6 reports the results of regressions estimating the effect of realized index inclusion on media attention,using the same sample and empirical strategy as in Table 5. For these tests, the sample consists of firmsthat are tightly ranked around the threshold of inclusion, firms ranked 351–450. Since we are interested inthe effects of realized inclusion, and our dependent variables are forward variables measured at an annualhorizon, we use only our post-period, years 2014-2016. The independent variables of interest are Added, anindicator that evaluates to 1 if the firm is included in the index but had been excluded in the previous year,Booted, an indicator that evaluates to 1 if the firm is excluded from the index but had been included inthe previous year, and Switch, an indicator that evaluates to 1 if the firm has been either Added or Booted.We estimate heterogeneity in the media response with interacted regressions in which Switch x Nikkei is theindependent variable of interest (and an indicator for Nikkei is added as a control). In Columns 1 through 3,the dependent variable is No. of Media Articles; in Columns 4 through 6, the dependent variable is WeightedNo. of Media Articles. We use the same controls for each regression in this table: Centered Rank, which isequal to the firm’s synthetic rank minus 400, Log Market Cap, and ROE. We include time and industry fixedeffects throughout. Definitions for all firm-level variables appear in Appendix A. Standard errors, clusteredby firm, are reported in parentheses. Significance levels are indicated by ∗, ∗∗, and ∗∗∗ for 10%, 5%, and 1%respectively.
No. of Media Articles Weighted No. of Media Articles
(1) (2) (3) (4) (5) (6)Switch 36.327* 3.541 70.255** 19.788
(19.73) (7.06) (32.11) (20.74)Added 53.625 85.081
(56.02) (80.07)Booted 27.493 62.684
(25.16) (41.78)Nikkei225 x Switch 132.846* 203.883**
(69.57) (101.99)Nikkei225 2.407 0.065
(13.72) (18.82)Centered Rank -0.174 -0.121 -0.081 -0.341 -0.296 -0.203
(0.15) (0.17) (0.13) (0.22) (0.23) (0.19)Log Market Cap 45.450*** 44.015** 35.782** 59.784*** 58.555** 45.879**
(16.03) (17.52) (15.18) (21.12) (22.63) (19.20)ROE 137.211 115.584 129.014 153.964 135.428 137.980
(95.01) (74.03) (84.90) (142.84) (103.71) (125.84)Time FE Yes Yes Yes Yes Yes YesIndustry FE Yes Yes Yes Yes Yes YesObservations 299 299 299 299 299 299R2 0.3404 0.3393 0.3694 0.3203 0.3182 0.3529F-stat 0.140 3.646 0.049 3.997p-value 0.709 0.058 0.825 0.047
52

Table 7. Treatment Effects in ROE for Nikkei vs. Non-Nikkei
Table 7 reports the results of estimating difference-in-difference-in-differences specifications (equation 3),testing for differential treatment response of Nikkei225 firms. In all columns we include time-fixed effects,firm controls, and contemporaneous ROE (as in our main specification, from Column 5 of Table 3). Tdenotes the treatment variable used for a particular specification. In Column 1, we use our main treatmentand control definition, with firms ranked 301–500 as T with firms ranked 501–800 included in the estimationsample as controls. In Column 2, we add firms ranked 1–300 to the estimation sample as controls. InColumn 3, we additionally add firms ranked 801–1,000 as controls (i.e., use the full “ranked set” as theestimation sample). In Column 4, we use the full ranked set, but use our more continuous measure oftreatment intensity (Quintile(Closeness)) as T. All firm-level controls and outcome variables are defined inAppendix A. Standard errors, clustered at the firm level, are reported in parentheses. Significance levels areindicated by +, ∗, ∗∗, and ∗∗∗ for 15%, 10%, 5%, and 1% respectively.
(1) (2) (3) (4)Dep Var : Forward Forward Forward Forward
ROE ROE ROE ROET : Treat Treat Treat Quintile(Closeness)T x Nikkei225 x Post 0.038+ 0.042* 0.050** 0.015*
(0.03) (0.02) (0.02) (0.01)T x Post 0.014** 0.012** 0.012** 0.003
(0.01) (0.01) (0.01) (0.00)T x Nikkei225 -0.051** -0.050** -0.055** -0.017***
(0.02) (0.02) (0.02) (0.01)Nikkei225 x Post 0.013 0.010 0.006 -0.018
(0.02) (0.01) (0.01) (0.02)Nikkei225 0.006 -0.001 -0.007 0.019+
(0.01) (0.00) (0.01) (0.01)T 0.004 -0.005 0.001 0.003+
(0.01) (0.00) (0.00) (0.00)ROE 0.380*** 0.450*** 0.373*** 0.366***
(0.15) (0.11) (0.05) (0.05)Log Market Cap -0.011* -0.003+ 0.001 0.000
(0.01) (0.00) (0.00) (0.00)Log Book to Market -0.045*** -0.045*** -0.049*** -0.048***
(0.01) (0.01) (0.01) (0.01)Sales Growth -0.012 -0.012 -0.014 -0.013
(0.02) (0.02) (0.01) (0.01)LT Debt to Equity -0.007 -0.003 -0.003 -0.004
(0.00) (0.00) (0.00) (0.00)Cash to Equity 0.001 0.005 0.003 0.003
(0.01) (0.00) (0.00) (0.00)Time FE Yes Yes Yes YesObservations 2,783 4,462 5,546 5,546R2 0.3084 0.3557 0.2656 0.2663Sample 301-800 1-800 1-1000 1-1000
53

Table 8. Drivers of ROE
Table 8 reports the results of DID regressions following the specification in Table 3, Column 5, but using as dependent variablesdrivers of one-year-ahead ROE —Sales Growth, ROA, Profit Margin, Asset Turnover, Leverage, and Shareholder Payouts. As inTable 3, Treat is an indicator variable that is set to one for firms ranked 301–500 under our replication of the JPX400 selectionalgorithm and zero for firms ranked 501–800; Post is an indicator variable that is set to one for the years 2014–2016 and zero for thepre-treatment period, 2010–2012. The starting sample for all of these analyses is the one for which all variables used in the baselineanalysis—Table 3, Columns 3-5—are available. All firm-level control variables are defined in Appendix A. Standard errors, clus-tered at the firm level, are reported in parentheses. Significance levels are indicated by ∗, ∗∗, and ∗∗∗ for 10%, 5%, and 1% respectively.
(1) (2) (3) (4) (5) (6)Forward
Sales GrowthForward
ROAForward
Profit MarginForward
Asset TurnoverForwardLeverage
ForwardPayout
Treat x Post 0.0065 0.0053∗∗ 0.0074∗∗ 0.0047 -0.0048 0.0059∗∗
(0.010) (0.002) (0.004) (0.008) (0.016) (0.003)Treat -0.0224∗∗ -0.0020 -0.0147∗∗∗ -0.0161∗∗∗ 0.0077 -0.0039∗∗∗
(0.009) (0.002) (0.003) (0.006) (0.013) (0.001)Sales Growth -0.0017 -0.0167∗∗ -0.0402∗∗∗ -0.0109 0.0728∗∗ 0.0071
(0.035) (0.007) (0.010) (0.026) (0.034) (0.007)ROA 0.5307∗∗∗
(0.058)Profit Margin 0.8153∗∗∗
(0.063)Asset Turnover 0.9564∗∗∗
(0.007)Repurchases to Equity 0.0147
(0.033)Dividends to Equity 0.9491∗∗∗
(0.070)LT Debt to Equity 0.0049 -0.0052∗∗∗ 0.0026 0.0006 0.9456∗∗∗ -0.0010
(0.005) (0.001) (0.002) (0.003) (0.021) (0.001)Cash to Equity -0.0218∗∗ -0.0047∗∗ -0.0013 -0.0090 -0.8277∗∗∗ 0.0051
(0.009) (0.002) (0.004) (0.007) (0.032) (0.003)Log Market Cap -0.0019 -0.0026∗∗ 0.0058∗∗∗ 0.0058∗∗ 0.0173∗∗ -0.0001
(0.003) (0.001) (0.001) (0.003) (0.007) (0.001)Log Book to Market -0.0870∗∗∗ -0.0201∗∗∗ -0.0175∗∗∗ -0.0035 0.0331∗∗∗ -0.0077∗∗∗
(0.007) (0.003) (0.005) (0.006) (0.012) (0.002)Time FE Yes Yes Yes Yes Yes YesObservations 2,785 2,784 2,785 2,784 2,783 2,781R2 0.1456 0.5002 0.6261 0.9538 0.8875 0.2611
54

Table 9. Accruals, Investments, and Book-to-Market Multiple
Table 9 reports the results of DID regressions following the specification in Table 3, Column 5, but usingalternative outcome variables measured in the year following each JPX400 selection: Accruals to Assets, NetOperating Assets, R&D to Sales, Log Employees, Log Average Employee Pay, Log Average Executive Pay,and Log Book-to-Market. As in Table 3, Treat is an indicator variable that is set to one for firms ranked301–500 under our replication of the JPX400 selection algorithm and zero for firms ranked 501–800; Postis an indicator variable that is set to one for the years 2014–2016 and zero for the pre-treatment period,2010–2012. The starting sample for all analyses is the one for which all variables used in the baselineanalysis—Table 3, Columns 3-5—are available. Observations vary across specifications depending on theavailability of specific new variables used for the analysis. All firm-level control variables are defined inAppendix A. Standard errors, clustered at the firm level, are reported in parentheses. Significance levels areindicated by ∗, ∗∗, and ∗∗∗ for 10%, 5%, and 1% respectively.
(1) (2) (3) (4) (5) (6)ForwardAccrualsto Assets
ForwardLog
NOA
ForwardR&D to
Sales
ForwardLog
Employees
ForwardLog AvgEE Pay
ForwardLogBM
Treat x Post 0.0017 0.0329 -0.0011* 0.0050 0.0045 -0.0281*(0.002) (0.022) (0.001) (0.011) (0.005) (0.017)
Treat 0.0003 0.0038 0.0011** 0.0044 -0.0117*** 0.0114(0.002) (0.014) (0.000) (0.009) (0.004) (0.012)
Accruals to Assets 0.4042***(0.034)
Log NOA 0.6881***(0.094)
R&D to Sales 0.9805***(0.018)
Log Employees 0.9817***(0.005)
Log Avg EE Pay 0.9515***(0.008)
Log Avg Exec Pay -0.0021(0.003)
Log Book to Market 0.0048*** 0.2935*** 0.0003 -0.0449*** -0.0063** 0.8617***(0.002) (0.101) (0.000) (0.009) (0.003) (0.011)
Log Market Cap -0.0007 0.3007*** -0.0003 0.0060 0.0077*** -0.0152***(0.001) (0.097) (0.000) (0.007) (0.002) (0.005)
Sales Growth 0.0250*** 0.1630*** 0.0035*** 0.0505** 0.0049 0.2264***(0.006) (0.050) (0.001) (0.020) (0.010) (0.033)
LT Debt to Equity 0.0003 0.2083*** -0.0001 0.0110** -0.0024 0.0028(0.001) (0.068) (0.000) (0.006) (0.002) (0.008)
Cash to Equity 0.0125*** -0.2537*** 0.0005 -0.0185** -0.0036 -0.0399*(0.002) (0.098) (0.000) (0.009) (0.004) (0.023)
Time FE Yes Yes Yes Yes Yes YesObservations 2,779 2,710 2,785 2,654 2,560 2,725R2 0.2295 0.9618 0.9260 0.9883 0.9209 0.8675
55