
Good morning, my name is Jasper van Baten. I will be ... · Good morning, my name is Jasper van...
48
1 Good morning, my name is Jasper van Baten. I will be presenting this key note lecture instead of Bill Barrett, he could not make it here today. I am an independent contractor, and I mostly write process simulation software. Bill works at the US Environmental Protection Agency. He is therefore the specialist on the environmental aspects of what we are about to present today.
Transcript of Good morning, my name is Jasper van Baten. I will be ... · Good morning, my name is Jasper van...

1
Good morning, my name is Jasper van Baten. I will be presenting this key note lecture instead of Bill Barrett, he could not make it here today. I am an independent contractor, and I mostly write process simulation software. Bill works at the US Environmental Protection Agency. He is therefore the specialist on the environmental aspects of what we are about to present today.
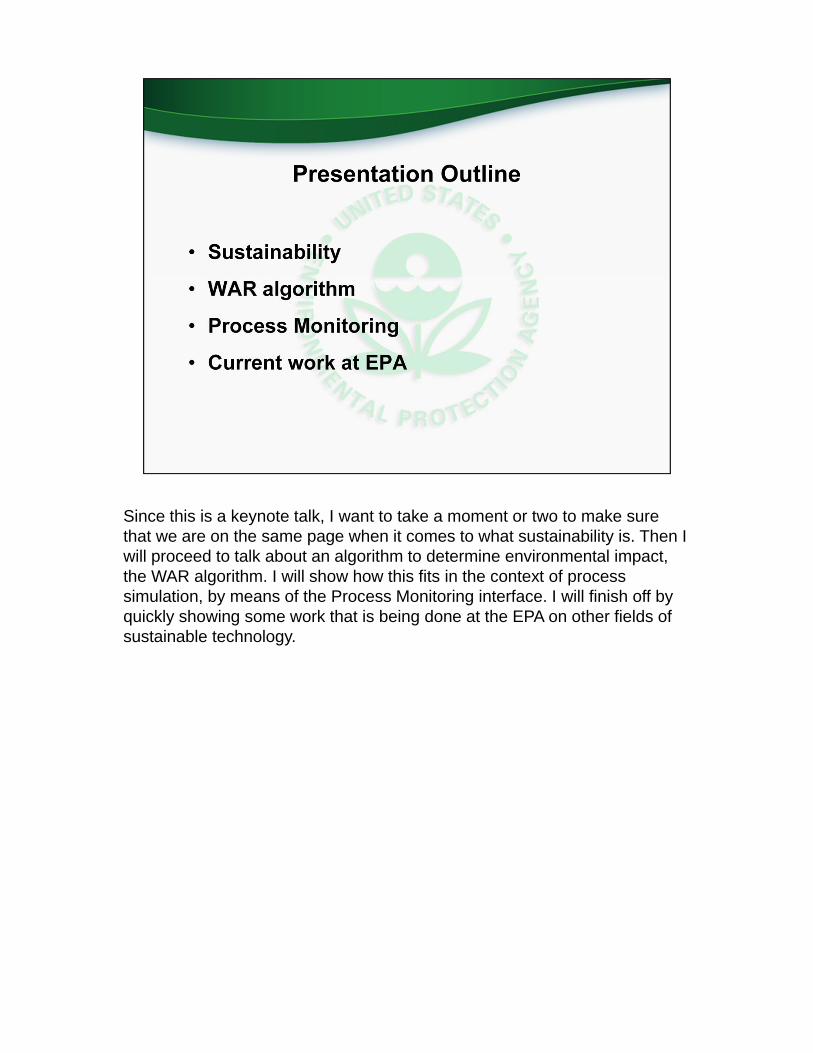
Since this is a keynote talk, I want to take a moment or two to make sure that we are on the same page when it comes to what sustainability is. Then I will proceed to talk about an algorithm to determine environmental impact, the WAR algorithm. I will show how this fits in the context of process simulation, by means of the Process Monitoring interface. I will finish off by quickly showing some work that is being done at the EPA on other fields of sustainable technology.

The best starting point for sustainability is the definition of sustainable development from the Brundtland Report, shown on the screen.
In general, sustainability is the long term maintenance of human well being. Three dimensions are considered when trying to determine whether something is sustainable: social, economic and environmental. These dimensions are commonly referred to as the triple bottom line of people, planet and profit.
3
4
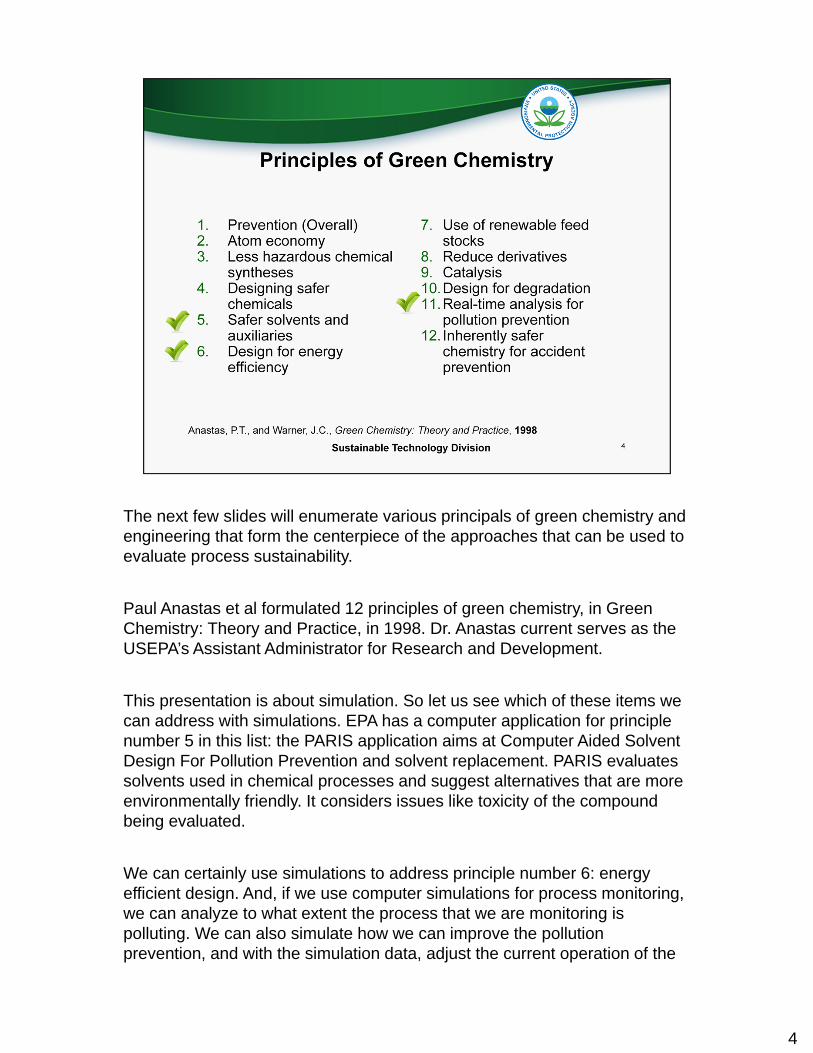
The next few slides will enumerate various principals of green chemistry and engineering that form the centerpiece of the approaches that can be used to evaluate process sustainability.
Paul Anastas et al formulated 12 principles of green chemistry, in Green Chemistry: Theory and Practice, in 1998. Dr. Anastas current serves as the USEPA’s Assistant Administrator for Research and Development.
This presentation is about simulation. So let us see which of these items we can address with simulations. EPA has a computer application for principle number 5 in this list: the PARIS application aims at Computer Aided Solvent Design For Pollution Prevention and solvent replacement. PARIS evaluates solvents used in chemical processes and suggest alternatives that are more environmentally friendly. It considers issues like toxicity of the compound being evaluated.
We can certainly use simulations to address principle number 6: energy efficient design. And, if we use computer simulations for process monitoring, we can analyze to what extent the process that we are monitoring is polluting. We can also simulate how we can improve the pollution prevention, and with the simulation data, adjust the current operation of the

plant we are monitoring.
4

5
Winterton formulates 12 additional principles of green chemistry, in Green Chemistry in 2001. Again, we readily identify a number of principles here where simulations can help out. Simulations are useful in setting up mass as well as energy balances for the process. Based on the mass balances, we can identify and quantify catalyst and solvent losses. As we are using thermodynamics in our simulation, we can identify safety issues related to exotherms. We can use simulations to minimize consumption of energy and other resources. And again, we have the opportunity to monitor the actual process by means of simulation.
Simulation also finds application in operator training, which can address issue 11.
Overall evaluation of the process to compare chemistries can help to identify the more sustainable one.
6
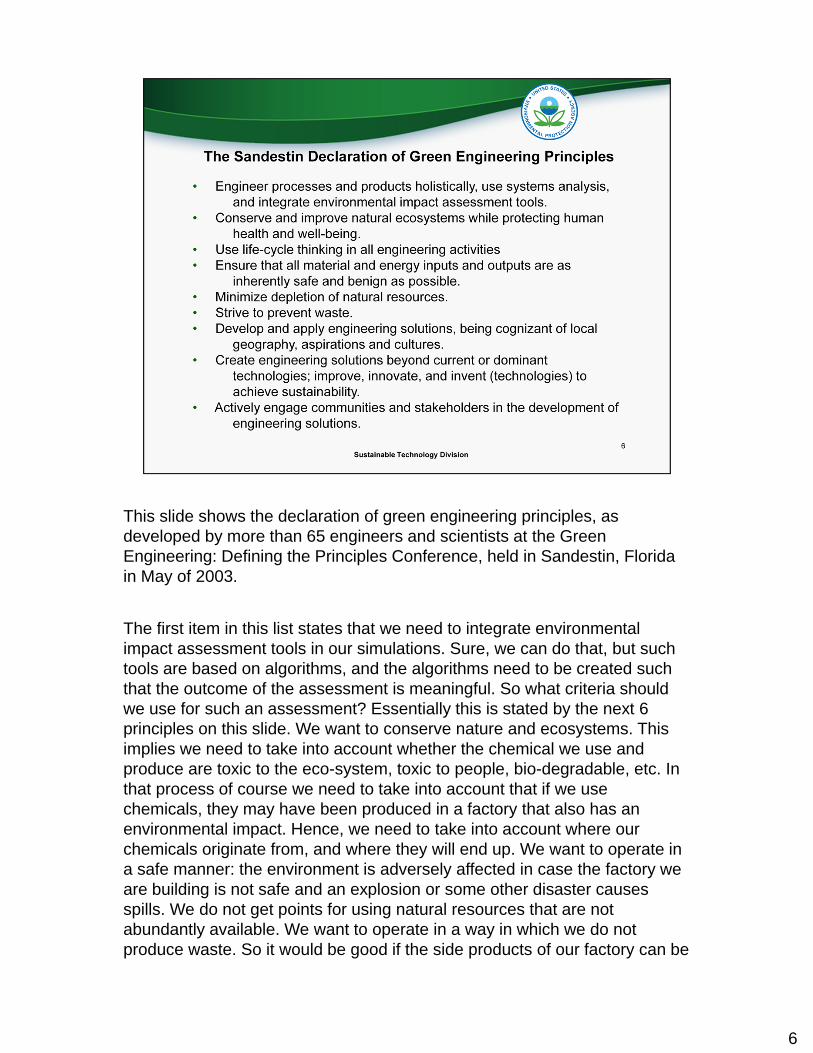
This slide shows the declaration of green engineering principles, as developed by more than 65 engineers and scientists at the Green Engineering: Defining the Principles Conference, held in Sandestin, Florida in May of 2003.
The first item in this list states that we need to integrate environmental impact assessment tools in our simulations. Sure, we can do that, but such tools are based on algorithms, and the algorithms need to be created such that the outcome of the assessment is meaningful. So what criteria should we use for such an assessment? Essentially this is stated by the next 6 principles on this slide. We want to conserve nature and ecosystems. This implies we need to take into account whether the chemical we use and produce are toxic to the eco-system, toxic to people, bio-degradable, etc. In that process of course we need to take into account that if we use chemicals, they may have been produced in a factory that also has an environmental impact. Hence, we need to take into account where our chemicals originate from, and where they will end up. We want to operate in a safe manner: the environment is adversely affected in case the factory we are building is not safe and an explosion or some other disaster causes spills. We do not get points for using natural resources that are not abundantly available. We want to operate in a way in which we do not produce waste. So it would be good if the side products of our factory can be

reused in some other context for example. All of this is somewhat more complex in the context of the location of our factory. For example, contributions to smog formation are to be taken more seriously in metropolitan areas.
6

7
The EPA has developed a taxonomy of sustainability indicators that can be used for evaluating a process. These indicators are broadly classified into four areas, environmental, efficiency, economic, and energy – THE FOUR E’s. This slide provides an overview of the indicators.
The environmental indicators deal primarily with the environmental and human health impacts associated with the use of a particular chemical in a process. The presentation will demonstrate the calculation of an environmental sustainability indicator, the WAR Algorithm value, for a chemical process.
Efficiency indicators focus on creating as much product possible from the input materials. This reduces the amount of wastes that need to be disposed. Additionally, the actual process chemistry is important here. One example is that by improving product yields and product purity will reduce the need for separation processes and improve process efficiency.
As for economic considerations, simply put, unprofitable process are not sustainable.

Lastly, energy utilization is a major concern in process sustainability. Current energy resources are not sustainable over the long term.
7
8
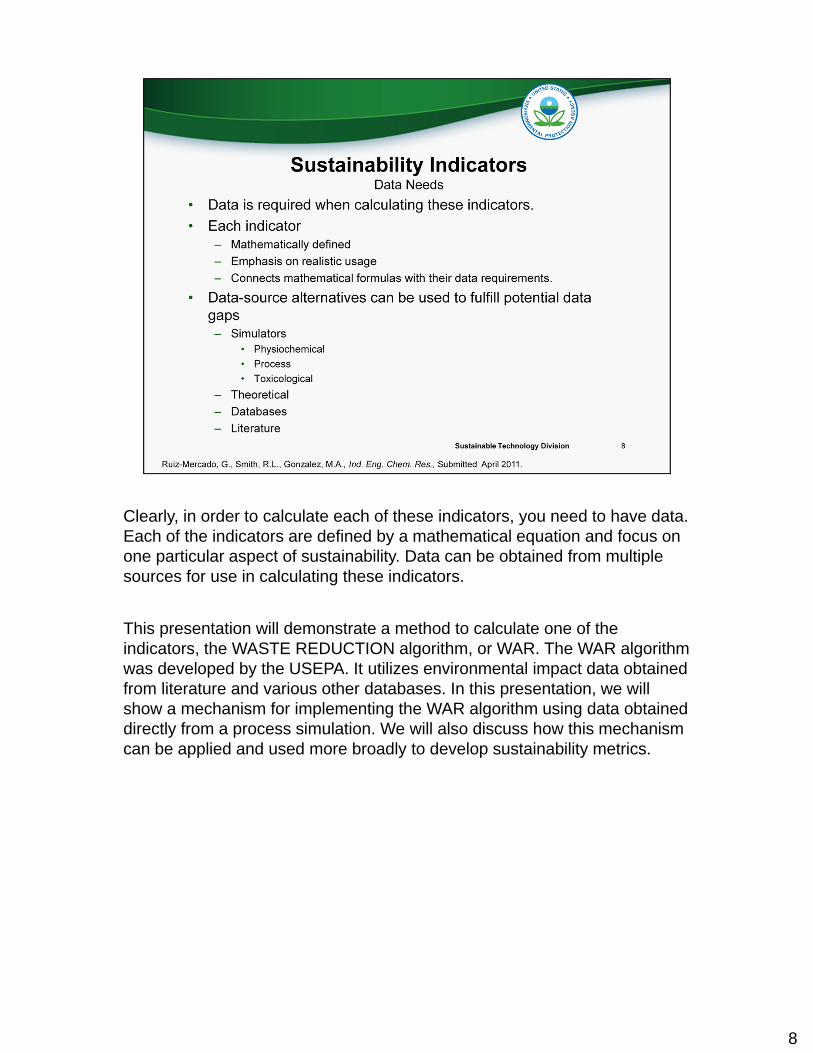
Clearly, in order to calculate each of these indicators, you need to have data. Each of the indicators are defined by a mathematical equation and focus on one particular aspect of sustainability. Data can be obtained from multiple sources for use in calculating these indicators.
This presentation will demonstrate a method to calculate one of the indicators, the WASTE REDUCTION algorithm, or WAR. The WAR algorithm was developed by the USEPA. It utilizes environmental impact data obtained from literature and various other databases. In this presentation, we will show a mechanism for implementing the WAR algorithm using data obtained directly from a process simulation. We will also discuss how this mechanism can be applied and used more broadly to develop sustainability metrics.

This brings us to the WAR algorithm.

The WAR algorithm considers the likelihood of various environmental impacts, the Potential Environmental Impact (or PEI), that may result from the chemicals used and produced in a process. Reactions that convert chemicals from less environmentally harmful ones to more environmentally harmful ones would result in an increase in the PEI associated with the process. Likewise, generation of less harmful chemicals would result in a decrease in the PEI of the process.
WAR is considered a one-dimensional sustainability indicator because it only considers the environmental aspects of a chemical process; one of the four E’s.
Note that we are trying to assess the Potential Environmental Impact, or how harmful feeds and products to our process are. Hence, we need a better idea of what we consider harmful.
10

This table shows the environmental impact categories considered by the WAR algorithm. These impacts are grouped into four broad categories, human toxicity, ecological toxicity, global atmospheric impacts and regional atmospheric impacts.
Toxicity data are considered in terms of the LD50, or the dose of the chemical that will kill 50% of those exposed to the chemical at that dose. This is a measure of acute toxicity, toxic effects that result from short term exposure to the chemical. LD50 is used in both human and ecological settings. Chemicals can have different LD50s for a human and animals species. An appropriate LD50 should be selected based upon whether the target organism is a person or a different species. The units for LD50 are typically mass of chemical per body mass of target organism.
The inhalation/dermal toxicity values used in the evaluation come from the United States Occupational Safety and Health Administration, or OSHA (pronounced with a long O, like in open). OSHA established permissible exposure limits, or PELs, for chemical. For inhalation hazards, these values have units of mass per volume of air.
Aquatic toxicity data are in terms of the water concentration that will kill 50%
11
of the population of a target organism, referred to as the lethal concentration 50, or LC50. Again the values are species dependent and typically are in terms of daphnia, a water flea, or fat head minnow, a small fish species.
Global atmospheric impacts consider global warming potential, which is a normalization of the amount of global warming that may occur due to the chemicals being released to that of carbon dioxide. Likewise, the chemical’s ability to harm the ozone layer, called the ozone depletion potential, or ODP is measured relative to the potential for ozone destruction of trichlorofluoromethane.
Acidification, acid rain, and photochemical oxidation (smog formation) are more local phenomena, and are considered on a regional level. Acidification is the result of acid gases such as sulfur dioxide and nitrogen oxides combining with atmospheric moisture to form acid rain. Photochemical oxidation is the formation of smog by the reaction of volatile hydrocarbons (such as unburnt motor vehicle fuel) and nitrogen oxides in the atmosphere. The reaction is catalyzed by sunlight. This is typically a problem around metropolitan areas.
Note that energy consumption also has an environmental impact. Less so if we use renewable energy than in the case we are burning coal. So the PEI assigned to energy consumption depends on the source of the energy.
11
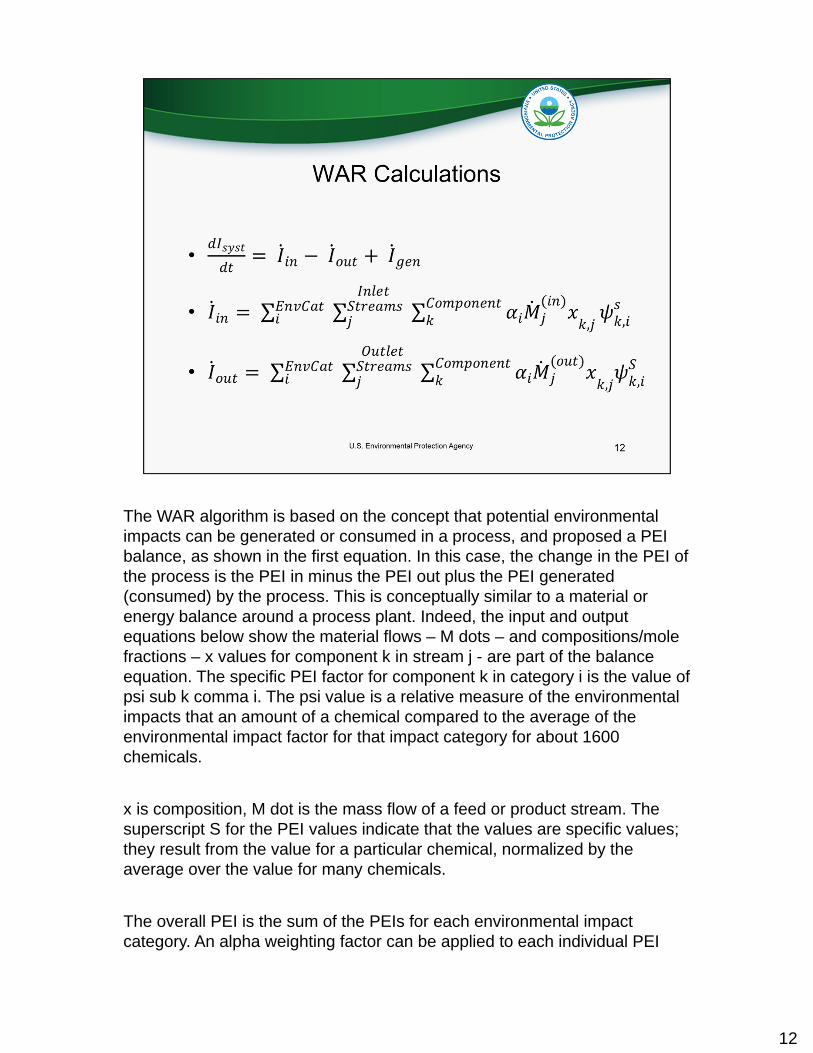
The WAR algorithm is based on the concept that potential environmental impacts can be generated or consumed in a process, and proposed a PEI balance, as shown in the first equation. In this case, the change in the PEI of the process is the PEI in minus the PEI out plus the PEI generated (consumed) by the process. This is conceptually similar to a material or energy balance around a process plant. Indeed, the input and output equations below show the material flows – M dots – and compositions/mole fractions – x values for component k in stream j - are part of the balance equation. The specific PEI factor for component k in category i is the value of psi sub k comma i. The psi value is a relative measure of the environmental impacts that an amount of a chemical compared to the average of the environmental impact factor for that impact category for about 1600 chemicals.
x is composition, M dot is the mass flow of a feed or product stream. The superscript S for the PEI values indicate that the values are specific values; they result from the value for a particular chemical, normalized by the average over the value for many chemicals.
The overall PEI is the sum of the PEIs for each environmental impact category. An alpha weighting factor can be applied to each individual PEI
12

based upon the needs of the WAR analysis. For instance, aquatic toxicity may be a minor issue in an arid region, where there will not be likely discharges to a water body.
Like any balance, at steady state, the change in PEI with time, dI dt becomes zero and the PEI generation rate can be calculated as the input PEI minus the output PEI.
Process simulation can be used to calculate the material flows and compositions for use in the WAR calculation. A problem however is that it is difficult to extract data from a simulation package for use in WAR or any other process evaluation for that matter.
12

Over the years, there have been many attempts to implement the WAR algorithm. The issues with implementing WAR in a process simulation package is faced by every process evaluation method developed, and that is the difficulty obtaining data from the process simulation package.
The original WAR implementation either parsed Aspen text output files for process data or required manual input of the data. Manual data input is labor intensive and prone to human error. Parsing text output files is subject to failure if the structure of the output file changes and the process data are no longer where the program expects them to be, which is exactly what happened – the next version of Aspen had a different output file format than the one WAR GUI was originally implemented and the WAR GUI program had to be rewritten to handle the new output file format.
There were also process simulation package specific implementations of WAR. The problem with this approach is that a different version of WAR will be required for each process simulator. Not a good scenario.
What was needed was a standardized method for obtaining the information required for WAR directly from the process simulation package. The first attempt at this approach was developed by Maurizio Fermeglia of the
13

University of Treiste in Italy. In that implementation, Dr. Fermeglia created CAPE-OPEN unit operations that he placed into the flowsheet’s input and output streams. This method works in all CAPE-OPEN compliant process simulation packages. Its disadvantage is that the process engineer must place unit operations into the flowsheet and will need to move them if the flowsheet changes.
The most recent implementation is the one that will be presented here. This method involves use of an interface package proposed to the CAPE-OPEN Laboratories Network (CO-Lan) called Flowsheet Monitoring. The Flowsheet Monitoring interfaces provide simulation plug-ins with direct access to the flowsheet’s object graph as a collection of unit operations and a collection of streams. In this case, the WAR algorithm can identify inlet and outlet streams, obtain material flow data and calculate the WAR value. Further, the WAR values can be made available to the process simulator should it desire to use these values.
13
So next, let us discuss flowsheet monitoring.
15
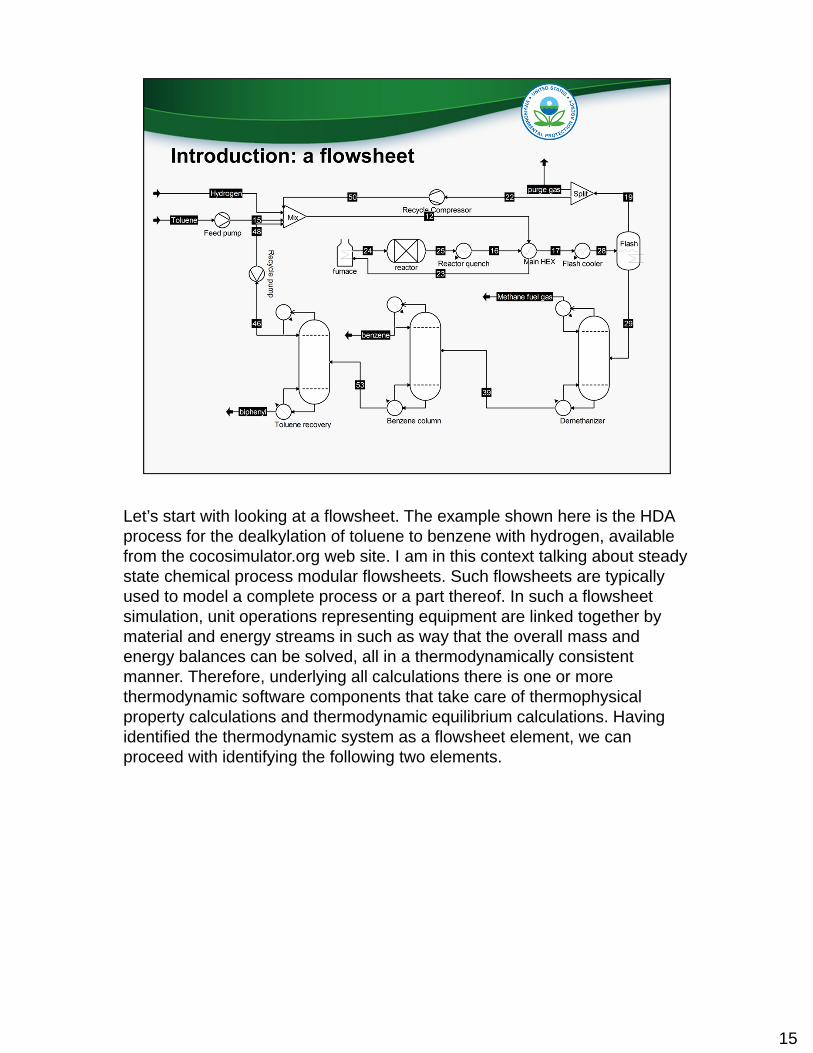
Let’s start with looking at a flowsheet. The example shown here is the HDA process for the dealkylation of toluene to benzene with hydrogen, available from the cocosimulator.org web site. I am in this context talking about steady state chemical process modular flowsheets. Such flowsheets are typically used to model a complete process or a part thereof. In such a flowsheet simulation, unit operations representing equipment are linked together by material and energy streams in such as way that the overall mass and energy balances can be solved, all in a thermodynamically consistent manner. Therefore, underlying all calculations there is one or more thermodynamic software components that take care of thermophysical property calculations and thermodynamic equilibrium calculations. Having identified the thermodynamic system as a flowsheet element, we can proceed with identifying the following two elements.
16
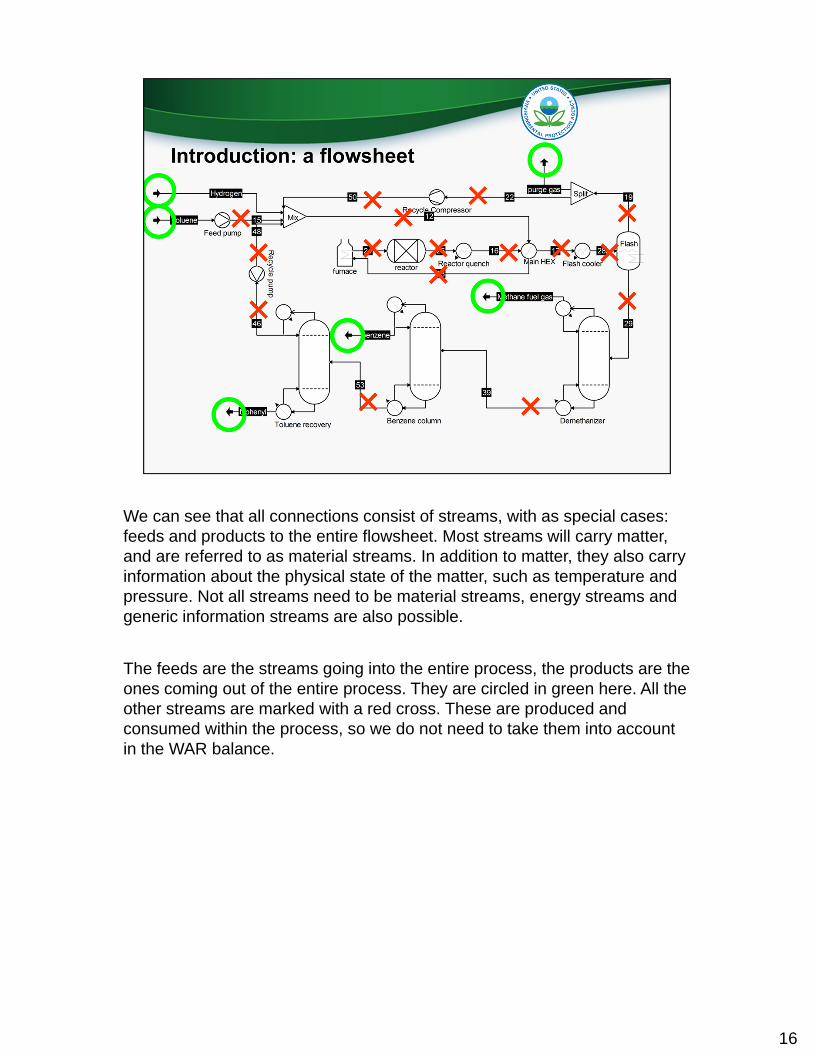
We can see that all connections consist of streams, with as special cases: feeds and products to the entire flowsheet. Most streams will carry matter, and are referred to as material streams. In addition to matter, they also carry information about the physical state of the matter, such as temperature and pressure. Not all streams need to be material streams, energy streams and generic information streams are also possible.
The feeds are the streams going into the entire process, the products are the ones coming out of the entire process. They are circled in green here. All the other streams are marked with a red cross. These are produced and consumed within the process, so we do not need to take them into account in the WAR balance.
17
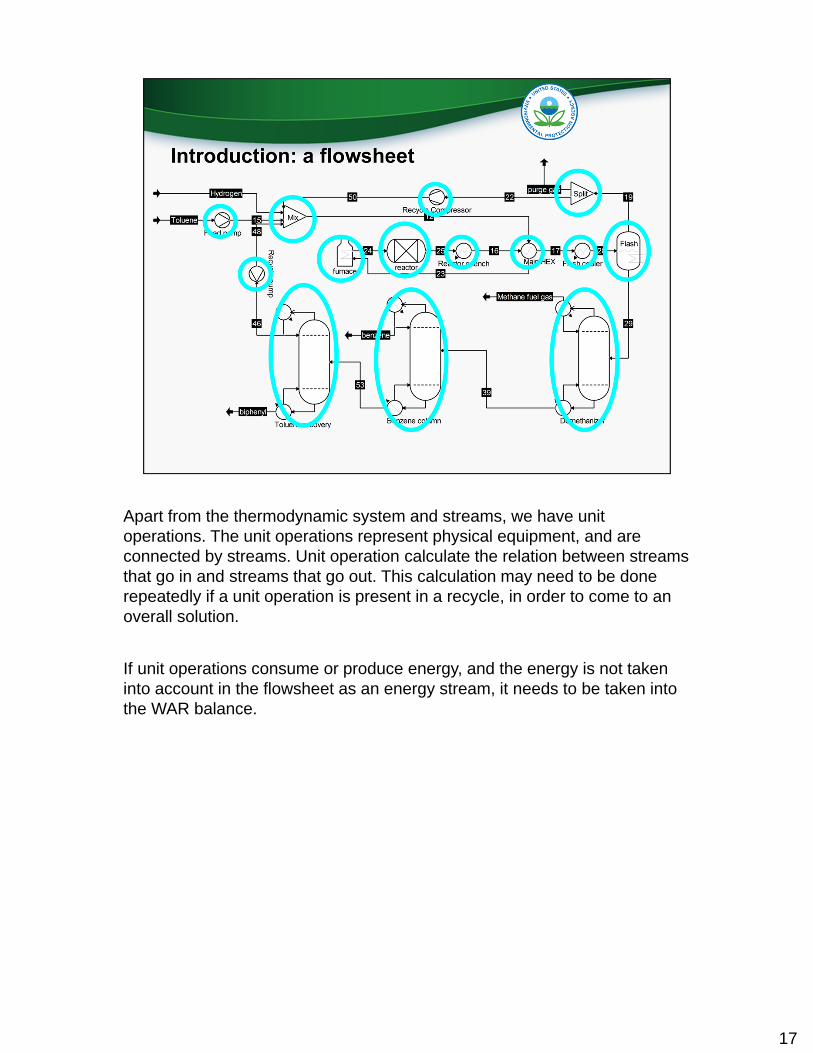
Apart from the thermodynamic system and streams, we have unit operations. The unit operations represent physical equipment, and are connected by streams. Unit operation calculate the relation between streams that go in and streams that go out. This calculation may need to be done repeatedly if a unit operation is present in a recycle, in order to come to an overall solution.
If unit operations consume or produce energy, and the energy is not taken into account in the flowsheet as an energy stream, it needs to be taken into the WAR balance.
18
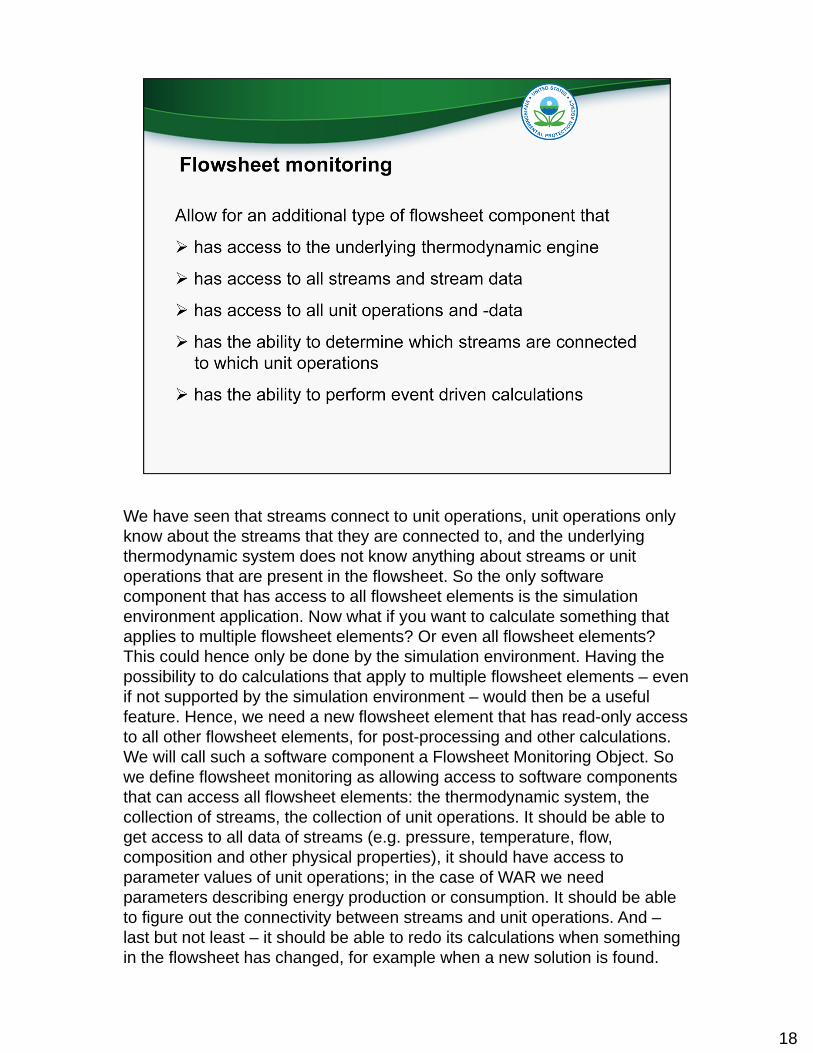
We have seen that streams connect to unit operations, unit operations only know about the streams that they are connected to, and the underlying thermodynamic system does not know anything about streams or unit operations that are present in the flowsheet. So the only software component that has access to all flowsheet elements is the simulation environment application. Now what if you want to calculate something that applies to multiple flowsheet elements? Or even all flowsheet elements? This could hence only be done by the simulation environment. Having the possibility to do calculations that apply to multiple flowsheet elements – even if not supported by the simulation environment – would then be a useful feature. Hence, we need a new flowsheet element that has read-only access to all other flowsheet elements, for post-processing and other calculations. We will call such a software component a Flowsheet Monitoring Object. So we define flowsheet monitoring as allowing access to software components that can access all flowsheet elements: the thermodynamic system, the collection of streams, the collection of unit operations. It should be able to get access to all data of streams (e.g. pressure, temperature, flow, composition and other physical properties), it should have access to parameter values of unit operations; in the case of WAR we need parameters describing energy production or consumption. It should be able to figure out the connectivity between streams and unit operations. And –last but not least – it should be able to redo its calculations when something in the flowsheet has changed, for example when a new solution is found.
19
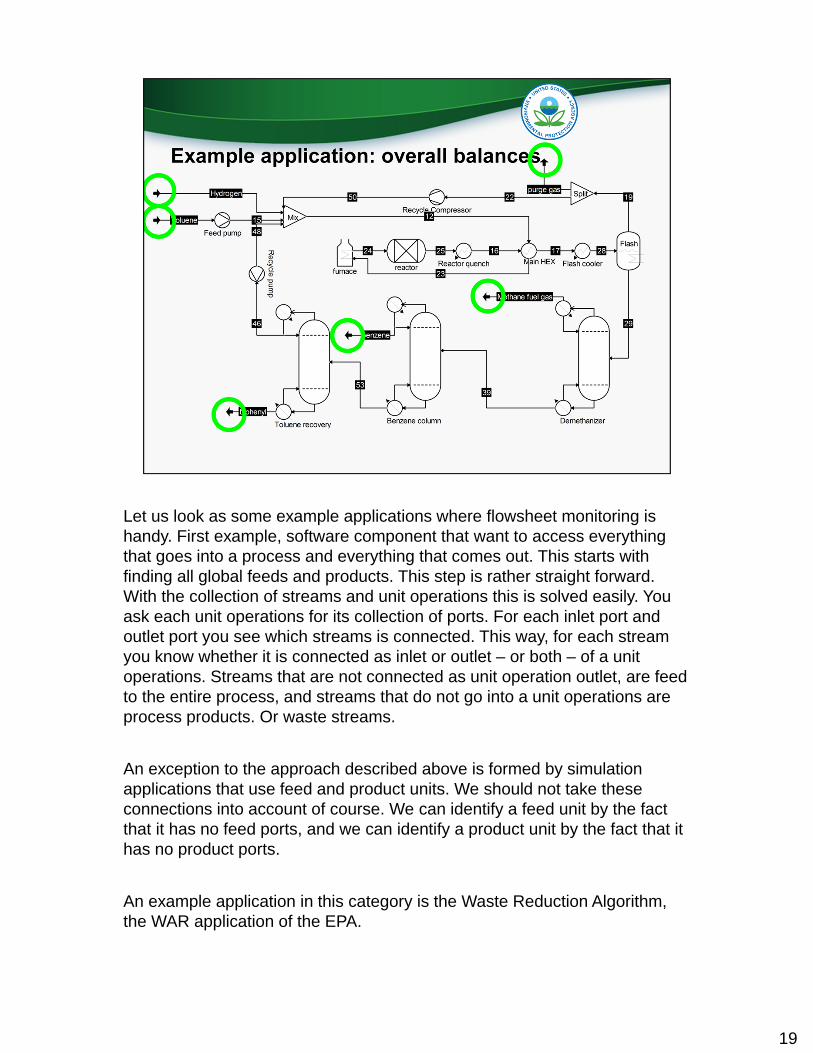
Let us look as some example applications where flowsheet monitoring is handy. First example, software component that want to access everything that goes into a process and everything that comes out. This starts with finding all global feeds and products. This step is rather straight forward. With the collection of streams and unit operations this is solved easily. You ask each unit operations for its collection of ports. For each inlet port and outlet port you see which streams is connected. This way, for each stream you know whether it is connected as inlet or outlet – or both – of a unit operations. Streams that are not connected as unit operation outlet, are feed to the entire process, and streams that do not go into a unit operations are process products. Or waste streams.
An exception to the approach described above is formed by simulation applications that use feed and product units. We should not take these connections into account of course. We can identify a feed unit by the fact that it has no feed ports, and we can identify a product unit by the fact that it has no product ports.
An example application in this category is the Waste Reduction Algorithm, the WAR application of the EPA.
20
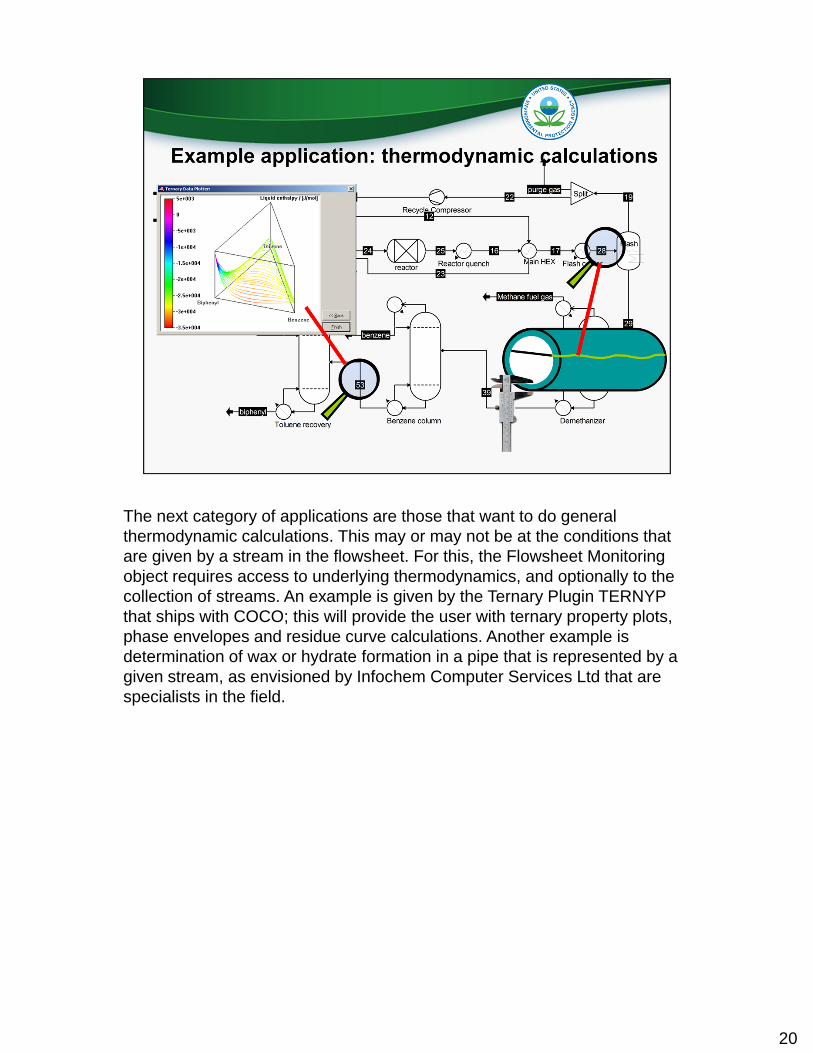
The next category of applications are those that want to do general thermodynamic calculations. This may or may not be at the conditions that are given by a stream in the flowsheet. For this, the Flowsheet Monitoring object requires access to underlying thermodynamics, and optionally to the collection of streams. An example is given by the Ternary Plugin TERNYP that ships with COCO; this will provide the user with ternary property plots, phase envelopes and residue curve calculations. Another example is determination of wax or hydrate formation in a pipe that is represented by a given stream, as envisioned by Infochem Computer Services Ltd that are specialists in the field.
21
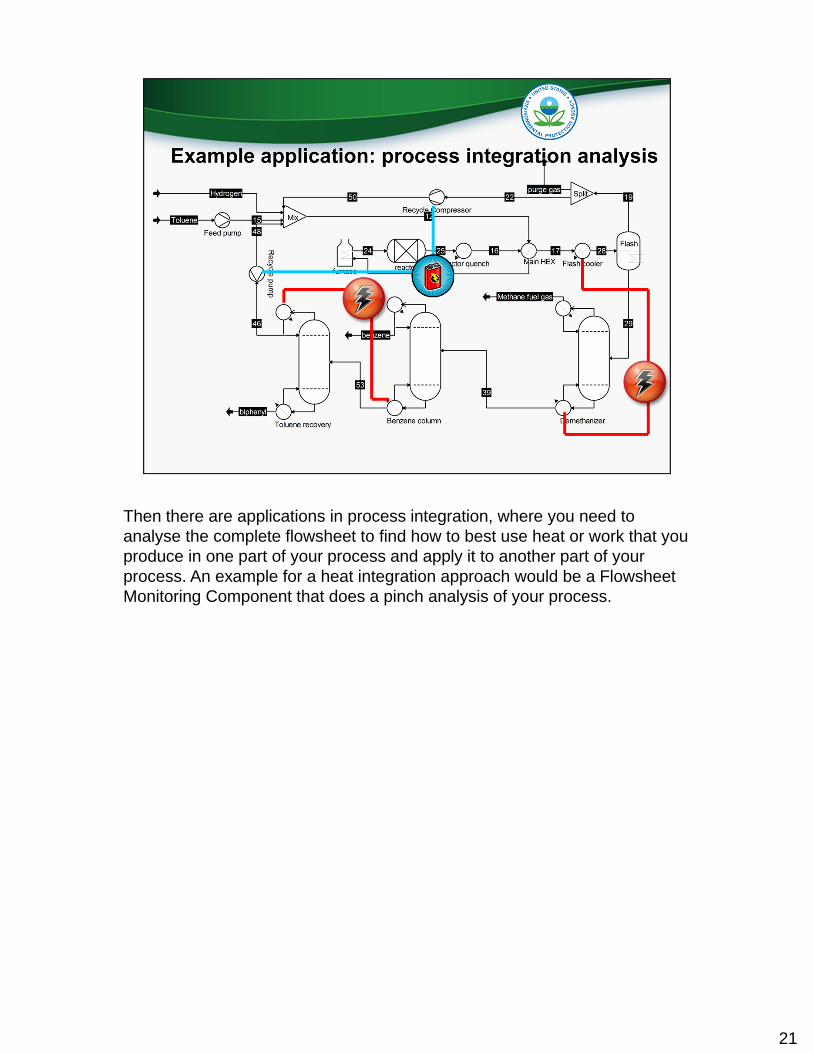
Then there are applications in process integration, where you need to analyse the complete flowsheet to find how to best use heat or work that you produce in one part of your process and apply it to another part of your process. An example for a heat integration approach would be a Flowsheet Monitoring Component that does a pinch analysis of your process.
22
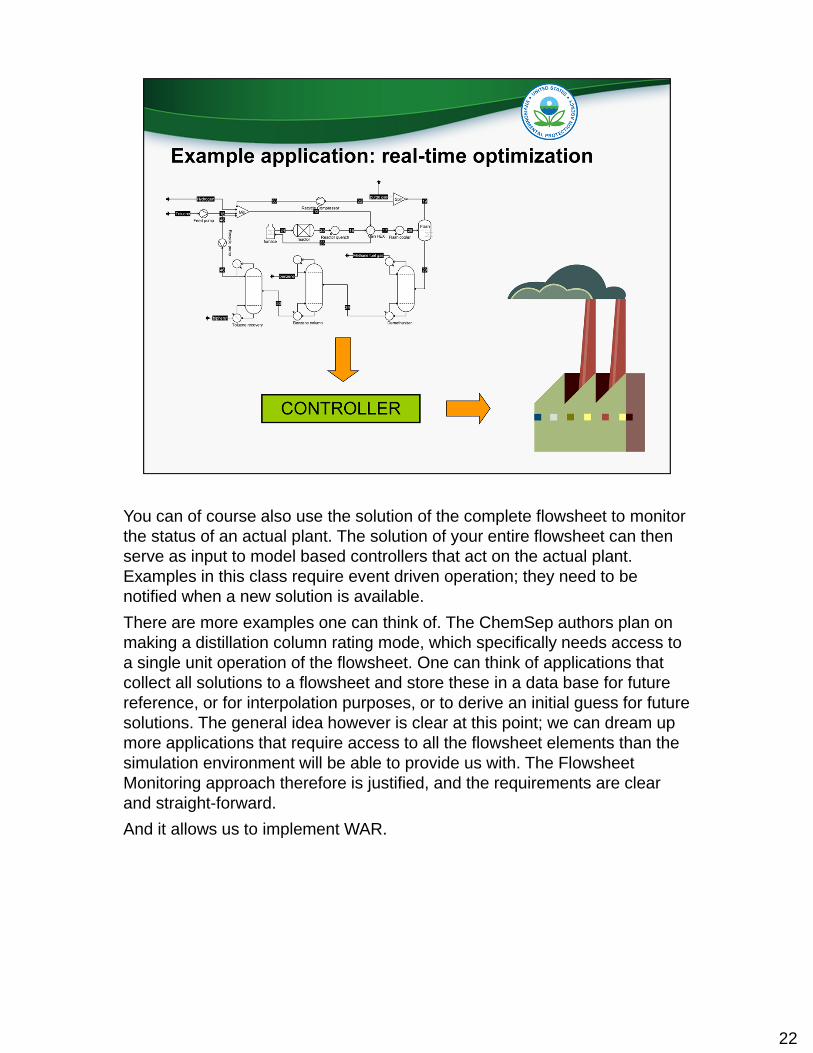
You can of course also use the solution of the complete flowsheet to monitor the status of an actual plant. The solution of your entire flowsheet can then serve as input to model based controllers that act on the actual plant. Examples in this class require event driven operation; they need to be notified when a new solution is available.
There are more examples one can think of. The ChemSep authors plan on making a distillation column rating mode, which specifically needs access to a single unit operation of the flowsheet. One can think of applications that collect all solutions to a flowsheet and store these in a data base for future reference, or for interpolation purposes, or to derive an initial guess for future solutions. The general idea however is clear at this point; we can dream up more applications that require access to all the flowsheet elements than the simulation environment will be able to provide us with. The Flowsheet Monitoring approach therefore is justified, and the requirements are clear and straight-forward.
And it allows us to implement WAR.

23
Now that we have set the scene and now what we require, let’s have a look at what we have. If we are thinking of writing software components that work in multiple simulation environments, the first thing we should think of is CAPE-OPEN. CAPE-OPEN is a set of interface definitions that allow for exchange of chemical engineering process sub-models such as unit operations and thermodynamic systems between simulation environments.
Conveniently, CAPE-OPEN defines interfaces to access all of the flowsheet elements that we are interested in. The thermodynamic calculation system is well defined, material streams are defined by CAPE-OPEN material objects and energy or information streams are defined as collections of CAPE-OPEN parameters. There is a set of interfaces to describe unit operations, as well as one to describe collection. All CAPE-OPEN software components even identify themselves. And the best thing is support for all of these interfaces is present all ready in all major simulation environments. So let us build up a monitoring hierarchy from the ground up. I will show the elements that we need to access. Mind that we will work under the restriction that all flowsheet elements will be accessed by the flowsheet monitoring object in a read-only manner. This is because we cannot touch the data structure that is maintained by the simulation environment. We can therefore not modify –say – the pressure on a stream. We can however duplicate the material object that describes the stream and perform calculations on the duplicate. So…

24
If the monitoring object can access the streams, it has access to the material object in case of a material stream. This does not only allow us access to all thermodynamic properties, but also to all property calculations that can be done by the underlying thermodynamic system. We can after all duplicate the material object and populate it with the properties that we want to. If the stream is an energy or information stream, we have access to a collection of parameters describing the data on the stream. The stream also identifies itself.
25
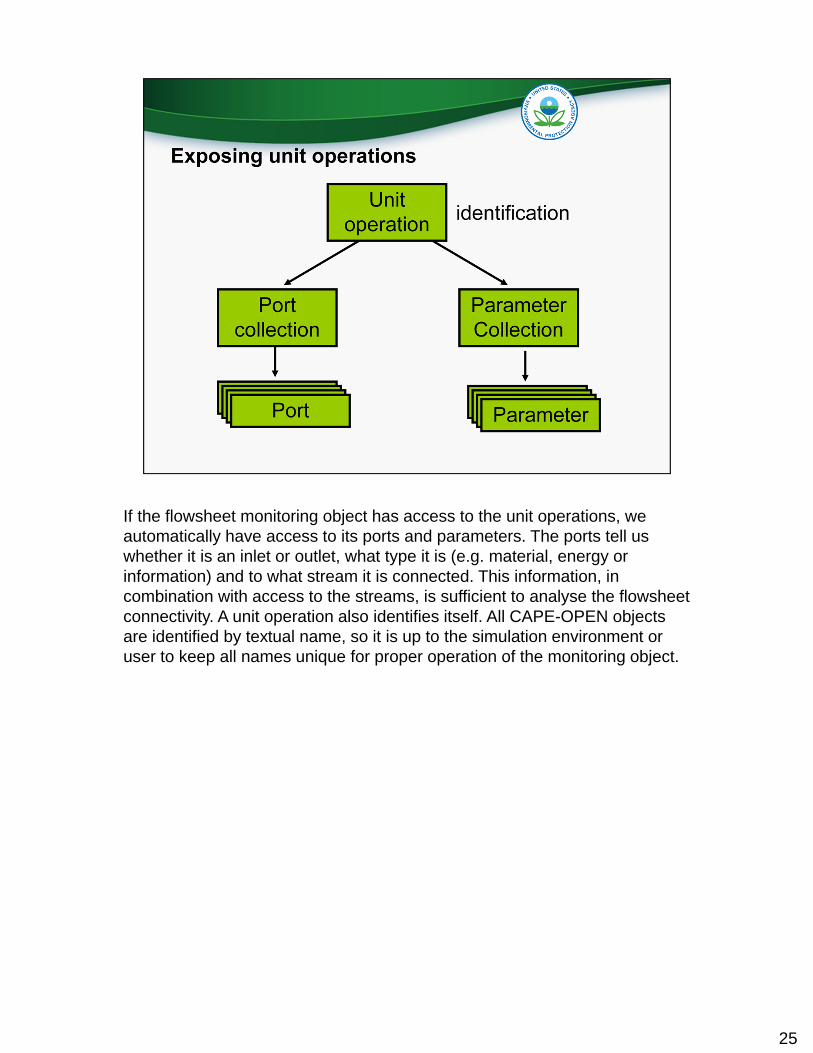
If the flowsheet monitoring object has access to the unit operations, we automatically have access to its ports and parameters. The ports tell us whether it is an inlet or outlet, what type it is (e.g. material, energy or information) and to what stream it is connected. This information, in combination with access to the streams, is sufficient to analyse the flowsheet connectivity. A unit operation also identifies itself. All CAPE-OPEN objects are identified by textual name, so it is up to the simulation environment or user to keep all names unique for proper operation of the monitoring object.
26
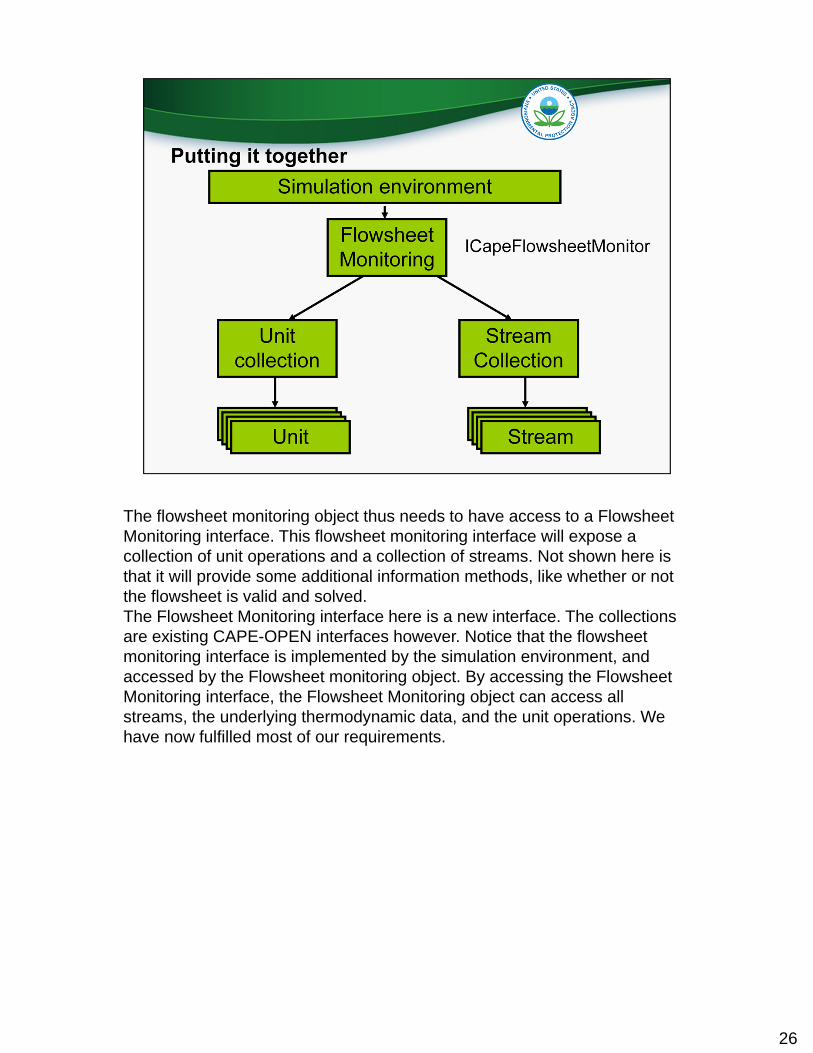
The flowsheet monitoring object thus needs to have access to a Flowsheet Monitoring interface. This flowsheet monitoring interface will expose a collection of unit operations and a collection of streams. Not shown here is that it will provide some additional information methods, like whether or not the flowsheet is valid and solved.The Flowsheet Monitoring interface here is a new interface. The collections are existing CAPE-OPEN interfaces however. Notice that the flowsheet monitoring interface is implemented by the simulation environment, and accessed by the Flowsheet monitoring object. By accessing the Flowsheet Monitoring interface, the Flowsheet Monitoring object can access all streams, the underlying thermodynamic data, and the unit operations. We have now fulfilled most of our requirements.

So – let us have a look at how things come together. We show the usage of the new WAR implementation in the COFE flowsheeting environment that comes with COCO. COCO is freely available from cocosimulator.org.
WAR is implemented as a Flowsheet Monitoring Object. In COFE, these are available from the Add-In menu. If we select Load Add-In, we get a box from which we can select from installed Add-Ins at the system. We select WAR.
27
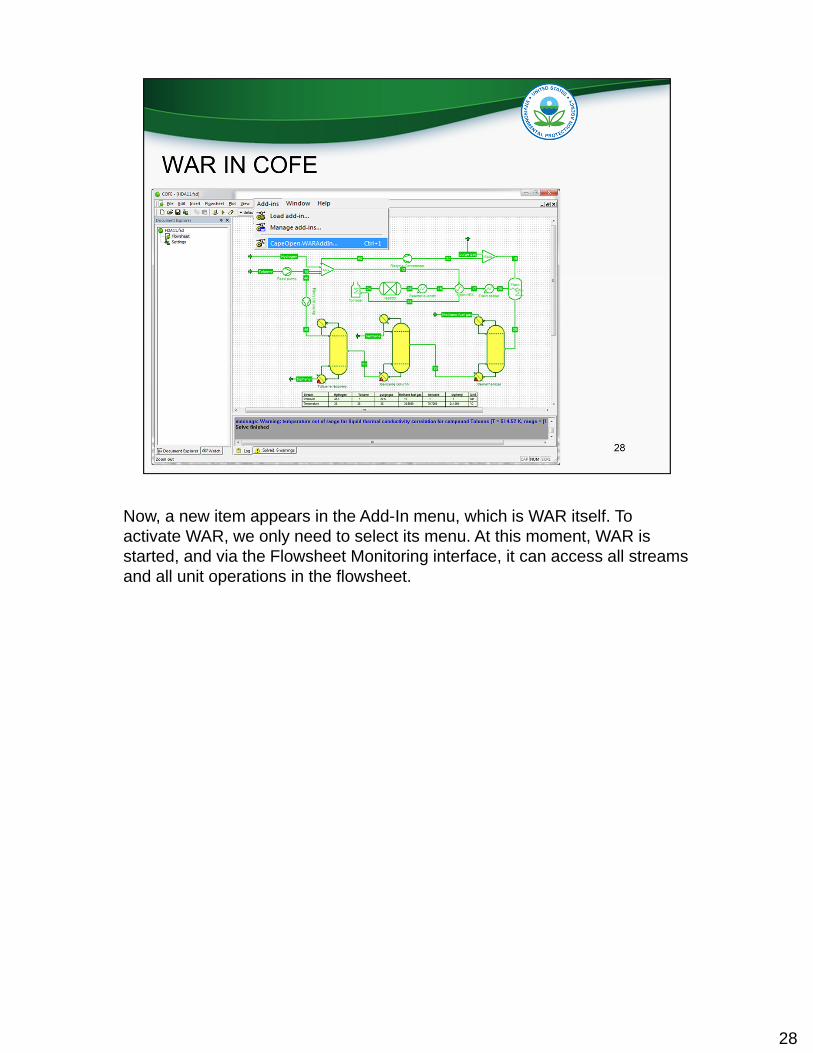
Now, a new item appears in the Add-In menu, which is WAR itself. To activate WAR, we only need to select its menu. At this moment, WAR is started, and via the Flowsheet Monitoring interface, it can access all streams and all unit operations in the flowsheet.
28

The WAR dialog starts up, and we notice that the application has already determined the connectivity of the flowsheet. This connectivity depends on which part of the flowsheet we want to consider. In this example, we consider the flowsheet as a whole, so on the left we select to include all unit operations. In the middle, the resulting feed streams are immediately visible. On the right, we have the product streams. Some of these are considered waste, and some of these are considered products. We have to identify which ones of those are products. A Potential Environmental Impact is also associated with energy. But this depends on what source of energy we use. A selection of Potential Environmental Impact parameters is available for several types of energy. We pick one.
29

On the next page, we can select the weighting factors alpha, that determine which kinds of pollution are important in the region in which the factory is located. The default value is unity for all factors, and we leave it at that.
30

Then, all we need to do is go to the results page, and the WAR algorithm is executed. The report shows the total generation of Potential Environmental Impact in the process, and the contribution of each environmental category. We can save or print the generated output for further processing.
31

Finally I will show some slides about work that is being done at the EPA…

Here we see an excerpt from the EPA Science Matters News Letter of April 2011.
Research at the US EPA will focus more on an integrated approach to develop solutions that make society more sustainable. We are not just talking about how sustainable an individual process is, but how sustainable human activities are as a whole.
Historically, the USEPA’s environmental programs have dealt with impacts to a single environmental media: soil, water, air; without considering the impacts on other media. An example of where this focus is problematic is the use of methyl tertiary butyl ether (MTBE) as an oxygenate in gasoline. In the early 1990s, EPA’s air program required addition of oxygenates to gasoline to reduce smog formation potential. Oxygenates improved combustion efficiency in spark-ignited engines. This reduced tailpipe volatile organic compound (VOC) emissions. The problem was that gasoline is typically stored in underground storage tanks. These tanks would leak, or gasoline would be spilled during filling the tanks. Once released from the tanks, MTBE was more water soluble than the organic compounds in gasoline, and caused significantly more contamination of groundwater than gasoline alone.
33

Going forward, the USEPA’s approach to environmental research to consider all possible environmental implications of decisions. The ongoing process related research at USEPA is following this principle.
Current environmental research being conducted considers the sustainability of products as a whole, across the products entire life cycle, and also considers impacts not just in one environmental media, but rather considers all possible environmental implications of a product. This not just includes releases of chemicals, but use of natural resources. This includes use of land, energy, water, mineral, forest, and other resources. The goal is to improve the human health and the overall quality of life while the maintaining global economy
33

Over the next few slides, I will present an overview of a couple of USEPA research programs geared towards evaluating the sustainability of industrial processes. These research programs are PARIS – focused on replacing solvents with ones having less environmental impacts, GREENSCOPE – a way to evaluate the sustainability of chemical processes, Life cycle assessment and TRACI which are used to evaluate the environmental impacts of products.
34
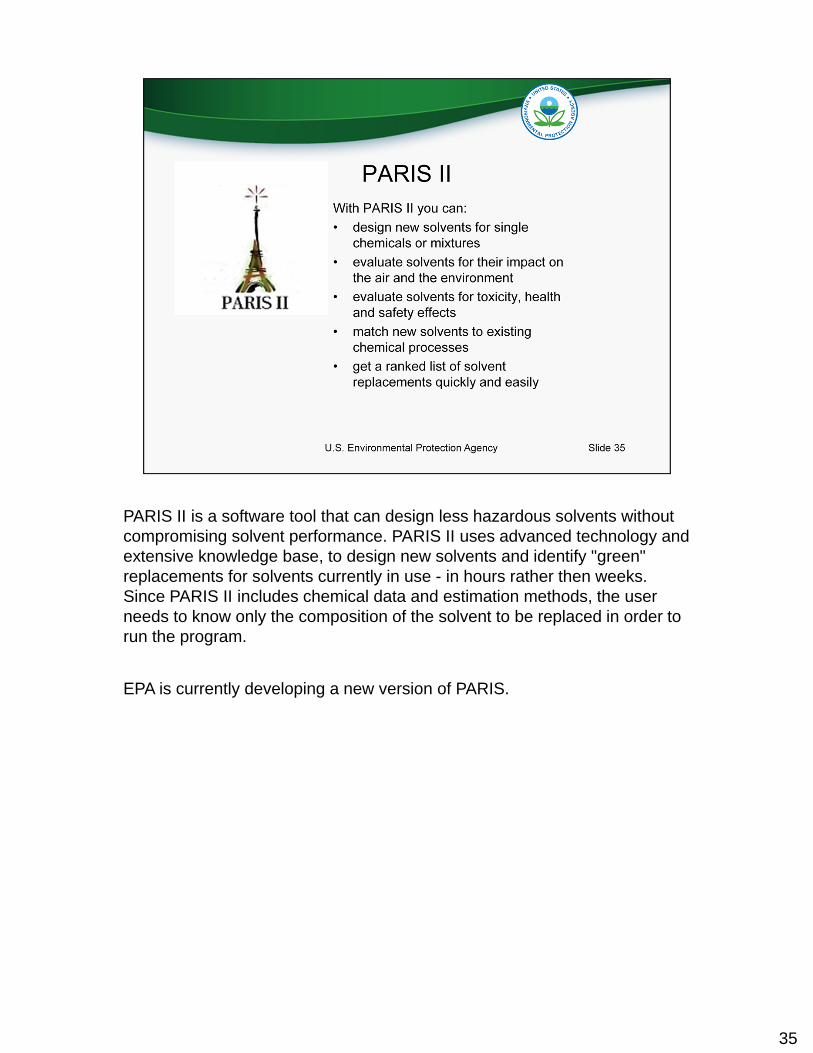
PARIS II is a software tool that can design less hazardous solvents without compromising solvent performance. PARIS II uses advanced technology and extensive knowledge base, to design new solvents and identify "green" replacements for solvents currently in use - in hours rather then weeks. Since PARIS II includes chemical data and estimation methods, the user needs to know only the composition of the solvent to be replaced in order to run the program.
EPA is currently developing a new version of PARIS.
35

Greenscope is a project to develop multi-dimensional sustainability indicators for use with process simulation packages. One goal of this research is to implement the Greenscope package using Flowsheet Monitoring. In this way, you could quickly evaluate your process using a number of sustainability indicators.
The GREENSCOPE project was developed because current process design methodologies are focused in developing industrial processes to meet the product requirements and specifications, environmental emissions laws, and maximizing the economics benefits. However the environmental cost, ecological impact, material usage, and energy efficiency of the respective manufacturing process are not reflected in market places.
Where WAR is a 1 dimensional assessment tool, oriented on the feeds and products of a process, GREENSCOPE adds more dimensions to the analysis, but still looks at a single process.
Contact: Ray Smith (513)569-7161 [email protected]

As opposed to WAR and GREENSCOPE, Life cycle assessments consider the environmental impacts of a product from cradle to grave.
Each product requires raw materials which are extracted from the earth. These raw materials could be minerals extracted by mining, oil, water, or biological products… plants and animal materials. These raw materials are then used to create the product through various production processes. These can include chemical processes, machining, energy generation, transportation of intermediate products, and other processes. Many of these production processes can be modeled using a process simulation package, and these process simulations can be linked together to provide an estimate of releases to the environment.
During the use phase, environmental implications of the use of the product is considered. This can include energy use, maintenance of the product, etc.
Finally, the product’s life cycle needs to evaluate the environmental implications of the end of the product’s life. This can include dismantling the product for recycling or disposal in landfills. Reuse and recycling of materials can occur in any phase of the life cycle, returning materials to other points in the product life cycle.
37

USEPA life cycle assessment research in this perspective includes methods for determining the life cycle inventory of releases to the environment and resource requirements. EPA is involved in assembling and coordinating the collection of data pertaining to processes and development of standard databases. This includes preparation of industry average data for creation of a generic models, and the use of process simulation for obtaining process specific data. Generic life cycle data can be useful for commodity materials such as sulfuric acid, or energy sources such as electricity by considering the mix of power supplies – for example the average emissions that results from hydroelectric generation, wind power, nuclear, or fossil fuel electric generation.
Additionally, the USEPA is involved in the preparation of life cycle assessments for different products, including bio-based fuels and consumer products.
37
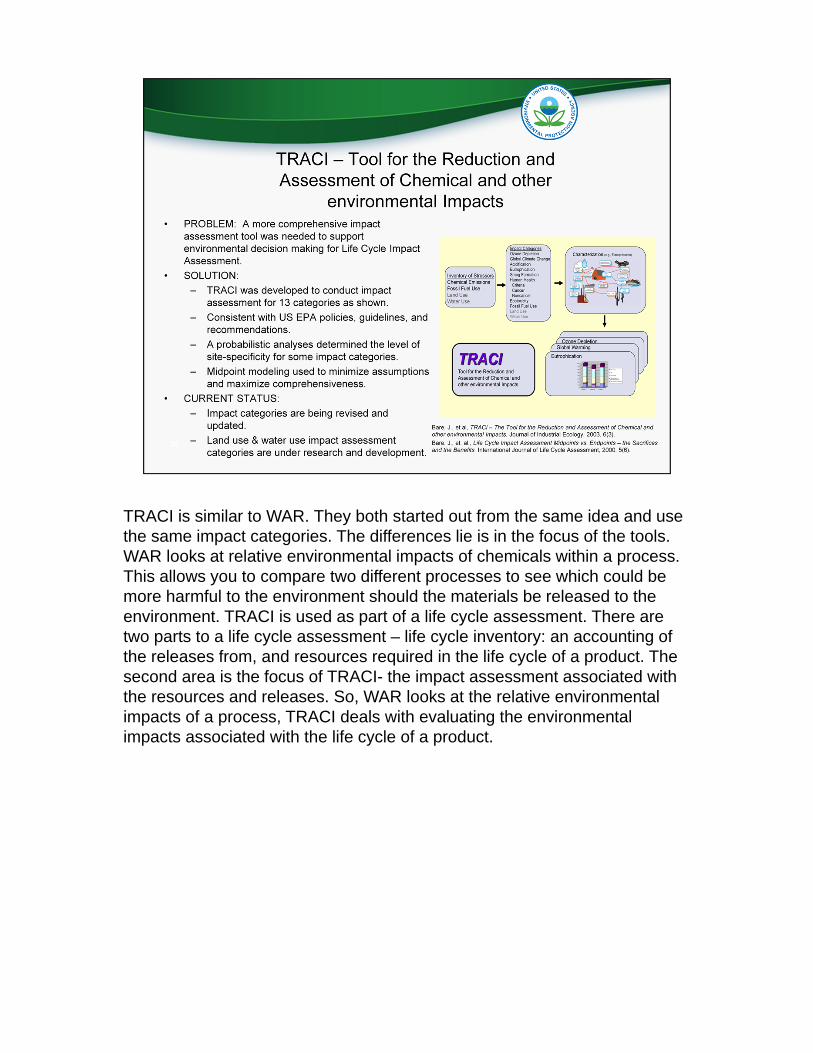
TRACI is similar to WAR. They both started out from the same idea and use the same impact categories. The differences lie is in the focus of the tools. WAR looks at relative environmental impacts of chemicals within a process. This allows you to compare two different processes to see which could be more harmful to the environment should the materials be released to the environment. TRACI is used as part of a life cycle assessment. There are two parts to a life cycle assessment – life cycle inventory: an accounting of the releases from, and resources required in the life cycle of a product. The second area is the focus of TRACI- the impact assessment associated with the resources and releases. So, WAR looks at the relative environmental impacts of a process, TRACI deals with evaluating the environmental impacts associated with the life cycle of a product.

Having a closer look at the diagram, we see a box labeled “Impact Categories.” This lists all of the categories that are currently included in TRACI. Note that all of the bold categories are currently included, but the land and water use are currently being developed and are not available at this time.
TRACI received the US EPA Gold Medal which is the highest award available within the Agency.
For more information on TRACI, or other topics related to comprehensive impact assessment like Life Cycle Impact Assessment or Sustainability Metrics, contact Jane Bare at [email protected]
Contact: Jane Bare (513)569-7513 [email protected]

This concludes the presentation. I hope you enjoyed it, and I would like to thank you for your attention. I will answer your questions as good as I can; if I cannot answer your questions, I am sure that Bill can.
40