Gomez Paper
5
Lamb Waves and Dispersion Curves in Plates and its Applications in NDE Experiences Using Comsol Multiphysics Pablo Gómez *,1 , José Paulino Fernández 1 and Pablo David García 1 1 Hydro-Geophysics & NDE Modeling Unit. C/ Gutierrez Quirós s/n. University of Oviedo. Mieres, Spain. *Pablo Gómez: [email protected] Abstract: A model for numerically obtaining lamb wave modes and dispersion curves in plates is presented. It is shown that COMSOL Multiphysics can be employed to simulate the behavior of guided waves in dispersive plates, which is useful for NDE applications. The simulation results will be used to obtain a time-offset acceleration profile where the dispersive lamb modes of propagation are implied. The MASW (Mutichannel analysis of surface waves) is then employed for data processing making explicit the presence and character of the lamb different propagation modes. The curves are then interpreted. The link between MATLAB and COMSOL for transforming the simulation in interpretable curves is very convenient for routine comparison between numerical and analytical or experimental solutions. Keywords: Lamb waves, Dispersion curves, MASW, Numerical modeling. 1. Introduction The dispersive behavior of different structural elements is very interesting in NDE applications. Specifically, in acoustic evaluation where a stratified media is presented, techniques like Impact-Echo method (Sansalone, 1985) is not enough for studying the thickness of different layers. The reason of the above is that, across the plates, different frequency components of the input signal travels at different velocities (Graff, 1975). Thus, the idea of a specific frequency traveling up and down across the thickness of the plate makes no sense because guided waves phenomena grow up in the layer. The behavior of guided waves in plates was first studied by Lamb (1905). Since then, many researchers have been working in this field over years. Recently works (Ryden, 2004) (Park, 2000) have shown how to combining spectral analysis and dispersive phenomena to determinate thickness and velocity profiles in stratified media. In this paper we are going to use Comsol Multyphisics to generate pseudo-experimental data which can be analyzed over the MASW (Multichannel Analysis of surface waves) method for getting dispersion curves. A Matlab code is then employed for data processing showing how Comsol can be very useful for the study of guided waves in plates and for comparison with the experimental data. 2. Lamb Waves As we said, Lamb derived the dispersion relation for different waves traveling across the plane of a free plate. According to him, only some frequency-velocity pairs can propagate through it. This pairs can be obtained from the dispersion relations: tan 2 tan 2 4 2 2 2 2 (1) and tan 2 tan 2 2 2 2 4 2 (2) Where ; (3) In the expressions above, is the thickness of the plate, the angular frequency, the wave number and and the compression and shear wave velocities respectively. Equations (1) and (2) predict two different modes of propagation. One of them is symmetric (1) and the other antisymmetric (2). These modes propagate across the midplane of the plate (Figure 1). Two fundamental modes and and the corresponding higher order modes can be seen in Figure 1. From the dispersion curves shape, Lamb predicted four different waves in the plate: the bending wave, shear wave, quasi longitudinal wave and Rayleigh wave. In the high frequencies limit, Figure 1 shows all that Excerpt from the Proceedings of the 2011 COMSOL Conference in Stuttgart
Transcript of Gomez Paper

7/27/2019 Gomez Paper
http://slidepdf.com/reader/full/gomez-paper 1/5
Lamb Waves and Dispersion Curves in Plates and its
Applications in NDE Experiences Using Comsol Multiphysics
Pablo Gómez*,1
, José Paulino Fernández1 and Pablo David García
1
1Hydro-Geophysics & NDE Modeling Unit. C/ Gutierrez Quirós s/n. University of Oviedo.
Mieres, Spain.*Pablo Gómez: [email protected]
Abstract: A model for numerically obtaininglamb wave modes and dispersion curves in plates is presented. It is shown that COMSOLMultiphysics can be employed to simulate the behavior of guided waves in dispersive plates,
which is useful for NDE applications.The simulation results will be used to obtain atime-offset acceleration profile where thedispersive lamb modes of propagation areimplied. The MASW (Mutichannel analysis ofsurface waves) is then employed for data processing making explicit the presence and
character of the lamb different propagationmodes. The curves are then interpreted. Thelink between MATLAB and COMSOL fortransforming the simulation in interpretablecurves is very convenient for routinecomparison between numerical and analytical
or experimental solutions.
Keywords: Lamb waves, Dispersion curves,MASW, Numerical modeling.
1. Introduction
The dispersive behavior of differentstructural elements is very interesting in NDEapplications. Specifically, in acousticevaluation where a stratified media is presented, techniques like Impact-Echomethod (Sansalone, 1985) is not enough for
studying the thickness of different layers.
The reason of the above is that, across the
plates, different frequency components of theinput signal travels at different velocities(Graff, 1975). Thus, the idea of a specific
frequency traveling up and down across thethickness of the plate makes no sense becauseguided waves phenomena grow up in the layer.
The behavior of guided waves in plateswas first studied by Lamb (1905). Since then,many researchers have been working in this
field over years. Recently works (Ryden,2004) (Park, 2000) have shown how tocombining spectral analysis and dispersive
phenomena to determinate thickness andvelocity profiles in stratified media.
In this paper we are going to use Comsol
Multyphisics to generate pseudo-experimentaldata which can be analyzed over the MASW(Multichannel Analysis of surface waves)method for getting dispersion curves. AMatlab code is then employed for data processing showing how Comsol can be veryuseful for the study of guided waves in plates
and for comparison with the experimental data.
2. Lamb Waves
As we said, Lamb derived the dispersionrelation for different waves traveling across the
plane of a free plate. According to him, onlysome frequency-velocity pairs can propagate
through it. This pairs can be obtained from thedispersion relations:
tan2
tan2
42
222 (1)
and
tan2
tan2
222
42 (2)
Where
;
(3)
In the expressions above, is the thickness
of the plate, the angular frequency, the
wave number and and the compressionand shear wave velocities respectively.
Equations (1) and (2) predict two differentmodes of propagation. One of them issymmetric (1) and the other antisymmetric (2).These modes propagate across the midplane ofthe plate (Figure 1).
Two fundamental modes and and thecorresponding higher order modes can be seenin Figure 1. From the dispersion curves shape,
Lamb predicted four different waves in the plate: the bending wave, shear wave, quasi
longitudinal wave and Rayleigh wave. In thehigh frequencies limit, Figure 1 shows all that
Excerpt from the Proceedings of the 2011 COMSOL Conference in Stuttgart

7/27/2019 Gomez Paper
http://slidepdf.com/reader/full/gomez-paper 2/5
of them travel at the Rayleigh wave velocity
and at the shear wave velocity.
Figure 1. Normalized dispersion curves for a free
plate (Ryden Thesis, 2004).
.
3. Multichannel Analysis of Surface
Waves (MASW)
Different surface waves analysis methodsfor getting experimental dispersion curveshave been performed over the years. MASWmethod is one of them and we are going to
explain its basis here.
Taking into account the features of the twodimensional Fourier Transform (2DFFT), thespatial and temporal variables can be relatedwith the spatial and temporal frequencies and
thus, obtain the experimental dispersion curves(because the phase velocity is the ratio between both). To do that, a large number ofreceivers located at the surface plate arenecessary. The receivers record theacceleration field generated by an excitationsignal (in general a hammer impact, Figure 2).
The distance between each receiver must bethe same and, it should be chosen accordingthe Nyquist criteria for the spatial frequency.Since the spatial frequency is related with theminimum wavelength, an estimation of it will be necessary for instance, with thecompression wave velocity of the plate. From
the above, one can chose the distance betweenreceivers and the length over the surface whichis going to be evaluated.
Figure 2. MASW experience scheme.
Similar considerations made for the spatialsampling are also necessary for temporalsampling and good frequencies detection.
Under Figure 2 configuration, an x-t profile can be measured. This profile defines a
two dimensional function
,
The Fourier transform with respect to thetime variable can be written as
, , (4)
The function
, can be now
considered as a product of two different terms.The amplitude and the phase spectrums
, , , (5)
The amplitude spectrum , containsinformation related with the attenuation and
spherical divergence, however, the phase
spectrum , contains all informationabout the dispersion properties (park et al,2001). Therefore we have
, , (6)
Where /, is the ratio between
frequency and phase velocity. Applying now
the Fourier Transformation to the spatialcoordinate we get
, , (7)
The function , is a two dimensionalfunction obtained from 2DFT. For a given
frequency , , will be maximum if
/ (8)
And thus, the phase velocity can bedetermined from the transformed variables.
The function , is very useful because itsAmplitude contains the information aboutwhich pairs of transformed variables transportthe most energy. Then, with the chang newvariables (8) we obtain an intensity function
, which will have picks over the
dispersion curves predicted for the plate.

7/27/2019 Gomez Paper
http://slidepdf.com/reader/full/gomez-paper 3/5
Because of the above, MASW method can
be used to obtained dispersion curves derivedfrom experimental data, plotting and image of
the function we get the k-f representationand then, doing the change variables, we
perform finally the v ph-f representation.
3. Use of COMSOL Multiphysics
The experimental procedure in MASWmethod needs to apply a suddenly force and torecord the acceleration in different points ofthe surface plate. Taking into account the
elastic nature of the body, the Solid MechanicsModule of Comsol is used to solve the timedependent problem. This kind of study allows
solving the elasticity equations for a linearelastic solid in the time domain.
A 2D model has been performedsimulating the cross section of a steel plate(4x0.1 m). We have as Local ModelDefinitions 40 acceleration probes (measuringthe y axis acceleration component) located onthe surface plate. A point on the surface has
been defined to locate the impact source. Alldistances included are shown in Figure 3
Figure 3. Simulation configuration
According with Sansalone (1985) theimpact has been simulated with a sine pulse
force applied to the surface. Differentexperiences with a steel plate showed us thatthe duration of a hammer impact on the steel
surface rounds 200 microseconds (Figure 4).Due to it, as last Local Definitions, a sinefunction was included.
A point load equal to the sine functiondefined above is acting only during the first200 microseconds. Finally, we have used a
triangular mesh for our domain.
The Nyquist criteria apply to our receiverspacing (5cm), gives us a minimum
wavelength 10. Moreover, the time
dependent solver has been set up manually,
forcing the solver to evaluate solutions from
10 to 10 microseconds, which give us a
sampling frequency 50. Figure 1
indicates one frequency value above all and
frequencies travels at Rayleigh wavevelocity. The physical reason for this is thatthe high frequencies, which correspond withlow wavelengths, are not able to “see” the bottom of the plate and, therefore, travels atRayleigh wave velocity as if the medium was a
half-space. Our temporal and spatial samplingcriteria have been chosen according with theabove consideration for see, at least, thisfrequency value. Finally, the simulation timehas been 4 ms, which is enough for detectingall phenomena imply in the process.
Figure 4. Temporal sine pulse used for simulatingthe impact point force applies to the surface plate.
The material properties used in the modelare shown in Table 1
Density Compressionwave velocity
Shear wavevelocity
8030(kg/m3) 5659 (m/s) 3120 (m/s)
Table 1: steel plate elastic constants used.
The signals obtained with the model will be then employed in a post-processing dataover Matlab code develops on the basis ofMASW method.
4. Results and discussion
While the model is running, the maximumand minimum displacement zones created in
the plate due to the dispersive Lamb waves can be seen (Figure 5). Simulation results obtainedin the time dependent study performed with
Comsol are used to get the time-offset profile
0.5 1 1.5 2 2.5
x 10-4
0
0.2
0.4
0.6
0.8
1
Time (s)
F o r c e
( N )
7/27/2019 Gomez Paper
http://slidepdf.com/reader/full/gomez-paper 4/5
whisee
Figu
Max
wav
Irepr
spatiTradatamat
func plot
zon
of tf) re
Figu
obtai
h defines ouigure 6.
re 5. Simulamum and mini
s are visible.
n the datasent our tw
al) discretesform Matlamatrix. As pix, which is t
tioning. As we sa
s of
e layer in th presentation (
re 5. Pseuned from the C
0 . 5
1
1 . 5
2
2 . 5
3
3 . 5
4
x 1 0
- 3
0 . 0 0 5
T i m e
( s )
r two dimen
tion imagemum zones du
we have adimensiona
unction. A b code is ruogram outpuhe amplitude
. A color iid in section
follow the d
wave numbFigure 7)
o-experimentomsol simulati
0 . 0 1
Offset (10
sional functi
aken at 1to the dispers
matrix whil (temporal a
D Fast Four nning overreturns anot
of the spectr
age can th, the maxim
spersion cur
er-frequency
l (x,t) proon.
0 . 0 1 5
0 . 0 2
m )
n,
s.ive
chnd
ierheerm
mm
es
k-
ile
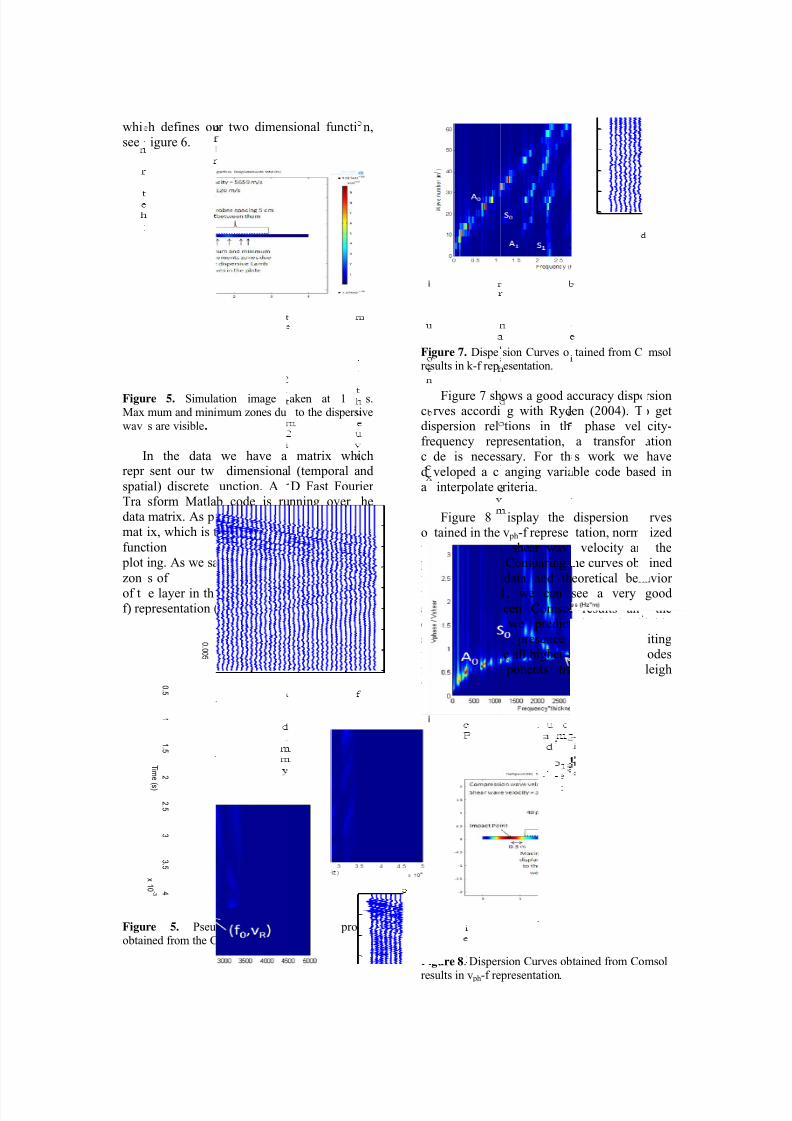
Fi
re
cdifr c
d a
ow pl
fr
fr aesifr
fr w
Fi
re
gure 7. Dispesults in k-f rep
Figure 7 shrves accordispersion relequency repde is neces
veloped a c interpolate c
Figure 8
tained in theith respect tate thickness.
om Comsol
om Figurecuracy betw pected. Asgnificant thequency aboequency coave velocity.
gure 8. Disper
sults in v ph
-f re
sion Curves oesentation.
ows a good ag with Ryd tions in thresentation,sary. For th
anging variariteria.
isplay thev ph-f represe shear wav Comparing t
data and th
1, we caneen Comsolwe predict presencee all higher f ponents tra
sion Curves ob
presentation.
tained from C
ccuracy dispeen (2004). T phase vela transfor s work we
ble code bas
dispersion ctation, norm velocity anhe curves obt
eoretical beh
see a veryresults an
ed, it is hof the li
undamentalvels at Ra
tained from Co
msol
rsiono getcity-ationhave
ed in
rveslized
theained
avior
goodthe
ighlyitingodesleigh
msol

7/27/2019 Gomez Paper
http://slidepdf.com/reader/full/gomez-paper 5/5
Another important aspect is how thevelocity value at the limiting frequency is
slightly below of the shear wave velocity. Thisis consistent with the theoretical limitcorresponding at Rayleigh wave velocity because, according with Graff (1975), the R-
wave velocity is about 80% of the S-wavevelocity.
Finally, it should also be noted how the
beginning of the mode is not detected. This
result was also expected because this phasevelocity-frequency pairs correspond to a higherwavelength values which are not measuredunder our experimental configuration.
5. Conclusions
As a conclusion, this Paper shown as
Comsol Multyphysics simulation software isvery useful for the study and obtainingdispersion curves in plates. The results showhow the simulation predicts the theoretical behavior correctly. Therefore, Comsol can beused to compare experimental results withtheoretical curves and, most importantly, to predict how different situations affect the
dispersion relations for instance: boundary
conditions, sources and receivers locations,different thickness layer, matched layers, ordifferent component materials.
Theoretically, Lamb dispersion relations
haven’t analytical solutions. Thereforealgorithms based on roots finding arenecessary for implementing solutions. That isthe reason why Comsol give us a solution to a problem the is useful in acoustic NDEexperiences.
6. References
1. Miller, R.D., Xia, J., Park, C.B., andIvanov, J.M., Multichannel analysis of surface
waves to map bedrock, Kansas GeologicalSurvey, The Leading Edge, December, pp1392-1396. 1999
2. Nazarian, S., Stokoe, II K.H., Briggs, R.C.,and Rogers, R. Determination of pavement
layer thicknesses and moduli by SASWmethod, Transp. Res. Rec. 1196, Washington
DC, pp 133-150. 1987,
3. Nazarian, S., Yuan, D., and Tandon, V.Structural Field Testing of Flexible PavementLayers with Seismic Methods for QualityControl, Transp. Res. Rec., 1654, pp 50-60.1999
4. Park, C.B.,et al, Multi-channel analysis ofsurface waves using Vibroseis (MASWV),Kansas Geological Survey, 66th Ann. Internat.Mtg. Soc. Expl.Geophys., Expanded Abstracts, pp 68-71. 1996
5. Park, C.B., Miller, R.D., and Xia, J.Detection of near-surface voids using surface
wave, Proceedings of the Symposium on theApplication of Geophysics to Engineering andEnvironmental Problems (SAGEEP 1999),Oakland, CA, March 14-18, pp 281-286.1999a
6. Park, C.B., Miller, R.D., and Xia, J.Multichannel analysis of surface waves,Kansas Geological Survey, Geophysics, Vol64, No 3, pp 800-808. 1999c
7. Ryden, N. SASW as a tool for non
destructive testing of pavements, MSc thesis,Univ. of Lund, Sweden. 1999
8. Ryden, N., Park, C. B., Ulriksen, P. and
Miller, R. D. Multimodal approach to seismic pavement testing, Journal of Geotechnical andGeoenvironmental Engineering, ASCE, Vol.130, No. 6, pp 636-645. 2004
9. Ryden, N., Park, C.B., Ulriksen, P., andMiller R.D. Lamb wave analysis for non-destructive testing of concrete plate structures,Proceedings of the Symposium on theApplication of Geophysics to Engineering and
Environmental Problems (SAGEEP 2003), SanAntonio, TX, April 6-10, INF03. 2003
10. Ryden, N., and Park, C.B. Surface wavesin inversely dispersive media, Accepted for publication in: Near Surface Geophysics. 2004
11. Ryden, N., and Lowe, M. Guided wave propagation in three-layer pavement structures,Submitted for publication to: Journal of theAcoustical Society of America. 2004