GOME-2 Polarisation Study — Final Presentation L.G. Tilstra (1,2), I. Aben (1), P. Stammes (2) (1)...
51
GOME-2 Polarisation Study — Final Presentation L.G. Tilstra (1,2) , I. Aben (1) , P. Stammes (2) (1) SRON; (2) KNMI EUMETSAT, Darmstadt, 28-11-2008
-
Upload
pierce-anthony -
Category
Documents
-
view
213 -
download
0
Transcript of GOME-2 Polarisation Study — Final Presentation L.G. Tilstra (1,2), I. Aben (1), P. Stammes (2) (1)...

GOME-2 Polarisation Study — Final Presentation
L.G. Tilstra (1,2), I. Aben (1), P. Stammes (2)
(1)SRON; (2)KNMI
EUMETSAT, Darmstadt, 28-11-2008

2
Overview
1) Introduction of validation techniques
2) Evolution of the data processor
3) Task 1 – Special geometries analysis
4) Task 2 – Limiting atmospheres analysis
5) Solar irradiance measured by the PMDs
6) Errors on Stokes fractions and main science channel radiance
7) Task 3 – PMD raw mode
8) Summary
9) Recommendations

3
1) Validation of GOME-2 polarisation data (Stokes fraction Q/I)
A. Inspect so-called “butterfly diagrams” of Q/I versus (Q/I)ss
B. Focus on special geometries along the orbit where Q/I = 0
C. Limiting atmospheres approach
D. Focus on the solar irradiance (sunlight is unpolarised)
Available techniques:

4
A. Butterfly diagrams
In general, we expect 0 < Q/I < (Q/I)ss for most measurements.
Exceptions are:
near-backscattering geometries
sunglint geometries
rainbow geometries (Θ between 130° and 155°)(v4.0)
5
B. Special geometries where Q/I = 0
A. Situations where cos(2χss) = 0 [or: χss=45° or 135°]
++ many situations are found, along virtually the entire orbit (because of the many situations are found, along virtually the entire orbit (because of the large range of viewing angles and the small pixel sizes in scan direction)large range of viewing angles and the small pixel sizes in scan direction)
++ very high accuracy (for each day of data)very high accuracy (for each day of data)
–– these are special situations where (U/Q)these are special situations where (U/Q)ssss is undetermined, and the data is undetermined, and the data
processor treats these situations in a special way by setting U/I = 0 (!!)processor treats these situations in a special way by setting U/I = 0 (!!)
B. Backscatter situations (Θ = 180°)
++ rainbow and sunglint situations are automatically filtered outrainbow and sunglint situations are automatically filtered out
–– situations are only found “around the equator” (situations are only found “around the equator” (φφ––φφ00≈180°)≈180°)
–– situations occur for a very small range of viewing anglessituations occur for a very small range of viewing angles
The results from approach (B) agree completely with those of approach (A)
Q/I = P·cos (2χ) (P = degree of polarisation, χ = direction of polarisation)

6
C. Limiting atmospheres PMD 14 (~756 nm):
Very low scattering optical thickness (~0.02);
mostly single scattering processes.
The depolarised limit is reached for clouds.
The polarised limit is obtained in the case of a
“black surface” (ocean and sea).
For the depolarised limit we have Q/I≈0.
For the polarised limit we have Q/I≈(Q/I)ss.
PMD 2 (~317 nm):
Higher scattering optical thickness.
Single, but also multiple scattering processes.
Black surface: soil, vegetation, ocean, or sea.

7
2)2) Evolution of the data processor Evolution of the data processor

8
“Butterfly diagrams”:
(rainbow geometries removed)
(v4.0)
General behaviour ok Scatter for the shorter wavelengths
Scatter is caused by very low signal
levels. Happens rarely. Could even
be corrected by bringing the Q/I back
to their single scattering value.
9
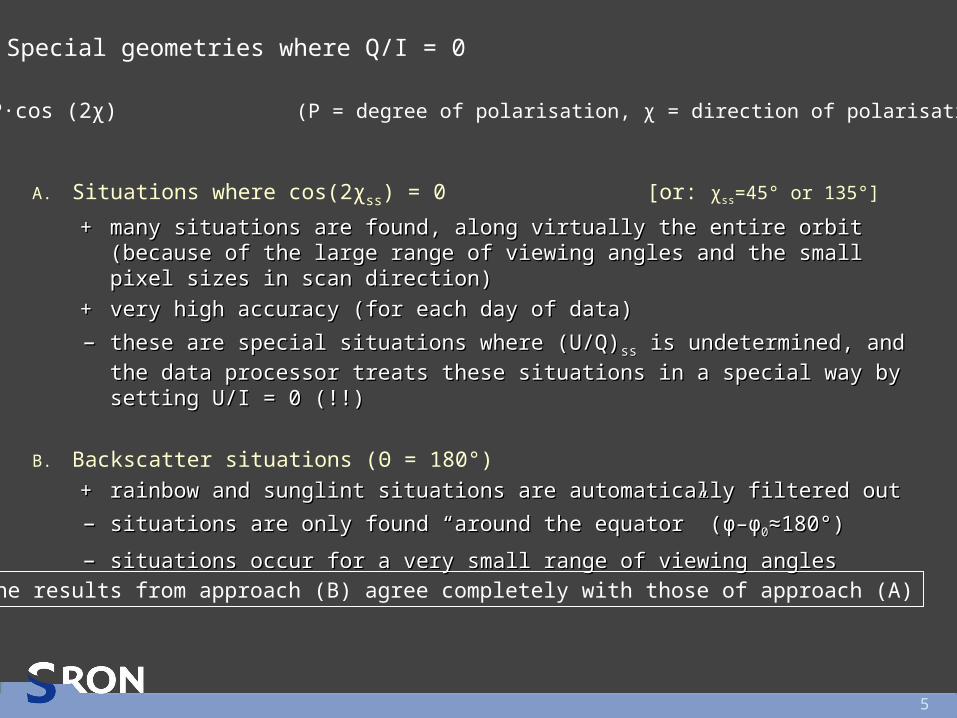
Processor version 3.4 /
PMD band definition v1.0
14 June 2007, one orbit
1. Wavelength dependent offset
2. Scan-angle dependence
3. Two branches exist
blue points : |cos(2χss)| ≤ 0.01
red points : 177° ≤ Θ ≤ 180°
green points : (Q/I)ss
Branches: Northern and Southern part of the orbit, separated by the principal plane (where the backscattering points are located).

10
Processor version 3.7 /
PMD band definition v2.0
9 October 2007, one orbit
blue points : |cos(2χss)| ≤ 0.01
red points : 177° ≤ Θ ≤ 180°
green points : (Q/I)ss
Introduction of PMD band definition v2.0 has a large effect, especially in the UV. Offsets have changed, but there is clearly a strong overcorrection.

11
By studying the ratio of the (calibrated) solar irradiance spectra measured by PMD-p and PMD-s, and by shifting PMD-s w.r.t. PMD-p by 0, 1, 2, 3, and 4 detector pixels, we found a misalignment of ~2 detector pixels in the UV more appropriate than the ~4 detector pixels shift in PMD band definition v2.0.
Cause of the overcorrection:
The wavelength calibration of the PMDs turned out to be incorrect, leading to an overestimation of the spectral misalignment of PMD-p w.r.t. PMD-s, and hence an overcorrecting by PMD band definition v2.0.
EUMETSAT improved the wavelength calibration of the PMDs, resulting in a new PMD band definition, v3.1.

12
Processor version 3.8 /
PMD band definition v3.1
5 February 2008, one orbit
blue points : |cos(2χss)| ≤ 0.01
red points : 177° ≤ Θ ≤ 180°
green points : (Q/I)ss
1. Offsets ≈ 0 (for exact nadir)
2. Scan-angle dependence
3. Branches have joined together
Idea: scan-angle dependence of polarisation key data incorrect.EUMETSAT: new polarisation key data obtain from PMD raw mode.

13
blue points : |cos(2χss)| ≤ 0.01
red points : 177° ≤ Θ ≤ 180°
green points : (Q/I)ss
Processor version 3.9 /
PMD band definition v3.1 /
New polarisation key data
26 March 2008, one orbit
Scan-angle dependence better, but
can still be improved. There are still
systematic offsets, but only for the
longer wavelengths (so, not caused by
spectral misalignment PMDs).
Processor version 4.0: sign of U/I.
Effect on Q/I small, large effect on
radiance main science channels.
14
3)3) Task 1 – Special geometry analysis Task 1 – Special geometry analysis

yellow : 3.7 a
red : 3.8 a + b 02/2008
green : 3.9 b + c 03/2008
blue : 4.0 b + c + d 06/2008
Data since 01-01-2008 (10 months)
Every 3rd day is processed, in total 95 days
PMD band definition v3.1 is active since the
beginning of March 2008
a) PMD band definition v1.0
b) spectral calibration fixed
c) PMD band definition v3.1 + new key data
d) change in sign Stokes parameter U
Special geometries: results
[recent near-real time data]

Special geometries: results
[recent near-real time data]
yellow : 3.7 a
red : 3.8 a + b 02/2008
green : 3.9 b + c 03/2008
blue : 4.0 b + c + d 06/2008
a) PMD band definition v1.0
b) spectral calibration fixed
c) PMD band definition v3.1 + new key data
d) change in sign Stokes parameter U
Data since 01-01-2008 (10 months)
Every 3rd day is processed, in total 95 days
PMD band definition v3.1 is active since the
beginning of March 2008

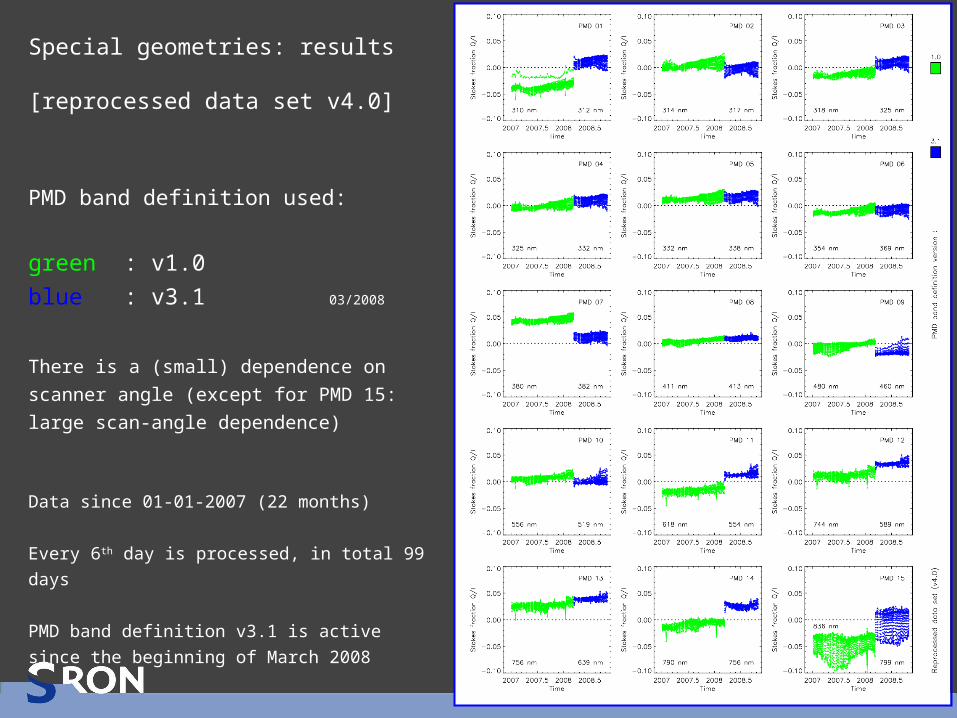
Special geometries: results
[reprocessed data set v4.0]
PMD band definition used:
green : v1.0
blue : v3.1 03/2008
There is a (small) dependence on scanner
angle (except for PMD 15: large scan-
angle dependence)
Data since 01-01-2007 (22 months)
Every 6th day is processed, in total 99 days
PMD band definition v3.1 is active since the
beginning of March 2008

19
PMD 8:
Looks ok: no transition occurs when going from data measured with PMD band definition v1.0 to data measured with PMD band definition v3.1.
PMD band definition used:
green : v1.0
blue : v3.1
Accuracy of the method:
0.001–0.005
Trend due to degradation?

20
PMD 7:
Clear transition in going from PMD band definition v1.0 to PMD band definition v3.1 (improvement) ; small scan-angle dependence, increasing with time.
PMD band definition used:
green : v1.0
blue : v3.1
Trend due to degradation?

21
PMD 12:
In this case, the situation seems to have worsened. However, the wavelengths in the two PMD band definitions are very different (744 versus 589 nm).
PMD band definition used:
green : v1.0
blue : v3.1

22
PMD 1:
Transition (improvement). Deviating behaviour (at a scanner angle of about –40 degrees) is caused by measurement 245 in each (backward) scan. Reported.
PMD band definition used:
green : v1.0
blue : v3.1
Trend due to degradation?
(reset pixels: 241-244)

23
PMD 15:
The error was reported and the bug was traced down by EUMETSAT. The bug will be fixed in the next version of the GOME-2 data processor (v4.1).
PMD band definition used:
green : v1.0
blue : v3.1
This large scan-angle
dependence was not present
in version 3.9.
(version 3.9 should give the
same results as version 4.0
for the special geometries)

24
4)4) Task 2 – Limiting atmospheres analysis Task 2 – Limiting atmospheres analysis
25
Limiting atmospheres: results for recent near-real time data
Slopes of linear fits
O : polarised limit
◊ : depolarised limit
Data since 01-01-2008
Every 3rd day is processed,
in total 95 days
PMD band definition v3.1 is
active since the beginning
of March 2008
? temporal behaviour ?

26
Limiting atmospheres: results for recent near-real time data
Intercepts of linear fits
Intercepts of
polarised and
depolarised fit
agree nicely
v4.0: PMD 15 ?
(data since 01-01-2008)
O : polarised limit
◊ : depolarised limit

27
Limiting atmospheres: results for reprocessed data set (v4.0)
Slopes of linear fits
O : polarised limit
◊ : depolarised limit
Data since 01-01-2007
Every 6th day is processed,
in total 99 days
PMD band definition v3.1 is
active since the beginning
of March 2008
? periodic behaviour ?

28
Limiting atmospheres: results for reprocessed data set (v4.0)
Intercepts of linear fits
PMD band definition
v3.1 yields better
results: initial
wavelength mismatch
between PMD-p and
PMD-s smaller
v4.0: PMD 15 noisy
(data since 01-01-2007)
O : polarised limit
◊ : depolarised limit

29
Polarised limit: comparison with simulations of limiting atmospheres
Blue circles: simulated Q/I for PMD 14, based on input parameters of GOME-2 measurements, including ozone column, viewing and solar angles, for a fixed surface albedo of 0.002 (ocean).
Dependence on surface albedo: even very small changes in the surface albedo already cause a different position of the limit. Polarised limit is very sensitive.
756 nm
756 nm
30
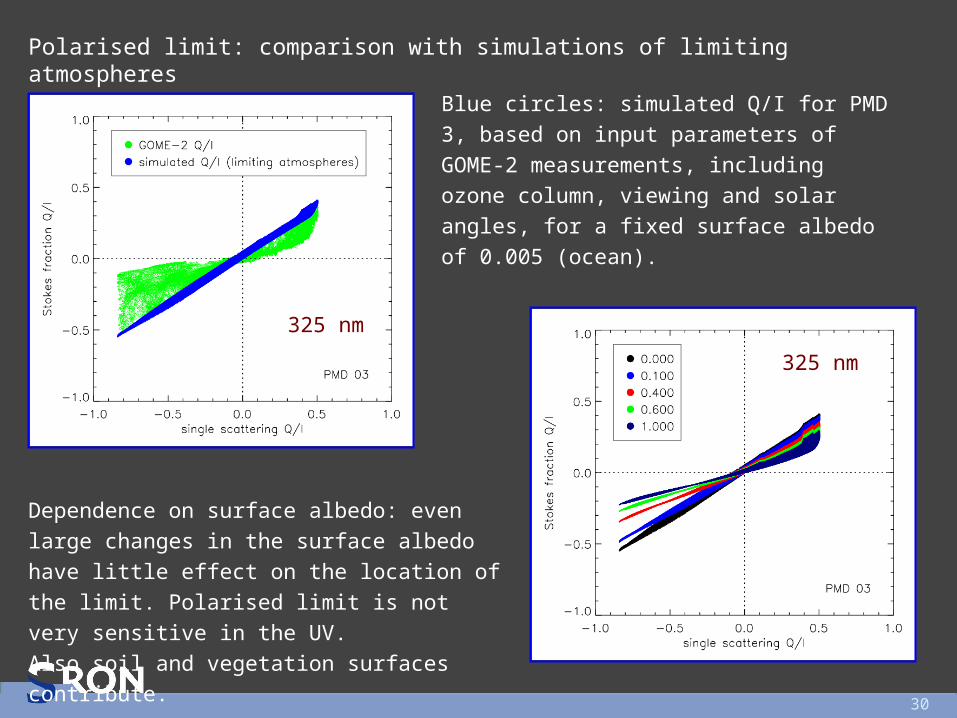
Polarised limit: comparison with simulations of limiting atmospheres
Blue circles: simulated Q/I for PMD 3, based on input parameters of GOME-2 measurements, including ozone column, viewing and solar angles, for a fixed surface albedo of 0.005 (ocean).
325 nm
Dependence on surface albedo: even large changes in the surface albedo have little effect on the location of the limit. Polarised limit is not very sensitive in the UV.Also soil and vegetation surfaces contribute.
325 nm

31
5)5) Solar irradiance measured by the PMDs Solar irradiance measured by the PMDs

32
4) Solar irradiance measurements by the PMDs
Irradiances of PMDs p and s should be the same; their intensity ratio should be 1
Effect of distance
between Earth and
Sun is divided out
Improvement with
new PMD band
definition v3.1
Temporal behaviour:
different degradation
of PMD-p and PMD-s

33
Difference in solar irradiance, for all 15 PMD bands:
The shape of the ratio cannot be caused by degradation (alone). Key data issue?

34
Degradation of PMD-p:
corrected for distance Earth-Sun, normalised to 1 at the start of the time series
Strong degradation for
the shorter wavelength
PMDs (1-8):
Rate of ~20% per year
v4.0

35
Degradation of PMD-s:
corrected for distance Earth-Sun, normalised to 1 at the start of the time series
Again strong
degradation for the
shorter wavelengths
Looks like PMD-s is
less stable than PMD-p,
and also more
responsible for the
periodic behaviour of
their ratio than PMD-p
v4.0

36
6)6) Errors on Stokes fractions and main science channel radiances

37
Systematic offsets found for the PMD bands:(average over 2½ months)
very consistent results
depolarised limit agrees
with polarised limit
polarised limit less
accurate for long
wavelengths
Error bars:
limiting atmospheres: no
error assumed in slope
(statistical error)
special geometries:
error larger because of
scan-angle dependence

38
Effect of errors in the Stokes fractions on the radiances of the main science channels
Errors are below ~0.5% for all
wavelengths
Shorter wavelength: smaller errors
despite higher sensitivity to
polarisation
Sensitivity of the main science channels to
polarisation (Stokes fraction Q/I) : mu_2

39
7)7) Task 3 – PMD raw mode Task 3 – PMD raw mode
Earth reflectance
Stokes fractions

40
PMD raw mode:
In PMD raw mode, GOME-2 measures the spectrum at the full spectral
resolution, using all 256 detector pixels, at the expense of the spatial
coverage, which is 1/16th of the normal coverage. The first 15
measurements in a scan are skipped, and the 16th is recorded (at the full
spectral grid). This is repeated 16 times in each scan.
Simulations:
The simulations are performed by the
polarised radiative transfer model
“DAK” (v3.1). The ozone columns are
determined from SCIAMACHY
assimilated total ozone columns.
Surface albedo values are obtained
from a LER database. Above 400 nm, a
very high accuracy of the LER values is
required, which is not available.

41
Selection of cloud-free scenes using AVHRR data (provided by EUMETSAT)
(left:) AVHRR cloud fraction
Two orbit parts: right part θ0 > 90°,
left part mostly over sea
(right:) cloud fraction < 0.05
Yellow circle in Alaska: suitable
GOME-2 PMD raw measurement
with cloud fraction ~0.00

42
Scene 1 – Alaska (land)
(west-viewing geometry)
Clear signatures of vegetation.
Fair agreement, even for the longer
wavelengths. In the UV ~3% off.
Below ~320 nm the values are too
high (probably straylight).
Red points : GOME-2
Blue points : simulations
Green lines : Q/I=0 and Q/I=(Q/I)ss
Good agreement, keeping in mind
that we know that there should be
offsets. Offsets roughly as large as
expected. Noise at the shorter
wavelengths: low signal levels.

43
Poor agreement for the longer
wavelengths. Surface albedo
clearly not correct.
Shape looks reasonable, but the
deviation is not as expected for the
longer wavelengths. A too high
value for the surface albedo leads
to enhanced depolarisation.
Scene 2 – Canada (land)
(east-viewing geometry)

44
Scene 3 – Alaska II (land)
(west-viewing geometry)
Fair agreement for the longer
wavelengths. In the UV ~4–7% off.
Very similar to Scene 1.
Good agreement, offsets are similar
to offsets found for Scene 1 (and
those were roughly similar to the
offsets for the PMD bands found
from the special geometry and
limiting atmospheres analyses).

45
Scene 4 – Special geometry scene
(cloudy, ocean)
There are oscillations at the longer
wavelengths. Also seen in Scenes 1–3.
Reasonable agreement, offsets follow
the shape of the offsets found before.
All in all: error on Q/I for the PMD raw
mode is smaller than 0.05 (above 320
nm), and most likely similar to the
errors found for the PMD band data.

46
8) Summary (1/2)
Special geometry and limiting atmospheres analyses have consistent results
(Stokes fraction).
Both analyses show a very clear improvement with every new data processor
version.
In particular, there was a large improvement with the introduction of PMD band
definition v3.1 and new (polarisation) key data.
The scan-angle dependence has been reduced, but is still there to some degree
see recommendations.
Behaviour of PMD 15 since processor version 4.0: bug will be fixed in v4.1.
Solar PMD data show periodic oscillations suggesting problems in the (diffuser)
calibration.
The solar irradiance spectra measured by PMD-p and PMD-s show a rate of
degradation ~20% per year in the UV.

47
8) Summary (2/2)
At the moment, the degradation of PMD–p and PMD-s is very similar The
effect on the Stokes fractions (so far) is small. The decision to use two
orthogonal PMDs (instead of one in combination with the main science
channels for GOME-1) is paying off.
(Relative) degradation correction for the PMDs may be necessary to obtain
reliable Stokes fractions in the future.
This degradation correction is probably scanner-angle dependent.
Some time-dependent periodic behaviour is also visible in the Stokes fractions.
PMD raw mode Stokes fraction and Earth reflectance look reasonable, and copy
the validation results of the PMD band data.
Systematic offsets in Stokes fractions are below 0.02 for wavelengths below
520 nm, and below 0.04 for the longer wavelengths.
Effect of errors in Stokes fractions on main science channel radiance /
reflectance is below the 0.5%.

48
9) Recommendations:
The scan-angle dependence, which was reduced by already a lot, can and
needs to be further reduced (ongoing work at EUMETSAT).
Implement a correction for the Stokes fractions (i.e., for the ratio of PMD-p and
PMD-s signals) based on the special geometry approach (scan-angle
dependent). This then automatically corrects for instrument degradation,
temporal variations and scan-angle dependencies.
Acknowledgements :
We greatly acknowledge support from EUMETSAT (R.Lang, Y.Livschitz,
R.Munro). In particular also the very quick analyses, testing and
implementation of improvements in the operational data processor.

49

50
Limiting atmospheres: how to determine the limits (1)
Some of the practical problems:
– filter out rainbow situations (130° ≤ Θ ≤ 155°)
– filter out “suspicious” pixel 245 for each scan:
note that this is the pixel following reset pixels 241–244
PMD radiance is approximately a factor 5 too high (why?)
Q/I looks ok, but sometimes “saturation-like” effects occur
– outliers for short wavelength PMD bands: signals too low?
PMD 1, 14-07-2008 (1 day of data)
~2 million measurements, version 4.0

51
Limiting atmospheres: how to determine the limits (2)
Approach:
– horizontal bins with cell size 0.02 (optimum)
– per horizontal cell, determine the histogram using vertical bins of 0.01
– determine the two edges of this distribution function
– assign a weight to these edges, based on the number of measurements
– fit a linear function through the points, using the weights
depolarised limit
polarised limit
PMD 5, all limits found in 2008
(some more fine tuning may further improve the results)