Gold Versus Paper June 17 2011 Letter
14
Gold Versus Paper Turning paper into Gold June 17, 2011 1. LONG TERM PRICTURE (months to years) Gold is good, stocks are b ad. Gold continues to act as the safest global currency. Hold onto your Gold! We have previously covered the fairly compelling data indicating that Gold stocks are a buy (at least for a trade). But I wa nt to remind you that I believe Go ld stocks are better for renting as opposed to owning. For the long haul, I’ll take Gold over Gold stocks (as a sector) any day. Why? The major reason is a common fallacy turned on its head by a long-term chart, which I stole from this article by Steve Saville, an experienced market commentator whom I respect. The fallacy is that Gold stocks provide leverage to the price of Gold. Below is a ratio chart of the Barron’s Gold Mining Index divided by the price of Gold. The area of interest on the chart is the 1970s Gold bull market: So much for Gold stocks o utperforming Gold! Heavy inflation is hard on Gold miners just like it is on other businesses, as costs become difficult to control. The fundamentals for Gold miners are actually better in a deflationary environment, as the price of Gold tends to hold up better than other commodities, increasing operating margins for Gold mining firms.
Transcript of Gold Versus Paper June 17 2011 Letter

5/7/2018 Gold Versus Paper June 17 2011 Letter - slidepdf.com
http://slidepdf.com/reader/full/gold-versus-paper-june-17-2011-letter 1/14
Gold Versus Paper
Turning paper into Gold
June 17, 2011
1. LONG TERM PRICTURE (months to years)
Gold is good, stocks are bad. Gold continues to act as the safest global currency. Holdonto your Gold!
We have previously covered the fairly compelling data indicating that Gold stocks are a buy (at least for a trade). But I want to remind you that I believe Gold stocks are better for renting as opposed to owning. For the long haul, I’ll take Gold over Gold stocks (as asector) any day. Why? The major reason is a common fallacy turned on its head by along-term chart, which I stole from this article by Steve Saville, an experienced marketcommentator whom I respect. The fallacy is that Gold stocks provide leverage to the price of Gold. Below is a ratio chart of the Barron’s Gold Mining Index divided by the price of Gold. The area of interest on the chart is the 1970s Gold bull market:
So much for Gold stocks outperforming Gold! Heavy inflation is hard on Gold miners just like it is on other businesses, as costs become difficult to control. The fundamentalsfor Gold miners are actually better in a deflationary environment, as the price of Goldtends to hold up better than other commodities, increasing operating margins for Goldmining firms.

5/7/2018 Gold Versus Paper June 17 2011 Letter - slidepdf.com
http://slidepdf.com/reader/full/gold-versus-paper-june-17-2011-letter 2/14
Having shown this admittedly not very encouraging chart, there were a few nice spikesduring the 1970s that were worth trying to catch, particularly the 1973-1974 spike in thisratio.
Gold is safer than Gold stocks and at the same time will likely outperform Gold stocks asa sector (individual opportunities aside, but I am not a stock picker or mining expert).Another point of this chart is to show just how undervalued Gold stocks are relative toGold historically right now (the chart only goes thru the start of 2010 and things haven’tgotten better since then), which is actually bullish for Gold stocks over the intermediateterm.
The second reason I prefer Gold to Gold stocks is that both during the bull market inGold stocks in the 1930s and in the 1970s, the largest gains for Gold stocks occurredAFTER the Dow to Gold ratio bottomed! In other words, once we reach a Dow to Goldratio of 2 (and we may go below 1 this cycle), it will be time to sell your Gold. And then
buy… Gold stocks (as an intermediate-term trade)!
2. INTERMEDIATE TERM PICTURE (weeks to months)
The “risk-off” trade is at or very near its end, which is why I recommended that you buythe NUGT ETF this week. The previous letter and updates showed the reasons why Iliked this trade and recommended it. I think the GDX/NUGT low is already in, althoughit is possible we re-test it.
Please keep in mind that I am recommending a TRADE here, not an investment. In other
words, if I am wrong and all we get here is a relief rally of 15% in GDX before another down leg in the Gold stocks, then we will get out with a profit. Here is an important data point for you, posed as a question: Do you know how many times the $HUI Gold BugsMining Index has declined for 10 or more weeks straight without an intervening 15% or more rally since the Gold stock bull market began in late 2000? The answer is two.
The first was back in early 2005, when a 12 week rally without a 15% bounce took place.The second is right now. We have now gone 10 weeks without a 15% bounce higher. Inother words, this decline is very long in the tooth and there is a good chance it hasalready completed. As an aside, there were two 9.5 week declines without a 15% bouncehigher in the $HUI over the past decade, one in late 2001 and one in early 2003. All other
longer-term Gold stock corrections (including the crash in late 2008) included a bounceof at least 15%.
Another bullish factor is the positive divergence that has developed between junior mining stocks (as represented by the GDXJ ETF) and the senior mining stocks (asrepresented by GDX ETF). Here is an 18 month daily ratio chart of the GDXJ:GDX ratiochart to show you what I mean:

5/7/2018 Gold Versus Paper June 17 2011 Letter - slidepdf.com
http://slidepdf.com/reader/full/gold-versus-paper-june-17-2011-letter 3/14
We have already had the rapid plunge in Gold stock indices over the last few weeks, so if the juniors were going to fall [further] off a cliff relative to the seniors, they should havealready done so. The fact that junior stocks, as a sector, have fallen less than senior stocksover the past week is encouraging, particularly when you consider how long in the tooththe current decline is time wise.

5/7/2018 Gold Versus Paper June 17 2011 Letter - slidepdf.com
http://slidepdf.com/reader/full/gold-versus-paper-june-17-2011-letter 4/14
Additionally, some nice divergences have shown up on the 60 minute intraday chart of the GDX ETF (following is a 4 month chart thru today’s close):

5/7/2018 Gold Versus Paper June 17 2011 Letter - slidepdf.com
http://slidepdf.com/reader/full/gold-versus-paper-june-17-2011-letter 5/14
We are dealing in probabilities when trading, not absolutes. There are no guaranteeswhen speculating, but the current set-up is near perfect. Throw in the horrible RydexPrecious Metals Mutual Fund sentiment data (i.e. total fund assets declining precipitously) shown in a previous update (by the way, we hit yet another new low todayin this data point!), and you have a nice low risk entry for a trade.
Furthermore, I believe the general stock markets are bottoming here for several reasons.Some have been outlined in updates last week. Here are a few more charts. First is anupdated chart of the Equity Put to Call Ratio chart ($CPCE), which is a rough proxy for retail trader option buying (i.e. the people we want to bet against when they take anextreme position). This time, I am going to show the actual raw data for the $CPCE over the past 5.5 months, which is noisy but gets the current point across:

5/7/2018 Gold Versus Paper June 17 2011 Letter - slidepdf.com
http://slidepdf.com/reader/full/gold-versus-paper-june-17-2011-letter 6/14
A put to call ratio of more than 1 (i.e. more puts bought than calls) is a condition thatdoesn’t last and usually indicates a bottom in common equities. Particularly when youremember that bull market rules still apply as we are not in a confirmed cyclical bear market yet! In other words, don’t let your point of reference be the fall of 2008 whenlooking at how extreme the current data point is.

5/7/2018 Gold Versus Paper June 17 2011 Letter - slidepdf.com
http://slidepdf.com/reader/full/gold-versus-paper-june-17-2011-letter 7/14
Also, take a look at the Industrial Metals ($GYX) to Gold ($GOLD) ratio over the past18 months using a daily chart to see its predictive abilities and what it is saying now:

5/7/2018 Gold Versus Paper June 17 2011 Letter - slidepdf.com
http://slidepdf.com/reader/full/gold-versus-paper-june-17-2011-letter 8/14
After predicting the current general equity decline perfectly, this ratio is failing to makenew lows with the stock market and in fact this ratio bottomed ONE MONTH AGO! Thissuggests a rally (or at least a sideways trading range) is imminent. The large bank stocks($BKX) are also hinting at a bottom here (6 month daily chart thru today’s close
follows):

5/7/2018 Gold Versus Paper June 17 2011 Letter - slidepdf.com
http://slidepdf.com/reader/full/gold-versus-paper-june-17-2011-letter 9/14
Why would the banks stocks not make new lows with the rest of the market when their fundamentals are so horrible and everyone knows it? Aren’t the large bank stocks theones at risk of blowing up if the Greek debt situation finally hits the fan?

5/7/2018 Gold Versus Paper June 17 2011 Letter - slidepdf.com
http://slidepdf.com/reader/full/gold-versus-paper-june-17-2011-letter 10/14
Now, please keep in mind that I am not overall bullish on common equities and, in fact, Idon’t own any and haven’t for years. I do trade non-precious metal equities from time totime, usually when I want to go short the market, which I wouldn’t do right now since Ithink a rally is imminent. But, we have to keep in mind that we are still in a cyclical bullmarket for common stocks in several larger economies including the one I tend to focus
on, the United States.
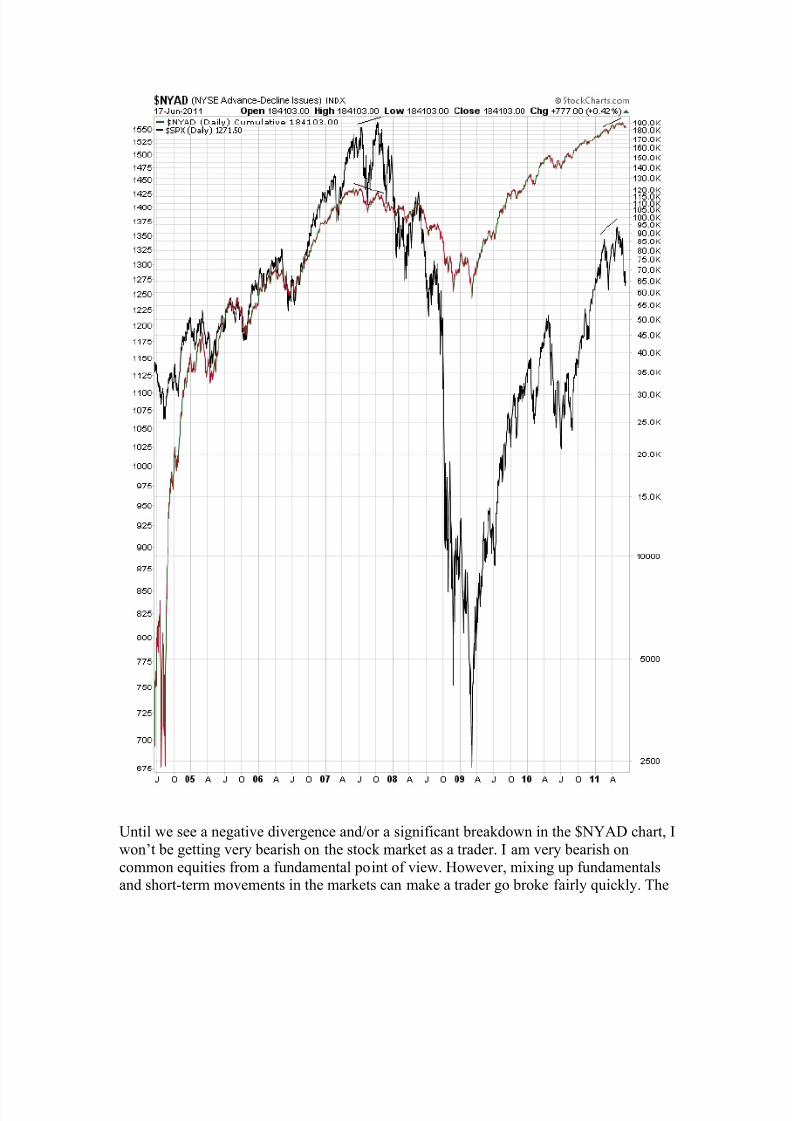
Take a look at the New York Stock Exchange Advance Decline line ($NYAD). It would be awful strange to start a bear market without a breakdown in this line. Here’s this data point versus the S&P 500 ($SPX) over the last 7 years ($NYAD is the colored linear plotwhile $SPX is the black linear plot):
5/7/2018 Gold Versus Paper June 17 2011 Letter - slidepdf.com
http://slidepdf.com/reader/full/gold-versus-paper-june-17-2011-letter 11/14
Until we see a negative divergence and/or a significant breakdown in the $NYAD chart, Iwon’t be getting very bearish on the stock market as a trader. I am very bearish oncommon equities from a fundamental point of view. However, mixing up fundamentalsand short-term movements in the markets can make a trader go broke fairly quickly. The

5/7/2018 Gold Versus Paper June 17 2011 Letter - slidepdf.com
http://slidepdf.com/reader/full/gold-versus-paper-june-17-2011-letter 12/14
markets are what they are and they are telling me that a bounce is coming, whether justified by fundamentals or not.
I also want to re-iterate that I am still not certain whether the current “buy Gold stocks”recommendation will be just a bounce good for a 20% gain or a hold for a multi-month
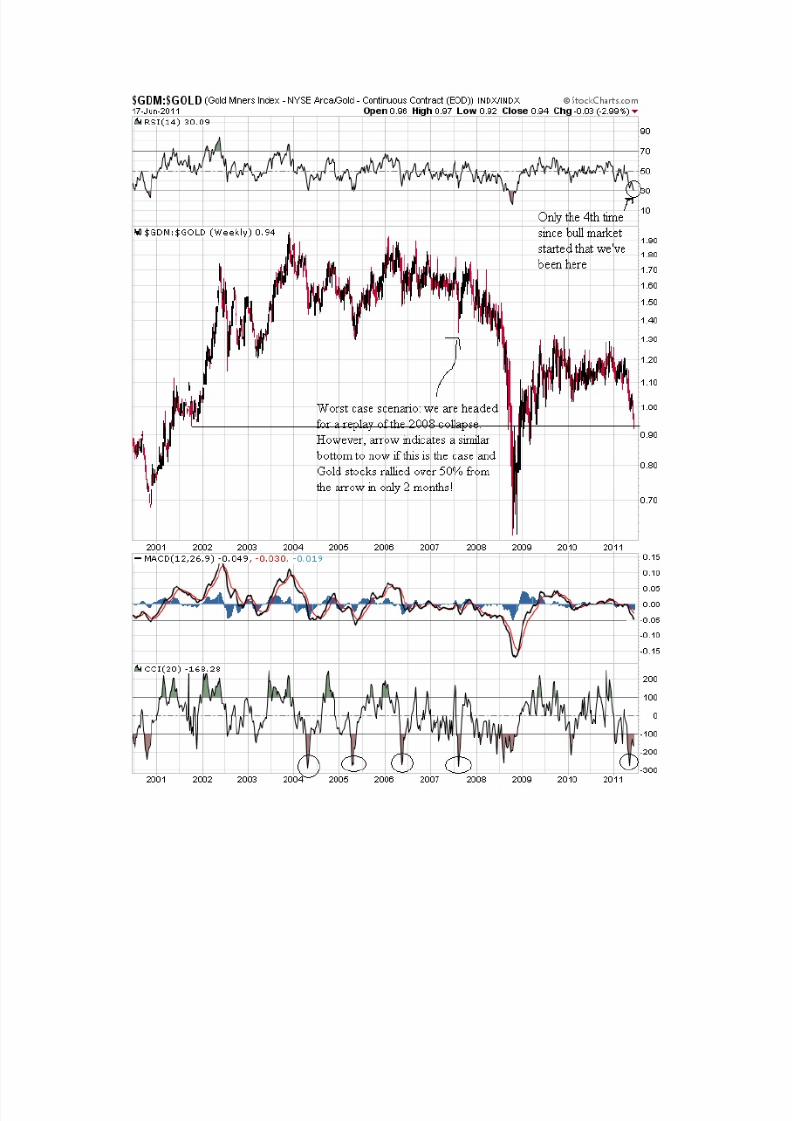
rally. The strength and character of the bounce in Gold stocks should give us a clue. Keepin mind that longer term, the current Gold stocks to Gold price ratio chart looks awfulgood for a pending multi-month bull move. I don’t know what the catalyst might be.Perhaps the global central banks will throw a gazillion dollars worth of funny money atthe Greek (and remaining PIIGS) problem – wouldn’t that be unusual? A large, new“liquidity” back stop (i.e. euphemism for creating money out of thin air to bail out your friends) could send major currencies into the toilet relative to Gold.
Keep this chart in mind when thinking of the intermediate term ($GDM:$GOLD weeklychart over past 11 years thru Friday’s close):
5/7/2018 Gold Versus Paper June 17 2011 Letter - slidepdf.com
http://slidepdf.com/reader/full/gold-versus-paper-june-17-2011-letter 13/14

5/7/2018 Gold Versus Paper June 17 2011 Letter - slidepdf.com
http://slidepdf.com/reader/full/gold-versus-paper-june-17-2011-letter 14/14
3. TRADE RECOMMENDATIONS
Buy Gold stocks!
If you don’t want the leverage of NUGT, you can simply buy GDX, GDXJ or GLDX.
I am also wary of continuing to try to short silver here, so I would recommend closing outany open ZSL trades at this point. It might work, but the risk-reward ratio seems rather neutral at this point.
Keep in mind that the ratio chart presented above is screaming at us that Gold stocks willoutperform Gold on the next short-term move higher in the precious metals sector. Isuspect that Gold is going to be range bound for a few more weeks while Gold stockscreep higher and foreshadow the next move higher in Gold, but a surprise move to theupside in Gold should see Gold stocks outperform Gold (in percentage terms).
Have a good weekend.
Adam
HOLD the NUGT ETF and buy more on any price dips below26.50 if you are so inclined and/or not yet in the trade. I am going to
hold off for now in setting a stop loss, as I don’t want people to get stopped out of this tradewhen we are forming an important bottom here. I will send out a trade trigger alert if I feelsomething has gone wrong with the trade. More experienced traders can do what they
already know how to do, which is manage risk.