
Tocqueville Gold Strategy Third Quarter 2016 Investor...
15
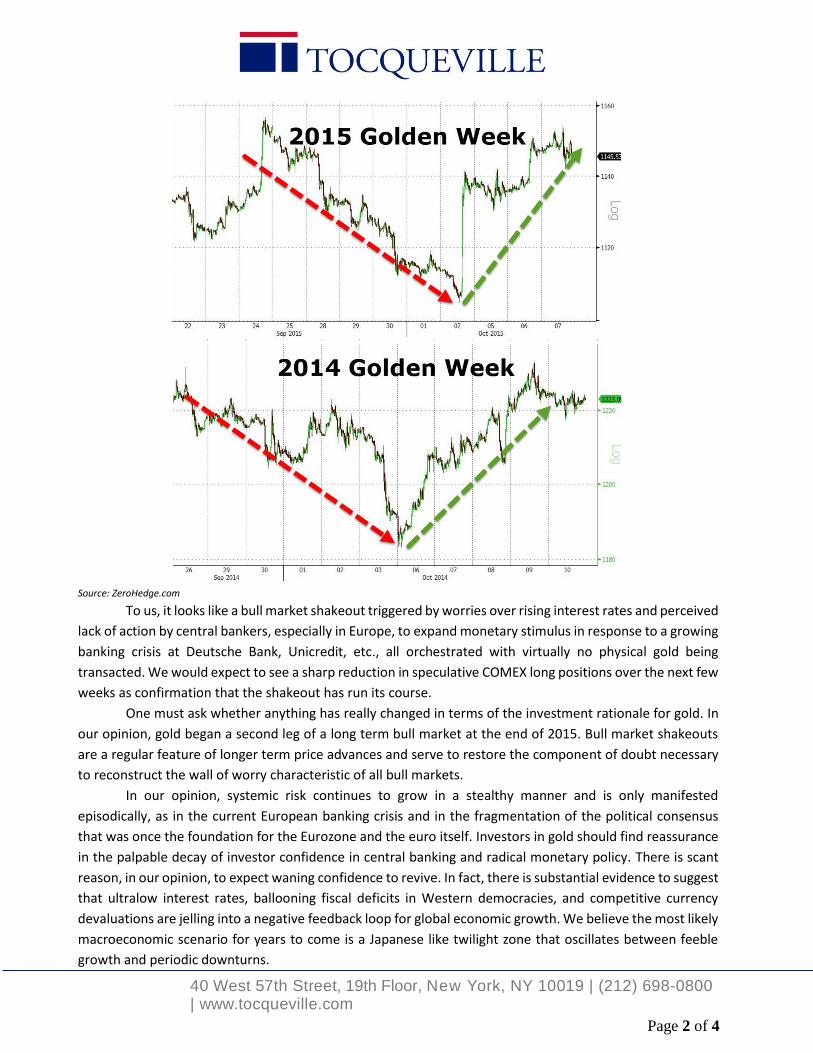
40 West 57th Street, 19th Floor, New York, NY 10019 | (212) 698-0800 | www.tocqueville.com Page 1 of 4 Tocqueville Gold Strategy Third Quarter 2016 Investor Letter During the third quarter of 2016, gold and gold mining shares consolidated in a narrow range following substantial gains in the first half of the year. On a year to date basis (9/30/16) gold bullion rose 24% while most gold mining shares gained 3x-4x the gold price. During the first few days of October, the gold price broke sharply lower beneath the consolidation range of the third quarter. The decline in gold accelerated after breaking through technical support zones clustered around $1300/oz. in only a few days. High frequency and short term momentum traders piled on as they typically do when technical support is breached. Intense short selling by these players accelerated the market decline. Bearishness has replaced the euphoria and overconfidence that dominated only a few months ago in early July. It must be remembered that these short term gyrations reflect synthetic or paper trading, which we have discussed frequently over the past two years, and is almost completely disconnected from flows of physical metal. Long term, we don’t think this washout signals a structural change in gold’s outlook; it may have been a clean-out of weak holders as prices recalibrate lower towards physical support from Asian buyers. The correction of the past few days coincided with an absence of Chinese buyers due to the “Golden Week” holiday there. “With China (by far the largest buyer of physical gold) closed, the markets were open for rampant manipulation, which is exactly what happened as several billion dollars in paper assets were dumped.” (Zero Hedge Oct. 9, 2016) As noted in the October 10 Belkin report, “who sells $22 billion of gold for maximum market impact over a very short period of time? The global monetary cabal (central banks, BIS) have a long history of suppressing gold prices because a rising gold price discredits their legitimacy. But never mind, gold is still up 18% year to date …even after last week’s intervention.” As the charts below show, this intervention was very similar to the previous two years. Paper losses inflicted by synthetic speculators during Golden Week were recouped in the subsequent trading sessions.
Transcript of Tocqueville Gold Strategy Third Quarter 2016 Investor...

40 West 57th Street, 19th Floor, New York, NY 10019 | (212) 698-0800 | www.tocqueville.com
Page 1 of 4
Tocqueville Gold Strategy
Third Quarter 2016 Investor Letter
During the third quarter of 2016, gold and gold mining shares consolidated in a narrow range
following substantial gains in the first half of the year. On a year to date basis (9/30/16) gold bullion rose 24%
while most gold mining shares gained 3x-4x the gold price.
During the first few days of October, the gold price broke sharply lower beneath the consolidation
range of the third quarter. The decline in gold accelerated after breaking through technical support zones
clustered around $1300/oz. in only a few days. High frequency and short term momentum traders piled on
as they typically do when technical support is breached. Intense short selling by these players accelerated
the market decline. Bearishness has replaced the euphoria and overconfidence that dominated only a few
months ago in early July. It must be remembered that these short term gyrations reflect synthetic or paper
trading, which we have discussed frequently over the past two years, and is almost completely disconnected
from flows of physical metal.
Long term, we don’t think this washout signals a structural change in gold’s outlook; it may have
been a clean-out of weak holders as prices recalibrate lower towards physical support from Asian buyers.
The correction of the past few days coincided with an absence of Chinese buyers due to the “Golden Week”
holiday there. “With China (by far the largest buyer of physical gold) closed, the markets were open for
rampant manipulation, which is exactly what happened as several billion dollars in paper assets were
dumped.” (Zero Hedge Oct. 9, 2016) As noted in the October 10 Belkin report, “who sells $22 billion of gold
for maximum market impact over a very short period of time? The global monetary cabal (central banks, BIS)
have a long history of suppressing gold prices because a rising gold price discredits their legitimacy. But never
mind, gold is still up 18% year to date …even after last week’s intervention.” As the charts below show, this
intervention was very similar to the previous two years. Paper losses inflicted by synthetic speculators during
Golden Week were recouped in the subsequent trading sessions.
40 West 57th Street, 19th Floor, New York, NY 10019 | (212) 698-0800 | www.tocqueville.com
Page 2 of 4
Source: ZeroHedge.com
To us, it looks like a bull market shakeout triggered by worries over rising interest rates and perceived
lack of action by central bankers, especially in Europe, to expand monetary stimulus in response to a growing
banking crisis at Deutsche Bank, Unicredit, etc., all orchestrated with virtually no physical gold being
transacted. We would expect to see a sharp reduction in speculative COMEX long positions over the next few
weeks as confirmation that the shakeout has run its course.
One must ask whether anything has really changed in terms of the investment rationale for gold. In
our opinion, gold began a second leg of a long term bull market at the end of 2015. Bull market shakeouts
are a regular feature of longer term price advances and serve to restore the component of doubt necessary
to reconstruct the wall of worry characteristic of all bull markets.
In our opinion, systemic risk continues to grow in a stealthy manner and is only manifested
episodically, as in the current European banking crisis and in the fragmentation of the political consensus
that was once the foundation for the Eurozone and the euro itself. Investors in gold should find reassurance
in the palpable decay of investor confidence in central banking and radical monetary policy. There is scant
reason, in our opinion, to expect waning confidence to revive. In fact, there is substantial evidence to suggest
that ultralow interest rates, ballooning fiscal deficits in Western democracies, and competitive currency
devaluations are jelling into a negative feedback loop for global economic growth. We believe the most likely
macroeconomic scenario for years to come is a Japanese like twilight zone that oscillates between feeble
growth and periodic downturns.

40 West 57th Street, 19th Floor, New York, NY 10019 | (212) 698-0800 | www.tocqueville.com
Page 3 of 4
In our opinion, numerous catalysts are aligning to stoke broader interest and a renewed advance in
gold prices:
Spreading loss of confidence in central banking, both from investors and policy insiders. Trial balloons
to eliminate cash, ramp up fiscal deficits, and push nominal interest rates below the zero bound seem
to proliferate. Commentary in main stream financial media openly questions the efficacy of ultralow
interest rates and QE to stimulate economic growth.
Interest rates appear set to rise on a schedule not orchestrated by the Fed but by the financial
markets. Both political candidates favor fiscal stimulus that will inflate deficits at a time when non
US buyers of treasuries, a principal source of demand in recent years, have been in a liquidation
mode for the past twelve months. In our opinion, a continuation of rising interest rates will lead to
steep capital losses for holders of low to negative yielding sovereign debt, and cause considerable
collateral damage to equities.
Global gold mining production, in our opinion, appears locked into an irreversible decline for the next
5 to 10 years. Because exploration has slowed sharply, there are fewer new deposits to mine.
Industry reserve life is dwindling. Barriers to new mine construction seem more formidable than at
any time for the past twenty years.
The US economy is cruising at stall speed on a best case basis and more likely teetering on recession.
Should interest rates rise at this precarious juncture, monetary policy, perceived to be in a tightening
mode, could be forced into another phase of QE or even more radical measures.
Gold is extremely under owned in Western investment portfolios. Because supplies of above ground
stocks normally available to satisfy Western investment demand have been severely depleted by
flows to Asian investors, the price dynamics could be explosive.
Gold has enjoyed a stealth bull market since the advent of radical monetary policies around 2000. As
the chart below shows, gold has been the best performing asset class since then, a fact that is
completely unrecognized by main stream media and conventional investors. The painful correction
from 2011 to year end 2015 camouflaged gold’s strength and explains why most investors remain
complacent as to systemic risk, intellectually understanding the unsustainability of radical monetary
policy but unmotivated to seek gold’s protection.

40 West 57th Street, 19th Floor, New York, NY 10019 | (212) 698-0800 | www.tocqueville.com
Page 4 of 4
It seems unlikely that the long term erosion of investment confidence, the onset of a secular bear
market in financial assets, and further advances in the stealth bull market for gold will take place in a linear
fashion. There are bound to be shakeouts and fake outs along the way to camouflage the underlying reality
that the global financial system as we know it is in extremis. We also believe that the current sharp correction
in the precious metals complex is a setup for another major advance toward new highs in metal and share
prices. We therefore recommend taking advantage of current weakness to build or establish new positions.
John Hathaway
Senior Portfolio Manager
© Tocqueville Asset Management L.P.
October 12, 2016
This article reflects the views of the author as of the date or dates cited and may change at any time. The information should not be construed as investment advice. No representation is made concerning the accuracy of cited data, nor is there any guarantee that any projection, forecast or opinion will be realized. References to stocks, securities or investments should not be considered recommendations to buy or sell. Past performance is not a guide to future performance. Securities that are referenced may be held in portfolios managed by Tocqueville or by principals, employees and associates of Tocqueville, and such references should not be deemed as an understanding of any future position, buying or selling, that may be taken by Tocqueville. We will periodically reprint charts or quote extensively from articles published by other sources. When we do, we will provide appropriate source information. The quotes and material that we reproduce are selected because, in our view, they provide an interesting, provocative or enlightening perspective on current events. Their reproduction in no way implies that we endorse any part of the material or investment recommendations published on those sites.

1
Section I. Macro
$0
$200
$400
$600
$800
$1,000
$1,200
$1,400
$1,600
$1,800
$2,000
2000 2002 2004 2006 2008 2010 2012 2014 2016-5%
-4%
-3%
-2%
-1%
0%
1%
2%
3%
4%
5%Fig.1. Gold and US Real Rates
US Real Rates
Gold ($/Oz)
Source: Bloomberg
$0
$500
$1,000
$1,500
$2,000
$2,500
$3,000
$3,500
$4,000
$4,500
$5,000
1995 1998 2001 2004 2007 2010 2013 2016
Fig.2. Fed Balance Sheet ($B)
Source: Bloomberg
-3%
-2%
-1%
0%
1%
2%
3%
4%
2000 2002 2004 2006 2008 2010 2012 2014 2016€ 0
€ 200
€ 400
€ 600
€ 800
€ 1,000
€ 1,200
€ 1,400
€ 1,600H
un
dre
dsFig.3. Gold and ECB Real Rates
Gold (€/Oz)ECB Real Rates
Source: Bloomberg
€ 500
€ 1,000
€ 1,500
€ 2,000
€ 2,500
€ 3,000
€ 3,500
€ 4,000
1999 2001 2003 2005 2007 2009 2011 2013 2015
Fig.4. ECB Balance Sheet (€B)
Source: Bloomberg
¥0
¥2,000
¥4,000
¥6,000
¥8,000
¥10,000
¥12,000
¥14,000
2000 2002 2004 2006 2008 2010 2012 2014 2016-2%
0%
2%
4%
6%
8%
10%
12%
14%Fig.5. Gold and PBC Real Rates
PBC Real Rates
Gold (¥/Oz)
Source: Bloomberg
¥5,000
¥10,000
¥15,000
¥20,000
¥25,000
¥30,000
¥35,000
¥40,000
2003 2005 2007 2009 2011 2013 2015
Fig.6. PBC Balance Sheet (¥B)
Source: Bloomberg
2
Section I. Macro
$4
$6
$8
$10
$12
$14
$16
$18
2006 2007 2008 2009 2010 2011 2012 2013 2014 2015 2016
Fig.7. The Biggest 6 Central Bank Balance SheetsUS, UK, Japan, China, EU & Switzerland (US$T)
Source: Bloomberg
-5%
0%
5%
10%
15%
20%
25%
1999 2001 2003 2005 2007 2009 2011 2013 2015
Fig.9. US M1 YoY%
Source: Bloomberg
0%
2%
4%
6%
8%
10%
12%
1999 2001 2003 2005 2007 2009 2011 2013 2015
Fig.10. US M2 YoY%
Source: Bloomberg
0%
5%
10%
15%
20%
1999 2001 2003 2005 2007 2009 2011 2013 2015
Fig.11. ECB M1 YoY %
Source: Bloomberg
0%
2%
4%
6%
8%
10%
12%
1999 2001 2003 2005 2007 2009 2011 2013 2015
Fig.12. ECB M2 YoY %
Source: Bloomberg
0%
5%
10%
15%
20%
25%
30%
35%
40%
1999 2001 2003 2005 2007 2009 2011 2013 2015
Hu
nd
red
s Fig.13. PBC M1 YoY %
Source: Bloomberg
0%
5%
10%
15%
20%
25%
30%
35%
1999 2001 2003 2005 2007 2009 2011 2013 2015
Fig.14. PBC M2 YoY %
Source: Bloomberg
$0
$10
$20
$30
$40
$50
1999 2002 2005 2008 2011 2014
$0
$500
$1,000
$1,500
$2,000
Tho
usa
nd
s
Fig.8. Gold and M2 (US$B, Fed, ECB & PBC)
Gold
M2
Source: Bloomberg
3
Section I. Macro
Fig.15. Inflation August 2016
US Euro Area China
Headline CPI 1.1 0.2 1.3
Core CPI 2.3 0.8 n/a
Shadowstats 8.2 n/a n/a
$13
$14
$15
$16
$17
$18
$19
$20
2011 2012 2013 2014 2015 2016
Fig.18. The Debt Ceiling ($T)
Total Federal Debt
Debt Ceiling Limit
Source: Bloomberg
Source: Bloomberg, Shadow Government Statistics.
2.0%
2.5%
3.0%
3.5%
4.0%
4.5%
5.0%
5.5%
6.0%
6.5%
7.0%
2000 2002 2004 2006 2008 2010 2012 2014 2016
Fig.19. Average Annual Interest Rate on US Debt
Source: US Treasury, Meridian Macro.
$0
$5
$10
$15
$20
$25
1940 1950 1960 1970 1980 1990 2000 2010
Fig.16. US National Debt ($T)
Source: TreasuryDirect.gov, USDebtClock.org
20%
30%
40%
50%
60%
70%
80%
90%
100%
110%
120%
1966 1976 1986 1996 2006 2016
Fig.17. Total Pubic Market Debt as % of GDP
Source: Stlouisfed.org
0%
5%
10%
15%
20%
25%
1988 1992 1996 2000 2004 2008 2012
Fig.20. Interest Expense as % of Total Government Outlays
Source: Bloomberg; US Treasury

4
Section I. Macro
-$20
$20
$60
$100
$140
$180
$220
$260
1990 1992 1994 1996 1998 2000 2002 2004 2006 2008 2010 2012 2014 2016
Fig.23. China Net Purchases Long-Term US Securities(annual US$B)
Source: US Treasury; MacroMavens, LLC
-$800
-$300
$200
$700
$1,200
$1,700
2005 2006 2007 2008 2009 2010 2011 2012 2013 2014 2015 2016
Fig.21. Global Forex Accumulation (US$B, 12 month sum)
Source: Bloomberg; MacroMavens, LLC
-$100
$100
$300
$500
$700
1978 1983 1988 1993 1998 2003 2008 2013
Fig.22. Net Purchases of US Treasury Notes and Bonds by All Foreign Countries (US$B, 12 month sum)
Source: US Treasury; MacroMavens, LLC
5
Section II. Gold
19.6%21.8%
3.1%
0.0%
5.0%
10.0%
15.0%
20.0%
25.0%
1934 1982 2015
Fig.25. Market Value of Above Ground Gold as % of Total US Financial Assets
Source: Federal Reserve, World Gold Council
0
40
80
Oct-03 Oct-05 Oct-07 Oct-09 Oct-11 Oct-13 Oct-15
Mill
ion
s o
f O
un
ces
Fig.26. Gold Held by ETFs
All ETFS
SPDR Trust
Source: Bloomberg, Company Filings.
Fig.24. Gold Supply and Demand (tonnes)
2002 2003 2004 2005 2006 2007 2008 2009 2010 2011 2012 2013 2014 20152Q16 YTD
Supply
Mine production 2,591 2,592 2,478 2,550 2,481 2,476 2,409 2,584 2,739 2,827 2,848 3,019 3,114 3,186 1,537
Old gold scrap 835 944 829 886 1,107 956 1,217 1,672 1,723 1,669 1,626 1,371 1,122 1,093 687
Traditional supply 3,426 3,536 3,307 3,436 3,588 3,432 3,626 4,257 4,463 4,495 4,473 4,390 4,236 4,279 2,224
Net producer hedging -412 -279 -445 -86 -373 -444 -349 -252 -108 10 -20 -50 42 -21 -83
Official sector sales 545 617 497 662 367 484 236 30 - - - - -
Total supply 3,559 3,874 3,359 4,012 3,582 3,472 3,513 4,034 4,355 4,505 4,453 4,340 4,278 4,258 2,307
Demand
Jewellery 2,680 2,522 2,673 2,707 2,283 2,405 2,187 1,760 2,017 1,972 1,908 2,198 2,153 2,455 924
Other 360 385 416 431 458 462 436 373 466 453 428 409 389 331 161
Total fabrication 3,040 2,907 3,089 3,138 2,741 2,867 2,623 2,134 2,483 2,425 2,336 2,603 2,542 2,786 1,085
Bar & coin retail investment 373 314 396 412 421 446 649 743 1,205 1,519 1,256 1,654 1,064 1,012 485
Official sector purchases - - - - - - - - 77 457 535 369 477 588 185
ETFs & similar 3 39 133 208 260 253 321 617 382 185 279 -881 -159 -133 579
Implied net investment 143 614 -259 254 160 -94 -80 541 207 -81 47 595 354 5 -27
Total demand 3,559 3,874 3,359 4,012 3,582 3,472 3,513 4,034 4,355 4,505 4,453 4,340 4,278 4,258 2,307Source: World Gold Council

6
Section II. Gold
Investment Adviser, 20.6%
Broker, 6.2%
Private Banking, 8.1%
Pension Fund, 0.6%
Hedge Fund, 7.2%
Mutual Fund, 4.4%
Insurance Company, 0.2%
Non-Institutional,
52.7%
Fig.27. SPDR Gold Trust Ownership by Type
Source: FactSet
-800-700-600-500-400-300-200-100
0100200300400500600700800
00 01 02 03 04 05 06 07 08 09 10 11 12 13 14 15 16
Fig.29. Central Banks Net Purchases (tonnes)
Source: World Gold Council
Fig.28. Notable Transaction in Aug 2016 (YTD)
Country Tonnes Transaction
Russia 112 Purchase
Turkey 60 Decrease
China 71 PurchaseSource: World Gold Council
8%
9%
10%
11%
12%
13%
14%
3/00 3/02 3/04 3/06 3/08 3/10 3/12 3/14 3/16
Fig.31. Gold as % of Total Reserves
Source: World Gold Council
29,500
30,000
30,500
31,000
31,500
32,000
32,500
33,000
33,500
34,000
2000 2002 2004 2006 2008 2010 2012 2014 2016
Fig.30 Central Banks Holdings of Gold (tonnes)
Source: World Gold Council

7
Section II. Gold
0
20
40
60
80
100
Sep-07 Sep-08 Sep-09 Sep-10 Sep-11 Sep-12 Sep-13 Sep-14 Sep-15 Sep-16
Fig.32. Web searches for "Gold Bubble"
Source: GoogleTrends
0
20
40
60
80
100
Oct-04 Oct-05 Oct-06 Oct-07 Oct-08 Oct-09 Oct-10 Oct-11 Oct-12 Oct-13 Oct-14 Oct-15
Fig.33. Web searches for "Gold Investment"
Source: GoogleTrends
$0$200$400$600$800$1,000$1,200$1,400$1,600$1,800$2,000
0
20
40
60
80
100
2006 2007 2008 2009 2010 2011 2012 2013 2014 2015 2016
Fig.34. Bernstein's Daily Sentiment Index
DSI
Gold
Source Bloomberg, Bernstein's DSI
$400
$600
$800
$1,000
$1,200
$1,400
$1,600
$1,800
$2,000
-
20.00
40.00
60.00
80.00
100.00
2006 2007 2008 2009 2010 2011 2012 2013 2014 2015 2016
Fig.35. Market Vane Sentiment Index
MV
Gold
Source Bloomberg, Market Vane

8
Section II. Gold
$0
$200
$400
$600
$800
$1,000
$1,200
$1,400
$1,600
$1,800
$2,000
800
1,000
1,200
1,400
1,600
1,800
2,000
2006 2008 2010 2012 2014 2016
Fig.36. Comex Gold Futures Open Interest (tonnes)
Open Interest
Gold ($/Oz)
Source: Bloomberg
-20%
80%
180%
280%
380%
480%
2000 2002 2004 2006 2008 2010 2012 2014 2016
Fig.37. Gold vs Continuous Commodity Index Performance
CCI Index
Gold
Source: Bloomberg
$-
$200
$400
$600
$800
$1,000
$1,200
$1,400
$1,600
$1,800
$2,000
0%
20%
40%
60%
80%
100%
7/10 7/11 7/12 7/13 7/14 7/15 7/16
Fig.39. Commercial Net Shorts as % of Total Open Interest
Net Short/OpenInterestGold
Source: Bloomberg; The McClellan Market Report
More Net Short
Less Net Short
$0
$500
$1,000
$1,500
$2,000
-1,200
-700
-200
300
800
2006 2007 2008 2009 2010 2011 2012 2013 2014 2015 2016
Fig.38. Comex Gold Futures Activity (tonnes)
Net Large Speculators
Net Hedgers/Commercials
Gold ($/Oz)
Source: CFTC
0
100
200
300
400
500
600
0
1
2
3
4
5
6
2003 2005 2007 2009 2011 2013 2015
Mill
ion
s o
f O
un
ces
Fig. 40. Registered COMEX Gold Stocks vs. Owners per Ounce
Registered Stocks
Owners per Ounce
Source: Bloomberg

9
Section III. Gold Mining Equities
0%
10%
20%
30%
40%
50%
60%
70%
1995 1997 1999 2001 2003 2005 2007 2009 2011 2013 2015
Fig.41. XAU and HUI as a Ratio of Gold
HUI/GoldXAU/Gold
Source: FactSet
-$4,000
-$3,000
-$2,000
-$1,000
$0
$1,000
$2,000
$3,000
$4,000
1H
07
2H
07
1H
08
2H
08
1H
09
2H
09
1H
10
2H
10
1H
11
2H
11
1H
12
2H
12
1H
13
2H
13
1H
14
2H
14
1H
15
2H
15
1H
16
2H
16
Fig.42. Net Fund Flows For Lipper's Equity Precious Metals Fund Universe ($M)
Source: Morningstar 2H16 is through 8/31/16
0
100
200
300
400
500
600
$0
$2
$4
$6
$8
$10
$12
$14
$16
03 04 05 06 07 08 09 10 11 12 13 14 15
Fig.44. Equity Capital Issued by Gold Miners
$B of Equty Issued
# of Transactions
Source: Bloomberg
$0
$2
$4
$6
$8
$10
$12
$14
$16
$18
5/06 5/07 5/08 5/09 5/10 5/11 5/12 5/13 5/14 5/15 5/16
Fig.43. Market Cap of Van Eck Gold Equity ETFs ($B)
Source: FactSet

10
Section III. Gold Mining Equities
-10%
-8%
-6%
-4%
-2%
0%
2%
4%
6%
8%
10%
02 03 04 05 06 07 08 09 10 11 12 13 14 15
Fig.45. Senior Producers Return On Capital
Source: FactSet. Universe: NEM, ABX, GG, KGC, AUY, NCM, AU, GFI, HMY
0%
20%
40%
60%
80%
100%
120%
$0
$200
$400
$600
$800
$1,000
$1,200
05 06 07 08 09 10 11 12 13 14 15
Fig.46. Average Cost of Acquisitions in the Gold Sector ($/Oz)
Acquisition Cost As Ratio of Gold Price
Source: RBC Capital Markets, Bloomberg.
2001 2002 2003 2004 2005 2006 2007 2008 2009 2010 2011 2012 2013 2014 20152016
E
After Tax Cash Cost ($/oz) 209 210 253 311 363 413 552 738 661 814 987 1,108 1,087 988 903 868
Margin (%) 23% 32% 30% 24% 18% 32% 21% 15% 32% 34% 37% 34% 23% 22% 22% 24%
0%
5%
10%
15%
20%
25%
30%
35%
40%
$0
$200
$400
$600
$800
$1,000
$1,200
$1,400Fig.47. Gold Mining Industry Production Costs
After Tax Cash Cost ($/oz)
Margin (%)
Source: Tocqueville Asset Management, FactSet.

11
Section III. Gold Mining Equities
Source: BMO Capital Markets
Fig.48. Gold Price Discounted by Market ($/Oz)
Fig.49. NAV Premiums – Senior & Intermediate Producers (N.A.)
Source: ScotiabankSource: Scotiabank
Fig.50. P/CF – Universe of Coverage AverageFig.51. Adjusted Market Cap per Oz of Resource
Divided by Gold Price
Source: BMO Capital Markets