

GOING GLOBAL WITH INNOVATION - International …/media/IE Singapore... · · 2016-08-23GOING...
51
Stephen Tracy Data & Insight Lead, SEA GOING GLOBAL WITH INNOVATION MARKETING INNOVATION: STEPS TOWARD BECOMING A DATA DRIVEN BUSINESS
Transcript of GOING GLOBAL WITH INNOVATION - International …/media/IE Singapore... · · 2016-08-23GOING...
Stephen TracyData & Insight Lead, SEA
GOING GLOBAL WITH INNOVATIONMARKETING INNOVATION: STEPS TOWARD BECOMING A DATA DRIVEN BUSINESS

INTRODUCTION
3
INTRODUCTION
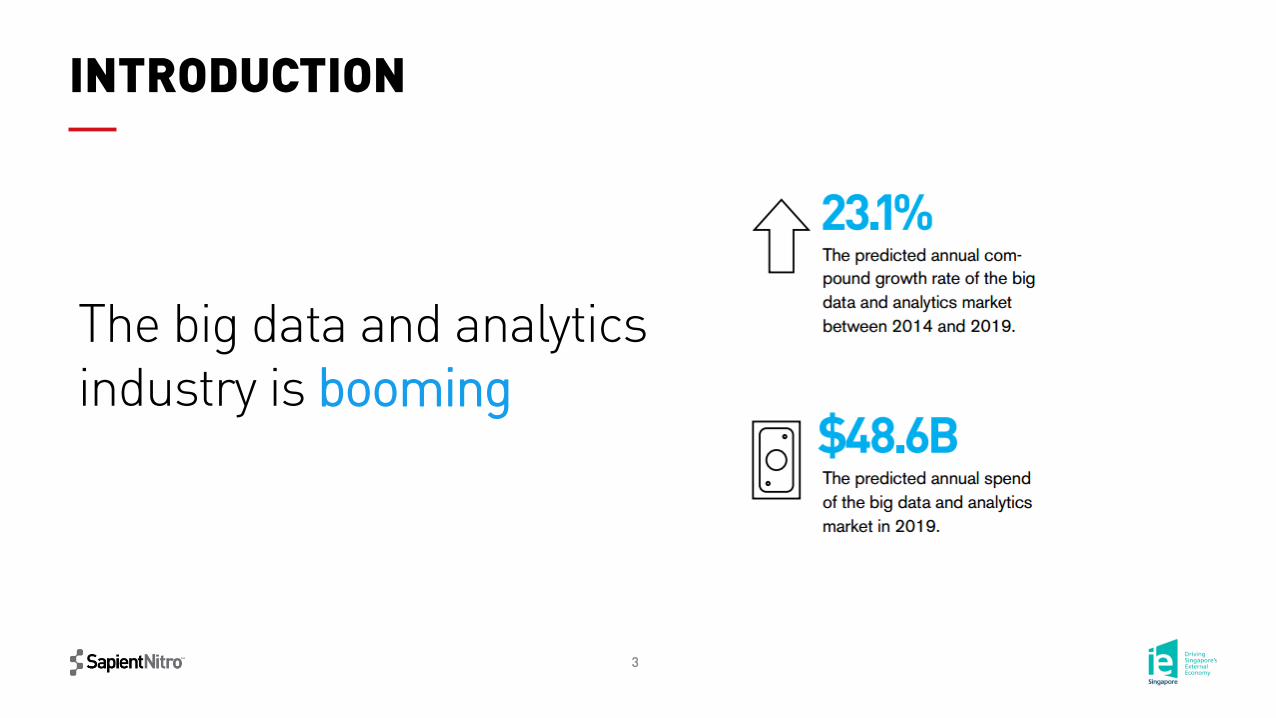
The big data and analytics industry is booming
4
INTRODUCTION
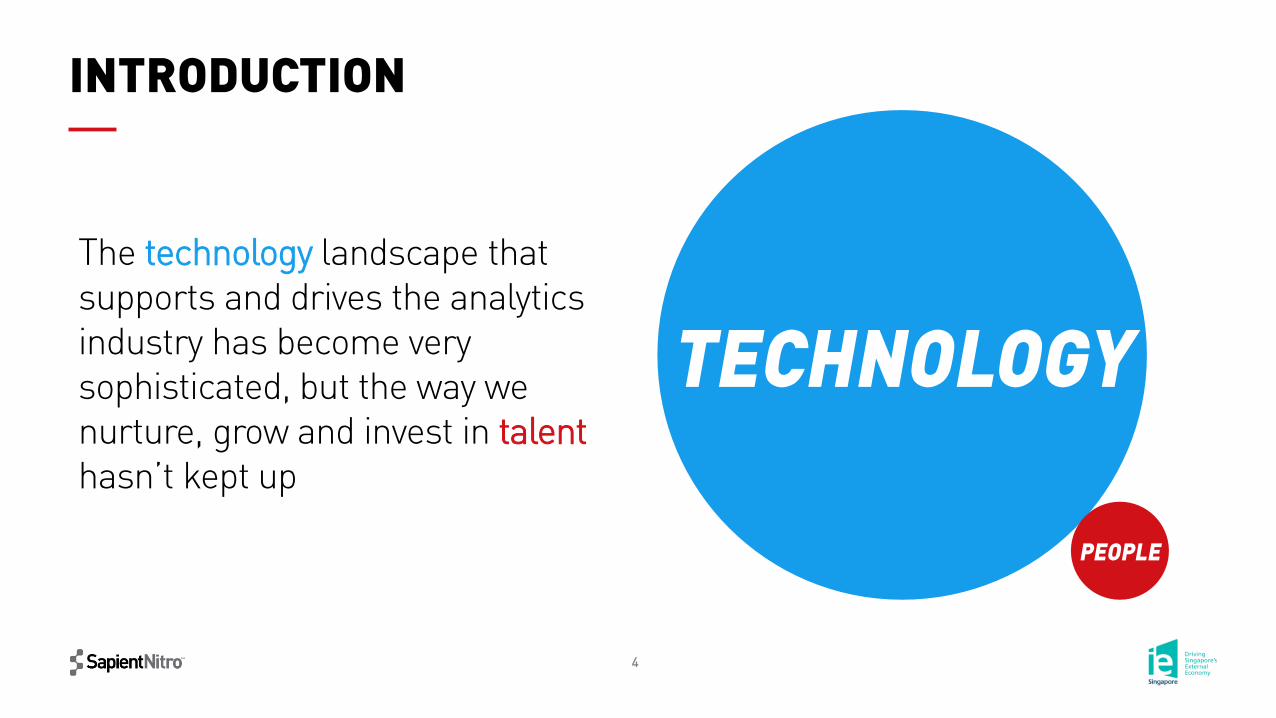
The technology landscape that supports and drives the analytics industry has become very sophisticated, but the way we nurture, grow and invest in talenthasn’t kept up
TECHNOLOGY
PEOPLE
5
INTRODUCTION
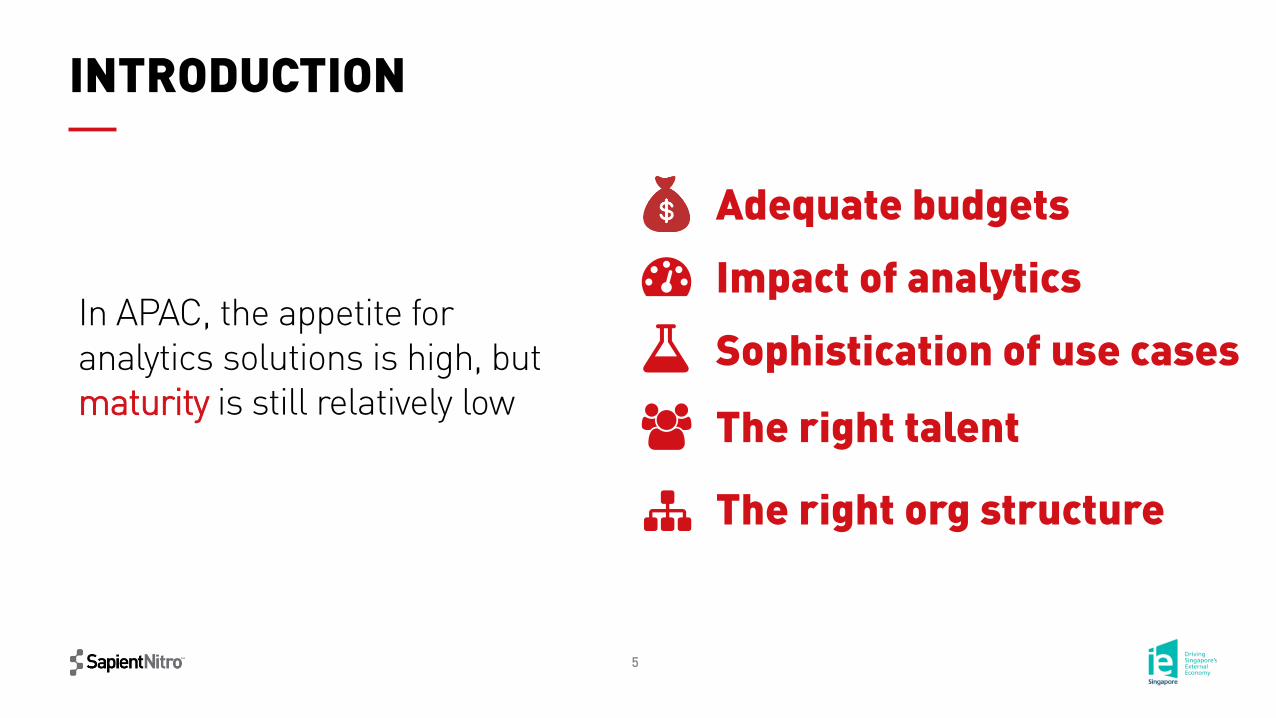
In APAC, the appetite for analytics solutions is high, but maturity is still relatively low
Adequate budgets
Impact of analytics
The right talent
The right org structure
Sophistication of use cases
10 TIPS FOR ANALYTICS SUCCESS

ask good questionsone

8
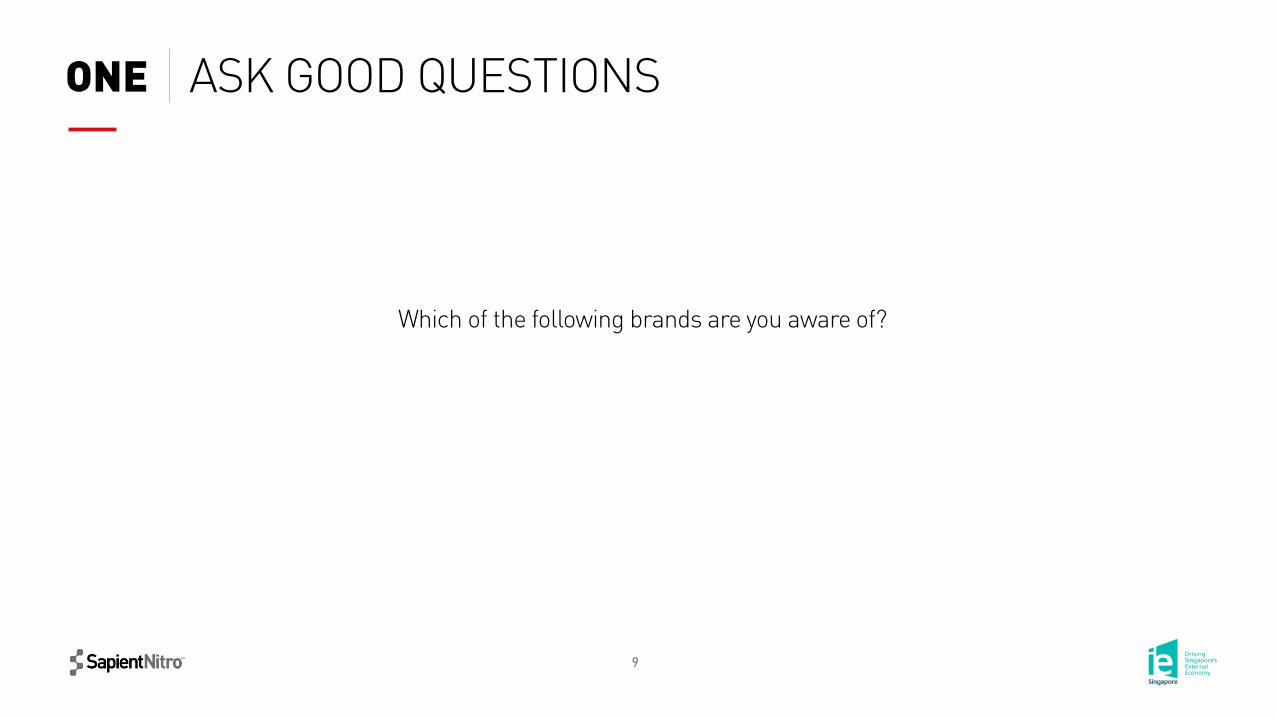
ASK GOOD QUESTIONSONE
Image Source: @nathanwright
Machines are good at answering complex questions, but they’re not very good at asking them
9
Which of the following brands are you aware of?
ASK GOOD QUESTIONSONE
10
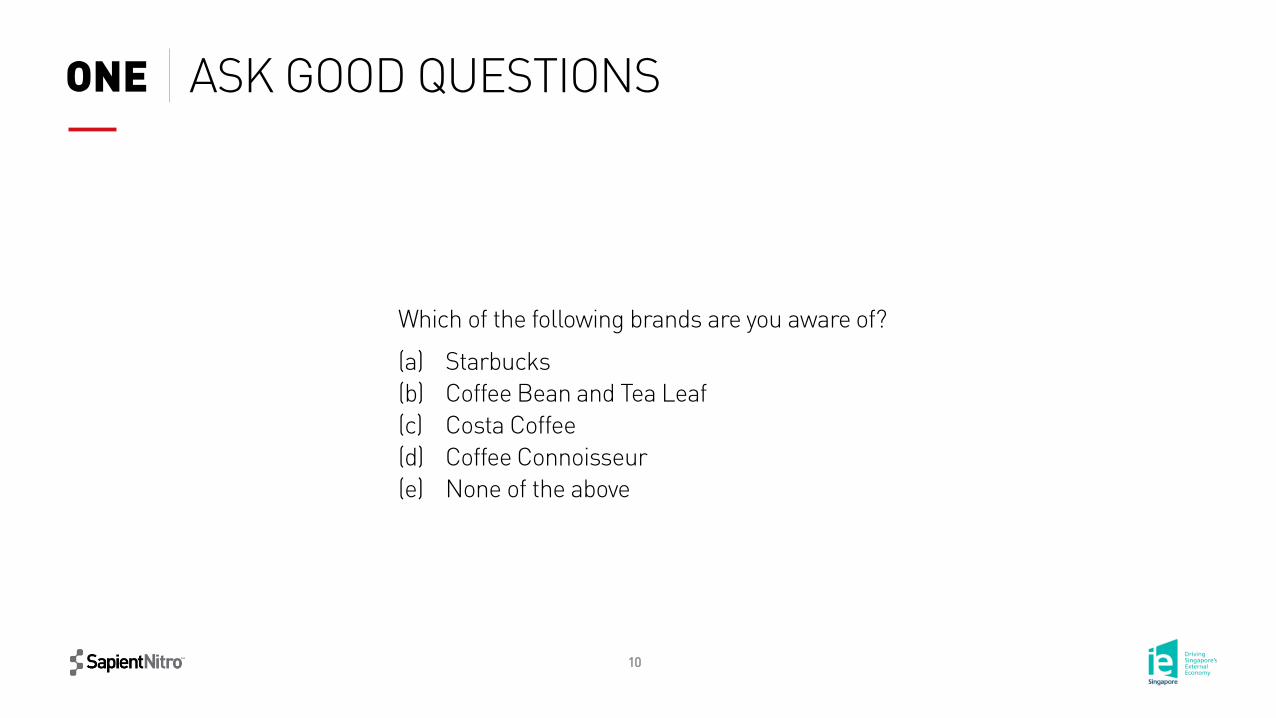
(a) Starbucks(b) Coffee Bean and Tea Leaf(c) Costa Coffee(d) Coffee Connoisseur(e) None of the above
Which of the following brands are you aware of?
ASK GOOD QUESTIONSONE
11
(a) Starbucks(b) Coffee Bean and Tea Leaf(c) Costa Coffee(d) Coffee Connoisseur(e) None of the above
Which of the following brands are you aware of?
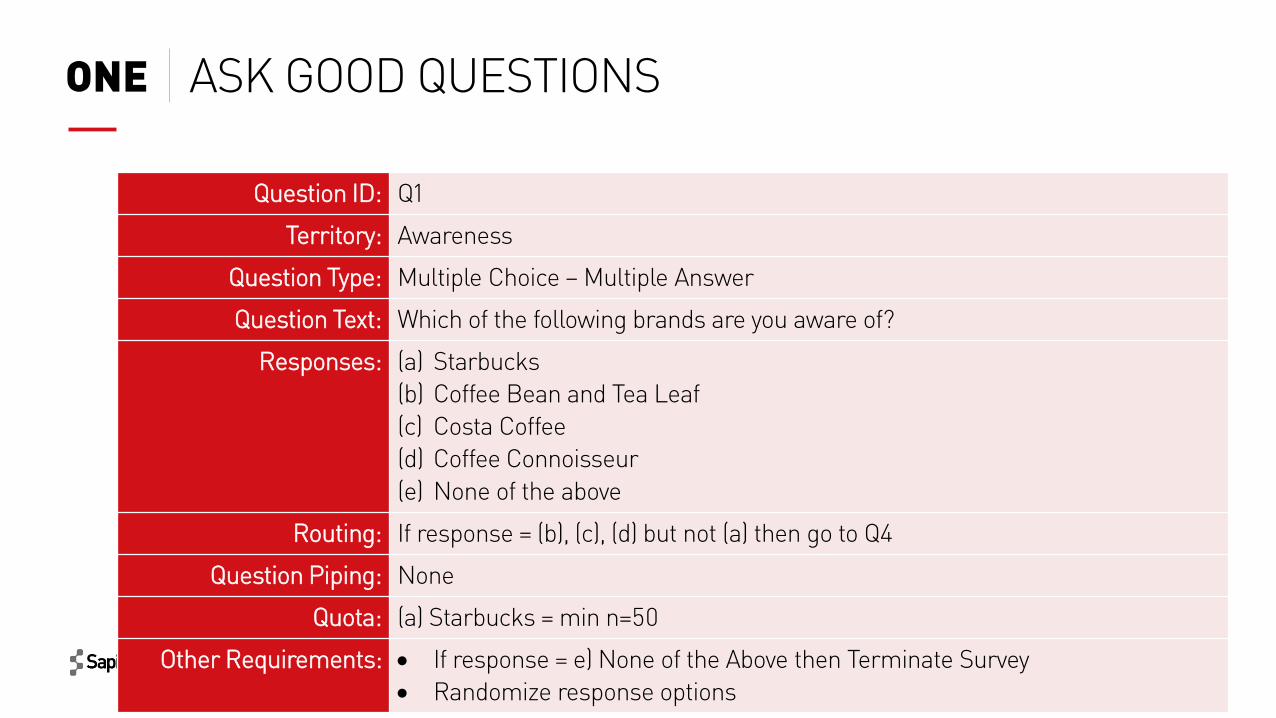
Question ID: Q1
Territory: Awareness
Question Type: Multiple Choice – Multiple Answer
Question Text: Which of the following brands are you aware of?
Responses: (a) Starbucks(b) Coffee Bean and Tea Leaf(c) Costa Coffee(d) Coffee Connoisseur(e) None of the above
Routing: If response = (b), (c), (d) but not (a) then go to Q4
Question Piping: None
Quota: (a) Starbucks = min n=50
Other Requirements: If response = e) None of the Above then Terminate Survey Randomize response options
ASK GOOD QUESTIONSONE
12
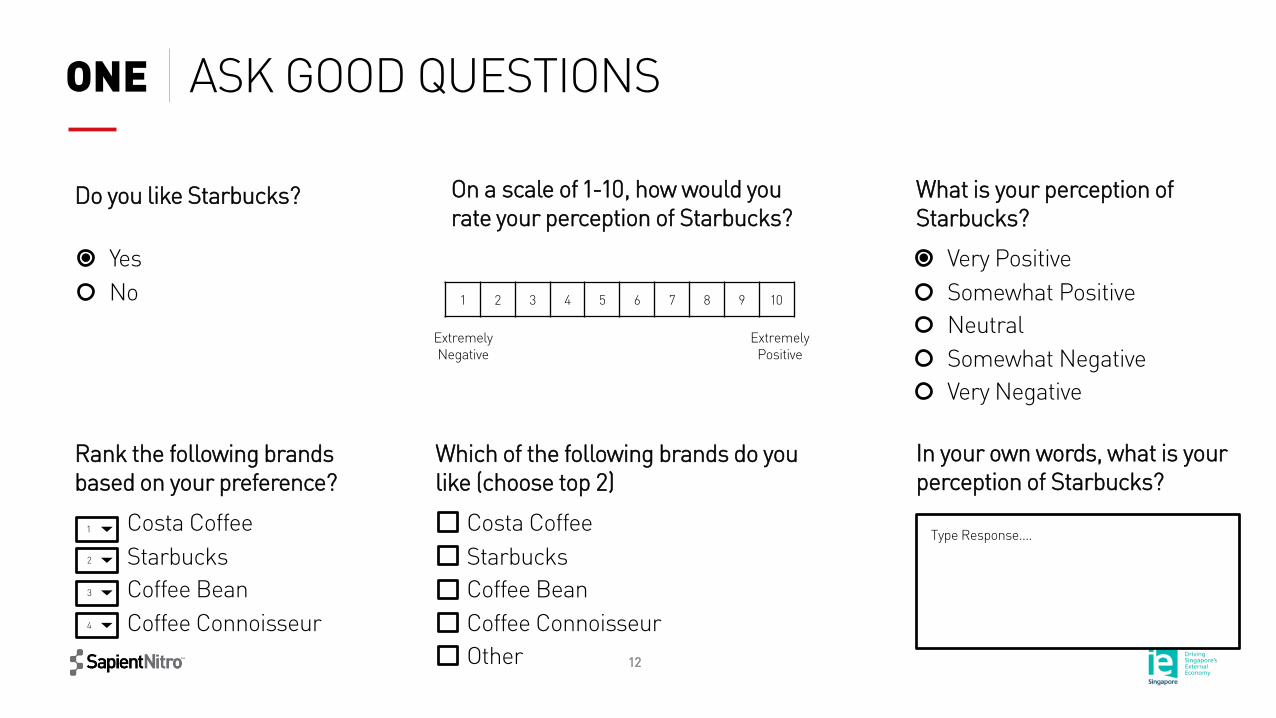
ASK GOOD QUESTIONSONE
Do you like Starbucks?
YesNo 1 2 3 4 5 6 7 8 9 10
On a scale of 1-10, how would you rate your perception of Starbucks?
Extremely Negative
Extremely Positive
What is your perception of Starbucks?
Very PositiveSomewhat PositiveNeutralSomewhat NegativeVery Negative
Rank the following brands based on your preference?
Costa CoffeeStarbucksCoffee BeanCoffee Connoisseur
1
2
3
4
Which of the following brands do you like (choose top 2)
Costa CoffeeStarbucksCoffee BeanCoffee ConnoisseurOther
In your own words, what is your perception of Starbucks?
Type Response….

thinklong termtwo
14
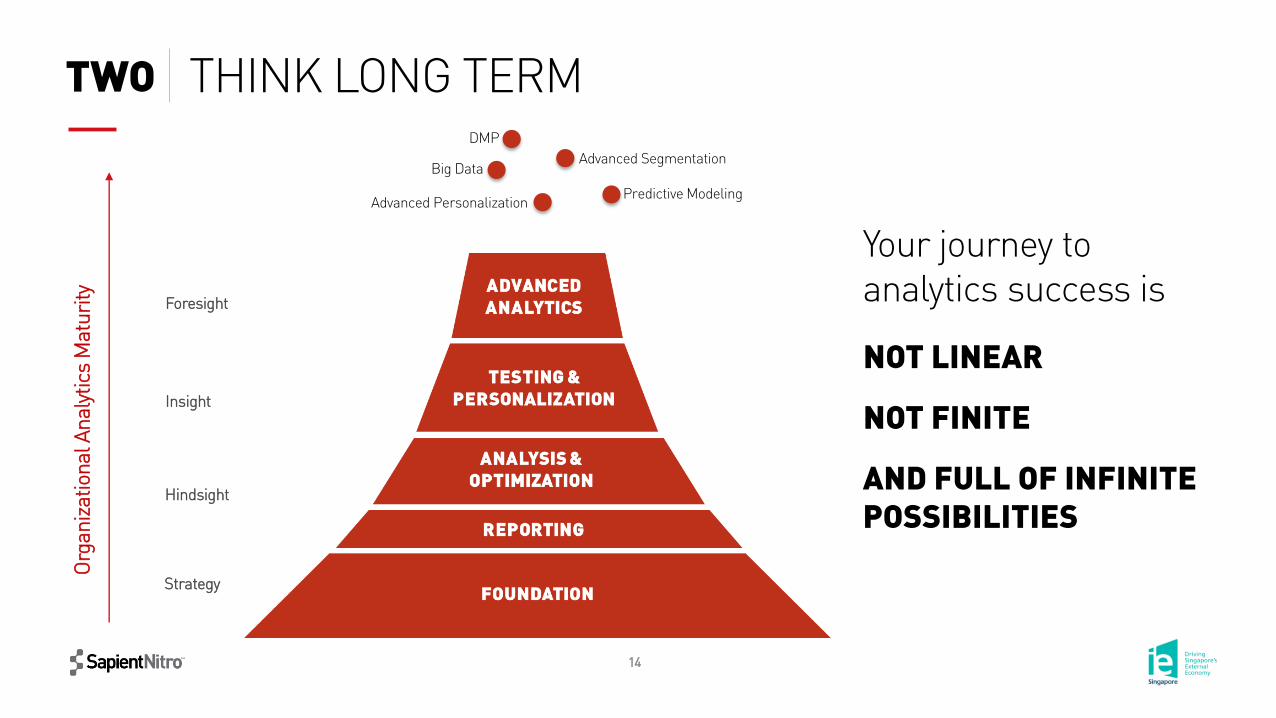
THINK LONG TERMTWOO
rgan
izat
iona
l Ana
lytic
s M
atur
ity Foresight
Insight
Hindsight
Strategy
Predictive Modeling
Big DataAdvanced Segmentation
Advanced Personalization
DMP
Your journey to analytics success is
NOT LINEAR
NOT FINITE
AND FULL OF INFINITE POSSIBILITIES
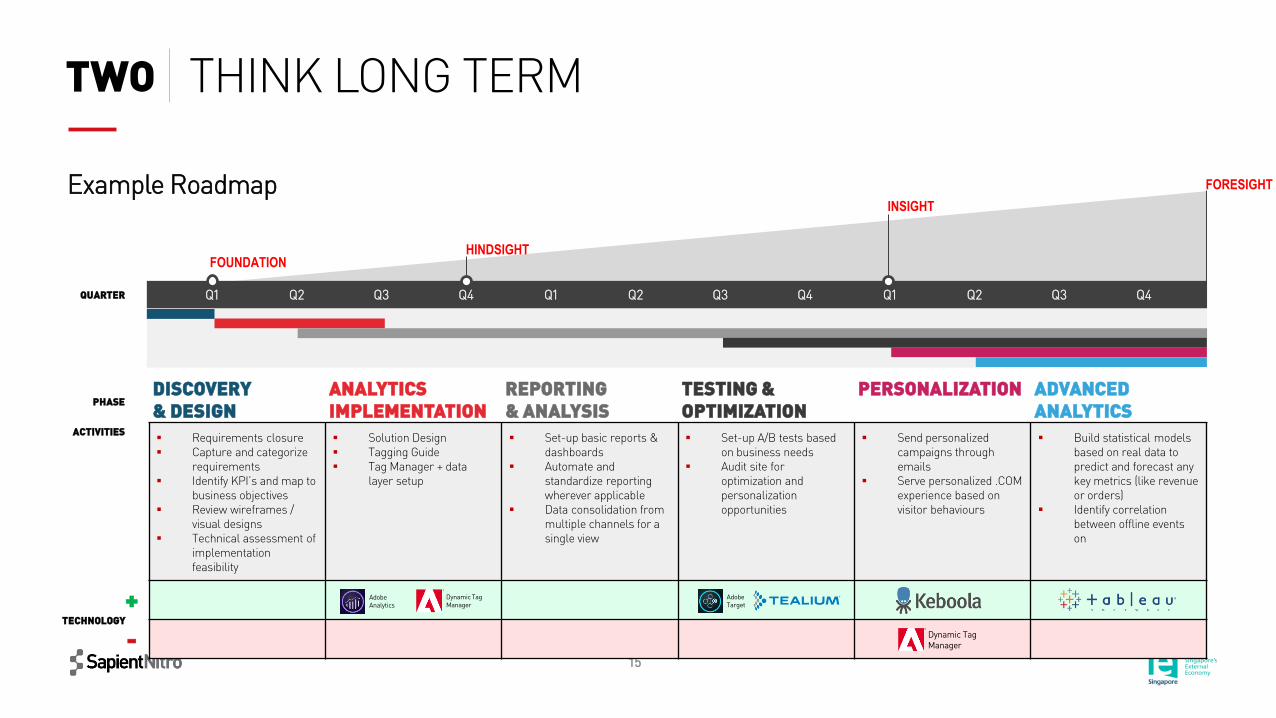
15
DISCOVERY & DESIGN
ANALYTICS IMPLEMENTATION
REPORTING & ANALYSIS
TESTING & OPTIMIZATION
PERSONALIZATION ADVANCEDANALYTICS
Requirements closure Capture and categorize
requirements Identify KPI’s and map to
business objectives Review wireframes /
visual designs Technical assessment of
implementation feasibility
Solution Design Tagging Guide Tag Manager + data
layer setup
Set-up basic reports & dashboards
Automate and standardize reporting wherever applicable
Data consolidation from multiple channels for a single view
Set-up A/B tests based on business needs
Audit site for optimization and personalization opportunities
Send personalized campaigns through emails
Serve personalized .COM experience based on visitor behaviours
Build statistical models based on real data to predict and forecast any key metrics (like revenue or orders)
Identify correlation between offline events on
THINK LONG TERMTWO
FOUNDATIONHINDSIGHT
INSIGHT
FORESIGHT
Q1 Q2 Q3 Q4 Q1 Q2 Q3 Q4 Q1 Q2 Q3 Q4QUARTER
PHASE
ACTIVITIES
Dynamic Tag Manager
TECHNOLOGY
+
- Dynamic Tag Manager
AdobeAnalytics
AdobeTarget
Example Roadmap

start withpeoplethree
17
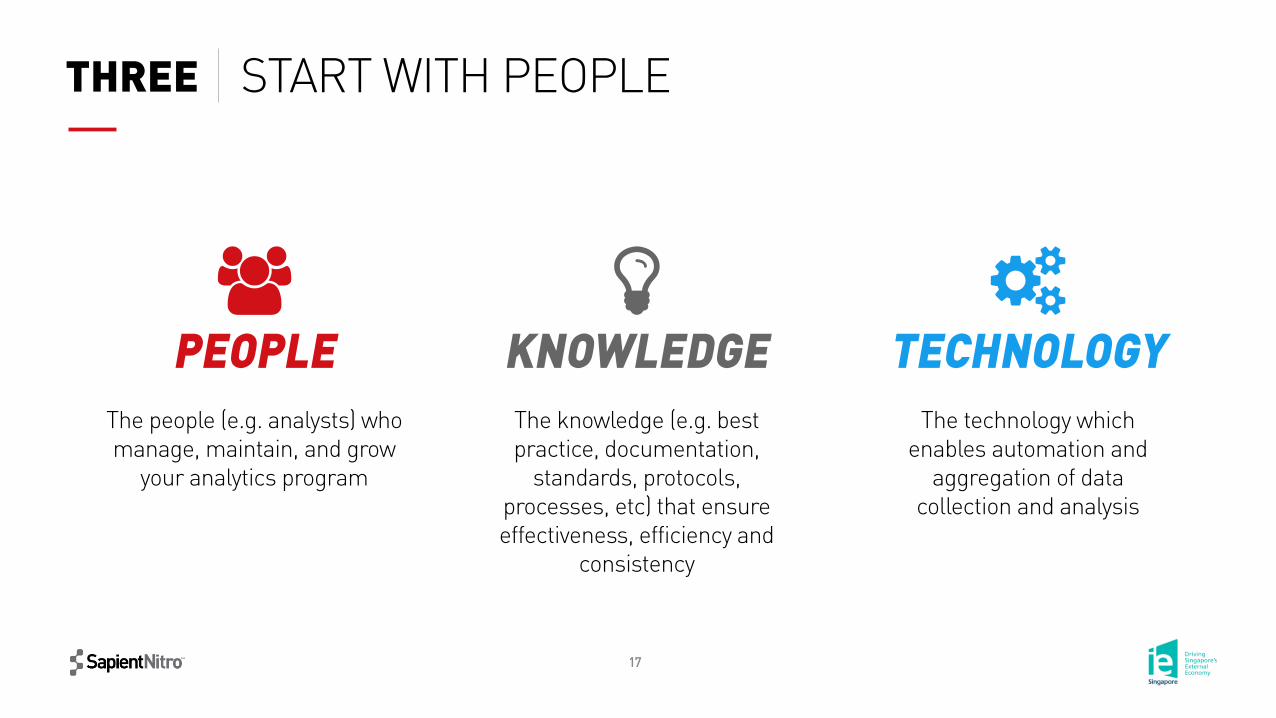
START WITH PEOPLETHREE
The people (e.g. analysts) who manage, maintain, and grow
your analytics program
PEOPLE KNOWLEDGE TECHNOLOGYThe knowledge (e.g. best practice, documentation,
standards, protocols, processes, etc) that ensure effectiveness, efficiency and
consistency
The technology which enables automation and
aggregation of data collection and analysis
18
START WITH PEOPLETHREE
10 / 90 RULEFor every $10 you spend on a tool you should be investing $90 "intelligent resources/analysts” (i.e. people)
$25,000
$250,000$225,000
$2,250,000
Tech People
19
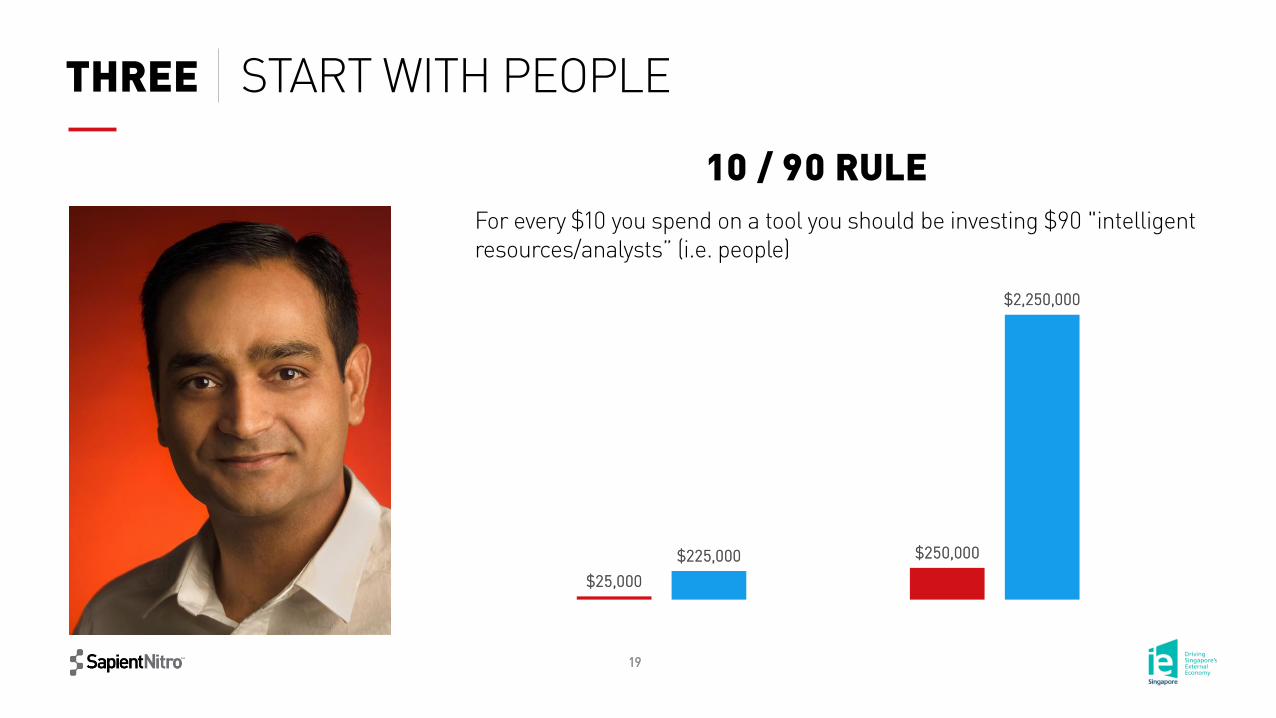
START WITH PEOPLETHREE
10 / 90 RULEFor every $10 you spend on a tool you should be investing $90 "intelligent resources/analysts” (i.e. people)
$25,000
$250,000$225,000
$2,250,000
Tech People

seek truth,not validationfour
21
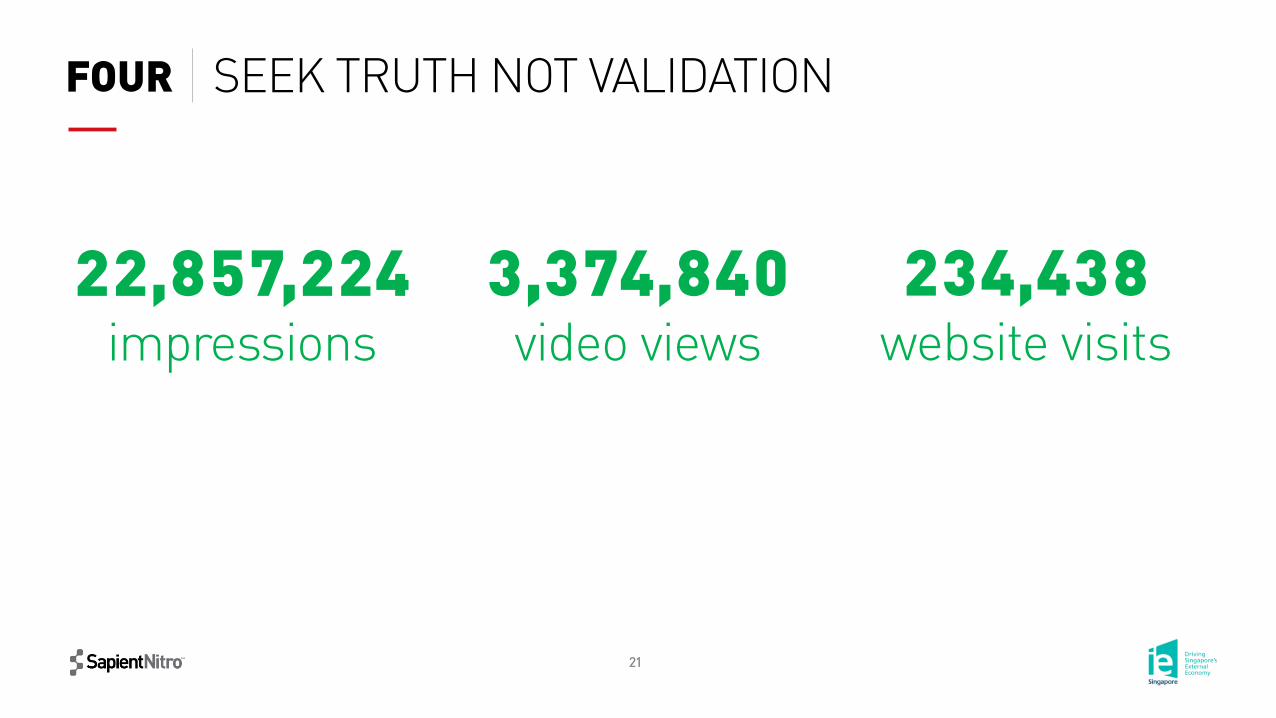
SEEK TRUTH NOT VALIDATIONFOUR
22,857,224impressions
3,374,840video views
234,438website visits
22
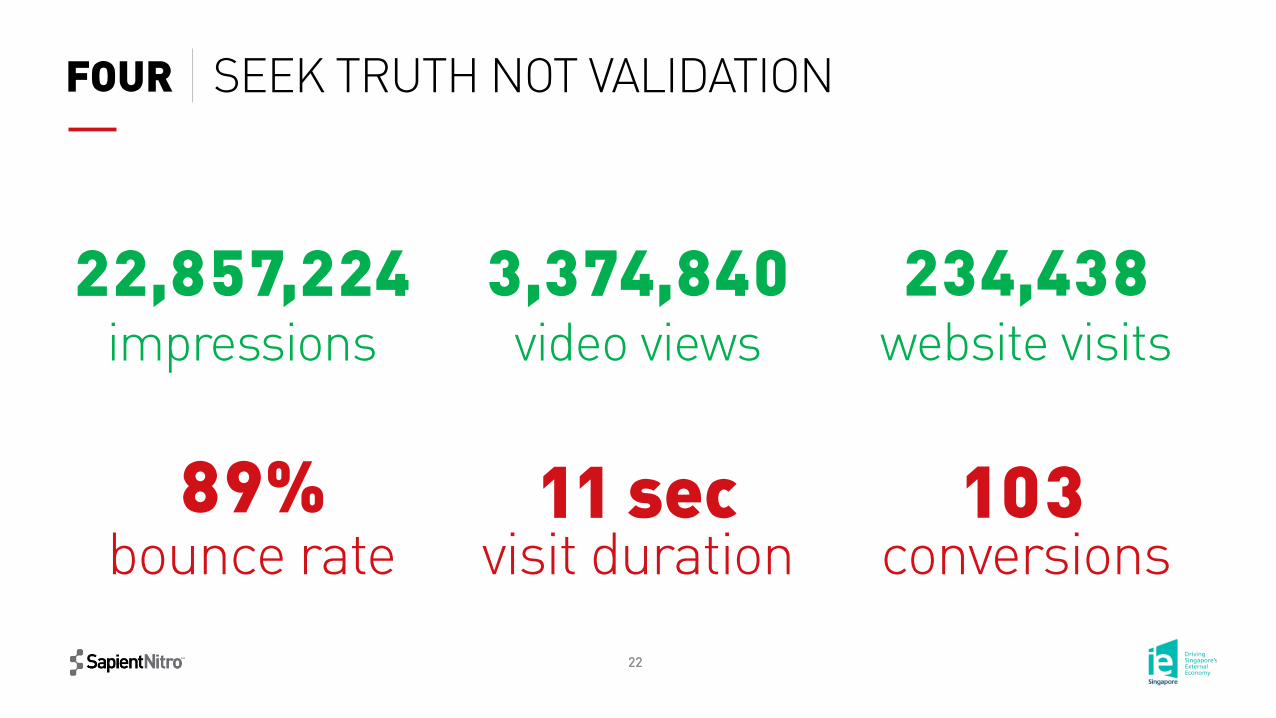
SEEK TRUTH NOT VALIDATIONFOUR
22,857,224
103
impressions
conversions
3,374,840video views
234,438website visits
89%bounce rate
11 secvisit duration

understand your datafive
24
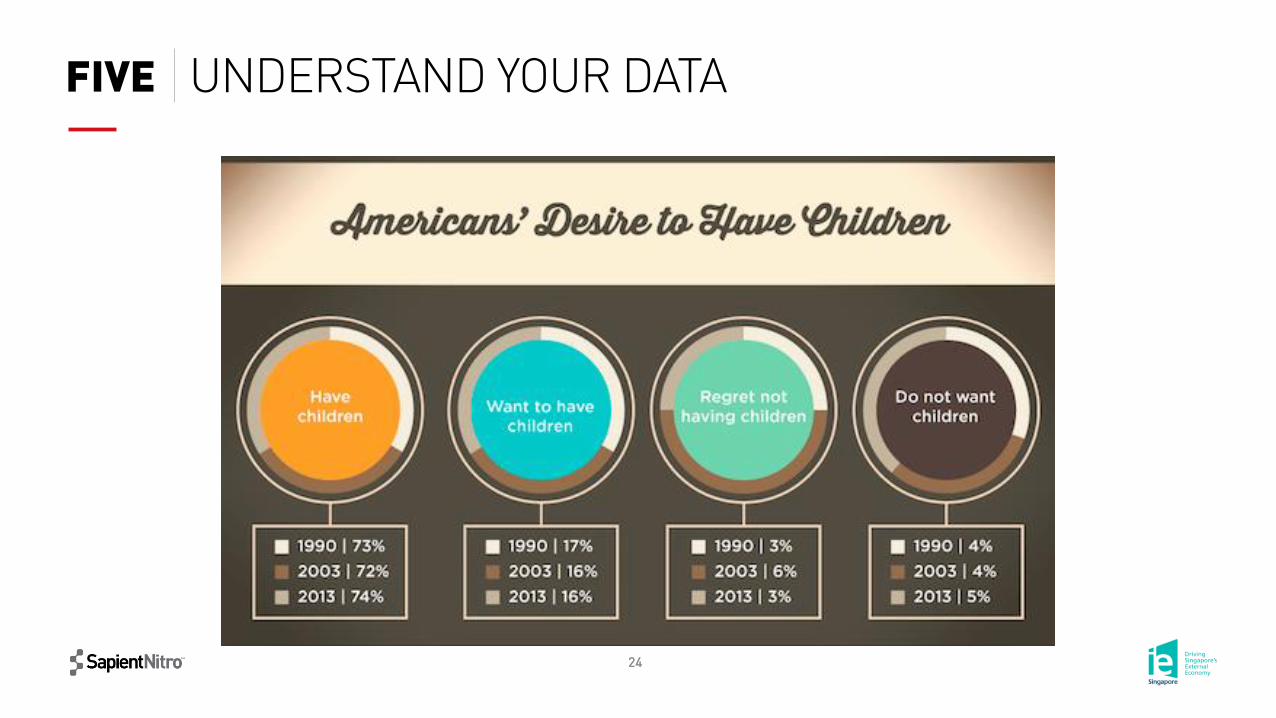
UNDERSTAND YOUR DATAFIVE
25
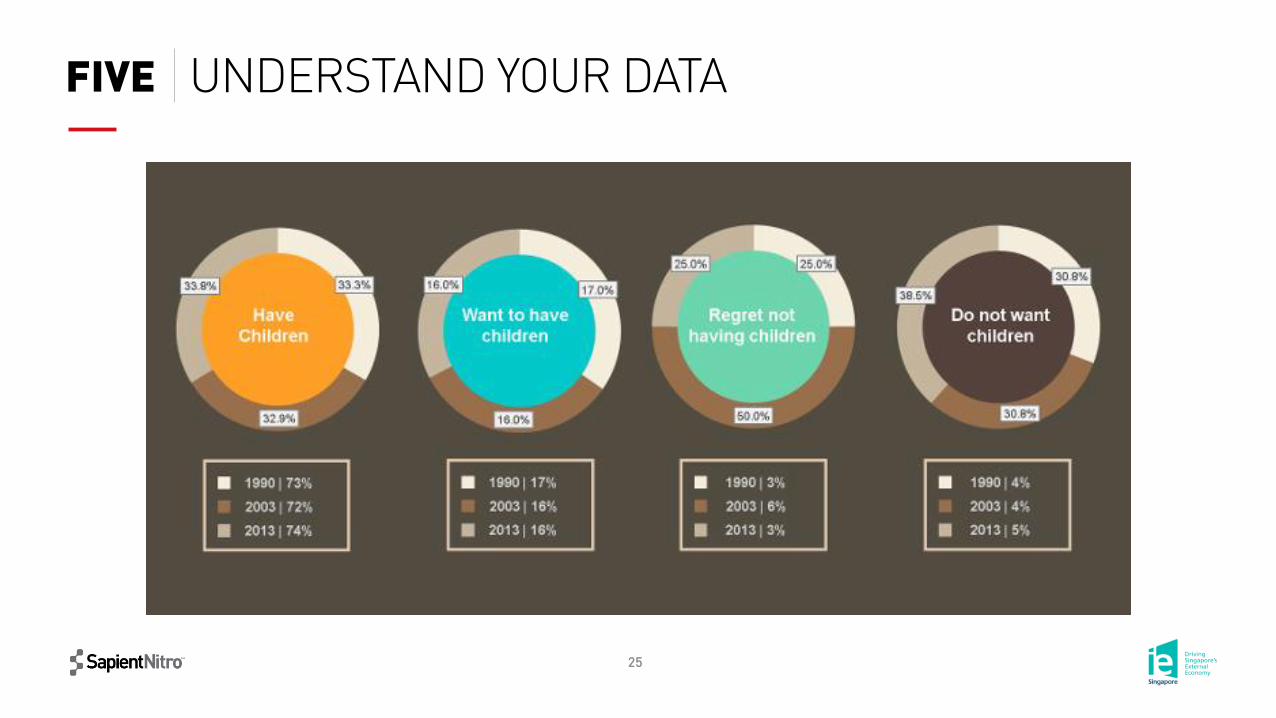
UNDERSTAND YOUR DATAFIVE
26
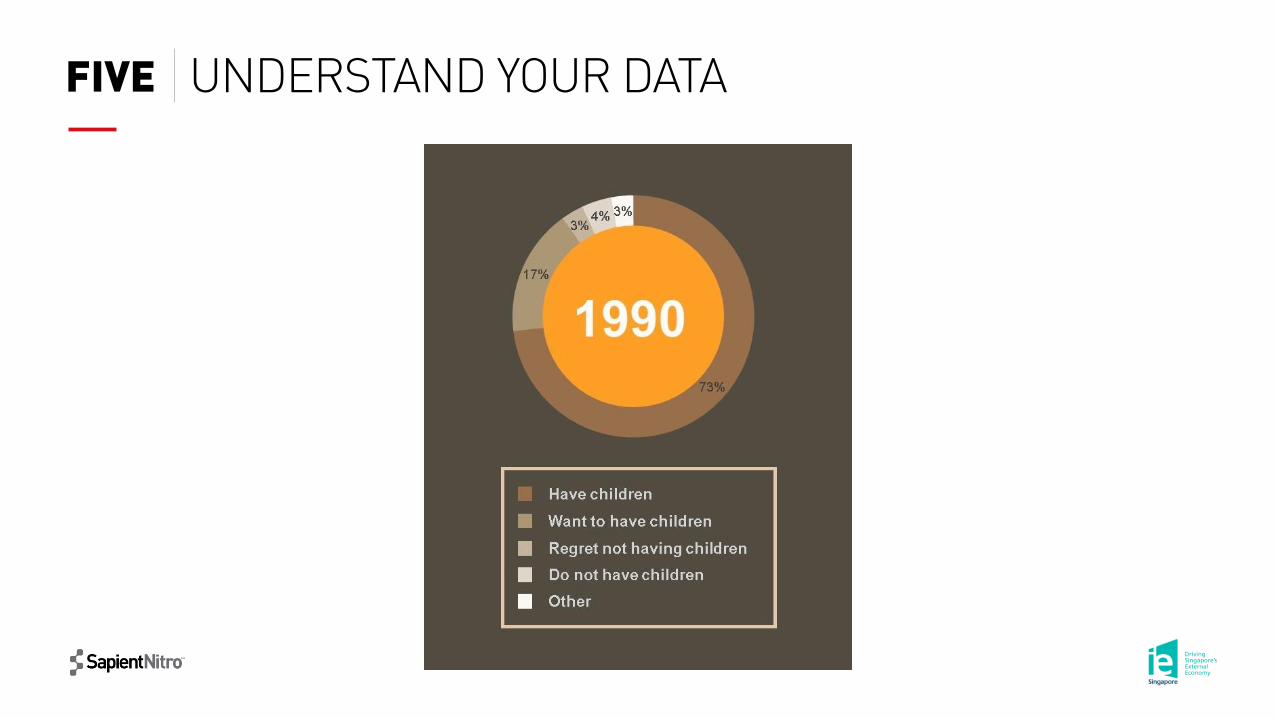
UNDERSTAND YOUR DATAFIVE

understand the limits of technology
six
28
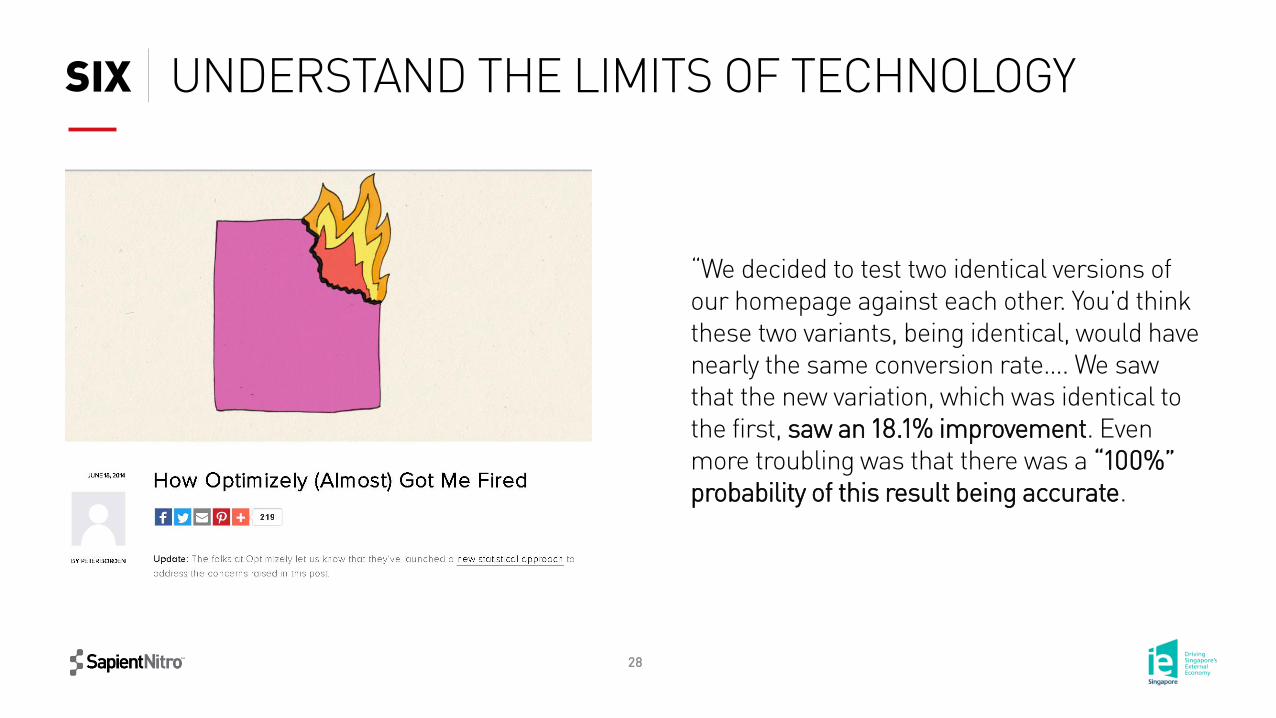
UNDERSTAND THE LIMITS OF TECHNOLOGYSIX
“We decided to test two identical versions of our homepage against each other. You’d think these two variants, being identical, would have nearly the same conversion rate…. We saw that the new variation, which was identical to the first, saw an 18.1% improvement. Even more troubling was that there was a “100%” probability of this result being accurate.
29
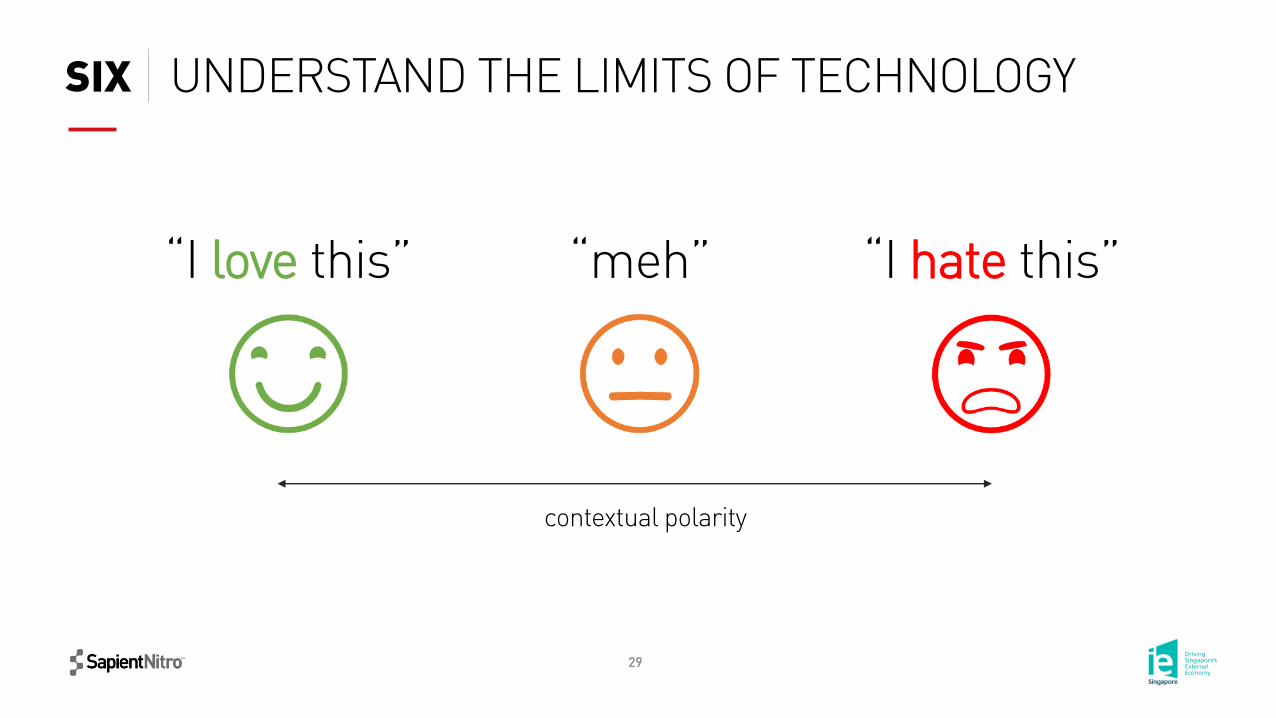
“I love this” “I hate this”“meh”
contextual polarity
UNDERSTAND THE LIMITS OF TECHNOLOGYSIX

30
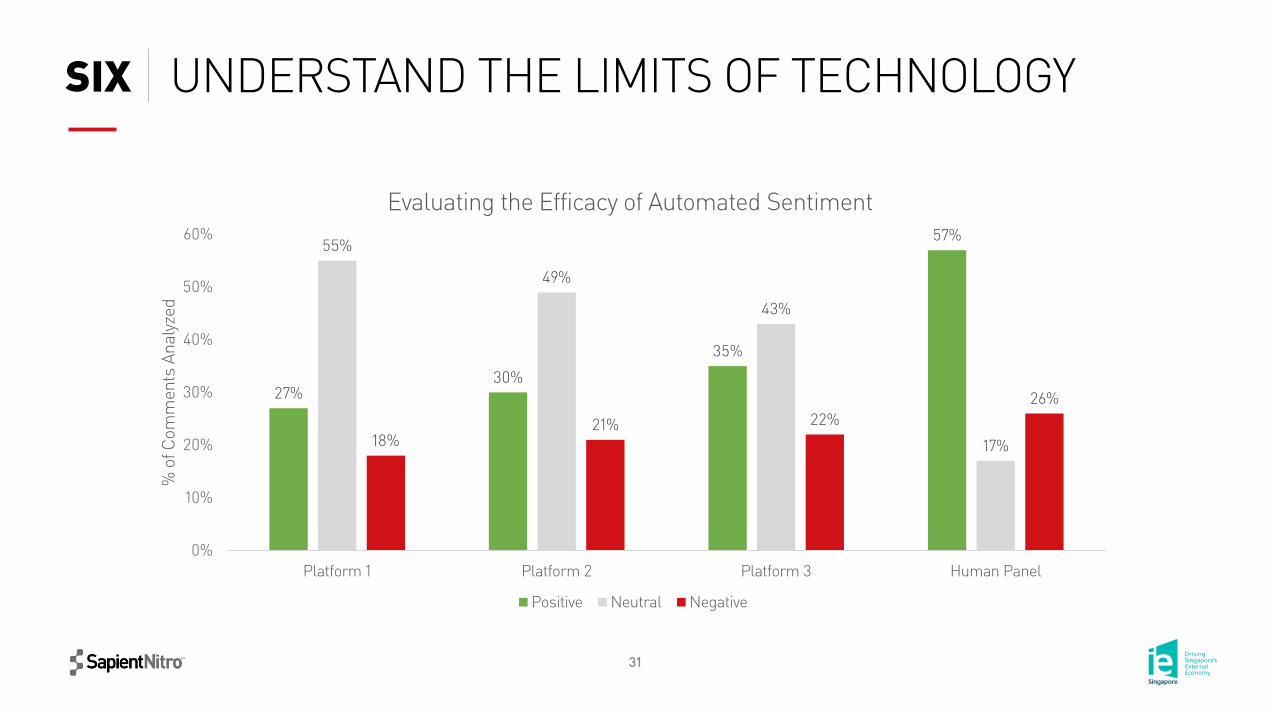
27%30%
35%
57%55%
49%
43%
17%18%21% 22%
26%
0%
10%
20%
30%
40%
50%
60%
Platform 1 Platform 2 Platform 3 Human Panel
% o
f Com
men
ts A
naly
zed
Evaluating the Efficacy of Automated Sentiment
Positive Neutral Negative
UNDERSTAND THE LIMITS OF TECHNOLOGYSIX
31
27%30%
35%
57%55%
49%
43%
17%18%21% 22%
26%
0%
10%
20%
30%
40%
50%
60%
Platform 1 Platform 2 Platform 3 Human Panel
% o
f Com
men
ts A
naly
zed
Evaluating the Efficacy of Automated Sentiment
Positive Neutral Negative
UNDERSTAND THE LIMITS OF TECHNOLOGYSIX

ensure you have ownership
seven
33
ENSURE YOU HAVE OWNERSHIPSEVEN
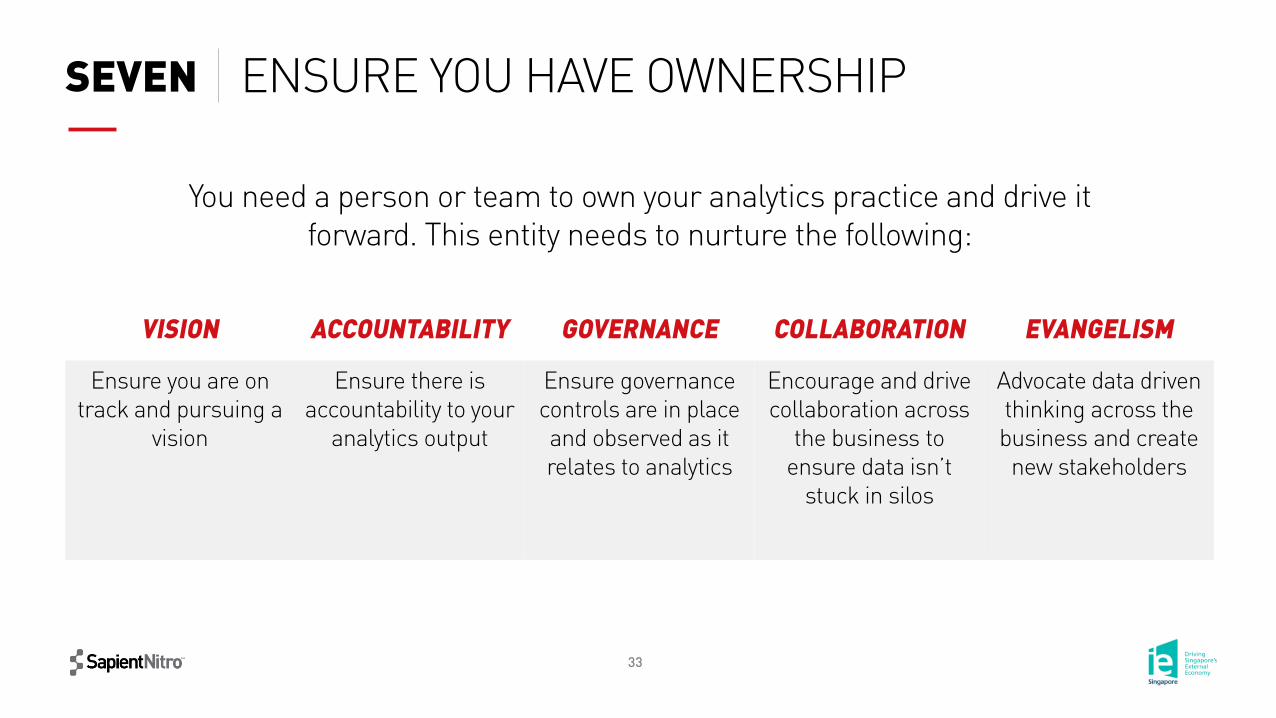
You need a person or team to own your analytics practice and drive it forward. This entity needs to nurture the following:
VISION ACCOUNTABILITY GOVERNANCE COLLABORATION EVANGELISM
Ensure you are on track and pursuing a
vision
Ensure there is accountability to your
analytics output
Ensure governance controls are in place and observed as it relates to analytics
Encourage and drive collaboration across
the business to ensure data isn’t
stuck in silos
Advocate data driven thinking across the business and create
new stakeholders

invest in storytellers not just data crunchers
eight
35
INVEST IN STORYTELLERSEIGHT
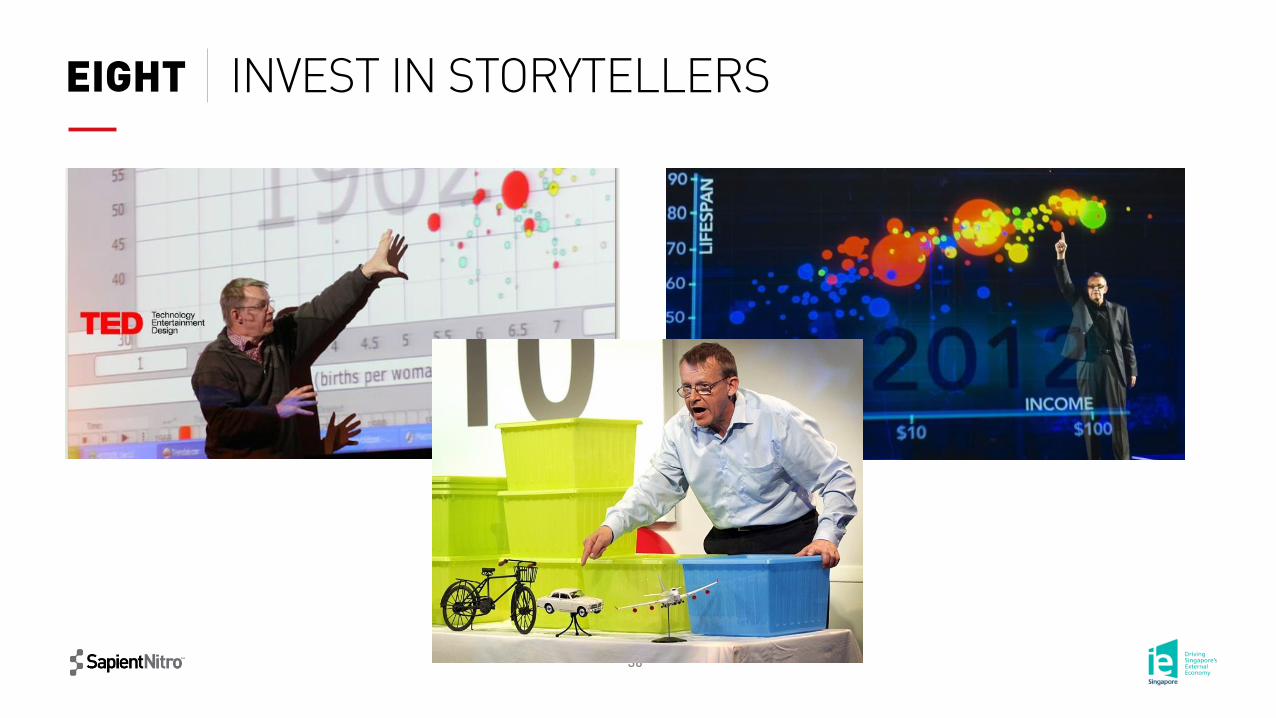
Empirical storytelling is the process of using data to tell a rich and compelling story. In practice, empirical storytelling requires a proficiency in collecting, cleaning,
interpreting and visualizing data, but it also requires someone who can communicate the data and key message in a way that resonates with the audience
Empirical Storytelling
36
INVEST IN STORYTELLERSEIGHT
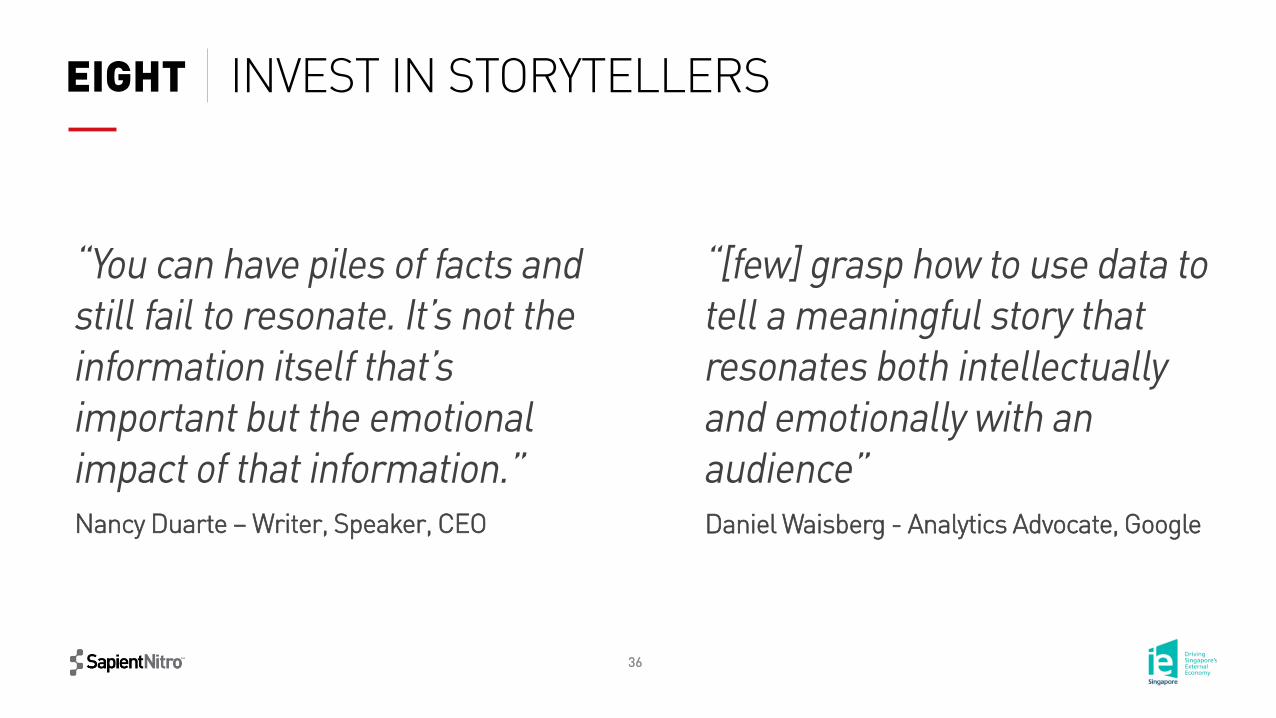
“You can have piles of facts and still fail to resonate. It’s not the information itself that’s important but the emotional impact of that information.”
“[few] grasp how to use data to tell a meaningful story that resonates both intellectually and emotionally with an audience”
Nancy Duarte – Writer, Speaker, CEO Daniel Waisberg - Analytics Advocate, Google
37
INVEST IN STORYTELLERSEIGHT
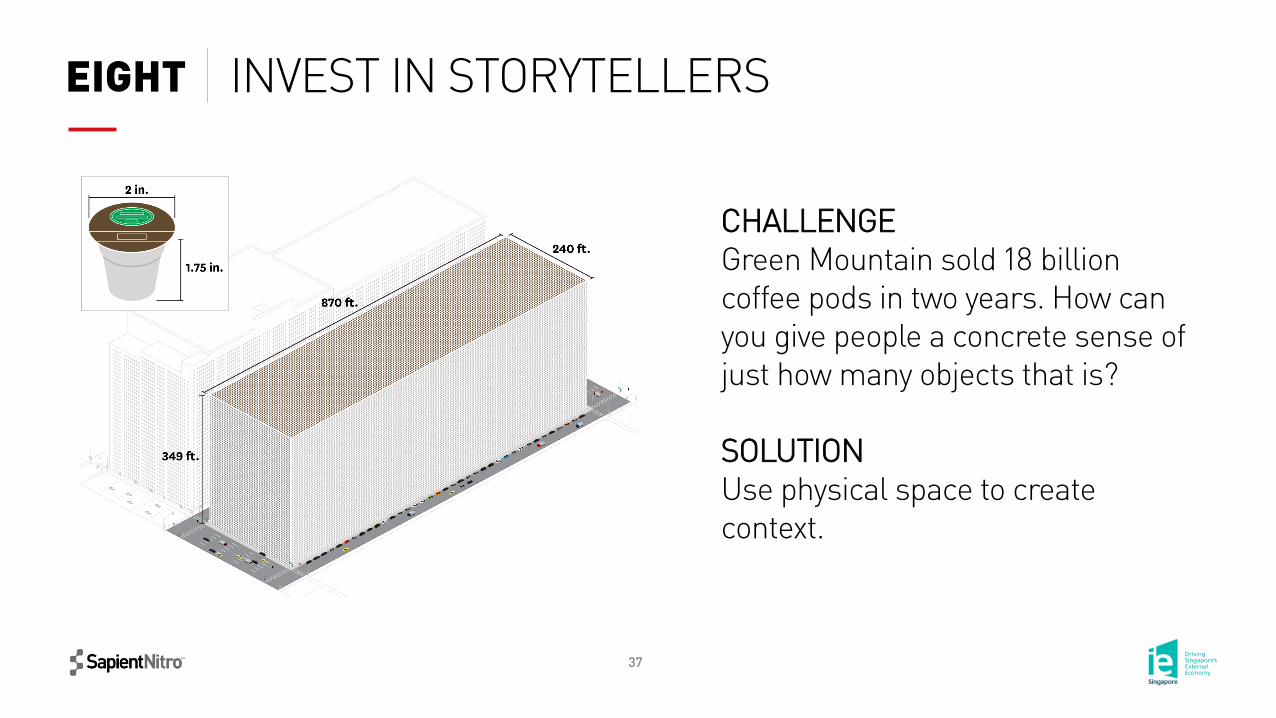
CHALLENGEGreen Mountain sold 18 billion coffee pods in two years. How can you give people a concrete sense of just how many objects that is?
SOLUTIONUse physical space to create context.
38
INVEST IN STORYTELLERSEIGHT

find meaningful ways to communicate data
nine
40
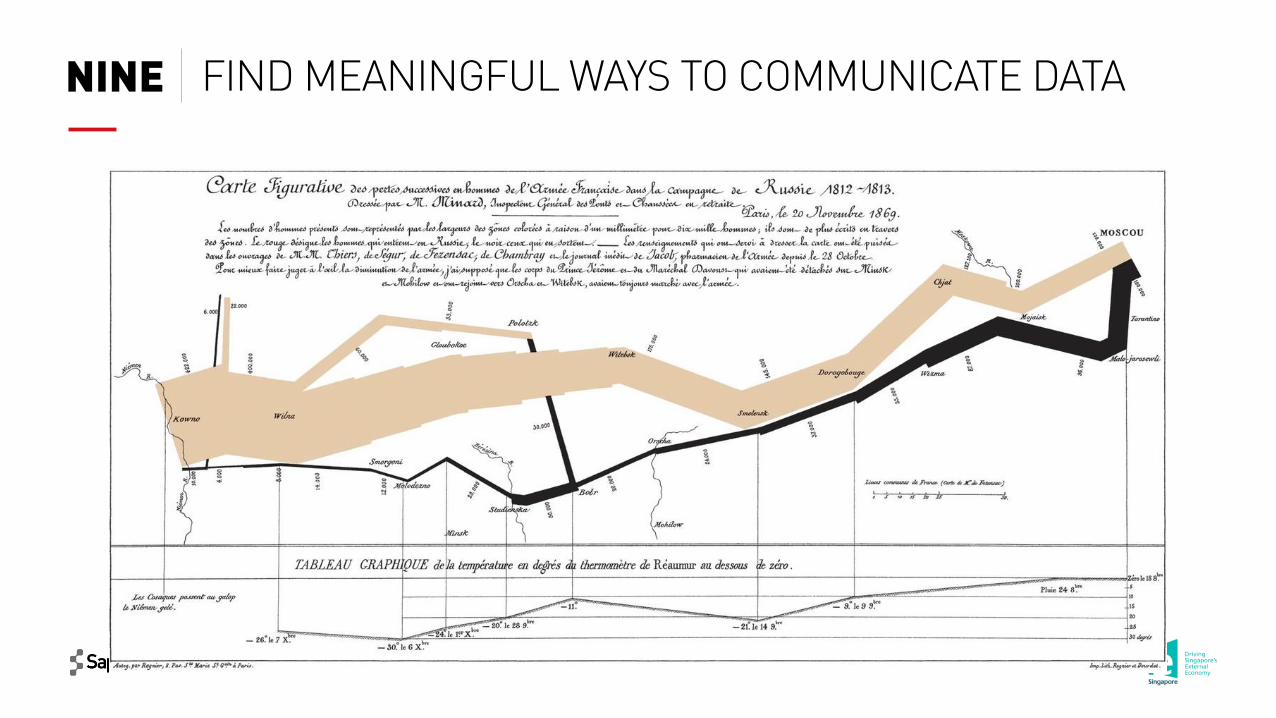
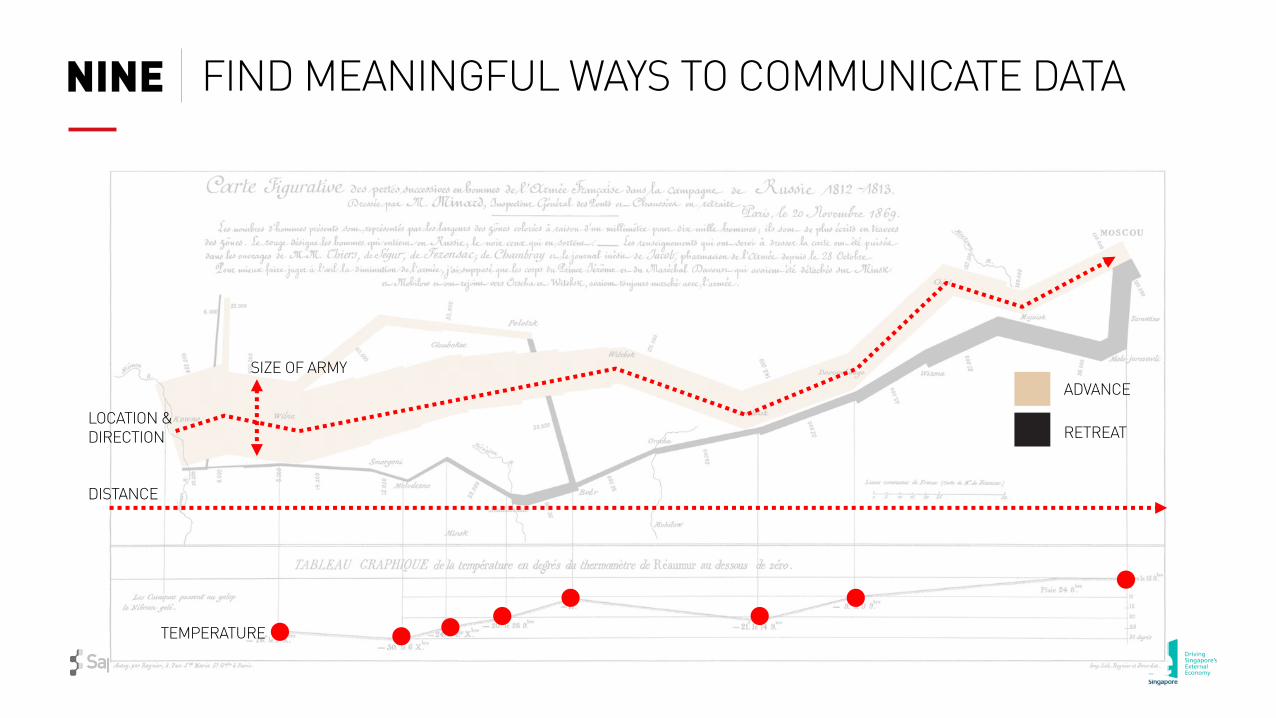
FIND MEANINGFUL WAYS TO COMMUNICATE DATANINE
41
FIND MEANINGFUL WAYS TO COMMUNICATE DATANINE
DISTANCE
LOCATION & DIRECTION
SIZE OF ARMY
TEMPERATURE
ADVANCE
RETREAT
42
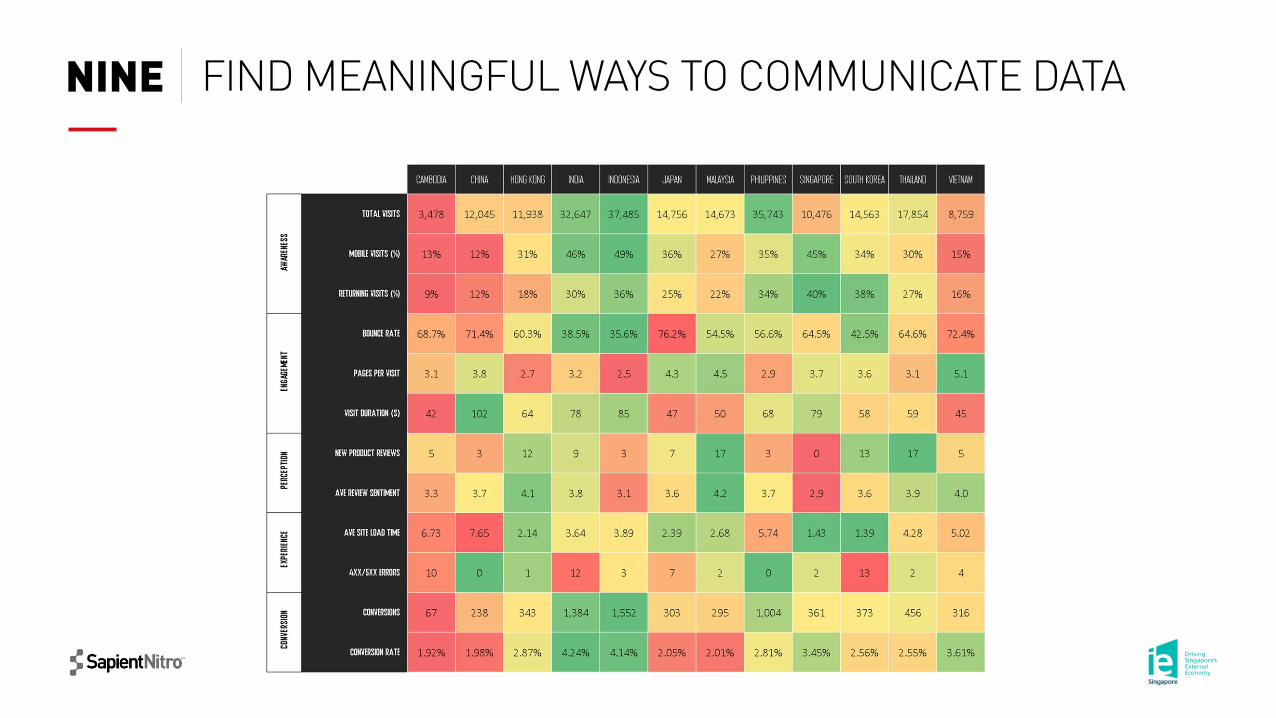
FIND MEANINGFUL WAYS TO COMMUNICATE DATANINE
43
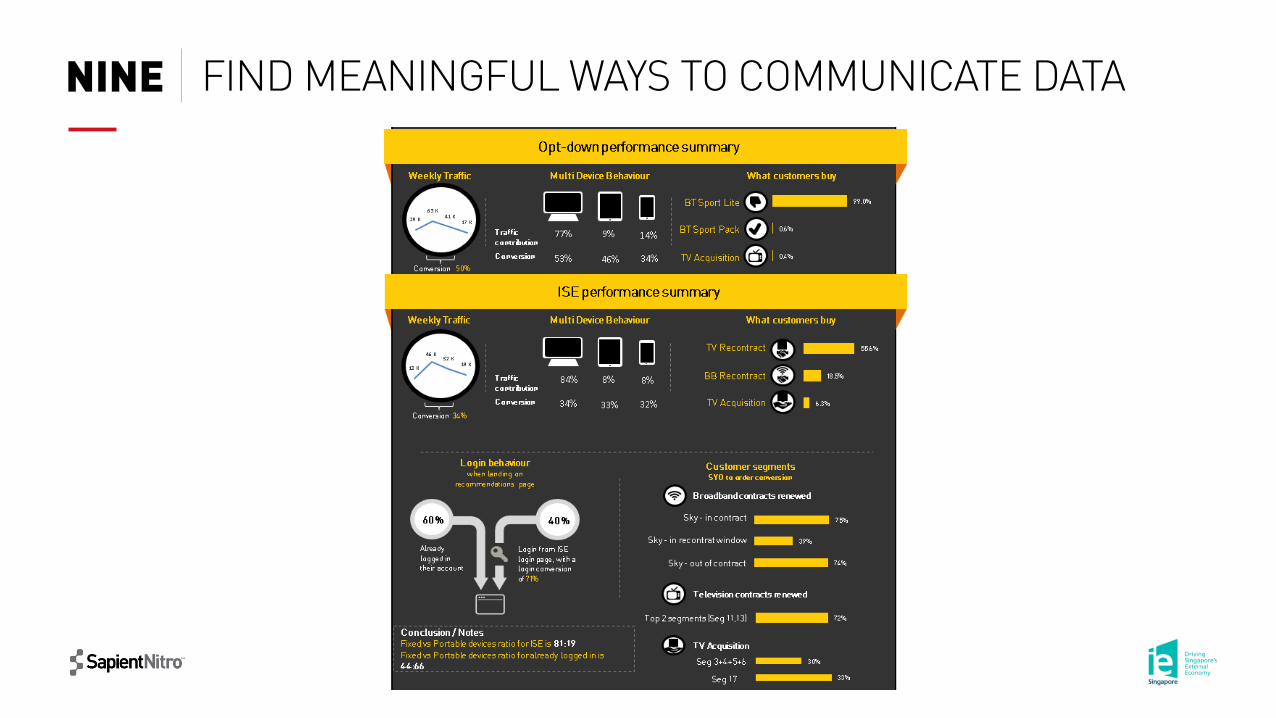
FIND MEANINGFUL WAYS TO COMMUNICATE DATANINE

tentransform datainto actionable insight
45
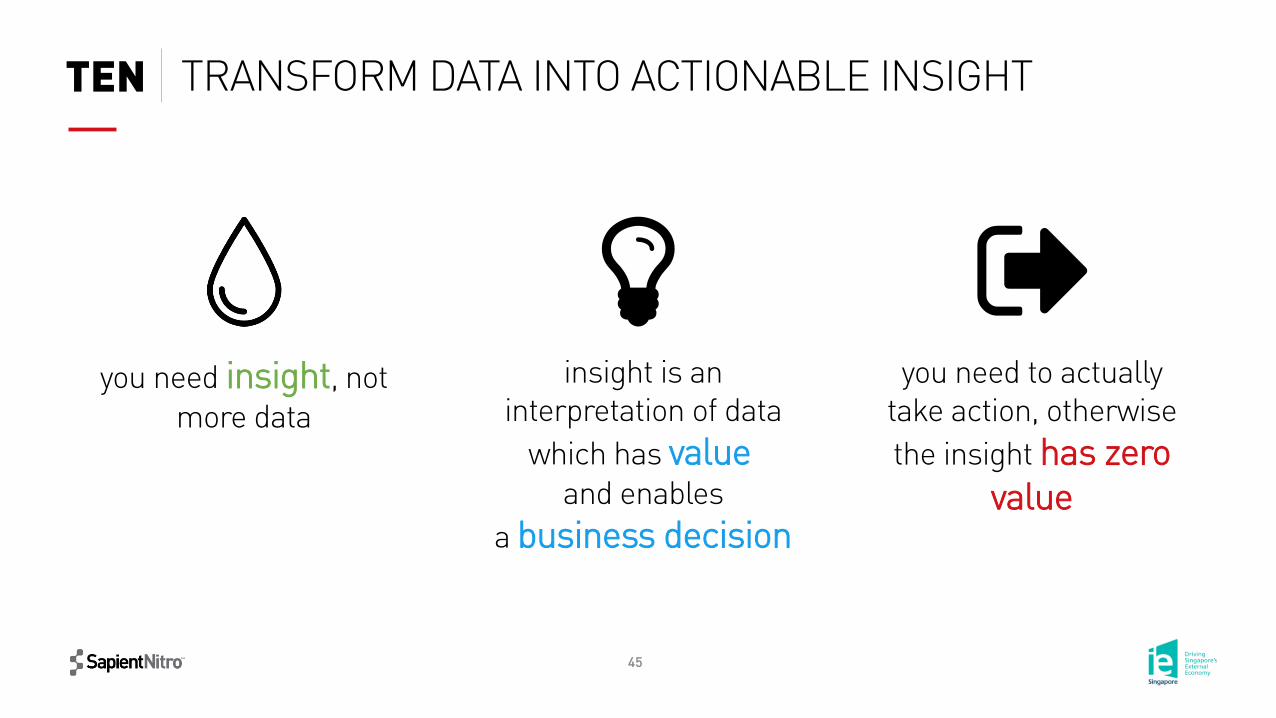
insight is an interpretation of data
which has valueand enables
a business decision
you need insight, not more data
you need to actually take action, otherwise the insight has zero
value
TRANSFORM DATA INTO ACTIONABLE INSIGHTTEN
46
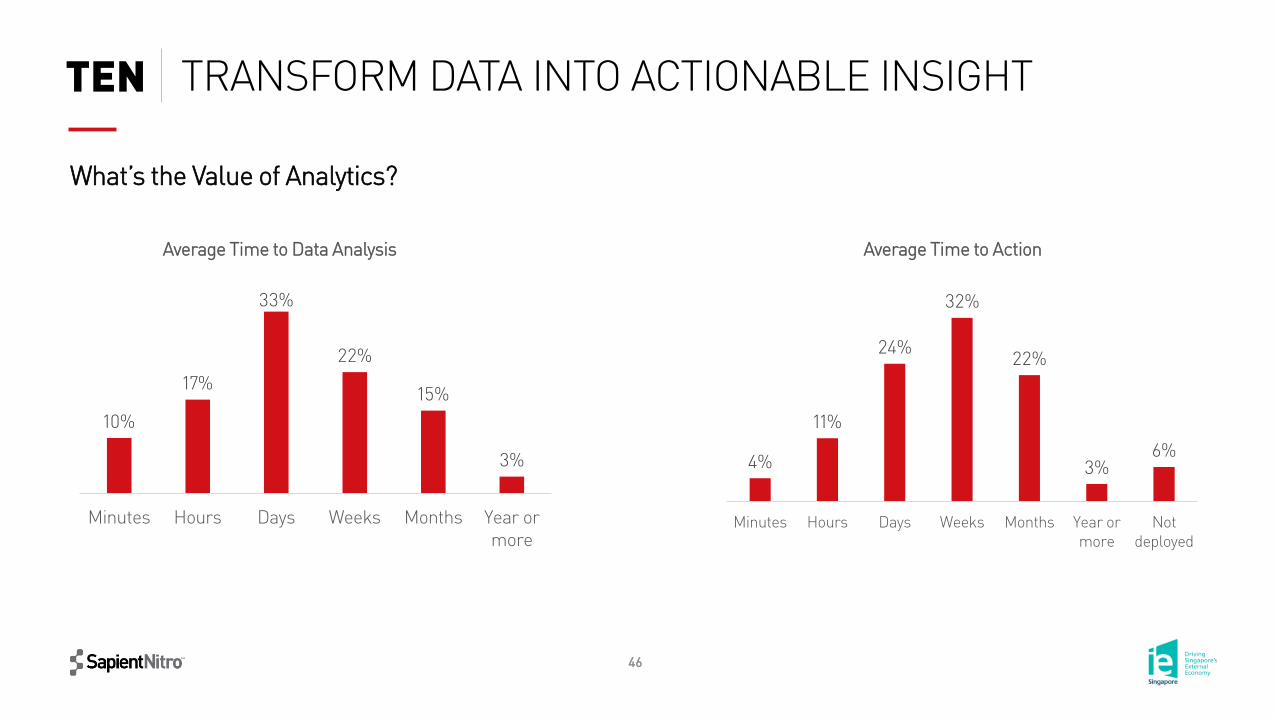
TRANSFORM DATA INTO ACTIONABLE INSIGHTTEN
Average Time to Data Analysis
10%
17%
33%
22%
15%
3%
Minutes Hours Days Weeks Months Year ormore
4%
11%
24%
32%
22%
3%6%
Minutes Hours Days Weeks Months Year ormore
Notdeployed
Average Time to Action
What’s the Value of Analytics?
47
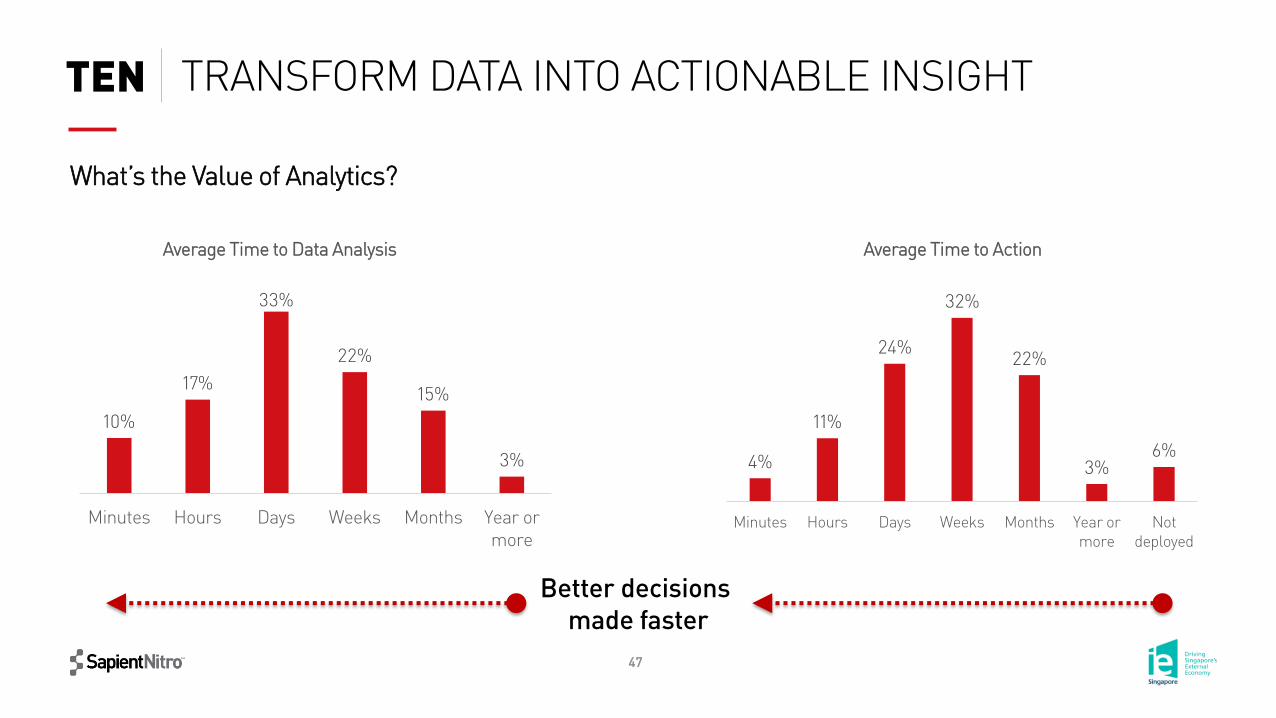
TRANSFORM DATA INTO ACTIONABLE INSIGHTTEN
Average Time to Data Analysis
10%
17%
33%
22%
15%
3%
Minutes Hours Days Weeks Months Year ormore
4%
11%
24%
32%
22%
3%6%
Minutes Hours Days Weeks Months Year ormore
Notdeployed
Average Time to Action
Better decisions made faster
What’s the Value of Analytics?
48
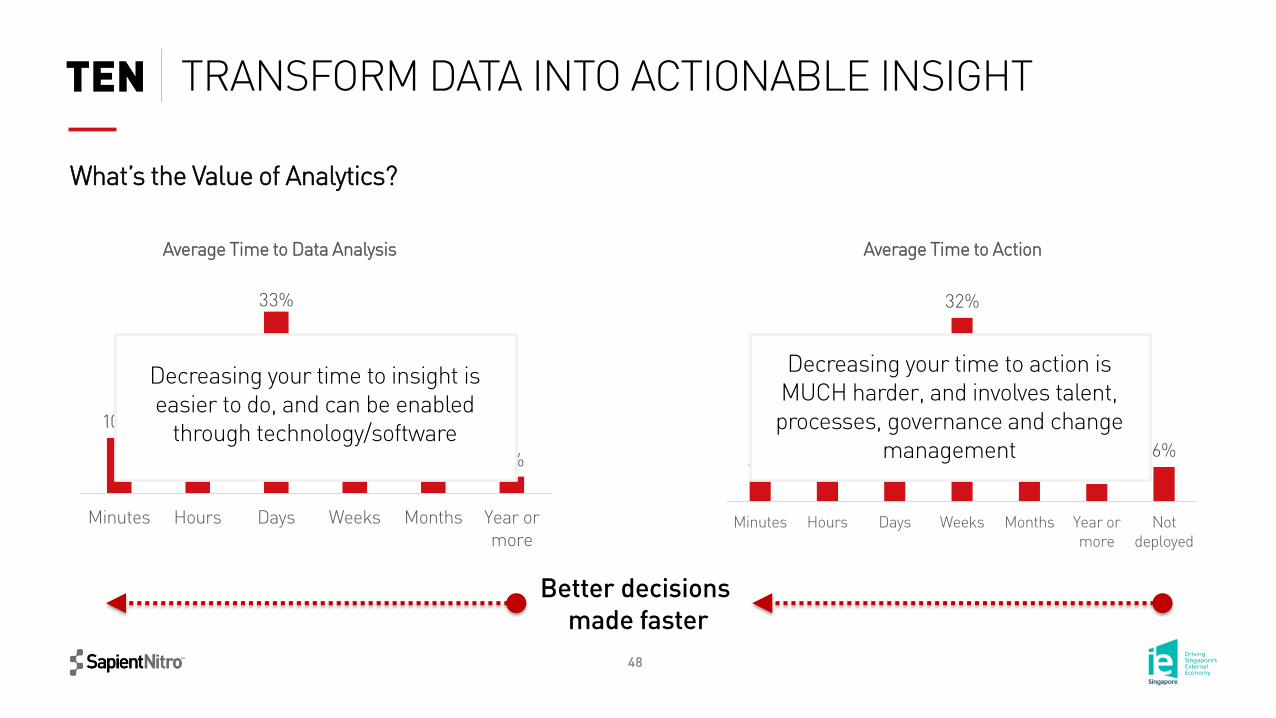
TRANSFORM DATA INTO ACTIONABLE INSIGHTTEN
Average Time to Data Analysis
10%
17%
33%
22%
15%
3%
Minutes Hours Days Weeks Months Year ormore
4%
11%
24%
32%
22%
3%6%
Minutes Hours Days Weeks Months Year ormore
Notdeployed
Average Time to Action
Better decisions made faster
Decreasing your time to insight is easier to do, and can be enabled
through technology/software
Decreasing your time to action is MUCH harder, and involves talent,
processes, governance and change management
What’s the Value of Analytics?

PRACTICAL STEPS FOR SMEs
50
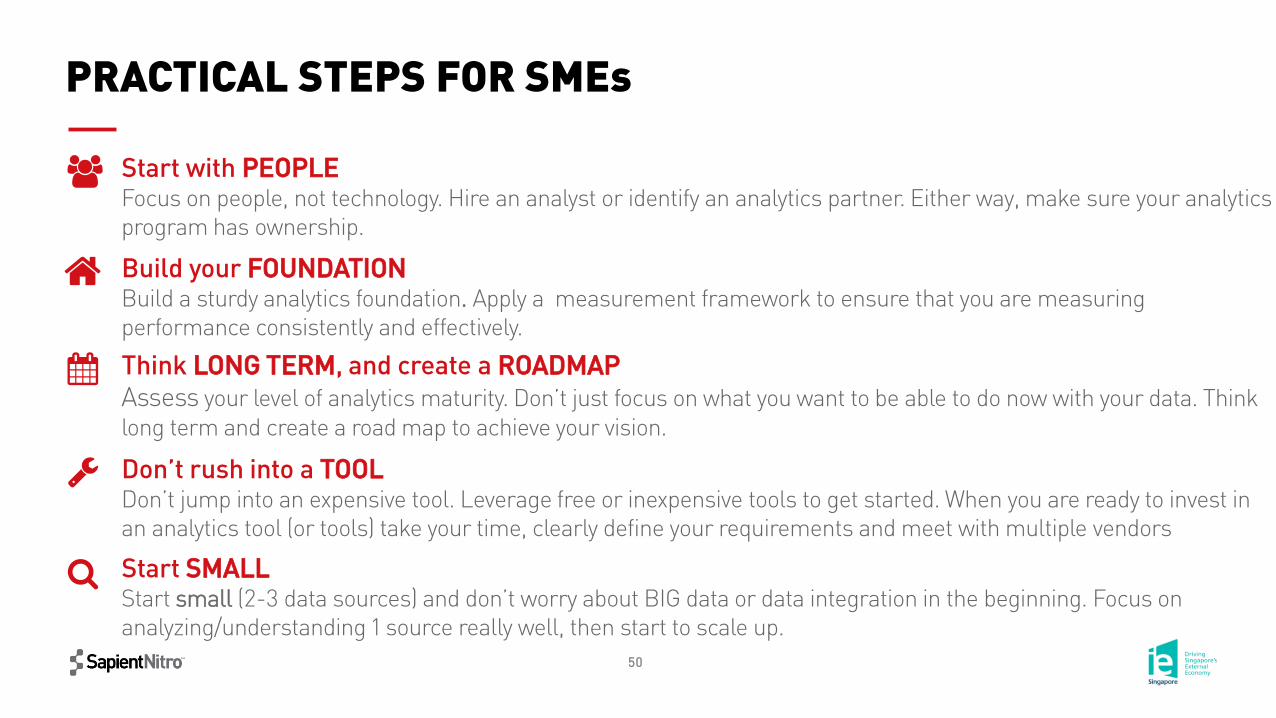
PRACTICAL STEPS FOR SMEs
Start with PEOPLEFocus on people, not technology. Hire an analyst or identify an analytics partner. Either way, make sure your analytics program has ownership.
Build your FOUNDATIONBuild a sturdy analytics foundation. Apply a measurement framework to ensure that you are measuring performance consistently and effectively.
Think LONG TERM, and create a ROADMAPAssess your level of analytics maturity. Don’t just focus on what you want to be able to do now with your data. Think long term and create a road map to achieve your vision.
Don’t rush into a TOOLDon’t jump into an expensive tool. Leverage free or inexpensive tools to get started. When you are ready to invest in an analytics tool (or tools) take your time, clearly define your requirements and meet with multiple vendors
Start SMALLStart small (2-3 data sources) and don’t worry about BIG data or data integration in the beginning. Focus on analyzing/understanding 1 source really well, then start to scale up.