Go Green Corporate Knights Inc. Business for a Better ... · Corporate Knights Inc. Business for a...
30
Go Green Capitalism Presents: Corporate Knights Inc. Business for a Better World 2016 Case Competition
Transcript of Go Green Corporate Knights Inc. Business for a Better ... · Corporate Knights Inc. Business for a...

Go Green Capitalism Presents:
Corporate Knights Inc. Business for a Better World 2016
Case Competition

Go Green Capitalism
Go-Green Capitalism Team
1
Introduction Proposal Action Plan Monitor
Expertise: Business and
Service Transformation
Expertise: Investment
Forecasting and Macroeconomic
Assessment
Laurent Sevigny Bhupinder Dulku Dorothy Pan
Business Consultant
Expertise: Financial
Modeling and Risk Analysis
Expertise: Equity and Capital Markets Research
Economist Financial Analyst Financial Analyst
Mukesh Dhatwalia
“Building A Profitably Greener Future Together Today”

Go Green Capitalism
Green Portfolio Challenge
2
Introduction Proposal Action Plan Monitor
Portfolio in Alignment with 2℃ Investing
Reduces Exposure to CO2 Emissions
Sustain High Rates of Return
Reduce Portfolio Risk Exposure

Go Green Capitalism
Portfolio Strategy Proposal
3
Introduction Proposal Action Plan Monitor
Divest and Re-Invest 18.8 billion (10.8%) from carbon intensive investments by 2020
Favourable Project
27%
73%
0.6%
8%
9%
tonnes of CO2 emissions
Fossil Fuel Reserves
remaining coal exposure
“brown exposure”
“green exposure”
Result:

Go Green Capitalism
Portfolio Management Strategy
Steps to implement the portfolio management strategy:
4
Introduction Proposal Action Plan Monitor
Action Plan is enabled by the Go-Green Capitalism Framework
Action Plan
Step 1: Divest
Step 2: Invest
Step 3: Influence

Go Green Capitalism
Action Plan: Framework
5
Introduction Proposal Action Plan Monitor
Sustainability +
Financial
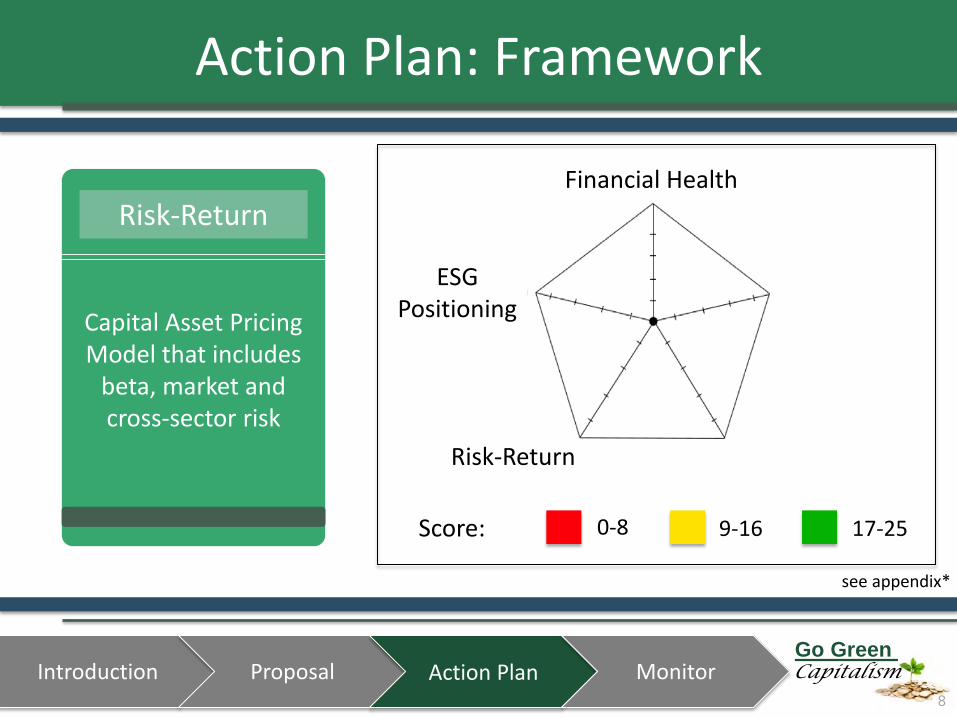
0-8 9-16 17-25
see appendix*
Score:

Go Green Capitalism
Action Plan: Framework
6
Introduction Proposal Action Plan Monitor
0-8 9-16 17-25
see appendix*
Score:
Company’s net worth and
debt/equity ratio
Financial Health Financial Health

Go Green Capitalism
Action Plan: Framework
7
Introduction Proposal Action Plan Monitor
0-8 9-16 17-25
see appendix*
Score:
ESG Positioning
Sector-risk level determined on 9
sustainability factors
Financial Health
ESG Positioning
Go Green Capitalism
Action Plan: Framework
8
Introduction Proposal Action Plan Monitor
0-8 9-16 17-25
see appendix*
Score:
Risk-Return
Capital Asset Pricing Model that includes
beta, market and cross-sector risk
Financial Health
ESG Positioning
Risk-Return

Go Green Capitalism
Action Plan: Framework
9
Introduction Proposal Action Plan Monitor
0-8 9-16 17-25
see appendix*
Score:
Future Value
Analyst prediction for potential
revenue as well as EPS growth
Financial Health
ESG Positioning
Risk-Return Future Value

Go Green Capitalism
Action Plan: Framework
10
Introduction Proposal Action Plan Monitor
0-8 9-16 17-25
see appendix*
Score:
Externalities
Security’s performance within its sector to relevant sustainability metrics
Financial Health
ESG Positioning
Externalities
Risk-Return Future Value

Go Green Capitalism
Glencore PLC Royal Dutch Shell (RDSA) Svenska Cellulosa AB
Action Plan: Framework
11
Introduction Proposal Action Plan Monitor
Financial Can cover ST but not LT debt
ESG Operates in a high risk sector
Risk-R Expected Risk-Return is -58%
Future Market Perform (Hold)
Ext. Sector Underperformance
Financial Can meet debt commitments
ESG Operates in a high risk sector
Risk-R Expected Risk-Return is -16%
Future Market Perform (Buy)
Ext. Average Sector Performance
11 8
Financial Assets able to cover all debt
ESG Operates in a med-risk sector
Risk-R Expected Risk-Return is +17%
Future L-Term Buy & Market Perform
Ext. Outperformance to Industry
17
Presenter
Presentation Notes
�

Go Green Capitalism
Action Plan – Step 1: Divest
12
Introduction Proposal Action Plan Monitor
Securities score
Royal Dutch Shell 11
BASF SE 12
Total SA 12
GDF Suez 11
Bayer AG 12
Glencore PLC 8
BHP Biliton 8
Eni Spa 7
SSE PLC 13
BG Group 7
0 - 8 9 - 16 17 - 25
RDSA.L FP.PA ENGL.PA BAYN.DE
GLEN.L BLT.L ENI.MA SSE.L BG.L
BAS.DE
Energy
Divest 25% per year of $18.8 billion over the next 4 years
Energy Materials Utilities
Presenter
Presentation Notes
�

Go Green Capitalism
Action Plan – Step 2: Invest
13
Introduction Proposal Action Plan Monitor
see appendix*
Re-Investment of $18.8 billion into 14 securities over 4 years
Rebalancing of Energy, Materials, and
Utilities
21.4%
Re-Investment into existing fund
positions
49.3%
New investment options based on
framework
29.3%
Presenter
Presentation Notes
One of the most innovative pieces on our business plan is the application of the framework for re-investment

Go Green Capitalism
Action Plan – Step 3: Influence
14
Introduction Proposal Action Plan Monitor
USA: Exxon Mobil Chevron Corp
see appendix*
SPAIN: Iberdrola SA
UK: National Grid BP PLC
GERMANY: Linde AG
Worldwide Operations
Direct Corporate
Engagement
Proxy Voting
File Shareholder
Proposals
Go Green Capitalism
Portfolio Risk-Reduction
15
Introduction Proposal Action Plan Monitor
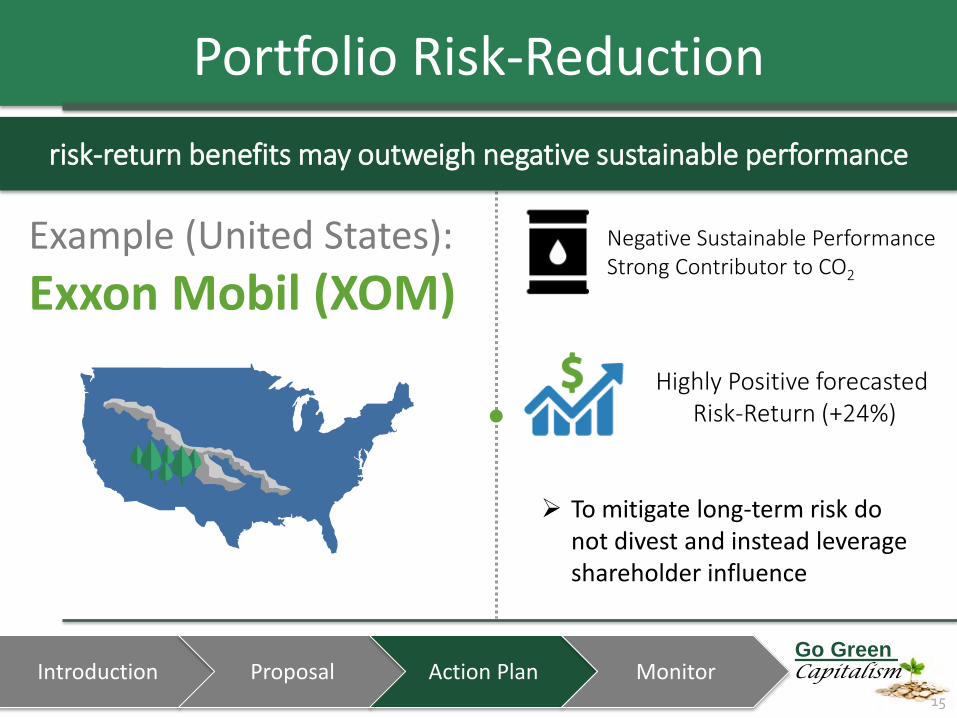
Example (United States): Exxon Mobil (XOM)
risk-return benefits may outweigh negative sustainable performance
Negative Sustainable Performance Strong Contributor to CO2
Highly Positive forecasted Risk-Return (+24%)
To mitigate long-term risk do not divest and instead leverage shareholder influence

Go Green Capitalism
Monitor: Balanced Scorecard
16
Norway Government Pension Fund Global Performance Measurements
Annual Return
• The annual return will measures the portfolio’s year over year capital gains and earnings from dividends.
• KPI: >5% Annual Portfolio Return (exceed 2014’s 5% annual returns).
Portfolio CO2 Emissions
• Position to not exceed a 2o temperature increase Each year the portfolio will have to reduce the amount of CO2 emissions.
• KPI: 27% reduction of tones of CO2 emissions per million dollar of revenue by 2020.
Treynor Ratio
• To measure the portfolio performance risk based on the annual return, risk-free rate and calculated Beta.
• KPI: Decrease portfolio risk by 5% annually for a total of 20% risk reduction by 2020.
2020 Portfolio Objectives: Reduce CO2 Emissions, Risk to Volatility, Maximize Annual Return
Introduction Proposal Action Plan Monitor
Presenter
Presentation Notes
Objectives of Go-Green Capitalism Investment Strategy: Minimize carbon footprint, reduce the risk of stranded assets and maximize annual return of the fund. In order to achieve the objectives, we adopt BSC to manage performance. Use three data to measure how are things going: Annual return, Portfolio CO2 emissions and Treynor Ratio. Treynor Ratio: “subtract the average return of the risk-free rate (using U.S. Treasury Bills) from the average return of the portfolio, then divided by the portfolio beta”. Portfolio beta which is in line with systematic risk could be greatly influenced by climate change. Expected value for measurement (KPI) How to make a corrective intervention if KPI is not met?

Go Green Capitalism
Strategy Investment Performance
17
Introduction Proposal Action Plan Monitor
S&P500
Source: Google Finance
$18,817,656,010 Total Invested
+218.75% Return Over Time
+69.32% S&P500
+$22,345,966,512 Difference from Benchmark
Go Green Capitalism
Summary
18
Introduction Proposal Action Plan Monitor
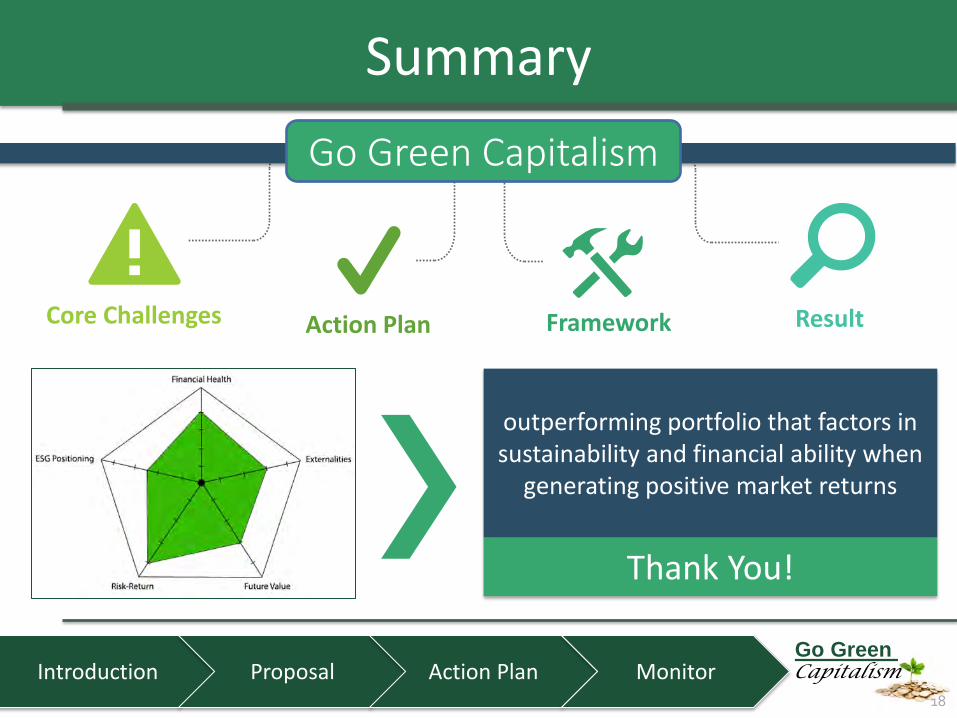
Core Challenges Action Plan
Go Green Capitalism
Framework Result
outperforming portfolio that factors in sustainability and financial ability when
generating positive market returns
Thank You!

Go Green Capitalism
Appendix: Framework Definitions
19
Introduction Proposal Action Plan Monitor
Metrics: Comparison measurement of a security’s relative performance within its sector to other stocks in that sector.
Financial Health Company’s net worth and debt/equity ratio
ESG Positioning
The sector risk-level determined on 9 important sustainability factors faced by all industries. (See Appendix: ESG Positioning)
Risk-Return Capital Asset Pricing Model (HeraclesTM) that includes beta, market, as well as cross-sector relationship risk between industries
Future Value Security’s potential EPS and company growth
Externalities An assessment of a security’s performance within its industry to relevant SASB metrics
Figure 1: Sustainability Snowflake
0-8 9-16
Aggregate Score:
17-25

Go Green Capitalism
Appendix: Framework Weighting for Sensitivity Basis
20
Introduction Proposal Action Plan Monitor
Framework Model Weighting:
Financial Health
given a 1.0 model weighting. Past performance of the security and management of debt/equity are important for sound growth
ESG Positioning
given a 1.0 model weighting. Overarching sector issues may not all be relevant to the security’s performance
Externalities
given a 1.5 model weight. Performance of the security relative to other securities decreased risk associated with the security. Pick best performers
Future Value given a 0.5 model weight due to large amount of assumption work involved
Risk-Return given a 1.5 model weight as cross-sector risk relationship is an important consideration for sustainability
Figure 1: Sustainability Snowflake
0-8 9-16
Aggregate Score:
17-25

Go Green Capitalism
Appendix: Framework Sensitivity Results on Change
21
Introduction Proposal Action Plan Monitor
Sensitivity Analysis: Financial Health
no change -> best metric in assessing fundaments of investment
ESG Positioning
decreased to weight of 0.5 -> Not considering the sector risk level the security operates in introduces undue an incomplete investment assessment
Externalities
decreased to weight of 0.5 -> decreased potential return as securities did not consider their performance relative to other securities in the sector
Future Value increased to weight of 1 -> caused risk level to significantly increase.
Risk-Return
decreased to weight 0.5 -> decreases in appropriate selection of securities. Loss of diversification due to less cross sector risk-relationship assessment
Figure 1: Sustainability Snowflake
0-8 9-16
Aggregate Score:
17-25

Go Green Capitalism
Appendix: ESG Positioning
22
Introduction Proposal Action Plan Monitor
• Sustainability factors taken as consideration. These sustainability metrics were involved in the literature assessment of the securities and allowed to quantifiable determine sector risk-levels with respect to sustainability issues. Each sector has potential for these concerns to come up. Examples:
Sustainability Issues (Factors)
1. Energy
2. Water Use
3. Emissions to Water
4. Waste
5. Emissions to Air
6. Ecosystems
7. Workplace Health & Safety
8. Disaster Risk
9. Site Contamination
Cement (High Risk Sector)
Sector Risk-Level Examples (L, Medium, High)
Forestry (Medium) Electronics (High)
Crops (Medium) Textiles (Medium)
Chemicals (High) Retail (Low)
Glass (Medium) Mining (High)
Pharmaceuticals (High Risk Sector)

Go Green Capitalism
Appendix: Action Plan – Step 2: Invest
23
Introduction Proposal Action Plan Monitor
Re-investment of $18.8 billion into the following 14 securities
Strategy Stock Name Framework Score Allocation
Re-Investment Energy, Materials, Utilities
National Grid PLC 12 10.7%
Linde AG 9 7.1%
Iberdrola SA 8 3.6%
Re-Investment into existing positions (from list of 100 Norway Pension Fund Global Securities)
Reckitt Benckiser Group 19 14.3%
Johnson and Johnson 19 14.3%
L’Oreal SA 19 3.6%
Unilever 20 4.0%
Novo Nordisk A/5 16 6.7%
Svenska Cellulosa 17 6.4%
New Investment options based on sustainable investing framework
Biogen Idec 18 4.6%
Allergan PLC 16 9.4%
Storebrand 16 3.9%
Dassault Systèmes 21 7.1%
Koninklijke Philips 16 4.3%
Presenter
Presentation Notes
One of the most innovative pieces on our business plan is the application of the framework for re-investment

Go Green Capitalism
Appendix: Action Plan – Step 2: New Investment Selection
24
Introduction Proposal Action Plan Monitor
New Investment options based on sustainable investing Framework
Security Country Framework Score Allocation of $18.8 billion
Biogen Idec USA 18 4.6%
Allergan PLC Ireland 16 9.4%
Storebrand Norway 16 3.9%
Dassault Systèmes France 21 7.1%
Koninklijke Philips Netherlands 16 4.3%
Securities for assessment were selected from Corporate Knights: The Global 100 Most Sustainable Corporations [Source: http://www.corporateknights.com/magazines/2015-
global-100-issue/2015-global-100-results-14218559/]. Then the framework was applied to all securities found on this list and securities with a negative risk-return were remove from
the list of potential candidates. Allocation was a result of an assessment of performance within sector due to externalities, future growth prospects, as well as risk-return metric.
Presenter
Presentation Notes
One of the most innovative pieces on our business plan is the application of the framework for re-investment

Go Green Capitalism
Appendix: Action Plan – Step 2: Re-Investment Geography
25
Introduction Proposal Action Plan Monitor
Geographic Representation of the $18.8 billion Re-investment
Presenter
Presentation Notes
One of the most innovative pieces on our business plan is the application of the framework for re-investment

Go Green Capitalism
Appendix: Action Plan – Step 3: Influence
26
Introduction Proposal Action Plan Monitor
• NGFP has the ability to influence corporate policies on environmental and social concerns with investment decisions.
• NGFP may leverage shareholder engagement for the fund to influence positive change with sustainable business investing.
Securities score
National Grid 12
Exxon Mobil 12
Linde AG 9
Iberdrola SA 8
Chevron Corp. 12
BP PLC 11
Action Plan: Influence
• Direct Corporate Engagement – leverage shareholder power to influence corporate behaviour and boards of directors
• Proxy Voting – vote in favour of ESG supported decision making
• Filing Shareholder Proposals – take the lead on putting together proposals that address a company’s performance and future investment in sustainable operations

Go Green Capitalism
Appendix: Literature Review
27
Introduction Proposal Action Plan Monitor
• A variety of sources, including primary and secondary, were used in the creation of the action plan, framework, and risk assessment.
Sources Benson, C., Gupta, N., and Mateti, R. (2010). “Does Risk Reduction Mitigate the Costs of Going Green? An Empirical
Study of Sustainable Investing.” Southern Journal of Business and Ethics, Vol. 2, 2010, 7-25 Clark, G. L., Feiner, A., & Viehs, M. (2014). From the Stockholder to the Stakeholder: How Sustainability Can Drive
Financial Outperformance. McGlade, Christophe and Paul Elkins (2015). “The Geographical Distribution of Fossil Fuels Unused When Limiting
Global Warming to 2 degrees”. Scientific Collective. MacMillan Publishers Ltd. <http://www.collectif- scientifique-gaz-de-schiste.com/fr/accueil/images/pdf/texteschoisis/McGlade_et_al-2015- Nature.pdf>
Swanest. Intelligent Investing Made Simple: Swany. <www.swanest.com> Willard, B. (2012). The New Sustainability Advantage: Seven Business Case Benefits of a Triple Bottom Line. New
Society Publishers. Urwin, Roger and Claire Woods. Sustainable Investing: Principles and Practices (2011). Towers Watson.
<https://www.towerswatson.com/en/Insights/IC-Types/Ad-hoc-Point-of-View/Perspectives/2011/Sustainable-Investing-Principles-and-Practices>
Note: Not an exhaustive list of all the secondary sources used. Important ones listed above

Go Green Capitalism
Appendix: Business Case for Sustainability
28
Introduction Proposal Action Plan Monitor
Shifting Trend in Environmental Subsidies • Governments spend over USD 640 billion / year on
environmental harmful fossil fuel subsidies compared to the USD 121 billion spent on renewable-energy subsidies (OECD, 2013).
• trend towards subsidy spending with environmental initiatives
Debunking The Myth That Sustainable Investment is Not Profitable ‘From The Stockholder To The Stakeholder Art’ by Arabesque Partners and the University of Oxford • “80% of the studies [more than 200 studies] show that
stock price performance is positively influenced by sustainability practices”
• “Positive environmental news triggers positive stock price movements”
• Oppositely: “Following environmental disasters…stock price of affected firms reacts significantly negatively”
• “Firms that are more ‘eco-efficient’ significantly outperform firms that are less ‘eco-efficient’
Best in Class Screening Investment Strategy • invest in profitable companies who excel in
Environment, Social and Government (ESG) factors
http://sustainabilityadvantage.com/2013/02/05/5-reasons-i-low-ball-employee-productivity-in-the-business-case-for-sustainability/

Go Green Capitalism
Appendix: Trade-Off Analysis
29
Introduction Proposal Action Plan Monitor
What is the trade-off of sustainable investing?
Investing with a sustainable focus may mean smaller returns in the short run however in the long run undoubtedly generates higher returns. Furthermore
there is some undue risk attached to not knowing the future and the direction trends will head. But the same holds for negative sustainable companies
generating returns.
Mitigation: The Norwegian people are long-term planning individuals that want to protect
returns in the long run and not be dependent on the volatility of the short term. Investing sustainably promotes this philosophy and is in line with goals of the
Norway Government Pension Fund