Gluskin Sheff + Associates Inc. Rosenberg Spring 2018.pdf · Gluskin Sheff + Associates Inc....
67
Gluskin Sheff + Associates Inc. Paradigm Shift David A. Rosenberg Email: [email protected] Tel: +1 (416) 681-8919 April 2018 Paradigm Shift David A. Rosenberg Email: [email protected] Tel: +1 (416) 681-8919 April 2018 fåîÉëíÉÇ=áå=óçìê=éêçëéÉêáíó
Transcript of Gluskin Sheff + Associates Inc. Rosenberg Spring 2018.pdf · Gluskin Sheff + Associates Inc....

Gluskin Sheff + Associates Inc.
Paradigm ShiftDavid A. RosenbergEmail: [email protected]: +1 (416) 681-8919
April 2018
Paradigm ShiftDavid A. RosenbergEmail: [email protected]: +1 (416) 681-8919
April 2018
fåîÉëíÉÇ=áå=óçìê=éêçëéÉêáíó

Gluskin Sheff + Associates Inc.
Notes:Source: BusinessWeek (August 13, 1979)
1
BEWARE OF THE FRONT COVER EFFECT

Gluskin Sheff + Associates Inc.
Notes:Source: The Economist (October 7th – 13th, 2017)
2
THIS ONE MAY HAVE MARKED THE TOP
Gluskin Shes + Associates Inc.
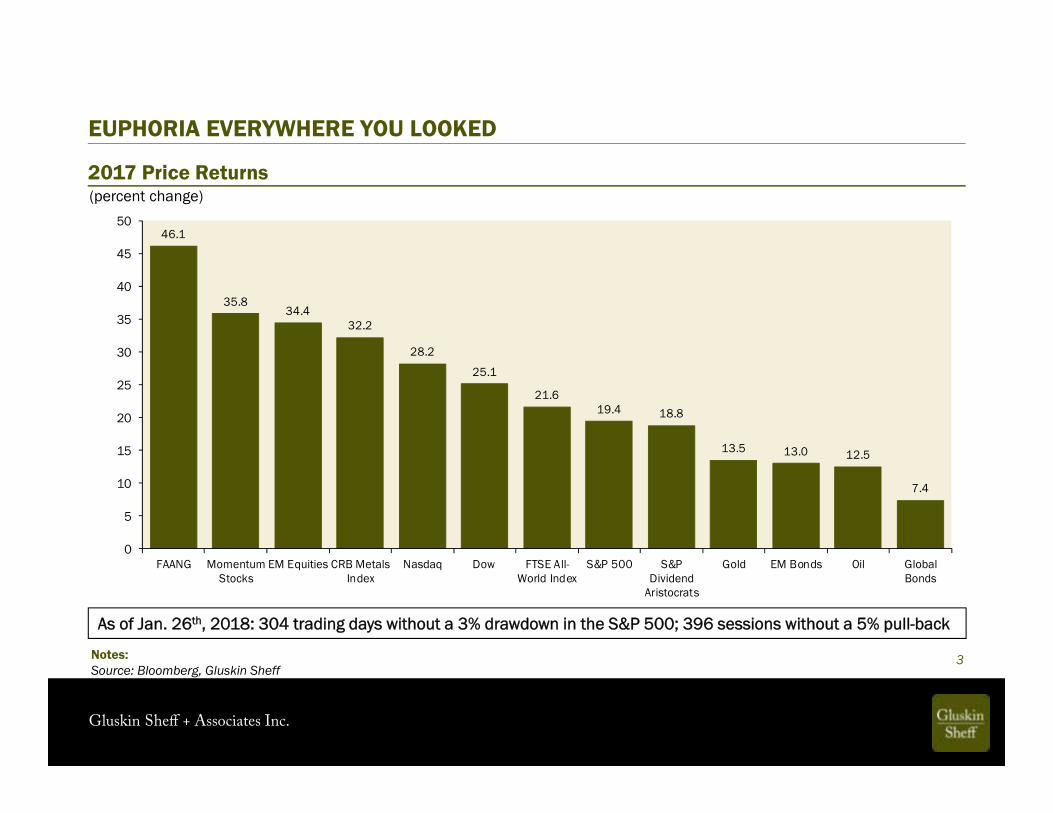
EUPHORIA EVERYWHERE YOU LOOKED
2017 Price Returns
3Notes:Source: Bloomberg, Gluskin Sheff
(percent change)
As of Jan. 26th, 2018: 304 trading days without a 3% drawdown in the S&P 500; 396 sessions without a 5% pull-back
46.1
35.834.4
32.2
28.2
25.1
21.619.4 18.8
13.5 13.0 12.5
7.4
0
5
10
15
20
25
30
35
40
45
50
FAANG MomentumStocks
EM Equities CRB MetalsIndex
Nasdaq Dow FTSE All-World Index
S&P 500 S&PDividend
Aristocrats
Gold EM Bonds Oil GlobalBonds

Gluskin Sheff + Associates Inc.
4
I find myself in an interesting position for an investor from the value school. I recognize on one hand that this is one of the highest-priced markets in US history. On the other hand, as a historian of the great equity bubbles, I also recognize that we are currently showing signs of entering the blow-off or melt-up phase of this very long bull market.
— Jeremy Grantham, January 3rd, 2018
ONE LAST MELT-UP!
*Sees the potential for a final 60% surge over the next two years
Gluskin Sheff + Associates Inc.
5
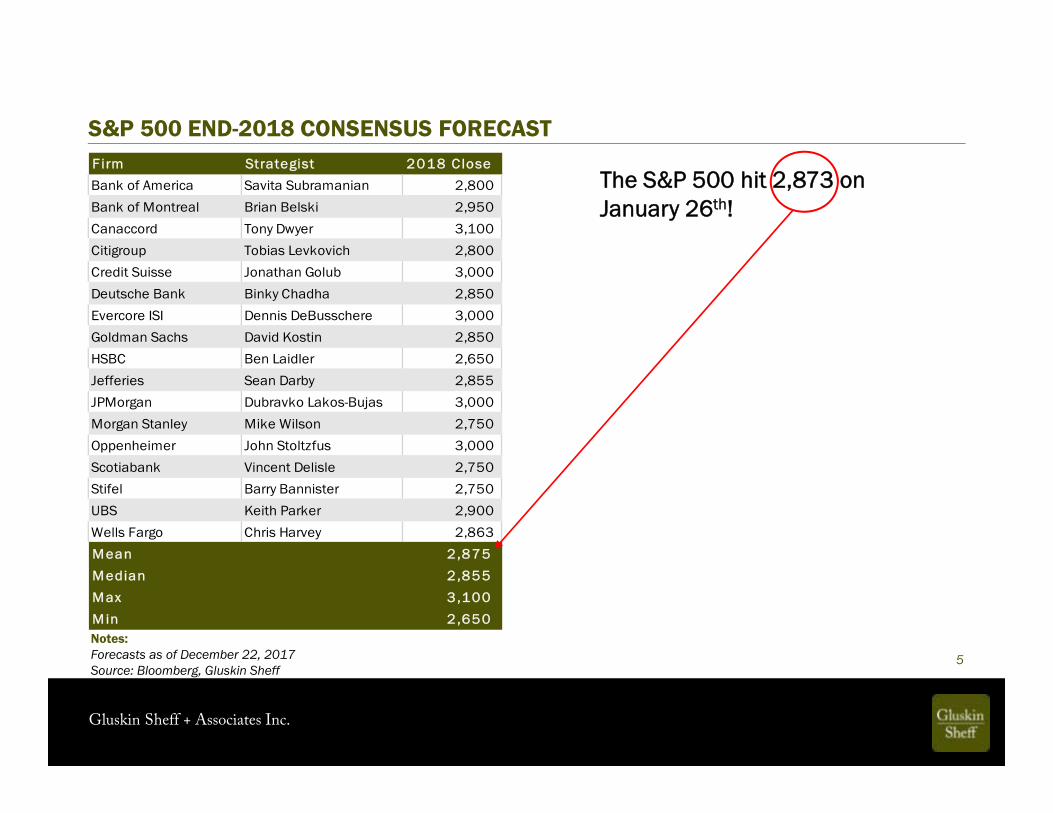
S&P 500 END-2018 CONSENSUS FORECASTFirm Strategist 2018 C loseBank of America Savita Subramanian 2,800 Bank of Montreal Brian Belski 2,950 Canaccord Tony Dwyer 3,100 Citigroup Tobias Levkovich 2,800 Credit Suisse Jonathan Golub 3,000 Deutsche Bank Binky Chadha 2,850 Evercore ISI Dennis DeBusschere 3,000 Goldman Sachs David Kostin 2,850 HSBC Ben Laidler 2,650 Jefferies Sean Darby 2,855 JPMorgan Dubravko Lakos-Bujas 3,000 Morgan Stanley Mike Wilson 2,750 Oppenheimer John Stoltzfus 3,000 Scotiabank Vincent Delisle 2,750 Stifel Barry Bannister 2,750 UBS Keith Parker 2,900 Wells Fargo Chris Harvey 2,863 Mean 2,875 Median 2,855 Max 3,100 M in 2,650
The S&P 500 hit 2,873 on January 26th!
Notes:Forecasts as of December 22, 2017Source: Bloomberg, Gluskin Sheff

Gluskin Sheff + Associates Inc.
6
The stock market has smashed one record after another, gaining $8 trillion in value. That is great news for Americans’ 401k, retirement, pension, and college savings accounts.
— January 30, 2018
HOW ARE THOSE 401Ks MR. PRESIDENT?
Notes:Source: State of the Union Address (January 30, 2018)

Gluskin Sheff + Associates Inc.
7
“There are two bubbles: We have a stock market bubble, and we have a bond market bubble…what’s behind the bubble? Well the fact, that, essentially, we’re beginning to run an ever-larger government deficit. As a share of GDP debt has been rising very significantly and we’re just not paying enough attention to that.”
— January 31, 2018
HE KNOWS BUBBLES BETTER THAN ANYBODY
Notes:Source: Alan Greenspan, Bloomberg TV, January 31, 2018

Gluskin Sheff + Associates Inc.
8
1. Markets tend to return to the mean over time2. Excesses in one direction will lead to an opposite excess
in the other direction3. There are no new eras — excesses are never permanent4. Exponential rapidly rising or falling markets usually go
further than you think, but they do not correct by going sideways
5. The public buys the most at the top and the least at the bottom
6. Fear and greed are stronger than long-term resolve7. Markets are strongest when they are broad and weakest
when they narrow to a handful of blue-chip names8. Bear markets have three stages — sharp down, reflexive
rebound and a drawn-out fundamental downtrend9. When all the experts and forecasts agree — something
else is going to happen10. Bull markets are more fun than bear markets
BOB FARRELL’S 10 MARKET RULES TO REMEMBER
Gluskin Sheff + Associates Inc.
9
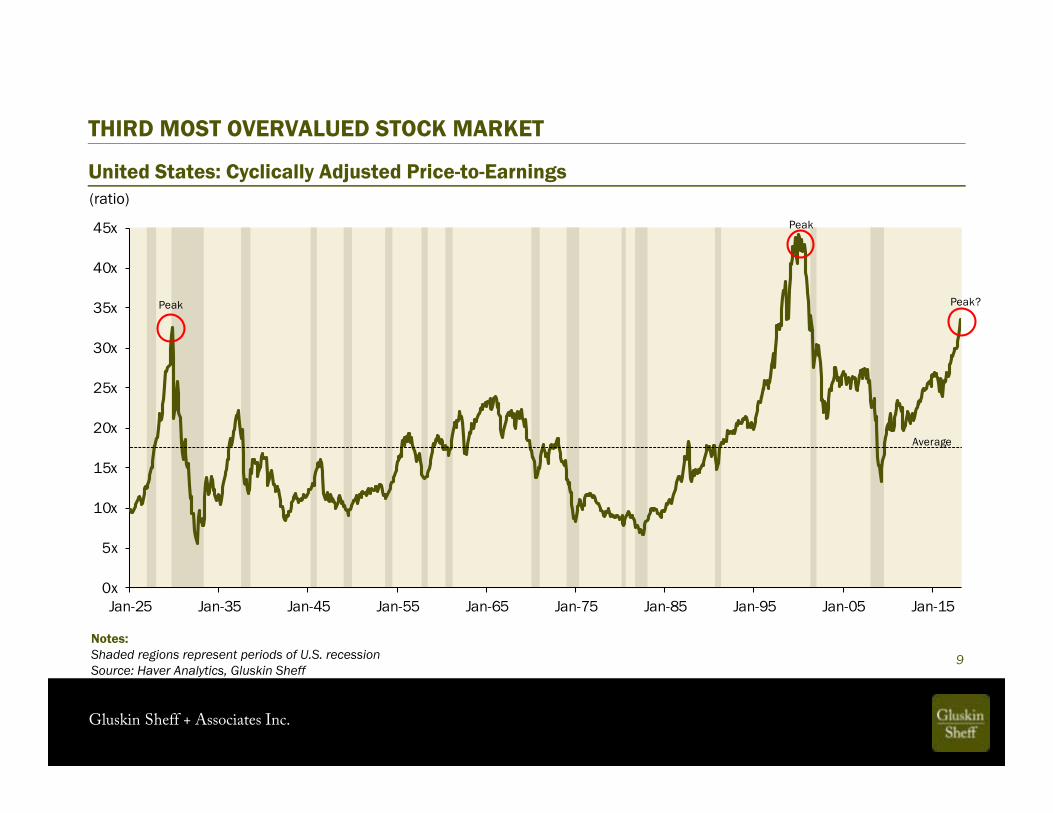
(ratio)
THIRD MOST OVERVALUED STOCK MARKET
United States: Cyclically Adjusted Price-to-Earnings
Notes:Shaded regions represent periods of U.S. recessionSource: Haver Analytics, Gluskin Sheff
0x
5x
10x
15x
20x
25x
30x
35x
40x
45x
Jan-25 Jan-35 Jan-45 Jan-55 Jan-65 Jan-75 Jan-85 Jan-95 Jan-05 Jan-15
Average
Peak
Peak
Peak?
Gluskin Sheff + Associates Inc.
Notes:Shaded regions represent periods of U.S. recessionSource: Haver Analytics, Gluskin Sheff
10
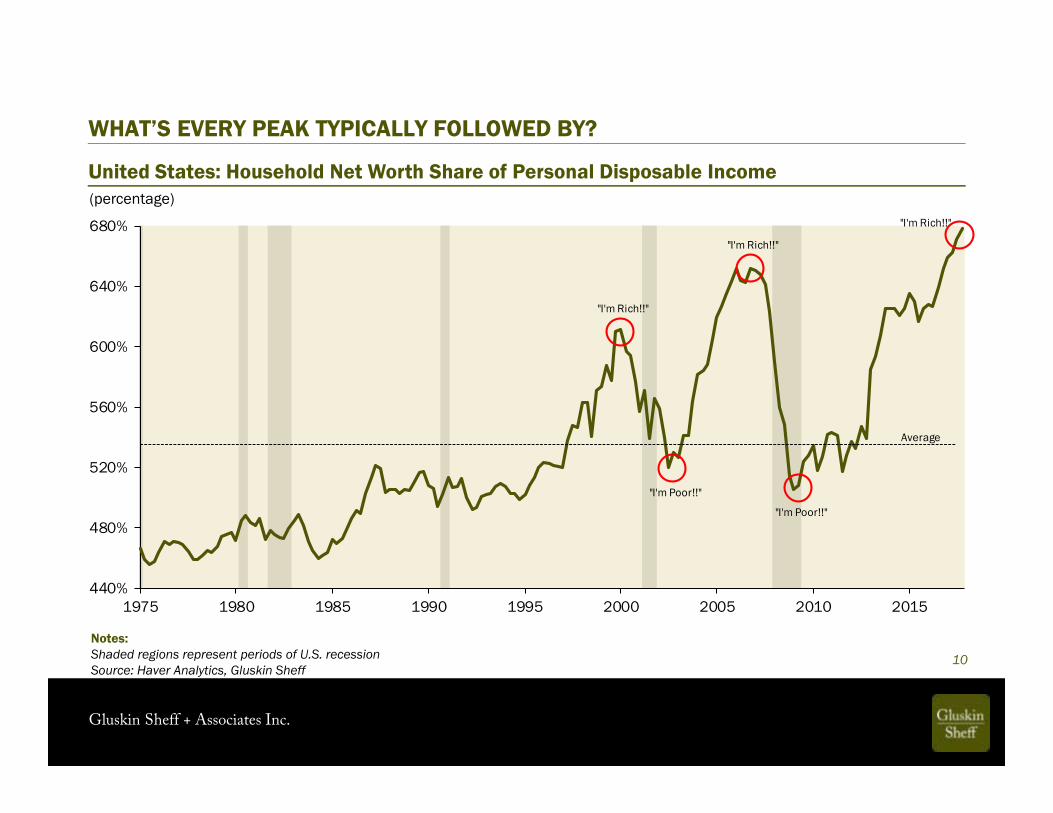
(percentage)
WHAT’S EVERY PEAK TYPICALLY FOLLOWED BY?
United States: Household Net Worth Share of Personal Disposable Income
440%
480%
520%
560%
600%
640%
680%
1975 1980 1985 1990 1995 2000 2005 2010 2015
"I'm Rich!!"
"I'm Rich!!"
"I'm Rich!!"
"I'm Poor!!"
"I'm Poor!!"
Average

Gluskin Sheff + Associates Inc.
11
“Current valuation ratios for households and businesses are high relative to historical benchmarks...we find that the current price-to-earnings ratio predicts approximately zero growth in real equity prices over the next ten years.”
“The net worth-to-income ratio — defined as household assets net of liabilities divided by personal disposable income — provides a valuation metric for a broad set of assets including debt, equity, and real estate weighted by the proportion in which they are being held by households. Similar to the P/E ratio, this ratio tends to revert toward its historical average and does not remain at extreme values, either high or low, for prolonged periods.”Notes:
Source: Valuation Ratios for Households and Businesses (January 8, 2018)
SOME WARNINGS FROM THE SAN FRAN FED

Gluskin Sheff + Associates Inc.
12
“Change of a long term or secular nature is usually gradual enough that it is obscured by the noise caused by short-term volatility. By the time secular trends are even acknowledged by the majority they are generally obvious and mature. In the early stages of a new secular paradigm, therefore, most are conditioned to hear only the short-term noise they have been conditioned to respond to by the prior existing secular condition. Moreover, in a shift of secular or long term significance, the markets will be adapting to a new set of rules while most market participants will be still playing by the old rules”
- Bob Farrell Aug. 3, 2001
A SECULAR INFLECTION POINT?
Notes:Source: Bob Farrell, Theme & Profile Investing Update, August 3, 2001
Gluskin Sheff + Associates Inc.
Notes:Source: Haver Analytics, Gluskin Sheff
13
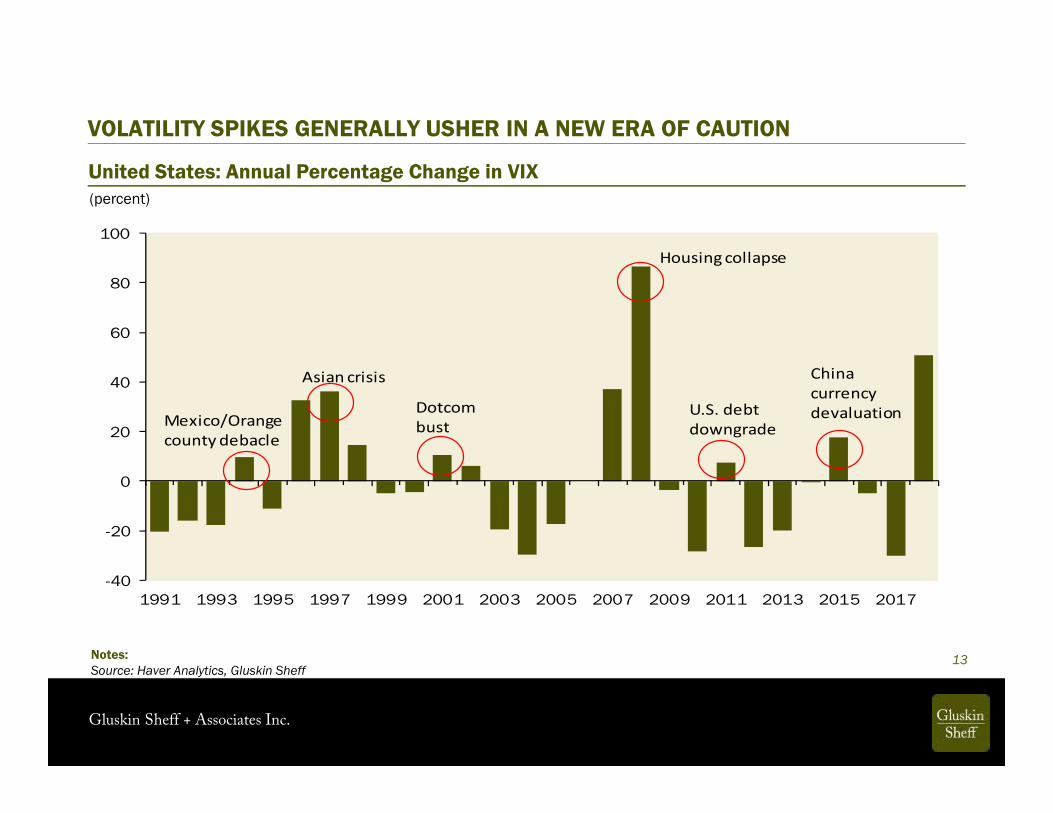
United States: Annual Percentage Change in VIX(percent)
VOLATILITY SPIKES GENERALLY USHER IN A NEW ERA OF CAUTION
-40
-20
0
20
40
60
80
100
1991 1993 1995 1997 1999 2001 2003 2005 2007 2009 2011 2013 2015 2017
Asian crisis
Housing collapse
China currency devaluationMexico/Orange
county debacle
U.S. debt downgrade
Dotcom bust

Gluskin Sheff + Associates Inc.
Notes:Source: Haver Analytics, Gluskin Sheff
14
United States: 2-year Treasury Note Yield(percent)
LOOK FAMILIAR?
0.5
1.0
1.5
2.0
2.5
Sep-15 Mar-16 Sep-16 Mar-17 Sep-17 Mar-18

Gluskin Sheff + Associates Inc.
Notes:Source: Haver Analytics, Gluskin Sheff
15
United States: G4 Central Bank Assets(year-over-year change; trillions of U.S. dollars)
LIQUIDITY TURNING FROM A TAILWIND TO A HEADWIND
-1.0
-0.5
0.0
0.5
1.0
1.5
2.0
2.5
3.0
2008 2009 2010 2011 2012 2013 2014 2015 2016 2017 2018 2019
BoE ECB BoJ Fed Total

Gluskin Sheff + Associates Inc.
16

Gluskin Sheff + Associates Inc.
Notes:Source: Wall Street Journal (January 25, 2018)
17
“What will the ultimate economic consequences be? Eventually the boost from reduced tax and regulations will peter out, and the drag from higher trade barriers and less immigration will show. Yet the most important determinant is monetary policy.”
Gluskin Sheff + Associates Inc.
Notes:Source: Haver Analytics, Gluskin Sheff
18
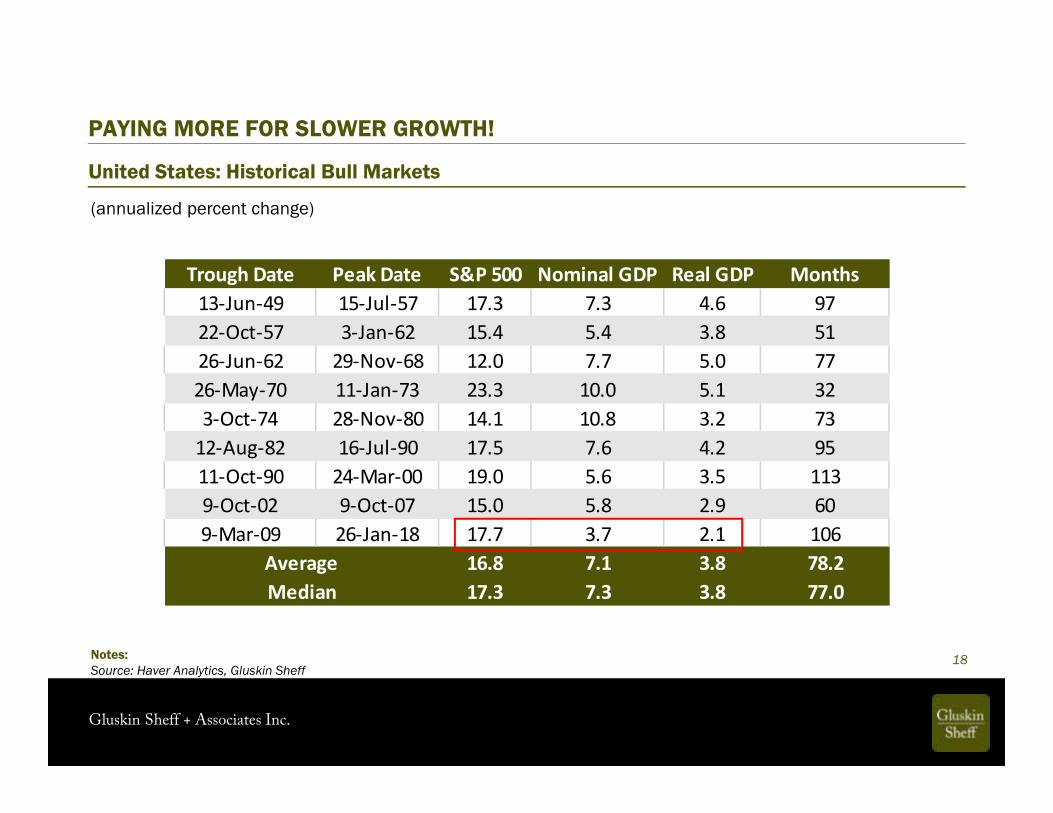
(annualized percent change)
PAYING MORE FOR SLOWER GROWTH!
United States: Historical Bull Markets
Trough Date Peak Date S&P 500 Nominal GDP Real GDP Months13-Jun-49 15-Jul-57 17.3 7.3 4.6 9722-Oct-57 3-Jan-62 15.4 5.4 3.8 5126-Jun-62 29-Nov-68 12.0 7.7 5.0 7726-May-70 11-Jan-73 23.3 10.0 5.1 323-Oct-74 28-Nov-80 14.1 10.8 3.2 73
12-Aug-82 16-Jul-90 17.5 7.6 4.2 9511-Oct-90 24-Mar-00 19.0 5.6 3.5 1139-Oct-02 9-Oct-07 15.0 5.8 2.9 609-Mar-09 26-Jan-18 17.7 3.7 2.1 106
16.8 7.1 3.8 78.217.3 7.3 3.8 77.0Median
Average
Gluskin Sheff + Associates Inc.
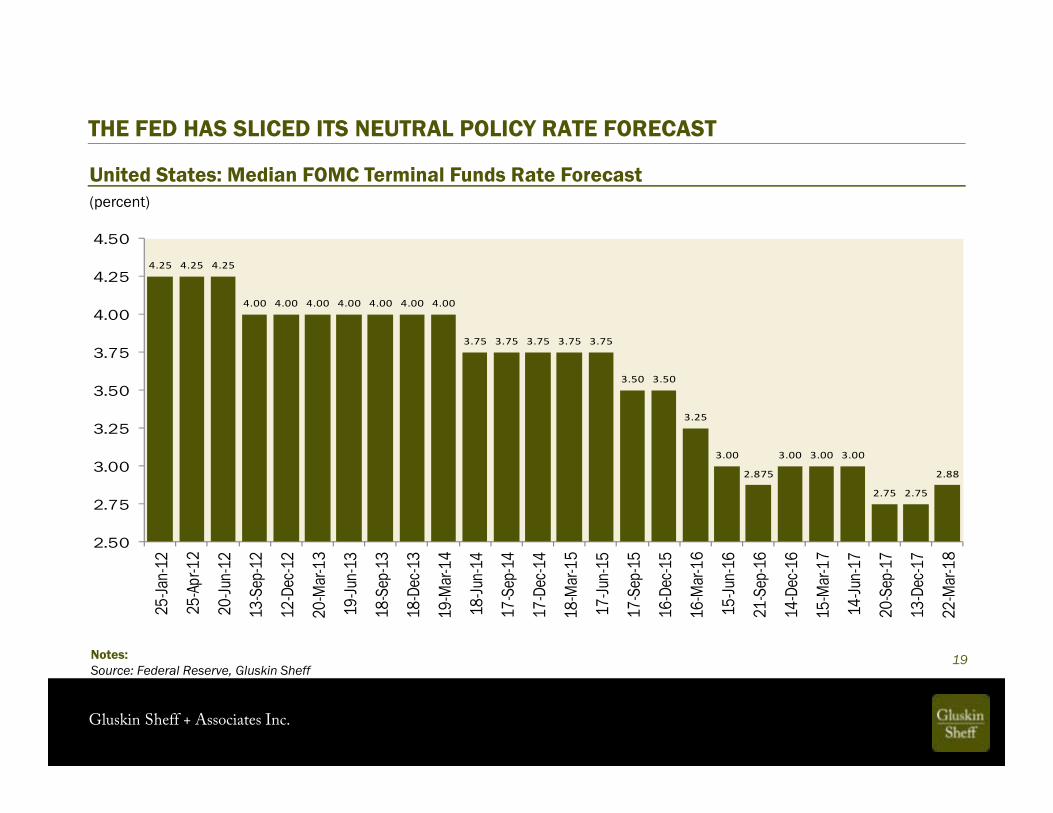
19Notes:Source: Federal Reserve, Gluskin Sheff
(percent)United States: Median FOMC Terminal Funds Rate Forecast
THE FED HAS SLICED ITS NEUTRAL POLICY RATE FORECAST
4.25 4.25 4.25
4.00 4.00 4.00 4.00 4.00 4.00 4.00
3.75 3.75 3.75 3.75 3.75
3.50 3.50
3.25
3.00
2.875
3.00 3.00 3.00
2.75 2.75
2.88
2.50
2.75
3.00
3.25
3.50
3.75
4.00
4.25
4.50
25-Ja
n-12
25-Ap
r-12
20-Ju
n-12
13-S
ep-1
2
12-D
ec-1
2
20-M
ar-1
3
19-Ju
n-13
18-S
ep-1
3
18-D
ec-1
3
19-M
ar-1
4
18-Ju
n-14
17-S
ep-1
4
17-D
ec-1
4
18-M
ar-1
5
17-Ju
n-15
17-S
ep-1
5
16-D
ec-1
5
16-M
ar-1
6
15-Ju
n-16
21-S
ep-1
6
14-D
ec-1
6
15-M
ar-1
7
14-Ju
n-17
20-S
ep-1
7
13-D
ec-1
7
22-M
ar-1
8

Gluskin Sheff + Associates Inc.
20Notes:Source: Federal Reserve, Gluskin Sheff
(percent)United States: FOMC Full Employment Forecast
FED HAS TAKEN DOWN ITS NAIRU ESTIMATE OVER TIME AS WELL
5.0
4.9 4.9
4.8 4.8 4.8 4.8
4.7
4.6 4.6 4.6
4.5
4.4
4.5
4.6
4.7
4.8
4.9
5.0
5.1
Jun-15 Sep-15 Dec-15 Mar-16 Jun-16 Sep-16 Dec-16 Mar-17 Jun-17 Sep-17 Dec-17 Mar-18

Gluskin Sheff + Associates Inc.
21Notes:Shaded regions represent periods of U.S. recessionSource: Haver Analytics, Gluskin Sheff
(percent)United States: Unemployment Rate
LITTLE (IF ANY) SLACK LEFT IN THE LABOR FORCE
2
3
4
5
6
7
8
9
10
1995 2000 2005 2010 2015
11 months below Fed's NAIRU
estimate

Gluskin Sheff + Associates Inc.
22Notes:Source: Meeting of the FOMC (July 2-3, 1996)
CHAIRMAN GREENSPAN. Price stability is that state in which expected changes in the general price level do not effectively alter business or household decisions.
MS. YELLEN. Could you please put a number on that?
CHAIRMAN GREENSPAN. I would say the number is zero, if inflation is properly measured.
-July 3rd, 1996
IS 2% CORE INFLATION REALLY PRICE STABILITY?

Gluskin Sheff + Associates Inc.
23Notes:Shaded regions represent periods of U.S. recessionSource: Haver Analytics, Gluskin Sheff
(percent)United States: Core PCE
AN EVER-ELUSIVE 2% TARGET
0.8
1.2
1.6
2.0
2.4
2.8
1995 2000 2005 2010 2015
We've been below the Fed's 2% target since April 2012

Gluskin Sheff + Associates Inc.
24
Notes:Real fed funds rate = nominal fed funds rate less core PCE inflationShaded regions represent periods where the output gap has closedSource: Haver Analytics, Gluskin Sheff
(percent)United States: Real Federal Funds Rate
NEGATIVE REAL FUNDS RATE AT FULL EMPLOYMENT??
-6
-4
-2
0
2
4
6
8
10
12
1960 1965 1970 1975 1980 1985 1990 1995 2000 2005 2010 2015

Gluskin Sheff + Associates Inc.
25Notes:Source: The Wall Street Journal (January 11, 2018)

Gluskin Sheff + Associates Inc.
26
…The Federal Reserve, as one writer put it, after the recent increase in the discount rate, is in the position of the chaperone who has ordered the punch bowl removed just when the party was really warming up…Nowadays, there is perhaps a tendency to exaggerate the effectiveness of monetary policy in both directions. Recently, opinion has been voiced that the country's main danger comes from a roseate belief that monetary policy, backed by flexible tax and debt management policies and aided by a host of built-in stabilizers, has completely conquered the problem of major economic fluctuations and relegated them to ancient history. This, of course, is not so because we are dealing with human beings and human nature.
— William McChesney Martin, October 19th, 1955
WHAT EVER HAPPENED TO TAKING THE PUNCH BOWL AWAY?
*Inflation was 0.4% the day of this speech; 2.2% a year later

Gluskin Sheff + Associates Inc.
27
“I still do not believe we are out of the woods on the market; I don’t think all of the yield spreads have gotten back to where they were. All objective measures of stock market levels suggest that, if anything, we are still above normal and that we are vulnerable to a significant decline. Consequently, even though under normal circumstances I would say that in this type of environment we probably should be in something of a tightening mode, if rates go up under these conditions I suspect the stock market would go down, and I’m fearful of the extent of that particular decline.”
— December 16, 1987
“What’s concerning me is that there is a vulnerability out there which is continuing to heal but is not healed yet. And I’m basically concerned, in a way which in fact Governor Seger raised, that if we were to indicate that we were tightening, the shock to the markets I think would break the stock market and create some real problems. ”
— February 10, 1988
THE START OF THE ‘GREENSPAN PUT’
Notes:Source: Meeting of the FOMC (December 15-16, 1987); Meeting of the FOMC (February 9-10, 1988)

Gluskin Sheff + Associates Inc.
28
“Stock prices rose and long-term interest rates fell when investors began to anticipate the most recent action. Easier financial conditions will promote economic growth. For example, lower mortgage rates will make housing more affordable and allow more homeowners to refinance. Lower corporate bond rates will encourage investment. And higher stock prices will boost consumer wealth and help increase confidence, which can also spur spending. Increased spending will lead to higher incomes and profits that, in a virtuous circle, will further support economic expansion.”
— November 4, 2010
FOLLOWED BY THE ‘BERNANKE PUT’ (WHAT HE SAID THE DAY AFTER QE2)
Notes:Source: What the Fed did and why: supporting the recovery and sustaining price stability; Washington Post (November 4, 2010)

Gluskin Sheff + Associates Inc.
29
“…We also face the serious risk that inflation, which we currently forecast to run below our target, could decline further over time, raising real interest rates and thereby making it yet more difficult for monetary policy to provide meaningful stimulus. Under such circumstances, there is an important benefit from conveying that we do not intend to take the punch bowl away just as the party is getting going. Frankly, I worried at the time of our September meeting that our open-ended purchase program would be interpreted by markets as tepid support for accommodation. Instead, just the opposite occurred. By linking our purchases to significant improvements in the outlook for the labor market, and coupling this commitment with the statement that we intend to keep rates low as the economic recovery strengthens, we communicated that we will at least keep refilling the punch bowl until the guests have all arrived, and will not remove it prematurely before the party is well under way…”
— December 12, 2012
THE ‘YELLEN PUT’ HAD AN EVEN HIGHER STRIKE PRICE!
Notes:Source: Meeting of the FOMC (December 11-12, 2012)

Gluskin Sheff + Associates Inc.
30Notes:Source: FOMC Press Conference (December 13, 2017)
“I think when we look at other indicators of financial stability risks, there is nothing flashing red there or possibly even orange.”
-December 13th, 2017
JANET DIDN’T EVEN SEE ORANGE AS THE MARKET WAS SOARING TO THE HIGHS
Dec. 2017 20-year Avg.Trailing P/E 22.2x 19.5x
Forward P/E 18.3x 16.3x
High Yield Spreads 364 basis points 582 bps

Gluskin Sheff + Associates Inc.
31
The Economics of the Fed PutAnna Cieslak (Duke University) and Annette Vissing-Jorgensen (University of California Berkeley)
In summary, the Fed pays attention directly to the stock market rather than merely to variables correlated with the stock market.... these facts are consistent with the view that the stock market is a causal factor influencing Fed policy making.
Our textual analysis suggests that the Fed’s focus on the stock market is driven a lot by its concern about the effect of stock market declines have on consumption, with a relatively smaller weight put on other GDP components.
Discussions of stock market conditions by the FOMC attendees are most frequently cast in the context of consumption, with the consumption-wealth effect highlighted as one of the main channels through which the stock market affects the economy.
This result confirms the Fed thinking causally about the stock market as a driver of the economy and the Fed updating its expectations of future economic conditions accordingly. At a time when it has come under criticism for focusing too much on asset prices it would be useful for the Fed to lay out whether it believes the stock market should have an independent impact onthe target beyond its effects on Fed growth and inflation expectations.
THE FED’S REACTION TO THE STOCK MARKET
Notes:Source: The Economics of the Fed Put (December, 2016)
Gluskin Sheff + Associates Inc.
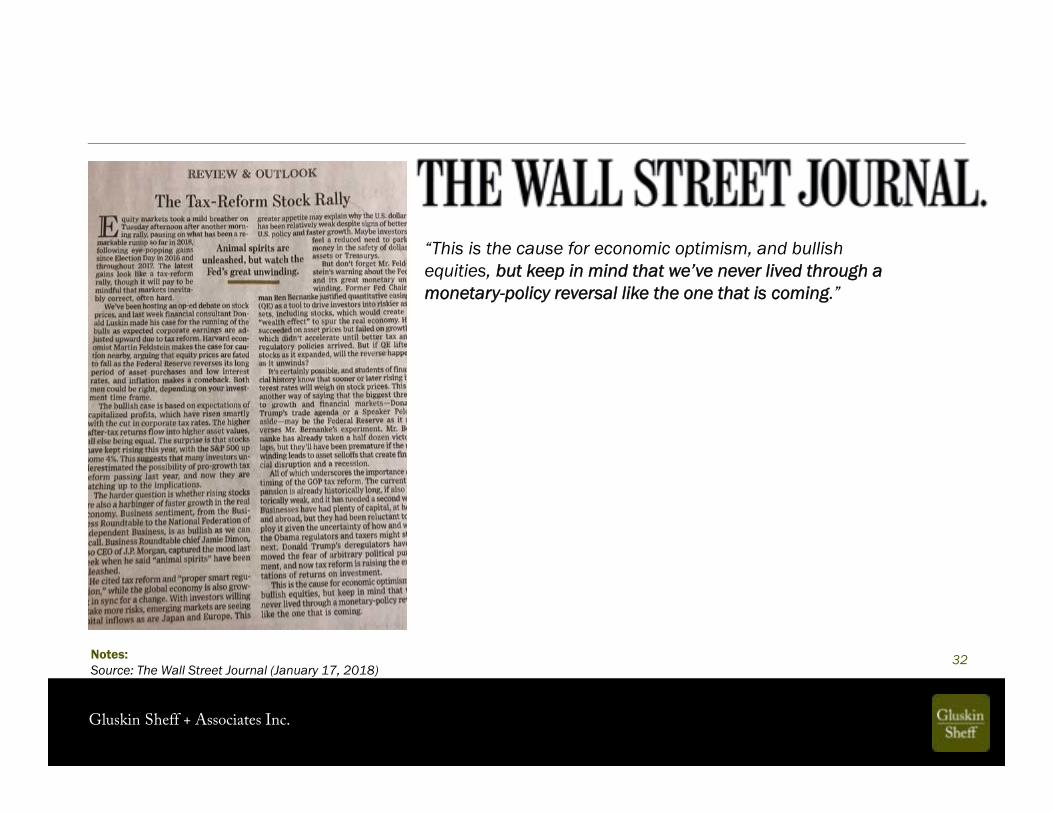
32Notes:Source: The Wall Street Journal (January 17, 2018)
“This is the cause for economic optimism, and bullish equities, but keep in mind that we’ve never lived through a monetary-policy reversal like the one that is coming.”

Gluskin Sheff + Associates Inc.
33Notes:Source: Meeting of the FOMC (October 23-24, 2012), Speech at the C. Peter McColough Series (April 8, 2015)
“I think we are actually at a point of encouraging risk-taking, and that should give us pause. Investors really do understand now that we will be there to prevent serious losses. It is not that it is easy for them to make money but that they have every incentive to take more risk, and they are doing so. Meanwhile, we look like we are blowing a fixed-income duration bubble right across the credit spectrum that will result in big losses when rates come up down the road. You can almost say that that is our strategy.”
-October 24, 2012
“Overly accommodative monetary policy also poses risks. First, the economy could overheat, and rising inflation could require the Committee to raise rates faster, which--if overdone--could produce a damaging recession. For now, I would be more concerned with a second risk, which is that more-accommodative policy could lead to frothy financial conditions and eventually undermine financial stability. While I do not see a troubling buildup of these risks today, tighter monetary policy might eventually be necessary if such risks do appear.”
-April 8, 2015
POWELL CAUTIOUS ON RISK-TAKING
Oct. 2012 Apr. 2015 Today
Trailing P/E 14.5x 18.8x 21.9x
Forward P/E 12.7x 16.9x 16.9x
High Yield Spreads 554 bps 459 bps 366 bps

Gluskin Sheff + Associates Inc.
Notes:Source: Wall Street Journal (January 24, 2018)
34
“We’ve been patient in removing accommodation, and I think that patience has served us well, Mr. Powell said at his confirmation hearing Nov. 28, after being nominated by President Donald Trump on Nov. 2. Now that growth has picked up, “it’s time for us to be normalizing interest rates” he added”

Gluskin Sheff + Associates Inc.
35

Gluskin Sheff + Associates Inc.
FED TIGHTENING CYCLES AND FINANCIAL EVENTS
36Notes:Shaded regions represent periods of U.S. recessionSource: Haver Analytics, Gluskin Sheff
(percent)
United States: Federal Funds Rate
-2
0
2
4
6
8
10
12
14
16
18
20
1965 1968 1971 1974 1977 1980 1983 1986 1989 1992 1995 1998 2001 2004 2007 2010 2013 2016
First Penn/Latam Debt Crisis
Asian Crisis/Russian Default & LTCM
U.S. Housing and Credit Collapse
Orange County/Mexican Crisis
Penn Central
Continental Illinois Bankruptcy
Franklin National
Savings & Loan DebacleLincoln Savings
Tech Wreck

Gluskin Sheff + Associates Inc.
Notes:Source: Financial Times (March 9, 2018)
37

Gluskin Sheff + Associates Inc.
Notes:Source: Financial Times (March 1, 2018)
38
LATE-CYCLE EROSION IN CREDIT QUALITY

Gluskin Sheff + Associates Inc.
Notes:Shaded regions represent periods of U.S. recessionSource: Haver Analytics, Gluskin Sheff
Credit Cards: Net Charge-off Rate
39
Auto Loans: 90+ Days Delinquent Rate(percent) (percent)
CONSUMER CREDIT QUALITY CONCERNS SURFACING
United States
2
4
6
8
10
12
14
2000 2002 2004 2006 2008 2010 2012 2014 20161.5
2.0
2.5
3.0
3.5
4.0
4.5
5.0
5.5
2000 2002 2004 2006 2008 2010 2012 2014 2016

Gluskin Sheff + Associates Inc.
Notes:Source: Barron’s (March 5, 2018)
40
I’d keep an eye on credit-card debt. Subprime auto has been a problem for a couple years, and valuations on loans used to finance leveraged buyouts are high. Any type of secured lending backed by an asset that is overvalued should be a concern. That is what happened with housing. Corporate debt also has not gotten as much attention as it should. It is market-funded, rather than bank-funded, but the banks still have exposure. Then there’s cyber-risk. It took us so long to get around to the reforms postcrisis that we got a little behind on systemic cyber-risk, but regulators are very focused on it now.
BAIR-ISH!

Gluskin Sheff + Associates Inc.
Notes:Shaded regions represent periods of U.S. recessionSource: Haver Analytics, Gluskin Sheff
41
United States: Corporate Debt-to-GDP(percent)
CORPORATE BALANCE SHEETS ARE NOT IN GOOD SHAPE!
37
38
39
40
41
42
43
44
45
46
1986 1988 1990 1992 1994 1996 1998 2000 2002 2004 2006 2008 2010 2012 2014 2016
credit cycle peakcredit cycle peak credit cycle peak
credit cycle peak
Gluskin Sheff + Associates Inc.
Notes:Source: Bloomberg, Gluskin Sheff
42
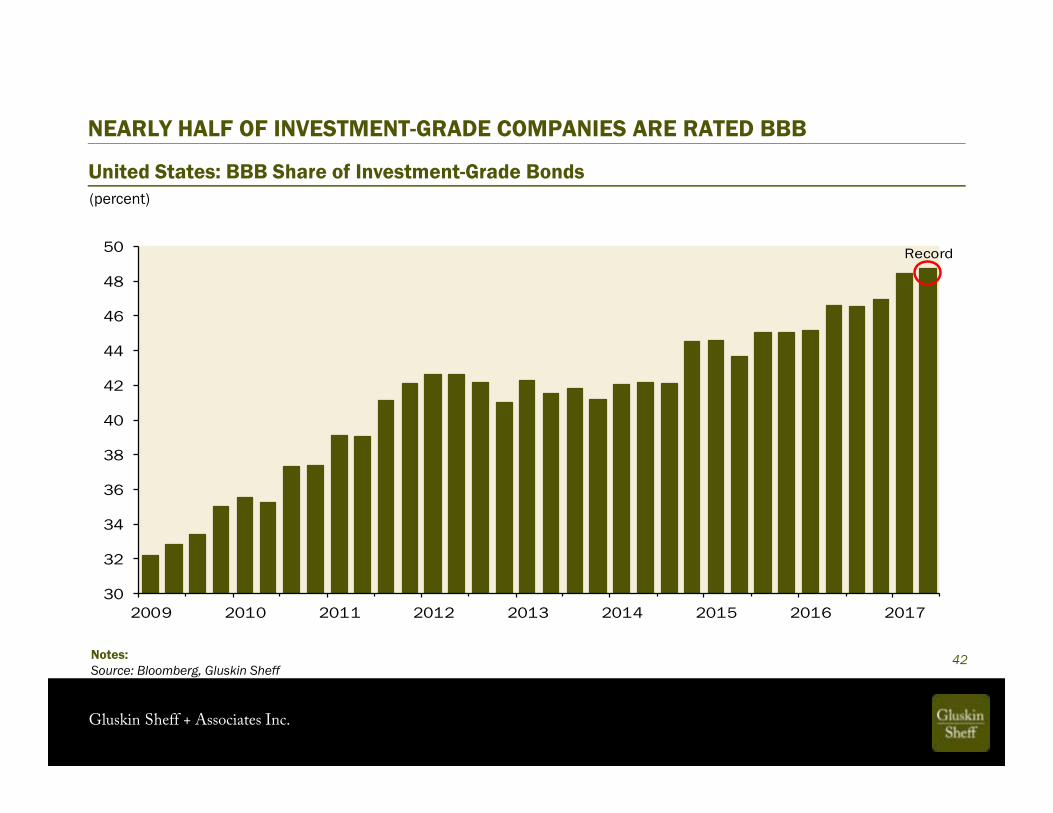
United States: BBB Share of Investment-Grade Bonds(percent)
NEARLY HALF OF INVESTMENT-GRADE COMPANIES ARE RATED BBB
30
32
34
36
38
40
42
44
46
48
50
2009 2010 2011 2012 2013 2014 2015 2016 2017
Record

Gluskin Sheff + Associates Inc.
Notes:Source: BofA Merrill Lynch Global Research, Gluskin Sheff
43
United States: High Yield and Leveraged Loan Maturity Profile($ billions)
1432
154
221
302
61
152042
166 168149
171
73
0
50
100
150
200
250
300
350
2018 2019 2020 2021 2022 2023 2024
BondsLoans
A LARGE AMOUNT OF HIGH YIELD DEBT IS COMING DUE

Gluskin Sheff + Associates Inc.
Notes:Source: BofA Merrill Lynch, Gluskin Sheff
44
United States: Investment Grade Maturity Profile($ billions)
359
488
647613 627
431
369
0
100
200
300
400
500
600
700
2018 2019 2020 2021 2022 2023 2024
MATURING INVESTMENT GRADE BONDS SET TO DOUBLE IN NEXT 2 – 3 YEARS
Gluskin Sheff + Associates Inc.
45
Gluskin Sheff + Associates Inc.
46
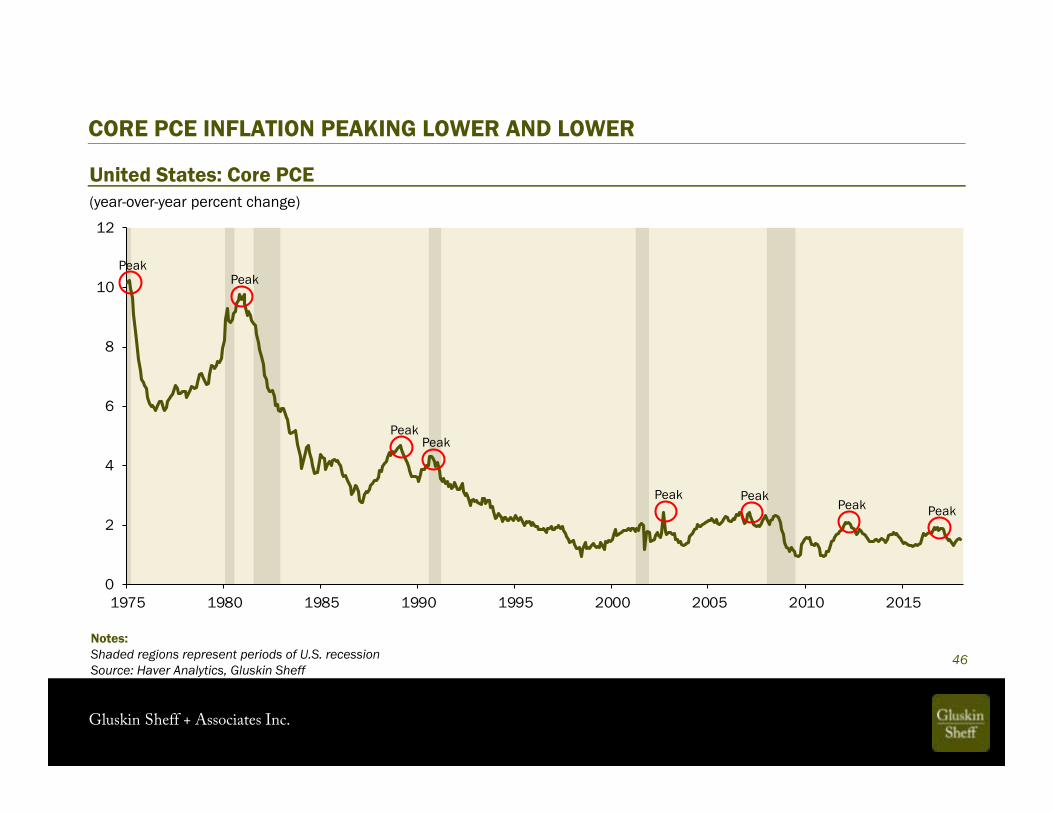
(year-over-year percent change)United States: Core PCE
CORE PCE INFLATION PEAKING LOWER AND LOWER
0
2
4
6
8
10
12
1975 1980 1985 1990 1995 2000 2005 2010 2015
PeakPeak
PeakPeak
PeakPeak Peak
Peak
Notes:Shaded regions represent periods of U.S. recessionSource: Haver Analytics, Gluskin Sheff

Gluskin Sheff + Associates Inc.
Notes:Source: Haver Analytics, Gluskin Sheff
47
2005 - 2006(year-over-year percent change)
1999 - 2000(year-over-year percent change)
SECULAR DISINFLATION, PUNCTUATED BY CYCLICAL INFLATION
United States: Core PCE
1.1
1.2
1.3
1.4
1.5
1.6
1.7
1.8
1.9
Jan-99 Jul-99 Jan-00 Jul-002.0
2.1
2.2
2.3
2.4
2.5
May-05 Oct-05 Mar-06 Aug-06
1986 - 1988(year-over-year percent change)
2.5
3.0
3.5
4.0
4.5
5.0
Nov-86 May-87 Nov-87 May-88 Nov-88

Gluskin Sheff + Associates Inc.
48

Gluskin Sheff + Associates Inc.
49
BOND BULL MARKET OVER…HAVEN’T WE HEARD THAT BEFORE?
2011• Gross was right: The bond bubble will burst — Marketwatch
2012
• The End of the 30-year Bond Bull Market? — University of Pennsylvania, Wharton
2013• Bill Gross: Bull Market in Bonds Over — Wall Street Journal
2014
• This is the ‘Doomsday’ Bond Market Scenario — CNBC
2015
• How to Avoid the Coming 25 Year Bond Bear Market — Forbes
2018
• The Bear Market in Bonds is Just Getting Started — Bloomberg

Gluskin Sheff + Associates Inc.
Notes:Shaded regions represent periods of U.S. recessionSource: Haver Analytics, Gluskin Sheff
50
WE HAVEN’T BROKEN OUT OF THE DOWNTREND JUST YET
United States: 10-year Treasury Note Yield(percent)
0
2
4
6
8
10
12
14
16
18
1980 1985 1990 1995 2000 2005 2010 2015
Peak
Peak
Peak
Peak
Trough
Trough
Trough
Trough
Trough
Peak
Peak
Trough
Trough
Trough
Peak
10-year Yields ( %)
Cyc les Trough Peak
Aug. 1980 - Jul. 1981 11.55 14.67Feb. 1983 - May 1984 10.27 13.91Aug. 1986 - Sept. 1987 6.95 9.63Sept. 1993 - Nov. 1994 5.43 7.91Sept. 1998 - Jan. 2000 4.44 6.68May 2003 - Jun. 2006 3.37 5.15Dec. 2008 - Dec. 2009 2.25 3.85Jul. 2016 - Feb. 2018 1.36 2.95

Gluskin Sheff + Associates Inc.
Notes:Source: Haver Analytics, Gluskin Sheff
51
2004 - 2006(percent)
1998 - 2000(percent)
BOND MARKET CORRECTIONS OCCUR DESPITE SECULAR DEMAND
United States: 10-Year Treasury Note Yield1993 - 1994(percent)
5.3
5.6
5.9
6.2
6.5
6.8
7.1
7.4
7.7
8.0
Jun-93 Dec-93 Jun-94 Dec-944.4
4.7
5.0
5.3
5.6
5.9
6.2
6.5
6.8
Aug-98 Feb-99 Aug-99 Feb-003.8
4.0
4.2
4.4
4.6
4.8
5.0
5.2
Jul-04 Jan-05 Jul-05 Jan-06 Jul-06
• Bond market corrections occur; can last up to 2 years and see 10-year note yields rise 200 bps

Gluskin Sheff + Associates Inc.
52

Gluskin Sheff + Associates Inc.
(months)
53
Month of Economic Cycle Peak
Notes:Source: National Bureau of Economic Research, Gluskin Sheff
THE U.S. CYCLE IS VERY LATE
United States: Duration of Economic Expansions
0
20
40
60
80
100
120
140
Jun-
1857
Oct-1
860
Apr-1
865
Jun-
1869
Oct-1
873
Mar
-188
2M
ar-1
887
Jul-1
890
Jan-
1893
Dec-1
895
Jun-
1899
Sep-
1902
May
-190
7Ja
n-19
10Ja
n-19
13Au
g-19
18Ja
n-19
20M
ay-1
923
Oct-1
926
Aug-
1929
May
-193
7Fe
b-19
45No
v-194
8Ju
l-195
3Au
g-19
57Ap
r-196
0De
c-196
9No
v-197
3Ja
n-19
80Ju
l-198
1Ju
l-199
0M
ar-2
001
Dec-2
007
Curre
nt
Third longest!
Average
Gluskin Sheff + Associates Inc.
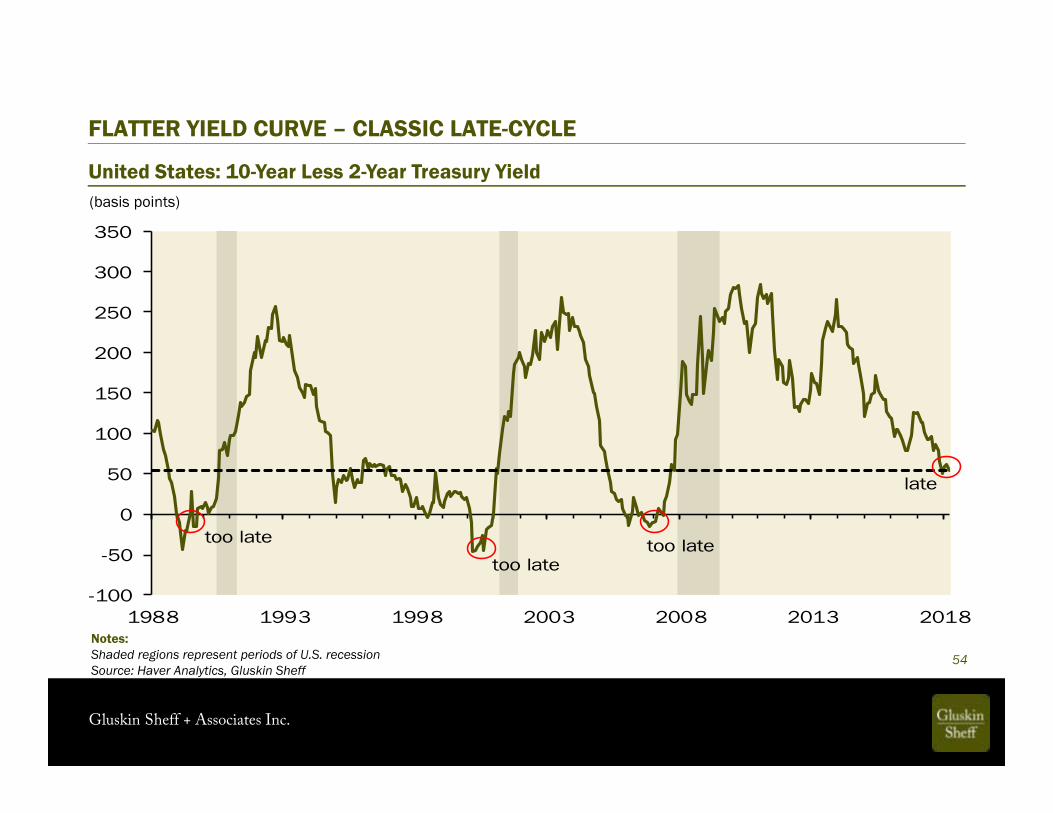
United States: 10-Year Less 2-Year Treasury Yield(basis points)
54Notes:Shaded regions represent periods of U.S. recessionSource: Haver Analytics, Gluskin Sheff
FLATTER YIELD CURVE – CLASSIC LATE-CYCLE
-100
-50
0
50
100
150
200
250
300
350
1988 1993 1998 2003 2008 2013 2018
too latetoo latetoo late
late

Gluskin Sheff + Associates Inc.
55Notes:Source: Haver Analytics, Gluskin Sheff
Variable
Average chan ge in expans ion s ( s tart to
peak/t rough) This cyc lePercen t of average
recovered this cyc le
Core CPI (bps) 82.0 60.0 73.2%
CRB Commodity Index (%) 37.0% 48.0% 100.0%
2s/10s Yield Curve (bps) -183.0 -164.0 89.6%
Industry Capacity Utilization Rate (ppts) 9.0 12.5 100.0%
Unemployment Rate (ppts) -2.9 -5.2 100.0%
Real GDP (ppts) 8.9 7.4 83.1%
Profit Margins (ppts) 3.9 5.6 100.0%
ISM Manufacturing (pts) 25.0 14.2 56.8%
Auto Sales (%) 56.0% 84.0% 100.0%
Housing Starts (%) 63.5% 127.0% 100.0%
Cyclical GDP Share (ppts) 3.2 3.7 100.0%
Trailing P/E Multiple (pts) 7.8 9.3 100.0%
High Yield Spread (bps) -662.7 -785.1 100.0%
Employment-to-Population Ratio (ppts) 2.5 0.8 32.3%
Consumer Confidence (pts) 43.9 75.6 100.0%
Average 89.0%
Median 100.0%
14 OF 15 VARIABLES SUGGEST WE ARE PAST THE SEVENTH-INNING STRETCH
Gluskin Sheff + Associates Inc.
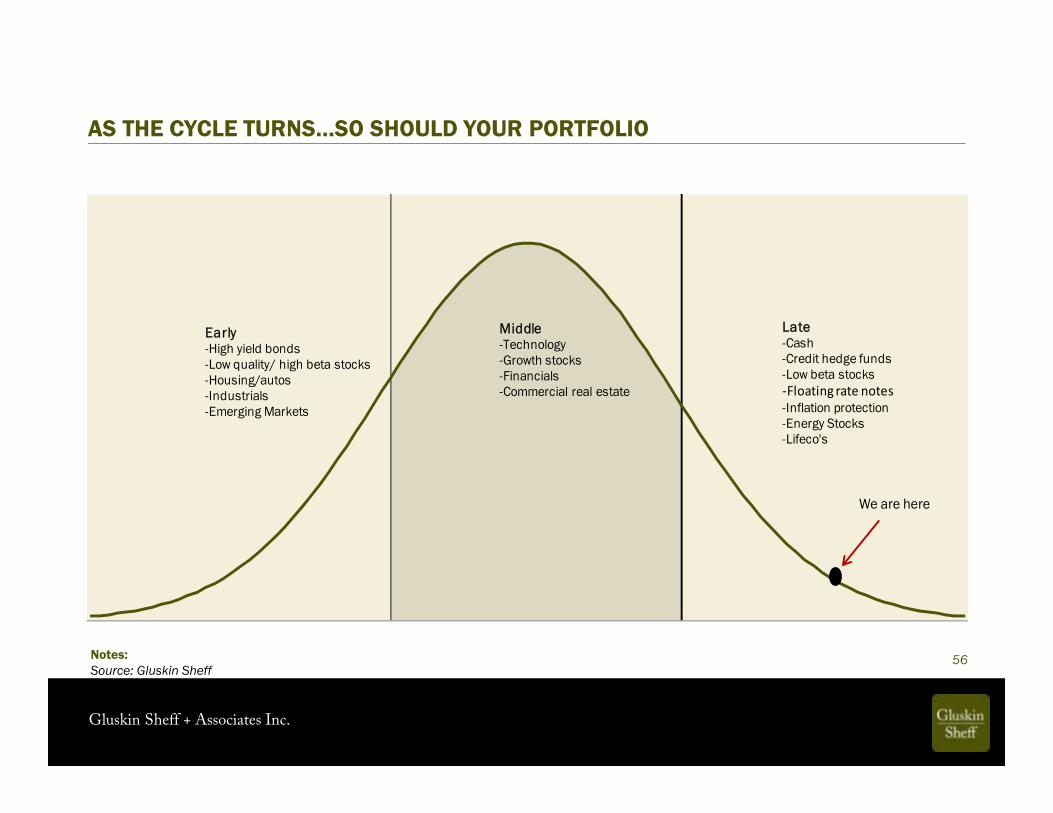
AS THE CYCLE TURNS…SO SHOULD YOUR PORTFOLIO
56
We are here
Early-High yield bonds-Low quality/ high beta stocks-Housing/autos-Industrials-Emerging Markets
Middle-Technology-Growth stocks-Financials-Commercial real estate
Late-Cash-Credit hedge funds-Low beta stocks-Floating rate notes-Inflation protection-Energy Stocks-Lifeco's
Notes:Source: Gluskin Sheff

Gluskin Sheff + Associates Inc.
57
THERE HAVE BEEN 13 FED HIKING CYCLES, 10 LANDED IN RECESSION!First Hike Last Hike ResultOctober 1950 May 1953 Recession
October 1955 August 1957 Recession
September 1958 September 1959 Recession
December 1965 September 1966 Soft Landing
November 1967 June 1969 Recession
April 1972 September 1973 Recession
May 1977 March 1980 Recession
August 1980 December 1980 Recession
March 1983 August 1984 Soft Landing
January 1987 May 1989 Recession
February 1994 February 1995 Soft Landing
June 1999 May 2000 Recession
June 2004 June 2006 Recession
December 2015 ??? ???

Gluskin Sheff + Associates Inc.
Notes:Note: data represents four quarter average of subsequent QoQ (annualized) GDP growthSource: Haver Analytics, Gluskin Sheff 58
United States
THE FED DOESN’T SEE RECESSIONS WHEN IT IS STARING THEM IN THE FACE
Recession Start
Forecast Growth Coming
Year (%)What Actually Happened (%) Delta (%)
Dec-69 1.2 -0.1 -1.3Nov-73 2.4 -1.9 -4.3Jul-81 0.9 -2.6 -3.5Jul-90 2.0 0.0 -2.0
Mar-01 2.6 1.4 -1.2Dec-07 1.3 -2.7 -4.0
Average 1.7 -1.0 -2.7
Gluskin Sheff + Associates Inc.
Notes:Source: Haver Analytics, Gluskin Sheff
59
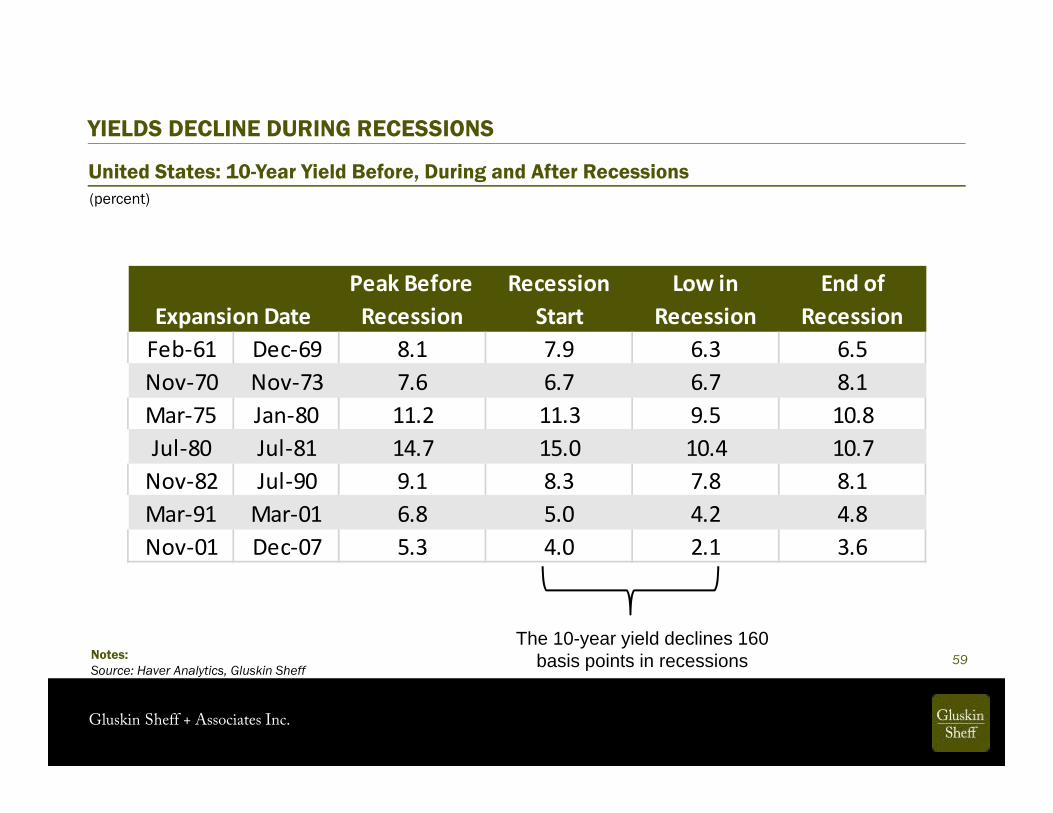
United States: 10-Year Yield Before, During and After Recessions(percent)
YIELDS DECLINE DURING RECESSIONS
Peak Before Recession
Recession Start
Low in Recession
End of Recession
Feb-61 Dec-69 8.1 7.9 6.3 6.5Nov-70 Nov-73 7.6 6.7 6.7 8.1Mar-75 Jan-80 11.2 11.3 9.5 10.8Jul-80 Jul-81 14.7 15.0 10.4 10.7
Nov-82 Jul-90 9.1 8.3 7.8 8.1Mar-91 Mar-01 6.8 5.0 4.2 4.8Nov-01 Dec-07 5.3 4.0 2.1 3.6
Expansion Date
The 10-year yield declines 160 basis points in recessions

Gluskin Sheff + Associates Inc.
Notes:Source: Haver Analytics, Gluskin Sheff
60
United States: S&P 500
WHAT ‘IF’ WE GET A RECESSION?
Months % Decline Months % Decline Months % Decline Oct-49 Jul-53 6 -7.2 2 -8.2 8 -14.8
May-54 Aug-57 12 -9.1 2 -13.8 14 -21.6Apr-58 Apr-60 8 -10.4 6 -3.8 14 -13.9Feb-61 Dec-69 13 -15.1 5 -24.7 18 -36.1Nov-70 Nov-73 10 -20.2 11 -35.1 21 -48.2Mar-75 Jan-80 0 -0.9 2 -14.0 2 -14.7
Jul-80 Jul-81 8 -6.8 13 -21.8 21 -27.1Nov-82 Jul-90 0 -3.5 3 -17.0 3 -19.9Mar-91 Mar-01 12 -24.0 6 -16.8 18 -36.8Nov-01 Dec-07 2 -6.2 15 -53.9 17 -56.8
7.1 -10.3 6.5 -20.9 13.6 -29.0
Peak to Recession Start Peak to Recession Trough
Average
Expansion Date
Recession Start to Recession Trough

Gluskin Sheff + Associates Inc.
61

Gluskin Sheff + Associates Inc.
62
THE FED WILL HAVE VERY LITTLE LEEWAY IN THE NEXT DOWNTURN
Notes:Source: Haver Analytics, Gluskin Sheff
Start End Start Level End Level DeltaOct-57 May-58 3.50 0.57 -2.93May-60 Jul-61 3.83 1.18 -2.65Nov-66 Jul-67 5.74 3.79 -1.95Feb-70 Feb-71 8.95 6.03 -2.92Sep-71 Feb-72 5.53 3.30 -2.23Jul-74 May-75 12.91 5.22 -7.69Apr-80 Jul-80 17.43 9.01 -8.42Jul-81 Dec-81 19.10 12.44 -6.66Aug-84 Dec-84 11.50 8.13 -3.38May-89 Sep-92 9.81 3.00 -6.81Dec-00 Jun-03 6.50 1.00 -5.50Aug-07 Dec-08 5.25 0.13 -5.13
Average 9.17 4.48 -4.69Median 7.73 3.55 -4.25
Federal Funds Rate (%)

Gluskin Sheff + Associates Inc.
63
FISCAL POLICY WILL BE SERIOUSLY CONSTRAINED IN FIGHTING NEXT RECESSION
Notes:Source: Haver Analytics, Gluskin Sheff
Cycle PeakDeficit-to-GDP
(%)Year Following
RecessionDeficit-to-GDP
(%) Delta (%)1948 4.5 1950 -1.1 -5.61953 -1.7 1955 -0.7 1.01957 0.7 1959 -2.5 -3.21960 0.1 1962 -1.2 -1.31969 0.3 1971 -2.1 -2.41973 -1.1 1976 -4.1 -3.01980 -2.6 1983 -5.9 -3.31990 -3.7 1992 -4.5 -0.82001 1.2 2002 -1.5 -2.72007 -1.1 2010 -8.7 -7.6
Average -0.3 -3.2 -2.9Median -0.5 -2.3 -2.9

Gluskin Sheff + Associates Inc.
Notes:Source: BIS, Haver Analytics, Gluskin Sheff
Total Debt
64
Total Debt-to-GDP(U.S. Dollar Trillions) (ratio)
WHERE WAS THE DELEVERAGING?
United States
5
10
15
20
25
30
35
40
45
50
1980 1985 1990 1995 2000 2005 2010 2015120
140
160
180
200
220
240
260
1980 1985 1990 1995 2000 2005 2010 2015

Gluskin Sheff + Associates Inc.
65Notes:Source: Ben Bernanke, Deflation: Making Sure “It” Doesn’t Happen Here (November 21, 2002)
THE END GAME IS THE DEBT JUBILEE

Gluskin Sheff + Associates Inc.
DISCLAIMER
The information, opinions, and other materials contained in this presentation is the property of Gluskin Sheff + Associates Inc. and may not be reproduced in any way, in whole or in part, without express authorization of the copyright holder in writing. The statements and statistics contained herein have been prepared by Gluskin Sheff + Associates Inc. based on information from sources considered to be reliable. We make no representation or warranty, express or implied, as to its accuracy or completeness. This publication is for the information of investors and business persons and does not constitute an offer to sell or a solicitation to buy securities.
66