Globefish Commodity Update Shrimp 2010
78
Shrimp Extract from GLOBEFISH Databank Prices - Exports - Imports - Catches - Consumptio n February 2010 COMMODITY UPDATE Food and Agriculture Organization of the United Nations Fisheries and Aquaculture Policy and Economics Division Viale delle Terme di Caracalla 00153 Rome, Italy Tel.: +39 06 5705 5074 Fax: +39 06 5705 5188 www.globefish.org
-
Upload
nguyenvi47 -
Category
Documents
-
view
50 -
download
0
Transcript of Globefish Commodity Update Shrimp 2010
5/13/2018 Globefish Commodity Update Shrimp 2010 - slidepdf.com
http://slidepdf.com/reader/full/globefish-commodity-update-shrimp-2010 1/78
ShrimpExtract from GLOBEFISH Databank
Prices - Exports - Imports - Catches - Consumption
February 2010
COMMODITY
UPDATE
Food and Agriculture Organization of the United Nations
Fisheries and Aquaculture Policy and Economics Division
Viale delle Terme di Caracalla
00153 Rome, Italy
Tel.: +39 06 5705 5074
Fax: +39 06 5705 5188
www.globefish.org

5/13/2018 Globefish Commodity Update Shrimp 2010 - slidepdf.com
http://slidepdf.com/reader/full/globefish-commodity-update-shrimp-2010 2/78
Shrimp
COMMODITY
update
The COMMODITY UPDATE reports, issued for each commodity once a year, contain
information on prices, imports, exports and production by commodity. The information is taken
form the network of GLOBEFISH correspondents and the GLOBEFISH European Price Report,INFOFISH Trade News, FAO FISHDAB, EUROSTAT and others.
The issues are scheduled approximately as follows:
FISHMEAL - FISH OIL –Spring CRAB - Autumn
BIVALVES - Spring LOBSTER - Autumn
SALMON - Spring CEPHALOPODS - Winter
FRESHWATER FISH - Spring GROUNDFISH - Winter
SHRIMP - Summer SMALL PELAGICS - Winter
TUNA - Summer
For single issues For an annual subscription to
please contact the complete set please contact
GLOBEFISH EUROFISH
Vial .e delle Terme di Caracalla . H.C. Andersens Blvd. 44-46
00153 Rome . 1553 Copenhagen V
ITALY Denmark
Tel: ++39 0657056313 . Tel.: ++45 33377755
Fax: ++39 0657055188 . Fax: ++45 33377756
E - mail: globefish - [email protected] . E - mail: [email protected]
Web si.te: www.gl.obefi .sh.org . Web site: www. eurofish.dk
Prepared by Paola Sabatini, Helga Josupeit, Karine Boisset
All ri g hts reserved. No part of FAO/GLOBEFISH COMMODITY UPDATE may be reproduced, stored in a retrieval system, or
transmitted in any form or by any means (electronic, mechanical, photocopying or otherwise), without the prior permission of FAO.
Requests for use of this material (including purpose and extent) should be addressed to the Director, Publications Division, Food
and Agriculture Organization of the United Nations, Viale delle Terme di Caracalla, 00153 Rome, Italy.
Layout: Turan Rahimzadeh.

5/13/2018 Globefish Commodity Update Shrimp 2010 - slidepdf.com
http://slidepdf.com/reader/full/globefish-commodity-update-shrimp-2010 3/78

5/13/2018 Globefish Commodity Update Shrimp 2010 - slidepdf.com
http://slidepdf.com/reader/full/globefish-commodity-update-shrimp-2010 4/78
Table of Contents
MARKET REPORTS
Shrimp Market Report, Europe - February 2010 1
Shrimp Market Report, Japan - February 2010 4
Shrimp Market Report, US - January 2010 7
SHRIMP PRICES
Black tiger shrimp wholesale prices, Japan, origin Indonesia, in USD/kg 9
Headless white shrimp prices, selected counts, 4 lb block, wholesaler to chain retailer,
monthly price in Japan, origin Indonesia, in USD/block 11
Headless, white shrimp, selected counts, wholesale and monthly price, Japan,
origin India, in USD/kg 14
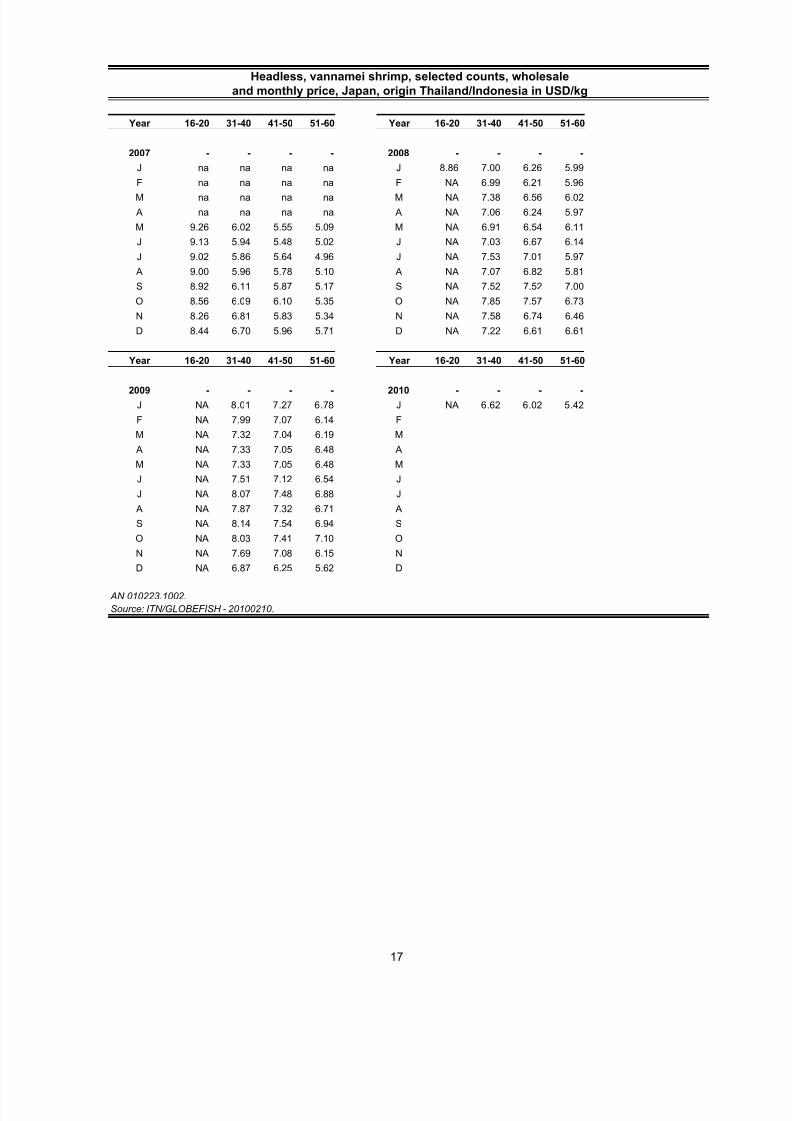
Headless, vannamei shrimp, selected counts, wholesale
and monthly price, Japan, origin Thailand/Indonesia in USD/kg 17
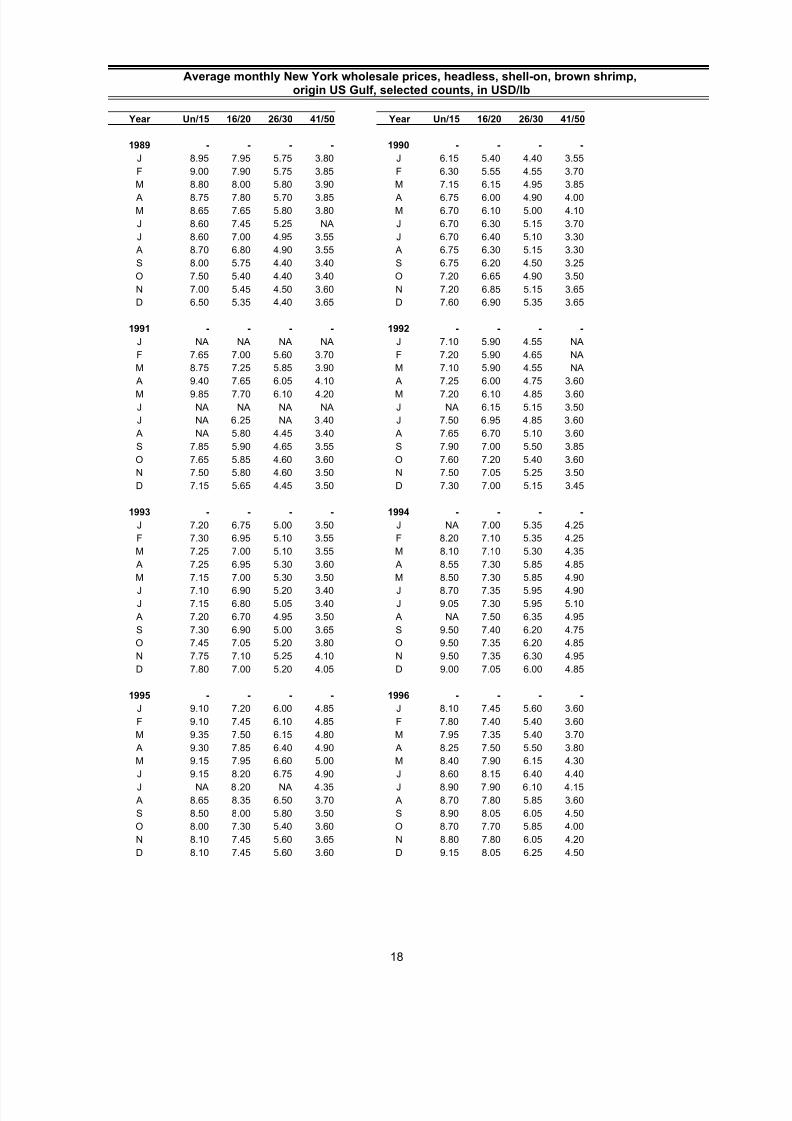
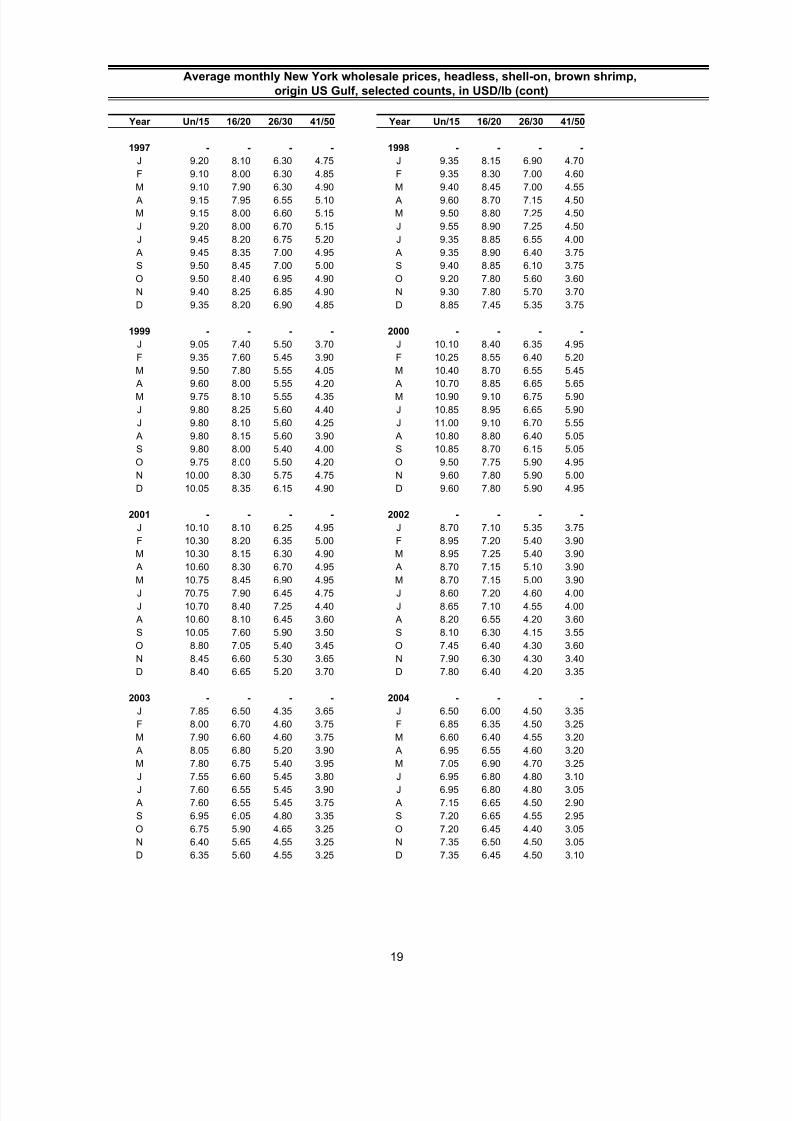
Average monthly New York wholesale prices, headless, shell-on, brown shrimp,
origin US Gulf, selected counts, in USD/lb 18
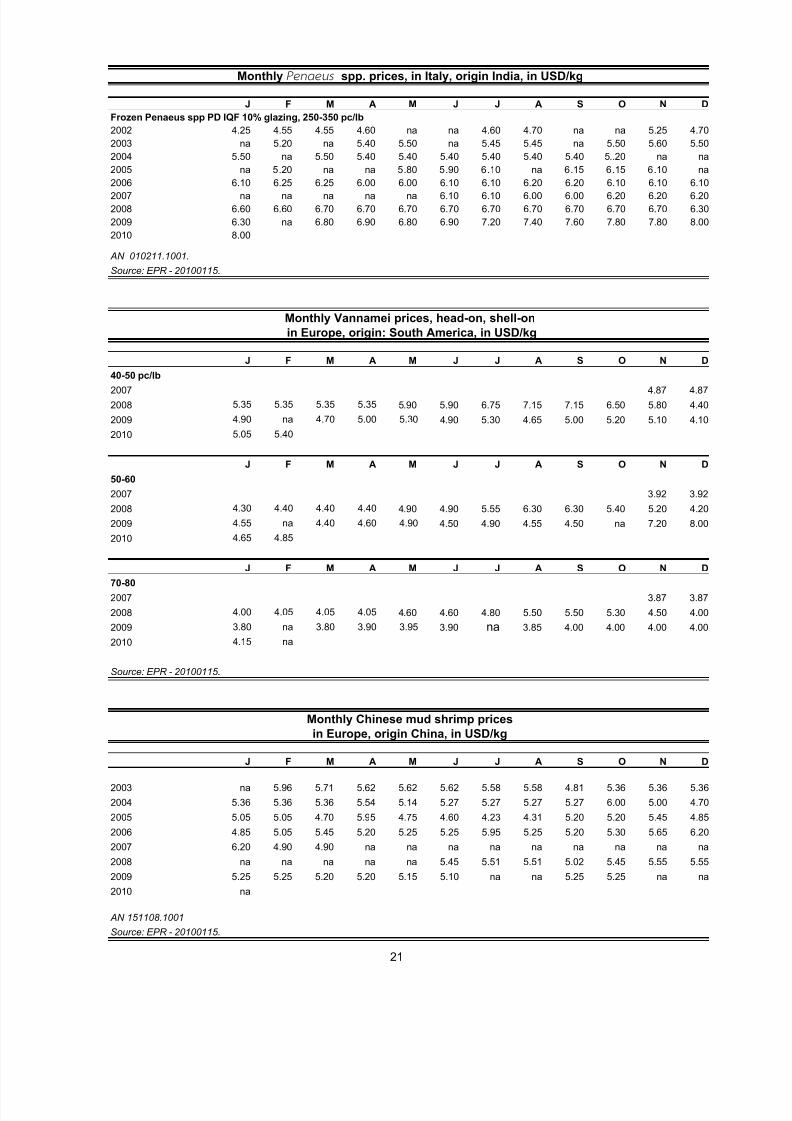
Monthly Penaeus spp . prices, in Italy, origin India 21
Monthly Vannamei prices, head-on, shell-on in Europe,
origin: South America, in USD/kg 21
Monthly Chinese mud shrimp prices in Europe, origin China, in USD/kg 21
SHRIMP IMPORTS
Total EU imports of chilled and frozen shrimps, by country of origin, in 1000 tonnes 22
Total EU imports of chilled and frozen shrimp, by country of origin, in Euro/ECU 1 000 24
Yearly chilled and frozen shrimp imports,
by major importing countries, in 1 000 tonnes 26
Yearly chilled and frozen shrimp imports,by major importing countries, in USD million 27
EU imports of shrimps (all product types), by country of origin, in 1000 tonnes 28
i

5/13/2018 Globefish Commodity Update Shrimp 2010 - slidepdf.com
http://slidepdf.com/reader/full/globefish-commodity-update-shrimp-2010 5/78
Total EU imports of shrimps (all product types), by country of origin, in Euro/ECU million 30
Yearly shrimp imports (all product types), by major importing countries, in 1 000 tonnes 32
Yearly shrimp imports (all product types), by major importing countries, in USD million 35
Spanish shrimp imports, by country of origin, in 1 000 tonnes 38
Italian shrimp imports, by country of origin, in 1 000 tonnes 40
German shrimp imports, by country of origin, in 1 000 tonnes 42
Yearly imports of frozen and chilled shrimp, UK,by countries of origin, in 1 000 tonnes, 1985-2009 43
Yearly frozen shrimp imports into Japan, by country of origin, in tonnes, 1984-2009 45
Yearly Japanese coldwater shrimp imports, by selected countries of origin,
in tonnes, 1980-2009 47
Fresh, frozen, shrimp imports, USA, by country of origin, yearly, in 1 000 tonnes 48
US shrimp imports, by product type, cumulative monthly, in 1000 tonnes 50
EU-25 shrimp imports 1999-2008 (1000 in tonnes) 50
EU-25: Imports of Shrimp, 1999-2008 (in 1000 euros) 51
Imports of fresh and frozen shrimp, France, by country of origin in 1000 tonnes 52
SHRIMP EXPORTS
Total EU exports of chilled and frozen shrimps, by country of destination, in 1000 tonnes 53
Total EU exports of chilled and frozen shrimps, by country of destination, in Euro/ECU million 54
Total EU exports of shrimps, by country of destination, in 1000 tonnes 55
Total EU exports of shrimps, by country of destination, in Euro/ECU 1 000 56
Yearly shrimp exports by major exporting countries, in 1 000 tonnes 57
Yearly shrimp exports, by major exporting countries, in USD million 58
Yearly chilled and frozen shrimps exports, by major exporting countries, in USD million 60
Yearly chilled and frozen shrimps exports, by major exporting countries, in 1 000 tonnes 61
ii

5/13/2018 Globefish Commodity Update Shrimp 2010 - slidepdf.com
http://slidepdf.com/reader/full/globefish-commodity-update-shrimp-2010 6/78
SHRIMP PRODUCTION
Crangon crangon landings, in 1 000 tonnes 63
Pandalus borealis landings, in 1 000 tonnes 63
EU shrimp landings, in 1 000 tonnes 64
Estimates on shrimp aquaculture production, in 1 000 tonnes 65
Yearly shrimp production by major fishing areas, in 1 000 tonnes 66
Yearly shrimp production by major producing countries, in 1 000 tonnes 69
Yearly shrimp production by major species, in 1 000 tonnes 70
Wild shrimp production by major producing countries, in 1 000 tonnes 71
iii
5/13/2018 Globefish Commodity Update Shrimp 2010 - slidepdf.com
http://slidepdf.com/reader/full/globefish-commodity-update-shrimp-2010 7/78
1
Shrimp Market Report, Europe – February 2010
Crisis seems to be over for shrimp industry
During 2009 the EU market took advantage of the low shrimp prices experienced in 2009, and
overall imports were stable. The only exception was Spain, were the severe economic crisis led
to sharply lower shrimp imports. For the opening months of 2010, some price increases are
forecast, as some major producing countries have supply problems.
European markets reported relatively stable shrimp imports, which is surprisingly given the overall
economic climate. On balance, the third quarter showed higher imports. The decision of the EU to
tighten controls on Indian shrimp seems to have led to a shift of these products away from the EU
towards the US market. In the first nine months of 2009, however, Indian shrimp exports to the EU had
grown quite substantially.
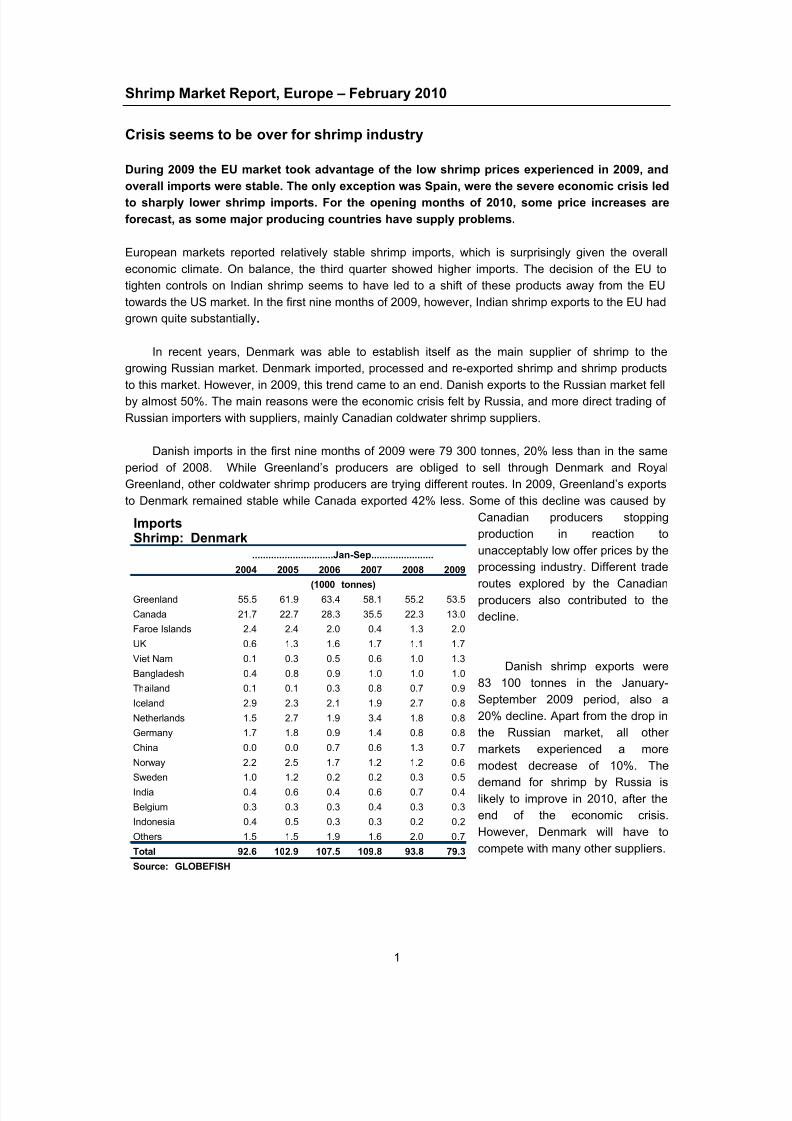
In recent years, Denmark was able to establish itself as the main supplier of shrimp to thegrowing Russian market. Denmark imported, processed and re-exported shrimp and shrimp products
to this market. However, in 2009, this trend came to an end. Danish exports to the Russian market fell
by almost 50%. The main reasons were the economic crisis felt by Russia, and more direct trading of
Russian importers with suppliers, mainly Canadian coldwater shrimp suppliers.
Danish imports in the first nine months of 2009 were 79 300 tonnes, 20% less than in the same
period of 2008. While Greenland’s producers are obliged to sell through Denmark and Royal
Greenland, other coldwater shrimp producers are trying different routes. In 2009, Greenland’s exports
to Denmark remained stable while Canada exported 42% less. Some of this decline was caused by
Canadian producers stopping
production in reaction tounacceptably low offer prices by the
processing industry. Different trade
routes explored by the Canadian
producers also contributed to the
decline.
Danish shrimp exports were
83 100 tonnes in the January-
September 2009 period, also a
20% decline. Apart from the drop in
the Russian market, all other
markets experienced a more
modest decrease of 10%. The
demand for shrimp by Russia is
likely to improve in 2010, after the
end of the economic crisis.
However, Denmark will have to
compete with many other suppliers.
ImportsShrimp: Denmark
2004 2005 2006 2007 2008 2009
Greenland 55.5 61.9 63.4 58.1 55.2 53.5
Canada 21.7 22.7 28.3 35.5 22.3 13.0
Faroe Islands 2.4 2.4 2.0 0.4 1.3 2.0
UK 0.6 1.3 1.6 1.7 1.1 1.7
Viet Nam 0.1 0.3 0.5 0.6 1.0 1.3
Bangladesh 0.4 0.8 0.9 1.0 1.0 1.0
Thailand 0.1 0.1 0.3 0.8 0.7 0.9
Iceland 2.9 2.3 2.1 1.9 2.7 0.8
Netherlands 1.5 2.7 1.9 3.4 1.8 0.8
Germany 1.7 1.8 0.9 1.4 0.8 0.8
China 0.0 0.0 0.7 0.6 1.3 0.7
Norway 2.2 2.5 1.7 1.2 1.2 0.6
Sweden 1.0 1.2 0.2 0.2 0.3 0.5
India 0.4 0.6 0.4 0.6 0.7 0.4
Belgium 0.3 0.3 0.3 0.4 0.3 0.3
Indonesia 0.4 0.5 0.3 0.3 0.2 0.2
Others 1.5 1.5 1.9 1.6 2.0 0.7
Total 92.6 102.9 107.5 109.8 93.8 79.3
Source: GLOBEFISH
..............................Jan-Sep.......................
(1000 tonnes)
5/13/2018 Globefish Commodity Update Shrimp 2010 - slidepdf.com
http://slidepdf.com/reader/full/globefish-commodity-update-shrimp-2010 8/78
2
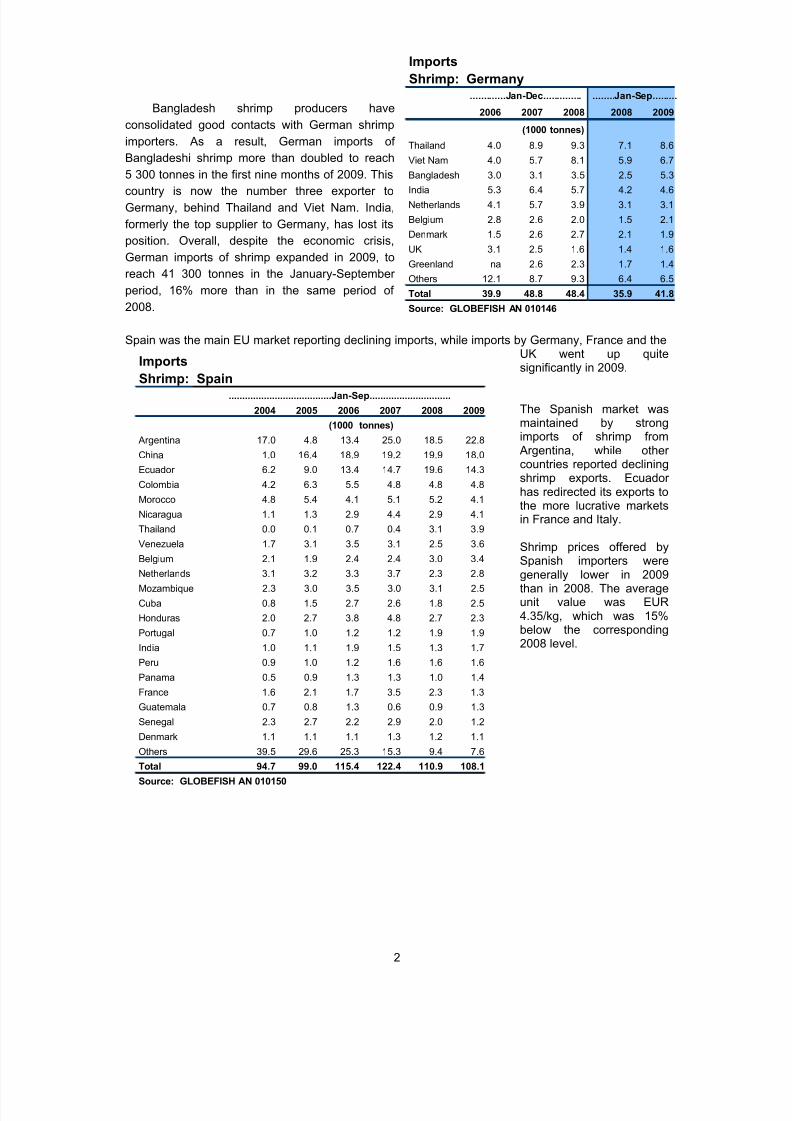
Bangladesh shrimp producers have
consolidated good contacts with German shrimp
importers. As a result, German imports of
Bangladeshi shrimp more than doubled to reach
5 300 tonnes in the first nine months of 2009. Thiscountry is now the number three exporter to
Germany, behind Thailand and Viet Nam. India,
formerly the top supplier to Germany, has lost its
position. Overall, despite the economic crisis,
German imports of shrimp expanded in 2009, to
reach 41 300 tonnes in the January-September
period, 16% more than in the same period of
2008.
Spain was the main EU market reporting declining imports, while imports by Germany, France and the
UK went up quitesignificantly in 2009.
The Spanish market wasmaintained by strongimports of shrimp from Argentina, while other countries reported decliningshrimp exports. Ecuador has redirected its exports tothe more lucrative marketsin France and Italy.
Shrimp prices offered bySpanish importers weregenerally lower in 2009than in 2008. The averageunit value was EUR4.35/kg, which was 15%below the corresponding2008 level.
Imports
Shrimp: Germany
2006 2007 2008 2008 2009
Thailand 4.0 8.9 9.3 7.1 8.6
Viet Nam 4.0 5.7 8.1 5.9 6.7
Bangladesh 3.0 3.1 3.5 2.5 5.3India 5.3 6.4 5.7 4.2 4.6
Netherlands 4.1 5.7 3.9 3.1 3.1
Belgium 2.8 2.6 2.0 1.5 2.1
Denmark 1.5 2.6 2.7 2.1 1.9
UK 3.1 2.5 1.6 1.4 1.6
Greenland na 2.6 2.3 1.7 1.4
Others 12.1 8.7 9.3 6.4 6.5
Total 39.9 48.8 48.4 35.9 41.8
Source: GLOBEFISH AN 010146
.............Jan-Dec.............. ........Jan-Sep.........
(1000 tonnes)
Imports
Shrimp: Spain
2004 2005 2006 2007 2008 2009
Argentina 17.0 4.8 13.4 25.0 18.5 22.8
China 1.0 16.4 18.9 19.2 19.9 18.0
Ecuador 6.2 9.0 13.4 14.7 19.6 14.3
Colombia 4.2 6.3 5.5 4.8 4.8 4.8
Morocco 4.8 5.4 4.1 5.1 5.2 4.1
Nicaragua 1.1 1.3 2.9 4.4 2.9 4.1
Thailand 0.0 0.1 0.7 0.4 3.1 3.9Venezuela 1.7 3.1 3.5 3.1 2.5 3.6
Belgium 2.1 1.9 2.4 2.4 3.0 3.4
Netherlands 3.1 3.2 3.3 3.7 2.3 2.8
Mozambique 2.3 3.0 3.5 3.0 3.1 2.5
Cuba 0.8 1.5 2.7 2.6 1.8 2.5
Honduras 2.0 2.7 3.8 4.8 2.7 2.3
Portugal 0.7 1.0 1.2 1.2 1.9 1.9
India 1.0 1.1 1.9 1.5 1.3 1.7
Peru 0.9 1.0 1.2 1.6 1.6 1.6
Panama 0.5 0.9 1.3 1.3 1.0 1.4
France 1.6 2.1 1.7 3.5 2.3 1.3
Guatemala 0.7 0.8 1.3 0.6 0.9 1.3Senegal 2.3 2.7 2.2 2.9 2.0 1.2
Denmark 1.1 1.1 1.1 1.3 1.2 1.1
Others 39.5 29.6 25.3 15.3 9.4 7.6
Total 94.7 99.0 115.4 122.4 110.9 108.1
Source: GLOBEFISH AN 010150
(1000 tonnes)
......................................Jan-Sep..............................
5/13/2018 Globefish Commodity Update Shrimp 2010 - slidepdf.com
http://slidepdf.com/reader/full/globefish-commodity-update-shrimp-2010 9/78
3
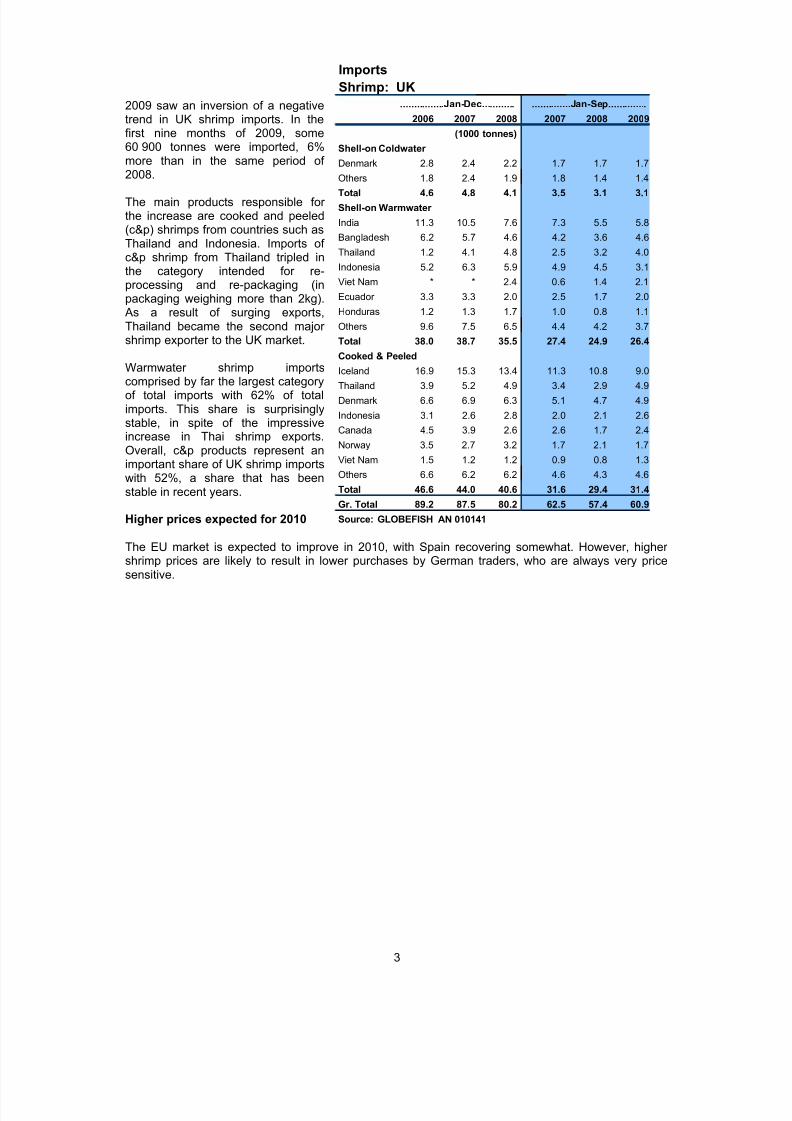
2009 saw an inversion of a negativetrend in UK shrimp imports. In thefirst nine months of 2009, some60 900 tonnes were imported, 6%more than in the same period of
2008.
The main products responsible for the increase are cooked and peeled(c&p) shrimps from countries such asThailand and Indonesia. Imports of c&p shrimp from Thailand tripled inthe category intended for re-processing and re-packaging (inpackaging weighing more than 2kg). As a result of surging exports,Thailand became the second major shrimp exporter to the UK market.
Warmwater shrimp importscomprised by far the largest categoryof total imports with 62% of totalimports. This share is surprisinglystable, in spite of the impressiveincrease in Thai shrimp exports.Overall, c&p products represent animportant share of UK shrimp importswith 52%, a share that has beenstable in recent years.
Higher prices expected for 2010
The EU market is expected to improve in 2010, with Spain recovering somewhat. However, higher shrimp prices are likely to result in lower purchases by German traders, who are always very pricesensitive.
Imports
Shrimp: UK
2006 2007 2008 2007 2008 2009
Shell-on Coldwater
Denmark 2.8 2.4 2.2 1.7 1.7 1.7
Others 1.8 2.4 1.9 1.8 1.4 1.4
Total 4.6 4.8 4.1 3.5 3.1 3.1
Shell-on Warmwater
India 11.3 10.5 7.6 7.3 5.5 5.8
Bangladesh 6.2 5.7 4.6 4.2 3.6 4.6
Thailand 1.2 4.1 4.8 2.5 3.2 4.0
Indonesia 5.2 6.3 5.9 4.9 4.5 3.1
Viet Nam * * 2.4 0.6 1.4 2.1
Ecuador 3.3 3.3 2.0 2.5 1.7 2.0
Honduras 1.2 1.3 1.7 1.0 0.8 1.1
Others 9.6 7.5 6.5 4.4 4.2 3.7
Total 38.0 38.7 35.5 27.4 24.9 26.4
Cooked & Peeled
Iceland 16.9 15.3 13.4 11.3 10.8 9.0
Thailand 3.9 5.2 4.9 3.4 2.9 4.9
Denmark 6.6 6.9 6.3 5.1 4.7 4.9
Indonesia 3.1 2.6 2.8 2.0 2.1 2.6
Canada 4.5 3.9 2.6 2.6 1.7 2.4
Norway 3.5 2.7 3.2 1.7 2.1 1.7
Viet Nam 1.5 1.2 1.2 0.9 0.8 1.3
Others 6.6 6.2 6.2 4.6 4.3 4.6
Total 46.6 44.0 40.6 31.6 29.4 31.4
Gr. Total 89.2 87.5 80.2 62.5 57.4 60.9
Source: GLOBEFISH AN 010141
................Jan-Dec............ ..............Jan-Sep..............
(1000 tonnes)

5/13/2018 Globefish Commodity Update Shrimp 2010 - slidepdf.com
http://slidepdf.com/reader/full/globefish-commodity-update-shrimp-2010 10/78
4
Shrimp Market Report, Japan – February 2010
Climate change and the economic crisis impact shrimp production
Thai shrimp production is estimated to have reached about 540 000 tonnes in 2009, an increase
of 9% compared with 2008, while total exports of shrimp in the first ten months of 2009 grew 8% in
terms of value. This contrasts with the announcements made at the beginning of 2009 that the Thai
shrimp sector would cut its production by 20% to 396 000 tonnes, in order to cope the international
crisis. However, Thai shrimp exporters managed to gain market share in the US benefitting from the
supply problems suffered by Indonesia, the US second supplier. According to the Thai Shrimp
Association, the forecast for 2010 is for a similar level of production, although national authorities are
aiming for a 5% growth rate.
Packers in southern Viet Nam faced a serious raw material shortage during the fourth quarter of
2009 as farming in the Mekong Delta fell by 30% compared with 2008. Raw material prices increased
by 10-15% and many packers operated 30-50% below their production capacity. November-March is
the low season for farmed shrimp in Viet Nam, with the new season only commencing in April. For
many farmers, the supply outlook is still bleak because of lack of access to finance. However, the
industry forecast predicts a better supply situation in 2010.
Shrimp farms in the southern state of Andhra (India) were seriously affected by heavy rains in
late November 2009 and premature harvests collected mostly 31/40 to 80/120 sizes. Current supplies
of farmed shrimp are very low in the southern and eastern aquaculture areas. The mandatory farm
registration with MPEDA (Marine Product Export Development Authority of India) is effective from
December for all brackish water shrimp aquaculture (black tiger and vannamei) operations. Export
processors are allowed to buy raw materials from registered farms only.
Shrimp supply in Indonesia was badly affected by disease in 2009. Conflicts between farmers
and exporters also added to Indonesia’s supply problems. Total shrimp culture production fell from
230 000 tonnes to 180 000 tonnes. Initially the government allowed imports of vannamei (raw
material) in order to enable exporters to fulfil their orders, but, as a result of protests by farmers, this
was banned in December 2009, and the government gave its support to increasing local production of
shrimp, including intensive vannamei farming. The Ministry of Maritime Affairs and Fisheries is
encouraging the use of locally produced vannamei broodstock as a means of combating the diseases
which affect imported broodstock.
Good demand in Japan
Compared with the same period last year Japanese household consumption of shrimp during
January-August increased by 8.3% to 1 309 grams - 100 grams more than the same period during the
previous year. Promotional campaigns by supermarkets for black tiger shrimp were effective during
the spring and summer festival seasons and retail prices were much lower as a result of the strong
yen appreciation against the US dollar. Increased consumption of black tiger shrimp showed that the
Japanese prefer black tiger shrimp to farmed vannamei, particularly when it is affordable to average
consumers.
Good business was reported during the 2009 year-end festival sales. Compared with headless
products, demand was strong for head-on shrimp which are used for New Year celebrations and
traditional family dinners at home. However, consumers avoided high quality seafood products and
5/13/2018 Globefish Commodity Update Shrimp 2010 - slidepdf.com
http://slidepdf.com/reader/full/globefish-commodity-update-shrimp-2010 11/78
5
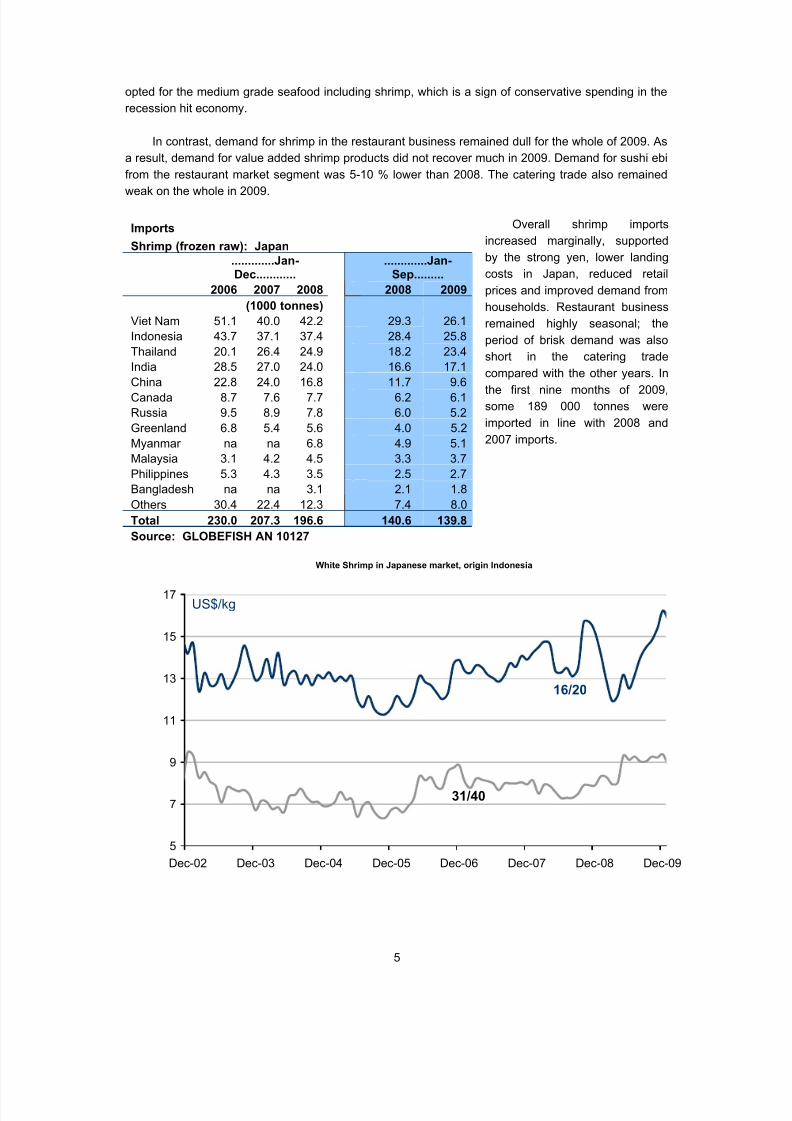
opted for the medium grade seafood including shrimp, which is a sign of conservative spending in the
recession hit economy.
In contrast, demand for shrimp in the restaurant business remained dull for the whole of 2009. As
a result, demand for value added shrimp products did not recover much in 2009. Demand for sushi ebi
from the restaurant market segment was 5-10 % lower than 2008. The catering trade also remainedweak on the whole in 2009.
Overall shrimp imports
increased marginally, supported
by the strong yen, lower landing
costs in Japan, reduced retail
prices and improved demand from
households. Restaurant business
remained highly seasonal; the
period of brisk demand was also
short in the catering tradecompared with the other years. In
the first nine months of 2009,
some 189 000 tonnes were
imported in line with 2008 and
2007 imports.
White Shrimp in Japanese market, origin Indonesia
5
7
9
11
13
15
17
Dec-02 Dec-03 Dec-04 Dec-05 Dec-06 Dec-07 Dec-08 Dec-09
US$/kg
31/40
16/20
Imports
Shrimp (frozen raw): Japan.............Jan-Dec............
.............Jan-Sep.........
2006 2007 2008 2008 2009
(1000 tonnes)
Viet Nam 51.1 40.0 42.2 29.3 26.1
Indonesia 43.7 37.1 37.4 28.4 25.8
Thailand 20.1 26.4 24.9 18.2 23.4India 28.5 27.0 24.0 16.6 17.1
China 22.8 24.0 16.8 11.7 9.6
Canada 8.7 7.6 7.7 6.2 6.1
Russia 9.5 8.9 7.8 6.0 5.2
Greenland 6.8 5.4 5.6 4.0 5.2
Myanmar na na 6.8 4.9 5.1
Malaysia 3.1 4.2 4.5 3.3 3.7
Philippines 5.3 4.3 3.5 2.5 2.7
Bangladesh na na 3.1 2.1 1.8
Others 30.4 22.4 12.3 7.4 8.0
Total 230.0 207.3 196.6 140.6 139.8
Source: GLOBEFISH AN 10127

5/13/2018 Globefish Commodity Update Shrimp 2010 - slidepdf.com
http://slidepdf.com/reader/full/globefish-commodity-update-shrimp-2010 12/78
6
Both major exporters of shrimp to the Japanese market - Indonesia and Viet Nam - reported
lower exports of shrimp in the first nine months of 2009. Supplies improved from India and Myanmar,
as these were mostly the preferred black tiger shrimp. Thailand exported more vannamei shrimp to
Japan with the major share of these exports being semi-processed products.
In the import trade, the strong yen will support occasional purchases for the Japanese market,earmarked for spring sales in April. Considering seasonal harvests will be low until April, and high
consumption is expected during the Chinese New Year (14-15 February), shrimp markets are
expected to be firm in the coming months.

5/13/2018 Globefish Commodity Update Shrimp 2010 - slidepdf.com
http://slidepdf.com/reader/full/globefish-commodity-update-shrimp-2010 13/78
7
Shrimp Market Report, US – January 2010
US reviews antidumping duties
The Department of Commerce publishedthe final results of the third administrativereview of the antidumping duties on shrimp.While this report was positive for shrimpexporters from India, Ecuador, Viet Namand China, Thailand was given higher duties. Shrimp importers in the US are nowexpecting results of the review process of the International Trade Commission, whichwill begin in January and that couldpossibly revoke antidumping duties,according to a meeting of the NationalFisheries Institute. In addition, in a report
prepared by the US Labour Department,Thai shrimp companies were accused of using child and forced labour in their production sector. Labour conditions in thissector had already been questioned in aprevious report from Yet another concernamong Thai exporters is the exchange rate,as the appreciation of the baht is likely tobe a barrier for the improvement anddiversification of exports. Nevertheless,
Thai producers expect to show a 5% increase in their shrimp production and exports, with the USAremaining the main buyer, accounting for over 50% of total exports.
US shrimp imports stable
In the first half of 2009 USshrimp imports remainedalmost unchanged in termsof volume, totalling 236 076tonnes. In terms of value,imports fell 2.5% to USD 1600 million, as a result of lower prices on the worldshrimp. Thailand remainsthe top supplier of shrimp tothe US market, with 73 367
tonnes or 31% of totalimported volumes. Thesecond main supplier isIndonesia, followed byEcuador. The six topsuppliers which include alsoMexico, Viet Nam and Chinaaccounted for 81% of totalsupply of imported shrimp tothe US market in the firstsemester of 2009.Purchases from Mexicogrew significantly (+59%)while sales from China fellfurther (-27%). Headless

5/13/2018 Globefish Commodity Update Shrimp 2010 - slidepdf.com
http://slidepdf.com/reader/full/globefish-commodity-update-shrimp-2010 14/78
8
shell-on frozen shrimp remains the main imported product, with 92 741 tonnes, but its share in totalimports fell from 42% to 39%.Ecuador is the main supplier of headless shell-on frozen shrimp. The second main imported product ispeeled frozen shrimp, which accounts for 33% of total imports. Purchases of breaded frozen shrimpwere 13% lower. The upcoming Christmas holiday season, when consumption usually peaks, had littleimpact on imports of shrimp. Total imports up to August fell 2% in terms of volume and 5% in terms of
value, with a 3% reduction in unit value. This could be interpreted as being adequate supply for demand that is not improving and remains uncertain in the short term. Efforts to enhance consumptionare being taken by the National Fisheries Institute. As consumers are eating out less often because of the recession, the industry is trying to attract consumers by providing a website (www.eatshrimp.com)giving recipes and suggestions for eating shrimp at home.
Domestic supply grew, pushing down prices
Gulf shrimp landings between January and August grew 38%. This growth in the supply of domesticshrimp added to stock carried over from last season, seriously affecting prices. In some Gulf States,prices in August fell over 50%. The Governor of Louisiana formed a task force in order to analyze themarket situation and to prepare measures to help the shrimp sector. Wild American Shrimp Inc,representing the domestic industry, asked the national government to take measures to distinguish
wild shrimp from cultured shrimp so that it can be promoted as a wild-caught product.
Prices will increase, but overall level very low
Demand in the US market is likely to remain stable and moderate for the rest of 2009, until therecovery of the economy is certain and is recognised by consumers. Until then, high end productssuch as shrimp will not show a significant increase in demand. In the domestic wild-caught shrimpmarket oversupply and low prices are likely to continue and will remain a challenge unless a distinctionis made between these supplies and imported cultured shrimp, which sets a precedent for price levels.Consumption and thus demand may increase in the coming holiday season, especially as prices arestill low.
5/13/2018 Globefish Commodity Update Shrimp 2010 - slidepdf.com
http://slidepdf.com/reader/full/globefish-commodity-update-shrimp-2010 15/78
SHRIMP PRICES
Year 16/20 31/40 Year 16/20 31/40 Year 16/20 31/40
cnt cnt cnt cnt cnt cnt
1989 - - 1990 - - 1991 - -
J 14.68 8.97 J 11.60 8.00 J 13.06 7.85
F 13.59 8.59 F 13.90 8.40 F 14.32 8.51
M 12.64 8.29 M 13.60 8.40 M 13.33 8.16
A 12.63 8.50 A 13.40 7.15 A 13.90 8.85
M 11.85 7.93 M 15.30 8.50 M 13.60 8.79
J 9.39 7.28 J 14.36 7.72 J 12.07 8.10
J 10.72 8.13 J 15.46 8.28 J 11.35 7.96
A 10.72 8.13 A 15.60 8.54 A 11.49 8.27
S 9.86 7.48 S 14.96 8.46 S 11.66 8.38
O 10.05 7.55 O 15.30 8.70 O 13.97 8.68N 11.33 7.88 N 16.50 9.37 N 13.42 8.38
D 11.60 8.00 D 13.55 8.12 D 13.09 9.09
1992 - - 1993 - - 1994 - -
J 12.26 8.10 J 13.44 8.16 J 13.48 9.31
F 12.32 8.13 F 14.50 8.93 F 13.83 9.39
M 12.41 7.94 M 14.50 8.90 M 15.16 10.97
A 12.65 8.07 A 14.30 9.31 A 15.82 11.32
M 12.29 7.99 M 13.70 9.28 M 16.41 12.13
J 12.43 8.07 J 15.27 10.09 J 15.90 11.96
J 13.78 9.56 J 14.55 9.55 J 16.01 12.07
A 13.14 9.26 A 14.77 9.76 A 15.87 11.96
S 15.65 10.06 S 14.88 9.92 S 14.56 11.19
O 16.30 9.73 O 14.80 9.62 O 15.44 12.14N 16.78 9.73 N 14.83 9.70 N 16.31 12.58
D 15.29 8.87 D 13.94 9.37 D 16.11 12.22
1995 - - 1996 - - 1997 - -
J 16.42 12.14 J 14.83 9.28 J 15.56 10.28
F 16.69 12.25 F 15.06 9.61 F 15.33 10.61
M 16.75 12.28 M 17.33 9.98 M 15.28 10.72
A 19.53 13.67 A 17.56 12.14 A 15.67 10.61
M 19.53 13.88 M 18.44 10.56 M 17.50 11.89
J 18.36 12.47 J 17.78 12.11 J 18.22 12.22
J 17.94 11.42 J 15.17 10.25 J 17.45 12.28
A 16.42 10.33 A 15.17 10.28 A 15.33 11.50
S 16.72 10.03 S 15.72 10.56 S 16.61 11.44
O 16.31 10.22 O 14.72 10.00 O 17.56 12.00
N 15.44 9.75 N 15.94 10.72 N 18.78 12.08
D 15.11 9.61 D 15.69 10.56 D 18.53 11.78
1998 - - 1999 - - 2000 - -
J 17.56 10.89 J 17.28 9.94 J 17.61 10.77
F 20.28 13.06 F 15.75 8.72 F 17.59 10.24
M 19.10 12.06 M 15.51 8.67 M 19.38 11.26
A 19.39 12.06 A 15.96 9.02 A 18.79 10.44
M 19.12 11.78 M 16.11 9.21 M 17.55 9.92
J 17.60 10.64 J 15.72 8.66 J 16.88 10.13
J 16.67 10.22 J 14.54 9.09 J 18.11 10.61
A 17.05 10.60 A 16.34 10.09 A 17.62 10.22
S 17.58 10.94 S 17.14 10.93 S 18.76 10.42O 17.61 10.67 O 16.96 10.96 O 18.58 11.36
N 16.28 8.84 N 18.00 11.39 N 18.51 11.32
D 16.22 8.67 D 18.37 11.44 D 18.09 10.56
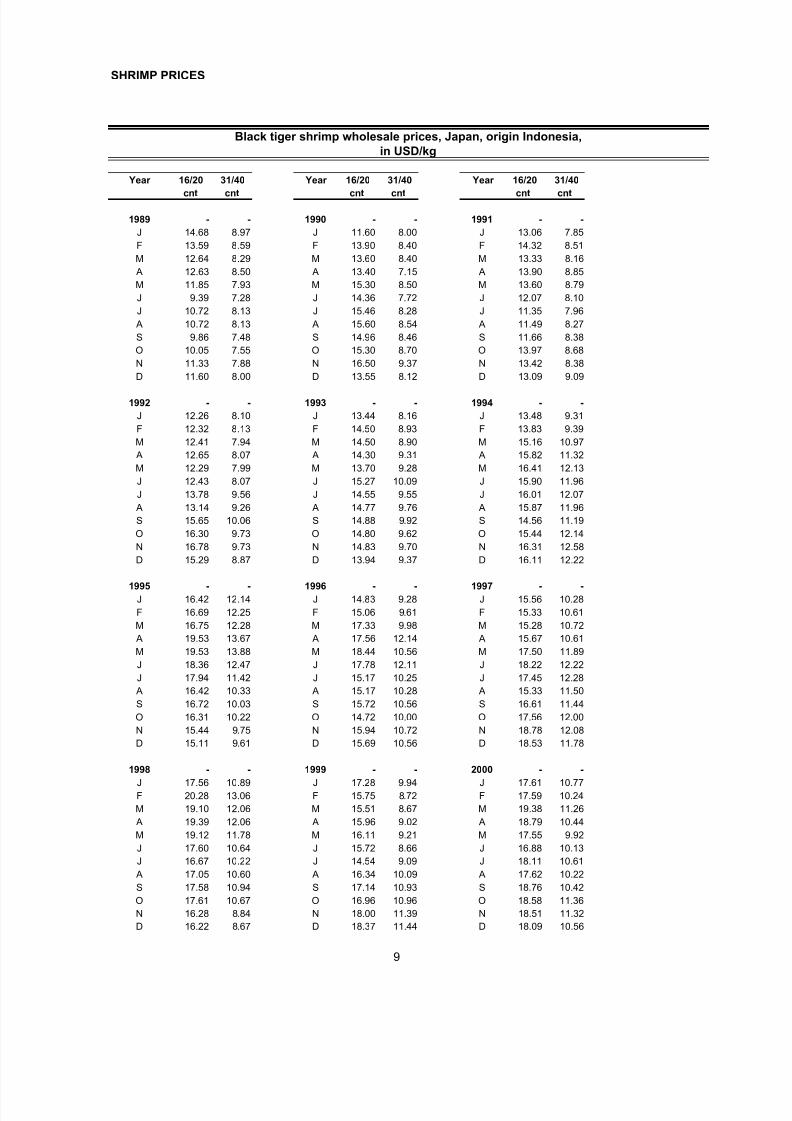
Black tiger shrimp wholesale prices, Japan, origin Indonesia,in USD/kg
9
5/13/2018 Globefish Commodity Update Shrimp 2010 - slidepdf.com
http://slidepdf.com/reader/full/globefish-commodity-update-shrimp-2010 16/78
2001 - - 2002 - - 2003 - -
J 16.67 10.48 J 11.77 7.77 J 14.68 9.32
F 17.65 11.21 F 12.59 8.61 F 12.39 8.26
M 17.67 11.22 M 12.67 8.52 M 13.27 8.53
A 14.24 8.90 A 11.44 7.84 A 12.68 8.07M 14.29 9.07 M 12.45 8.51 M 12.71 7.86
J 13.45 8.66 J 12.69 8.69 J 13.21 7.08
J 12.60 8.62 J 12.53 8.98 J 12.51 7.79
A 12.37 8.50 A 12.17 8.89 A 12.86 7.72
S 12.06 8.30 S 12.46 8.93 S 13.55 7.61
O 11.67 7.80 O 13.26 8.99 O 14.57 7.67
N 10.25 6.80 N 14.84 7.74 N 13.80 7.41
D 10.37 7.06 D 14.18 9.56 D 12.92 6.71
2004 - - 2005 - - 2006 - -
J 13.13 7.15 J 13.29 6.92 J 12.17 6.81
F 13.94 7.10 F 12.87 7.09 F 11.79 6.61
M 13.03 6.76 M 13.09 7.58 M 11.67 NA
A 14.23 6.85 A 12.88 7.21 A 12.21 7.28M 12.70 6.60 M 13.12 7.24 M 13.13 8.33
J 13.21 7.37 J 12.02 6.39 J 12.82 8.14
J 13.34 7.44 J 11.63 6.93 J 12.67 8.28
A 12.73 7.74 A 12.16 7.09 A 12.32 7.82
S 13.17 7.34 S 11.91 7.09 S 12.01 7.77
O 12.68 7.10 O 11.54 6.63 O 12.29 8.56
N 13.16 7.11 N 11.30 6.36 N 13.69 8.74
D 13.00 6.90 D 11.59 6.73 D 13.88 8.86
2007 - - 2008 - - 2009 - -
J 13.35 8.06 J 14.23 8.13 J 14.17 8.32
F 13.27 7.78 F 14.49 7.51 F 12.91 8.29
M 13.63 8.22 M 14.76 7.93 M 11.93 7.95 A 13.53 8.17 A 14.66 7.87 A 12.19 8.03
M 13.19 8.09 M 13.36 7.58 M 13.18 9.31
J 13.02 7.99 J 13.28 7.29 J 12.52 9.11
J 12.85 7.67 J 13.50 7.30 J 13.16 9.27
A 13.15 7.98 A 13.10 7.30 A 14.00 9.04
S 13.73 8.09 S 13.50 7.50 S 14.48 9.04
O 13.55 7.98 O 15.70 7.90 O 14.82 9.26
N 14.08 8.04 N 15.70 7.90 N 15.38 9.23
D 13.90 7.94 D 15.21 7.89 D 16.24 9.37
2010 - -
J 15.65 8.73
F
M A
M
J
J
A
S
O
N
D
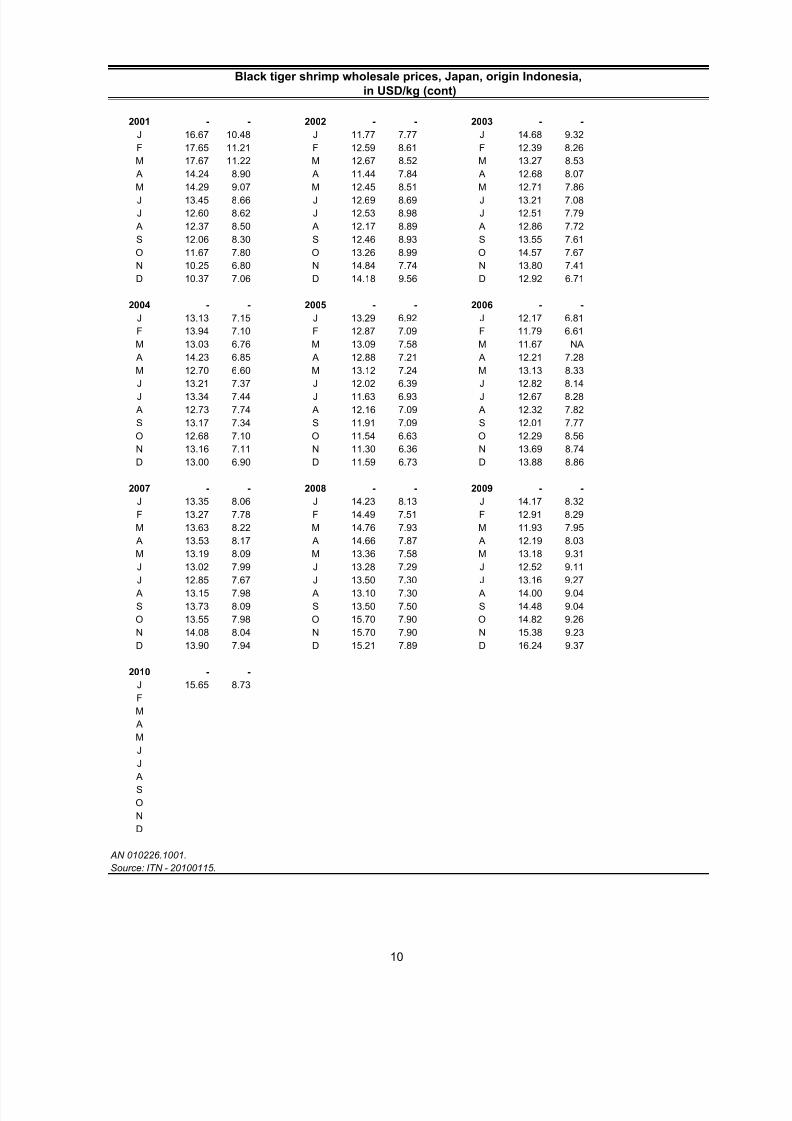
AN 010226.1001.
Source: ITN - 20100115.
Black tiger shrimp wholesale prices, Japan, origin Indonesia,
in USD/kg (cont)
10

5/13/2018 Globefish Commodity Update Shrimp 2010 - slidepdf.com
http://slidepdf.com/reader/full/globefish-commodity-update-shrimp-2010 17/78
Year 13/15 16/20 26/30 41/50 Year 13/15 16/20 26/30 41/50
1989 - - - - 1990 - - - -
J 44.10 34.35 19.45 11.50 J 27.95 22.05 17.60 13.10
F 43.45 35.65 19.95 11.75 F 27.30 23.15 16.25 13.15M 42.50 33.25 20.10 10.80 M 28.10 24.80 17.50 12.90
A 41.10 32.35 20.15 12.95 A 25.60 23.05 15.50 12.00
M 38.30 29.75 18.95 12.65 M 27.50 26.50 16.95 11.50
J 34.45 24.95 18.40 11.95 J 28.35 27.05 17.60 11.75
J 35.70 25.60 20.25 13.35 J 29.40 28.40 18.50 12.55
A 34.55 24.15 19.80 12.60 A 30.30 28.95 19.20 14.50
S 31.60 22.10 18.35 12.20 S 33.60 27.15 18.60 14.30
O 29.50 21.80 18.25 12.65 O 36.80 29.15 20.70 15.35
N 27.20 19.20 16.75 12.20 N 40.10 29.30 21.95 15.80
D 27.70 21.85 17.35 13.15 D 37.85 24.60 16.90 13.60
1991 - - - - 1992 - - - -
J 35.40 28.85 19.35 13.15 J 37.75 29.80 21.45 14.70
F 40.70 32.10 21.50 13.70 F 37.50 29.50 21.55 14.75
M 37.25 30.00 19.90 12.30 M 34.90 26.90 18.95 14.05 A 37.25 29.20 20.10 13.15 A 34.45 26.20 18.70 13.50
M 37.25 28.90 20.25 13.00 M 35.85 26.30 18.80 13.30
J 35.55 27.65 20.10 13.30 J 37.25 28.65 20.40 14.50
J 35.40 27.10 20.25 13.00 J 38.30 29.00 19.75 14.90
A 35.10 27.05 20.10 13.15 A 37.10 28.15 18.75 14.45
S 35.25 27.10 20.80 13.35 S 29.65 29.65 20.70 15.00
O 37.25 28.05 21.90 13.85 O 39.60 30.35 20.95 14.80
N 37.60 29.90 21.45 14.95 N 39.40 30.40 20.95 14.80
D 37.90 29.70 21.10 14.85 D 38.20 28.95 19.30 14.10
1993 - - - - 1994 - - - -
J 35.95 27.95 17.60 12.40 J 36.85 30.60 20.85 17.30
F 37.15 28.70 18.60 12.50 F 40.90 35.35 23.25 19.05
M 36.60 28.00 18.95 13.35 M 42.15 36.00 NA 19.40
A 38.00 29.05 19.70 14.30 A 42.95 35.80 23.85 19.55
M 38.45 29.40 19.90 14.00 M 43.90 37.60 24.90 21.00
J 37.10 28.65 21.15 15.95 J 43.30 38.00 25.50 21.15
J 37.30 29.15 24.40 15.95 J 45.40 39.25 27.00 21.90
A 38.40 30.00 NA 16.40 A 44.45 38.40 25.75 20.70
S 36.95 30.30 21.80 16.55 S 43.85 37.30 24.70 18.15
O 37.25 30.65 21.70 16.95 O 43.75 38.25 24.85 17.90
N 37.55 31.05 22.25 17.15 N 48.35 40.15 25.70 19.05
D 38.15 31.25 22.05 17.45 D 48.05 39.55 27.00 19.00
1995 - - - - 1996 - - - -
J 48.05 39.55 27.00 19.00 J 37.20 31.50 21.45 13.35
F 49.25 41.70 26.45 19.60 F 37.35 30.80 20.55 14.00M 52.80 44.00 27.50 20.90 M 39.23 31.20 22.69 15.36
A 56.25 45.70 29.30 22.25 A 39.50 33.95 23.25 15.80
M 57.20 47.65 29.75 22.65 M 41.70 32.70 24.70 17.10
J 49.60 41.90 28.35 20.05 J 40.32 33.36 23.17 16.22
J 47.00 41.10 27.00 19.40 J 36.90 30.00 22.60 15.70
A 43.75 38.30 25.15 17.50 A 36.10 30.10 22.20 14.80
S 40.10 35.10 24.10 16.09 S 35.30 29.70 22.30 14.85
O 39.80 34.30 23.40 14.90 O 35.00 28.70 22.00 14.80
N 38.50 33.15 22.90 13.65 N 38.10 31.80 22.40 16.10
D 38.60 32.65 21.75 13.85 D 37.95 31.80 22.95 15.90
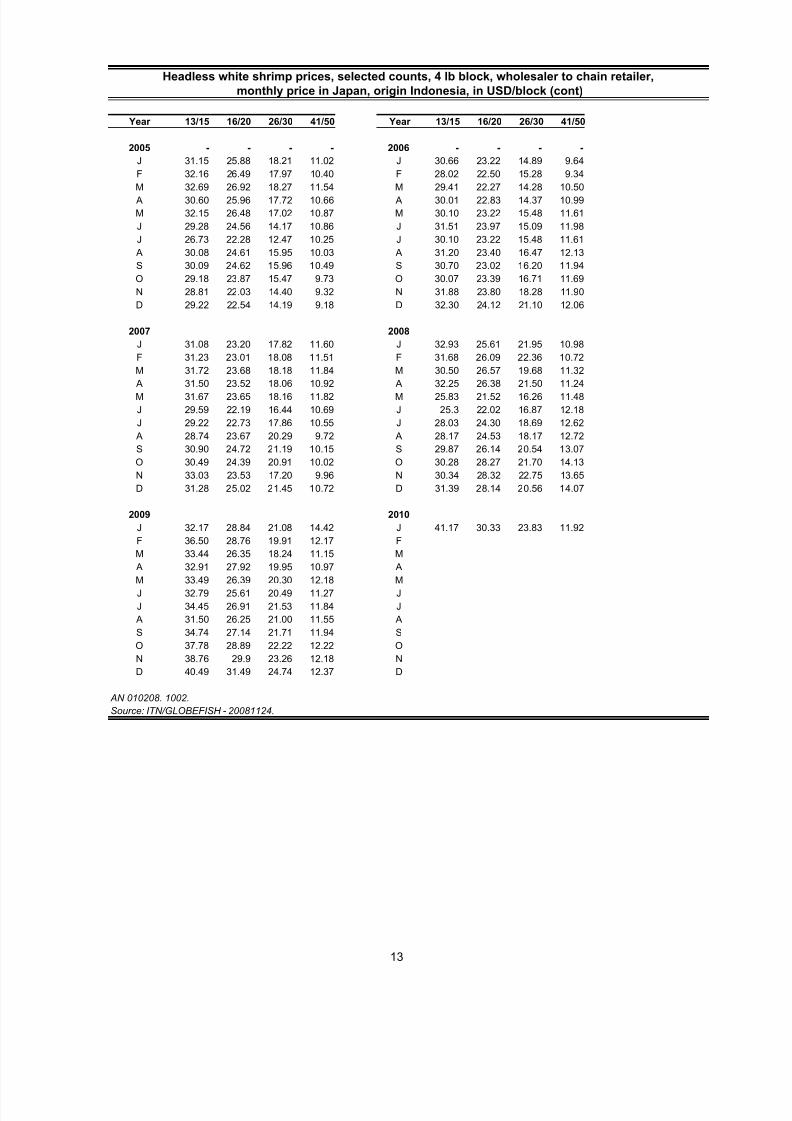
Headless white shrimp prices, selected counts, 4 lb block, wholesaler to chain retailer,
monthly price in Japan, origin Indonesia, in USD/block
11

5/13/2018 Globefish Commodity Update Shrimp 2010 - slidepdf.com
http://slidepdf.com/reader/full/globefish-commodity-update-shrimp-2010 18/78
Year 13/15 16/20 26/30 41/50 Year 13/15 16/20 26/30 41/50
1997 - - - - 1998 - - - -
J 37.00 31.40 22.40 15.50 J 38.40 31.60 25.60 18.10
F 35.70 30.85 22.30 16.20 F 43.70 34.80 29.20 19.40M 36.10 31.20 22.55 16.40 M 41.00 33.30 27.80 19.30
A 36.90 31.80 23.80 17.90 A 40.30 33.30 27.10 17.80
M 38.70 32.80 25.20 18.90 M 38.80 32.00 26.35 17.30
J 41.70 34.60 27.50 20.40 J 36.40 29.70 25.40 15.90
J 41.60 34.50 27.40 20.30 J 36.50 30.50 23.75 14.50
A 38.00 31.50 26.30 19.00 A 35.10 29.00 22.90 14.00
S 37.10 29.90 26.10 18.50 S 36.60 30.90 23.60 13.70
O 41.60 34.10 27.00 19.10 O 43.90 37.20 27.00 15.20
N 42.70 34.60 NA 20.90 N 41.90 33.60 25.10 NA
D 41.60 33.70 NA 19.60 D 36.70 29.80 20.50 12.80
1999 - - - - 2000 - - - -
J 38.90 31.60 22.00 13.30 J 41.62 36.89 22.70 17.50
F 35.76 29.66 18.32 12.21 F 40.32 35.74 21.08 16.95M 35.08 30.07 18.80 12.95 M 43.37 37.71 22.16 16.03
A 35.80 31.64 19.98 14.15 A 43.21 37.58 22.55 15.97
M 35.63 31.48 19.06 14.50 M 41.21 36.63 21.98 15.57
J 35.80 32.01 18.95 13.48 J 42.60 36.05 22.94 15.92
J 33.96 30.27 18.00 13.09 J 41.92 36.33 23.29 15.84
A 35.70 31.83 18.92 13.76 A 40.91 35.40 22.98 15.63
S 39.15 35.01 21.19 17.04 S 43.32 35.79 24.49 17.89
O 39.91 35.69 21.60 17.37 O 43.66 36.23 25.08 15.58
N 41.94 37.18 21.93 17.64 N 44.44 35.10 24.07 17.59
D 42.95 38.07 23.43 18.06 D 42.05 33.10 22.57 17.00
2001 - - - - 2002 - - - -
J 43.78 32.62 22.75 17.17 J 34.79 23.44 17.39 12.10F 43.63 32.51 22.67 17.11 F 36.27 25.69 18.89 14.36
M 42.37 31.57 22.02 16.62 M 37.37 26.47 19.47 14.79
A 40.05 29.64 20.03 15.62 A 35.85 25.17 18.31 13.73
M 40.95 30.31 20.48 15.97 M 35.97 25.02 17.98 13.68
J 40.22 28.73 20.52 15.60 J 36.67 25.51 18.34 13.95
J 39.00 26.66 19.90 14.72 J 37.44 24.67 18.72 12.76
A 40.04 26.97 20.43 15.12 A 37.03 24.41 18.52 12.63
S 40.94 27.16 20.05 15.04 S 33.84 22.84 16.92 11.84
O 39.56 26.37 19.78 14.01 O 31.96 22.65 16.99 11.33
N 37.38 24.92 18.28 13.29 N 33.40 25.05 17.54 11.69
D 34.16 22.24 15.89 11.92 D 32.41 24.31 17.02 10.94
2003 - - - - 2004 - - - -
J 33.57 24.75 16.78 11.75 J 28.09 24.34 18.26 10.77F 28.91 23.13 16.52 11.56 F 30.30 25.56 18.94 11.36
M 29.00 23.03 17.06 11.09 M 28.86 24.35 18.04 10.82
A 25.72 22.40 15.77 10.79 A 30.37 25.62 18.98 10.91
M 24.13 22.05 15.39 10.82 M 28.15 23.75 17.59 10.12
J 27.18 25.05 18.68 11.04 J 29.27 24.69 18.29 10.52
J 27.19 22.95 17.00 11.47 J 29.09 25.39 17.55 10.62
A 26.94 23.15 16.84 11.79 A 28.75 25.15 17.07 10.33
S 29.95 24.82 17.97 11.98 S 30.08 24.61 18.23 10.48
O 31.29 26.69 19.33 11.96 O 29.67 24.65 17.35 10.50
N 29.44 25.76 18.40 11.50 N 31.26 26.05 18.00 10.42
D 28.23 24.30 18.28 10.65 D 28.66 26.75 18.15 10.51
Headless white shrimp prices, selected counts, 4 lb block, wholesaler to chain retailer,
monthly price in Japan, origin Indonesia, in USD/block (cont)
12
5/13/2018 Globefish Commodity Update Shrimp 2010 - slidepdf.com
http://slidepdf.com/reader/full/globefish-commodity-update-shrimp-2010 19/78
Year 13/15 16/20 26/30 41/50 Year 13/15 16/20 26/30 41/50
2005 - - - - 2006 - - - -
J 31.15 25.88 18.21 11.02 J 30.66 23.22 14.89 9.64
F 32.16 26.49 17.97 10.40 F 28.02 22.50 15.28 9.34M 32.69 26.92 18.27 11.54 M 29.41 22.27 14.28 10.50
A 30.60 25.96 17.72 10.66 A 30.01 22.83 14.37 10.99
M 32.15 26.48 17.02 10.87 M 30.10 23.22 15.48 11.61
J 29.28 24.56 14.17 10.86 J 31.51 23.97 15.09 11.98
J 26.73 22.28 12.47 10.25 J 30.10 23.22 15.48 11.61
A 30.08 24.61 15.95 10.03 A 31.20 23.40 16.47 12.13
S 30.09 24.62 15.96 10.49 S 30.70 23.02 16.20 11.94
O 29.18 23.87 15.47 9.73 O 30.07 23.39 16.71 11.69
N 28.81 22.03 14.40 9.32 N 31.88 23.80 18.28 11.90
D 29.22 22.54 14.19 9.18 D 32.30 24.12 21.10 12.06
2007 2008
J 31.08 23.20 17.82 11.60 J 32.93 25.61 21.95 10.98
F 31.23 23.01 18.08 11.51 F 31.68 26.09 22.36 10.72M 31.72 23.68 18.18 11.84 M 30.50 26.57 19.68 11.32
A 31.50 23.52 18.06 10.92 A 32.25 26.38 21.50 11.24
M 31.67 23.65 18.16 11.82 M 25.83 21.52 16.26 11.48
J 29.59 22.19 16.44 10.69 J 25.3 22.02 16.87 12.18
J 29.22 22.73 17.86 10.55 J 28.03 24.30 18.69 12.62
A 28.74 23.67 20.29 9.72 A 28.17 24.53 18.17 12.72
S 30.90 24.72 21.19 10.15 S 29.87 26.14 20.54 13.07
O 30.49 24.39 20.91 10.02 O 30.28 28.27 21.70 14.13
N 33.03 23.53 17.20 9.96 N 30.34 28.32 22.75 13.65
D 31.28 25.02 21.45 10.72 D 31.39 28.14 20.56 14.07
2009 2010
J 32.17 28.84 21.08 14.42 J 41.17 30.33 23.83 11.92F 36.50 28.76 19.91 12.17 F
M 33.44 26.35 18.24 11.15 M
A 32.91 27.92 19.95 10.97 A
M 33.49 26.39 20.30 12.18 M
J 32.79 25.61 20.49 11.27 J
J 34.45 26.91 21.53 11.84 J
A 31.50 26.25 21.00 11.55 A
S 34.74 27.14 21.71 11.94 S
O 37.78 28.89 22.22 12.22 O
N 38.76 29.9 23.26 12.18 N
D 40.49 31.49 24.74 12.37 D
AN 010208. 1002.
Source: ITN/GLOBEFISH - 20081124.
monthly price in Japan, origin Indonesia, in USD/block (cont)
Headless white shrimp prices, selected counts, 4 lb block, wholesaler to chain retailer,
13

5/13/2018 Globefish Commodity Update Shrimp 2010 - slidepdf.com
http://slidepdf.com/reader/full/globefish-commodity-update-shrimp-2010 20/78
Year 13/15 16/20 31/35 41/50 Year 13/15 16/20 31/35 41/50
1989 - - - - 1990 - - - -
J 21.85 17.30 8.35 6.15 J 13.25 11.35 8.80 6.75
F 21.95 17.80 9.20 6.25 F 13.55 12.30 9.30 7.05M 21.45 17.20 10.60 6.30 M 14.05 13.40 9.10 7.30
A 20.70 16.35 10.45 6.40 A 13.40 12.45 8.05 6.80
M 20.35 16.20 9.10 6.65 M 14.20 13.90 8.45 7.10
J 16.55 13.10 8.20 6.00 J 15.15 14.20 8.15 7.20
J 17.25 13.80 9.00 6.00 J 15.85 14.70 8.60 7.40
A 16.55 12.80 9.20 6.50 A 16.20 15.00 8.65 7.60
S 15.45 11.70 9.70 6.60 S 16.35 15.35 9.30 8.05
O 14.60 10.50 8.90 6.50 O 19.95 17.45 9.60 8.05
N 13.80 10.80 8.10 6.70 N 21.50 18.35 10.00 8.70
D 13.35 11.30 8.30 6.90 D 21.20 16.65 9.10 7.75
1991 - - - - 1992 - - - -
J 20.10 16.05 8.60 7.50 J 20.15 16.00 9.70 7.30
F 20.70 16.95 9.80 8.10 F 20.15 16.00 9.70 7.30M 19.90 16.25 8.85 7.75 M 19.95 15.55 9.60 7.20
A 19.70 16.45 9.30 7.45 A 17.00 13.10 NA 6.55
M 19.60 16.30 9.25 7.25 M 17.65 13.55 8.20 6.50
J 19.35 15.80 9.00 7.55 J 17.85 13.55 8.30 6.55
J 19.15 15.55 9.20 7.40 J 21.40 17.15 9.70 7.65
A 18.85 15.40 9.30 6.95 A 20.90 16.60 9.40 7.40
S 19.10 15.60 9.45 6.70 S NA 16.85 9.95 7.30
O 20.20 16.50 10.00 6.90 O 21.75 17.45 9.20 7.40
N 20.70 16.75 9.55 7.30 N 22.20 17.65 9.45 7.80
D 19.90 15.90 9.55 7.15 D 21.70 16.50 9.25 7.45
1993 - - - - 1994 - - - -
J 19.35 15.00 8.20 6.40 J 18.65 16.85 10.65 9.10
F 19.42 15.39 9.10 6.50 F 18.80 17.00 10.75 8.50
M 19.40 15.35 9.10 6.50 M 21.80 18.48 NA 10.65
A 19.73 16.40 10.00 6.88 A 21.95 18.85 12.40 10.50
M 20.10 16.75 10.20 7.00 M 23.20 20.00 12.95 11.20
J 19.70 16.90 10.10 7.75 J 23.30 20.70 13.00 12.30
J 19.10 16.60 10.00 7.75 J 24.20 21.70 13.80 12.00
A 20.10 17.50 10.80 8.40 A 23.50 21.00 13.45 11.10
S 20.10 17.30 10.40 8.05 S 22.68 20.15 12.60 10.09
O 20.75 17.90 10.60 8.70 O 23.35 20.88 12.43 9.95
N 20.60 17.85 11.10 9.30 N 24.70 22.13 12.85 10.30
D 20.00 18.00 12.40 9.00 D 25.00 22.00 12.50 10.00
1995 - - - - 1996 - - - -
J 25.00 22.00 12.50 10.00 J 20.67 17.50 9.00 7.42F 25.05 22.05 12.50 10.00 F 20.75 17.11 9.33 7.78
M 25.10 22.10 12.80 10.05 M 20.78 17.14 9.81 7.57
A 28.10 24.00 14.65 11.60 A 21.15 17.43 10.05 8.13
M 28.30 24.40 14.30 11.30 M 21.80 17.80 NA 8.90
J 26.55 22.43 12.98 10.63 J 21.32 17.38 10.89 8.11
J 26.43 22.30 12.93 9.70 J 19.85 17.05 10.15 7.85
A 24.63 20.25 11.50 10.40 A 19.40 16.65 12.00 7.40
S 22.58 18.55 11.30 8.53 S 19.50 16.25 10.20 7.40
O 20.65 18.40 10.45 7.20 O 19.10 16.15 9.88 7.20
N 20.00 17.55 9.75 6.83 N 20.20 16.60 10.55 8.05
D 21.44 18.14 9.33 7.69 D 20.30 17.28 NA 6.60
Headless, white shrimp, selected counts, wholesale
and monthly price, Japan, origin India, in USD/kg
14

5/13/2018 Globefish Commodity Update Shrimp 2010 - slidepdf.com
http://slidepdf.com/reader/full/globefish-commodity-update-shrimp-2010 21/78
Year 13/15 16/20 31/35 41/50 Year 13/15 16/20 31/35 41/50
1997 - - - - 1998 - - - -
J 19.80 16.35 NA 6.45 J 20.33 16.55 11.30 9.40
F 18.65 16.05 10.15 7.70 F 22.28 18.23 12.75 10.00M 18.85 16.20 10.25 7.80 M 20.90 17.40 12.00 9.65
A 18.85 15.85 10.70 8.95 A 20.55 17.05 11.65 9.30
M 19.35 17.65 11.75 9.90 M 19.75 16.80 11.30 8.85
J 20.10 17.90 12.30 10.15 J 19.15 16.55 10.30 8.10
J 20.80 18.15 11.95 10.15 J 18.25 16.30 10.30 7.60
A 19.00 17.25 11.65 9.30 A 17.75 15.70 9.90 7.35
S 18.53 16.85 11.35 9.05 S 18.30 16.53 9.50 7.05
O 21.20 18.70 12.45 10.00 O 22.80 19.85 11.00 8.45
N 22.15 18.95 12.90 10.45 N 22.20 18.43 NA NA
D 21.58 18.45 NA 10.20 D 18.35 16.20 8.53 NA
1999 - - - - 2000 - - - -
J 19.70 17.15 9.15 NA J 21.29 17.50 12.52 8.28
F 18.32 14.25 8.72 NA F 20.62 17.50 10.54 8.02M 17.66 14.70 8.21 6.57 M 20.53 18.00 10.50 7.99
A 18.32 14.70 8.33 6.25 A 20.67 18.50 10.81 7.99
M 18.23 14.65 8.70 6.63 M 19.69 18.50 11.91 7.32
J 17.84 13.80 8.21 6.36 J 20.11 18.50 10.52 7.95
J 17.39 14.20 8.59 6.34 J 19.80 17.70 10.48 7.92
A 18.38 14.20 9.95 6.92 A 20.46 17.85 10.35 8.05
S 19.23 17.00 10.29 7.16 S 20.16 18.30 10.55 8.21
O 20.20 18.00 10.30 8.00 O 20.70 18.20 NA 9.50
N 20.45 17.00 10.95 8.10 N 20.50 17.80 NA 9.30
D 21.56 17.50 11.02 8.88 D NA 17.30 10.80 9.80
2001 - - - - 2002 - - - -
J NA 17.00 11.30 9.30 J 18.15 12.30 7.19 6.81F 20.00 17.00 9.50 NA F 18.14 12.10 8.31 7.18
M 21.00 15.10 10.40 8.20 M 17.95 13.60 8.60 7.10
A 20.02 16.30 9.62 8.01 A NA 11.40 NA 5.70
M 20.42 14.60 9.80 8.17 M 15.00 11.60 NA 5.70
J 20.52 14.70 9.85 8.21 J 16.00 11.30 NA 5.50
J 19.19 13.70 9.35 7.76 J 14.50 10.50 NA 5.00
A 20.02 12.70 9.40 7.77 A 16.00 11.80 NA 5.80
S 20.89 12.75 9.61 7.94 S 16.20 12.10 NA 5.70
O 20.19 13.00 8.86 7.01 O 17.00 12.90 NA 5.50
N 19.11 13.20 7.89 6.65 N 17.00 12.90 NA 5.50
D 18.27 12.10 7.55 5.96 D 15.70 12.00 NA 5.00
2003 - - - - 2004 - - - -
J 15.70 12.00 NA 5.00 J NA 10.70 NA NA
F 13.10 11.20 6.70 8.00 F 12.50 11.00 7.00 4.50
M 12.90 11.20 7.20 5.00 M 12.60 10.60 6.10 4.50
A 12.60 11.30 7.00 5.00 A 12.30 10.65 6.10 4.50
M 12.70 11.40 7.40 5.30 M 12.30 10.65 6.10 4.50
J 12.30 10.80 NA 4.80 J 12.20 10.20 6.00 NA
J 12.50 11.10 7.10 5.10 J 12.50 10.70 6.50 4.50
A 13.10 11.50 7.30 5.10 A 12.80 10.80 NA 5.80
S 12.80 11.10 7.10 5.10 S 13.05 10.90 NA NA
O 12.60 11.10 7.10 5.20 O 13.00 10.80 NA NA
N 12.70 10.80 6.10 5.20 N 12.80 10.50 NA NA
D 12.20 10.20 6.20 NA D 13.00 10.90 NA 4.50
and monthly price, Japan, origin India, in USD/kg (cont)
Headless, white shrimp, selected counts, wholesale
15

5/13/2018 Globefish Commodity Update Shrimp 2010 - slidepdf.com
http://slidepdf.com/reader/full/globefish-commodity-update-shrimp-2010 22/78
Year 13/15 16/20 31/35 41/50 Year 13/15 16/20 31/35 41/50
2005 - - - - 2006 - - - -
J 13.00 10.90 NA 4.50 J 13.70 10.50 NA NA
F NA 11.40 NA 4.50 F 14.60 10.30 NA NA
M 15.00 12.00 NA 5.00 M 13.40 10.30 NA NA
A 15.00 12.00 NA 5.00 A 14.80 11.63 7.40 5.50
M 15.00 12.00 NA 5.00 M 15.91 12.50 7.95 5.91
J 14.30 11.70 NA 5.20 J 14.62 11.18 7.31 5.59
J 13.80 11.00 NA NA J 14.62 11.18 6.67 5.59
A 13.60 10.70 5.80 4.20 A 15.60 11.70 6.72 6.07
S 15.04 12.08 6.61 5.25 S 15.35 11.51 6.61 5.97
O 14.46 11.84 6.35 5.04 O 15.87 11.37 7.51 6.01
N 14.83 11.22 5.93 4.87 N 15.31 11.91 7.87 6.38
D 14.21 10.87 5.85 4.80 D 15.94 12.06 8.19 6.46
2007 - - - - 2008 - - - -
J 15.33 11.60 7.88 5.80 J 16.01 11.89 7.55 5.95
F 15.62 11.51 7.81 5.76 F 13.51 11.18 6.99 6.06
M 15.65 11.84 8.04 5.92 M 14.27 11.81 7.38 6.40
A 15.54 11.97 7.98 5.88 A 13.68 11.00 7.09 6.35
M 15.63 12.04 8.03 5.91 M 13.39 11.24 7.18 6.22
J 15.62 11.92 7.61 5.76 J 13.36 11.72 7.27 6.09
J 15.83 12.18 7.51 5.48 J 14.02 11.92 7.95 6.54
A 14.80 12.26 7.82 5.50 A 13.63 11.82 7.50 6.36
S 15.45 12.80 8.17 5.74 S 14.00 12.14 7.70 6.54
O 15.25 12.63 8.06 5.67 O 15.14 12.87 8.08 7.07
N 15.75 12.25 8.10 5.68 N 14.67 12.90 8.60 7.08
D 15.64 11.62 7.38 6.25 D 15.15 12.99 8.12 7.04
2009 - - - - 2010 - - - -
J 14.98 12.76 8.32 7.21 J 13.54 10.84 7.31 6.23
F 14.38 12.17 8.30 6.92 F
M 13.18 11.15 7.10 6.08 M
A 12.97 10.72 6.98 5.99 A
M 13.20 10.91 7.11 5.84 M
J 13.32 10.76 5.38 5.64 J
J 13.73 11.31 7.54 5.92 J
A 13.18 11.33 7.38 5.80 A
S 13.57 11.94 8.14 6.25 S
O 13.89 11.67 7.23 6.39 O
N 14.12 11.63 7.20 6.37 N
D 14.34 11.53 7.59 6.47 D
AN 010206. 1002.
Source: ITN/GLOBEFISH - 20100222.
Headless, white shrimp, selected counts, wholesale
and monthly price, Japan, origin India, in USD/kg (cont)
16
5/13/2018 Globefish Commodity Update Shrimp 2010 - slidepdf.com
http://slidepdf.com/reader/full/globefish-commodity-update-shrimp-2010 23/78
Year 16-20 31-40 41-50 51-60 Year 16-20 31-40 41-50 51-60
2007 - - - - 2008 - - - -
J na na na na J 8.86 7.00 6.26 5.99
F na na na na F NA 6.99 6.21 5.96
M na na na na M NA 7.38 6.56 6.02
A na na na na A NA 7.06 6.24 5.97
M 9.26 6.02 5.55 5.09 M NA 6.91 6.54 6.11
J 9.13 5.94 5.48 5.02 J NA 7.03 6.67 6.14
J 9.02 5.86 5.64 4.96 J NA 7.53 7.01 5.97
A 9.00 5.96 5.78 5.10 A NA 7.07 6.82 5.81
S 8.92 6.11 5.87 5.17 S NA 7.52 7.52 7.00
O 8.56 6.09 6.10 5.35 O NA 7.85 7.57 6.73
N 8.26 6.81 5.83 5.34 N NA 7.58 6.74 6.46
D 8.44 6.70 5.96 5.71 D NA 7.22 6.61 6.61
Year 16-20 31-40 41-50 51-60 Year 16-20 31-40 41-50 51-60
2009 - - - - 2010 - - - -
J NA 8.01 7.27 6.78 J NA 6.62 6.02 5.42
F NA 7.99 7.07 6.14 F
M NA 7.32 7.04 6.19 M
A NA 7.33 7.05 6.48 A
M NA 7.33 7.05 6.48 M
J NA 7.51 7.12 6.54 J
J NA 8.07 7.48 6.88 J
A NA 7.87 7.32 6.71 A
S NA 8.14 7.54 6.94 S
O NA 8.03 7.41 7.10 O
N NA 7.69 7.08 6.15 N
D NA 6.87 6.25 5.62 D
AN 010223.1002.
Source: ITN/GLOBEFISH - 20100210.
Headless, vannamei shrimp, selected counts, wholesale
and monthly price, Japan, origin Thailand/Indonesia in USD/kg
17
5/13/2018 Globefish Commodity Update Shrimp 2010 - slidepdf.com
http://slidepdf.com/reader/full/globefish-commodity-update-shrimp-2010 24/78
Year Un/15 16/20 26/30 41/50 Year Un/15 16/20 26/30 41/50
1989 - - - - 1990 - - - -
J 8.95 7.95 5.75 3.80 J 6.15 5.40 4.40 3.55
F 9.00 7.90 5.75 3.85 F 6.30 5.55 4.55 3.70
M 8.80 8.00 5.80 3.90 M 7.15 6.15 4.95 3.85
A 8.75 7.80 5.70 3.85 A 6.75 6.00 4.90 4.00
M 8.65 7.65 5.80 3.80 M 6.70 6.10 5.00 4.10
J 8.60 7.45 5.25 NA J 6.70 6.30 5.15 3.70
J 8.60 7.00 4.95 3.55 J 6.70 6.40 5.10 3.30
A 8.70 6.80 4.90 3.55 A 6.75 6.30 5.15 3.30
S 8.00 5.75 4.40 3.40 S 6.75 6.20 4.50 3.25
O 7.50 5.40 4.40 3.40 O 7.20 6.65 4.90 3.50
N 7.00 5.45 4.50 3.60 N 7.20 6.85 5.15 3.65
D 6.50 5.35 4.40 3.65 D 7.60 6.90 5.35 3.65
1991 - - - - 1992 - - - -
J NA NA NA NA J 7.10 5.90 4.55 NA
F 7.65 7.00 5.60 3.70 F 7.20 5.90 4.65 NAM 8.75 7.25 5.85 3.90 M 7.10 5.90 4.55 NA
A 9.40 7.65 6.05 4.10 A 7.25 6.00 4.75 3.60
M 9.85 7.70 6.10 4.20 M 7.20 6.10 4.85 3.60
J NA NA NA NA J NA 6.15 5.15 3.50
J NA 6.25 NA 3.40 J 7.50 6.95 4.85 3.60
A NA 5.80 4.45 3.40 A 7.65 6.70 5.10 3.60
S 7.85 5.90 4.65 3.55 S 7.90 7.00 5.50 3.85
O 7.65 5.85 4.60 3.60 O 7.60 7.20 5.40 3.60
N 7.50 5.80 4.60 3.50 N 7.50 7.05 5.25 3.50
D 7.15 5.65 4.45 3.50 D 7.30 7.00 5.15 3.45
1993 - - - - 1994 - - - -
J 7.20 6.75 5.00 3.50 J NA 7.00 5.35 4.25
F 7.30 6.95 5.10 3.55 F 8.20 7.10 5.35 4.25
M 7.25 7.00 5.10 3.55 M 8.10 7.10 5.30 4.35
A 7.25 6.95 5.30 3.60 A 8.55 7.30 5.85 4.85
M 7.15 7.00 5.30 3.50 M 8.50 7.30 5.85 4.90
J 7.10 6.90 5.20 3.40 J 8.70 7.35 5.95 4.90
J 7.15 6.80 5.05 3.40 J 9.05 7.30 5.95 5.10
A 7.20 6.70 4.95 3.50 A NA 7.50 6.35 4.95
S 7.30 6.90 5.00 3.65 S 9.50 7.40 6.20 4.75
O 7.45 7.05 5.20 3.80 O 9.50 7.35 6.20 4.85
N 7.75 7.10 5.25 4.10 N 9.50 7.35 6.30 4.95
D 7.80 7.00 5.20 4.05 D 9.00 7.05 6.00 4.85
1995 - - - - 1996 - - - -
J 9.10 7.20 6.00 4.85 J 8.10 7.45 5.60 3.60F 9.10 7.45 6.10 4.85 F 7.80 7.40 5.40 3.60
M 9.35 7.50 6.15 4.80 M 7.95 7.35 5.40 3.70
A 9.30 7.85 6.40 4.90 A 8.25 7.50 5.50 3.80
M 9.15 7.95 6.60 5.00 M 8.40 7.90 6.15 4.30
J 9.15 8.20 6.75 4.90 J 8.60 8.15 6.40 4.40
J NA 8.20 NA 4.35 J 8.90 7.90 6.10 4.15
A 8.65 8.35 6.50 3.70 A 8.70 7.80 5.85 3.60
S 8.50 8.00 5.80 3.50 S 8.90 8.05 6.05 4.50
O 8.00 7.30 5.40 3.60 O 8.70 7.70 5.85 4.00
N 8.10 7.45 5.60 3.65 N 8.80 7.80 6.05 4.20
D 8.10 7.45 5.60 3.60 D 9.15 8.05 6.25 4.50
Average monthly New York wholesale prices, headless, shell-on, brown shrimp,origin US Gulf, selected counts, in USD/lb
18
5/13/2018 Globefish Commodity Update Shrimp 2010 - slidepdf.com
http://slidepdf.com/reader/full/globefish-commodity-update-shrimp-2010 25/78
Year Un/15 16/20 26/30 41/50 Year Un/15 16/20 26/30 41/50
1997 - - - - 1998 - - - -
J 9.20 8.10 6.30 4.75 J 9.35 8.15 6.90 4.70
F 9.10 8.00 6.30 4.85 F 9.35 8.30 7.00 4.60M 9.10 7.90 6.30 4.90 M 9.40 8.45 7.00 4.55
A 9.15 7.95 6.55 5.10 A 9.60 8.70 7.15 4.50
M 9.15 8.00 6.60 5.15 M 9.50 8.80 7.25 4.50
J 9.20 8.00 6.70 5.15 J 9.55 8.90 7.25 4.50
J 9.45 8.20 6.75 5.20 J 9.35 8.85 6.55 4.00
A 9.45 8.35 7.00 4.95 A 9.35 8.90 6.40 3.75
S 9.50 8.45 7.00 5.00 S 9.40 8.85 6.10 3.75
O 9.50 8.40 6.95 4.90 O 9.20 7.80 5.60 3.60
N 9.40 8.25 6.85 4.90 N 9.30 7.80 5.70 3.70
D 9.35 8.20 6.90 4.85 D 8.85 7.45 5.35 3.75
1999 - - - - 2000 - - - -
J 9.05 7.40 5.50 3.70 J 10.10 8.40 6.35 4.95
F 9.35 7.60 5.45 3.90 F 10.25 8.55 6.40 5.20M 9.50 7.80 5.55 4.05 M 10.40 8.70 6.55 5.45
A 9.60 8.00 5.55 4.20 A 10.70 8.85 6.65 5.65
M 9.75 8.10 5.55 4.35 M 10.90 9.10 6.75 5.90
J 9.80 8.25 5.60 4.40 J 10.85 8.95 6.65 5.90
J 9.80 8.10 5.60 4.25 J 11.00 9.10 6.70 5.55
A 9.80 8.15 5.60 3.90 A 10.80 8.80 6.40 5.05
S 9.80 8.00 5.40 4.00 S 10.85 8.70 6.15 5.05
O 9.75 8.00 5.50 4.20 O 9.50 7.75 5.90 4.95
N 10.00 8.30 5.75 4.75 N 9.60 7.80 5.90 5.00
D 10.05 8.35 6.15 4.90 D 9.60 7.80 5.90 4.95
2001 - - - - 2002 - - - -
J 10.10 8.10 6.25 4.95 J 8.70 7.10 5.35 3.75F 10.30 8.20 6.35 5.00 F 8.95 7.20 5.40 3.90
M 10.30 8.15 6.30 4.90 M 8.95 7.25 5.40 3.90
A 10.60 8.30 6.70 4.95 A 8.70 7.15 5.10 3.90
M 10.75 8.45 6.90 4.95 M 8.70 7.15 5.00 3.90
J 70.75 7.90 6.45 4.75 J 8.60 7.20 4.60 4.00
J 10.70 8.40 7.25 4.40 J 8.65 7.10 4.55 4.00
A 10.60 8.10 6.45 3.60 A 8.20 6.55 4.20 3.60
S 10.05 7.60 5.90 3.50 S 8.10 6.30 4.15 3.55
O 8.80 7.05 5.40 3.45 O 7.45 6.40 4.30 3.60
N 8.45 6.60 5.30 3.65 N 7.90 6.30 4.30 3.40
D 8.40 6.65 5.20 3.70 D 7.80 6.40 4.20 3.35
2003 - - - - 2004 - - - -
J 7.85 6.50 4.35 3.65 J 6.50 6.00 4.50 3.35F 8.00 6.70 4.60 3.75 F 6.85 6.35 4.50 3.25
M 7.90 6.60 4.60 3.75 M 6.60 6.40 4.55 3.20
A 8.05 6.80 5.20 3.90 A 6.95 6.55 4.60 3.20
M 7.80 6.75 5.40 3.95 M 7.05 6.90 4.70 3.25
J 7.55 6.60 5.45 3.80 J 6.95 6.80 4.80 3.10
J 7.60 6.55 5.45 3.90 J 6.95 6.80 4.80 3.05
A 7.60 6.55 5.45 3.75 A 7.15 6.65 4.50 2.90
S 6.95 6.05 4.80 3.35 S 7.20 6.65 4.55 2.95
O 6.75 5.90 4.65 3.25 O 7.20 6.45 4.40 3.05
N 6.40 5.65 4.55 3.25 N 7.35 6.50 4.50 3.05
D 6.35 5.60 4.55 3.25 D 7.35 6.45 4.50 3.10
Average monthly New York wholesale prices, headless, shell-on, brown shrimp,
origin US Gulf, selected counts, in USD/lb (cont)
19

5/13/2018 Globefish Commodity Update Shrimp 2010 - slidepdf.com
http://slidepdf.com/reader/full/globefish-commodity-update-shrimp-2010 26/78
Year Un/15 16/20 26/30 41/50 Year Un/15 16/20 26/30 41/50
2005 - - - - 2006 - - - -
J 7.55 6.45 4.60 3.20 J 7.20 5.75 4.55 3.45
F 7.60 6.50 4.65 3.45 F 7.10 5.70 4.55 3.50M 7.50 6.35 4.50 3.40 M 6.95 5.45 4.50 3.50
A 7.50 6.20 4.45 3.40 A 6.95 5.40 4.50 3.55
M 7.50 6.15 4.45 3.45 M 6.85 5.40 4.50 3.60
J 7.65 6.25 4.50 3.50 J 6.95 5.40 4.75 3.70
J 7.85 6.40 4.50 3.50 J 6.95 5.45 4.75 3.70
A 7.95 6.50 4.60 3.50 A 6.10 4.85 4.45 3.15
S 7.90 6.25 4.50 3.40 S 5.90 4.65 4.10 3.05
O 7.70 6.15 4.55 3.45 O 5.75 4.55 4.00 2.95
N 7.50 5.95 4.55 3.50 N 5.45 4.20 3.70 2.80
D 7.50 5.95 4.55 3.50 D 5.50 4.20 3.70 2.80
2007 - - - - 2008 - - - -
J 5.85 4.30 3.80 2.70 J 6.95 6.60 4.65 3.30
F 6.05 4.30 3.80 2.70 F 7.00 6.70 4.65 3.30M 6.40 4.45 3.85 2.70 M 7.00 6.70 4.65 3.30
A 6.60 4.80 4.15 2.65 A 7.15 6.90 4.60 3.60
M 6.55 4.95 4.30 2.70 M 7.35 6.95 4.60 3.80
J 6.75 5.30 4.55 2.70 J 7.50 7.05 4.65 3.95
J 6.75 5.70 4.70 2.70 J 7.70 7.20 4.90 4.20
A 6.85 5.80 4.80 2.80 A 7.85 7.45 4.95 4.40
S 6.70 5.55 4.45 2.70 S 7.45 7.00 4.60 4.05
O 6.70 5.45 4.35 2.90 O 7.15 6.75 4.65 4.05
N 6.80 5.95 4.50 2.90 N 6.75 6.25 4.65 4.00
D 6.95 6.50 4.55 3.20 D 6.65 5.80 4.65 4.00
2009 - - - - 2010 - - - -J 6.55 5.45 4.50 3.90 J 5.80 4.10 3.55 2.50
F 6.55 5.40 4.50 3.90 F
M 6.55 5.40 4.50 3..90 M
A 6.40 5.10 4.50 3.90 A
M 6.10 4.95 4.50 3.90 M
J 6.00 4.85 4.50 3.90 J
J 4.45 3.85 4.30 3.60 J
A 5.30 4.40 4.15 2.90 A
S 4.90 3.85 3.50 2.45 S
O 4.70 3.45 3.20 2.40 O
N 4.65 3.75 3.35 2.45 N
D 5.30 3.80 3.35 2.60 D
AN 010205. 1002.
Source: ITN - 20100115.
Average monthly New York wholesale prices, headless, shell-on, brown shrimp,
origin US Gulf, selected counts, in USD/lb (cont)
20
5/13/2018 Globefish Commodity Update Shrimp 2010 - slidepdf.com
http://slidepdf.com/reader/full/globefish-commodity-update-shrimp-2010 27/78
J F M A M J J A S O N D
Frozen Penaeus spp PD IQF 10% glazing, 250-350 pc/lb
2002 4.25 4.55 4.55 4.60 na na 4.60 4.70 na na 5.25 4.70
2003 na 5.20 na 5.40 5.50 na 5.45 5.45 na 5.50 5.60 5.50
2004 5.50 na 5.50 5.40 5.40 5.40 5.40 5.40 5.40 5..20 na na
2005 na 5.20 na na 5.80 5.90 6.10 na 6.15 6.15 6.10 na
2006 6.10 6.25 6.25 6.00 6.00 6.10 6.10 6.20 6.20 6.10 6.10 6.10
2007 na na na na na 6.10 6.10 6.00 6.00 6.20 6.20 6.20
2008 6.60 6.60 6.70 6.70 6.70 6.70 6.70 6.70 6.70 6.70 6.70 6.30
2009 6.30 na 6.80 6.90 6.80 6.90 7.20 7.40 7.60 7.80 7.80 8.00
2010 8.00
AN 010211.1001.
Source: EPR - 20100115.
J F M A M J J A S O N D
40-50 pc/lb
2007 4.87 4.87
2008 5.35 5.35 5.35 5.35 5.90 5.90 6.75 7.15 7.15 6.50 5.80 4.40
2009 4.90 na 4.70 5.00 5.30 4.90 5.30 4.65 5.00 5.20 5.10 4.10
2010 5.05 5.40
J F M A M J J A S O N D
50-60
2007 3.92 3.92
2008 4.30 4.40 4.40 4.40 4.90 4.90 5.55 6.30 6.30 5.40 5.20 4.20
2009 4.55 na 4.40 4.60 4.90 4.50 4.90 4.55 4.50 na 7.20 8.00
2010 4.65 4.85
J F M A M J J A S O N D
70-80
2007 3.87 3.87
2008 4.00 4.05 4.05 4.05 4.60 4.60 4.80 5.50 5.50 5.30 4.50 4.00
2009 3.80 na 3.80 3.90 3.95 3.90 na 3.85 4.00 4.00 4.00 4.00
2010 4.15 na
Source: EPR - 20100115.
J F M A M J J A S O N D
2003 na 5.96 5.71 5.62 5.62 5.62 5.58 5.58 4.81 5.36 5.36 5.36
2004 5.36 5.36 5.36 5.54 5.14 5.27 5.27 5.27 5.27 6.00 5.00 4.70
2005 5.05 5.05 4.70 5.95 4.75 4.60 4.23 4.31 5.20 5.20 5.45 4.85
2006 4.85 5.05 5.45 5.20 5.25 5.25 5.95 5.25 5.20 5.30 5.65 6.20
2007 6.20 4.90 4.90 na na na na na na na na na
2008 na na na na na 5.45 5.51 5.51 5.02 5.45 5.55 5.55
2009 5.25 5.25 5.20 5.20 5.15 5.10 na na 5.25 5.25 na na
2010 na
AN 151108.1001
Source: EPR - 20100115.
Monthly Penaeus spp. prices, in Italy, origin India, in USD/kg
in Europe, origin China, in USD/kg
Monthly Vannamei prices, head-on, shell-onin Europe, origin: South America, in USD/kg
Monthly Chinese mud shrimp prices
21
5/13/2018 Globefish Commodity Update Shrimp 2010 - slidepdf.com
http://slidepdf.com/reader/full/globefish-commodity-update-shrimp-2010 28/78
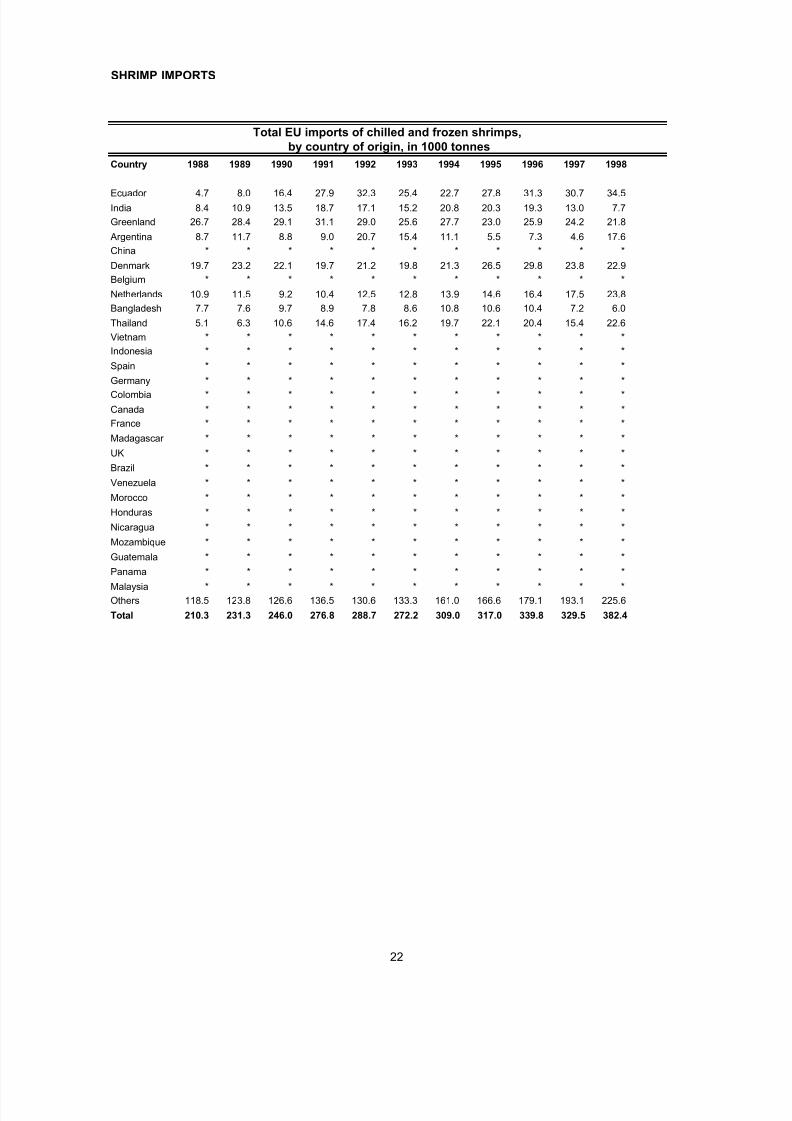
SHRIMP IMPORTS
Country 1988 1989 1990 1991 1992 1993 1994 1995 1996 1997 1998
Ecuador 4.7 8.0 16.4 27.9 32.3 25.4 22.7 27.8 31.3 30.7 34.5
India 8.4 10.9 13.5 18.7 17.1 15.2 20.8 20.3 19.3 13.0 7.7
Greenland 26.7 28.4 29.1 31.1 29.0 25.6 27.7 23.0 25.9 24.2 21.8
Argentina 8.7 11.7 8.8 9.0 20.7 15.4 11.1 5.5 7.3 4.6 17.6
China * * * * * * * * * * *
Denmark 19.7 23.2 22.1 19.7 21.2 19.8 21.3 26.5 29.8 23.8 22.9
Belgium * * * * * * * * * * *
Netherlands 10.9 11.5 9.2 10.4 12.5 12.8 13.9 14.6 16.4 17.5 23.8
Bangladesh 7.7 7.6 9.7 8.9 7.8 8.6 10.8 10.6 10.4 7.2 6.0
Thailand 5.1 6.3 10.6 14.6 17.4 16.2 19.7 22.1 20.4 15.4 22.6
Vietnam * * * * * * * * * * *
Indonesia * * * * * * * * * * *Spain * * * * * * * * * * *
Germany * * * * * * * * * * *
Colombia * * * * * * * * * * *
Canada * * * * * * * * * * *
France * * * * * * * * * * *
Madagascar * * * * * * * * * * *
UK * * * * * * * * * * *
Brazil * * * * * * * * * * *
Venezuela * * * * * * * * * * *
Morocco * * * * * * * * * * *
Honduras * * * * * * * * * * *
Nicaragua * * * * * * * * * * *
Mozambique * * * * * * * * * * *
Guatemala * * * * * * * * * * *
Panama * * * * * * * * * * *
Malaysia * * * * * * * * * * *
Others 118.5 123.8 126.6 136.5 130.6 133.3 161.0 166.6 179.1 193.1 225.6
Total 210.3 231.3 246.0 276.8 288.7 272.2 309.0 317.0 339.8 329.5 382.4
Total EU imports of chilled and frozen shrimps,
by country of origin, in 1000 tonnes
22

5/13/2018 Globefish Commodity Update Shrimp 2010 - slidepdf.com
http://slidepdf.com/reader/full/globefish-commodity-update-shrimp-2010 29/78
Country 1999 2000 2001 2002 2003 2004 2005 2006 2007 2008
Ecuador 29.1 10.8 13.3 12.7 19.2 30.6 43.1 55.3 62.9 73.8
India 13.3 17.7 17.4 33.1 40.2 34.8 38.4 46.8 49.3 52.5
Greenland 23.6 28.1 33.0 55.5 56.0 57.4 58.3 61.9 56.1 51.5
Argentina 14.5 26.4 49.6 47.8 39.5 27.5 6.6 31.9 45.3 38.6
China 17.4 24.1 20.7 2.9 1.1 3.5 33.5 38.2 37.3 34.9
Denmark 23.8 23.9 24.5 27.0 28.9 29.7 30.7 32.1 34.2 33.2
Belgium 14.8 13.9 13.7 16.7 23.1 21.0 17.5 23.3 22.6 30.5
Netherlands 20.8 21.7 26.1 36.3 33.5 37.6 35.4 31.8 32.5 28.7
Bangladesh 10.1 13.5 15.3 18.7 22.3 20.6 23.7 26.3 26.9 27.9
Thailand 9.8 9.7 8.0 2.4 0.7 2.1 4.8 8.2 16.4 23.0
Vietnam * * * * * * 12.8 14.0 14.6 21.1
Indonesia * * * * * * 20.0 18.9 18.6 18.7
Spain 7.8 10.6 13.9 15.6 14.2 17.4 11.8 15.6 22.8 17.9
Germany * * * * * * 14.7 11.9 12.9 13.5
Colombia * * * * * * 11.9 11.8 12.3 12.9
Canada 13.3 12.7 15.4 10.6 14.7 15.7 20.3 21.4 24.1 11.9
France * * * * * * 12.1 11.5 14.5 11.6
Madagascar * * * * * * 10.1 10.5 9.8 10.2
UK 16.1 17.0 17.7 19.2 18 15.7 11.6 12.9 11.7 9.6
Brazil * * * * 37.1 42.8 40.1 32.5 18.2 9.6
Venezuela * * * * * * 9.7 8.6 8.7
Morocco * * * * * * * * * 8.6
Honduras * * * * * * * 9.7 10.9 7.3
Nicaragua * * * * * * * * * 7.0
Mozambique * * * * * * 7.8 7.5 8.4 6.4
Guatemala * * * * * * * * * 4.4
Panama * * * * * * * * * 4.3Malaysia * * * * * * 10.3 10.3 8.3 4.0
Others 158.2 175.2 180.4 192.4 209.7 197.6 97.5 82.5 70.6 45.7
Total 372.7 405.1 449.0 490.9 558.2 554.0 573.0 636.5 649.7 628.0
* = included under "Others"
AN 010158. 1002.
Source: EUROSTAT - 20100201.
Total EU imports of chilled and frozen shrimps,
by country of origin, in 1000 tonnes (cont)
23
5/13/2018 Globefish Commodity Update Shrimp 2010 - slidepdf.com
http://slidepdf.com/reader/full/globefish-commodity-update-shrimp-2010 30/78
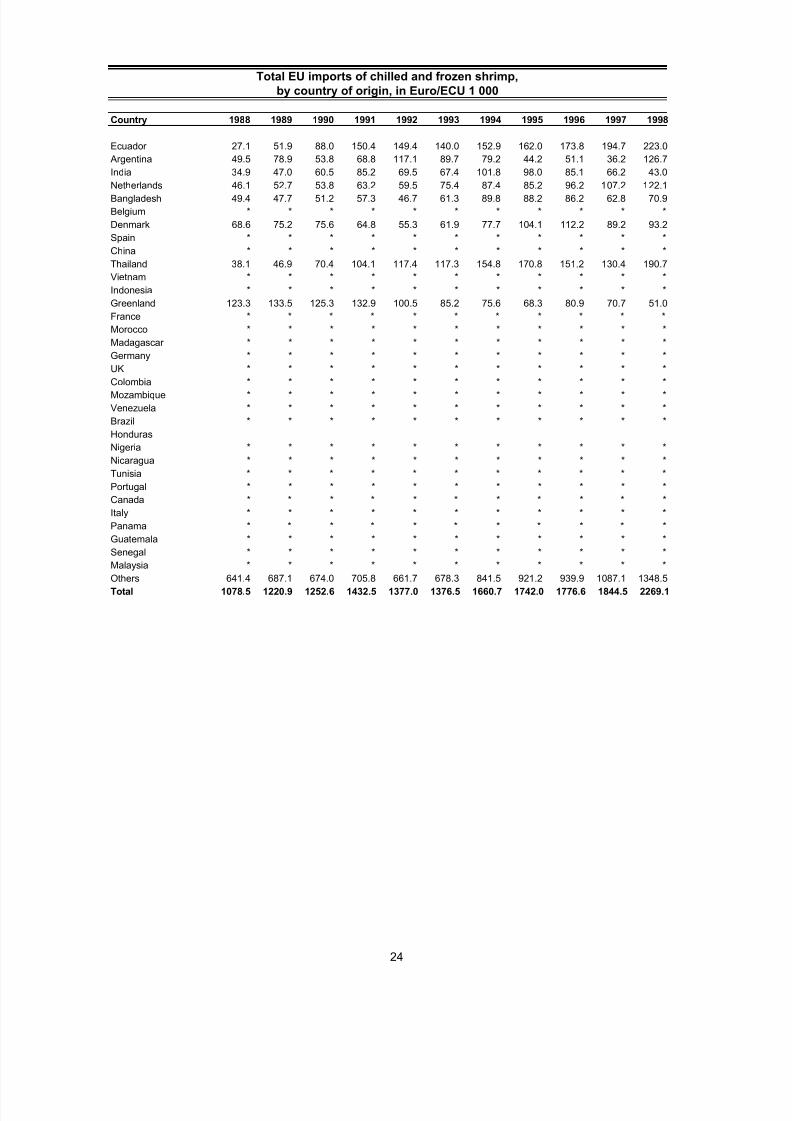
Country 1988 1989 1990 1991 1992 1993 1994 1995 1996 1997 1998
Ecuador 27.1 51.9 88.0 150.4 149.4 140.0 152.9 162.0 173.8 194.7 223.0
Argentina 49.5 78.9 53.8 68.8 117.1 89.7 79.2 44.2 51.1 36.2 126.7
India 34.9 47.0 60.5 85.2 69.5 67.4 101.8 98.0 85.1 66.2 43.0Netherlands 46.1 52.7 53.8 63.2 59.5 75.4 87.4 85.2 96.2 107.2 122.1
Bangladesh 49.4 47.7 51.2 57.3 46.7 61.3 89.8 88.2 86.2 62.8 70.9
Belgium * * * * * * * * * * *
Denmark 68.6 75.2 75.6 64.8 55.3 61.9 77.7 104.1 112.2 89.2 93.2
Spain * * * * * * * * * * *
China * * * * * * * * * * *
Thailand 38.1 46.9 70.4 104.1 117.4 117.3 154.8 170.8 151.2 130.4 190.7
Vietnam * * * * * * * * * * *
Indonesia * * * * * * * * * * *
Greenland 123.3 133.5 125.3 132.9 100.5 85.2 75.6 68.3 80.9 70.7 51.0
France * * * * * * * * * * *
Morocco * * * * * * * * * * *
Madagascar * * * * * * * * * * *
Germany * * * * * * * * * * *UK * * * * * * * * * * *
Colombia * * * * * * * * * * *
Mozambique * * * * * * * * * * *
Venezuela * * * * * * * * * * *
Brazil * * * * * * * * * * *
Honduras
Nigeria * * * * * * * * * * *
Nicaragua * * * * * * * * * * *
Tunisia * * * * * * * * * * *
Portugal * * * * * * * * * * *
Canada * * * * * * * * * * *
Italy * * * * * * * * * * *
Panama * * * * * * * * * * *
Guatemala * * * * * * * * * * *
Senegal * * * * * * * * * * *
Malaysia * * * * * * * * * * *
Others 641.4 687.1 674.0 705.8 661.7 678.3 841.5 921.2 939.9 1087.1 1348.5
Total 1078.5 1220.9 1252.6 1432.5 1377.0 1376.5 1660.7 1742.0 1776.6 1844.5 2269.1
Total EU imports of chilled and frozen shrimp,
by country of origin, in Euro/ECU 1 000
24

5/13/2018 Globefish Commodity Update Shrimp 2010 - slidepdf.com
http://slidepdf.com/reader/full/globefish-commodity-update-shrimp-2010 31/78
Country 1999 2000 2001 2002 2003 2004 2005 2006 2007 2008
Ecuador 183.2 100.1 93.4 75.7 90.7 125.5 185.6 241.5 246.1 312.4
Argentina 113.3 231.3 353.7 283.1 342.8 211.6 73.3 271.2 239.4 253.1
India 73.7 126.8 127.3 160.7 186.9 167.4 184.1 238.9 244.6 227.2
Netherlands 147.6 175.1 211.1 239.4 209.2 213.4 202.6 190.9 203.6 186.6
Bangladesh 101.2 169.2 162.1 171.0 172.7 143.8 156.2 176.1 171.9 151.5
Belgium 96.7 108.3 101.4 109.9 124.2 107.5 95.3 127.9 118.6 144.5
Denmark 105.2 100.9 109.5 113.8 110.2 106.3 113.4 115.1 133.8 142.1
Spain 51.6 94.6 118.4 116.4 107.4 103.0 74.6 99.2 120.4 111.8
China 78.2 125.2 105.3 17.8 9.8 17.3 119.0 141.2 122.9 111.0
Thailand 79.8 97.0 73.5 19.8 5.2 14.9 21.9 42.4 79.2 110.7
Vietnam * * * * * * 76.1 82.7 80.0 105.9
Indonesia 86.2 NA 125.3 77.7 109.3 121.1 110.6 107.2 99.5 93.5
Greenland 55.0 65.1 69.3 103.4 98.4 76.2 79.3 88.3 87.2 93.2
France * * * * * * 91.6 91.6 103.5 87.2
Morocco * * * * * * 61.1 64.1 70.6 85.3
Madagascar * * * * * * 90.8 99.7 88.3 82.6
Germany * * * * * * 60.2 51.4 61.0 73.2
UK 94.0 114.3 116.3 112.8 100.1 81.9 66.0 76.5 70.1 55.7
Colombia * * * * * * * * * 49.1
Mozambique * * * * * * 62.0 59.3 60.8 43.5
Venezuela * * * * * * * * * 36.9
Brazil * * * * 133.9 139.6 140.7 119.3 57.5 33.6
Honduras 33.3
Nigeria * * * * * * * * * 32.6
Nicaragua * * * * * * * * * 30.4
Tunisia * * * * * * * * * 29.4
Portugal * * * * * * * * * 24.7
Canada * * * * * * * * * 23.2
Italy * * * * * * * * * 22.2
Panama * * * * * * * * * 20.2
Guatemala * * * * * * * * * 17.9
Senegal * * * * * * * * * 16.3
Malaysia * * * * * * 50.1 52.3 37.6 16.1
Others 939.8 1366.8 1183.0 1135.4 1123.6 1043.9 643.5 668.1 537.1 152.9
Total 2205.6 2874.9 2949.4 2736.9 2924.4 2673.4 2758.0 3204.7 3033.7 3009.5
* = included under "Others"
AN 010157. 1002.
Source: EUROSTAT - 20100201. .
Total EU imports of chilled and frozen shrimp,
by country of origin, in Euro/ECU 1 000 (cont.)
25

5/13/2018 Globefish Commodity Update Shrimp 2010 - slidepdf.com
http://slidepdf.com/reader/full/globefish-commodity-update-shrimp-2010 32/78
Country 1984 1985 1986 1987 1988 1989 1990 1991 1992 1993 1994 1995
USA 136.7 140.7 160.5 193.6 206.5 218.6 215.8 232.4 256.8 257.5 268.1 251.7
Japan 170.0 184.3 215.5 249.4 260.7 266.5 287.1 289.6 276.8 301.8 304.2 293.9
Spain 12.7 7.6 19.5 39.2 51.7 59.5 71.2 82.0 82.6 90.9 109.1 81.4France 23.5 27.3 30.9 31.6 35.3 37.5 44.0 46.2 50.6 64.7 51.7 56.4
Denmark 29.3 38.7 42.7 45.8 43.5 53.3 50.6 55.6 49.8 48.2 50.6 41.6
Russian Fed 0.0 0.4 1.4 2.5
Italy 12.9 16.1 17.6 16.6 19.5 21.0 23.5 25.0 28.1 21.3 24.2 25.4
Belgium 4.0 5.4 7.0 9.4 10.7 11.9 13.4 13.2 13.7 16.4 21.8 24.3
China 0.5 0.1 0.4 0.2 0.4 2.6 3.3 13.8 12.7
UK 18.4 19.3 24.7 27.1 26.3 26.8 25.5 23.3 21.0 20.0 28.1 27.5
Korea Rep 0.3 0.0 0.1 0.2 0.8 1.5 2.6 1.2 1.3 1.0 4.9 5.5
Canada 13.9 12.0 13.5 14.6 15.4 16.2 17.5 18.2 19.2 19.9 17.0 23.1
Netherlands 6.3 8.7 8.1 10.0 10.6 11.4 9.4 15.2 14.2 14.0 25.0 25.9
Iceland 2.6 5.3 7.8 6.2 3.6 4.5 1.7 4.1
Malaysia 14.0 13.6 12.8 14.9 17.4 21.7 22.6 29.0 26.0 24.2 25.1 27.7
Germany 5.2 5.3 6.0 7.0 9.6 10.7 10.2 11.3 11.2 11.0 13.2 11.2
China, Hong 23.4 28.4 40.9 49.9 71.6 64.9 58.8 49.3 42.4 31.5 36.8 32.0
Others 43.8 51.5 53.8 59.2 68.2 70.8 88.9 91.5 103.0 122.4 125.4 125.7
Total 514.5 558.9 653.8 768.9 850.3 898.0 948.8 989.8 1003.1 1053.2 1122.1 1072.6
Country 1996 1997 1998 1999 2000 2001 2002 2003 2004 2005 2006 2007
USA 238.0 262.7 275.0 281.4 283.3 325.7 332.9 399.6 397.0 397.0 420.3 417.3
Japan 289.7 268.1 239.5 248.2 247.4 245.9 249.6 186.3 242.4 233.6 230.9 208.0
Spain 84.0 78.3 102.3 93.6 114.0 127.0 124.7 140.6 141.4 151.9 176.6 175.6
France 58.5 56.0 63.1 61.8 56.1 61.8 67.1 79.6 89.5 87.7 91.4 93.4
Denmark 53.7 54.7 48.3 50.1 63.9 66.2 79.2 86.4 98.7 106.8 114.5 89.0
Russian Fed 0.1 6.9 6.8 0.0 7.7 12.8 17.9 26.4 34.9 45.0 45.7 67.2
Italy 29.9 26.0 36.9 35.5 40.0 47.1 42.6 47.8 48.8 54.2 64.7 67.1
Belgium 23.3 23.6 22.1 26.0 24.8 26.7 34.1 46.3 49.0 51.2 59.3 61.4China 15.1 14.2 15.2 17.5 57.4 66.6 67.6 68.3 57.9 59.3 57.9 47.4
UK 25.8 26.2 37.0 31.8 36.6 38.1 43.6 43.9 43.1 43.3 42.5 43.5
Korea Rep 10.2 9.6 3.0 6.5 11.2 21.0 23.9 24.5 28.3 31.2 38.7 43.4
Canada 51.5 35.5 43.5 52.1 60.2 67.2 42.2 26.0 33.7 33.9 35.4 40.8
Netherlands 23.9 24.6 33.2 30.3 31.3 33.7 41.1 62.7 44.9 46.2 40.9 40.6
Iceland 3.5 4.8 13.0 27.6 34.8 37.5 41.7 43.2 53.2 46.1 38.3 35.9
Malaysia 20.9 23.8 23.1 19.9 16.5 24.0 56.0 32.9 42.5 37.5 27.1 29.5
Germany 10.6 10.2 12.0 12.0 14.7 16.0 12.8 13.9 17.2 20.6 22.7 28.7
China, Hong 32.6 26.8 25.9 26.6 36.3 31.4 31.1 25.7 22.9 22.7 28.2 28.0
Others 125.3 125.9 152.0 156.3 176.1 179.0 191.9 207.0 240.5 227.1 240.1 316.8
Total 1096.8 1077.9 1151.9 1177.3 1312.2 1427.6 1500.0 1561.2 1685.9 1695.1 1775.3 1833.5
AN 010156. 1001.
Source: Fishstat Plus - 20100115.
Yearly chilled and frozen shrimp imports, by major
importing countries, in 1 000 tonnes
26
5/13/2018 Globefish Commodity Update Shrimp 2010 - slidepdf.com
http://slidepdf.com/reader/full/globefish-commodity-update-shrimp-2010 33/78
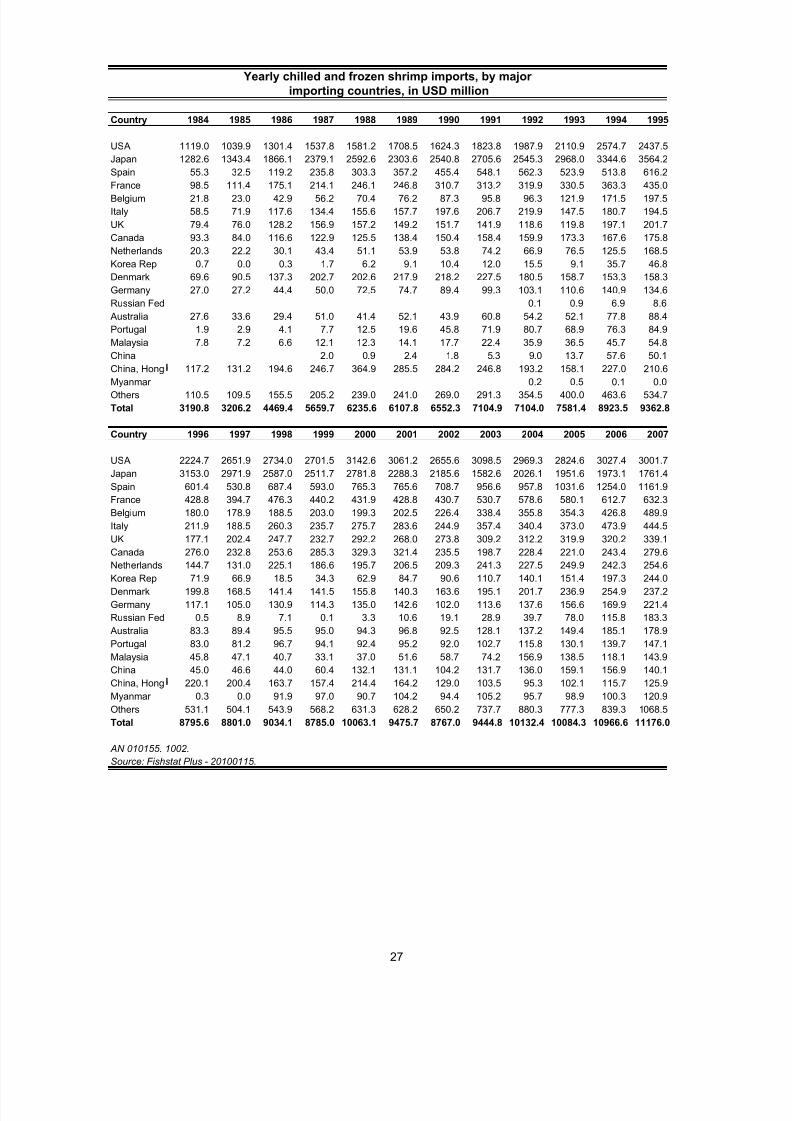
Country 1984 1985 1986 1987 1988 1989 1990 1991 1992 1993 1994 1995
USA 1119.0 1039.9 1301.4 1537.8 1581.2 1708.5 1624.3 1823.8 1987.9 2110.9 2574.7 2437.5
Japan 1282.6 1343.4 1866.1 2379.1 2592.6 2303.6 2540.8 2705.6 2545.3 2968.0 3344.6 3564.2
Spain 55.3 32.5 119.2 235.8 303.3 357.2 455.4 548.1 562.3 523.9 513.8 616.2France 98.5 111.4 175.1 214.1 246.1 246.8 310.7 313.2 319.9 330.5 363.3 435.0
Belgium 21.8 23.0 42.9 56.2 70.4 76.2 87.3 95.8 96.3 121.9 171.5 197.5
Italy 58.5 71.9 117.6 134.4 155.6 157.7 197.6 206.7 219.9 147.5 180.7 194.5
UK 79.4 76.0 128.2 156.9 157.2 149.2 151.7 141.9 118.6 119.8 197.1 201.7
Canada 93.3 84.0 116.6 122.9 125.5 138.4 150.4 158.4 159.9 173.3 167.6 175.8
Netherlands 20.3 22.2 30.1 43.4 51.1 53.9 53.8 74.2 66.9 76.5 125.5 168.5
Korea Rep 0.7 0.0 0.3 1.7 6.2 9.1 10.4 12.0 15.5 9.1 35.7 46.8
Denmark 69.6 90.5 137.3 202.7 202.6 217.9 218.2 227.5 180.5 158.7 153.3 158.3
Germany 27.0 27.2 44.4 50.0 72.5 74.7 89.4 99.3 103.1 110.6 140.9 134.6
Russian Fed 0.1 0.9 6.9 8.6
Australia 27.6 33.6 29.4 51.0 41.4 52.1 43.9 60.8 54.2 52.1 77.8 88.4
Portugal 1.9 2.9 4.1 7.7 12.5 19.6 45.8 71.9 80.7 68.9 76.3 84.9
Malaysia 7.8 7.2 6.6 12.1 12.3 14.1 17.7 22.4 35.9 36.5 45.7 54.8
China 2.0 0.9 2.4 1.8 5.3 9.0 13.7 57.6 50.1China, Hong 117.2 131.2 194.6 246.7 364.9 285.5 284.2 246.8 193.2 158.1 227.0 210.6
Myanmar 0.2 0.5 0.1 0.0
Others 110.5 109.5 155.5 205.2 239.0 241.0 269.0 291.3 354.5 400.0 463.6 534.7
Total 3190.8 3206.2 4469.4 5659.7 6235.6 6107.8 6552.3 7104.9 7104.0 7581.4 8923.5 9362.8
Country 1996 1997 1998 1999 2000 2001 2002 2003 2004 2005 2006 2007
USA 2224.7 2651.9 2734.0 2701.5 3142.6 3061.2 2655.6 3098.5 2969.3 2824.6 3027.4 3001.7
Japan 3153.0 2971.9 2587.0 2511.7 2781.8 2288.3 2185.6 1582.6 2026.1 1951.6 1973.1 1761.4
Spain 601.4 530.8 687.4 593.0 765.3 765.6 708.7 956.6 957.8 1031.6 1254.0 1161.9
France 428.8 394.7 476.3 440.2 431.9 428.8 430.7 530.7 578.6 580.1 612.7 632.3
Belgium 180.0 178.9 188.5 203.0 199.3 202.5 226.4 338.4 355.8 354.3 426.8 489.9
Italy 211.9 188.5 260.3 235.7 275.7 283.6 244.9 357.4 340.4 373.0 473.9 444.5
UK 177.1 202.4 247.7 232.7 292.2 268.0 273.8 309.2 312.2 319.9 320.2 339.1
Canada 276.0 232.8 253.6 285.3 329.3 321.4 235.5 198.7 228.4 221.0 243.4 279.6
Netherlands 144.7 131.0 225.1 186.6 195.7 206.5 209.3 241.3 227.5 249.9 242.3 254.6
Korea Rep 71.9 66.9 18.5 34.3 62.9 84.7 90.6 110.7 140.1 151.4 197.3 244.0
Denmark 199.8 168.5 141.4 141.5 155.8 140.3 163.6 195.1 201.7 236.9 254.9 237.2
Germany 117.1 105.0 130.9 114.3 135.0 142.6 102.0 113.6 137.6 156.6 169.9 221.4
Russian Fed 0.5 8.9 7.1 0.1 3.3 10.6 19.1 28.9 39.7 78.0 115.8 183.3
Australia 83.3 89.4 95.5 95.0 94.3 96.8 92.5 128.1 137.2 149.4 185.1 178.9
Portugal 83.0 81.2 96.7 94.1 92.4 95.2 92.0 102.7 115.8 130.1 139.7 147.1
Malaysia 45.8 47.1 40.7 33.1 37.0 51.6 58.7 74.2 156.9 138.5 118.1 143.9
China 45.0 46.6 44.0 60.4 132.1 131.1 104.2 131.7 136.0 159.1 156.9 140.1
China, Hong 220.1 200.4 163.7 157.4 214.4 164.2 129.0 103.5 95.3 102.1 115.7 125.9
Myanmar 0.3 0.0 91.9 97.0 90.7 104.2 94.4 105.2 95.7 98.9 100.3 120.9
Others 531.1 504.1 543.9 568.2 631.3 628.2 650.2 737.7 880.3 777.3 839.3 1068.5Total 8795.6 8801.0 9034.1 8785.0 10063.1 9475.7 8767.0 9444.8 10132.4 10084.3 10966.6 11176.0
AN 010155. 1002.
Source: Fishstat Plus - 20100115.
Yearly chilled and frozen shrimp imports, by major
importing countries, in USD million
27

5/13/2018 Globefish Commodity Update Shrimp 2010 - slidepdf.com
http://slidepdf.com/reader/full/globefish-commodity-update-shrimp-2010 34/78
Country 1988 1989 1990 1991 1992 1993 1994 1995 1996 1997 1998
Greenland 36.6 38.3 40.8 41.0 41.9 35.2 44.6 35.1 39.4 35.8 33.0
Ecuador 4.8 8.0 16.4 27.9 32.3 25.4 22.7 27.8 31.4 30.7 35.5
India 8.8 11.4 13.8 19.2 17.8 15.9 21.8 22.0 20.2 13.8 8.8
Denmark 32.9 35.7 35.5 35.3 37.0 33.6 33.7 38.5 43.0 36.6 37.5
Netherlands 17.2 20.0 18.4 20.4 24.4 20.4 21.5 22.5 24.1 27.0 35.3
Thailand 15.4 14.5 21.3 24.9 27.3 25.9 29.8 32.9 31.9 24.3 34.9
Argentina 8.7 11.7 8.8 9.0 20.7 15.4 11.1 5.5 7.3 4.6 17.7
China 4.7 5.0 7.2 5.3 5.8 4.7 6.0 5.9 4.1 8.2 15.8
Belgium 7.5 8.2 8.6 8.5 8.7 10.7 13.7 15.6 14.8 16.9 17.6
Canada 5.5 8.8 5.3 9.2 10.9 8.7 11.0 12.7 16.0 17.2 18.9
Bangladesh * * * * * * * * * * *
Vietnam * * * * * * * * * * *
Indonesia * * * * * * * * * * *
Spain * * * * * * * * * * *
Germany * * * * * * * * * * *
France * * * * * * * * * * *
Colombia * * * * * * * * * * *
Morocco * * * * * * * * * * *Iceland 8.9 8.0 9.4 13.4 14.9 17.5 26.4 25.9 32.1 33.5 27.8
UK 8.6 11.4 12.8 13.4 13.0 13.3 14.6 16.8 15.7 14.9 17.2
Norway * * * * * * * * * 18.5 20.8
Madagascar * * * * * * * * * * *
Brazil * * * * * * * * * * *
Honduras * * * * * * * * * * *
Venezuela * * * * * * * * * * *
Nicaragua * * * * * * * * * * *
Mozambique * * * * * * * * * * *
Malaysia * * * * * * * * * * *
Faeroe Is. * * * * * * * * * * *
Others 120.8 130.3 135.9 138.9 136.6 133.3 149.2 159.2 170.0 162.4 193.8
Total 280.4 311.3 334.1 366.5 391.4 360.0 406.1 420.5 449.9 444.5 514.5
EU imports of shrimps (all product types), by country of origin, in 1000 tonnes
28
5/13/2018 Globefish Commodity Update Shrimp 2010 - slidepdf.com
http://slidepdf.com/reader/full/globefish-commodity-update-shrimp-2010 35/78
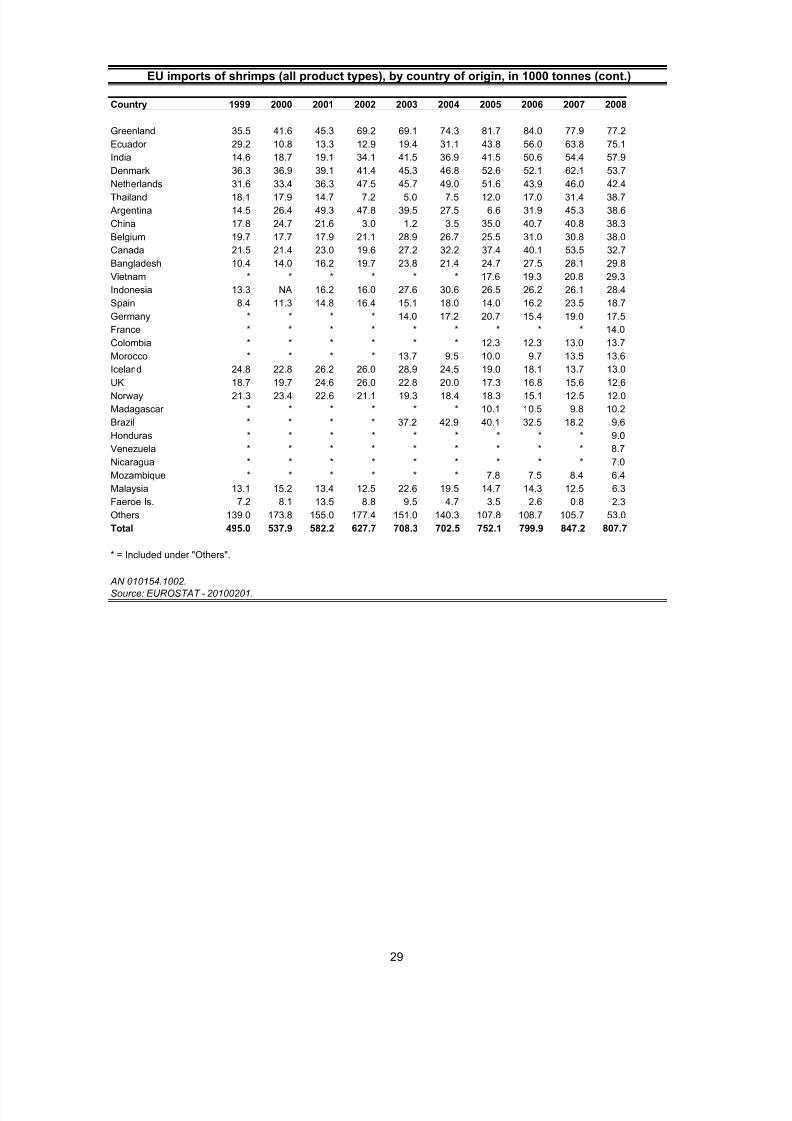
Country 1999 2000 2001 2002 2003 2004 2005 2006 2007 2008
Greenland 35.5 41.6 45.3 69.2 69.1 74.3 81.7 84.0 77.9 77.2
Ecuador 29.2 10.8 13.3 12.9 19.4 31.1 43.8 56.0 63.8 75.1
India 14.6 18.7 19.1 34.1 41.5 36.9 41.5 50.6 54.4 57.9
Denmark 36.3 36.9 39.1 41.4 45.3 46.8 52.6 52.1 62.1 53.7
Netherlands 31.6 33.4 36.3 47.5 45.7 49.0 51.6 43.9 46.0 42.4
Thailand 18.1 17.9 14.7 7.2 5.0 7.5 12.0 17.0 31.4 38.7
Argentina 14.5 26.4 49.3 47.8 39.5 27.5 6.6 31.9 45.3 38.6
China 17.8 24.7 21.6 3.0 1.2 3.5 35.0 40.7 40.8 38.3
Belgium 19.7 17.7 17.9 21.1 28.9 26.7 25.5 31.0 30.8 38.0
Canada 21.5 21.4 23.0 19.6 27.2 32.2 37.4 40.1 53.5 32.7
Bangladesh 10.4 14.0 16.2 19.7 23.8 21.4 24.7 27.5 28.1 29.8
Vietnam * * * * * * 17.6 19.3 20.8 29.3
Indonesia 13.3 NA 16.2 16.0 27.6 30.6 26.5 26.2 26.1 28.4
Spain 8.4 11.3 14.8 16.4 15.1 18.0 14.0 16.2 23.5 18.7
Germany * * * * 14.0 17.2 20.7 15.4 19.0 17.5
France * * * * * * * * * 14.0
Colombia * * * * * * 12.3 12.3 13.0 13.7
Morocco * * * * 13.7 9.5 10.0 9.7 13.5 13.6Iceland 24.8 22.8 26.2 26.0 28.9 24.5 19.0 18.1 13.7 13.0
UK 18.7 19.7 24.6 26.0 22.8 20.0 17.3 16.8 15.6 12.6
Norway 21.3 23.4 22.6 21.1 19.3 18.4 18.3 15.1 12.5 12.0
Madagascar * * * * * * 10.1 10.5 9.8 10.2
Brazil * * * * 37.2 42.9 40.1 32.5 18.2 9.6
Honduras * * * * * * * * * 9.0
Venezuela * * * * * * * * * 8.7
Nicaragua * * * * * * * * * 7.0
Mozambique * * * * * * 7.8 7.5 8.4 6.4
Malaysia 13.1 15.2 13.4 12.5 22.6 19.5 14.7 14.3 12.5 6.3
Faeroe Is. 7.2 8.1 13.5 8.8 9.5 4.7 3.5 2.6 0.8 2.3
Others 139.0 173.8 155.0 177.4 151.0 140.3 107.8 108.7 105.7 53.0
Total 495.0 537.9 582.2 627.7 708.3 702.5 752.1 799.9 847.2 807.7
* = Included under "Others".
AN 010154.1002.
Source: EUROSTAT - 20100201.
EU imports of shrimps (all product types), by country of origin, in 1000 tonnes (cont.)
29
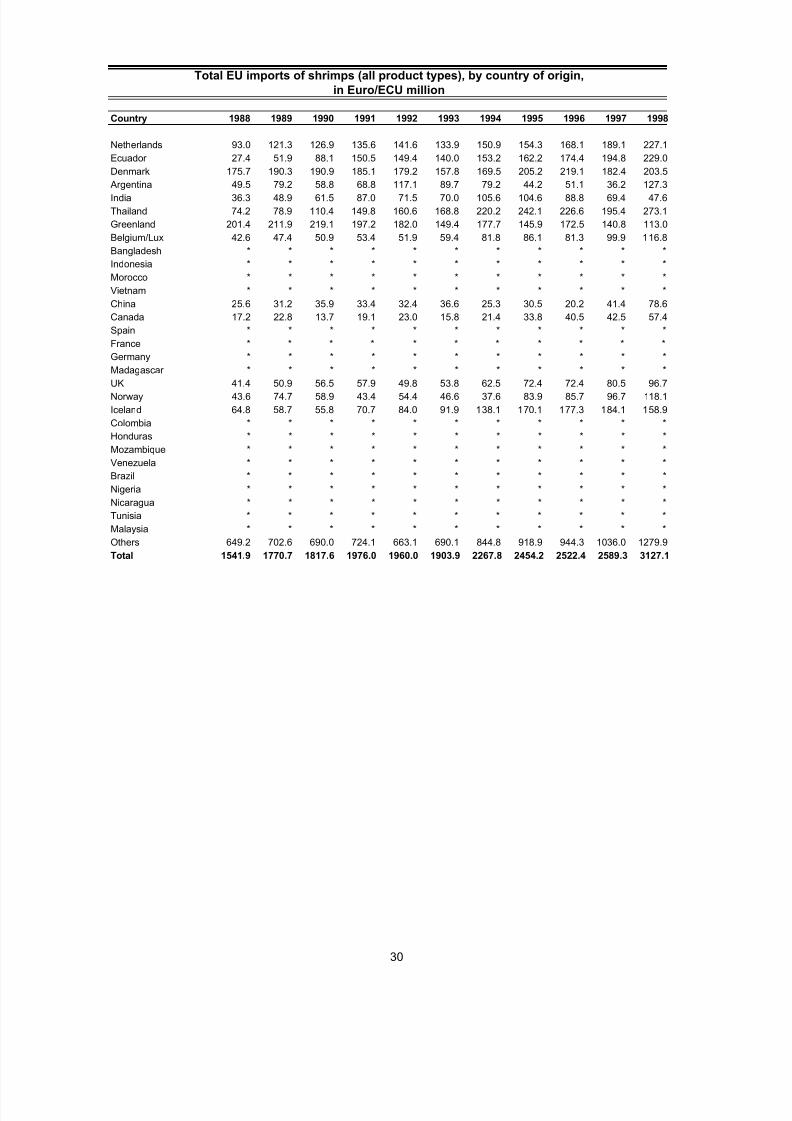
5/13/2018 Globefish Commodity Update Shrimp 2010 - slidepdf.com
http://slidepdf.com/reader/full/globefish-commodity-update-shrimp-2010 36/78
Country 1988 1989 1990 1991 1992 1993 1994 1995 1996 1997 1998
Netherlands 93.0 121.3 126.9 135.6 141.6 133.9 150.9 154.3 168.1 189.1 227.1
Ecuador 27.4 51.9 88.1 150.5 149.4 140.0 153.2 162.2 174.4 194.8 229.0
Denmark 175.7 190.3 190.9 185.1 179.2 157.8 169.5 205.2 219.1 182.4 203.5
Argentina 49.5 79.2 58.8 68.8 117.1 89.7 79.2 44.2 51.1 36.2 127.3
India 36.3 48.9 61.5 87.0 71.5 70.0 105.6 104.6 88.8 69.4 47.6
Thailand 74.2 78.9 110.4 149.8 160.6 168.8 220.2 242.1 226.6 195.4 273.1
Greenland 201.4 211.9 219.1 197.2 182.0 149.4 177.7 145.9 172.5 140.8 113.0
Belgium/Lux 42.6 47.4 50.9 53.4 51.9 59.4 81.8 86.1 81.3 99.9 116.8
Bangladesh * * * * * * * * * * *
Indonesia * * * * * * * * * * *
Morocco * * * * * * * * * * *
Vietnam * * * * * * * * * * *
China 25.6 31.2 35.9 33.4 32.4 36.6 25.3 30.5 20.2 41.4 78.6
Canada 17.2 22.8 13.7 19.1 23.0 15.8 21.4 33.8 40.5 42.5 57.4
Spain * * * * * * * * * * *
France * * * * * * * * * * *
Germany * * * * * * * * * * *Madagascar * * * * * * * * * * *
UK 41.4 50.9 56.5 57.9 49.8 53.8 62.5 72.4 72.4 80.5 96.7
Norway 43.6 74.7 58.9 43.4 54.4 46.6 37.6 83.9 85.7 96.7 118.1
Iceland 64.8 58.7 55.8 70.7 84.0 91.9 138.1 170.1 177.3 184.1 158.9
Colombia * * * * * * * * * * *
Honduras * * * * * * * * * * *
Mozambique * * * * * * * * * * *
Venezuela * * * * * * * * * * *
Brazil * * * * * * * * * * *
Nigeria * * * * * * * * * * *
Nicaragua * * * * * * * * * * *
Tunisia * * * * * * * * * * *
Malaysia * * * * * * * * * * *Others 649.2 702.6 690.0 724.1 663.1 690.1 844.8 918.9 944.3 1036.0 1279.9
Total 1541.9 1770.7 1817.6 1976.0 1960.0 1903.9 2267.8 2454.2 2522.4 2589.3 3127.1
Total EU imports of shrimps (all product types), by country of origin,
in Euro/ECU million
30

5/13/2018 Globefish Commodity Update Shrimp 2010 - slidepdf.com
http://slidepdf.com/reader/full/globefish-commodity-update-shrimp-2010 37/78
Country 1999 2000 2001 2002 2003 2004 2005 2006 2007 2008
Netherlands 257.9 289.9 317.5 357.6 321.9 323.6 341.2 302.7 341.2 333.1
Ecuador 183.6 100.1 93.4 78.5 92.2 127.9 189.8 245.8 251.6 320.5
Denmark 192.3 195.7 213.6 208.2 205.8 204.9 233.3 228.5 277.2 267.7
Argentina 113.3 231.3 353.7 283.1 342.8 211.6 73.4 271.2 239.5 253.1
India 78.3 131.6 134.5 138.6 191.9 174.0 193.8 250.7 260.7 243.4
Thailand 134.3 160.0 125.0 120.1 28.5 42.4 60.3 96.8 168.1 201.7
Greenland 118.3 143.6 134.9 164.6 160.6 154.8 179.7 178.6 176.5 199.4
Belgium/Lux 121.8 127.6 129.3 50.2 156.7 134.7 136.3 169.2 164.5 184.6
Bangladesh 102.8 175.3 170.4 180.4 183.7 148.8 161.6 182.4 178.0 159.8
Indonesia 101.0 NA 148.2 100.0 134.5 147.2 146.4 148.8 139.1 149.3
Morocco * * * * 92.7 78.7 95.6 101.2 127.2 147.5
Vietnam * * * * * * 103.4 113.8 113.3 146.7
China 80.0 128.4 111.4 114.4 10.1 17.5 123.8 152.6 137.3 124.9
Canada 78.5 85.4 75.1 67.0 81.6 101.5 107.6 114.0 159.0 121.7
Spain 54.2 97.6 122.8 105.1 112 105.6 88.1 101.9 123.4 115.4
France 97.6 106.3 95.7 96.2 111.2 108.6 126.4 111.9 126.3 105.8
Germany * * * * 67.5 75.3 86.9 71.4 95.2 101.3Madagascar 66.9 90.8 98.5 96.0 120.7 107.0 91.0 99.8 88.3 82.6
UK 104.6 130.0 155.0 142.2 123.8 102.2 96.2 103.6 92.2 71.5
Norway 126.7 138.9 122.1 186.0 88.1 83.2 84.1 70.7 65.3 67.0
Iceland 147.4 140.5 145.8 176.1 137.8 121.1 91.1 81.1 65.5 65.6
Colombia * * * * * * 52.1 52.4 47.2 53.9
Honduras * * * * * * * * * 44.9
Mozambique * * * * * * 62.0 59.3 60.8 43.5
Venezuela * * * * * * * * * 36.9
Brazil * * * * 134.2 139.7 140.6 119.3 57.5 33.6
Nigeria * * * * * * * * * 32.6
Nicaragua * * * * * * * * * 30.4
Tunisia * * * * * * * * * 29.4
Malaysia 71.2 160.2 89.8 65.8 102.5 83.5 67.6 68.5 54.7 25.2Others 755.6 1085.8 980.5 855.3 748.5 688.5 598.9 601.2 487.4 267.4
Total 2986.4 3719.0 3817.3 3585.4 3749.3 3482.3 3731.5 4097.6 4097.0 4060.1
* = Included under "Others".
Since 1995 EU also includes Sweden, Finland and Austria.
AN 010153.1002.
Source: EUROSTAT - 20100201.
Total EU imports of shrimps (all product types), by country of origin,
in Euro/ECU million (cont.)
31

5/13/2018 Globefish Commodity Update Shrimp 2010 - slidepdf.com
http://slidepdf.com/reader/full/globefish-commodity-update-shrimp-2010 38/78
Country 1980 1981 1982 1983 1984 1985 1986 1987 1988 1989
USA 99.5 101.1 122.6 154.9 155.4 163.3 175.1 217.0 228.6 228.8
Japan 146.5 165.4 154.0 150.3 170.4 184.9 216.5 251.0 264.8 270.9
Spain 10.8 8.8 14.1 12.6 12.7 7.6 19.5 39.2 52.3 60.3Denmark 28.3 28.2 27.3 31.1 38.8 48.8 54.3 58.9 57.3 71.3
France 24.8 24.5 26.9 28.0 23.6 27.4 31.1 31.9 43.2 45.1
UK 17.1 13.2 15.7 17.3 19.4 20.1 25.6 28.6 48.5 51.9
Korea Rep 0.1 0.0 0.1 1.1 0.5 0.7 1.5 2.5 1.9
Belgium 9.6 8.7 8.7 10.3 8.0 9.6 12.2 14.7 15.8 18.1
Italy 6.4 6.2 9.8 11.3 12.9 16.1 17.6 16.6 25.0 25.2
Russian Fed
Canada 10.3 10.4 9.5 12.5 16.5 14.3 16.1 17.7 21.8 22.7
Netherlands 14.9 15.1 13.9 12.2 9.4 12.6 12.7 15.8 17.3 20.7
Germany 5.9 5.3 5.5 6.0 5.2 5.3 6.0 7.0 17.5 19.2
China 2.5 3.0 3.5 4.2 2.9 1.6
China, Hong Kong SAR 19.5 17.1 24.2 24.2 25.9 31.1 44.7 53.4 76.5 68.1
Iceland 2.6 5.3
Malaysia 22.8 21.9 15.4 13.9 17.9 15.4 15.0 18.3 20.0 24.9 Australia 3.9 6.3 7.5 7.7 7.9 9.2 9.4 11.5 10.4 11.9
Sweden 13.3 11.1 13.9 13.7 13.5 13.8 14.1 15.1 15.2 17.1
Morocco
Myanmar
Singapore 3.6 4.8 7.4 13.5 18.0 17.4 20.7 21.8 24.1 23.4
Mexico
Norway 3.7 4.5 6.8 14.3 6.9 14.2 11.9 10.4 10.8 9.9
Portugal 1.0 1.2 1.3 1.0 0.5 0.9 1.4 2.4 3.3 4.4
United Arab Emirates 0.3 0.2
Thailand 9.3 8.2 9.6 11.4 8.7 8.2 7.7 6.6 7.0 6.0
Ukraine
Taiwan Province of China 0.1 0.0 0.0 0.0 0.1 0.3 0.3 3.0
South Africa 0.1 0.3 1.7 1.0Barbados 0.1
Others 6.7 7.3 6.3 7.2 7.5 6.6 8.8 10.3 19.1 18.5
Total 458.0 469.1 500.5 553.6 582.6 630.0 724.9 854.5 988.6 1031.1
in 1 000 tonnes
Yearly shrimp imports (all product types), by major importing countries,
32

5/13/2018 Globefish Commodity Update Shrimp 2010 - slidepdf.com
http://slidepdf.com/reader/full/globefish-commodity-update-shrimp-2010 39/78
Country 1990 1991 1992 1993 1994 1995 1996 1997 1998 1999
USA 228.0 245.2 270.0 272.8 285.1 271.1 264.4 294.3 315.8 332.2
Japan 292.0 297.3 286.1 313.2 319.6 314.5 313.0 293.4 266.9 278.4
Spain 72.2 83.2 83.7 92.1 109.7 82.2 85.2 79.2 103.2 94.5Denmark 70.3 72.9 70.7 64.7 77.1 65.2 76.6 77.3 71.6 76.2
France 54.2 55.6 65.8 74.9 60.8 65.2 67.7 65.5 74.2 73.5
UK 51.4 52.2 54.1 51.9 57.9 57.1 60.7 60.3 73.2 69.3
Korea Rep 2.6 1.2 2.0 2.0 6.2 7.0 13.3 23.2 17.1 25.2
Belgium 18.9 18.6 20.6 21.8 28.0 31.5 30.4 31.4 30.1 33.8
Italy 28.4 30.7 34.2 26.2 28.9 29.0 33.8 30.3 41.9 41.2
Russian Fed 0.0 0.4 1.4 2.5 0.1 6.9 6.8 0.0
Canada 23.5 24.4 25.4 31.0 24.6 29.5 57.8 41.4 49.9 60.5
Netherlands 19.4 25.1 20.2 19.9 31.8 32.4 30.8 32.6 41.2 37.2
Germany 20.4 23.0 24.2 22.3 25.5 23.2 23.4 24.4 26.2 23.9
China 1.5 2.2 4.9 4.3 15.2 14.6 17.0 14.2 15.2 17.5
China, Hong Kong SAR 62.2 52.3 46.1 34.3 39.8 35.3 35.6 30.0 29.2 29.7
Iceland 7.8 6.2 3.6 4.5 1.7 4.1 3.5 4.8 13.0 27.6
Malaysia 24.5 32.2 29.6 27.5 26.9 28.5 22.7 24.4 23.7 20.9 Australia 11.0 13.1 12.5 12.8 13.7 9.0 13.7 13.8 14.8 15.8
Sweden 16.8 18.2 19.5 19.7 21.9 17.2 21.0 20.8 20.0 20.9
Morocco 0.0 0.0 0.1 0.0 0.0 6.9 7.2
Myanmar 0.0 0.1 0.0 0.0 0.1 0.0 13.5 13.8
Singapore 35.0 23.4 23.3 23.2 23.8 19.4 18.6 18.0 16.0 15.5
Mexico 0.3 0.4 2.4 5.2 5.9 3.3 3.1 3.5 13.8 5.0
Norway 9.2 13.6 20.5 28.1 13.9 18.9 18.8 14.4 14.7 18.4
Portugal 7.1 10.2 11.4 10.8 10.7 10.5 10.8 11.5 12.4 13.0
United Arab Emirates 0.5 1.0 0.7 2.0 2.0 0.1 0.2 4.6
Thailand 7.2 15.8 10.4 9.8 16.4 16.7 14.8 17.9 18.5 19.3
Ukraine
Taiwan Province of China 2.0 2.8 8.4 13.9 19.0 17.7 17.1 21.8 16.0 17.3
South Africa 1.4 1.9 1.4 1.4 1.7 1.6 2.0 2.5 1.8 2.0Barbados 0.1 0.1 0.2 0.1 0.1 0.1 0.1 0.1 0.1 0.1
Others 23.9 23.5 23.9 25.6 33.5 35.7 33.7 35.3 36.3 37.5
Total 1091.2 1145.5 1176.2 1215.1 1301.1 1245.3 1291.8 1293.3 1383.9 1431.9
Yearly shrimp (all product types) imports, by major importing countries,
in 1 000 tonnes (cont)
33

5/13/2018 Globefish Commodity Update Shrimp 2010 - slidepdf.com
http://slidepdf.com/reader/full/globefish-commodity-update-shrimp-2010 40/78
Country 2000 2001 2002 2003 2004 2005 2006 2007
USA 345.7 400.9 430.0 504.9 518.9 532.2 593.7 559.9
Japan 283.0 286.5 294.0 229.0 302.8 296.1 302.4 276.6
Spain 115.0 128.0 126.0 142.4 143.8 153.8 178.1 177.6
Denmark 94.8 93.1 107.3 116.5 136.2 147.3 155.4 131.3
France 67.5 73.7 79.5 93.8 101.7 101.1 104.9 107.1
UK 77.9 82.3 86.4 90.7 89.0 90.6 89.1 87.7
Korea Rep 31.1 41.5 50.0 55.4 63.2 61.5 75.1 76.7
Belgium 32.2 32.8 40.0 53.6 57.0 60.3 70.6 74.8
Italy 45.5 53.1 48.0 54.1 56.2 62.1 72.7 74.4
Russian Fed 7.8 12.9 18.1 27.1 35.6 46.1 46.8 69.3
Canada 66.4 73.6 50.5 37.6 47.0 50.2 53.2 58.9
Netherlands 40.3 42.5 50.2 75.9 52.5 54.2 50.9 52.9
Germany 27.6 28.5 23.4 27.0 30.2 35.1 39.2 49.6
China 57.4 66.7 67.7 68.3 58.0 59.4 58.0 48.4
China, Hong Kong SAR 39.6 34.5 37.1 33.8 29.3 30.4 38.0 37.9
Iceland 34.8 37.6 41.8 43.2 53.2 46.1 38.4 35.9
Malaysia 16.8 24.6 56.3 33.1 46.1 40.4 30.2 33.3
Australia 14.5 17.6 17.4 23.5 26.9 29.8 33.6 31.4
Sweden 21.3 22.5 22.8 23.8 25.2 27.4 26.5 28.4
Morocco 8.3 6.0 7.1 8.1 7.3 8.0 10.6 26.4
Myanmar 15.5 19.5 21.5 22.9 23.0 23.7 23.3 25.4
Singapore 15.3 13.8 14.3 16.9 24.4 24.4 23.8 23.1
Mexico 7.0 9.7 9.2 10.8 9.7 14.4 15.3 22.1
Norway 28.0 19.2 19.5 14.1 26.4 18.6 11.5 21.4
Portugal 11.8 13.5 13.4 14.3 15.9 18.8 19.8 20.5
United Arab Emirates 6.2 8.0 9.2 10.1 10.3 7.0 10.0 18.0
Thailand 22.2 28.8 33.7 33.1 23.7 23.7 20.6 15.8
Ukraine 0.3 0.6 1.4 1.5 3.6 9.0 14.1
Taiwan Province of China 16.4 12.6 11.1 7.2 5.6 3.5 2.7 11.6
South Africa 2.3 2.7 2.7 2.7 5.1 7.2 7.8 8.8
Barbados 0.1 0.2 0.2 0.2 0.1 0.2 0.3 8.5
Others 43.1 45.1 51.8 63.6 84.6 75.5 86.5 111.5
Total 1595.4 1732.2 1840.9 1939.1 2110.5 2152.5 2298.0 2339.4
AN 010152. 1001.
Source: Fishstat Plus - 20100115.
Yearly shrimp (all product types) imports, by major importing countries,
in 1 000 tonnes (cont)
34
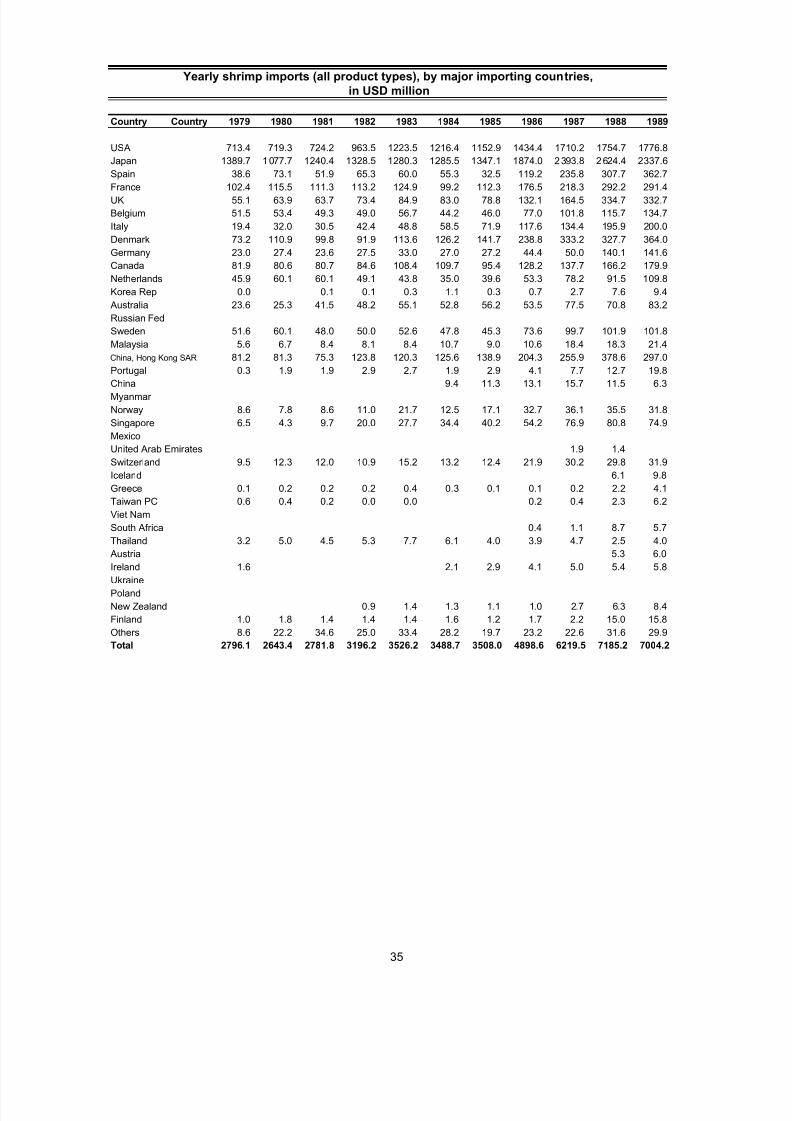
5/13/2018 Globefish Commodity Update Shrimp 2010 - slidepdf.com
http://slidepdf.com/reader/full/globefish-commodity-update-shrimp-2010 41/78
Country Country 1979 1980 1981 1982 1983 1984 1985 1986 1987 1988 1989
USA 713.4 719.3 724.2 963.5 1223.5 1216.4 1152.9 1434.4 1710.2 1754.7 1776.8
Japan 1389.7 1077.7 1240.4 1328.5 1280.3 1285.5 1347.1 1874.0 2393.8 2624.4 2337.6
Spain 38.6 73.1 51.9 65.3 60.0 55.3 32.5 119.2 235.8 307.7 362.7France 102.4 115.5 111.3 113.2 124.9 99.2 112.3 176.5 218.3 292.2 291.4
UK 55.1 63.9 63.7 73.4 84.9 83.0 78.8 132.1 164.5 334.7 332.7
Belgium 51.5 53.4 49.3 49.0 56.7 44.2 46.0 77.0 101.8 115.7 134.7
Italy 19.4 32.0 30.5 42.4 48.8 58.5 71.9 117.6 134.4 195.9 200.0
Denmark 73.2 110.9 99.8 91.9 113.6 126.2 141.7 238.8 333.2 327.7 364.0
Germany 23.0 27.4 23.6 27.5 33.0 27.0 27.2 44.4 50.0 140.1 141.6
Canada 81.9 80.6 80.7 84.6 108.4 109.7 95.4 128.2 137.7 166.2 179.9
Netherlands 45.9 60.1 60.1 49.1 43.8 35.0 39.6 53.3 78.2 91.5 109.8
Korea Rep 0.0 0.1 0.1 0.3 1.1 0.3 0.7 2.7 7.6 9.4
Australia 23.6 25.3 41.5 48.2 55.1 52.8 56.2 53.5 77.5 70.8 83.2
Russian Fed
Sweden 51.6 60.1 48.0 50.0 52.6 47.8 45.3 73.6 99.7 101.9 101.8
Malaysia 5.6 6.7 8.4 8.1 8.4 10.7 9.0 10.6 18.4 18.3 21.4
China, Hong Kong SAR 81.2 81.3 75.3 123.8 120.3 125.6 138.9 204.3 255.9 378.6 297.0Portugal 0.3 1.9 1.9 2.9 2.7 1.9 2.9 4.1 7.7 12.7 19.8
China 9.4 11.3 13.1 15.7 11.5 6.3
Myanmar
Norway 8.6 7.8 8.6 11.0 21.7 12.5 17.1 32.7 36.1 35.5 31.8
Singapore 6.5 4.3 9.7 20.0 27.7 34.4 40.2 54.2 76.9 80.8 74.9
Mexico
United Arab Emirates 1.9 1.4
Switzerland 9.5 12.3 12.0 10.9 15.2 13.2 12.4 21.9 30.2 29.8 31.9
Iceland 6.1 9.8
Greece 0.1 0.2 0.2 0.2 0.4 0.3 0.1 0.1 0.2 2.2 4.1
Taiwan PC 0.6 0.4 0.2 0.0 0.0 0.2 0.4 2.3 6.2
Viet Nam
South Africa 0.4 1.1 8.7 5.7Thailand 3.2 5.0 4.5 5.3 7.7 6.1 4.0 3.9 4.7 2.5 4.0
Austria 5.3
Ireland 1.6 2.1 2.9 4.1 5.0 5.4 5.8
Ukraine
Poland
New Zealand 0.9 1.4 1.3 1.1 1.0 2.7 6.3 8.4
Finland 1.0 1.8 1.4 1.4 1.4 1.6 1.2 1.7 2.2 15.0 15.8
Others 8.6 22.2 34.6 25.0 33.4 28.2 19.7 23.2 22.6 31.6 29.9
Total 2796.1 2643.4 2781.8 3196.2 3526.2 3488.7 3508.0 4898.6 6219.5 7185.2 7004.2
Yearly shrimp imports (all product types), by major importing countries,
in USD million
35
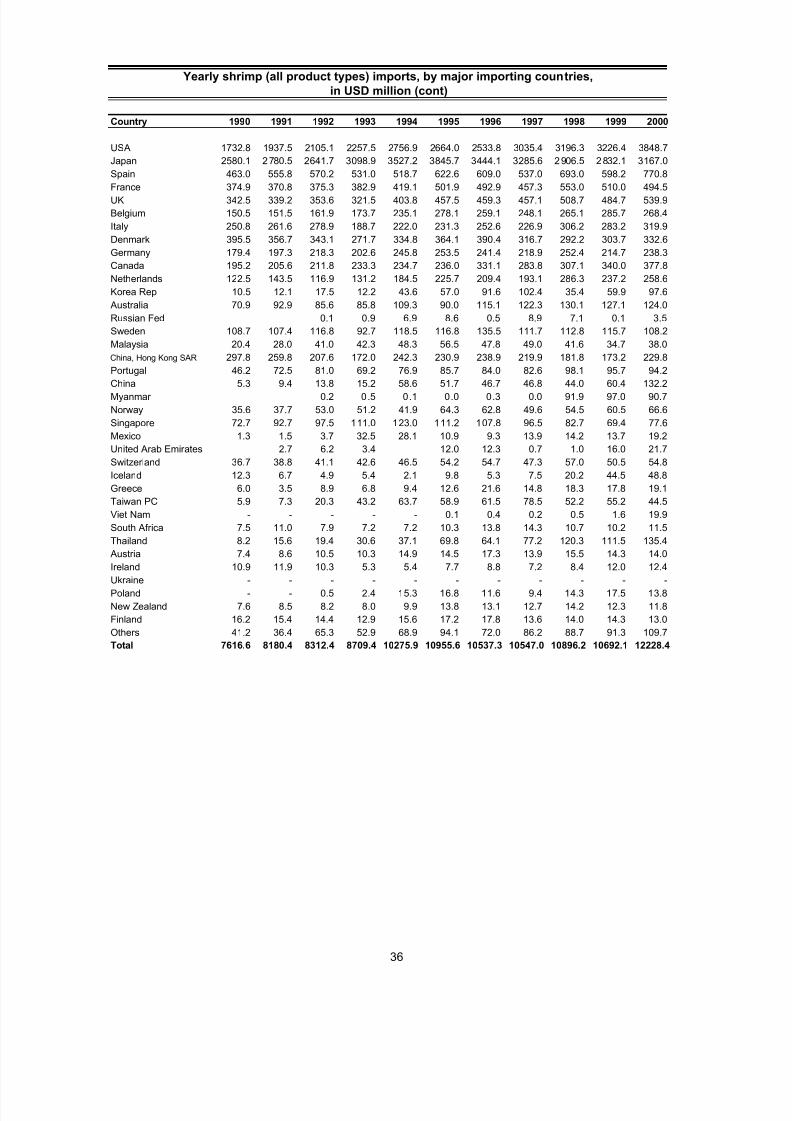
5/13/2018 Globefish Commodity Update Shrimp 2010 - slidepdf.com
http://slidepdf.com/reader/full/globefish-commodity-update-shrimp-2010 42/78
Country 1990 1991 1992 1993 1994 1995 1996 1997 1998 1999 2000
USA 1732.8 1937.5 2105.1 2257.5 2756.9 2664.0 2533.8 3035.4 3196.3 3226.4 3848.7
Japan 2580.1 2780.5 2641.7 3098.9 3527.2 3845.7 3444.1 3285.6 2906.5 2832.1 3167.0
Spain 463.0 555.8 570.2 531.0 518.7 622.6 609.0 537.0 693.0 598.2 770.8France 374.9 370.8 375.3 382.9 419.1 501.9 492.9 457.3 553.0 510.0 494.5
UK 342.5 339.2 353.6 321.5 403.8 457.5 459.3 457.1 508.7 484.7 539.9
Belgium 150.5 151.5 161.9 173.7 235.1 278.1 259.1 248.1 265.1 285.7 268.4
Italy 250.8 261.6 278.9 188.7 222.0 231.3 252.6 226.9 306.2 283.2 319.9
Denmark 395.5 356.7 343.1 271.7 334.8 364.1 390.4 316.7 292.2 303.7 332.6
Germany 179.4 197.3 218.3 202.6 245.8 253.5 241.4 218.9 252.4 214.7 238.3
Canada 195.2 205.6 211.8 233.3 234.7 236.0 331.1 283.8 307.1 340.0 377.8
Netherlands 122.5 143.5 116.9 131.2 184.5 225.7 209.4 193.1 286.3 237.2 258.6
Korea Rep 10.5 12.1 17.5 12.2 43.6 57.0 91.6 102.4 35.4 59.9 97.6
Australia 70.9 92.9 85.6 85.8 109.3 90.0 115.1 122.3 130.1 127.1 124.0
Russian Fed 0.1 0.9 6.9 8.6 0.5 8.9 7.1 0.1 3.5
Sweden 108.7 107.4 116.8 92.7 118.5 116.8 135.5 111.7 112.8 115.7 108.2
Malaysia 20.4 28.0 41.0 42.3 48.3 56.5 47.8 49.0 41.6 34.7 38.0
China, Hong Kong SAR 297.8 259.8 207.6 172.0 242.3 230.9 238.9 219.9 181.8 173.2 229.8Portugal 46.2 72.5 81.0 69.2 76.9 85.7 84.0 82.6 98.1 95.7 94.2
China 5.3 9.4 13.8 15.2 58.6 51.7 46.7 46.8 44.0 60.4 132.2
Myanmar 0.2 0.5 0.1 0.0 0.3 0.0 91.9 97.0 90.7
Norway 35.6 37.7 53.0 51.2 41.9 64.3 62.8 49.6 54.5 60.5 66.6
Singapore 72.7 92.7 97.5 111.0 123.0 111.2 107.8 96.5 82.7 69.4 77.6
Mexico 1.3 1.5 3.7 32.5 28.1 10.9 9.3 13.9 14.2 13.7 19.2
United Arab Emirates 2.7 6.2 3.4 12.0 12.3 0.7 1.0 16.0 21.7
Switzerland 36.7 38.8 41.1 42.6 46.5 54.2 54.7 47.3 57.0 50.5 54.8
Iceland 12.3 6.7 4.9 5.4 2.1 9.8 5.3 7.5 20.2 44.5 48.8
Greece 6.0 3.5 8.9 6.8 9.4 12.6 21.6 14.8 18.3 17.8 19.1
Taiwan PC 5.9 7.3 20.3 43.2 63.7 58.9 61.5 78.5 52.2 55.2 44.5
Viet Nam - - - - - 0.1 0.4 0.2 0.5 1.6 19.9
South Africa 7.5 11.0 7.9 7.2 7.2 10.3 13.8 14.3 10.7 10.2 11.5Thailand 8.2 15.6 19.4 30.6 37.1 69.8 64.1 77.2 120.3 111.5 135.4
Austria 7.4 8.6 10.5 10.3 14.9 14.5 17.3 13.9 15.5 14.3 14.0
Ireland 10.9 11.9 10.3 5.3 5.4 7.7 8.8 7.2 8.4 12.0 12.4
Ukraine - - - - - - - - - - -
Poland - - 0.5 2.4 15.3 16.8 11.6 9.4 14.3 17.5 13.8
New Zealand 7.6 8.5 8.2 8.0 9.9 13.8 13.1 12.7 14.2 12.3 11.8
Finland 16.2 15.4 14.4 12.9 15.6 17.2 17.8 13.6 14.0 14.3 13.0
Others 41.2 36.4 65.3 52.9 68.9 94.1 72.0 86.2 88.7 91.3 109.7
Total 7616.6 8180.4 8312.4 8709.4 10275.9 10955.6 10537.3 10547.0 10896.2 10692.1 12228.4
Yearly shrimp (all product types) imports, by major importing countries,
in USD million (cont)
36

5/13/2018 Globefish Commodity Update Shrimp 2010 - slidepdf.com
http://slidepdf.com/reader/full/globefish-commodity-update-shrimp-2010 43/78
Country 2001 2002 2003 2004 2005 2006 2007
USA 3730.8 3425.7 3896.0 3833.1 3673.0 4140.6 3922.9
Japan 2679.9 2578.6 1946.8 2525.7 2439.3 2520.0 2283.2
Spain 771.4 716.4 967.2 970.3 1041.4 1263.6 1174.0
France 495.8 499.9 617.4 663.6 665.8 703.6 736.1
UK 504.1 503.1 577.3 603.6 616.6 616.9 647.9
Belgium 258.6 288.8 412.2 437.0 451.5 548.8 645.4
Italy 326.5 286.8 409.8 400.8 436.0 539.4 511.3
Denmark 274.5 307.4 358.7 419.1 463.7 472.4 490.2
Germany 241.6 186.3 216.5 249.5 276.0 304.4 415.5
Canada 366.5 292.5 279.0 316.5 324.0 360.6 404.3
Netherlands 259.3 263.7 307.5 280.6 308.6 315.0 358.1
Korea Rep 129.7 135.9 159.3 202.4 214.0 279.6 329.8
Australia 128.4 120.6 156.1 174.0 194.8 228.4 233.6
Russian Fed 10.9 19.8 29.9 40.9 81.0 120.0 194.1
Sweden 100.7 104.3 122.0 127.8 140.1 142.7 184.3
Malaysia 52.2 59.7 74.6 171.6 147.9 126.8 156.7
China, Hong Kong SAR 179.0 157.7 135.0 113.4 123.3 143.1 152.4
Portugal 97.5 94.3 107.4 119.9 134.3 142.9 151.2
China 131.3 104.5 131.7 136.3 159.5 157.4 148.3
Myanmar 104.2 94.4 105.2 95.7 98.9 100.3 120.9
Norway 53.5 52.5 50.5 72.1 63.4 55.4 99.0
Singapore 57.6 57.8 63.6 128.4 91.9 95.9 94.4
Mexico 34.0 44.6 52.7 46.1 69.3 74.4 92.9
United Arab Emirates 27.2 32.9 39.7 50.5 30.5 56.7 86.5
Switzerland 58.0 41.0 52.7 59.2 59.3 67.3 81.2
Iceland 42.9 49.1 55.5 81.7 65.4 55.9 66.0
Greece 22.2 22.9 32.5 34.9 36.7 42.3 54.9
Taiwan PC 34.9 25.6 17.3 14.0 10.7 9.2 47.1
Viet Nam 20.5 36.6 52.7 74.1 54.6 42.0 45.2
South Africa 13.1 10.4 13.4 25.3 36.4 40.9 44.8
Thailand 156.5 169.2 154.7 90.9 78.3 78.5 43.4
Austria 13.3 13.4 17.0 21.5 21.4 25.2 35.0
Ireland 14.5 14.1 14.4 16.7 19.2 25.6 31.3
Ukraine 0.8 1.4 2.0 1.8 6.7 19.2 30.1
Poland 13.8 13.7 17.8 26.3 19.3 20.9 28.2
New Zealand 9.5 11.8 13.3 16.0 21.3 20.6 26.4
Finland 12.6 11.6 14.2 15.6 15.4 17.3 23.8
Others 120.1 125.3 157.3 204.4 184.2 238.3 331.3
Total 11547.7 10974.2 11831.0 12861.4 12873.6 14212.1 14521.6
AN 010151. 1001.
Source: Fishstat Plus - 20100115.
Yearly shrimp (all product types) imports, by major importing countries,
in USD million (cont)
37

5/13/2018 Globefish Commodity Update Shrimp 2010 - slidepdf.com
http://slidepdf.com/reader/full/globefish-commodity-update-shrimp-2010 44/78
Country 1982 1983 1984 1985 1986 1987 1988 1989 1990 1991
Ecuador 0.0 0.0 0.0 0.2 0.1 0.5 2.1 5.8 11.7 20.4
China - - - - - - 0.1 0.3 0.7 1.1
Argentina 2.3 3.8 3.2 0.3 4.3 1.0 5.8 6.9 4.9 5.1
Colombia - - - - 0.3 0.4 0.7 1.5 2.2 2.3
Morocco 0.6 0.4 0.6 0.8 - 0.7 2.0 3.0 3.7 4.0
Nicaragua ** ** ** ** ** ** ** ** ** **
Thailand - - - - - 0.2 0.1 0.4 1.4 2.1
Mozambique 1.8 1.1 0.4 0.0 1.0 2.5 5.9 2.7 2.4 4.9
Venezuela ** ** ** ** ** ** ** ** ** **
Netherlands ** ** ** ** ** ** ** ** ** **
Honduras ** ** ** ** ** ** ** ** ** **
France - - - - - - 0.4 0.6 0.5 0.7
Senegal 1.1 0.6 0.5 0.1 1.3 1.6 3.9 2.0 1.3 0.6
Cuba ** ** ** ** ** ** ** ** ** **
India - 0.1 - - 0.1 0.2 0.7 0.8 1.9 3.6
Brazil - - - - - - 0.4 0.7 0.5 0.4
Tunisia 0.8 1.3 0.9 0.7 1.5 2.3 1.7 1.2 1.2 1.3
Angola - - - - - - 6.4 1.5 0.2 0.3UK - - - - - - 1.5 2.5 4.3 4.4
Iran - - - - - - 0.0 0.0 0.0 0.0
Malaysia - 0.1 - - 0.1 0.3 0.5 1.1 1.4 1.9
Indonesia * * * * * * * * * *
Australia 0.3 0.5 0.0 0.1 1.5 2.1 1.6 3.2 3.3 3.0
Others 11.3 7.3 7.5 6.1 9.8 15.3 19.9 23.7 26.7 25.2
Total* 17.9 14.6 13.1 8.2 18.4 24.7 50.1 51.1 59.3 72.0
Country 1992 1993 1994 1995 1996 1997 1998 1999 2000 2001
Ecuador 20.6 13.5 11.5 13.8 14.1 10.8 12.7 8.7 2.9 3.5
China 1.9 0.9 2.0 3.1 2.3 5.5 11.1 13.8 17.4 14.5
Argentina 15.1 11.5 8.3 4.7 6.6 3.6 12.3 8.1 18.7 37.3
Colombia 2.6 3.1 3.4 3.8 3.6 3.2 3.1 4.3 4.8 6.3
Morocco 3.6 4.2 6.1 6.2 4.7 5.1 7.1 8.6 9.1 7.9
Nicaragua ** ** ** ** ** ** ** ** ** **
Thailand 2.5 2.5 2.6 2.8 2.5 1.3 1.3 0.6 0.6 0.3
Mozambique 4.2 4.6 4.6 4.4 4.8 5.9 4.8 4.4 5.1 4.6
Venezuela ** ** ** ** ** ** ** ** ** **
Netherlands ** ** ** ** ** ** ** ** ** **
Honduras ** ** ** ** ** ** ** ** ** **
France 0.6 1.5 1.8 1.5 2.2 2.1 2.8 2.3 4.2 2.1
Senegal 0.9 0.7 0.9 0.7 1.7 2.8 4.2 3.7 3.4 3.3
Cuba ** ** ** ** ** ** ** ** ** **
India 3.4 2.5 1.7 1.4 1.5 0.8 0.6 0.6 0.7 1.0
Brazil 0.2 0.2 0.3 0.1 0.0 0.0 0.2 0.9 3.1 3.8
Tunisia 1.3 1.4 1.6 2.1 2.1 2.5 2.9 3.1 4.3 2.6 Angola 0.8 1.7 3.6 3.0 2.9 4.0 3.3 2.0 3.0 3.2
UK 4.2 5.4 5.4 4.8 4.2 3.8 3.7 3.0 2.8 3.0
Iran 0.0 0.1 0.9 0.6 0.6 1.0 1.4 2.2 2.8 1.7
Malaysia 2.1 1.7 1.9 2.4 1.2 1.3 1.0 1.3 1.5 0.8
Indonesia * * * * * * * * * *
Australia 1.6 0.5 0.3 1.3 0.6 0.4 1.4 1.2 1.3 1.5
Others 25.5 26.8 28.2 23.8 26.2 25.1 29.3 25.7 29.3 35.9
Total* 83.2 75.1 76.6 80.5 81.8 79.2 103.2 94.5 115.0 133.3
Spanish shrimp imports, by country of origin, in 1 000 tonnes
38
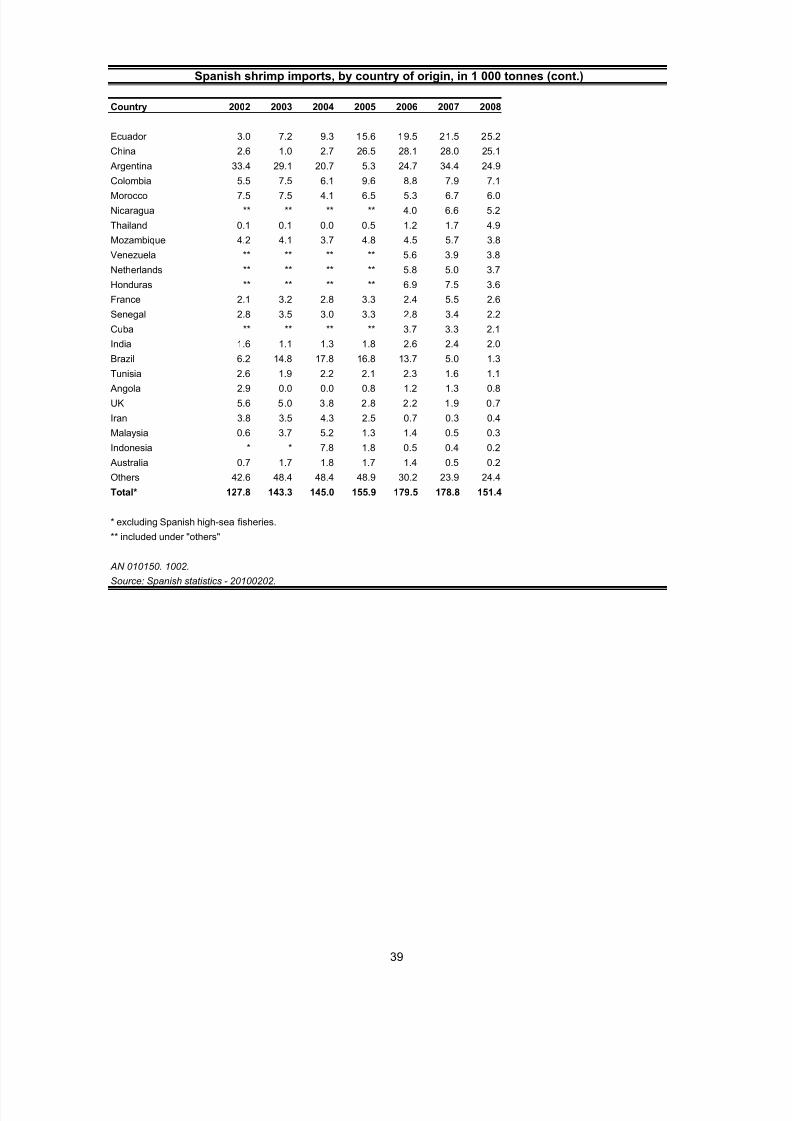
5/13/2018 Globefish Commodity Update Shrimp 2010 - slidepdf.com
http://slidepdf.com/reader/full/globefish-commodity-update-shrimp-2010 45/78
Country 2002 2003 2004 2005 2006 2007 2008
Ecuador 3.0 7.2 9.3 15.6 19.5 21.5 25.2
China 2.6 1.0 2.7 26.5 28.1 28.0 25.1
Argentina 33.4 29.1 20.7 5.3 24.7 34.4 24.9
Colombia 5.5 7.5 6.1 9.6 8.8 7.9 7.1
Morocco 7.5 7.5 4.1 6.5 5.3 6.7 6.0
Nicaragua ** ** ** ** 4.0 6.6 5.2
Thailand 0.1 0.1 0.0 0.5 1.2 1.7 4.9
Mozambique 4.2 4.1 3.7 4.8 4.5 5.7 3.8
Venezuela ** ** ** ** 5.6 3.9 3.8
Netherlands ** ** ** ** 5.8 5.0 3.7
Honduras ** ** ** ** 6.9 7.5 3.6
France 2.1 3.2 2.8 3.3 2.4 5.5 2.6
Senegal 2.8 3.5 3.0 3.3 2.8 3.4 2.2
Cuba ** ** ** ** 3.7 3.3 2.1
India 1.6 1.1 1.3 1.8 2.6 2.4 2.0
Brazil 6.2 14.8 17.8 16.8 13.7 5.0 1.3
Tunisia 2.6 1.9 2.2 2.1 2.3 1.6 1.1
Angola 2.9 0.0 0.0 0.8 1.2 1.3 0.8
UK 5.6 5.0 3.8 2.8 2.2 1.9 0.7
Iran 3.8 3.5 4.3 2.5 0.7 0.3 0.4
Malaysia 0.6 3.7 5.2 1.3 1.4 0.5 0.3
Indonesia * * 7.8 1.8 0.5 0.4 0.2
Australia 0.7 1.7 1.8 1.7 1.4 0.5 0.2
Others 42.6 48.4 48.4 48.9 30.2 23.9 24.4
Total* 127.8 143.3 145.0 155.9 179.5 178.8 151.4
* excluding Spanish high-sea fisheries.
** included under "others"
AN 010150. 1002.
Source: Spanish statistics - 20100202.
Spanish shrimp imports, by country of origin, in 1 000 tonnes (cont.)
39

5/13/2018 Globefish Commodity Update Shrimp 2010 - slidepdf.com
http://slidepdf.com/reader/full/globefish-commodity-update-shrimp-2010 46/78
Country 1982 1983 1984 1985 1986 1987 1988 1989 1990 1991
Ecuador - - - - - 0.2 1.5 0.4 0.9 1.7
Argentina 0.5 3.5 6.6 5.1 5.5 1.0 2.9 4.7 3.2 3.3
Denmark 1.9 2.1 1.8 4.8 3.6 4.6 5.7 4.7 3.9 4.4
India - - - - 0.1 0.2 0.4 0.7 2.6 3.6Spain 0.1 0.3 0.4 0.6 0.4 0.6 0.7 0.7 0.4 0.4
Netherlands - - - - - - 0.2 0.6 1.2 1.2
Vietnam * * * * * * * * * *
Thailand 0.6 0.2 1.4 0.1 0.4 1.5 1.6 1.9 2.9 3.9
France 0.7 0.5 0.2 0.3 0.5 0.6 1.0 1.1 0.8 0.7
China - - - - - - 0.1 0.1 0.6 0.0
UK 0.5 0.7 0.5 1.3 1.6 1.7 2.0 1.9 2.5 3.0
Tunisia 0.1 0.6 0.7 0.9 0.8 1.4 1.1 0.8 0.6 0.4
Malaysia - - - - - - 0.0 0.0 0.0 0.3
Venezuela 2.6 1.7 1.5 2.3 - 5.0 0.0 0.2 1.1 1.1
Cuba 1.8 2.0 0.7 1.6 2.2 1.7 1.8 1.8 0.8 0.6
Bangladesh 1.5 0.5 0.1 0.5 1.0 0.8 1.0 0.7 0.6 0.3
Brazil - 0.0 - 0.4 0.7 0.6 0.7 0.7 0.4 0.4
Others 0.0 0.1 0.0 0.4 4.0 0.6 4.7 4.6 6.0 5.4Total 10.3 12.2 13.9 17.9 20.1 19.9 24.7 24.9 28.1 30.3
Country 1992 1993 1994 1995 1996 1997 1998 1999 2000 2001
Ecuador 2.1 1.3 1.3 3.0 3.8 4.7 6.3 5.2 3.5 5.0
Argentina 5.1 2.7 1.8 0.0 0.5 0.7 4.7 5.8 6.5 11.2
Denmark 4.7 4.2 4.9 4.2 4.5 4.0 4.7 5.1 5.5 5.8
India 3.5 2.6 2.8 2.7 3.0 1.3 1.7 1.6 2.0 2.3
Spain 1.4 2.3 2.0 1.5 1.2 1.5 2.4 1.5 2.2 6.0
Netherlands 1.2 1.1 1.7 1.1 1.1 1.3 1.5 1.3 1.5 1.6
Vietnam * * * * * * * * * *
Thailand 4.0 2.8 2.9 3.6 3.1 2.3 3.1 0.6 0.4 0.2
France 0.7 0.4 0.5 0.5 0.9 1.2 1.4 1.9 1.7 1.3China 0.3 0.1 0.1 0.0 0.0 0.1 0.1 1.1 4.1 3.8
UK 2.7 2.2 3.3 3.3 4.2 4.0 5.0 5.4 5.3 5.0
Tunisia 0.3 0.4 0.6 0.4 0.7 0.8 1.0 1.0 1.8 0.9
Malaysia 0.5 1.0 1.6 3.3 3.7 3.8 3.8 4.4 4.4 3.8
Venezuela 1.0 0.5 0.6 1.3 1.6 1.2 1.3 1.1 1.2 0.6
Cuba 0.9 0.9 0.5 0.6 0.7 0.0 0.0 - - -
Bangladesh 0.1 0.2 0.1 - - - - 0.0 0.1 -
Brazil 0.7 0.1 0.0 0.1 0.0 0.0 0.1 0.0 0.2 0.3
Others 5.3 3.5 4.3 4.6 4.9 3.9 4.8 5.2 5.1 6.0
Total 33.8 26.2 29.0 30.2 33.9 30.8 41.9 41.2 45.5 53.8
Italian shrimp imports, by country of origin, in 1 000 tonnes
40

5/13/2018 Globefish Commodity Update Shrimp 2010 - slidepdf.com
http://slidepdf.com/reader/full/globefish-commodity-update-shrimp-2010 47/78
Country 2002 2003 2004 2005 2006 2007 2008
Ecuador 4.6 6.9 10.7 14.1 17.7 18.5 20.4
Argentina 12.3 9.2 6.1 1.2 6.8 10.3 8.1
Denmark 5.2 5.6 6.0 6.7 7.0 6.6 6.5
India 2.5 4.0 4.5 4.3 4.3 5.0 6.1
Spain 5.4 5.6 5.4 3.4 4.8 6.5 3.9
Netherlands 2.2 2.6 2.9 3.4 3.5 3.1 3.0
Vietnam 4.7 5.0 4.4 2.8 2.5 2.1 2.6
Thailand 0.1 0.1 0.4 0.5 1.0 1.2 2.0
France 1.5 2.2 2.4 2.7 2.2 2.0 1.9
China 0.2 0.2 0.1 2.4 2.6 3.6 1.8
UK 4.7 5.0 4.4 2.8 2.5 2.1 1.6
Tunisia 1.5 1.8 1.9 2.4 1.8 1.6 1.6
Malaysia 2.4 4.3 2.7 3.7 3.2 2.8 1.1
Venezuela 0.7 1.0 1.7 2.4 2.0 0.9 0.7
Cuba - - - - - 0.0 0.3
Bangladesh - 0.2 0.0 0.0 0.2 0.1 0.0Brazil 0.4 0.6 0.3 0.3 0.1 0.0 0.0
Others 0.0 0.6 2.3 9.1 10.7 8.0 6.2
Total 48.4 54.9 56.2 62.2 72.9 74.4 67.8
AN 010148. 1002.
Source: EUROSTAT/National statistics - 20100201.
Italian shrimp imports, by country of origin, in 1 000 tonnes (cont.)
41

5/13/2018 Globefish Commodity Update Shrimp 2010 - slidepdf.com
http://slidepdf.com/reader/full/globefish-commodity-update-shrimp-2010 48/78
Country 1982 1983 1984 1985 1986 1987 1988 1989 1990 1991
Thailand 0.6 1.1 0.9 0.8 0.6 0.9 1.1 1.5 2.6 3.6
Viet Nam - - - - - - 0.0 0.0 0.0 0.0
India - - - - - - 0.4 0.7 2.6 3.6
Netherlands 2.2 2.5 1.8 2.4 3.0 3.7 4.3 4.2 3.2 3.8
Bangladesh 0.6 0.5 0.4 0.5 0.8 0.6 1.1 1.1 1.5 1.1
Denmark 1.3 1.2 1.1 1.7 1.9 2.3 2.3 2.6 2.8 4.1
Greenland * * * * * * * * * *
Belgium - - - - - - 1.1 1.2 1.4 1.7
Indonesia * * * * * * * * * *
Canada * * * * * * * * * *
UK - - - - - - 2.1 1.9 2.5 3.0
Iceland 1.3 1.4 1.6 1.6 1.7 1.6 1.6 2.0 0.5 0.5
China 0.5 0.2 0.3 0.2 0.4 0.4 0.4 0.6 0.8 0.6
Others 5.5 6.3 6.5 6.3 6.1 6.9 5.1 5.9 3.7 2.1
Total 10.2 11.6 10.7 11.7 12.4 14.4 17.5 19.1 20.3 23.0
Country 1992 1993 1994 1995 1996 1997 1998 1999 2000 2001
ThailandViet Nam 4.3 5.2 6.0 6.2 6.2 5.2 6.1 4.5 4.4 4.0
India 0.3 0.0 0.1 0.0 0.0 0.4 1.1 0.9 1.4 1.7
Netherlands 0.4 2.6 2.8 2.7 2.9 1.0 0.5 1.6 1.7 1.7
Bangladesh 4.3 1.7 1.5 1.4 1.4 2.2 2.6 3.3 3.5 2.6
Denmark 0.9 1.3 2.2 2.1 1.9 1.1 0.5 1.3 1.9 2.2
Greenland 4.4 3.8 4.1 3.3 3.7 4.5 4.3 2.6 2.1 3.9
Belgium * * * * * * * * * *
Indonesia 2.0 1.5 1.2 1.0 1.3 1.5 1.2 1.4 1.9 2.1
Canada * * * * * * * * * *
UK * * * * * * * * * *
Iceland 0.7 2.2 3.3 3.3 4.2 1.4 1.2 1.8 2.3 3.7
China 1.0 1.0 1.6 0.9 0.9 1.3 1.5 1.0 0.8 0.7
Others 0.8 1.2 0.6 0.6 0.4 0.6 0.8 0.3 0.3 0.1
Total 6.9 3.8 4.3 2.3 1.0 6.6 6.3 5.5 6.2 5.9
Total 24.2 22.1 25.5 23.2 23.5 25.2 25.3 23.9 26.2 28.5
Country 2002 2003 2004 2005 2006 2007 2008
Thailand 2.4 1.6 2.2 3.5 4.0 8.9 9.3
Viet Nam 0.3 1.0 1.5 3.3 4.0 5.7 8.1
India 2.4 3.0 3.7 4.2 5.3 6.4 5.7
Netherlands 2.7 2.5 3.0 3.6 4.1 5.7 3.9
Bangladesh 2.8 2.5 2.1 2.7 3.0 3.1 3.5
Denmark 1.4 2.1 1.8 2.1 1.5 2.6 2.7
Greenland * * * * * 2.6 2.3
Belgium 2.1 2.7 2.5 2.5 2.8 2.6 2.0
Indonesia * * * * * 2.1 2.0Canada * * * * * * 1.7
UK 2.7 2.7 2.4 3.0 3.1 2.5 1.6
Iceland 0.8 0.9 1.0 2.8 0.4 0.6 0.5
China 0.0 0.0 0.0 0.2 0.1 0.7 0.3
Others 5.8 8.0 9.8 7.4 10.6 5.4 4.7
Total 23.4 27.0 30.0 35.1 38.8 48.9 48.4
AN 010146.1002.
Source: EUROSTAT/National statsistics - 20100202.
German shrimp imports, by country of origin, in 1 000 tonnes
42

5/13/2018 Globefish Commodity Update Shrimp 2010 - slidepdf.com
http://slidepdf.com/reader/full/globefish-commodity-update-shrimp-2010 49/78
- 1985 1986 1987 1988 1989 1990 1991 1992 1993 1994
COLDWATER(A) - - - - - - - - - -
Denmark 2.6 2.6 2.5 1.2 1.2 1.2 1.9 1.6 2.4 2.7
Others 4.0 4.5 5.8 6.2 4.8 4.2 3.0 2.6 1.5 4.6Total 6.6 7.1 8.3 7.4 6.0 5.4 4.9 4.2 3.9 7.3
WARMWATER(B) - - - - - - - - -
India 5.0 5.7 5.5 4.8 6.7 5.6 4.6 5.1 4.7 6.0
Bangladesh 1.6 2.9 2.6 2.5 3.0 3.8 3.3 3.0 3.3 3.2
Indonesia * * * * * * * * * *
Ecuador * * * * * * * * * *
Thailand 1.4 1.9 2.1 1.4 1.5 2.2 1.4 1.7 1.5 1.9
Honduras * * * * * * * * * *
France 0.6 0.8 0.7 1.0 0.9 0.8 0.7 0.5 0.4 0.7
Pakistan 2.1 2.1 3.3 3.9 3.6 3.0 2.9 3.0 2.3 2.4
Others 2.1 4.1 4.6 5.3 4.1 4.7 4.9 3.7 3.9 6.4
Total 12.8 17.5 18.8 18.9 19.8 20.1 17.8 17.0 16.1 20.6
C-AND-P(C) - - - - - - - - -
Iceland 2.3 3.1 3.2 3.9 3.5 4.6 7.3 8.1 9.4 9.8Canada * * * * * * * * * *
Denmark 1.1 1.6 1.0 2.2 2.5 4.1 2.6 3.6 5.5 4.7
Thailand 1.7 2.7 2.8 1.2 3.0 4.5 4.2 4.1 3.7 3.3
Norway 9.3 5.1 2.8 3.8 6.2 5.7 5.1 6.7 6.3 4.5
Indonesia * * * * * * * * * *
Vietnam * * * * * * * * * *
Others 2.7 3.7 4.0 9.9 7.9 7.0 9.6 10.3 7.0 7.3
Total 17.1 16.2 13.8 21.0 23.1 25.9 28.8 32.8 31.9 29.6
Gr. Total 36.4 40.1 40.9 47.2 48.8 51.4 51.5 54.0 51.9 57.5
- 1995 1996 1997 1998 1999 2000 2001 2002 2003
COLDWATER(A) - - - - - - - - -Denmark 3.2 2.5 1.4 1.8 2.4 1.6 2.4 4.3 3.5
Others 2.3 2.0 2.9 10.8 3.6 1.4 2.1 3.7 1.8
Total 5.5 4.5 4.3 12.6 6.0 3.0 4.5 8.0 5.3
WARMWATER(B) - - - - - - - -
India 7.0 7.3 5.0 2.8 4.9 8.1 8.0 11.1 11.6
Bangladesh 2.4 2.8 2.1 2.0 4.1 4.9 6.2 7.6 8.5
Indonesia * * * * * * 5.7 4.2 4.7
Ecuador * * * * * * 0.5 1.1 1.0
Thailand 2.2 1.8 2.9 5.7 2.0 3.0 2.0 0.5 0.0
Honduras * * * * * * * * *
France 0.8 0.6 * * * * * * *
Pakistan 2.5 2.8 * * * * * * *
Others 7.6 6.9 12.0 14.1 14.5 14.0 10.9 6.2 12.6
Total 22.5 22.2 22.0 24.6 25.5 30.0 33.3 30.7 38.4C-AND-P(C) - - - - - - - -
Iceland 11.7 15.2 15.9 13.7 13.5 14.2 17.7 18.8 22.2
Canada * * * * * * 2.8 2.5 2.5
Denmark 4.0 5.0 3.6 4.5 2.7 3.0 3.1 3.6 4.1
Thailand 3.4 3.7 2.9 3.8 2.9 3.2 3.9 1.6 1.3
Norway 4.0 3.9 5.1 7.8 8.3 9.3 8.6 6.4 4.8
Indonesia * * * * * * * * 1.2
Vietnam * * * * * * * * 0.5
Others 7.4 7.5 6.6 5.9 9.2 12.0 8.9 10.2 10.0
Total 30.5 35.3 34.1 35.7 36.6 41.7 45.0 43.1 46.6
Gr. Total 58.4 62.0 60.4 72.9 68.1 75.4 82.8 81.8 90.3
Yearly imports of frozen and chilled shrimp, UK,
by countries of origin, in 1 000 tonnes, 1985-2009
43
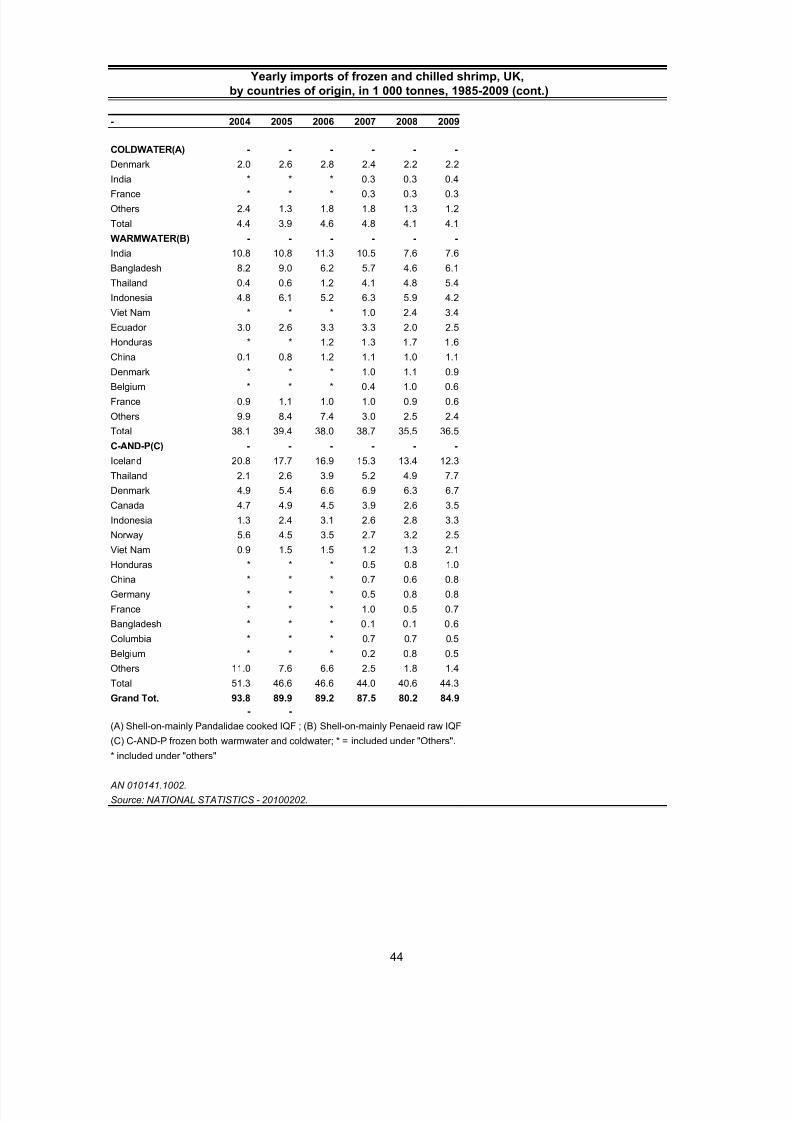
5/13/2018 Globefish Commodity Update Shrimp 2010 - slidepdf.com
http://slidepdf.com/reader/full/globefish-commodity-update-shrimp-2010 50/78
- 2004 2005 2006 2007 2008 2009
COLDWATER(A) - - - - - -
Denmark 2.0 2.6 2.8 2.4 2.2 2.2
India * * * 0.3 0.3 0.4
France * * * 0.3 0.3 0.3
Others 2.4 1.3 1.8 1.8 1.3 1.2
Total 4.4 3.9 4.6 4.8 4.1 4.1
WARMWATER(B) - - - - - -
India 10.8 10.8 11.3 10.5 7.6 7.6
Bangladesh 8.2 9.0 6.2 5.7 4.6 6.1
Thailand 0.4 0.6 1.2 4.1 4.8 5.4
Indonesia 4.8 6.1 5.2 6.3 5.9 4.2
Viet Nam * * * 1.0 2.4 3.4
Ecuador 3.0 2.6 3.3 3.3 2.0 2.5
Honduras * * 1.2 1.3 1.7 1.6
China 0.1 0.8 1.2 1.1 1.0 1.1
Denmark * * * 1.0 1.1 0.9
Belgium * * * 0.4 1.0 0.6
France 0.9 1.1 1.0 1.0 0.9 0.6
Others 9.9 8.4 7.4 3.0 2.5 2.4
Total 38.1 39.4 38.0 38.7 35.5 36.5
C-AND-P(C) - - - - - -
Iceland 20.8 17.7 16.9 15.3 13.4 12.3
Thailand 2.1 2.6 3.9 5.2 4.9 7.7
Denmark 4.9 5.4 6.6 6.9 6.3 6.7
Canada 4.7 4.9 4.5 3.9 2.6 3.5
Indonesia 1.3 2.4 3.1 2.6 2.8 3.3
Norway 5.6 4.5 3.5 2.7 3.2 2.5
Viet Nam 0.9 1.5 1.5 1.2 1.3 2.1
Honduras * * * 0.5 0.8 1.0
China * * * 0.7 0.6 0.8
Germany * * * 0.5 0.8 0.8
France * * * 1.0 0.5 0.7
Bangladesh * * * 0.1 0.1 0.6
Columbia * * * 0.7 0.7 0.5
Belgium * * * 0.2 0.8 0.5
Others 11.0 7.6 6.6 2.5 1.8 1.4
Total 51.3 46.6 46.6 44.0 40.6 44.3
Grand Tot. 93.8 89.9 89.2 87.5 80.2 84.9
- -(A) Shell-on-mainly Pandalidae cooked IQF ; (B) Shell-on-mainly Penaeid raw IQF
(C) C-AND-P frozen both warmwater and coldwater; * = included under "Others".
* included under "others"
AN 010141.1002.
Source: NATIONAL STATISTICS - 20100202.
Yearly imports of frozen and chilled shrimp, UK,
by countries of origin, in 1 000 tonnes, 1985-2009 (cont.)
44
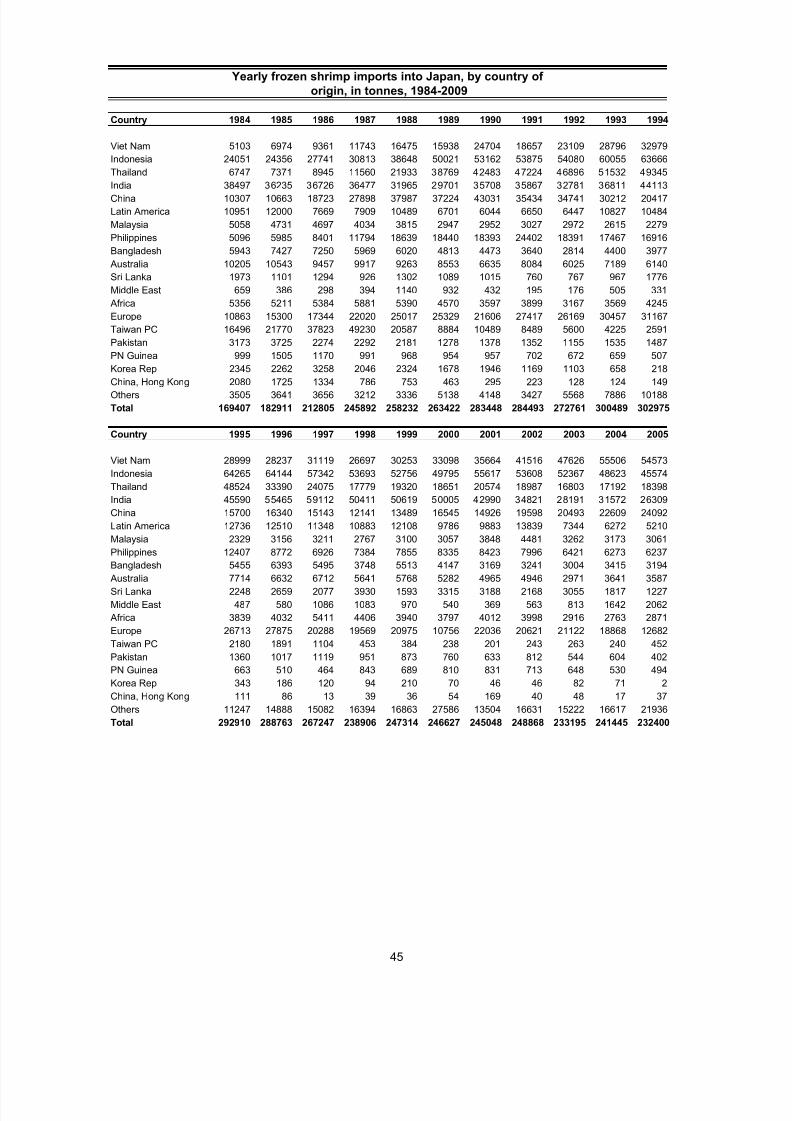
5/13/2018 Globefish Commodity Update Shrimp 2010 - slidepdf.com
http://slidepdf.com/reader/full/globefish-commodity-update-shrimp-2010 51/78
Country 1984 1985 1986 1987 1988 1989 1990 1991 1992 1993 1994
Viet Nam 5103 6974 9361 11743 16475 15938 24704 18657 23109 28796 32979
Indonesia 24051 24356 27741 30813 38648 50021 53162 53875 54080 60055 63666
Thailand 6747 7371 8945 11560 21933 38769 42483 47224 46896 51532 49345India 38497 36235 36726 36477 31965 29701 35708 35867 32781 36811 44113
China 10307 10663 18723 27898 37987 37224 43031 35434 34741 30212 20417
Latin America 10951 12000 7669 7909 10489 6701 6044 6650 6447 10827 10484
Malaysia 5058 4731 4697 4034 3815 2947 2952 3027 2972 2615 2279
Philippines 5096 5985 8401 11794 18639 18440 18393 24402 18391 17467 16916
Bangladesh 5943 7427 7250 5969 6020 4813 4473 3640 2814 4400 3977
Australia 10205 10543 9457 9917 9263 8553 6635 8084 6025 7189 6140
Sri Lanka 1973 1101 1294 926 1302 1089 1015 760 767 967 1776
Middle East 659 386 298 394 1140 932 432 195 176 505 331
Africa 5356 5211 5384 5881 5390 4570 3597 3899 3167 3569 4245
Europe 10863 15300 17344 22020 25017 25329 21606 27417 26169 30457 31167
Taiwan PC 16496 21770 37823 49230 20587 8884 10489 8489 5600 4225 2591
Pakistan 3173 3725 2274 2292 2181 1278 1378 1352 1155 1535 1487
PN Guinea 999 1505 1170 991 968 954 957 702 672 659 507Korea Rep 2345 2262 3258 2046 2324 1678 1946 1169 1103 658 218
China, Hong Kong 2080 1725 1334 786 753 463 295 223 128 124 149
Others 3505 3641 3656 3212 3336 5138 4148 3427 5568 7886 10188
Total 169407 182911 212805 245892 258232 263422 283448 284493 272761 300489 302975
Country 1995 1996 1997 1998 1999 2000 2001 2002 2003 2004 2005
Viet Nam 28999 28237 31119 26697 30253 33098 35664 41516 47626 55506 54573
Indonesia 64265 64144 57342 53693 52756 49795 55617 53608 52367 48623 45574
Thailand 48524 33390 24075 17779 19320 18651 20574 18987 16803 17192 18398
India 45590 55465 59112 50411 50619 50005 42990 34821 28191 31572 26309
China 15700 16340 15143 12141 13489 16545 14926 19598 20493 22609 24092
Latin America 12736 12510 11348 10883 12108 9786 9883 13839 7344 6272 5210
Malaysia 2329 3156 3211 2767 3100 3057 3848 4481 3262 3173 3061
Philippines 12407 8772 6926 7384 7855 8335 8423 7996 6421 6273 6237
Bangladesh 5455 6393 5495 3748 5513 4147 3169 3241 3004 3415 3194
Australia 7714 6632 6712 5641 5768 5282 4965 4946 2971 3641 3587
Sri Lanka 2248 2659 2077 3930 1593 3315 3188 2168 3055 1817 1227
Middle East 487 580 1086 1083 970 540 369 563 813 1642 2062
Africa 3839 4032 5411 4406 3940 3797 4012 3998 2916 2763 2871
Europe 26713 27875 20288 19569 20975 10756 22036 20621 21122 18868 12682
Taiwan PC 2180 1891 1104 453 384 238 201 243 263 240 452
Pakistan 1360 1017 1119 951 873 760 633 812 544 604 402
PN Guinea 663 510 464 843 689 810 831 713 648 530 494
Korea Rep 343 186 120 94 210 70 46 46 82 71 2
China, Hong Kong 111 86 13 39 36 54 169 40 48 17 37
Others 11247 14888 15082 16394 16863 27586 13504 16631 15222 16617 21936Total 292910 288763 267247 238906 247314 246627 245048 248868 233195 241445 232400
Yearly frozen shrimp imports into Japan, by country of
origin, in tonnes, 1984-2009
45
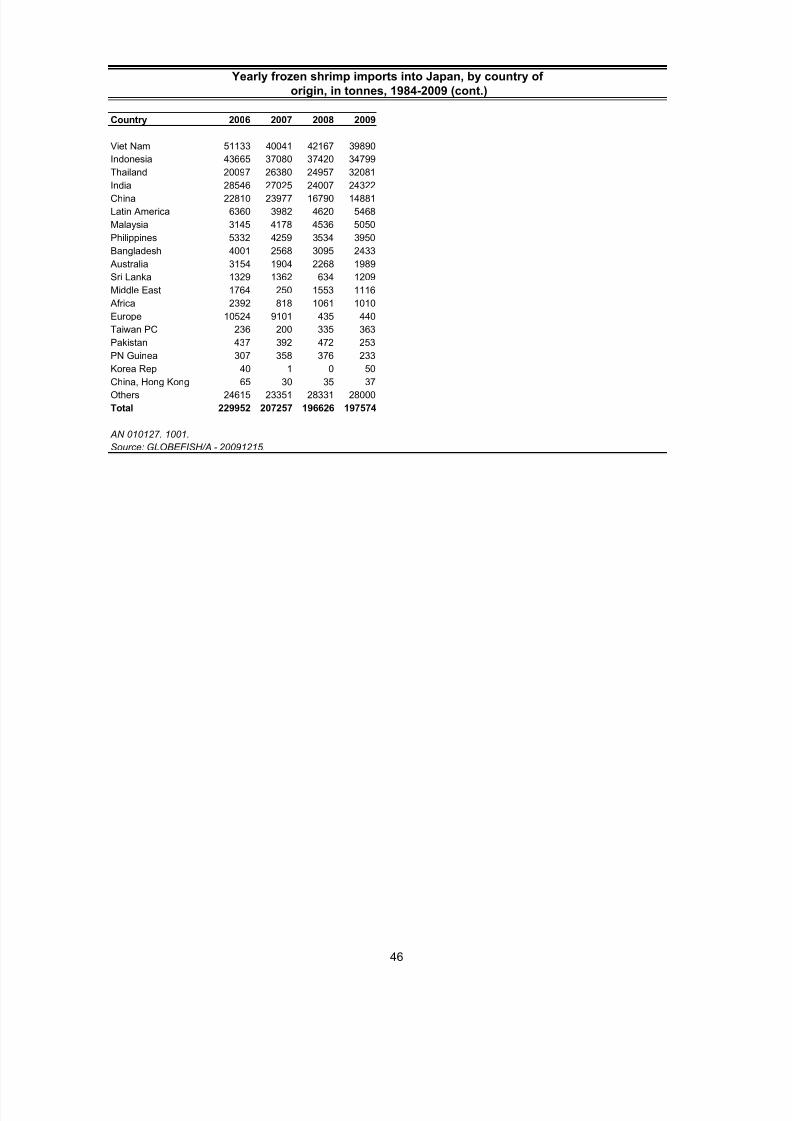
5/13/2018 Globefish Commodity Update Shrimp 2010 - slidepdf.com
http://slidepdf.com/reader/full/globefish-commodity-update-shrimp-2010 52/78
Country 2006 2007 2008 2009
Viet Nam 51133 40041 42167 39890
Indonesia 43665 37080 37420 34799
Thailand 20097 26380 24957 32081India 28546 27025 24007 24322
China 22810 23977 16790 14881
Latin America 6360 3982 4620 5468
Malaysia 3145 4178 4536 5050
Philippines 5332 4259 3534 3950
Bangladesh 4001 2568 3095 2433
Australia 3154 1904 2268 1989
Sri Lanka 1329 1362 634 1209
Middle East 1764 250 1553 1116
Africa 2392 818 1061 1010
Europe 10524 9101 435 440
Taiwan PC 236 200 335 363
Pakistan 437 392 472 253
PN Guinea 307 358 376 233Korea Rep 40 1 0 50
China, Hong Kong 65 30 35 37
Others 24615 23351 28331 28000
Total 229952 207257 196626 197574
AN 010127. 1001.
Source: GLOBEFISH/A - 20091215.
Yearly frozen shrimp imports into Japan, by country of
origin, in tonnes, 1984-2009 (cont.)
46
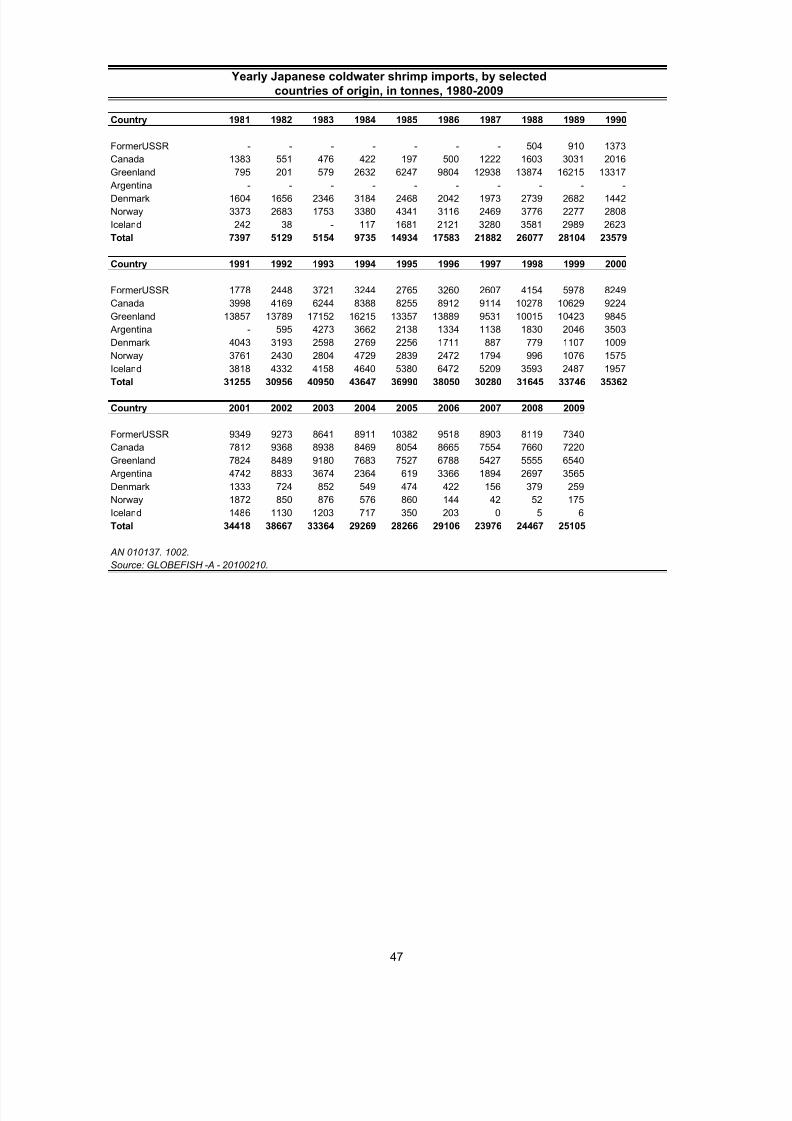
5/13/2018 Globefish Commodity Update Shrimp 2010 - slidepdf.com
http://slidepdf.com/reader/full/globefish-commodity-update-shrimp-2010 53/78
Country 1981 1982 1983 1984 1985 1986 1987 1988 1989 1990
FormerUSSR - - - - - - - 504 910 1373
Canada 1383 551 476 422 197 500 1222 1603 3031 2016
Greenland 795 201 579 2632 6247 9804 12938 13874 16215 13317 Argentina - - - - - - - - - -
Denmark 1604 1656 2346 3184 2468 2042 1973 2739 2682 1442
Norway 3373 2683 1753 3380 4341 3116 2469 3776 2277 2808
Iceland 242 38 - 117 1681 2121 3280 3581 2989 2623
Total 7397 5129 5154 9735 14934 17583 21882 26077 28104 23579
Country 1991 1992 1993 1994 1995 1996 1997 1998 1999 2000
FormerUSSR 1778 2448 3721 3244 2765 3260 2607 4154 5978 8249
Canada 3998 4169 6244 8388 8255 8912 9114 10278 10629 9224
Greenland 13857 13789 17152 16215 13357 13889 9531 10015 10423 9845
Argentina - 595 4273 3662 2138 1334 1138 1830 2046 3503
Denmark 4043 3193 2598 2769 2256 1711 887 779 1107 1009
Norway 3761 2430 2804 4729 2839 2472 1794 996 1076 1575Iceland 3818 4332 4158 4640 5380 6472 5209 3593 2487 1957
Total 31255 30956 40950 43647 36990 38050 30280 31645 33746 35362
Country 2001 2002 2003 2004 2005 2006 2007 2008 2009
FormerUSSR 9349 9273 8641 8911 10382 9518 8903 8119 7340
Canada 7812 9368 8938 8469 8054 8665 7554 7660 7220
Greenland 7824 8489 9180 7683 7527 6788 5427 5555 6540
Argentina 4742 8833 3674 2364 619 3366 1894 2697 3565
Denmark 1333 724 852 549 474 422 156 379 259
Norway 1872 850 876 576 860 144 42 52 175
Iceland 1486 1130 1203 717 350 203 0 5 6
Total 34418 38667 33364 29269 28266 29106 23976 24467 25105
AN 010137. 1002.
Source: GLOBEFISH -A - 20100210.
Yearly Japanese coldwater shrimp imports, by selected
countries of origin, in tonnes, 1980-2009
47

5/13/2018 Globefish Commodity Update Shrimp 2010 - slidepdf.com
http://slidepdf.com/reader/full/globefish-commodity-update-shrimp-2010 54/78
Country 1984 1985 1986 1987 1988 1989 1990 1991 1992 1993 1994
Thailand 8.3 11.1 10.9 10.9 10.8 22.0 25.4 45.5 53.8 66.8 80.8
Indonesia 0.9 0.9 1.0 1.7 2.0 6.1 8.6 11.6 13.7 13.3 11.0
Ecuador 21.1 19.9 28.1 45.9 47.2 36.8 38.3 48.9 54.7 49.2 48.1Vietnam * * * * * * * * * * *
China 1.5 3.1 9.4 19.2 47.3 46.7 57.4 35.1 49.4 31.0 22.9
Mexico 37.1 30.6 33.7 39.1 28.8 27.4 16.8 16.6 13.7 20.4 22.9
India 10.5 10.9 11.1 12.9 14.6 13.0 14.2 17.5 17.7 19.1 22.6
Bangladesh 1.5 2.0 2.8 4.2 5.3 5.9 6.7 4.9 8.3 9.6 8.6
Guyana 1.6 1.1 2.3 2.1 2.1 2.2 2.1 2.8 2.5 2.6 3.1
Peru 3.0 2.1 1.7 2.7 1.9 1.8 2.1 2.2 2.8 2.3 2.4
Venezuela 2.3 3.0 4.1 2.7 4.0 5.6 3.5 3.4 1.9 3.6 4.3
Honduras 2.4 2.4 2.5 3.6 4.1 3.4 4.2 5.9 7.6 9.5 9.0
Canada 1.3 2.0 1.6 3.1 2.4 1.8 2.2 3.4 2.8 3.4 4.7
Panama 7.4 8.9 9.9 7.5 6.7 7.8 5.3 5.9 5.5 6.3 7.0
Nicaragua 0.5 0.5 0.0 0.0 0.0 0.0 0.4 0.5 0.3 1.0 2.1
Colombia 1.6 1.5 2.0 2.0 1.9 2.7 3.7 4.6 2.8 3.3 3.1
Guatemala 2.0 1.7 1.3 1.5 2.0 2.8 2.5 2.2 2.2 3.3 3.7Philippines 1.1 2.1 2.1 2.5 NA NA NA NA NA NA NA
Brazil 9.0 11.5 9.0 7.5 9.0 7.6 3.9 3.8 5.5 4.4 4.6
El Salvador 3.9 2.8 3.4 3.3 3.7 2.8 2.4 2.1 2.6 3.4 3.1
Others 38.4 45.2 44.5 44.6 34.8 31.8 27.7 27.9 22.3 20.1 20.8
Total 155.4 163.3 181.4 217.0 228.6 228.2 227.4 244.8 270.1 272.6 284.8
Country 1995 1996 1997 1998 1999 2000 2001 2002 2003 2004 2005
Thailand 77.8 72.7 73.4 92.3 114.5 126.4 136.1 115.1 129.5 130.1 159.3
Indonesia 5.3 9.9 12.8 15.3 16.0 16.8 15.8 17.4 21.3 46.3 51.8
Ecuador 51.8 44.1 63.7 64.5 50.4 19.1 26.8 29.7 34.0 37.5 49.5
Vietnam * * * * * * * * 57.4 37.1 42.7
China 14.6 7.7 12.9 7.0 8.8 18.2 28.0 49.5 80.5 65.5 44.3
Mexico 33.1 30.8 34.0 35.4 35.0 29.1 30.0 24.3 25.4 29.0 28.1
India 17.7 18.9 20.0 20.2 21.8 28.4 32.9 44.2 45.3 40.5 35.2
Bangladesh 5.0 9.2 9.8 6.3 8.8 10.2 8.7 8.5 8.1 17.4 15.8
Guyana 3.3 4.0 4.3 5.6 5.7 8.6 11.7 9.7 11.4 8.5 8.6
Peru 2.7 2.0 4.5 6.9 2.1 0.5 0.7 1.8 1.5 2.9 4.5
Venezuela 4.8 6.9 8.7 5.7 12.1 14.9 9.5 10.3 10.0 16.3 11.4
Honduras 8.4 8.9 8.2 8.6 7.4 7.9 9.7 9.8 9.7 11.0 10.5
Canada 7.1 9.0 5.1 7.9 6.6 8.9 6.6 8.0 6.5 8.1 7.6
Panama 8.6 8.7 10.5 10.2 7.8 5.9 6.9 6.4 6.2 5.8 5.9
Nicaragua 3.6 3.4 3.4 3.8 4.3 4.8 5.0 4.7 4.5 4.5 4.9
Colombia 3.1 3.0 3.3 2.1 2.7 2.8 3.2 3.3 2.3 3.5 3.5
Guatemala 2.7 4.2 2.2 2.4 1.8 1.6 2.7 2.4 3.1 3.2 1.3
Philippines 2.1 1.2 1.2 1.8 1.6 1.9 1.8 1.3 1.0 1.6 1.7
Brazil 1.9 0.9 0.5 0.8 1.9 5.9 9.8 17.7 21.8 9.2 3.0El Salvador 3.7 5.5 3.4 4.0 2.7 1.4 1.6 0.6 0.6 0.3 0.1
Others 13.6 13.3 12.2 14.6 19.7 31.8 52.8 64.6 22.6 37.9 39.1
Total 270.9 264.3 294.1 315.4 331.7 345.1 400.3 429.3 502.7 516.2 528.8
Fresh, frozen, shrimp imports, USA, by country of
origin, yearly, in 1 000 tonnes
48

5/13/2018 Globefish Commodity Update Shrimp 2010 - slidepdf.com
http://slidepdf.com/reader/full/globefish-commodity-update-shrimp-2010 55/78
Country 2006 2007 2008
Thailand 193.0 188.3 183.4
Indonesia 57.7 59.1 84.0
Ecuador 59.3 59.2 56.3Vietnam 36.4 39.3 48.3
China 67.1 48.4 48.1
Mexico 35.4 40.6 34.5
India 26.7 20.8 15.4
Bangladesh 19.0 14.9 13.7
Guyana 7.8 8.9 9.1
Peru 5.3 7.2 7.5
Venezuela 9.8 10.8 7.1
Honduras 9.3 7.3 5.7
Canada 6.9 6.0 5.2
Panama 4.7 4.5 3.6
Nicaragua 4.8 4.2 2.4
Colombia 3.3 2.2 1.9
Guatemala 2.4 2.0 1.7Philippines 1.5 1.7 1.3
Brazil 0.6 0.0 0.0
El Salvador 0.1 0.0 0.0
Others 32.6 33.3 603.6
Total 583.6 558.7 1133.0
* included under "others"
AN 010132. 1002.
Source: FISHERY MARKET NEWS REPORT (YO)/NMFS - 20100202.
Fresh, frozen, shrimp imports, USA, by country of
origin, yearly, in 1 000 tonnes (cont.)
49

5/13/2018 Globefish Commodity Update Shrimp 2010 - slidepdf.com
http://slidepdf.com/reader/full/globefish-commodity-update-shrimp-2010 56/78
Product 1984 1985 1986 1987 1988 1989 1990 1991 1992 1993 1994
Shell on 102.4 105.5 118.8 140.7 162.8 169.0 148.4 142.2 159.6 154.7 152.1
Raw Peeled 34.3 35.2 41.6 52.9 43.8 49.6 67.4 90.1 97.6 102.8 116.0
Breaded 0.1 0.3 0.1 0.5 0.6 0.1 0.1 0.5 0.6 0.8 0.5Canned 6.2 7.8 7.2 7.8 6.4 5.1 7.1 7.7 8.1 3.7 2.9
Others (1) 12.3 14.6 13.7 15.1 15.0 4.3 4.4 4.2 4.3 10.5 13.3
Total Shrimp 155.4 163.3 181.4 217.0 228.6 228.2 227.4 244.8 270.1 272.6 284.8
Product 1995 1996 1997 1998 1999 2000 2001 2002 2003 2004 2005
Shell on 148.5 144.2 155.9 155.1 156.4 153.6 200.3 206.7 248.9 244.6 247.9
Raw Peeled 102.8 93.8 106.9 119.9 125.0 129.6 125.4 125.9 149.7 152.0 148.6
Breaded 0.6 0.2 0.2 0.3 1.0 1.9 3.2 4.5 8.8 16.6 44.6
Canned 3.0 1.6 1.6 1.5 1.3 1.7 1.9 1.9 1.8 1.4 1.5
Others (1) 16.0 24.4 29.5 38.6 47.9 58.3 69.5 90.2 93.5 101.7 86.2
Total Shrimp 270.9 264.3 294.1 315.4 331.7 345.1 400.3 429.3 502.7 516.2 528.8
Product 2006 2007 2008
Shell on 256.4 236.6 245.3
Raw Peeled 163.7 179.9 184.8
Breaded 49.3 36.5 37.9
Canned 2.0 1.6 1.3
Others (1) 118.9 134.1 97.2
Total Shrimp 590.3 588.7 566.5
(1) Mostly cooked/dried.
AN 010131.1002.
Source: FISHERY MARKET NEWS REPORT (YO)/NMFS - 20100202.
Country 1999 2000 2001 2002 2003 2004 2005 2006 2007 2008
Spain 94.5 117.6 133.3 128.4 143.4 145.5 156.4 180.2 178.9 166.9
Denmark 76.8 83.9 93.4 107.6 116.5 118.0 128.2 131.1 131.3 116.2
France 74.0 69.0 73.7 80.0 94.3 102.0 101.7 105.6 108.5 105.6
UK 69.3 75.2 81.5 86.5 90.8 88.9 91.2 89.3 87.8 79.4
Belgium 33.9 32.9 35.0 41.0 53.8 56.9 60.4 70.5 74.5 77.7
Italy 41.8 45.7 53.6 48.2 54.9 56.6 62.9 72.7 74.4 67.8
Netherlands 37.2 43.1 43.8 65.5 76.3 55.2 54.3 51.3 53.5 57.6
Germany 25.6 29.5 30.1 24.4 28.5 31.2 37.0 42.1 51.4 54.7
Sweden 20.9 21.2 22.5 22.9 24.0 25.7 27.7 26.8 28.4 26.3
Portugal 13.7 12.5 13.7 14.0 14.8 15.9 18.8 19.8 20.5 21.8
Estonia 7.2 4.8
Poland 6.7 6.0
Greece 5.4 2.9 3.6 3.7 4.0 4.3 4.4 5.1 6.4 6.0
Irish Rep. 1.6 1.7 2.3 2.3 2.2 1.9 2.4 2.8 3.6 2.8
Austria 1.2 1.3 1.3 1.3 1.6 2.7 3.5 3.0 3.2 3.4
Finland 2.4 2.4 2.7 2.5 2.6 2.6 2.5 2.8 3.1 3.0
Others 2.7 2.8 3.2 3.4 5.8 11.4 13.6 16.9 7.0 6.8
Total 501.1 541.7 593.7 631.7 713.4 718.7 765.0 820.0 846.5 806.8
AN 010133.1002.
Source: Eurostat - 20100209.
EU-25 shrimp imports 1999-2008 ( in 1000 tonnes)
US shrimp imports, by product type,
in 1000 tonnes
50

5/13/2018 Globefish Commodity Update Shrimp 2010 - slidepdf.com
http://slidepdf.com/reader/full/globefish-commodity-update-shrimp-2010 57/78
Country 1999 2000 2001 2002 2003 2004 2005 2006 2007 2008
Spain 560.7 854.9 883.5 777.9 861.8 789.4 852.2 1006.3 870.0 846.7
France 481.0 544.8 555.7 531.5 551.7 535.9 537.6 560.5 544.8 539.1
Belgium 267.3 299.2 308.2 314.2 362.8 352.3 365.3 435.1 469.6 467.7
UK 454.4 570.4 560.5 532.2 511.0 485.4 497.6 491.4 473.0 412.5Italy 267.2 347.9 369.9 304.9 368.2 325.3 354.4 429.5 373.1 367.7
Denmark 286.3 324.4 310.8 326.5 317.3 307.6 331.9 334.8 362.8 364.2
Netherlands 222.4 295.2 297.1 314.6 288.7 228.8 249.4 250.5 264.9 325.0
Germany 217.1 270.8 283.4 202.9 202.5 206.6 236.5 241.2 317.7 314.5
Sweden 108.4 116.2 113.0 111.3 108.9 104.6 113.7 114.3 134.4 131.1
Portugal 95.4 106.7 109.7 103.1 97.3 96.4 108.1 113.8 110.3 122.6
Greece 17.0 23.8 28.1 24.2 29.0 28.2 29.5 33.8 40.1 34.0
Austria 13.4 15.6 14.9 14.6 15.2 17.7 17.9 20.1 25.6 25.0
Irish Rep. 11.4 13.8 16.4 15.4 13.4 13.6 16.9 20.4 22.8 18.8
Finland 13.4 14.1 14.1 12.4 12.7 12.5 12.4 13.8 17.3 17.5
Total 3015.5 3797.6 3865.2 3585.4 3740.7 3504.2 3723.4 4065.5 4093.4 4055.0
AN 010134.1002.
Source: Eurostat - 20100209.
EU-25: Imports of Shrimp, 1999-2008 (in million euros)
51

5/13/2018 Globefish Commodity Update Shrimp 2010 - slidepdf.com
http://slidepdf.com/reader/full/globefish-commodity-update-shrimp-2010 58/78
2004 2005 2006 2007 2008 2009
Shell-on coldwater
Netherlands 2.7 2.8 2.6 2.6 2.6 2.4
Denmark 2.1 2.2 2.3 1.9 1.5 1.7Others 2.8 1.5 1.3 1.1 1.3 2.5
Total 7.6 6.5 6.2 5.6 5.4 6.6
Shell-on warmwater
Ecuador 7.1 9.1 12.3 15.8 19.5 17.6
India 4.0 4.8 7.6 7.9 8.8 11.5
Madagascar 11.7 10.3 9.6 9.4 9.3 8.6
Brazil 24.1 22.5 17.6 13.4 7.7 5.7
Colombia 2.8 2.2 2.4 3.7 4.6 5.7
Venezuela 1.6 0.6 1.7 3.6 3.7 3.9
Indonesia 4.9 6.7 5.7 4.3 4.2 3.6
Vietnam 2.1 3.5 3.7 2.8 3.5 3.5
Bangladesh 0.9 1.0 1.1 1.4 3.1 2.9
Spain na na na na 1.6 2.8
Thailand 0.2 1.8 1.6 2.0 3.7 2.8Belgium 0.9 0.9 1.5 1.3 2.6 2.8
Nicaragua na na na na 1.2 2.3
Honduras na na na na 1.2 2.2
Guatemala 0.5 0.2 3.4 1.8 1.9 1.6
Mexico na na na na 0.4 1.4
Netherlands na na na na 0.9 1.4
Others 20.8 17.5 17.0 20.8 9.4 8.2
Total 81.6 81.1 85.2 88.2 87.3 88.6
Cooked & peeled
Thailand 1.4 1.4 1.5 2.3 2.0 3.5
Netherlands 2.1 2.6 2.7 2.5 2.6 2.6
India 0.3 0.4 0.8 1.3 1.3 1.6Belgium 2.1 2.7 2.8 2.5 2.2 1.4
Vietnam 0.8 0.8 1.0 1.4 1.3 1.3
Denmark 1.3 1.7 1.9 1.3 0.9 0.8
Others 4.3 3.9 2.9 2.4 2.3 2.3
Total 12.3 13.5 13.6 13.7 12.6 13.5
GRAND TOTAL 101.5 101.1 105.0 107.5 105.3 108.7
AN 010128. 1002.
Source: GLOBEFISH - 20100215.
Imports of fresh and frozen shrimp, France,
by country of origin in 1000 tonnes
52

5/13/2018 Globefish Commodity Update Shrimp 2010 - slidepdf.com
http://slidepdf.com/reader/full/globefish-commodity-update-shrimp-2010 59/78
SHRIMP EXPORTS
Country 1988 1989 1990 1991 1992 1993 1994 1995 1996 1997 1998
France 19.7 21.3 23.0 20.4 20.3 21.0 20.3 19.3 20.1 21.5 18.3
Russian Fed. 0.0 0.0 0.0 0.0 0.3 1.3 1.8 3.2 5.1 7.0 6.2
Spain 5.9 8.8 11.4 11.5 10.7 13.0 12.9 11.3 14.2 16.6 15.2
Morocco 0.0 0.0 0.0 0.0 0.5 1.8 2.9 4.1 5.6 13.5 17.3
Netherlands 8.6 9.3 5.4 7.4 9.5 7.7 10.5 8.6 11.1 15.5 14.6
Italy 6.6 7.3 6.8 8.1 8.5 11.9 10.0 10.0 12.5 11.2 13.7
Germany 6.2 6.7 4.1 3.8 3.9 3.8 4.2 4.4 4.9 5.2 6.1
Belgium 2.7 3.0 2.8 2.9 3.1 3.1 4.0 4.8 4.6 3.7 4.0
Sweden 5.2 6.0 5.2 5.9 5.8 6.3 6.8 7.0 9.9 9.9 9.6
Portugal 1.5 3.2 3.2 3.5 3.7 5.0 5.9 6.3 6.6 7.5 7.8
China 0.0 0.0 0.0 0.0 0.0 0.0 0.3 1.0 7.0 12.3 12.4UK 6.6 6.8 6.0 5.8 4.9 4.6 4.7 4.7 4.1 4.9 3.2
Norway * * * * * * * * * * *
Others 23.1 28.1 27.5 30.9 36.1 29.4 30.8 30.7 30.1 26.9 42.4
Total 86.1 100.5 95.3 100.1 107.2 108.9 115.2 115.4 135.9 155.9 170.8
Country 1999 2000 2001 2002 2003 2004 2005 2006 2007 2008
France 30.3 28.4 37.8 36.2 34.9 37.4 29.3 32.8 35.6 35.8
Russian Fed. 2.9 6.6 9.6 14.4 21.7 25.9 28.7 27.0 37.5 32.5
Spain 15.3 16.8 15.7 19.8 27.2 26.2 24.3 24.2 21.5 24.5
Morocco 16.8 20.8 16.7 19.8 24.3 23.6 25.8 27.5 28.8 24.4
Netherlands 15.0 14.8 12.9 17.7 22.0 24.0 21.7 24.4 27.3 24.2
Italy 12.5 13.6 17.0 18.8 19.5 18.0 15.9 19.9 21.0 18.0
Germany 7.7 8.5 9.4 8.3 9.8 11.8 11.4 15.1 17.1 15.1
Belgium 5.4 6.5 6.4 7.1 7.2 7.6 8.1 10.2 10.8 13.8
Sweden 10.1 11.2 13.3 12.4 12.0 12.1 9.9 12.8 12.4 12.6
Portugal 7.3 7.4 8.6 9.4 10.9 13.2 9.9 12.4 12.8 11.6
China 9.8 9.8 9.8 14.8 13.0 9.0 13.2 16.2 10.3 10.9
UK 5.9 6.1 6.1 8.2 9.2 6.5 6.2 9.7 11.8 10.7
Norway * * * * * * 6.9 5.1 6.4 4.9
Others 22.1 23.9 26.5 36.7 39.1 36.6 30.7 39.1 40.5 44.9
Total 161.0 174.4 189.9 223.6 250.8 251.9 242.0 276.4 293.7 283.9
* included under "others"
AN 011087. 1002.
Source: EUROSTAT - 20100205.
Total EU exports of chilled and frozen shrimps, bycountry of destination, in 1000 tonnes
53
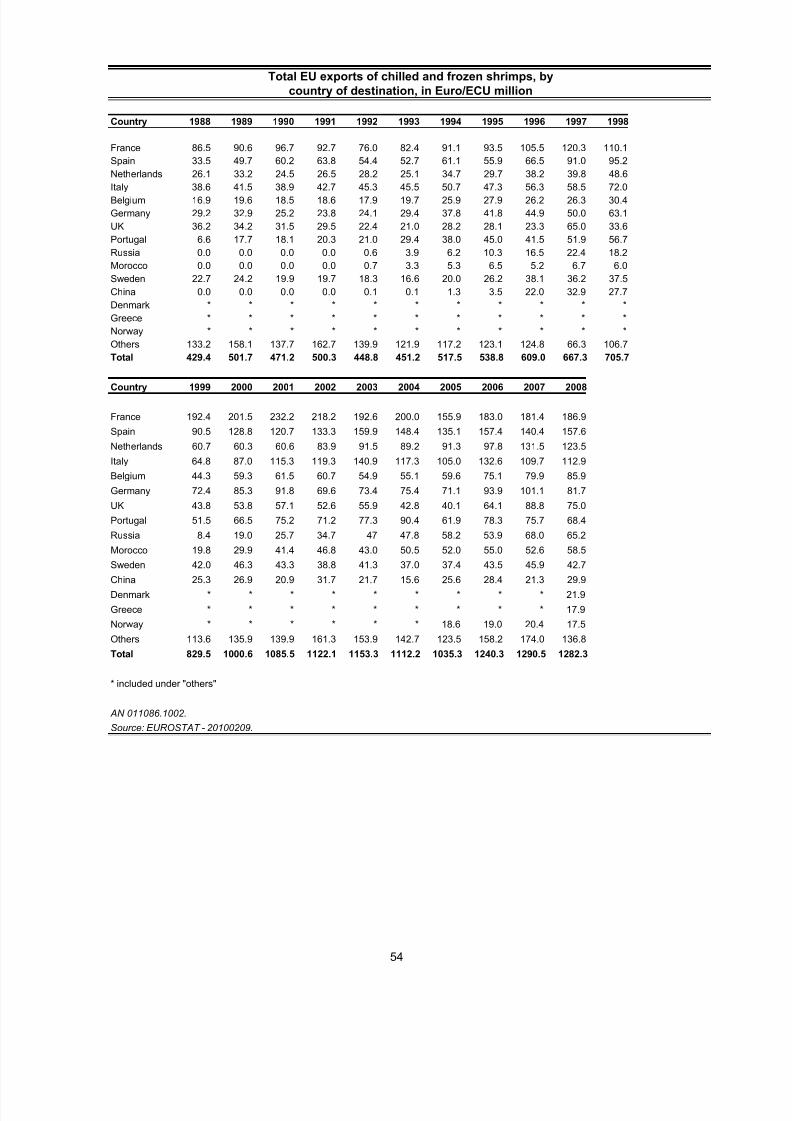
5/13/2018 Globefish Commodity Update Shrimp 2010 - slidepdf.com
http://slidepdf.com/reader/full/globefish-commodity-update-shrimp-2010 60/78
Country 1988 1989 1990 1991 1992 1993 1994 1995 1996 1997 1998
France 86.5 90.6 96.7 92.7 76.0 82.4 91.1 93.5 105.5 120.3 110.1
Spain 33.5 49.7 60.2 63.8 54.4 52.7 61.1 55.9 66.5 91.0 95.2
Netherlands 26.1 33.2 24.5 26.5 28.2 25.1 34.7 29.7 38.2 39.8 48.6Italy 38.6 41.5 38.9 42.7 45.3 45.5 50.7 47.3 56.3 58.5 72.0
Belgium 16.9 19.6 18.5 18.6 17.9 19.7 25.9 27.9 26.2 26.3 30.4
Germany 29.2 32.9 25.2 23.8 24.1 29.4 37.8 41.8 44.9 50.0 63.1
UK 36.2 34.2 31.5 29.5 22.4 21.0 28.2 28.1 23.3 65.0 33.6
Portugal 6.6 17.7 18.1 20.3 21.0 29.4 38.0 45.0 41.5 51.9 56.7
Russia 0.0 0.0 0.0 0.0 0.6 3.9 6.2 10.3 16.5 22.4 18.2
Morocco 0.0 0.0 0.0 0.0 0.7 3.3 5.3 6.5 5.2 6.7 6.0
Sweden 22.7 24.2 19.9 19.7 18.3 16.6 20.0 26.2 38.1 36.2 37.5
China 0.0 0.0 0.0 0.0 0.1 0.1 1.3 3.5 22.0 32.9 27.7
Denmark * * * * * * * * * * *
Greece * * * * * * * * * * *
Norway * * * * * * * * * * *
Others 133.2 158.1 137.7 162.7 139.9 121.9 117.2 123.1 124.8 66.3 106.7
Total 429.4 501.7 471.2 500.3 448.8 451.2 517.5 538.8 609.0 667.3 705.7
Country 1999 2000 2001 2002 2003 2004 2005 2006 2007 2008
France 192.4 201.5 232.2 218.2 192.6 200.0 155.9 183.0 181.4 186.9
Spain 90.5 128.8 120.7 133.3 159.9 148.4 135.1 157.4 140.4 157.6
Netherlands 60.7 60.3 60.6 83.9 91.5 89.2 91.3 97.8 131.5 123.5
Italy 64.8 87.0 115.3 119.3 140.9 117.3 105.0 132.6 109.7 112.9
Belgium 44.3 59.3 61.5 60.7 54.9 55.1 59.6 75.1 79.9 85.9
Germany 72.4 85.3 91.8 69.6 73.4 75.4 71.1 93.9 101.1 81.7
UK 43.8 53.8 57.1 52.6 55.9 42.8 40.1 64.1 88.8 75.0
Portugal 51.5 66.5 75.2 71.2 77.3 90.4 61.9 78.3 75.7 68.4
Russia 8.4 19.0 25.7 34.7 47 47.8 58.2 53.9 68.0 65.2
Morocco 19.8 29.9 41.4 46.8 43.0 50.5 52.0 55.0 52.6 58.5
Sweden 42.0 46.3 43.3 38.8 41.3 37.0 37.4 43.5 45.9 42.7
China 25.3 26.9 20.9 31.7 21.7 15.6 25.6 28.4 21.3 29.9
Denmark * * * * * * * * * 21.9
Greece * * * * * * * * * 17.9
Norway * * * * * * 18.6 19.0 20.4 17.5
Others 113.6 135.9 139.9 161.3 153.9 142.7 123.5 158.2 174.0 136.8
Total 829.5 1000.6 1085.5 1122.1 1153.3 1112.2 1035.3 1240.3 1290.5 1282.3
* included under "others"
AN 011086.1002.
Source: EUROSTAT - 20100209.
Total EU exports of chilled and frozen shrimps, by
country of destination, in Euro/ECU million
54
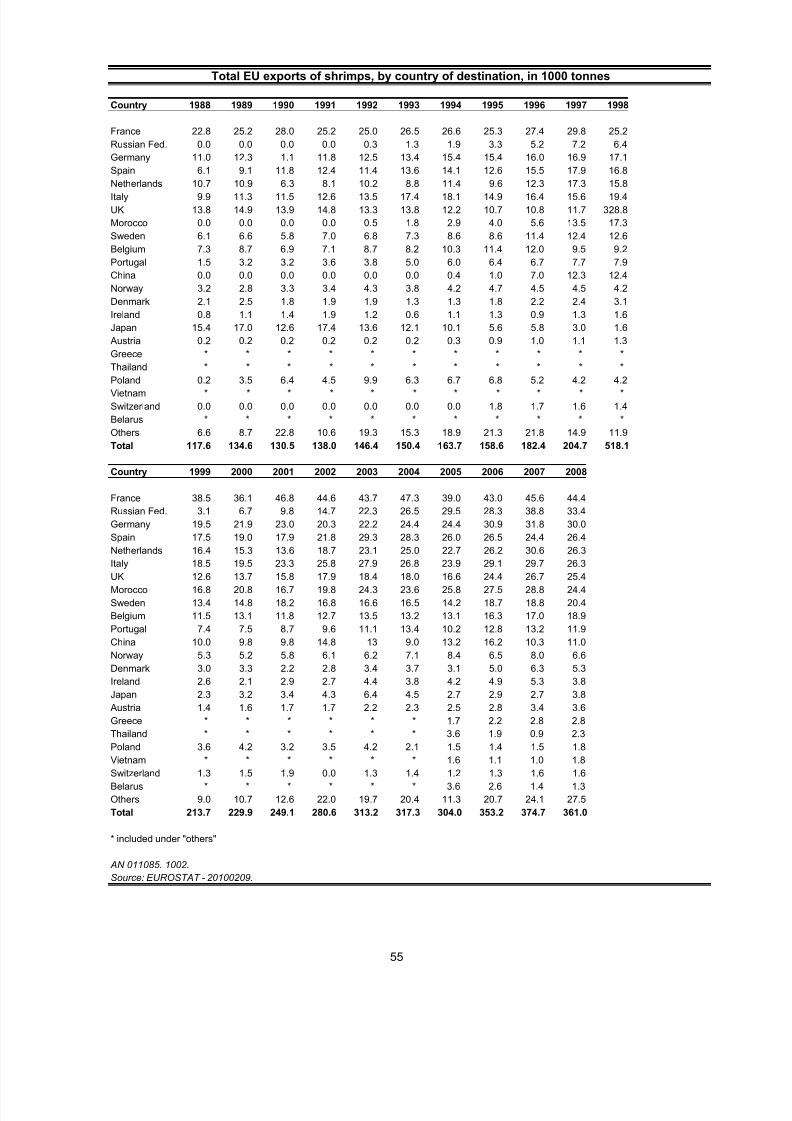
5/13/2018 Globefish Commodity Update Shrimp 2010 - slidepdf.com
http://slidepdf.com/reader/full/globefish-commodity-update-shrimp-2010 61/78
Country 1988 1989 1990 1991 1992 1993 1994 1995 1996 1997 1998
France 22.8 25.2 28.0 25.2 25.0 26.5 26.6 25.3 27.4 29.8 25.2
Russian Fed. 0.0 0.0 0.0 0.0 0.3 1.3 1.9 3.3 5.2 7.2 6.4
Germany 11.0 12.3 1.1 11.8 12.5 13.4 15.4 15.4 16.0 16.9 17.1
Spain 6.1 9.1 11.8 12.4 11.4 13.6 14.1 12.6 15.5 17.9 16.8
Netherlands 10.7 10.9 6.3 8.1 10.2 8.8 11.4 9.6 12.3 17.3 15.8
Italy 9.9 11.3 11.5 12.6 13.5 17.4 18.1 14.9 16.4 15.6 19.4
UK 13.8 14.9 13.9 14.8 13.3 13.8 12.2 10.7 10.8 11.7 328.8
Morocco 0.0 0.0 0.0 0.0 0.5 1.8 2.9 4.0 5.6 13.5 17.3
Sweden 6.1 6.6 5.8 7.0 6.8 7.3 8.6 8.6 11.4 12.4 12.6
Belgium 7.3 8.7 6.9 7.1 8.7 8.2 10.3 11.4 12.0 9.5 9.2
Portugal 1.5 3.2 3.2 3.6 3.8 5.0 6.0 6.4 6.7 7.7 7.9
China 0.0 0.0 0.0 0.0 0.0 0.0 0.4 1.0 7.0 12.3 12.4
Norway 3.2 2.8 3.3 3.4 4.3 3.8 4.2 4.7 4.5 4.5 4.2
Denmark 2.1 2.5 1.8 1.9 1.9 1.3 1.3 1.8 2.2 2.4 3.1
Ireland 0.8 1.1 1.4 1.9 1.2 0.6 1.1 1.3 0.9 1.3 1.6
Japan 15.4 17.0 12.6 17.4 13.6 12.1 10.1 5.6 5.8 3.0 1.6
Austria 0.2 0.2 0.2 0.2 0.2 0.2 0.3 0.9 1.0 1.1 1.3
Greece * * * * * * * * * * *Thailand * * * * * * * * * * *
Poland 0.2 3.5 6.4 4.5 9.9 6.3 6.7 6.8 5.2 4.2 4.2
Vietnam * * * * * * * * * * *
Switzerland 0.0 0.0 0.0 0.0 0.0 0.0 0.0 1.8 1.7 1.6 1.4
Belarus * * * * * * * * * * *
Others 6.6 8.7 22.8 10.6 19.3 15.3 18.9 21.3 21.8 14.9 11.9
Total 117.6 134.6 130.5 138.0 146.4 150.4 163.7 158.6 182.4 204.7 518.1
Country 1999 2000 2001 2002 2003 2004 2005 2006 2007 2008
France 38.5 36.1 46.8 44.6 43.7 47.3 39.0 43.0 45.6 44.4
Russian Fed. 3.1 6.7 9.8 14.7 22.3 26.5 29.5 28.3 38.8 33.4
Germany 19.5 21.9 23.0 20.3 22.2 24.4 24.4 30.9 31.8 30.0
Spain 17.5 19.0 17.9 21.8 29.3 28.3 26.0 26.5 24.4 26.4
Netherlands 16.4 15.3 13.6 18.7 23.1 25.0 22.7 26.2 30.6 26.3
Italy 18.5 19.5 23.3 25.8 27.9 26.8 23.9 29.1 29.7 26.3
UK 12.6 13.7 15.8 17.9 18.4 18.0 16.6 24.4 26.7 25.4
Morocco 16.8 20.8 16.7 19.8 24.3 23.6 25.8 27.5 28.8 24.4
Sweden 13.4 14.8 18.2 16.8 16.6 16.5 14.2 18.7 18.8 20.4
Belgium 11.5 13.1 11.8 12.7 13.5 13.2 13.1 16.3 17.0 18.9
Portugal 7.4 7.5 8.7 9.6 11.1 13.4 10.2 12.8 13.2 11.9
China 10.0 9.8 9.8 14.8 13 9.0 13.2 16.2 10.3 11.0
Norway 5.3 5.2 5.8 6.1 6.2 7.1 8.4 6.5 8.0 6.6
Denmark 3.0 3.3 2.2 2.8 3.4 3.7 3.1 5.0 6.3 5.3
Ireland 2.6 2.1 2.9 2.7 4.4 3.8 4.2 4.9 5.3 3.8
Japan 2.3 3.2 3.4 4.3 6.4 4.5 2.7 2.9 2.7 3.8
Austria 1.4 1.6 1.7 1.7 2.2 2.3 2.5 2.8 3.4 3.6Greece * * * * * * 1.7 2.2 2.8 2.8
Thailand * * * * * * 3.6 1.9 0.9 2.3
Poland 3.6 4.2 3.2 3.5 4.2 2.1 1.5 1.4 1.5 1.8
Vietnam * * * * * * 1.6 1.1 1.0 1.8
Switzerland 1.3 1.5 1.9 0.0 1.3 1.4 1.2 1.3 1.6 1.6
Belarus * * * * * * 3.6 2.6 1.4 1.3
Others 9.0 10.7 12.6 22.0 19.7 20.4 11.3 20.7 24.1 27.5
Total 213.7 229.9 249.1 280.6 313.2 317.3 304.0 353.2 374.7 361.0
* included under "others"
AN 011085. 1002.
Source: EUROSTAT - 20100209.
Total EU exports of shrimps, by country of destination, in 1000 tonnes
55

5/13/2018 Globefish Commodity Update Shrimp 2010 - slidepdf.com
http://slidepdf.com/reader/full/globefish-commodity-update-shrimp-2010 62/78
Country 1988 1989 1990 1991 1992 1993 1994 1995 1996 1997
France 105.6 113.8 129.0 121.0 102.2 113.3 130.1 132.3 151.5 170.9
Germany 63.4 73.2 75.5 77.5 81.7 92.0 110.5 123.4 126.4 132.6
Italy 69.4 77.7 78.1 78.4 82.3 80.7 91.1 80.8 88.4 95.2
Spain 35.1 52.4 65.9 68.8 58.9 56.7 68.2 63.6 73.7 99.5Belgium 53.6 71.1 62.7 58.6 64.0 69.4 90.5 93.8 98.8 76.8
UK 91.2 95.5 85.0 85.2 77.1 81.9 78.1 74.1 67.3 82.3
Netherlands 41.1 47.9 30.4 32.3 32.8 30.0 39.3 34.7 44.3 46.9
Sweden 30.0 29.1 23.6 25.8 24.0 21.6 29.9 37.7 48.8 50.6
Portugal 6.8 18.0 18.8 20.7 21.3 29.5 38.5 45.5 42.0 52.5
Russian Fed * * * * * * * * * *
Morocco 0.0 0.0 0.0 0.0 0.7 3.3 5.2 6.5 5.2 6.7
Norway 13.5 10.5 13.7 12.4 13.3 11.3 14.2 16.4 19.3 19.1
China 0.0 0.0 0.0 0.0 0.1 0.1 1.3 3.5 22.0 32.9
Denmark 11.0 14.5 10.6 13.4 11.1 7.2 8.6 10.5 12.0 13.4
Austria 1.7 1.7 1.6 1.6 1.7 1.8 2.5 9.2 9.7 11.0
Ireland 4.2 5.5 6.8 9.2 5.7 4.3 6.8 7.5 5.5 9.3
Greece * * * * * * * * * *
Ukraine * * * * * * * * * *
Switzerland 13.9 14.9 14.1 13.7 13.9 15.0 17.7 0.0 0.0 18.3
Japan 99.0 111.0 76.8 107.3 71.4 64.7 43.5 27.4 29.9 16.6
Luxembug * * * * * * * * * *
Finland * * * * * * * * * *
Poland 0.4 8.5 18.2 11.7 15.4 13.8 15.0 14.7 11.7 8.1
Thailand * * * * * * * * * *
Others 138.6 154.8 129.9 157.7 135.7 127.1 124.4 127.0 135.0 84.4
Total 665.4 765.8 731.7 762.7 712.8 729.8 839.4 866.6 950.0 1019.2
Country 1999 2000 2001 2002 2003 2004 2005 2006 2007 2008
France 244.1 256.7 294.2 280.5 253.8 263.8 214.2 246.7 243.7 241.9
Germany 158.3 190.7 199.9 164.4 168.6 166.6 163.3 203.8 212.7 201.3Italy 116.1 138.3 169.9 177.4 204.5 178.3 161.0 198.0 174.5 174.5
Spain 103.2 143.8 136.8 146.5 173.3 161.1 146.3 171.8 156.8 170.6
Belgium 127.8 141.0 144.6 146.1 143.1 131.8 124.0 153.7 168.7 168.0
UK 88.9 105.6 121.7 116.5 109.7 105.6 100.7 144.1 173.9 158.5
Netherlands 65.8 64.5 65.9 91.7 98.8 96.7 98.9 109.5 150.5 135.9
Sweden 60.9 67.1 68.4 61.2 64.4 60.0 59.2 75.8 81.6 92.1
Portugal 52.2 67.1 76.0 72.2 78.6 91.6 63.5 80.3 78.1 70.2
Russian Fed * * * * * * 61.8 60.2 74.4 69.7
Morocco 19.8 29.9 41.4 46.8 43.0 50.6 52.0 55.0 52.6 58.5
Norway 21.9 25.5 25.3 26.2 23.9 27.1 27.8 28.3 31.6 31.3
China 25.5 26.9 20.9 31.7 21.9 15.6 25.6 28.4 21.3 30.2
Denmark 21.2 26.2 16.4 20.2 21.9 21.5 17.9 27.0 31.0 28.8 Austria 15.6 19.6 19.4 17.6 20.8 19.9 20.0 23.4 26.9 27.6
Ireland 17.6 15.4 19.4 19.1 22.2 23.2 25.7 27.7 36.2 23.4
Greece * * * * * * 12.1 17.8 20.1 20.1
Ukraine * * * * * * * * * 17.5
Switzerland 14.8 17.2 17.1 13.1 12.7 11.3 9.8 10.9 13.2 14.0
Japan 11.1 16.3 14.5 15.3 19.9 12.5 9.2 9.9 8.1 12.9
Luxembug * * * * * * * * * 10.2
Finland * * * * * * * * * 9.7
Poland 12.0 11.7 11.6 11.2 11.9 6.2 4.9 4.9 7.2 9.5
Thailand * * * * * * 10.1 5.7 2.4 7.5
Others 58.0 84.5 100.1 125.1 126.7 129.2 69.6 88.6 99.7 73.8
Total 1234.8 1448.2 1563.6 1582.8 1619.7 1572.6 1467.5 1765.7 1862.7 1850.0* included under "others"
AN 010084.1002.
Source: EUROSTAT - 20100209.
Total EU exports of shrimps, by country of destination,
in Euro/ECU million
56
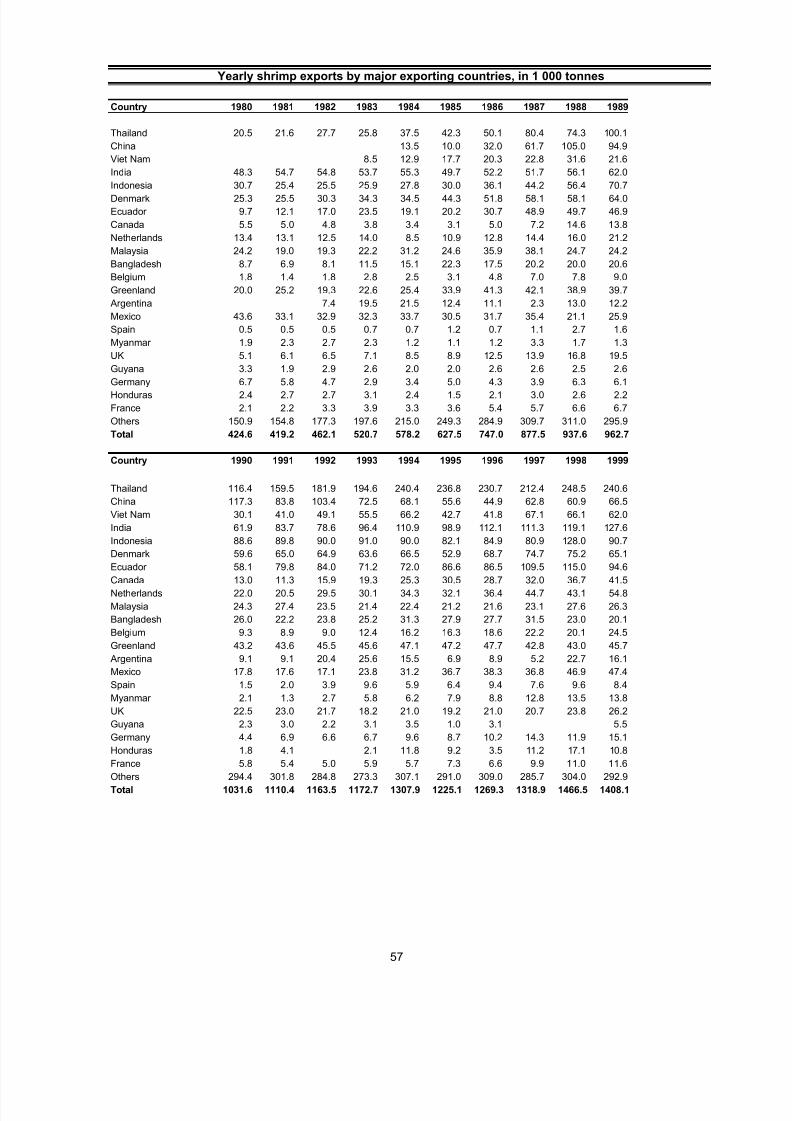
5/13/2018 Globefish Commodity Update Shrimp 2010 - slidepdf.com
http://slidepdf.com/reader/full/globefish-commodity-update-shrimp-2010 63/78
Country 1980 1981 1982 1983 1984 1985 1986 1987 1988 1989
Thailand 20.5 21.6 27.7 25.8 37.5 42.3 50.1 80.4 74.3 100.1
China 13.5 10.0 32.0 61.7 105.0 94.9
Viet Nam 8.5 12.9 17.7 20.3 22.8 31.6 21.6
India 48.3 54.7 54.8 53.7 55.3 49.7 52.2 51.7 56.1 62.0Indonesia 30.7 25.4 25.5 25.9 27.8 30.0 36.1 44.2 56.4 70.7
Denmark 25.3 25.5 30.3 34.3 34.5 44.3 51.8 58.1 58.1 64.0
Ecuador 9.7 12.1 17.0 23.5 19.1 20.2 30.7 48.9 49.7 46.9
Canada 5.5 5.0 4.8 3.8 3.4 3.1 5.0 7.2 14.6 13.8
Netherlands 13.4 13.1 12.5 14.0 8.5 10.9 12.8 14.4 16.0 21.2
Malaysia 24.2 19.0 19.3 22.2 31.2 24.6 35.9 38.1 24.7 24.2
Bangladesh 8.7 6.9 8.1 11.5 15.1 22.3 17.5 20.2 20.0 20.6
Belgium 1.8 1.4 1.8 2.8 2.5 3.1 4.8 7.0 7.8 9.0
Greenland 20.0 25.2 19.3 22.6 25.4 33.9 41.3 42.1 38.9 39.7
Argentina 7.4 19.5 21.5 12.4 11.1 2.3 13.0 12.2
Mexico 43.6 33.1 32.9 32.3 33.7 30.5 31.7 35.4 21.1 25.9
Spain 0.5 0.5 0.5 0.7 0.7 1.2 0.7 1.1 2.7 1.6
Myanmar 1.9 2.3 2.7 2.3 1.2 1.1 1.2 3.3 1.7 1.3
UK 5.1 6.1 6.5 7.1 8.5 8.9 12.5 13.9 16.8 19.5Guyana 3.3 1.9 2.9 2.6 2.0 2.0 2.6 2.6 2.5 2.6
Germany 6.7 5.8 4.7 2.9 3.4 5.0 4.3 3.9 6.3 6.1
Honduras 2.4 2.7 2.7 3.1 2.4 1.5 2.1 3.0 2.6 2.2
France 2.1 2.2 3.3 3.9 3.3 3.6 5.4 5.7 6.6 6.7
Others 150.9 154.8 177.3 197.6 215.0 249.3 284.9 309.7 311.0 295.9
Total 424.6 419.2 462.1 520.7 578.2 627.5 747.0 877.5 937.6 962.7
Country 1990 1991 1992 1993 1994 1995 1996 1997 1998 1999
Thailand 116.4 159.5 181.9 194.6 240.4 236.8 230.7 212.4 248.5 240.6
China 117.3 83.8 103.4 72.5 68.1 55.6 44.9 62.8 60.9 66.5
Viet Nam 30.1 41.0 49.1 55.5 66.2 42.7 41.8 67.1 66.1 62.0
India 61.9 83.7 78.6 96.4 110.9 98.9 112.1 111.3 119.1 127.6Indonesia 88.6 89.8 90.0 91.0 90.0 82.1 84.9 80.9 128.0 90.7
Denmark 59.6 65.0 64.9 63.6 66.5 52.9 68.7 74.7 75.2 65.1
Ecuador 58.1 79.8 84.0 71.2 72.0 86.6 86.5 109.5 115.0 94.6
Canada 13.0 11.3 15.9 19.3 25.3 30.5 28.7 32.0 36.7 41.5
Netherlands 22.0 20.5 29.5 30.1 34.3 32.1 36.4 44.7 43.1 54.8
Malaysia 24.3 27.4 23.5 21.4 22.4 21.2 21.6 23.1 27.6 26.3
Bangladesh 26.0 22.2 23.8 25.2 31.3 27.9 27.7 31.5 23.0 20.1
Belgium 9.3 8.9 9.0 12.4 16.2 16.3 18.6 22.2 20.1 24.5
Greenland 43.2 43.6 45.5 45.6 47.1 47.2 47.7 42.8 43.0 45.7
Argentina 9.1 9.1 20.4 25.6 15.5 6.9 8.9 5.2 22.7 16.1
Mexico 17.8 17.6 17.1 23.8 31.2 36.7 38.3 36.8 46.9 47.4
Spain 1.5 2.0 3.9 9.6 5.9 6.4 9.4 7.6 9.6 8.4
Myanmar 2.1 1.3 2.7 5.8 6.2 7.9 8.8 12.8 13.5 13.8
UK 22.5 23.0 21.7 18.2 21.0 19.2 21.0 20.7 23.8 26.2Guyana 2.3 3.0 2.2 3.1 3.5 1.0 3.1 5.5
Germany 4.4 6.9 6.6 6.7 9.6 8.7 10.2 14.3 11.9 15.1
Honduras 1.8 4.1 2.1 11.8 9.2 3.5 11.2 17.1 10.8
France 5.8 5.4 5.0 5.9 5.7 7.3 6.6 9.9 11.0 11.6
Others 294.4 301.8 284.8 273.3 307.1 291.0 309.0 285.7 304.0 292.9
Total 1031.6 1110.4 1163.5 1172.7 1307.9 1225.1 1269.3 1318.9 1466.5 1408.1
Yearly shrimp exports by major exporting countries, in 1 000 tonnes
57

5/13/2018 Globefish Commodity Update Shrimp 2010 - slidepdf.com
http://slidepdf.com/reader/full/globefish-commodity-update-shrimp-2010 64/78
Country 2000 2001 2002 2003 2004 2005 2006 2007
Thailand 249.6 255.6 211.7 234.0 240.9 283.0 346.2 356.0
China 93.9 106.0 132.6 188.5 220.7 223.2 270.3 258.7
Viet Nam 67.3 102.3 119.3 156.8 177.4 212.1 223.1 237.8
India 128.8 140.6 169.9 174.8 169.5 200.8 185.3 153.9Indonesia 104.8 115.4 112.1 122.7 130.5 145.1 161.8 140.3
Denmark 98.4 91.2 106.6 114.9 151.0 161.3 168.3 138.0
Ecuador 34.5 45.0 46.3 53.6 67.5 91.3 119.0 125.9
Canada 43.5 55.8 75.6 77.9 93.8 95.0 108.1 115.0
Netherlands 57.4 48.9 53.2 64.3 67.5 71.3 71.5 75.2
Malaysia 33.0 39.0 42.8 50.3 64.0 70.7 62.9 72.6
Bangladesh 28.7 33.5 29.5 33.0 39.9 37.7 43.2 65.0
Belgium 21.1 23.0 27.9 37.2 41.5 44.2 54.4 57.1
Greenland 51.0 51.8 58.6 70.2 70.7 82.0 74.0 48.7
Argentina 32.8 61.7 52.4 47.1 27.5 7.0 39.2 44.9
Mexico 37.7 39.9 26.7 27.2 30.7 28.9 36.9 41.7
Spain 11.6 16.6 23.0 19.4 20.6 15.6 20.3 30.0
Myanmar 15.5 19.5 21.5 22.9 23.0 26.9 23.3 23.3
UK 27.3 28.7 30.8 29.4 25.2 22.7 22.5 22.7Guyana 12.5 15.9 12.2 5.6 5.5 15.2 15.1 20.6
Germany 18.6 11.3 14.8 17.6 19.5 16.4 20.5 19.9
Honduras 10.4 11.7 15.4 18.6 21.4 22.3 28.0 19.7
France 11.0 10.6 9.3 13.8 15.7 17.2 16.4 17.7
Others 334.8 327.1 363.0 393.1 386.6 383.2 372.0 334.1
Total 1524.2 1651.0 1754.8 1973.0 2110.4 2273.0 2482.6 2419.0
AN 010082. 1002.
Source: Fishstat Plus - 20100205.
Country 1980 1981 1982 1983 1984 1985 1986 1987 1988 1989 1990 1991 1992
Thailand 106.1 109.0 138.4 157.2 181.6 184.3 236.9 323.6 487.6 749.5 1003.2 1317.4 1572.3
Viet Nam 33.3 51.6 61.7 75.2 114.1 147.6 74.3 112.3 172.1 213.7
China 95.7 66.9 226.8 370.9 583.3 532.6 698.5 507.1 593.5
Indonesia 178.0 165.3 181.2 191.7 194.1 196.5 284.5 351.5 496.1 522.2 653.2 728.9 716.5
India 235.4 288.4 319.1 307.7 289.7 254.7 301.3 309.5 332.5 302.0 346.5 462.0 455.5
Denmark 88.4 95.5 104.2 130.0 122.6 152.3 260.1 354.6 386.9 382.5 399.4 415.8 394.0
Ecuador 71.8 83.9 129.7 185.7 146.7 158.9 284.7 385.7 341.3 334.6 372.8 493.8 516.1
Netherlands 60.5 58.4 51.8 51.6 39.3 41.1 63.1 93.1 102.0 130.2 164.2 149.2 172.9
Bangladesh 38.9 36.6 45.0 63.0 70.1 78.5 99.1 125.5 141.5 146.6 151.1 140.1 140.6
Belgium 8.5 6.7 9.4 15.7 12.6 15.6 30.7 45.0 53.0 58.8 71.5 69.4 70.6
Canada 26.6 21.7 19.2 19.8 18.0 16.6 25.8 40.2 73.1 62.5 61.3 48.9 70.4
Mexico 495.0 415.1 424.3 370.8 402.1 326.6 354.0 435.0 277.1 338.0 203.1 223.8 172.7
Malaysia 62.0 43.5 48.8 30.5 47.8 42.8 55.4 74.4 115.1 108.2 119.2 140.8 131.7
Argentina 24.1 61.4 87.1 49.0 51.8 19.4 77.0 77.6 53.5 68.8 146.9
Spain 1.3 3.2 4.0 5.9 5.3 9.7 7.1 12.6 20.5 16.7 18.3 19.2 32.7
UK 28.2 31.9 32.6 33.9 36.1 39.6 66.8 84.6 108.6 113.3 147.3 154.5 131.3
France 18.1 16.5 23.2 28.7 22.3 26.4 48.9 58.1 65.2 61.2 59.5 51.6 49.2
Germany 14.7 13.9 12.6 7.6 8.5 9.4 11.0 10.7 31.8 34.9 29.4 35.8 28.0
Greenland 87.1 96.5 64.1 82.0 84.8 109.4 180.9 245.9 244.5 248.1 292.5 266.4 255.5
Morocco 0.1 1.3 0.9 1.1 1.8 2.1 2.7 3.1 7.6 4.6 11.2 11.6 20.1
Madagascar 17.5 16.7 21.5 24.0 23.1 22.6 25.8 41.8 31.1 32.5 39.7 42.2 31.3
USA 66.1 67.7 58.9 78.9 51.6 52.4 74.6 83.1 85.9 96.7 167.8 164.9 166.6
Others 852.3 900.6 1117.8 1263.7 1245.4 1391.0 1973.9 2313.5 2278.5 1907.7 1891.3 1983.0 1847.1
Total 2456.7 2472.4 2830.6 3144.1 3237.7 3308.2 4741.3 5895.8 6488.0 6335.3 7067.0 7667.1 7929.2
Yearly shrimp exports, by major exporting countries, in USD million
Yearly shrimp exports by major exporting countries, in 1 000 tonnes (cont.)
58
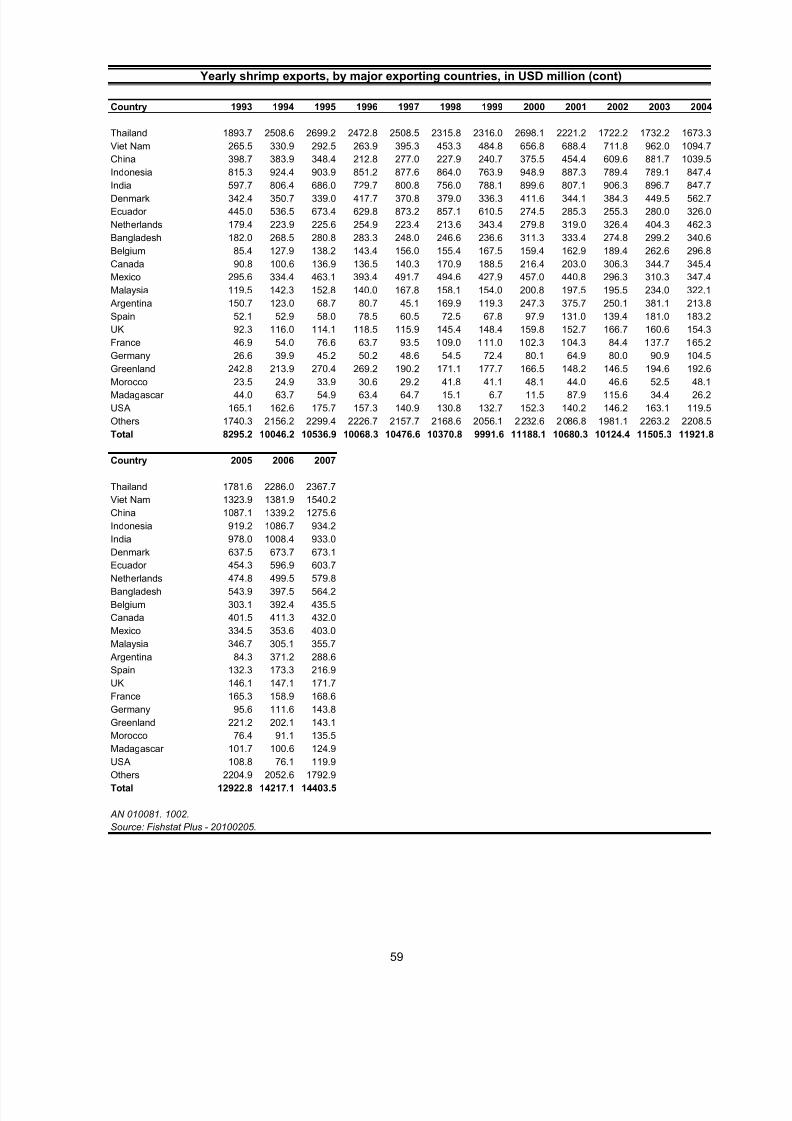
5/13/2018 Globefish Commodity Update Shrimp 2010 - slidepdf.com
http://slidepdf.com/reader/full/globefish-commodity-update-shrimp-2010 65/78
Country 1993 1994 1995 1996 1997 1998 1999 2000 2001 2002 2003 2004
Thailand 1893.7 2508.6 2699.2 2472.8 2508.5 2315.8 2316.0 2698.1 2221.2 1722.2 1732.2 1673.3
Viet Nam 265.5 330.9 292.5 263.9 395.3 453.3 484.8 656.8 688.4 711.8 962.0 1094.7
China 398.7 383.9 348.4 212.8 277.0 227.9 240.7 375.5 454.4 609.6 881.7 1039.5
Indonesia 815.3 924.4 903.9 851.2 877.6 864.0 763.9 948.9 887.3 789.4 789.1 847.4India 597.7 806.4 686.0 729.7 800.8 756.0 788.1 899.6 807.1 906.3 896.7 847.7
Denmark 342.4 350.7 339.0 417.7 370.8 379.0 336.3 411.6 344.1 384.3 449.5 562.7
Ecuador 445.0 536.5 673.4 629.8 873.2 857.1 610.5 274.5 285.3 255.3 280.0 326.0
Netherlands 179.4 223.9 225.6 254.9 223.4 213.6 343.4 279.8 319.0 326.4 404.3 462.3
Bangladesh 182.0 268.5 280.8 283.3 248.0 246.6 236.6 311.3 333.4 274.8 299.2 340.6
Belgium 85.4 127.9 138.2 143.4 156.0 155.4 167.5 159.4 162.9 189.4 262.6 296.8
Canada 90.8 100.6 136.9 136.5 140.3 170.9 188.5 216.4 203.0 306.3 344.7 345.4
Mexico 295.6 334.4 463.1 393.4 491.7 494.6 427.9 457.0 440.8 296.3 310.3 347.4
Malaysia 119.5 142.3 152.8 140.0 167.8 158.1 154.0 200.8 197.5 195.5 234.0 322.1
Argentina 150.7 123.0 68.7 80.7 45.1 169.9 119.3 247.3 375.7 250.1 381.1 213.8
Spain 52.1 52.9 58.0 78.5 60.5 72.5 67.8 97.9 131.0 139.4 181.0 183.2
UK 92.3 116.0 114.1 118.5 115.9 145.4 148.4 159.8 152.7 166.7 160.6 154.3
France 46.9 54.0 76.6 63.7 93.5 109.0 111.0 102.3 104.3 84.4 137.7 165.2
Germany 26.6 39.9 45.2 50.2 48.6 54.5 72.4 80.1 64.9 80.0 90.9 104.5Greenland 242.8 213.9 270.4 269.2 190.2 171.1 177.7 166.5 148.2 146.5 194.6 192.6
Morocco 23.5 24.9 33.9 30.6 29.2 41.8 41.1 48.1 44.0 46.6 52.5 48.1
Madagascar 44.0 63.7 54.9 63.4 64.7 15.1 6.7 11.5 87.9 115.6 34.4 26.2
USA 165.1 162.6 175.7 157.3 140.9 130.8 132.7 152.3 140.2 146.2 163.1 119.5
Others 1740.3 2156.2 2299.4 2226.7 2157.7 2168.6 2056.1 2232.6 2086.8 1981.1 2263.2 2208.5
Total 8295.2 10046.2 10536.9 10068.3 10476.6 10370.8 9991.6 11188.1 10680.3 10124.4 11505.3 11921.8
Country 2005 2006 2007
Thailand 1781.6 2286.0 2367.7
Viet Nam 1323.9 1381.9 1540.2
China 1087.1 1339.2 1275.6
Indonesia 919.2 1086.7 934.2
India 978.0 1008.4 933.0
Denmark 637.5 673.7 673.1
Ecuador 454.3 596.9 603.7
Netherlands 474.8 499.5 579.8
Bangladesh 543.9 397.5 564.2
Belgium 303.1 392.4 435.5
Canada 401.5 411.3 432.0
Mexico 334.5 353.6 403.0
Malaysia 346.7 305.1 355.7
Argentina 84.3 371.2 288.6
Spain 132.3 173.3 216.9
UK 146.1 147.1 171.7
France 165.3 158.9 168.6
Germany 95.6 111.6 143.8Greenland 221.2 202.1 143.1
Morocco 76.4 91.1 135.5
Madagascar 101.7 100.6 124.9
USA 108.8 76.1 119.9
Others 2204.9 2052.6 1792.9
Total 12922.8 14217.1 14403.5
AN 010081. 1002.
Source: Fishstat Plus - 20100205.
Yearly shrimp exports, by major exporting countries, in USD million (cont)
59

5/13/2018 Globefish Commodity Update Shrimp 2010 - slidepdf.com
http://slidepdf.com/reader/full/globefish-commodity-update-shrimp-2010 66/78
Country 1980 1981 1982 1983 1984 1985 1986 1987 1988 1989 1990 1991
Viet Nam 33.3 48.5 58.6 72.5 112.1 142.9 74.0 112.3 171.8
Thailand 97.5 100.7 128.8 148.5 133.7 140.1 184.7 252.9 385.4 630.5 806.6 1054.5
Indonesia 177.9 161.8 180.7 191.6 194.1 196.1 284.2 350.5 495.1 520.0 650.4 727.8India 233.3 287.7 318.5 307.4 289.3 254.5 300.8 309.1 332.2 301.8 346.4 461.5
Ecuador 71.8 83.9 129.7 185.7 146.7 158.9 284.7 385.7 341.3 334.6 372.8 493.8
Bangladesh 38.9 36.6 44.8 62.7 69.6 78.0 99.1 125.4 141.4 146.6 151.1 140.1
Mexico 495.0 415.1 424.3 370.8 401.9 326.4 354.0 435.0 277.1 338.0 203.1 223.8
Denmark 64.7 70.7 64.4 79.3 75.1 94.9 152.0 230.9 227.2 234.5 230.1 247.8
Belgium 4.3 2.8 4.3 9.6 7.8 8.7 15.9 20.4 28.1 33.6 40.8 41.1
Netherlands 36.4 33.0 26.4 29.7 19.9 19.5 27.1 39.0 48.2 56.9 68.4 62.9
Malaysia 57.5 37.7 43.9 24.2 42.2 37.5 48.4 63.7 74.5 69.5 78.7 101.3
Canada 26.6 21.7 19.2 19.8 18.0 16.6 25.8 40.2 65.2 56.6 52.4 37.3
Argentina 24.1 61.4 87.1 49.0 51.8 19.4 77.0 77.6 53.5 68.7
Spain 1.3 3.2 4.0 5.9 5.3 9.7 7.1 12.6 20.1 16.4 18.0 18.7
China 95.7 66.9 226.8 368.8 579.7 529.1 696.0 504.7
France 18.1 16.5 23.2 28.7 22.3 26.4 48.9 58.0 59.2 54.6 52.0 46.1
UK 26.6 31.0 32.0 33.2 35.7 39.3 66.0 83.6 88.0 93.2 121.8 127.7Morocco 0.1 1.3 0.9 1.1 1.8 2.1 2.7 3.1 7.6 4.6 11.2 11.6
Madagascar 17.5 16.7 21.5 24.0 23.1 22.6 25.8 41.8 31.1 32.5 39.7 42.2
Myanmar 7.7 7.8 9.9 10.8 5.3 5.8 8.4 2.8 9.2 6.8 11.7 5.6
Germany 14.7 13.9 12.6 7.6 8.5 9.4 11.0 10.7 15.8 19.5 22.5 27.6
Honduras 9.6 13.7 15.3 20.0 15.2 9.6 25.8 37.2 17.8 20.5 10.0 20.9
Others 817.7 899.7 1074.6 1195.1 1178.1 1329.4 1931.8 2326.8 2342.1 1927.0 1987.4 2098.7
Total 2216.9 2255.5 2603.0 2850.3 2924.7 2960.1 4255.5 5329.6 5806.3 5578.3 6136.9 6736.1
Country 1992 1993 1994 1995 1996 1997 1998 1999 2000 2001 2002 2003
Viet Nam 209.0 265.3 330.5 283.4 249.4 389.7 449.0 482.3 654.2 673.8 681.1 931.1
Thailand 1252.6 1511.1 1968.2 2041.6 1721.9 1566.7 1411.8 1278.5 1507.0 1232.5 801.1 867.0
Indonesia 715.4 813.9 922.9 901.4 848.3 875.5 862.2 762.3 947.0 884.7 788.1 788.8
India 455.4 595.5 803.8 684.8 724.3 799.7 755.6 783.1 897.5 802.1 891.0 828.1
Ecuador 516.1 445.0 536.5 673.4 629.8 873.0 853.1 607.2 272.0 280.3 251.4 276.1
Bangladesh 140.6 182.0 268.5 280.7 283.3 248.0 246.6 236.6 311.3 333.4 274.8 299.2
Mexico 172.7 295.6 334.4 463.0 392.8 491.0 494.5 427.8 457.0 437.3 286.0 301.3
Denmark 216.9 168.6 170.9 172.6 232.1 201.2 198.4 166.7 225.2 172.7 210.3 241.9
Belgium 41.9 59.3 97.1 100.9 111.7 112.3 115.4 127.6 124.9 127.1 146.8 206.3
Netherlands 69.7 82.2 94.1 96.5 97.7 105.1 87.5 180.9 139.3 172.2 175.2 219.1
Malaysia 96.1 85.2 104.9 123.0 113.8 138.1 131.1 131.4 175.0 170.8 169.5 204.5
Canada 59.0 78.9 91.9 123.6 123.1 110.4 128.1 119.3 120.8 125.0 234.3 259.4
Argentina 146.9 150.7 123.0 68.7 80.6 44.7 169.9 119.3 247.1 375.7 250.0 380.9
Spain 32.2 51.6 52.3 56.8 76.5 58.6 70.6 65.8 95.2 128.4 137.3 177.7
China 590.6 394.2 379.6 343.3 197.0 249.2 213.9 223.8 325.5 303.2 302.5 435.1
France 44.0 42.9 46.6 68.8 57.3 88.1 103.7 105.1 96.6 97.7 76.7 128.3
UK 110.6 71.4 90.5 96.1 98.6 95.3 123.8 125.8 132.4 131.1 148.5 141.4Morocco 20.1 23.5 24.9 33.9 30.6 29.2 41.8 41.1 48.1 44.0 46.6 52.5
Madagascar 31.3 44.0 63.7 54.9 63.4 64.7 15.1 6.7 11.4 87.9 115.6 34.4
Myanmar 6.4 34.4 45.2 63.2 72.4 95.6 91.9 97.0 90.7 104.2 94.4 105.2
Germany 22.0 22.3 34.5 35.3 38.9 39.8 40.0 53.5 64.2 48.2 64.1 70.4
Honduras 10.5 66.2 124.5 143.6 153.1 187.1 149.7 147.6 174.8 79.2 224.6
Others 1922.4 1706.9 1957.4 1974.1 1895.8 1762.2 1716.0 1662.2 1882.6 1671.7 1637.9 1784.7
Total 6872.0 7134.7 8607.6 8864.5 8283.0 8591.1 8507.1 7953.8 8972.6 8578.8 7862.4 8958.2
Yearly chilled and frozen shrimps exports, by major
exporting countries, in USD million
60

5/13/2018 Globefish Commodity Update Shrimp 2010 - slidepdf.com
http://slidepdf.com/reader/full/globefish-commodity-update-shrimp-2010 67/78
Country 2004 2005 2006 2007
Viet Nam 1061.7 1246.4 1246.6 1377.5
Thailand 809.3 942.4 1141.8 1244.8
Indonesia 773.8 806.6 944.0 794.8India 769.8 855.2 870.7 793.0
Ecuador 320.0 447.7 590.2 599.3
Bangladesh 340.6 543.9 397.5 563.8
Mexico 346.9 334.5 353.6 402.8
Denmark 308.5 377.5 389.8 350.0
Belgium 232.9 237.5 308.9 346.3
Netherlands 275.0 285.9 290.0 337.1
Malaysia 285.3 315.3 271.7 321.0
Canada 240.6 276.8 272.6 292.9
Argentina 213.7 84.3 371.2 288.6
Spain 180.8 129.3 169.0 212.3
China 447.3 359.8 223.6 203.0
France 152.0 145.3 138.5 145.0
UK 137.4 129.1 128.5 136.8Morocco 48.1 76.4 90.0 129.3
Madagascar 26.2 101.5 100.2 124.4
Myanmar 113.5 113.7 102.2 115.0
Germany 82.1 71.1 80.9 103.0
Honduras 100.4 109.0 128.1 91.8
Others 1782.7 1793.8 1657.1 1421.4
Total 9048.6 9783.0 10266.8 10393.8
AN 010080. 1002.
Source: Fishstat Plus - 20100205.
Country 1980 1981 1982 1983 1984 1985 1986 1987 1988 1989 1990 1991
Viet Nam 8.5 11.6 16.2 19.1 21.9 30.5 21.6 30.1 40.9
Thailand 18.4 19.4 25.4 23.7 23.7 28.3 33.8 60.9 51.2 75.3 85.7 122.1
Ecuador 9.7 12.1 17.0 23.5 19.1 20.2 30.7 48.9 49.7 46.9 58.1 79.8
India 47.8 54.5 54.6 53.6 55.2 49.5 52.1 51.6 56.0 62.0 61.9 83.6
Indonesia 30.5 24.6 25.4 25.8 27.8 29.8 36.0 43.6 56.0 70.3 88.0 89.3
Denmark 23.0 22.8 25.4 28.2 28.0 35.3 40.9 48.0 43.0 49.2 43.8 46.6
Canada 5.5 5.0 4.8 3.8 3.4 3.1 5.0 7.2 13.1 13.0 11.7 10.0
Bangladesh 8.7 6.9 8.1 11.5 15.0 22.3 17.5 20.1 20.0 20.6 26.0 22.2
Malaysia 14.1 8.9 9.6 10.3 19.3 14.6 25.4 28.2 15.5 13.5 14.6 16.4
China 13.5 10.0 32.0 60.7 102.5 93.0 116.0 82.8
Netherlands 9.5 9.0 8.5 10.2 5.4 7.1 7.9 8.3 9.9 13.1 12.9 10.9
Belgium 0.9 0.6 0.8 1.4 1.2 1.3 1.7 2.4 3.3 4.2 4.6 4.6
Argentina 7.4 19.5 21.5 12.4 11.1 2.3 13.0 12.2 9.1 9.1
Mexico 43.6 33.1 32.9 32.3 33.7 30.4 31.7 35.4 21.1 25.9 17.8 17.6
Greenland 13.8 18.7 14.8 18.1 19.8 27.0 33.1 33.5 29.8 29.6 31.5 31.9
Spain 0.5 0.5 0.5 0.7 0.7 1.2 0.7 1.1 2.6 1.5 1.5 1.9
Myanmar 1.9 2.3 2.7 2.3 1.2 1.1 1.2 3.3 1.7 1.3 2.1 1.3
Guyana 3.3 1.9 2.9 2.6 2.0 2.0 2.6 2.6 2.5 2.6 2.3 3.0
Honduras 2.4 2.7 2.7 3.1 2.4 1.5 2.1 3.0 2.6 2.2 1.8 4.1
UK 4.8 6.0 6.3 7.0 8.4 8.8 12.3 13.7 13.4 15.9 18.7 19.1
Brazil 7.5 8.8 9.2 9.0 12.3 16.0 12.2 11.6 13.0 11.5 8.3 7.0
Colombia 1.8 1.5 1.7 1.1 1.6 2.3 3.0 3.3 4.0 3.5 2.7 13.7Others 133.4 136.8 155.4 168.1 179.1 201.4 254.1 281.8 284.0 261.2 260.1 263.1
Total 381.1 376.1 416.0 464.3 505.7 541.8 666.0 793.2 838.2 850.1 909.0 981.1
Yearly chilled and frozen shrimps exports, by major
exporting countries, in 1 000 tonnes
Yearly chilled and frozen shrimps exports, by major
exporting countries, in USD million (cont.)
61
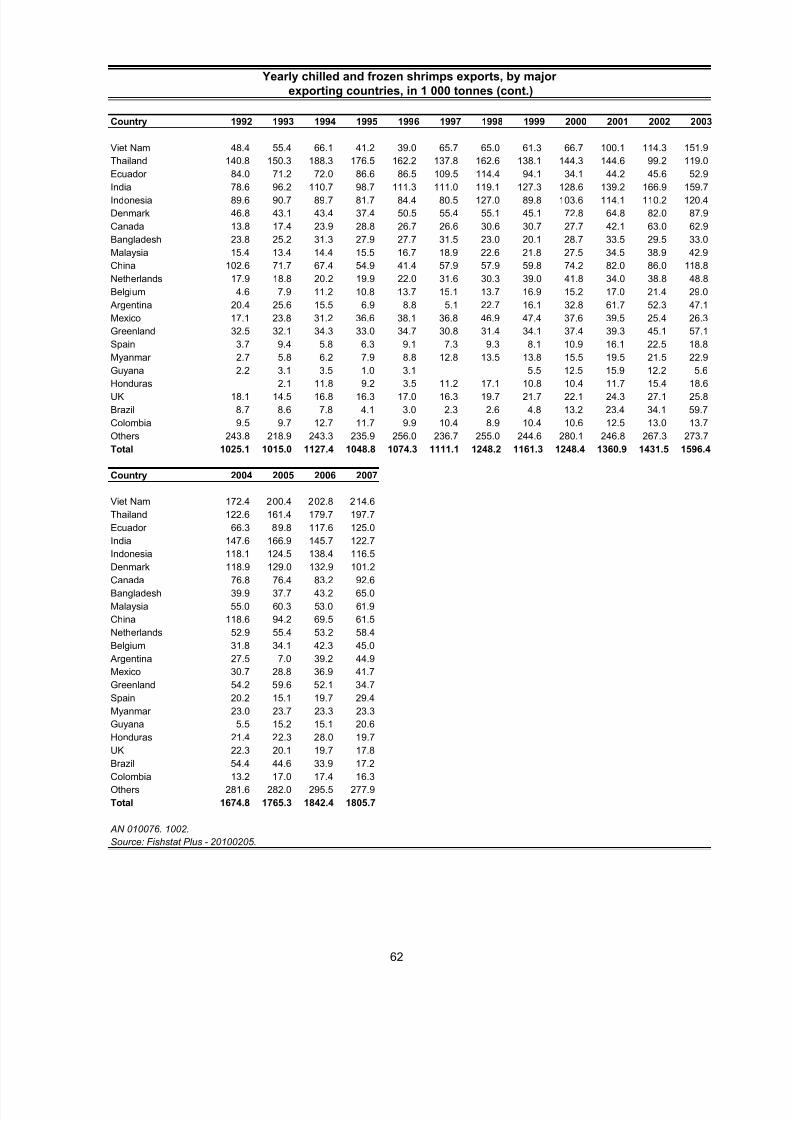
5/13/2018 Globefish Commodity Update Shrimp 2010 - slidepdf.com
http://slidepdf.com/reader/full/globefish-commodity-update-shrimp-2010 68/78
Country 1992 1993 1994 1995 1996 1997 1998 1999 2000 2001 2002 2003
Viet Nam 48.4 55.4 66.1 41.2 39.0 65.7 65.0 61.3 66.7 100.1 114.3 151.9
Thailand 140.8 150.3 188.3 176.5 162.2 137.8 162.6 138.1 144.3 144.6 99.2 119.0
Ecuador 84.0 71.2 72.0 86.6 86.5 109.5 114.4 94.1 34.1 44.2 45.6 52.9India 78.6 96.2 110.7 98.7 111.3 111.0 119.1 127.3 128.6 139.2 166.9 159.7
Indonesia 89.6 90.7 89.7 81.7 84.4 80.5 127.0 89.8 103.6 114.1 110.2 120.4
Denmark 46.8 43.1 43.4 37.4 50.5 55.4 55.1 45.1 72.8 64.8 82.0 87.9
Canada 13.8 17.4 23.9 28.8 26.7 26.6 30.6 30.7 27.7 42.1 63.0 62.9
Bangladesh 23.8 25.2 31.3 27.9 27.7 31.5 23.0 20.1 28.7 33.5 29.5 33.0
Malaysia 15.4 13.4 14.4 15.5 16.7 18.9 22.6 21.8 27.5 34.5 38.9 42.9
China 102.6 71.7 67.4 54.9 41.4 57.9 57.9 59.8 74.2 82.0 86.0 118.8
Netherlands 17.9 18.8 20.2 19.9 22.0 31.6 30.3 39.0 41.8 34.0 38.8 48.8
Belgium 4.6 7.9 11.2 10.8 13.7 15.1 13.7 16.9 15.2 17.0 21.4 29.0
Argentina 20.4 25.6 15.5 6.9 8.8 5.1 22.7 16.1 32.8 61.7 52.3 47.1
Mexico 17.1 23.8 31.2 36.6 38.1 36.8 46.9 47.4 37.6 39.5 25.4 26.3
Greenland 32.5 32.1 34.3 33.0 34.7 30.8 31.4 34.1 37.4 39.3 45.1 57.1
Spain 3.7 9.4 5.8 6.3 9.1 7.3 9.3 8.1 10.9 16.1 22.5 18.8
Myanmar 2.7 5.8 6.2 7.9 8.8 12.8 13.5 13.8 15.5 19.5 21.5 22.9Guyana 2.2 3.1 3.5 1.0 3.1 5.5 12.5 15.9 12.2 5.6
Honduras 2.1 11.8 9.2 3.5 11.2 17.1 10.8 10.4 11.7 15.4 18.6
UK 18.1 14.5 16.8 16.3 17.0 16.3 19.7 21.7 22.1 24.3 27.1 25.8
Brazil 8.7 8.6 7.8 4.1 3.0 2.3 2.6 4.8 13.2 23.4 34.1 59.7
Colombia 9.5 9.7 12.7 11.7 9.9 10.4 8.9 10.4 10.6 12.5 13.0 13.7
Others 243.8 218.9 243.3 235.9 256.0 236.7 255.0 244.6 280.1 246.8 267.3 273.7
Total 1025.1 1015.0 1127.4 1048.8 1074.3 1111.1 1248.2 1161.3 1248.4 1360.9 1431.5 1596.4
Country 2004 2005 2006 2007
Viet Nam 172.4 200.4 202.8 214.6
Thailand 122.6 161.4 179.7 197.7
Ecuador 66.3 89.8 117.6 125.0India 147.6 166.9 145.7 122.7
Indonesia 118.1 124.5 138.4 116.5
Denmark 118.9 129.0 132.9 101.2
Canada 76.8 76.4 83.2 92.6
Bangladesh 39.9 37.7 43.2 65.0
Malaysia 55.0 60.3 53.0 61.9
China 118.6 94.2 69.5 61.5
Netherlands 52.9 55.4 53.2 58.4
Belgium 31.8 34.1 42.3 45.0
Argentina 27.5 7.0 39.2 44.9
Mexico 30.7 28.8 36.9 41.7
Greenland 54.2 59.6 52.1 34.7
Spain 20.2 15.1 19.7 29.4
Myanmar 23.0 23.7 23.3 23.3Guyana 5.5 15.2 15.1 20.6
Honduras 21.4 22.3 28.0 19.7
UK 22.3 20.1 19.7 17.8
Brazil 54.4 44.6 33.9 17.2
Colombia 13.2 17.0 17.4 16.3
Others 281.6 282.0 295.5 277.9
Total 1674.8 1765.3 1842.4 1805.7
AN 010076. 1002.
Source: Fishstat Plus - 20100205.
exporting countries, in 1 000 tonnes (cont.)
Yearly chilled and frozen shrimps exports, by major
62
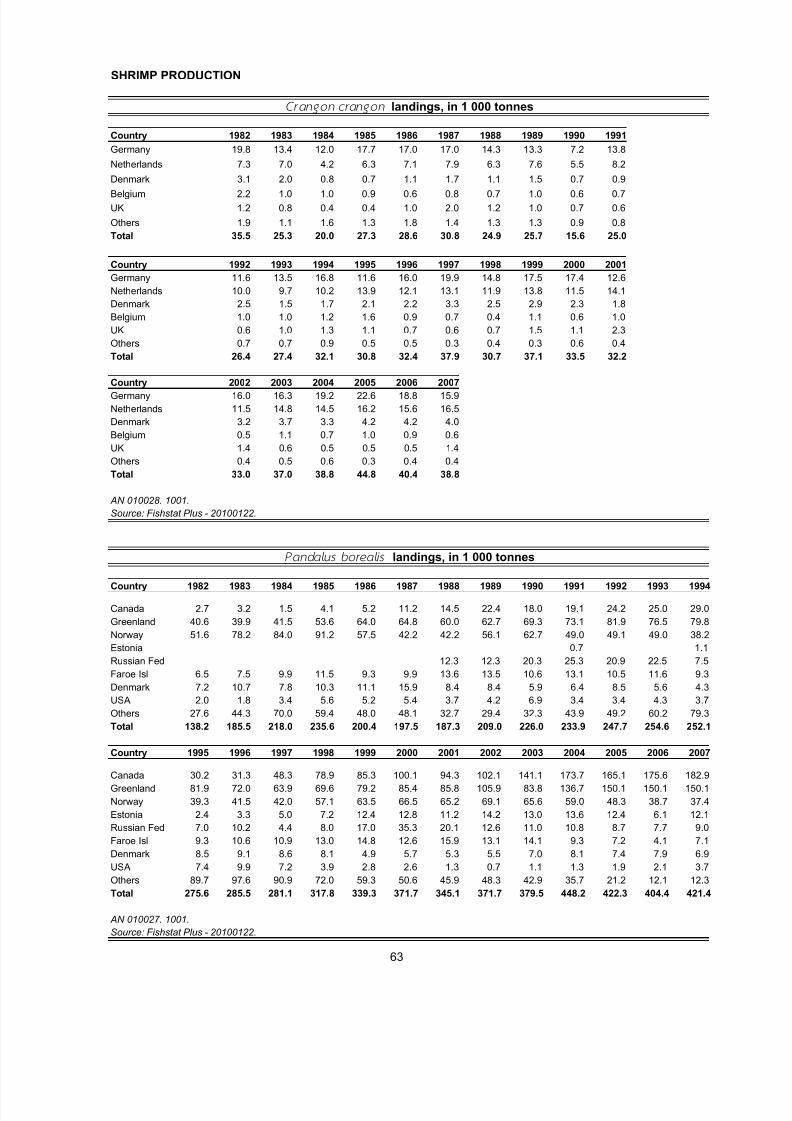
5/13/2018 Globefish Commodity Update Shrimp 2010 - slidepdf.com
http://slidepdf.com/reader/full/globefish-commodity-update-shrimp-2010 69/78
SHRIMP PRODUCTION
Country 1982 1983 1984 1985 1986 1987 1988 1989 1990 1991
Germany 19.8 13.4 12.0 17.7 17.0 17.0 14.3 13.3 7.2 13.8
Netherlands 7.3 7.0 4.2 6.3 7.1 7.9 6.3 7.6 5.5 8.2
Denmark 3.1 2.0 0.8 0.7 1.1 1.7 1.1 1.5 0.7 0.9
Belgium 2.2 1.0 1.0 0.9 0.6 0.8 0.7 1.0 0.6 0.7
UK 1.2 0.8 0.4 0.4 1.0 2.0 1.2 1.0 0.7 0.6
Others 1.9 1.1 1.6 1.3 1.8 1.4 1.3 1.3 0.9 0.8
Total 35.5 25.3 20.0 27.3 28.6 30.8 24.9 25.7 15.6 25.0
Country 1992 1993 1994 1995 1996 1997 1998 1999 2000 2001
Germany 11.6 13.5 16.8 11.6 16.0 19.9 14.8 17.5 17.4 12.6
Netherlands 10.0 9.7 10.2 13.9 12.1 13.1 11.9 13.8 11.5 14.1
Denmark 2.5 1.5 1.7 2.1 2.2 3.3 2.5 2.9 2.3 1.8
Belgium 1.0 1.0 1.2 1.6 0.9 0.7 0.4 1.1 0.6 1.0
UK 0.6 1.0 1.3 1.1 0.7 0.6 0.7 1.5 1.1 2.3
Others 0.7 0.7 0.9 0.5 0.5 0.3 0.4 0.3 0.6 0.4
Total 26.4 27.4 32.1 30.8 32.4 37.9 30.7 37.1 33.5 32.2
Country 2002 2003 2004 2005 2006 2007
Germany 16.0 16.3 19.2 22.6 18.8 15.9
Netherlands 11.5 14.8 14.5 16.2 15.6 16.5
Denmark 3.2 3.7 3.3 4.2 4.2 4.0
Belgium 0.5 1.1 0.7 1.0 0.9 0.6
UK 1.4 0.6 0.5 0.5 0.5 1.4
Others 0.4 0.5 0.6 0.3 0.4 0.4
Total 33.0 37.0 38.8 44.8 40.4 38.8
AN 010028. 1001.
Source: Fishstat Plus - 20100122.
Country 1982 1983 1984 1985 1986 1987 1988 1989 1990 1991 1992 1993 1994
Canada 2.7 3.2 1.5 4.1 5.2 11.2 14.5 22.4 18.0 19.1 24.2 25.0 29.0
Greenland 40.6 39.9 41.5 53.6 64.0 64.8 60.0 62.7 69.3 73.1 81.9 76.5 79.8
Norway 51.6 78.2 84.0 91.2 57.5 42.2 42.2 56.1 62.7 49.0 49.1 49.0 38.2
Estonia 0.7 1.1
Russian Fed 12.3 12.3 20.3 25.3 20.9 22.5 7.5
Faroe Isl 6.5 7.5 9.9 11.5 9.3 9.9 13.6 13.5 10.6 13.1 10.5 11.6 9.3
Denmark 7.2 10.7 7.8 10.3 11.1 15.9 8.4 8.4 5.9 6.4 8.5 5.6 4.3
USA 2.0 1.8 3.4 5.6 5.2 5.4 3.7 4.2 6.9 3.4 3.4 4.3 3.7
Others 27.6 44.3 70.0 59.4 48.0 48.1 32.7 29.4 32.3 43.9 49.2 60.2 79.3Total 138.2 185.5 218.0 235.6 200.4 197.5 187.3 209.0 226.0 233.9 247.7 254.6 252.1
Country 1995 1996 1997 1998 1999 2000 2001 2002 2003 2004 2005 2006 2007
Canada 30.2 31.3 48.3 78.9 85.3 100.1 94.3 102.1 141.1 173.7 165.1 175.6 182.9
Greenland 81.9 72.0 63.9 69.6 79.2 85.4 85.8 105.9 83.8 136.7 150.1 150.1 150.1
Norway 39.3 41.5 42.0 57.1 63.5 66.5 65.2 69.1 65.6 59.0 48.3 38.7 37.4
Estonia 2.4 3.3 5.0 7.2 12.4 12.8 11.2 14.2 13.0 13.6 12.4 6.1 12.1
Russian Fed 7.0 10.2 4.4 8.0 17.0 35.3 20.1 12.6 11.0 10.8 8.7 7.7 9.0
Faroe Isl 9.3 10.6 10.9 13.0 14.8 12.6 15.9 13.1 14.1 9.3 7.2 4.1 7.1
Denmark 8.5 9.1 8.6 8.1 4.9 5.7 5.3 5.5 7.0 8.1 7.4 7.9 6.9
USA 7.4 9.9 7.2 3.9 2.8 2.6 1.3 0.7 1.1 1.3 1.9 2.1 3.7
Others 89.7 97.6 90.9 72.0 59.3 50.6 45.9 48.3 42.9 35.7 21.2 12.1 12.3
Total 275.6 285.5 281.1 317.8 339.3 371.7 345.1 371.7 379.5 448.2 422.3 404.4 421.4
AN 010027. 1001.
Source: Fishstat Plus - 20100122.
Crangon crangon landings, in 1 000 tonnes
Pandalus borealis landings, in 1 000 tonnes
63
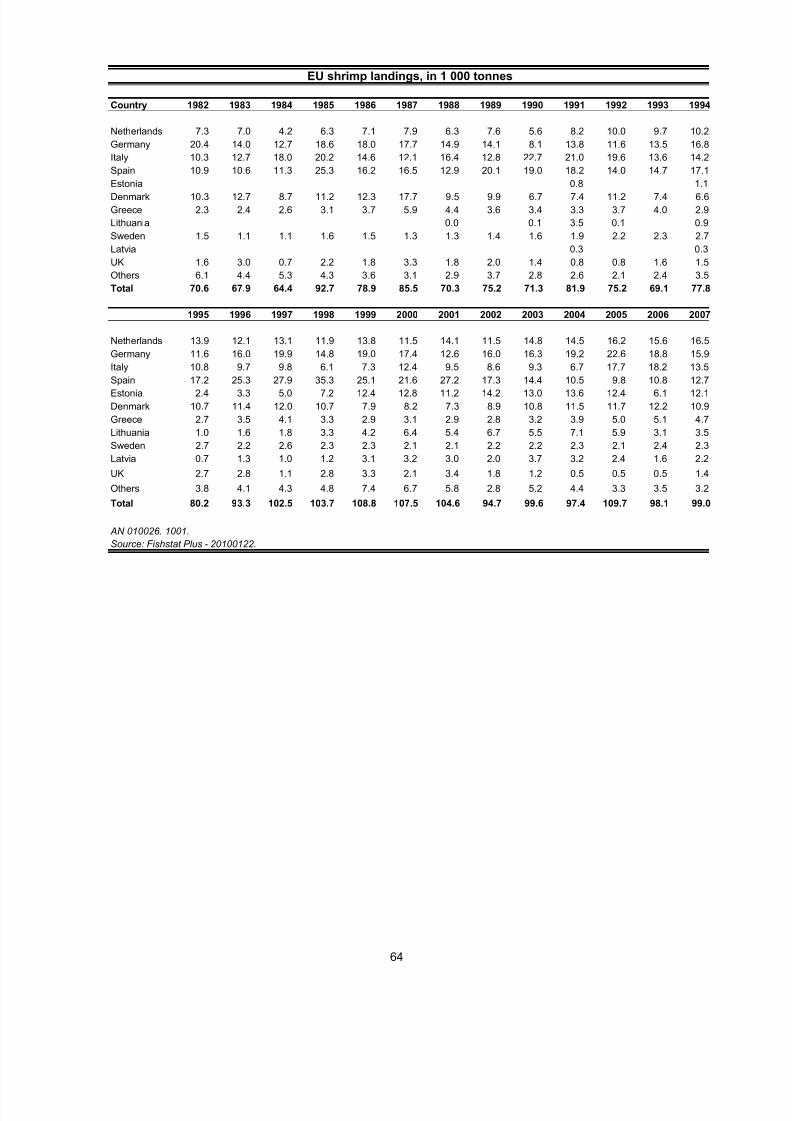
5/13/2018 Globefish Commodity Update Shrimp 2010 - slidepdf.com
http://slidepdf.com/reader/full/globefish-commodity-update-shrimp-2010 70/78
Country 1982 1983 1984 1985 1986 1987 1988 1989 1990 1991 1992 1993 1994
Netherlands 7.3 7.0 4.2 6.3 7.1 7.9 6.3 7.6 5.6 8.2 10.0 9.7 10.2
Germany 20.4 14.0 12.7 18.6 18.0 17.7 14.9 14.1 8.1 13.8 11.6 13.5 16.8
Italy 10.3 12.7 18.0 20.2 14.6 12.1 16.4 12.8 22.7 21.0 19.6 13.6 14.2
Spain 10.9 10.6 11.3 25.3 16.2 16.5 12.9 20.1 19.0 18.2 14.0 14.7 17.1
Estonia 0.8 1.1
Denmark 10.3 12.7 8.7 11.2 12.3 17.7 9.5 9.9 6.7 7.4 11.2 7.4 6.6
Greece 2.3 2.4 2.6 3.1 3.7 5.9 4.4 3.6 3.4 3.3 3.7 4.0 2.9
Lithuania 0.0 0.1 3.5 0.1 0.9
Sweden 1.5 1.1 1.1 1.6 1.5 1.3 1.3 1.4 1.6 1.9 2.2 2.3 2.7
Latvia 0.3 0.3
UK 1.6 3.0 0.7 2.2 1.8 3.3 1.8 2.0 1.4 0.8 0.8 1.6 1.5
Others 6.1 4.4 5.3 4.3 3.6 3.1 2.9 3.7 2.8 2.6 2.1 2.4 3.5
Total 70.6 67.9 64.4 92.7 78.9 85.5 70.3 75.2 71.3 81.9 75.2 69.1 77.8
1995 1996 1997 1998 1999 2000 2001 2002 2003 2004 2005 2006 2007
Netherlands 13.9 12.1 13.1 11.9 13.8 11.5 14.1 11.5 14.8 14.5 16.2 15.6 16.5
Germany 11.6 16.0 19.9 14.8 19.0 17.4 12.6 16.0 16.3 19.2 22.6 18.8 15.9Italy 10.8 9.7 9.8 6.1 7.3 12.4 9.5 8.6 9.3 6.7 17.7 18.2 13.5
Spain 17.2 25.3 27.9 35.3 25.1 21.6 27.2 17.3 14.4 10.5 9.8 10.8 12.7
Estonia 2.4 3.3 5.0 7.2 12.4 12.8 11.2 14.2 13.0 13.6 12.4 6.1 12.1
Denmark 10.7 11.4 12.0 10.7 7.9 8.2 7.3 8.9 10.8 11.5 11.7 12.2 10.9
Greece 2.7 3.5 4.1 3.3 2.9 3.1 2.9 2.8 3.2 3.9 5.0 5.1 4.7
Lithuania 1.0 1.6 1.8 3.3 4.2 6.4 5.4 6.7 5.5 7.1 5.9 3.1 3.5
Sweden 2.7 2.2 2.6 2.3 2.3 2.1 2.1 2.2 2.2 2.3 2.1 2.4 2.3
Latvia 0.7 1.3 1.0 1.2 3.1 3.2 3.0 2.0 3.7 3.2 2.4 1.6 2.2
UK 2.7 2.8 1.1 2.8 3.3 2.1 3.4 1.8 1.2 0.5 0.5 0.5 1.4
Others 3.8 4.1 4.3 4.8 7.4 6.7 5.8 2.8 5.2 4.4 3.3 3.5 3.2
Total 80.2 93.3 102.5 103.7 108.8 107.5 104.6 94.7 99.6 97.4 109.7 98.1 99.0
AN 010026. 1001.Source: Fishstat Plus - 20100122.
EU shrimp landings, in 1 000 tonnes
64

5/13/2018 Globefish Commodity Update Shrimp 2010 - slidepdf.com
http://slidepdf.com/reader/full/globefish-commodity-update-shrimp-2010 71/78
Country 1975 1976 1977 1978 1979 1980 1981 1982 1983 1984 1985 1986
China 0.7 1.2 3.9 4.5 5.7 9.8 10.1 14.9 17.1 19.3 40.7 82.8
Thailand 1.5 2.5 1.6 6.4 7.1 8.1 10.7 10.1 11.6 13.0 15.8 17.9
Viet Nam 1.2 1.5 2.0 2.5 3.2 4.0 4.9 6.1 7.4 8.0 8.0 13.0
Indonesia 9.6 14.1 21.2 21.6 23.9 23.8 28.2 30.8 27.8 32.1 37.7 41.8
India 0.7 1.4 1.9 2.5 3.1 3.9 4.8 5.9 7.3 10.0 13.0 14.0
Brazil 0.0 0.0 0.0 0.0 0.1 0.1 0.1 0.2 0.2 0.2 0.4 0.5
Ecuador 1.6 2.1 3.4 3.9 4.7 9.2 12.1 21.5 35.7 33.6 30.2 43.6
Bangladesh 3.3 3.8 4.2 4.8 5.4 6.0 6.8 7.6 8.0 8.2 11.3 14.7
Mexico - - - - - - - - - - 0.0 0.0
Philippines 1.8 2.2 2.7 3.4 2.0 0.9 1.7 1.8 12.7 29.3 29.9 31.1
Malaysia 0.0 0.0 0.0 0.0 0.0 0.0 0.0 0.2 0.2 0.1 0.1 0.3
Venezuela - - - - - - - - - - - -
Colombia - 0.0 0.0 0.0 0.0 0.0 0.0 0.1 0.1 0.1 0.2 0.3
Honduras 0.0 0.0 0.0 0.0 0.0 0.1 0.1 0.2 0.2 0.6 0.3 0.8
Sri Lanka - - - 0.0 0.0 0.0 0.0 0.0 0.0 0.0 0.3 0.4
Taiwan PC 0.8 0.9 1.4 2.2 6.3 3.8 6.0 8.7 10.3 12.0 18.6 49.6
Madagascar - - - - - - - - - - - -
Iran (Islamic Rep. of) - - - - - - - - - - - -Nicaragua - - - - - - - - 0.0 0.0 0.0 0.0
Myanmar - - - - - - - - - - - -
Saudi Arabia - - - - - - - - - - - -
Belize - - - - - - - - - - - 0.0
USA - - - - - - - - - 0.2 0.1 0.6
Australia - - - - - - - - - - 0.0 0.0
Korea Rep. 0.1 0.1 0.1 0.1 0.1 0.1 0.1 0.1 0.1 0.1 0.1 0.1
Japan 0.9 1.0 1.1 1.2 1.5 1.5 1.7 2.0 1.9 2.0 2.2 2.4
Total 22.3 31.0 43.8 53.4 63.4 71.9 88.6 112.0 142.2 172.2 213.6 319.7
Country 1987 1988 1989 1990 1991 1992 1993 1994 1995 1996 1997 1998
China 153.3 199.4 185.9 184.8 219.6 206.9 87.9 63.9 78.4 88.9 102.9 143.1
Thailand 23.6 55.6 93.5 119.5 162.1 184.9 225.5 265.5 260.7 240.3 227.6 252.7
Viet Nam 19.0 27.5 28.0 32.7 35.8 37.4 39.4 44.7 55.3 49.7 49.3 54.9
Indonesia 59.0 77.8 98.4 107.3 140.1 141.7 138.8 135.1 146.6 151.8 167.4 118.1
India 15.0 20.0 28.0 35.0 40.0 46.8 62.0 82.9 70.0 70.4 66.9 82.6
Brazil 0.5 0.8 1.3 1.7 2.0 2.1 2.1 2.1 2.0 3.4 3.6 7.3
Ecuador 69.2 74.5 70.1 76.4 105.2 113.1 83.4 88.7 105.6 107.9 132.7 144.0
Bangladesh 14.8 16.6 18.2 18.6 19.6 21.0 28.5 28.8 34.0 49.3 56.5 66.1
Mexico 0.3 0.6 2.8 4.4 5.1 8.3 11.5 13.5 15.9 13.3 17.4 23.7
Philippines 35.7 44.9 47.9 54.0 51.4 78.4 95.8 92.6 90.5 78.1 41.6 37.9
Malaysia 0.8 1.3 2.1 2.3 3.1 3.0 4.0 5.9 6.8 7.7 9.5 9.8
Venezuela - 0.0 0.1 0.2 0.6 1.3 1.5 2.2 3.1 4.0 5.0 5.2
Colombia 0.5 1.3 3.0 6.0 6.7 9.4 7.3 8.9 8.1 5.2 6.9 7.5
Honduras 1.8 2.7 3.0 3.3 4.0 5.5 8.1 8.9 7.0 9.8 9.0 8.2
Sri Lanka 0.5 0.7 0.7 1.0 1.5 2.0 2.5 3.1 3.3 3.6 3.6 6.5Taiwan PC 88.3 39.5 24.0 18.1 23.3 17.7 14.4 9.2 12.2 13.5 5.9 5.5
Madagascar - - - 0.0 0.0 0.0 0.8 0.4 1.5 2.4 2.5 2.5
Iran (Islamic Rep. of) - - - - - 0.0 0.0 0.1 0.1 0.2 0.5 0.9
Nicaragua 0.0 0.1 0.1 0.1 0.1 0.1 0.3 1.1 2.3 2.3 3.4 4.8
Myanmar - - 0.0 0.0 0.0 - - - 1.1 1.8 2.1 2.4
Saudi Arabia 0.0 0.0 0.0 0.1 0.1 0.2 0.2 0.0 0.2 0.2 0.8 1.7
Belize - - 0.5 0.1 0.2 0.3 0.6 0.7 0.9 0.7 1.2 1.6
USA 1.2 1.0 0.7 0.9 1.6 2.0 3.0 2.0 1.0 1.3 1.2 2.0
Australia 0.0 0.2 0.5 0.6 0.8 0.9 1.1 1.5 1.6 1.6 1.4 1.4
Korea Rep. 0.2 0.2 0.3 0.3 0.5 0.6 0.3 0.6 0.4 0.4 1.5 0.8
Japan 2.9 3.0 2.8 2.6 2.5 2.2 1.7 1.5 1.6 1.8 2.2 2.0
Total 494.1 576.9 621.2 679.9 838.2 897.0 835.2 882.0 929.8 927.9 945.9 1017.1
Estimates on shrimp aquaculture production, in 1 000 tonnes
65
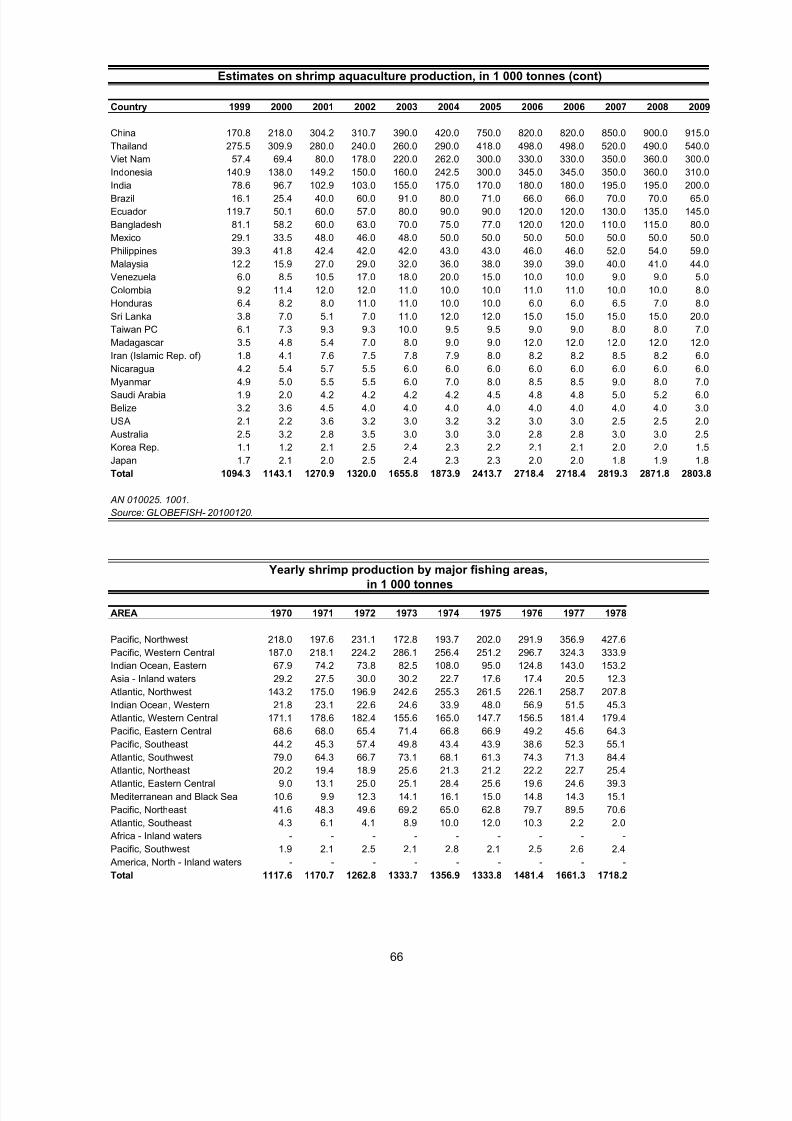
5/13/2018 Globefish Commodity Update Shrimp 2010 - slidepdf.com
http://slidepdf.com/reader/full/globefish-commodity-update-shrimp-2010 72/78
Country 1999 2000 2001 2002 2003 2004 2005 2006 2006 2007 2008 2009
China 170.8 218.0 304.2 310.7 390.0 420.0 750.0 820.0 820.0 850.0 900.0 915.0
Thailand 275.5 309.9 280.0 240.0 260.0 290.0 418.0 498.0 498.0 520.0 490.0 540.0
Viet Nam 57.4 69.4 80.0 178.0 220.0 262.0 300.0 330.0 330.0 350.0 360.0 300.0
Indonesia 140.9 138.0 149.2 150.0 160.0 242.5 300.0 345.0 345.0 350.0 360.0 310.0India 78.6 96.7 102.9 103.0 155.0 175.0 170.0 180.0 180.0 195.0 195.0 200.0
Brazil 16.1 25.4 40.0 60.0 91.0 80.0 71.0 66.0 66.0 70.0 70.0 65.0
Ecuador 119.7 50.1 60.0 57.0 80.0 90.0 90.0 120.0 120.0 130.0 135.0 145.0
Bangladesh 81.1 58.2 60.0 63.0 70.0 75.0 77.0 120.0 120.0 110.0 115.0 80.0
Mexico 29.1 33.5 48.0 46.0 48.0 50.0 50.0 50.0 50.0 50.0 50.0 50.0
Philippines 39.3 41.8 42.4 42.0 42.0 43.0 43.0 46.0 46.0 52.0 54.0 59.0
Malaysia 12.2 15.9 27.0 29.0 32.0 36.0 38.0 39.0 39.0 40.0 41.0 44.0
Venezuela 6.0 8.5 10.5 17.0 18.0 20.0 15.0 10.0 10.0 9.0 9.0 5.0
Colombia 9.2 11.4 12.0 12.0 11.0 10.0 10.0 11.0 11.0 10.0 10.0 8.0
Honduras 6.4 8.2 8.0 11.0 11.0 10.0 10.0 6.0 6.0 6.5 7.0 8.0
Sri Lanka 3.8 7.0 5.1 7.0 11.0 12.0 12.0 15.0 15.0 15.0 15.0 20.0
Taiwan PC 6.1 7.3 9.3 9.3 10.0 9.5 9.5 9.0 9.0 8.0 8.0 7.0
Madagascar 3.5 4.8 5.4 7.0 8.0 9.0 9.0 12.0 12.0 12.0 12.0 12.0
Iran (Islamic Rep. of) 1.8 4.1 7.6 7.5 7.8 7.9 8.0 8.2 8.2 8.5 8.2 6.0Nicaragua 4.2 5.4 5.7 5.5 6.0 6.0 6.0 6.0 6.0 6.0 6.0 6.0
Myanmar 4.9 5.0 5.5 5.5 6.0 7.0 8.0 8.5 8.5 9.0 8.0 7.0
Saudi Arabia 1.9 2.0 4.2 4.2 4.2 4.2 4.5 4.8 4.8 5.0 5.2 6.0
Belize 3.2 3.6 4.5 4.0 4.0 4.0 4.0 4.0 4.0 4.0 4.0 3.0
USA 2.1 2.2 3.6 3.2 3.0 3.2 3.2 3.0 3.0 2.5 2.5 2.0
Australia 2.5 3.2 2.8 3.5 3.0 3.0 3.0 2.8 2.8 3.0 3.0 2.5
Korea Rep. 1.1 1.2 2.1 2.5 2.4 2.3 2.2 2.1 2.1 2.0 2.0 1.5
Japan 1.7 2.1 2.0 2.5 2.4 2.3 2.3 2.0 2.0 1.8 1.9 1.8
Total 1094.3 1143.1 1270.9 1320.0 1655.8 1873.9 2413.7 2718.4 2718.4 2819.3 2871.8 2803.8
AN 010025. 1001.
Source: GLOBEFISH- 20100120.
AREA 1970 1971 1972 1973 1974 1975 1976 1977 1978
Pacific, Northwest 218.0 197.6 231.1 172.8 193.7 202.0 291.9 356.9 427.6
Pacific, Western Central 187.0 218.1 224.2 286.1 256.4 251.2 296.7 324.3 333.9
Indian Ocean, Eastern 67.9 74.2 73.8 82.5 108.0 95.0 124.8 143.0 153.2
Asia - Inland waters 29.2 27.5 30.0 30.2 22.7 17.6 17.4 20.5 12.3
Atlantic, Northwest 143.2 175.0 196.9 242.6 255.3 261.5 226.1 258.7 207.8
Indian Ocean, Western 21.8 23.1 22.6 24.6 33.9 48.0 56.9 51.5 45.3
Atlantic, Western Central 171.1 178.6 182.4 155.6 165.0 147.7 156.5 181.4 179.4
Pacific, Eastern Central 68.6 68.0 65.4 71.4 66.8 66.9 49.2 45.6 64.3
Pacific, Southeast 44.2 45.3 57.4 49.8 43.4 43.9 38.6 52.3 55.1
Atlantic, Southwest 79.0 64.3 66.7 73.1 68.1 61.3 74.3 71.3 84.4
Atlantic, Northeast 20.2 19.4 18.9 25.6 21.3 21.2 22.2 22.7 25.4
Atlantic, Eastern Central 9.0 13.1 25.0 25.1 28.4 25.6 19.6 24.6 39.3
Mediterranean and Black Sea 10.6 9.9 12.3 14.1 16.1 15.0 14.8 14.3 15.1
Pacific, Northeast 41.6 48.3 49.6 69.2 65.0 62.8 79.7 89.5 70.6
Atlantic, Southeast 4.3 6.1 4.1 8.9 10.0 12.0 10.3 2.2 2.0
Africa - Inland waters - - - - - - - - -
Pacific, Southwest 1.9 2.1 2.5 2.1 2.8 2.1 2.5 2.6 2.4
America, North - Inland waters - - - - - - - - -
Total 1117.6 1170.7 1262.8 1333.7 1356.9 1333.8 1481.4 1661.3 1718.2
Yearly shrimp production by major fishing areas,in 1 000 tonnes
Estimates on shrimp aquaculture production, in 1 000 tonnes (cont)
66
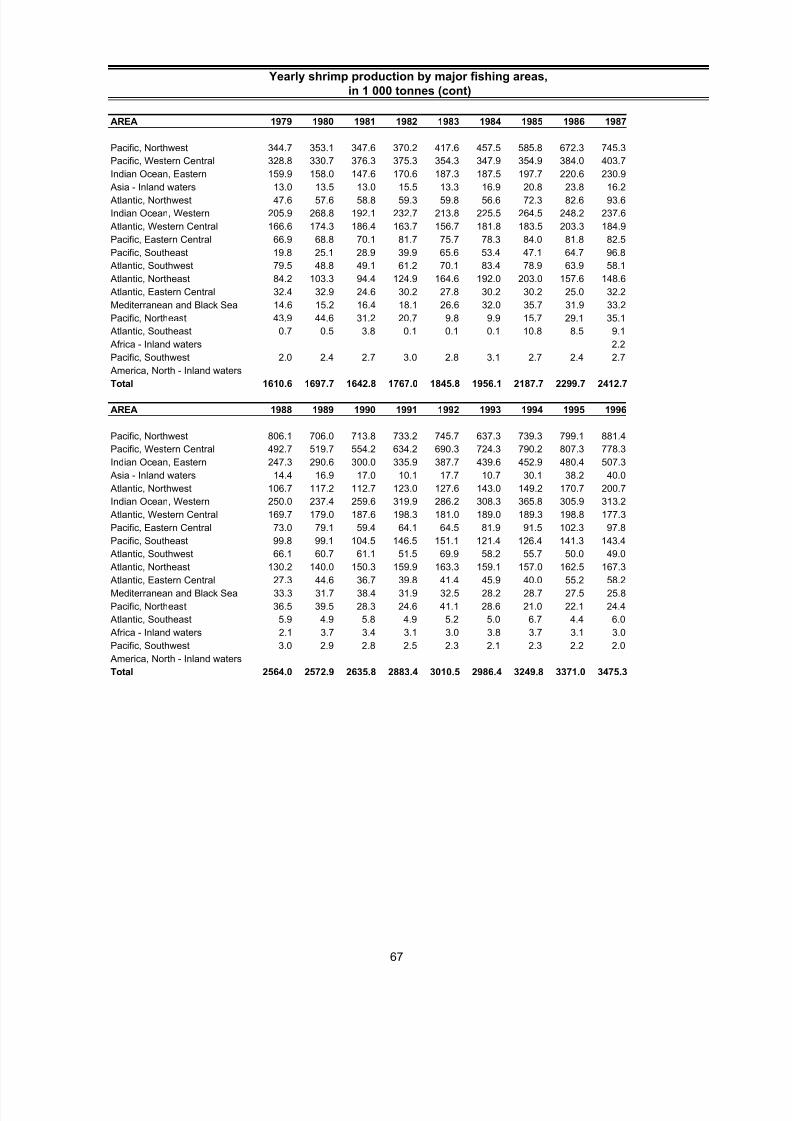
5/13/2018 Globefish Commodity Update Shrimp 2010 - slidepdf.com
http://slidepdf.com/reader/full/globefish-commodity-update-shrimp-2010 73/78
AREA 1979 1980 1981 1982 1983 1984 1985 1986 1987
Pacific, Northwest 344.7 353.1 347.6 370.2 417.6 457.5 585.8 672.3 745.3
Pacific, Western Central 328.8 330.7 376.3 375.3 354.3 347.9 354.9 384.0 403.7
Indian Ocean, Eastern 159.9 158.0 147.6 170.6 187.3 187.5 197.7 220.6 230.9 Asia - Inland waters 13.0 13.5 13.0 15.5 13.3 16.9 20.8 23.8 16.2
Atlantic, Northwest 47.6 57.6 58.8 59.3 59.8 56.6 72.3 82.6 93.6
Indian Ocean, Western 205.9 268.8 192.1 232.7 213.8 225.5 264.5 248.2 237.6
Atlantic, Western Central 166.6 174.3 186.4 163.7 156.7 181.8 183.5 203.3 184.9
Pacific, Eastern Central 66.9 68.8 70.1 81.7 75.7 78.3 84.0 81.8 82.5
Pacific, Southeast 19.8 25.1 28.9 39.9 65.6 53.4 47.1 64.7 96.8
Atlantic, Southwest 79.5 48.8 49.1 61.2 70.1 83.4 78.9 63.9 58.1
Atlantic, Northeast 84.2 103.3 94.4 124.9 164.6 192.0 203.0 157.6 148.6
Atlantic, Eastern Central 32.4 32.9 24.6 30.2 27.8 30.2 30.2 25.0 32.2
Mediterranean and Black Sea 14.6 15.2 16.4 18.1 26.6 32.0 35.7 31.9 33.2
Pacific, Northeast 43.9 44.6 31.2 20.7 9.8 9.9 15.7 29.1 35.1
Atlantic, Southeast 0.7 0.5 3.8 0.1 0.1 0.1 10.8 8.5 9.1
Africa - Inland waters 2.2
Pacific, Southwest 2.0 2.4 2.7 3.0 2.8 3.1 2.7 2.4 2.7 America, North - Inland waters
Total 1610.6 1697.7 1642.8 1767.0 1845.8 1956.1 2187.7 2299.7 2412.7
AREA 1988 1989 1990 1991 1992 1993 1994 1995 1996
Pacific, Northwest 806.1 706.0 713.8 733.2 745.7 637.3 739.3 799.1 881.4
Pacific, Western Central 492.7 519.7 554.2 634.2 690.3 724.3 790.2 807.3 778.3
Indian Ocean, Eastern 247.3 290.6 300.0 335.9 387.7 439.6 452.9 480.4 507.3
Asia - Inland waters 14.4 16.9 17.0 10.1 17.7 10.7 30.1 38.2 40.0
Atlantic, Northwest 106.7 117.2 112.7 123.0 127.6 143.0 149.2 170.7 200.7
Indian Ocean, Western 250.0 237.4 259.6 319.9 286.2 308.3 365.8 305.9 313.2
Atlantic, Western Central 169.7 179.0 187.6 198.3 181.0 189.0 189.3 198.8 177.3
Pacific, Eastern Central 73.0 79.1 59.4 64.1 64.5 81.9 91.5 102.3 97.8Pacific, Southeast 99.8 99.1 104.5 146.5 151.1 121.4 126.4 141.3 143.4
Atlantic, Southwest 66.1 60.7 61.1 51.5 69.9 58.2 55.7 50.0 49.0
Atlantic, Northeast 130.2 140.0 150.3 159.9 163.3 159.1 157.0 162.5 167.3
Atlantic, Eastern Central 27.3 44.6 36.7 39.8 41.4 45.9 40.0 55.2 58.2
Mediterranean and Black Sea 33.3 31.7 38.4 31.9 32.5 28.2 28.7 27.5 25.8
Pacific, Northeast 36.5 39.5 28.3 24.6 41.1 28.6 21.0 22.1 24.4
Atlantic, Southeast 5.9 4.9 5.8 4.9 5.2 5.0 6.7 4.4 6.0
Africa - Inland waters 2.1 3.7 3.4 3.1 3.0 3.8 3.7 3.1 3.0
Pacific, Southwest 3.0 2.9 2.8 2.5 2.3 2.1 2.3 2.2 2.0
America, North - Inland waters
Total 2564.0 2572.9 2635.8 2883.4 3010.5 2986.4 3249.8 3371.0 3475.3
Yearly shrimp production by major fishing areas,
in 1 000 tonnes (cont)
67

5/13/2018 Globefish Commodity Update Shrimp 2010 - slidepdf.com
http://slidepdf.com/reader/full/globefish-commodity-update-shrimp-2010 74/78
AREA 1997 1998 1999 2000 2001 2002 2003 2004 2005 2006 2007
Pacific, Northwest 886.0 976.3 1171.7 1176.6 1138.3 1193.2 1747.4 1809.1 1891.5 1982.1 2009.0
Pacific, Western Central 723.4 709.7 760.2 838.3 928.3 929.2 1034.7 1113.2 1148.6 1279.0 1301.0
Indian Ocean, Eastern 551.2 496.6 571.2 602.2 570.1 549.7 607.4 716.6 777.6 865.8 868.1 Asia - Inland waters 49.1 26.5 28.2 43.0 50.0 115.9 382.9 427.9 429.5 525.7 638.8
Atlantic, Northwest 174.5 207.3 243.1 269.6 263.5 288.3 287.3 360.5 349.5 349.3 366.7
Indian Ocean, Western 289.3 354.4 341.1 334.7 319.3 347.7 366.9 339.6 352.4 348.1 343.6
Atlantic, Western Central 183.3 199.1 195.6 241.2 256.1 240.8 285.6 279.7 257.6 290.5 239.4
Pacific, Eastern Central 105.6 106.3 106.5 98.3 109.9 111.6 130.2 134.6 170.1 203.1 206.2
Pacific, Southeast 180.0 186.5 147.1 67.3 63.6 79.4 94.2 109.1 144.5 183.3 188.5
Atlantic, Southwest 51.0 66.3 64.8 102.4 150.0 154.1 183.0 135.8 109.4 148.0 156.7
Atlantic, Northeast 191.4 176.9 173.7 172.8 142.1 149.0 127.9 123.9 114.0 94.1 92.3
Atlantic, Eastern Central 53.8 70.1 71.1 59.8 73.4 73.6 73.9 58.4 65.4 63.5 61.6
Mediterranean and Black Sea 30.7 27.9 29.5 35.4 29.8 31.5 32.0 31.2 42.4 39.8 34.6
Pacific, Northeast 24.3 11.5 18.1 20.4 23.0 30.0 18.3 12.8 14.7 12.1 14.8
Atlantic, Southeast 5.6 10.1 5.5 10.5 13.4 6.3 5.2 3.2 2.7 2.7 3.9
Africa - Inland waters 2.9 2.7 2.6 2.1 2.4 2.5 2.4 2.3 5.5 2.6 1.9
Pacific, Southwest 2.1 1.8 2.6 3.2 3.3 2.7 2.3 1.8 0.9 1.4 1.4 America, North - Inland waters 0.5 1.0 1.0
Total 3504.2 3630.0 3932.5 4077.8 4136.6 4305.6 5381.6 5659.6 5876.9 6391.9 6529.0
AN 010024. 1001.
Source: Fishstat Plus - 20100122.
Yearly shrimp production by major fishing areas,
in 1 000 tonnes (cont)
68
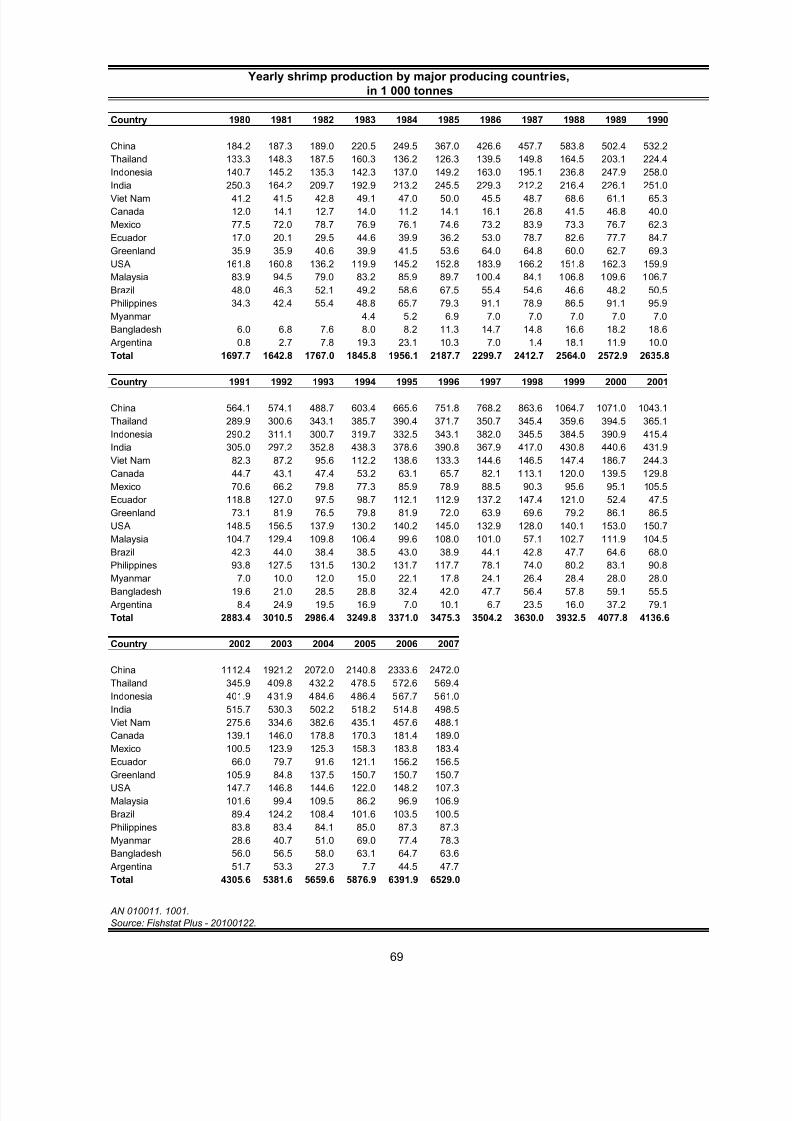
5/13/2018 Globefish Commodity Update Shrimp 2010 - slidepdf.com
http://slidepdf.com/reader/full/globefish-commodity-update-shrimp-2010 75/78
Country 1980 1981 1982 1983 1984 1985 1986 1987 1988 1989 1990
China 184.2 187.3 189.0 220.5 249.5 367.0 426.6 457.7 583.8 502.4 532.2
Thailand 133.3 148.3 187.5 160.3 136.2 126.3 139.5 149.8 164.5 203.1 224.4
Indonesia 140.7 145.2 135.3 142.3 137.0 149.2 163.0 195.1 236.8 247.9 258.0India 250.3 164.2 209.7 192.9 213.2 245.5 229.3 212.2 216.4 226.1 251.0
Viet Nam 41.2 41.5 42.8 49.1 47.0 50.0 45.5 48.7 68.6 61.1 65.3
Canada 12.0 14.1 12.7 14.0 11.2 14.1 16.1 26.8 41.5 46.8 40.0
Mexico 77.5 72.0 78.7 76.9 76.1 74.6 73.2 83.9 73.3 76.7 62.3
Ecuador 17.0 20.1 29.5 44.6 39.9 36.2 53.0 78.7 82.6 77.7 84.7
Greenland 35.9 35.9 40.6 39.9 41.5 53.6 64.0 64.8 60.0 62.7 69.3
USA 161.8 160.8 136.2 119.9 145.2 152.8 183.9 166.2 151.8 162.3 159.9
Malaysia 83.9 94.5 79.0 83.2 85.9 89.7 100.4 84.1 106.8 109.6 106.7
Brazil 48.0 46.3 52.1 49.2 58.6 67.5 55.4 54.6 46.6 48.2 50.5
Philippines 34.3 42.4 55.4 48.8 65.7 79.3 91.1 78.9 86.5 91.1 95.9
Myanmar 4.4 5.2 6.9 7.0 7.0 7.0 7.0 7.0
Bangladesh 6.0 6.8 7.6 8.0 8.2 11.3 14.7 14.8 16.6 18.2 18.6
Argentina 0.8 2.7 7.8 19.3 23.1 10.3 7.0 1.4 18.1 11.9 10.0
Total 1697.7 1642.8 1767.0 1845.8 1956.1 2187.7 2299.7 2412.7 2564.0 2572.9 2635.8
Country 1991 1992 1993 1994 1995 1996 1997 1998 1999 2000 2001
China 564.1 574.1 488.7 603.4 665.6 751.8 768.2 863.6 1064.7 1071.0 1043.1
Thailand 289.9 300.6 343.1 385.7 390.4 371.7 350.7 345.4 359.6 394.5 365.1
Indonesia 290.2 311.1 300.7 319.7 332.5 343.1 382.0 345.5 384.5 390.9 415.4
India 305.0 297.2 352.8 438.3 378.6 390.8 367.9 417.0 430.8 440.6 431.9
Viet Nam 82.3 87.2 95.6 112.2 138.6 133.3 144.6 146.5 147.4 186.7 244.3
Canada 44.7 43.1 47.4 53.2 63.1 65.7 82.1 113.1 120.0 139.5 129.8
Mexico 70.6 66.2 79.8 77.3 85.9 78.9 88.5 90.3 95.6 95.1 105.5
Ecuador 118.8 127.0 97.5 98.7 112.1 112.9 137.2 147.4 121.0 52.4 47.5
Greenland 73.1 81.9 76.5 79.8 81.9 72.0 63.9 69.6 79.2 86.1 86.5
USA 148.5 156.5 137.9 130.2 140.2 145.0 132.9 128.0 140.1 153.0 150.7
Malaysia 104.7 129.4 109.8 106.4 99.6 108.0 101.0 57.1 102.7 111.9 104.5
Brazil 42.3 44.0 38.4 38.5 43.0 38.9 44.1 42.8 47.7 64.6 68.0
Philippines 93.8 127.5 131.5 130.2 131.7 117.7 78.1 74.0 80.2 83.1 90.8
Myanmar 7.0 10.0 12.0 15.0 22.1 17.8 24.1 26.4 28.4 28.0 28.0
Bangladesh 19.6 21.0 28.5 28.8 32.4 42.0 47.7 56.4 57.8 59.1 55.5
Argentina 8.4 24.9 19.5 16.9 7.0 10.1 6.7 23.5 16.0 37.2 79.1
Total 2883.4 3010.5 2986.4 3249.8 3371.0 3475.3 3504.2 3630.0 3932.5 4077.8 4136.6
Country 2002 2003 2004 2005 2006 2007
China 1112.4 1921.2 2072.0 2140.8 2333.6 2472.0
Thailand 345.9 409.8 432.2 478.5 572.6 569.4
Indonesia 401.9 431.9 484.6 486.4 567.7 561.0
India 515.7 530.3 502.2 518.2 514.8 498.5Viet Nam 275.6 334.6 382.6 435.1 457.6 488.1
Canada 139.1 146.0 178.8 170.3 181.4 189.0
Mexico 100.5 123.9 125.3 158.3 183.8 183.4
Ecuador 66.0 79.7 91.6 121.1 156.2 156.5
Greenland 105.9 84.8 137.5 150.7 150.7 150.7
USA 147.7 146.8 144.6 122.0 148.2 107.3
Malaysia 101.6 99.4 109.5 86.2 96.9 106.9
Brazil 89.4 124.2 108.4 101.6 103.5 100.5
Philippines 83.8 83.4 84.1 85.0 87.3 87.3
Myanmar 28.6 40.7 51.0 69.0 77.4 78.3
Bangladesh 56.0 56.5 58.0 63.1 64.7 63.6
Argentina 51.7 53.3 27.3 7.7 44.5 47.7
Total 4305.6 5381.6 5659.6 5876.9 6391.9 6529.0
AN 010011. 1001.
Source: Fishstat Plus - 20100122.
Yearly shrimp production by major producing countries,
in 1 000 tonnes
69
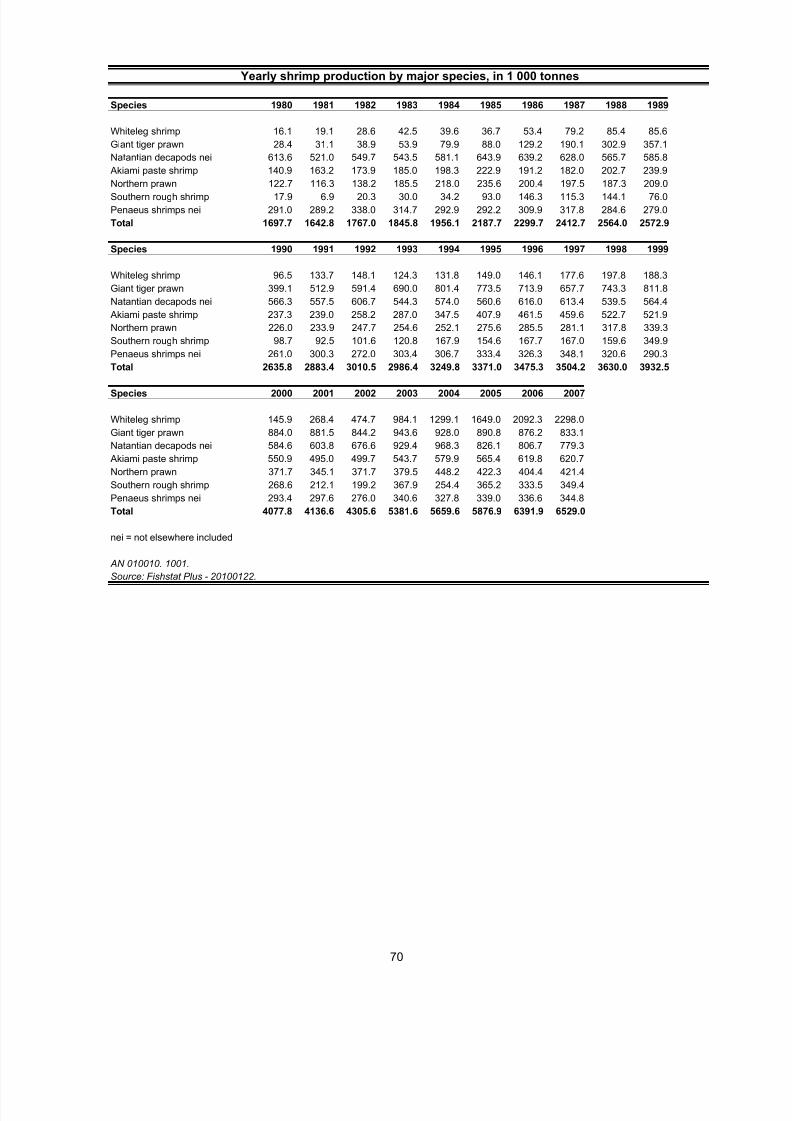
5/13/2018 Globefish Commodity Update Shrimp 2010 - slidepdf.com
http://slidepdf.com/reader/full/globefish-commodity-update-shrimp-2010 76/78
Species 1980 1981 1982 1983 1984 1985 1986 1987 1988 1989
Whiteleg shrimp 16.1 19.1 28.6 42.5 39.6 36.7 53.4 79.2 85.4 85.6
Giant tiger prawn 28.4 31.1 38.9 53.9 79.9 88.0 129.2 190.1 302.9 357.1
Natantian decapods nei 613.6 521.0 549.7 543.5 581.1 643.9 639.2 628.0 565.7 585.8
Akiami paste shrimp 140.9 163.2 173.9 185.0 198.3 222.9 191.2 182.0 202.7 239.9
Northern prawn 122.7 116.3 138.2 185.5 218.0 235.6 200.4 197.5 187.3 209.0
Southern rough shrimp 17.9 6.9 20.3 30.0 34.2 93.0 146.3 115.3 144.1 76.0
Penaeus shrimps nei 291.0 289.2 338.0 314.7 292.9 292.2 309.9 317.8 284.6 279.0
Total 1697.7 1642.8 1767.0 1845.8 1956.1 2187.7 2299.7 2412.7 2564.0 2572.9
Species 1990 1991 1992 1993 1994 1995 1996 1997 1998 1999
Whiteleg shrimp 96.5 133.7 148.1 124.3 131.8 149.0 146.1 177.6 197.8 188.3
Giant tiger prawn 399.1 512.9 591.4 690.0 801.4 773.5 713.9 657.7 743.3 811.8
Natantian decapods nei 566.3 557.5 606.7 544.3 574.0 560.6 616.0 613.4 539.5 564.4
Akiami paste shrimp 237.3 239.0 258.2 287.0 347.5 407.9 461.5 459.6 522.7 521.9
Northern prawn 226.0 233.9 247.7 254.6 252.1 275.6 285.5 281.1 317.8 339.3
Southern rough shrimp 98.7 92.5 101.6 120.8 167.9 154.6 167.7 167.0 159.6 349.9
Penaeus shrimps nei 261.0 300.3 272.0 303.4 306.7 333.4 326.3 348.1 320.6 290.3Total 2635.8 2883.4 3010.5 2986.4 3249.8 3371.0 3475.3 3504.2 3630.0 3932.5
Species 2000 2001 2002 2003 2004 2005 2006 2007
Whiteleg shrimp 145.9 268.4 474.7 984.1 1299.1 1649.0 2092.3 2298.0
Giant tiger prawn 884.0 881.5 844.2 943.6 928.0 890.8 876.2 833.1
Natantian decapods nei 584.6 603.8 676.6 929.4 968.3 826.1 806.7 779.3
Akiami paste shrimp 550.9 495.0 499.7 543.7 579.9 565.4 619.8 620.7
Northern prawn 371.7 345.1 371.7 379.5 448.2 422.3 404.4 421.4
Southern rough shrimp 268.6 212.1 199.2 367.9 254.4 365.2 333.5 349.4
Penaeus shrimps nei 293.4 297.6 276.0 340.6 327.8 339.0 336.6 344.8
Total 4077.8 4136.6 4305.6 5381.6 5659.6 5876.9 6391.9 6529.0
nei = not elsewhere included
AN 010010. 1001.
Source: Fishstat Plus - 20100122.
Yearly shrimp production by major species, in 1 000 tonnes
70
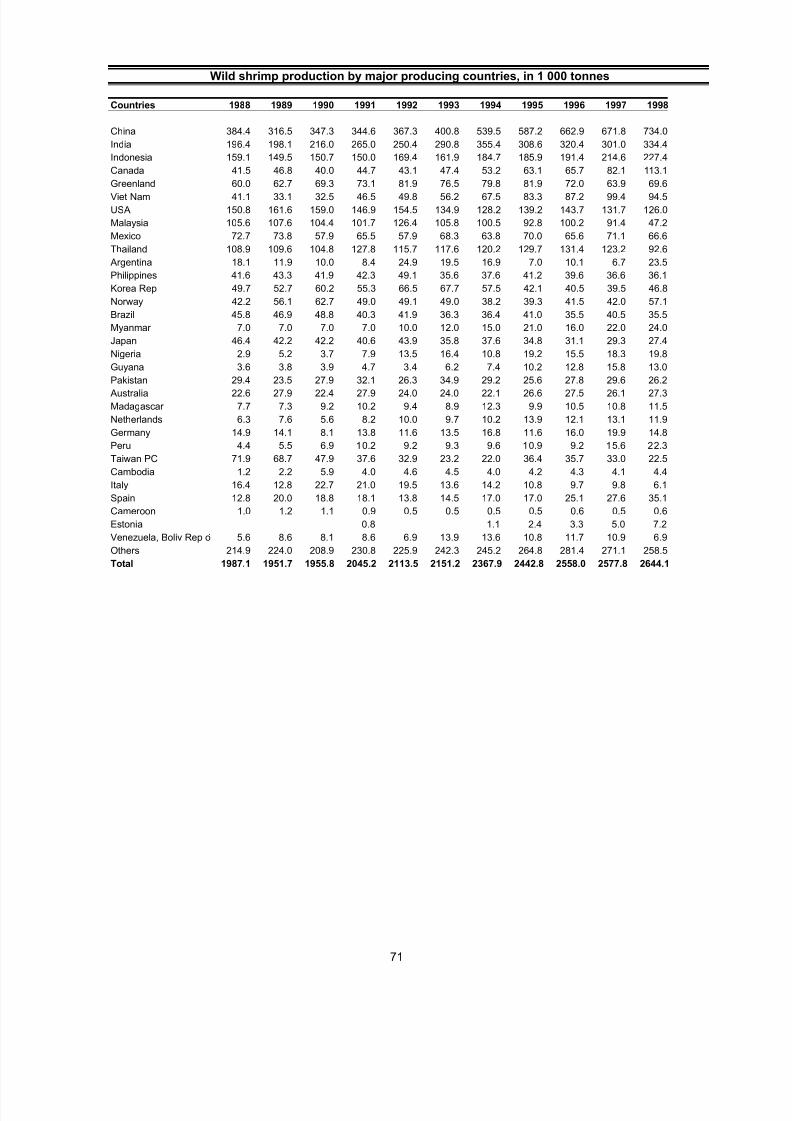
5/13/2018 Globefish Commodity Update Shrimp 2010 - slidepdf.com
http://slidepdf.com/reader/full/globefish-commodity-update-shrimp-2010 77/78
Countries 1988 1989 1990 1991 1992 1993 1994 1995 1996 1997 1998
China 384.4 316.5 347.3 344.6 367.3 400.8 539.5 587.2 662.9 671.8 734.0
India 196.4 198.1 216.0 265.0 250.4 290.8 355.4 308.6 320.4 301.0 334.4
Indonesia 159.1 149.5 150.7 150.0 169.4 161.9 184.7 185.9 191.4 214.6 227.4
Canada 41.5 46.8 40.0 44.7 43.1 47.4 53.2 63.1 65.7 82.1 113.1
Greenland 60.0 62.7 69.3 73.1 81.9 76.5 79.8 81.9 72.0 63.9 69.6
Viet Nam 41.1 33.1 32.5 46.5 49.8 56.2 67.5 83.3 87.2 99.4 94.5
USA 150.8 161.6 159.0 146.9 154.5 134.9 128.2 139.2 143.7 131.7 126.0
Malaysia 105.6 107.6 104.4 101.7 126.4 105.8 100.5 92.8 100.2 91.4 47.2
Mexico 72.7 73.8 57.9 65.5 57.9 68.3 63.8 70.0 65.6 71.1 66.6
Thailand 108.9 109.6 104.8 127.8 115.7 117.6 120.2 129.7 131.4 123.2 92.6
Argentina 18.1 11.9 10.0 8.4 24.9 19.5 16.9 7.0 10.1 6.7 23.5
Philippines 41.6 43.3 41.9 42.3 49.1 35.6 37.6 41.2 39.6 36.6 36.1
Korea Rep 49.7 52.7 60.2 55.3 66.5 67.7 57.5 42.1 40.5 39.5 46.8
Norway 42.2 56.1 62.7 49.0 49.1 49.0 38.2 39.3 41.5 42.0 57.1
Brazil 45.8 46.9 48.8 40.3 41.9 36.3 36.4 41.0 35.5 40.5 35.5
Myanmar 7.0 7.0 7.0 7.0 10.0 12.0 15.0 21.0 16.0 22.0 24.0
Japan 46.4 42.2 42.2 40.6 43.9 35.8 37.6 34.8 31.1 29.3 27.4
Nigeria 2.9 5.2 3.7 7.9 13.5 16.4 10.8 19.2 15.5 18.3 19.8Guyana 3.6 3.8 3.9 4.7 3.4 6.2 7.4 10.2 12.8 15.8 13.0
Pakistan 29.4 23.5 27.9 32.1 26.3 34.9 29.2 25.6 27.8 29.6 26.2
Australia 22.6 27.9 22.4 27.9 24.0 24.0 22.1 26.6 27.5 26.1 27.3
Madagascar 7.7 7.3 9.2 10.2 9.4 8.9 12.3 9.9 10.5 10.8 11.5
Netherlands 6.3 7.6 5.6 8.2 10.0 9.7 10.2 13.9 12.1 13.1 11.9
Germany 14.9 14.1 8.1 13.8 11.6 13.5 16.8 11.6 16.0 19.9 14.8
Peru 4.4 5.5 6.9 10.2 9.2 9.3 9.6 10.9 9.2 15.6 22.3
Taiwan PC 71.9 68.7 47.9 37.6 32.9 23.2 22.0 36.4 35.7 33.0 22.5
Cambodia 1.2 2.2 5.9 4.0 4.6 4.5 4.0 4.2 4.3 4.1 4.4
Italy 16.4 12.8 22.7 21.0 19.5 13.6 14.2 10.8 9.7 9.8 6.1
Spain 12.8 20.0 18.8 18.1 13.8 14.5 17.0 17.0 25.1 27.6 35.1
Cameroon 1.0 1.2 1.1 0.9 0.5 0.5 0.5 0.5 0.6 0.5 0.6
Estonia 0.8 1.1 2.4 3.3 5.0 7.2
Venezuela, Boliv Rep o 5.6 8.6 8.1 8.6 6.9 13.9 13.6 10.8 11.7 10.9 6.9
Others 214.9 224.0 208.9 230.8 225.9 242.3 245.2 264.8 281.4 271.1 258.5
Total 1987.1 1951.7 1955.8 2045.2 2113.5 2151.2 2367.9 2442.8 2558.0 2577.8 2644.1
Wild shrimp production by major producing countries, in 1 000 tonnes
71
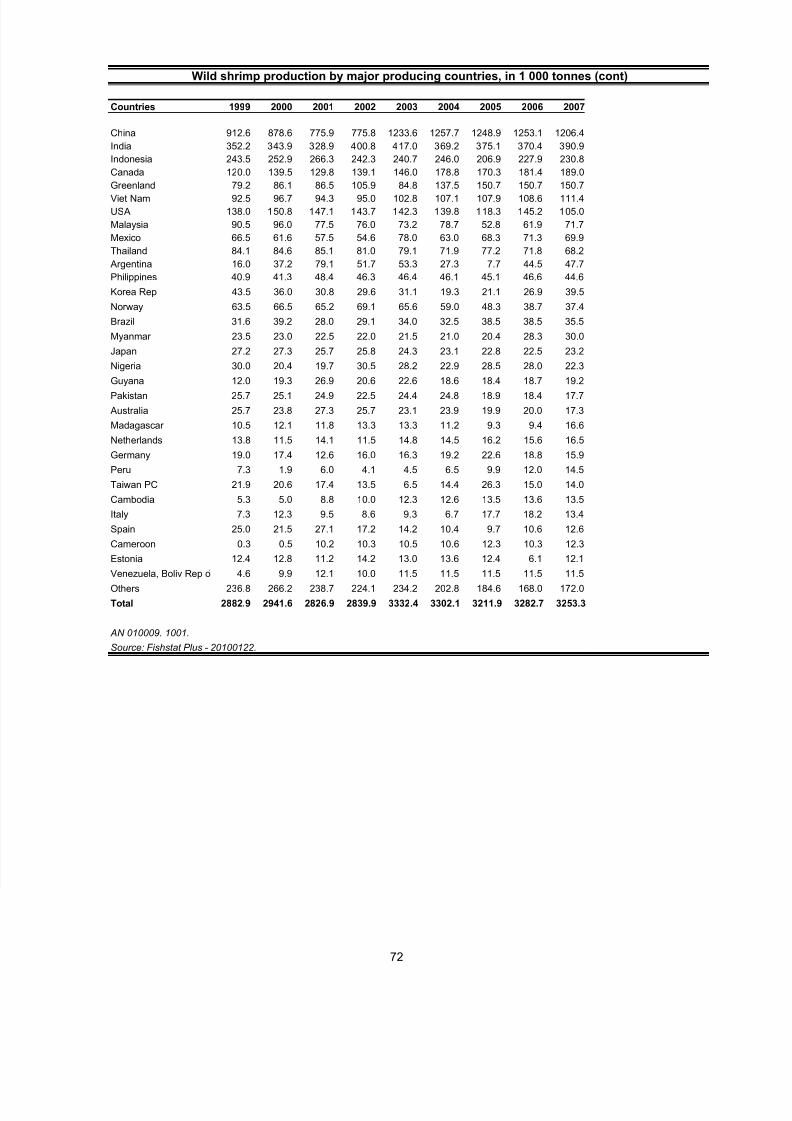
5/13/2018 Globefish Commodity Update Shrimp 2010 - slidepdf.com
http://slidepdf.com/reader/full/globefish-commodity-update-shrimp-2010 78/78
Countries 1999 2000 2001 2002 2003 2004 2005 2006 2007
China 912.6 878.6 775.9 775.8 1233.6 1257.7 1248.9 1253.1 1206.4
India 352.2 343.9 328.9 400.8 417.0 369.2 375.1 370.4 390.9
Indonesia 243.5 252.9 266.3 242.3 240.7 246.0 206.9 227.9 230.8
Canada 120.0 139.5 129.8 139.1 146.0 178.8 170.3 181.4 189.0Greenland 79.2 86.1 86.5 105.9 84.8 137.5 150.7 150.7 150.7
Viet Nam 92.5 96.7 94.3 95.0 102.8 107.1 107.9 108.6 111.4
USA 138.0 150.8 147.1 143.7 142.3 139.8 118.3 145.2 105.0
Malaysia 90.5 96.0 77.5 76.0 73.2 78.7 52.8 61.9 71.7
Mexico 66.5 61.6 57.5 54.6 78.0 63.0 68.3 71.3 69.9
Thailand 84.1 84.6 85.1 81.0 79.1 71.9 77.2 71.8 68.2
Argentina 16.0 37.2 79.1 51.7 53.3 27.3 7.7 44.5 47.7
Philippines 40.9 41.3 48.4 46.3 46.4 46.1 45.1 46.6 44.6
Korea Rep 43.5 36.0 30.8 29.6 31.1 19.3 21.1 26.9 39.5
Norway 63.5 66.5 65.2 69.1 65.6 59.0 48.3 38.7 37.4
Brazil 31.6 39.2 28.0 29.1 34.0 32.5 38.5 38.5 35.5
Myanmar 23.5 23.0 22.5 22.0 21.5 21.0 20.4 28.3 30.0
Japan 27.2 27.3 25.7 25.8 24.3 23.1 22.8 22.5 23.2Nigeria 30.0 20.4 19.7 30.5 28.2 22.9 28.5 28.0 22.3
Guyana 12.0 19.3 26.9 20.6 22.6 18.6 18.4 18.7 19.2
Pakistan 25.7 25.1 24.9 22.5 24.4 24.8 18.9 18.4 17.7
Australia 25.7 23.8 27.3 25.7 23.1 23.9 19.9 20.0 17.3
Madagascar 10.5 12.1 11.8 13.3 13.3 11.2 9.3 9.4 16.6
Netherlands 13.8 11.5 14.1 11.5 14.8 14.5 16.2 15.6 16.5
Germany 19.0 17.4 12.6 16.0 16.3 19.2 22.6 18.8 15.9
Peru 7.3 1.9 6.0 4.1 4.5 6.5 9.9 12.0 14.5
Taiwan PC 21.9 20.6 17.4 13.5 6.5 14.4 26.3 15.0 14.0
Cambodia 5.3 5.0 8.8 10.0 12.3 12.6 13.5 13.6 13.5
Italy 7.3 12.3 9.5 8.6 9.3 6.7 17.7 18.2 13.4
Spain 25.0 21.5 27.1 17.2 14.2 10.4 9.7 10.6 12.6Cameroon 0.3 0.5 10.2 10.3 10.5 10.6 12.3 10.3 12.3
Estonia 12.4 12.8 11.2 14.2 13.0 13.6 12.4 6.1 12.1
Venezuela, Boliv Rep o 4.6 9.9 12.1 10.0 11.5 11.5 11.5 11.5 11.5
Others 236.8 266.2 238.7 224.1 234.2 202.8 184.6 168.0 172.0
Total 2882.9 2941.6 2826.9 2839.9 3332.4 3302.1 3211.9 3282.7 3253.3
AN 010009. 1001.
Source: Fishstat Plus - 20100122.
Wild shrimp production by major producing countries, in 1 000 tonnes (cont)
72