Globalscope newsletter 2016 h2 – na xel ipartners
28
2016 H2 Globalscope Newsletter reporting on global M&A activity and the latest semi-annual conference “The starting point for business valuation across all sectors in any region in the global marketplace” Dallas 2016 H2 in association with
-
Upload
fadjar-sutandi -
Category
Economy & Finance
-
view
146 -
download
0
Transcript of Globalscope newsletter 2016 h2 – na xel ipartners
2016 H2
Globalscope Newsletterreporting on global M&A activity and the latest semi-annual conference
“The starting point for business valuation across all sectors in any region in the global marketplace”
Dallas 2016 H2
in association with

1Issue 5
Published October 2016
About Globalscope
What we do
Our focus is on mergers and acquisitions (M&A). This oftenincludes representing clients who wish to divest or acquire acompany and advising our clients on the related fine detailsincluding, for example, restructuring, international jointventures and licensing initiatives.
We work with the senior management of private and public companies as well as private equity firms.
Who we are
Globalscope was founded in 1987 when a small group of entrepreneurial corporate finance and business advisers came togetherto support clients in cross-border transactions.
We now have 51 member firms, with more than 500 professionals on the ground across 41 countries:
AFRICA
South Africa Fieldstone Africa
AMERICAS
Argentina Ficus CapitalBrazil Guarita & AssociadosCanada Osprey Capital Partners Inc.Mexico Allegiance Capital CorporationUnited States Allegiance Capital Corporation
Brooks, Houghton & CompanyGreif & Co.MelCap PartnersParamax Corporation
Panama Insignia Financial AdvisorsUruguay Ficus Capital S.A.
ASIAPAC
Australia Terrain CapitalTomkins Turner
China Beijing HRS ConsultingIndia MAPE Advisory Group Pvt Ltd
RCS Advisors (India) Pvt. Ltd.Indonesia Naxel iPartnersJapan Kaede Financial Advisory Inc.Singapore Stirling ColemanSouth Korea H-Partners KoreaVietnam Nexus Group
EUROPE
Armenia EV ConsultingBelarus Capital TimesBelgium Common Ground Corporate FinanceCroatia Grubišić & PartnersCzech Republic Venture Investors Corporate FinanceDenmark Dansk Merchant Capital A/SFinland Summa CapitalFrance Atout Capital
CMW Corporate FinanceGeorgia Alliance Group CapitalGermany CCI Management
CatCapTransfer Partners Group
Greece First Athens Corporate Finance SAHungary Heal PartnersIsrael Portofino InvestmentsItaly Benedetti & Associates
Palladio Corporate FinanceLuxembourg Tenzing Partners SANetherlands DEX international M&A
StratégiqueNorway Impello Management ASPoland Augeo Ventures
Aventis CapitalPortugal Bluemint CapitalRussia RB PartnersSpain NEXT Corporate FinanceSweden Jarl SecuritiesSwitzerland InternationalScope Ltd.Ukraine Capital TimesUnited Kingdom Corbett Keeling
Silverpeak
Produced and edited by:Matt Dixon, Corbett Keeling
Global Marketing Director
Why we do it
With 20 – 25% of all M&A transactions being cross-border(defined in this report as involving buyers from a differentcountry to the target company), it is essential for ourmember firms’ clients, whether they be buyers, sellers ortargets, to have access to an international network ofcorporate finance advisors.

2
Contents
Globalscope ConferenceHighlights of discussions from the latest Globalscope conference held in Dallas, USA
New developments 5
Conference report 6
Global M&A market landscape 7
Lower-mid market sector highlights 8($5-150m enterprise value transactions)
Regional Valuation StatisticsCountry by country and region by region analysis of business valuation statistics
Transaction data by region 11
Listed companies data by region 13
The starting point for business valuation across all sectors in any region in the global marketplace
Sector-Specific AnalysisA closer look at the underlying sector-specific structural drivers, new developments, recent M&A and projections
Consumer 17
Financial Services 19
Life Sciences 21
Industrials 23
Services 25
Technology, Media & Telecoms (TMT) 27

3
Data analysed by:Data supplied by:
Definitions and notes
Definitions
TEV - “Total Enterprise Value”TEV is an economic measure reflecting the market value of a whole business independent of a business’ capital structure. The analysis in thisdocument calculates TEV as follows:• For transaction data, by reference to the target company of each transaction, from the transaction consideration, share of equity
acquired, and other disclosed details such as the target’s net debt, as at the transaction date,• For listed company data, from the listed share price of each company, together with known details of its capital structure including issued
shares and net debt, as at the stated date.
EBITDA - “Earnings Before Interest, Tax, Depreciation and Amortisation”EBITDA is a business’ net income with interest, taxes, depreciation and amortisation added back which is often taken as a proxy for the cashgeneration rate of a business. The analysis in this document calculates EBITDA as follows:• For transaction data, by reference to the target company of each transaction, from the most recent known historic 12 months’ reported
value as at the transaction date,• For listed company data, from the most recent known historic 12 months’ reported value as at the stated date.
TEV/EBITDA - “TEV/EBITDA Multiple”The TEV/EBITDA Multiple is calculated for each transaction where more than 40% of the target’s equity is sold or for each listed companywhere the required data is disclosed. Where appropriate, the analysis in this document uses weighted averages calculated as follows:• For transaction data analysis, selected transaction TEV/EBITDA Multiples, within a given six month period, are weighted by reference to
each transaction’s reported consideration or “transaction value”,• For listed company data analysis, selected listed company TEV/EBITDA Multiples, on the stated date, are weighted by reference to each
listed company’s TEV,• Anomalous outlying data points are excluded.
SizeThe size classifications used in this document are Globalscope defined limits with respect to the value of the included transactions or listedcompanies as follows:• For transaction data, transactions are included where the TEV of the target is disclosed and identified by Capital IQ as being greater than
or equal to $5m (All Market Transactions), or greater than or equal to $5m and lower than or equal to $150m (Lower-Mid MarketTransactions).
• For listed company data, companies are included where there is a stock market listing, and a TEV of the company that is disclosed andidentified by Capital IQ as being greater than or equal to $5m (All Market Listed Companies), or greater than or equal to $5m and lowerthan or equal to $150m (Lower-Mid Market Listed Companies).
SectorsThe sector classifications used in this document are Globalscope defined aggregations of similar business activities based on sub-sectorsdefined by reference to the primary Capital IQ industry classification as follows:• For transaction data, the target company of each transaction,• For listed company data, each listed company.
RegionsThe regional classifications used in this document are defined by reference to the Capital IQ regional classification as follows:• For transaction data, the target company of each transaction,• For listed company data, each listed company.
Note on using multiples for business valuation:It is important to note that TEV/EBITDA Multiples calculated as set out above and applied to the EBITDA of a typical lower-mid marketbusiness would, in the majority of cases, be expected to overstate the value of the business. This can in part be due to the net impact of acombination of the following factors:
• A discount may be applied due to reduced liquidity of shares in a lower-mid market business,
• A premium may be applied due to the additional value of owning a controlling equity share,
• A (perceived) lack of transparency with respect to a lower-mid market business’ affairs,
• “TEV” is based on forecast profits (which usually assume growth) whereas these multiples are based on historic profits.
4
Globalscope ConferenceHighlights of discussions from the latest Globalscope conference held in Dallas, USA
New developments 5
Conference report 6
Global M&A market landscape 7
Lower-mid market sector highlights 8($5-150m enterprise value transactions)

5
New developments
Valuation multiples at historic peak 2016 H1
Synopsis
In the six months to June 2016 the global average Lower-Mid Market Transactions TEV/EBITDA Multiple has fallen slightly to 9.1 from 9.6 for the previous 6 months. This latest business valuation indicator is based on an analysis of 20,208 transactions in the period, of which 24% were categorised as cross-border.
TMT sector companies commanded the highest valuations, with Lower-Mid Market Transactions TEV/EBITDA Multiples averaging 10.7. This is in contrast to the Industrials sector where the average was 8.1; this has fallen from the previous half-year, where it was 8.6.
Network expansionSix leading M&A firms join Globalscope
“Joining Globalscope represents avery exciting project for AtoutCapital. We are looking forward tosharing business opportunities withtalented M&A professionals allaround the world for the benefit ofour clients and offering a gatewayfor France, a land of opportunity.”
Synopsis
At the recent semi-annual conference in Dallas, Globalscopepresident Russell D’Alba announced six new members of theGlobalscope Network: Atout Capital (France), Grubišić &Partners (Croatia), MelCap Partners (USA), Brooks, Houghton &Company (USA), Fieldstone Africa (South Africa), and EVConsulting (Armenia).
Rodolphe Ossola, Partner of Atout Capital commented:
New Members:
New members…

Conference report
Synopsis
At the 20th semi-annual conference, hosted by AllegianceCapital Corporation, more than 65 delegates met in Dallas todiscuss deal opportunities, hear from local industry and M&Aexperts, and develop the network. Allegiance prepared anoutstanding programme which included an extravagant Texascowboy-themed blue jeans dinner/dance and guest speakersincluding Dr. Ray Perryman, who spoke on Texas and the U.S.economy; and Robert Dye, Chief Economist at Comerica Bankwho talked about the state of the U.S. economy.
Comment“…it is a privilege and honor to continue theexceptional legacy of past presidents,including the expansive growth underimmediate past President, Michael Moritz,from Germany. It is my goal as President tofoster an even stronger network and create amore efficient organizational structure, forthe benefit of all Globalscope members. Wewelcome our six new members and arepleased to have an exceptionally large groupin attendance, as it shows the positivemomentum of our ever expanding network.”
Russell D’AlbaGlobalscope President
Host member firm:
The conference was hosted byAllegiance Capital Corporation, aDallas-headquartered privateinvestment bank, providing
Headlines
Next
The next Globalscope conference will be held in Milan in March 2017.
Greatest number of transactions:CatCap (Germany) reported 11 deals completed in the last6 months.
Largest transaction:Silverpeak (UK), for the sale of Magic Pony Technologies toTwitter, Inc.
Intra-Globalscope deal:Summa Capital (Finland) and RB Partners (Russia) whoadvised on the sale of the Russian business of Intersport toa group of private investors. Summa Capital advised thevendor Kesko, and RB Partners advised the acquirers (namenot disclosed).
Globalscope’s M&Atrack record continuesto gain momentumwith the followingheadlines in the lastsix months:
services including: mezzanine financing, debt structuring,strategic partnering, and other related services. Allegiancealso has offices in New York, Chicago, Minneapolis, andMonterrey (Mexico).
6

2011 2012 2013 2014 2015 2016
7
Global M&A market landscape
Thousands of M&A transactions all across the globe areclosed in any given six month period.
Transaction data, such as the latest published EBITDA andthe TEV (see definitions on page 3) at the time of sale of thetarget company, are sometimes published. These data canbe used to calculate average transaction TEV/EBITDAMultiples i.e. the average TEV/EBITDA Multiple across alltransactions for which data is disclosed for each six monthperiod.
Across a large enough sample of transactions, these averageTEV/EBITDA Multiples are a useful tool for assessing globalvaluation trends, as set out in the first chart below.
All Market TransactionsDot-dash lines show average data from all disclosedtransactions where the transaction value was at least $5m.The resulting All Market Transactions TEV/EBITDA Multiple,which can be used as a proxy for the M&A market as a whole,shows a plateau after the recent rise in average EV/EBITDAvalues.
Lower-Mid Market TransactionsSolid lines show average data from all disclosed transactionswhere the transaction value was at least $5m but no greaterthan $150m. The resulting Lower-Mid Market TransactionsTEV/EBITDA Multiple shows a slight decrease, whereas themarket as a whole shows a slight increase.
TEV
/EB
ITD
AV
olu
me
Lower-Mid Market Transactions TEV/EBITDA Multiple(Values in range $5m-$150m)has fallen to 9.1following a previous high in2015 H2 at 9.6
All MarketTransactions TEV/EBITDA Multiple(Values over $5m)has risen further to 12.0 from the low of 11.3 in 2015 H1
‘000s
This compares to the currentAll Market Listed Companies TEV/EBITDA Multiple of 12.4
This compares to the currentLower-Mid Market Listed Companies TEV/EBITDA Multiple of 11.2
Comment Context
AllTransactions VolumeTransaction volumes have reduced and are now at the lowest level since 2014 H1
Cross-Border TransactionsVolumeremaining at a consistent 22% - 24% of the total
Listed Companies made 3,572 strategic acquisitions in the last 6 months, this is below the average of 3,775 strategic acquisitions per six month period over the last three years
Lower-Mid Market Listed Companies made 574 strategic acquisitions in the last six months, this is above the average of 563 strategic acquisitions per six month period over the last three years
Data supplied by:
0
5
10
15
20
25
Data analysed by:
6.0
7.0
8.0
9.0
10.0
11.0
12.0

‘000s
8
Lower-mid market sector highlights
TEV/EB
ITDA
Vo
lum
e
Generally these data are significantly more volatile than theglobal average as they are based on fewer transactions andglobal events may affect each sector differently.
The following charts show global Lower-Mid MarketTransaction TEV/EBITDA Multiple trends of six underlyingsectors as identified and tracked by Globalscope.
Each of these average TEV/EBITDA Multiple data pointsrepresent transactions involving target companies operatingin broadly the same sectors, wherever they were locatedacross the globe, where the target company’s enterprisevalue was at least $5m but no greater than $150m.
2011 2012 2013 2014 2015 2016 Comment Context
Limited data for Financial Services sector in 2012 H1 so interpolated value used.
All TransactionsVolumeby sector in 2016 H1 there were:
Consumer: 3,123Financial Services: 1,315Life Sciences: 1,380Industrials: 4,012Services: 6,579TMT: 3,799
Lower-Mid MarketTransactionsTEV/EBITDA Multiples(Values in range $5m-$150m) by sector in 2016 H1 were:
TMT: 10.7Life Sciences: 9.7Consumer: 9.3Financial Services: 9.1Services: 8.4Industrials: 8.1
Analysis performed by:Data supplied by:
0
5
10
15
20
25
Listed Companies in each of these sectors made the following strategic acquisitions in the six months to mid August 2016:
Consumer: 677Financial Services: 150Life Sciences: 314Industrials: 1,141Services: 522TMT: 768
Lower-Mid Market Listed Companies in each of these sectors had the following average TEV/EBITDA Multiples as at mid August 2016:
TMT: 12.0Life Sciences: 14.4Consumer: 11.1Financial Services: 10.9Services: 10.6Industrials: 9.6
4
5
6
7
8
9
10
11
12
9
Regional Valuation StatisticsCountry by country and region by region analysis of business valuation statistics
Transaction data by region 11
Listed companies data by region 13
10
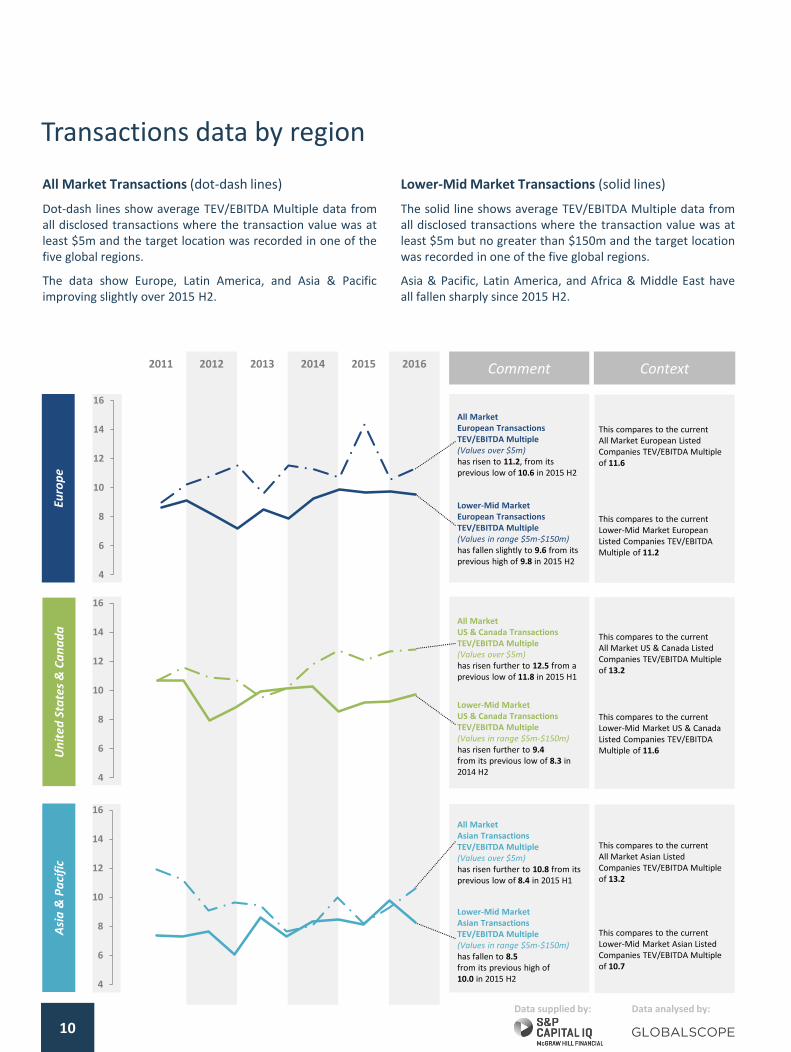
Transactions data by region
Euro
pe
2011 2012 2013 2014 2015 2016 Comment Context
Lower-Mid Market European Transactions TEV/EBITDA Multiple(Values in range $5m-$150m) has fallen slightly to 9.6 from its previous high of 9.8 in 2015 H2
All MarketEuropean TransactionsTEV/EBITDA Multiple(Values over $5m) has risen to 11.2, from its previous low of 10.6 in 2015 H2
This compares to the currentAll Market European Listed Companies TEV/EBITDA Multiple of 11.6
This compares to the currentLower-Mid Market European Listed Companies TEV/EBITDA Multiple of 11.2
Un
ited
Sta
tes
& C
an
ad
a
Lower-Mid MarketUS & Canada Transactions TEV/EBITDA Multiple(Values in range $5m-$150m) has risen further to 9.4from its previous low of 8.3 in 2014 H2
All MarketUS & Canada Transactions TEV/EBITDA Multiple(Values over $5m) has risen further to 12.5 from a previous low of 11.8 in 2015 H1
This compares to the currentAll Market US & Canada Listed Companies TEV/EBITDA Multiple of 13.2
This compares to the currentLower-Mid Market US & Canada Listed Companies TEV/EBITDA Multiple of 11.6
Asi
a &
Pa
cifi
c
All MarketAsian TransactionsTEV/EBITDA Multiple(Values over $5m) has risen further to 10.8 from its previous low of 8.4 in 2015 H1
This compares to the currentAll Market Asian Listed Companies TEV/EBITDA Multiple of 13.2
Lower-Mid MarketAsian TransactionsTEV/EBITDA Multiple(Values in range $5m-$150m)has fallen to 8.5from its previous high of 10.0 in 2015 H2
This compares to the currentLower-Mid Market Asian Listed Companies TEV/EBITDA Multiple of 10.7
Data supplied by: Data analysed by:
Lower-Mid Market Transactions (solid lines)
The solid line shows average TEV/EBITDA Multiple data fromall disclosed transactions where the transaction value was atleast $5m but no greater than $150m and the target locationwas recorded in one of the five global regions.
Asia & Pacific, Latin America, and Africa & Middle East haveall fallen sharply since 2015 H2.
All Market Transactions (dot-dash lines)
Dot-dash lines show average TEV/EBITDA Multiple data fromall disclosed transactions where the transaction value was atleast $5m and the target location was recorded in one of thefive global regions.
The data show Europe, Latin America, and Asia & Pacificimproving slightly over 2015 H2.
4
6
8
10
12
14
16
4
6
8
10
12
14
16
4
6
8
10
12
14
16

0
5
10
15
20
25
Tho
usa
nd
s
2011 2012 2013 2014 2015 2016
11
Africa
& M
idd
le East
Latin
Am
erica
Comment Context
All MarketAfrican Transactions TEV/EBITDA Multiple(Values over $5m) has fallen to 8.5 from its previous high of 12.8 in 2015 H2
This compares to the currentAll Market African Listed Companies TEV/EBITDA Multiple of 10.8
Lower-Mid Market African Transactions TEV/EBITDA Multiple(Values in range $5m-$150m)has fallen to 8.5 from its previous high of 9.8 in 2015 H2
This compares to the currentLower-Mid Market African Listed Companies TEV/EBITDA Multiple of 10.7
All MarketLatin America Transactions TEV/EBITDA Multiple(Values over $5m) has fallen slightly to 10.5 from its previous high of 10.5 in 2015 H2
This compares to the currentAll Market Latin America Listed Companies TEV/EBITDA Multiple of 9.9
Lower-Mid MarketLatin America Transactions
TEV/EBITDA Multiple(Values in range $5m-$150m) has fallen to 7.2 from its previous high of 14.5 in 2015 H2
This compares to the currentLower-Mid Market Latin America Listed Companies TEV/EBITDA Multiple of 8.8
Vo
lum
e
AllTransactionVolumesby region in 2015 H1 were:
Europe: 7,422US & Canada: 8,075Asia & Pacific: 3,564Africa & ME: 579Latin America: 568
Africa & Middle East and Latin America lower-mid market transaction data are more scarce than those for the other regions. Assuch these average transaction multiples are significantly more volatile and are included for completeness as much as forproviding a guide to valuation trends in these regions.
Data supplied by:
‘000s
Data analysed by:
Listed Companies in each of these regions made the following strategic acquisitions in the six months to mid August 2016:
Europe: 959US & Canada: 953Asia & Pacific: 1,500Africa & ME: 101Latin America: 59
4
6
8
10
12
14
16
4
6
8
10
12
14
16

Europe Asia & Pacific
Africa & ME
US & Canada
Latin America
Listed companies’ TEVs are calculated from each company’scurrent share price (which reflects the market’s expectationof future EBITDA performance).
The EBITDA figures used to calculate the Listed CompanyTEV/EBITDA Multiples shown here are the reported EBITDAvalues of each company for the last 12 months (LTM) – thisgives TEV/EBITDA Multiples more directly comparable toTransaction TEV/EBITDA Multiples than if forecast (NTM)EBITDA is used. A discount should be applied if using thesefigures for a valuation of a growing business, which wouldnormally use forecast performance data.
12
Listed companies data by regionAll Market Listed Companies (light)
The light blue bars show average data from listed companieswith TEV of at least $5m. The results can be used as proxiesof TEV/EBITDA Multiples for the current market as a whole.
Lower-Mid Market Listed Companies (dark)
The dark blue bars show average data from listed companieswith TEV of at least $5m but no greater than $150m. Theresults can be used as proxies of TEV/EBITDA Multiples forthe current lower-mid market as a whole.
Lower-Mid MarketListed CompaniesVolume(Values in range $5m-$150m) is again particularly low in Latin America at 97
All MarketListed CompaniesVolume(Values over $5m) is significantly higher in Asia & Pacific than anywhere else at 12,051
The global total number of All Market Listed Companies is 20,638
The global total number of Lower-Mid Market Listed Companies is 8,109
Comment Context
Lower-Mid Market Listed CompaniesTEV/EBITDA Multiple(Values in range $5m-$150m) is highest in US & Canada at 11.6, 32% higher than the lowest in Latin America of 8.8
All Market Listed CompaniesTEV/EBITDA Multiple(Values over $5m) is highest in Asia & Pacific at 13.2, 33% higher than the lowest in Latin America of 9.9
This compares to the global total All Market Listed Companies TEV/EBITDA Multiple of 12.4
This compares to the global total Lower-Mid Market Listed Companies TEV/EBITDA Multiple of 11.2
Vo
lum
eTE
V/E
BIT
DA
Acq
uis
itio
ns
‘000s
As at:mid August 2016
Data supplied by:
All MarketListed Companies(Values over $5m) Acquisitions in last six months is highest in Asia & Pacific in absolute terms at 1,500acquisitions, but highest is the US & Canada on an acquisitions per Listed Company basis at 29%, compared to Africa & ME’s 8%
In total there were 3,572 strategic acquisitions by All Market Listed Companies in the six months to mid August 2016.
These compare to All Market Transaction Volumes in 2016 H1 by region of (in ‘000s):
Europe: 7.4Asia & Pacific: 3.6Africa & ME: 0.6US & Canada: 8.1Latin America: 0.6
‘000s
Data analysed by:
11.6
13.2
10.8
13.2
9.911.2 10.7 10.7
11.6
8.8
0
2
4
6
8
10
12
14
16
3.6
12.1
1.3
3.2
0.51.4
5.5
0.6 0.60.1
0
2
4
6
8
10
12
14
1.0
1.5
0.1
1.0
0.1
0.00
0.20
0.40
0.60
0.80
1.00
1.20
1.40
1.60
Tho
usa
nd
s
14
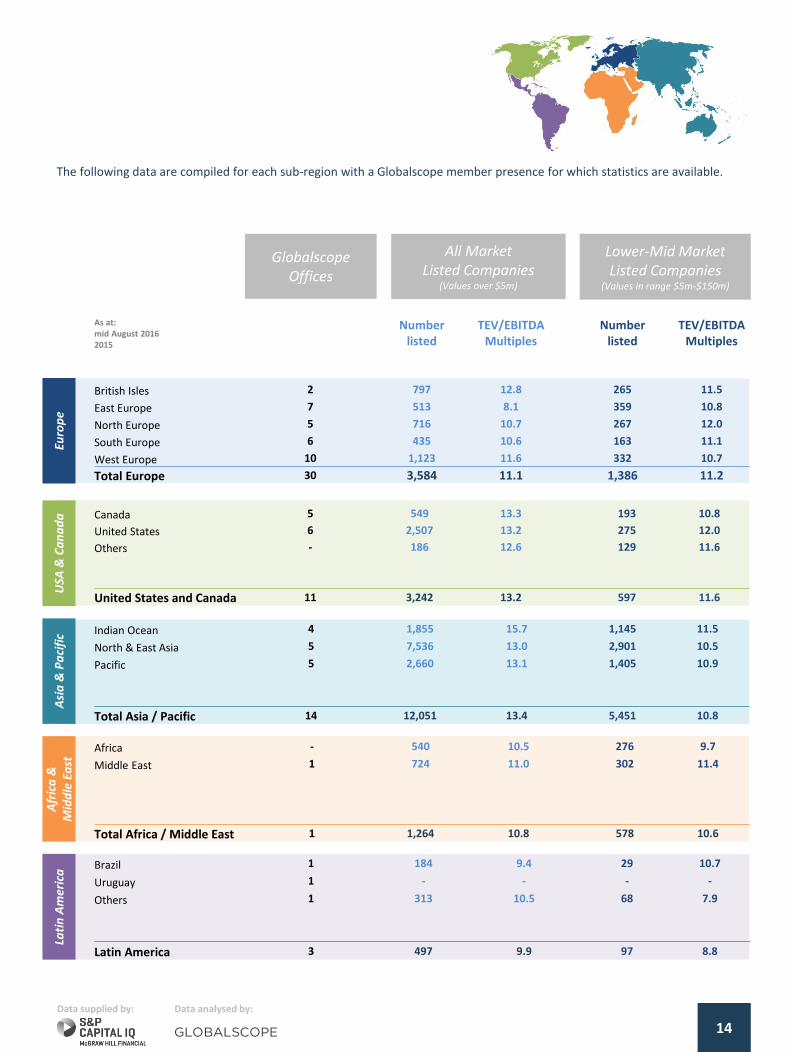
The following data are compiled for each sub-region with a Globalscope member presence for which statistics are available.
All Market Listed Companies
(Values over $5m)
Lower-Mid Market Listed Companies
(Values in range $5m-$150m)
Data supplied by: Data analysed by:
As at:mid August 20162015
Number listed
TEV/EBITDA Multiples
Number listed
TEV/EBITDAMultiples
British Isles 2 797 12.8 265 11.5
East Europe 7 513 8.1 359 10.8
North Europe 5 716 10.7 267 12.0
South Europe 6 435 10.6 163 11.1
West Europe 10 1,123 11.6 332 10.7
Total Europe 30 3,584 11.1 1,386 11.2
Indian Ocean 4 1,855 15.7 1,145 11.5
North & East Asia 5 7,536 13.0 2,901 10.5
Pacific 5 2,660 13.1 1,405 10.9
Total Asia / Pacific 14 12,051 13.4 5,451 10.8
Africa - 540 10.5 276 9.7
Middle East 1 724 11.0 302 11.4
Total Africa / Middle East 1 1,264 10.8 578 10.6
Brazil 1 184 9.4 29 10.7
Uruguay 1 - - - -
Others 1 313 10.5 68 7.9
Latin America 3 497 9.9 97 8.8
GlobalscopeOffices
Euro
pe
USA
& C
an
ad
aA
sia
& P
aci
fic
Afr
ica
&
Mid
dle
Ea
stLa
tin
Am
eric
a
Canada 5 549 13.3 193 10.8
United States 6 2,507 13.2 275 12.0
Others - 186 12.6 129 11.6
United States and Canada 11 3,242 13.2 597 11.6

14
Sector-Specific AnalysisA closer look at the underlying sector-specific structural drivers, new developments, recent M&A and projections
Consumer 17
Financial Services 19
Life Sciences 21
Industrials 23
Services 25
Technology, Media & Telecoms (TMT) 27
[email protected]+31 6130 85245
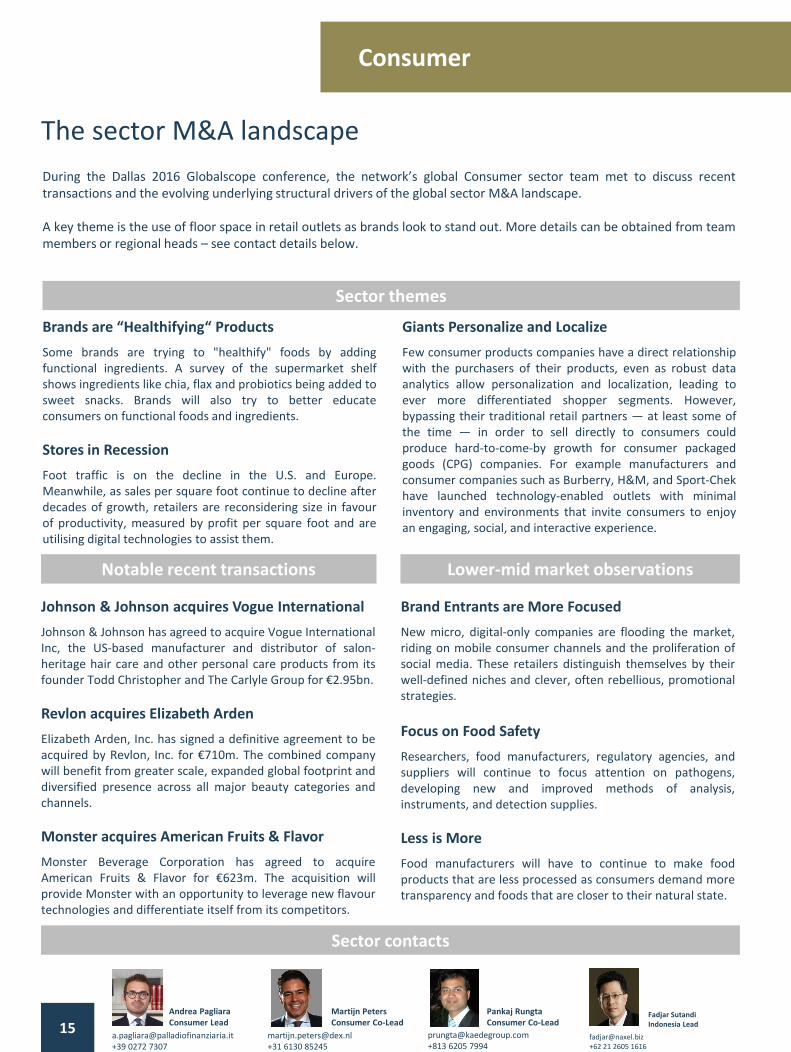
Martijn PetersConsumer Co-Lead
Consumer
15
The sector M&A landscape
During the Dallas 2016 Globalscope conference, the network’s global Consumer sector team met to discuss recenttransactions and the evolving underlying structural drivers of the global sector M&A landscape.
A key theme is the use of floor space in retail outlets as brands look to stand out. More details can be obtained from teammembers or regional heads – see contact details below.
Lower-mid market observations
Sector contacts
[email protected]+39 0272 7307
Andrea PagliaraConsumer Lead
Notable recent transactions
Sector themes
Brand Entrants are More Focused
New micro, digital-only companies are flooding the market,riding on mobile consumer channels and the proliferation ofsocial media. These retailers distinguish themselves by theirwell-defined niches and clever, often rebellious, promotionalstrategies.
Focus on Food Safety
Researchers, food manufacturers, regulatory agencies, andsuppliers will continue to focus attention on pathogens,developing new and improved methods of analysis,instruments, and detection supplies.
Less is More
Food manufacturers will have to continue to make foodproducts that are less processed as consumers demand moretransparency and foods that are closer to their natural state.
Johnson & Johnson acquires Vogue International
Johnson & Johnson has agreed to acquire Vogue InternationalInc, the US-based manufacturer and distributor of salon-heritage hair care and other personal care products from itsfounder Todd Christopher and The Carlyle Group for €2.95bn.
Revlon acquires Elizabeth Arden
Elizabeth Arden, Inc. has signed a definitive agreement to beacquired by Revlon, Inc. for €710m. The combined companywill benefit from greater scale, expanded global footprint anddiversified presence across all major beauty categories andchannels.
Monster acquires American Fruits & Flavor
Monster Beverage Corporation has agreed to acquireAmerican Fruits & Flavor for €623m. The acquisition willprovide Monster with an opportunity to leverage new flavourtechnologies and differentiate itself from its competitors.
Brands are “Healthifying“ Products
Some brands are trying to "healthify" foods by addingfunctional ingredients. A survey of the supermarket shelfshows ingredients like chia, flax and probiotics being added tosweet snacks. Brands will also try to better educateconsumers on functional foods and ingredients.
Stores in Recession
Foot traffic is on the decline in the U.S. and Europe.Meanwhile, as sales per square foot continue to decline afterdecades of growth, retailers are reconsidering size in favourof productivity, measured by profit per square foot and areutilising digital technologies to assist them.
[email protected]+813 6205 7994
Pankaj RungtaConsumer Co-Lead
Giants Personalize and Localize
Few consumer products companies have a direct relationshipwith the purchasers of their products, even as robust dataanalytics allow personalization and localization, leading toever more differentiated shopper segments. However,bypassing their traditional retail partners — at least some ofthe time — in order to sell directly to consumers couldproduce hard-to-come-by growth for consumer packagedgoods (CPG) companies. For example manufacturers andconsumer companies such as Burberry, H&M, and Sport-Chekhave launched technology-enabled outlets with minimalinventory and environments that invite consumers to enjoyan engaging, social, and interactive experience.
[email protected]+62 21 2605 1616
Fadjar SutandiIndonesia Lead

16
Durables& Apparel
Consumer Services
Retailing Food Staples
Food Luxuries
Europe Asia & Pacific
Africa & ME
US & Canada
Latin America
M&A trends & market analysis
The following data are compiled specifically for the Consumer sector, with valuation trends over time in the first chartbased on semi-annually averaged transactional data and regional and sub-sector comparisons in the second and thirdcharts based on listed companies data as at mid August 2016.
2011 2012 2013 2014 2015 2016
Lower-Mid Market Consumer Transactions TEV/EBITDA Multiple(Values in range $5m-$150m) has fallen to 9.3 from its previous high of 11.0 in 2015 H2
All MarketConsumer Transactions TEV/EBITDA Multiple(Values over $5m) has risen to 12.4 from its previous low of 10.3 in 2015 H2
This compares to the current cross-sector All Market Transactions TEV/EBITDA Multiple of 12.0
This compares to the current cross-sector Lower-Mid Market Transactions TEV/EBITDA Multiple of 9.1
Comment Context
Lower-Mid MarketConsumer Listed Companies TEV/EBITDA Multiple(Values in range $5m-$150m) by subsector is highest in Consumer Services at 12.0, 19% higher than the lowest in Durables & Apparel of 10.0
All MarketConsumer Listed Companies TEV/EBITDA Multiple(Values over $5m) by subsector is highest in Retailing at 16.6, 56% higher than the lowest in Food Staples of 10.6
Reg
ion
al TEV
/EBITD
ASu
b-secto
r TEV/EB
ITDA
Sector TEV
/EBITD
A
Lower-Mid MarketConsumer Listed Companies TEV/EBITDA Multiple(Values in range $5m-$150m) by region is highest in US & Canada at 12.1, 29% higher than the lowest in Latin America of 9.4
All MarketConsumer Listed Companies TEV/EBITDA Multiple(Values over $5m) by region is highest in US & Canada at 15.2, 23% higher than the lowest in Latin America of 12.3
This compares to the All Market Consumer Listed Companies TEV/EBITDA Multiple of 14.7
This compares to the Lower-Mid Market Consumer Listed Companies TEV/EBITDA Multiple of 11.1
Analysis performed by:Data supplied by:
6
7
8
9
10
11
12
13
14
This compares to the All Market Consumer Listed Companies TEV/EBITDA Multiple of 14.7
This compares to the Lower-Mid Market Consumer Listed Companies TEV/EBITDA Multiple of 11.1
13.915.2
12.4
15.2
12.311.4 10.9 11.4
12.1
9.4
0
2
4
6
8
10
12
14
16
18
20
13.7 14.0
16.6
10.6
15.1
10.0
12.010.9 10.8
11.6
0
2
4
6
8
10
12
14
16
18
20
Financial Services
17
The sector M&A landscape
During the Dallas 2016 Globalscope conference, the network’s global Financial Services sector team met to discuss recenttransactions and the evolving underlying structural drivers of the global sector M&A landscape.
A key theme is the shifting regulatory atmosphere in the wake of Brexit. More details can be obtained from teammembers or regional heads – see contact details below.
Jørgen BeuchertFinancial Services Lead
[email protected]+45 41 99 82 50
[email protected]+81 90 9852 8847
Josh ParkFinancial Services Co-Lead
Digital Services Lead Banks to Greater Risks
The increased number of digital services offered by banks isexposing them to greater risk, according to a new survey byAccenture. Three out of four bankers agreed that digitalservices expose banks to more risks and 85% said that theseservices were putting data handling concerns into thespotlight, leading to even more risk.
Bank Quality Greater In Smaller Banks
The 2016 Lafferty Bank Quality Rankings show a markedtrend favouring smaller banks in their rankings, the commonfactor of the nine banks who received more than three stars.These banks, such as British banks Aldermore and CloseBrothers, scored better in customer satisfaction, alongsidebetter retail focus, strategy, conduct, and management totop the list.
Deutsche Boerse Acquires London Stock Exchange
Deutsche Boerse AG has moved to acquire its UK cousinLondon Stock Exchange Plc for $14.8bn. The merger, which isstill subject to regulatory approval, would create the largesttrading exchange by revenue in the world.
Mitsubishi UFJ Acquires Rival Stake
Mitsubishi UFJ Financial Group has acquired a 27.2% inHitachi Capital Corporation for $998m. It is the business unitof Hitachi that provides small business loans and otherfinancing to companies around the globe.
China Investment Corp. Invests in Ant Financial
State-funded investment company China Investment Corp.(CIC) has invested $4.5bn in fellow Chinese company AntFinancial. Ant is an affiliate company of Alibaba, themultinational supply company, and was previously AliPay.
New Regulations Coming into Force
Regulations in the financial sector will continue to putpressure on the industry, and this could fuel a reshaping ofthe sector, with divestment and new entrants. Unfortunately,it will also have a negative impact on risk taking and theappetite for financing in M&A and the alternative financespace.
Brexit Causing a Stir
Political headwinds in Europe caused a slowdown in dealactivity during H1 2016, with European M&A activity($342.8bn, 3,110 deals) dropping 19.3% by value comparedto H1 2015 ($424.5bn, 3,287 deals).
Rise of Disruptive Forces
Banks are concerned that disruptive digital innovationsoutside the industry, from technology start-ups and existingtechnology firms will gain favour, and be another threat totheir business. These new products could lead to a shift inglobal wealth, risk management and InvestmentManagement.
Disruptive Bitcoin
Disruptive technologies such as Bitcoin, blockchain, and otherevolving sectors, as well as the FinTech industry, aredeveloping and investors and larger firms are getting excitedand ready to snap up vertical buys.
Lower-mid market observations
Sector contacts
Notable recent transactions
Sector themes
[email protected]+7 495 726 5917
Konstantin Dzhimbinov Financial Services Co-Lead
[email protected]+62 21 2605 1616
Fadjar SutandiIndonesia Lead

Europe Asia & Pacific
Africa & ME
US & Canada
Latin America
18
M&A trends & market analysis
The following data are compiled specifically for the Financial Services sector, with valuation trends over time in the firstchart based on semi-annually averaged transactional data and regional and sub-sector comparisons in the second andthird charts based on listed companies data as at mid August 2016.
2011 2012 2013 2014 2015 2016
All MarketFinancial Services Transactions TEV/EBITDA Multiple (Values over $5m) has fallen to 12.2 from its previous high of 14.2 in 2015 H2
Lower-Mid Market Financial Services Transactions TEV/EBITDA Multiple(Values in range $5m-$150m) has fallen to 9.1from its previous high of 9.5 in 2015 H2
Comment Context
Lower-Mid MarketFinancial Services Listed Companies TEV/EBITDA Multiple(Values in range $5m-$150m) by subsector is highest in Real Estate at 14.4, 86% higher than the lowest in Banks of 7.7
All MarketFinancial Services Listed Companies TEV/EBITDA Multiple(Values over $5m) by subsector is highest in Real Estate at 16.4, 53% higher than the lowest in Insurance of 10.7
Lower-Mid MarketFinancial Services Listed Companies TEV/EBITDA Multiple(Values in range $5m-$150m) by region is highest in Europe at 11.3, 51% higher than the lowest in Latin America of 7.5
All MarketFinancial Services Listed Companies TEV/EBITDA Multiple(Values over $5m) by region is highest in Asia & Pacific at 14.3, 49% higher than the lowest in Latin America of 9.6
Analysis performed by:Data supplied by:
Banks Diversified Insurance Real Estate
4
6
8
10
12
14
16
18
This compares to the All Market Financial Services Listed Companies TEV/EBITDA Multiple of 12.2
This compares to the Lower-Mid Market Financial Services Listed Companies TEV/EBITDA Multiple of 10.9
Reg
ion
al TEV
/EBITD
ASu
b-secto
r TEV/EB
ITDA
Sector TEV
/EBITD
A
This compares to the All Market Financial Services Listed Companies TEV/EBITDA Multiple of 12.2
This compares to the Lower-Mid Market Financial Services Listed Companies TEV/EBITDA Multiple of 10.9
9.9
14.312.8
12.0
9.6
11.3 11.3 11.1
9.4
7.5
0
2
4
6
8
10
12
14
16
18
20
13.5 13.4
10.7
16.4
7.7
11.49.8
14.4
0
2
4
6
8
10
12
14
16
18
20
This compares to the current cross-sector All Market Transactions TEV/EBITDA Multiple of 12.0
This compares to the current cross-sector Lower-Mid Market Transactions TEV/EBITDA Multiple of 9.1

Life Sciences
19
The sector M&A landscape
During the Dallas 2016 Globalscope conference, the network’s global Life Sciences sector team met to discuss recenttransactions and the evolving underlying structural drivers of the global sector M&A landscape.
A key theme is the rising cost of all drugs and pharmaceutical products in the US. More details can be obtained from team members or regional heads – see contact details below.
[email protected]+91 22 6154 4500
[email protected]+49 40 300 836 0
Jacob MatthewPharma Lead
Caspar Graf StauffenbergLife Sciences Lead
[email protected] +49 40 300 836 0
Manfred DraxLife Sciences Co-Lead
Emergence of Global Telemedicine Market
One of the fastest growing sectors of healthcare is the globaltelemedicine market, predicted to double in the next sixyears with 18.5% compound growth. Parks Associates saw5.7m visits to online doctors via apps, like Health Tap, in 2014and 16m in 2015. Hailed as the “future of medicine”, savingscan reach $700 per visit and increase ease of access tomedical attention in remote areas.
Shifting Demographics
The growing frequency of chronic diseases, a worldwide agingpopulation and rising consumer wealth are leading to a shiftin the target demographics for some pharmaceuticalscompanies. The increase in prevalence of chronic diseases,also inked to longer life expectancy, is having a profoundeffect on both developed and developing economies acrossthe globe.
Envision and Amsurg Corp. Agree Merger
Envision Healthcare Holdings Inc. agreed with AmsurgCorporation an all-stock merger to create a giant Americanprovider of healthcare services and physicians worth $15bn.This move will enable them to gain leverage in negotiationswith health insurers.
Pfizer Merges with Anacor
Pfizer, the world’s largest research-based pharmaceuticalcompany, announced a merger with Anacor Pharmaceuticalsfor $5.2bn in May. Anacor’s flagship asset, Crisabarole, isawaiting approval and has the potential to treat atopicdermatitis, a strong fit with Pfizer’s Inflammation andImmunology portfolios.
Toshiba Sells Medical Imaging Unit to Canon
Japanese player Toshiba has sold its medical imaging unit tofellow Japanese corporate Canon for $5.9bn.
Pharmaceutical Costs Soar in the USA
The cost of prescription medicines in the USA is a contentiousissue and prices are often three times as great as in the UK.This is due to the fact that a free market system of pricesetting is allowed in the USA, unlike elsewhere where there isgreater regulation. Presidential candidates Clinton andTrump have pledged to reduce these costs. Thecounterargument is that this move will reduce the amount ofinnovation pharmaceutical companies can afford to bear,although the country undertakes a third of global drugspending despite just 4.5% of the world’s population.
Focus on Outcomes
Much more R&D around medicines is being driven by a desirefor better outcomes. Insurance companies are beginning torefuse coverage of some treatments due to spiralling costs.This has lead to a pursuit of targeted and specialisedtherapies.
Shareholder Activism Leading Strategy
Shareholders are creating top-down pressure onpharmaceutical companies to increase focus on valuecreation and improved performance through acquisitions, JVsand divestitures.
Lower-mid market observations
Sector contacts
Notable recent transactions
Sector themes
[email protected]+62 21 2605 1616
Fadjar SutandiIndonesia Lead

Europe Asia & Pacific
Africa & ME
US & Canada
Latin America
20
M&A trends & market analysis
The following data are compiled specifically for the Life Sciences sector, with valuation trends over time in the first chartbased on semi-annually averaged transactional data and regional and sub-sector comparisons in the second and thirdcharts based on listed companies data as at mid August 2016.
2011 2012 2013 2014 2015 2016
Lower-Mid Market Life Sciences TransactionsTEV/EBITDA Multiple(Values in range $5m-$150m) has fallen to 9.7 from its previous high of 10.3 in 2015 H2
All MarketLife Sciences Transactions TEV/EBITDA Multiple(Values over $5m) has risen to 15.8 from its previous low of 14.5 in 2015 H2
Comment Context
Lower-Mid Market Life Sciences Listed Companies TEV/EBITDA Multiple(Values in range $5m-$150m) by subsector is highest in BioTech at 20.7, 62% higher than the lowest in Providers & Services of 12.7
All MarketLife Sciences Listed Companies -TEV/EBITDA Multiple(Values over $5m) by subsector is highest in MedTech at 17.8, 47% higher than the lowest in Providers & Services of 12.1
Lower-Mid Market Life Sciences Listed Companies TEV/EBITDA Multiple(Values in range $5m-$150m) by region is highest in US & Canada at 15.5, 77% higher than the lowest in Africa & ME of 8.8
All MarketLife Sciences Listed Companies -TEV/EBITDA Multiple(Values over $5m) by region is highest in Asia and Pacific at 18.6, 32% higher than the lowest in Latin America of 14.1
Analysis performed by:Data supplied by:
4
6
8
10
12
14
16
Equipment & Supplies
Providers & Services
MedTech BioTech Pharma
This compares to the All Market Life Sciences Listed Companies TEV/EBITDA Multiple of 15.0
This compares to the Lower-Mid Market Life Sciences Listed Companies TEV/EBITDA Multiple of 14.4
Reg
ion
al TEV
/EBITD
ASu
b-secto
r TEV/EB
ITDA
Sector TEV
/EBITD
A
This compares to the All Market Life Sciences Listed Companies TEV/EBITDA Multiple of 15.0
This compares to the Lower-Mid Market Life Sciences Listed Companies TEV/EBITDA Multiple of 14.4
14.4
18.6
15.614.3 14.114.6 14.5
8.8
15.5
13.0
0
2
4
6
8
10
12
14
16
18
20
22
17.2
12.1
17.8
14.315.4
14.512.7
18.920.7
13.4
0
2
4
6
8
10
12
14
16
18
20
22
24
This compares to the current cross-sector All Market Transactions TEV/EBITDA Multiple of 12.0
This compares to the current cross-sector Lower-Mid Market Transactions TEV/EBITDA Multiple of 9.1

The sector M&A landscape
Industrials
During the Dallas 2016 Globalscope conference, the network’s global Industrials sector team met to discuss recenttransactions and the evolving underlying structural drivers of the global sector M&A landscape.
A key theme is the changing use of data by large corporates in order to maximise manufacturing efficiency. More details can be obtained from team members or regional heads – see contact details below.
21Pankaj BhuwaniaIndustrials Co-Lead
[email protected]+91 98 1045 8044
Jeremi CzarneckiIndustrials Lead
[email protected]+48 608 335 400
Collusion in the Truck Making Industry
The EU issued its biggest ever cartel fine to six of the largestEuropean truck makers over allegations of price fixing anddelaying new emission technologies. These firms havestrongly resisted changes that would result in reduced carbondioxide emissions and improved fuel consumption. Despite600,000 individual hauliers in Europe the six firms have neartotal control of the market, so any fines may help the lowermid-market firms exert greater market power.
Next Generation Batteries
Demand for extended mobile devices’ battery life is drivingthe development of next generation batteries. Breakthroughshave been made but safety and economic concerns have thusfar prevented them from reaching the mass market.Predictions suggest this will reverse by 2020 with post-lithium-ion battery technologies representing 10% of theentire battery market by 2026.
Albermarle sells Chemetall to BASF
Albermarle Corporation, the American chemical company,announced its sale of Chemetall Surface Treatment toGerman chemicals giant BASF for $3.2bn. Chemetall’s appliedmetal surface treatments will help BASF fulfil its aim offocusing on automotive applications.
Total SA Expands Clean Energy Offering
Total SA has acquired French battery maker Saft Groupe SAfor $1.1bn. Saft designs and makes nickel and lithiumbatteries for the transportation and military sectors. Totalhad previously pledged to invest $500m in renewables.
Dover Corp. Acquires Wayne Fuelling Systems
Dover Corp. has acquired fuel pump technology businessWayne Fuelling Systems for $780m. Texas-based Waynemanufactures fuel pumps and other related items.
Robotics Changing the Face of Manufacturing
Shipments of multipurpose industrial robots in China havedoubled to an estimated 75,000 in the last 12 months, andwhilst this number is forecast to double again by 2018, somehave expressed concern over the reduction in innovationposed by the lack of human intervention.
Collection of Big Data Leading Efficiency Drives
Industrial manufacturing companies are using the Internet ofThings (“IoT”) to collect vast quantities of data on their shopfloors and assembly lines in order to help identify areas foroperational improvement.
Activist Investors Shaping Strategy
Some activist investors in the chemicals industry are seeing alack of rationale or coherence in companies’ portfolios. Thishas lead to many chemicals companies reconsidering theirproduct lines, often through merger or product acquisition.
Driverless Cars are the Order of the Day
Showrooms and design offices all over the world are racing tocreate a truly driverless car. Cab-hailing app Uber is testing afleet of Volvo cars that are driverless in San Francisco, but asyet no manufacturer is mass producing a purpose-builtvehicle.
Lower-mid market observations
Sector contacts
Notable recent transactions
Sector themes
[email protected]+62 21 2605 1616
Fadjar SutandiIndonesia Lead

Energy Materials Capital Goods
Auto-mobiles
Utilities
M&A trends & market analysis
The following data are compiled specifically for the Industrials sector, with valuation trends over time in the first chartbased on semi-annually averaged transactional data, and regional and sub-sector comparisons in the second and thirdcharts based on listed companies data as at mid August 2016.
2011 2012 2013 2014 2015 2016
Lower-Mid MarketIndustrials Transactions TEV/EBITDA Multiple (Values in range $5m-$150m) has fallen to 8.1 from its previous high of 8.6 in 2015 H2
All MarketIndustrials Transactions TEV/EBITDA Multiple (Values over $5m) has fallen to 11.1 from its previous high of 11.3 in 2015 H2
Comment Context
Lower-Mid MarketIndustrials Listed CompaniesTEV/EBITDA Multiples(Values in range $5m-$150m) by subsector is highest in Capital Goods at 10.2, 19% higher than the lowest in Automobiles of 8.6
All MarketIndustrials Listed CompaniesTEV/EBITDA Multiple (Values over $5m) by subsector is highest in Capital Goods at 14.1, 57% higher than the lowest in Automobiles of 8.9
Lower-Mid MarketIndustrials Listed CompaniesTEV/EBITDA Multiple(Values in range $5m-$150m) by region is highest in US & Canada at 10.1, 21% higher than the lowest in Latin America of 8.4
All MarketIndustrials Listed CompaniesTEV/EBITDA Multiple(Values over $5m) by region is highest in US & Canada at 12.9, 51% higher than the lowest in Latin America of 8.5
Data analysed by:Data supplied by:
22
This compares to the All Market Industrials Listed Companies TEV/EBITDA Multiple of 11.8
This compares to the Lower-Mid Market Industrials Listed Companies TEV/EBITDA Multiple of 9.6
Reg
ion
al TEV
/EBITD
ASu
b-secto
r TEV/EB
ITDA
Sector TEV
/EBITD
A
This compares to the All Market Industrials Listed Companies TEV/EBITDA Multiple of 11.8
This compares to the Lower-Mid Market Industrials Listed Companies TEV/EBITDA Multiple of 9.6
4
6
8
10
12
14
Europe Asia & Pacific
Africa & ME
US & Canada
Latin America
9.8
12.4
10.4
12.9
8.59.6 9.6 9.7 10.1
8.4
0
2
4
6
8
10
12
14
16
18
20
11.512.3
14.1
8.910.0
8.79.5 10.2
8.6 9.1
0
2
4
6
8
10
12
14
16
18
20
This compares to the current cross-sector All Market Transactions TEV/EBITDA Multiple of 12.0
This compares to the current cross-sector Lower-Mid Market Transactions TEV/EBITDA Multiple of 9.1
23
Services
The sector M&A landscape
During the Dallas 2016 Globalscope conference, the network’s global Services sector team met to discuss recenttransactions and the evolving underlying structural drivers of the global sector M&A landscape.
A key theme is the technology enabled workplace which is driving the development of new products and services. More details can be obtained from team members or regional heads – see contact details below.
[email protected]+44 20 7626 6266
Jim KeelingServices Lead
[email protected]+61 3 9665 2444
Dominic MarinelliResource Services Lead
[email protected]+31 6 13 08 52 45
Martijn PetersServices Co-Lead
Lower-mid market observations
Sector contacts
Notable recent transactions
Sector themes
New Wave of Corporate Airlines
Start ups Surf Air (US and Europe), FlyClub (UK) and Airly(Australia) have introduced a new business model forcorporate travel: monthly subscription. The “all you can fly”model between small airports removes the existing hassle ofconventional business travel and the expense of privateaircraft.
Innovative Products Lead the Way
Companies operating in the lower-mid market withinnovative and high-quality products are beginning to stealmarket share from the more traditional players in theirrespective spaces.
Remote Workers Driving Product Innovation
Service providers are seeing an increase in demand forpeople working on-the-go and remotely, leading to anexplosion of specialist platforms for the modern workforce.
Brexit Gives Rise to Opportunity
Professional services firms are using the fallout of Brexit toexploit revenues as they experience high volumes relatedqueries from clients. The Big Four expect firms to reorganisein order to adapt to regulatory change. Recently, a PwC clientwebcast on the topic of Brexit had 15,000 attendees.
Investing in Health
The emerging trend of living a healthy lifestyle is increasingdemand for relevant services and products, this extends towellness consultants operating within businesses.
Chinese Swoop for Vitaco
Australian vitamin producer Vitaco has been acquiredthrough a joint A$314m bid tabled by ShanghaiPharmaceuticals and Chinese private equity fund PrimaveraCapital.
AlliedBurton and Universal Services Merger
AlliedBurton and Universal Services have merged to createthe largest security company in North America. The firmprovides localized response and national support, employing140,000 security officers.
Technip and FMC in Merger of Equals
In what some are seeing as a bid to survive the oil industryslump, offshore service companies Technip and FMC havemerged in a transaction valuing the combined group at$13bn.
Global Freight Forwarding Market Set to Grow
The global freight forwarding market is estimated to havecontracted by 1.6% in nominal terms in 2015 but there is aforecasted real growth rate of 4.6% for 2015-19. Europe'sglobal market share is expected to contract whilst emergingregions gain share in its place. Trade deals such as theTranspacific Partnership are likely to boost trade further.
AI and Automation Transforming Industry
Businesses are transforming with more AI and automation toremain competitive, as high capital outlay is soon repaid withhigher productivity and lower overhead costs.
[email protected]+62 21 2605 1616
Fadjar SutandiIndonesia Lead

2011 2012 2013 2014 2015 2016
Europe Asia & Pacific
Africa & ME
US & Canada
Latin America
24
ProfessionalServices
HR and Employ-
ment
Real Estate Mgmt
Research / Consulting
Transport-ation
M&A trends & market analysis
The following data are compiled specifically for the Services sector, with valuation trends over time in the first chart based onsemi-annually averaged transactional data, and regional and sub-sector comparisons in the second and third charts based onlisted companies data as at mid August 2016.
Lower-Mid MarketServices Transactions TEV/EBITDA Multiple (Values in range $5m-$150m) has fallen to 8.4 from its previous high of 10.0 in 2015 H2
All MarketServices Transactions TEV/EBITDA Multiple (Values over $5m) has fallen further to 10.5 from its previous high of 12.7 in 2015 H1
Comment Context
Lower-Mid MarketServices Listed CompaniesTEV/EBITDA Multiple(Values in range $5m-$150m) by subsector is highest in Real Estate Management at 12.8, 36% higher than the lowest in Professional Services of 9.4
All MarketServices Listed CompaniesTEV/EBITDA Multiple(Values over $5m) by subsector is highest in Research / Consulting at 16.2, 112% higher than the lowest in Transportation of 7.7
Lower-Mid MarketServices Listed CompaniesTEV/EBITDA Multiple(Values in range $5m-$150m) by region is highest in Africa & ME at 12.4, 44% higher than the lowest in Latin America of 8.6
All MarketServices Listed CompaniesTEV/EBITDA Multiple(Values over $5m) by region is highest in Asia & Pacific at 14.0, 33% higher than the lowest in US & Canada of 10.6
Data analysed by:Data supplied by:
4
6
8
10
12
14
16
This compares to the All Market Services Listed Companies TEV/EBITDA Multiple of 12.9
This compares to the Lower-Mid Market Services Listed Companies TEV/EBITDA Multiple of 10.6
This compares to the All Market Services Listed Companies TEV/EBITDA Multiple of 12.9
This compares to the Lower-Mid Market Services Listed Companies TEV/EBITDA Multiple of 10.6
Reg
ion
al TEV
/EBITD
ASu
b-secto
r TEV/EB
ITDA
Sector TEV
/EBITD
A
12.514.0 13.4
10.6
13.0
11.110.1
12.411.5
8.6
0
2
4
6
8
10
12
14
16
18
20
13.0
10.5
16.0 16.2
7.7
9.410.1
12.8
10.99.9
0
2
4
6
8
10
12
14
16
18
20
This compares to the current cross-sector All Market Transactions TEV/EBITDA Multiple of 12.0
This compares to the current cross-sector Lower-Mid Market Transactions TEV/EBITDA Multiple of 9.1

European Private Equity Holds Steady
There were 350 European private equity-backed deals in Q22016, a decline of circa 8% on the 381 deals in Q1 2016.Sizeable value creation opportunities remain in the EuropeanPrivate Equity market, despite the well-publicisedmacroeconomic headwinds of Brexit and the Eurozone crisis.
Buyer Universe Changing Dramatically
Increasingly, the buyers involved in TMT sector transactionsare no longer just TMT players. Executives in other sectorsare increasingly conscious that their technology strategy willbe key to the ongoing competitiveness of their business,regardless of their sector.
Technology, Media & Telecoms (TMT)
25
The sector M&A landscape
During the Dallas 2016 Globalscope conference, the network’s global Technology, Media & Telecoms (TMT) sector teammet to discuss recent transactions and the evolving underlying structural drivers of the global sector M&A landscape.
A key theme is the ‘Information of Everything’, the increasing availability of large data sets and advanced analytics tools,which is driving the adoption of artificial intelligence to optimise systems and processes across all verticals. More detailscan be obtained from team members or regional heads – see contact details below.
[email protected]+44 20 7659 0310
[email protected]+494 0300 8360
Paddy MccGwireSoftware & Tech Lead
Mark MillerDigital & Internet Co-Lead
Sector contacts
Lower-mid market observationsNotable recent transactions
Sector themes
Unsolicited Offers Remain Prevalent
Buyers continue to seek to pre-empt auction processes wherepossible, with unsolicited offers. Increasingly, receipt of anunsolicited offer is becoming one of the most commoncatalysts for launching a formal process.
Record Levels of Capital Available
The year to July saw a record influx of capital into theEuropean market, with circa $5.5bn of VC funds raised. The 3largest funds raised year-to-date were Cocoon ($715m), IndexVentures ($704m) and EQT Ventures ($632m).
Strategic Valuations are Commonplace
Buyers remain willing to share strategic benefits with sellerswhere they see potential for significant value creation, oralternative targets are limited. Recent examples are ARM’sacquisition of Apical for $350m (c.15.0x EV/R) and Trainline’sacquisition of Captain Train for c. $190m (c.20.0x EV/R).
British Technology Loses its Crown Jewel
Japanese technology conglomerate Softbank acquired themicroprocessor IP licensing business ARM for $32bn. This wasthe largest ever transaction involving a European technologybusiness and ARM is by far the most recognisable UK-basedtechnology company.
Blue Coat Systems Changes Hands (again!)
Symantec has agreed to buy enterprise security softwarecompany Blue Coat Systems for $4.7bn. This transactioncomes only 12 months after Blue Coat was sold to BainCapital for $2.4bn by Thoma Bravo, who had originally takenthe company private for $1.3bn in 2011.
Microsoft Enters Social Media Domain
Microsoft has agreed to acquire the professional socialnetwork LinkedIn for $26.2bn in cash. LinkedIn will becomepart of Microsoft’s Productivity & Business Processes division.
Technology-Driven Acquisitions on the Rise
Established players have demonstrated they are not afraid topay strategic prices for technology they consider trulyground-breaking and capable of positioning their business forthe future, even if the product and/or market fit is unproven.A recent example is Twitter’s $150m acquisition of MagicPony Technologies, a < 3 year old machine learning company.
Ongoing Consolidation of the “Old TMT Economy”
Over the last 18 months, further waves of consolidation havecome to bear in the “old economy” technology industries.Perhaps the most volatile has been the semiconductor sector,which saw over $100bn of transactions in 2015 alone.
[email protected]+62 21 2605 1616
Fadjar SutandiIndonesia Lead

6
7
8
9
10
11
12
13
14
Media Software Hardware Semi-conductors
Telecoms
26
M&A trends & market analysis
The following data are compiled specifically for the TMT sector, with valuation trends over time in the first chart based onsemi-annually averaged transactional data and regional and sub-sector comparisons in the second and third charts basedon listed companies data as at mid August 2016.
Comment Context
Lower-Mid Market TMT Listed Companies TEV/EBITDA Multiple(Values in range $5m-$150m) by subsector is highest in Software at 13.4, 21% higher than the lowest in Hardware of 11.1
All MarketTMT Listed CompaniesTEV/EBITDA Multiple(Values over $5m) by subsector is highest in Software at 15.8, 118% higher than the lowest in Telecoms of 7.3
Lower-Mid Market TMT Listed Companies TEV/EBITDA Multiple(Values in range $5m-$150m) by region is highest in US & Canada at 13.0, 44% higher than the lowest in Latin America of 9.0
All MarketTMT Listed Companies -TEV/EBITDA Multiple(Values over $5m) by region is highest in US & Canada at 11.9, 59% higher than the lowest in Africa & ME of 7.5
Analysis performed by:Data supplied by:
This compares to the All Market TMT Listed Companies TEV/EBITDA Multiple of 11.3
This compares to the Lower-Mid Market TMT Listed Companies TEV/EBITDA Multiple of 12.0
This compares to the All Market TMT Listed Companies TEV/EBITDA Multiple of 11.3
This compares to the Lower-Mid Market TMT Listed Companies TEV/EBITDA Multiple of 12.0
Reg
ion
al TEV
/EBITD
ASu
b-secto
r TEV/EB
ITDA
Sector TEV
/EBITD
A
All MarketTMT TransactionsTEV/EBITDA Multiple(Values over $5m) has risen to 12.1 from its previous low of 10.8 in 2015 H2
Lower-Mid Market TMT TransactionsTEV/EBITDA Multiple(Values in range $5m-$150m) has risen to 10.7 from its previous low of 9.0 in 2015 H2
2011 2012 2013 2014 2015 2016
Europe Asia & Pacific
Africa & ME
US & Canada
Latin America
10.9 10.8
7.5
11.9
8.6
12.3 11.910.5
13.0
9.0
0
2
4
6
8
10
12
14
16
18
20
11.7
15.8
10.5
12.8
7.3
11.1
13.4
11.112.2
11.4
0
2
4
6
8
10
12
14
16
18
20
This compares to the current cross-sector All Market Transactions TEV/EBITDA Multiple of 12.0
This compares to the current cross-sector Lower-Mid Market Transactions TEV/EBITDA Multiple of 9.1

About NaXeL iPartners
Contacts
Fadjar Sutandi
Lead Partner
+62-21-2605-1616
NaXeL iPartners is formed to facilitate the need for direct investment and M&A transaction to Indonesia.
The key firm partners consist of seasoned investment banker and transaction lawyer Indonesia. To provide
an extensive services, we work closely with a regional Investment Bank for any capital markets related
transaction and with a local notable transaction law firm on transaction legal matter.
www.naxel.biz
More than 20 years experience in Indonesian Capital Markets and Corporate Finance Advisory Services.
Licensed Investment Advisor, Underwriter and Public Business Appraiser. Founded and lead NaXeL
iPartners that provides corporate finance advisory services from fund raising: debt, equity, mezzanine,
Off balance sheet financing, M&A , capital markets, and other corporate strategic actions. Assisting
Indonesian business in searching the right strategic partner to grow to the next level. Vice versa, assisting
foreign strategic and financial investors finding the right investment target in Indonesia.