
Global Views - Global Banking and Markets · Weekly commentary on economic and financial market...
31
Foreign Exchange Strategy Fixed Income Strategy Fixed Income Research Emerging Markets Strategy Portfolio Strategy Economics Weekly commentary on economic and financial market developments Global Views Corporate Bond Research Contact Us Global Views is available on scotiabank.com, Bloomberg at SCOT and Reuters at SM1C June 5, 2015 Economics Time To Reward China For Market Reforms 2-4 Derek Holt Global Forecast Update: Another Slow Start For The Global Economy 5-6 Aron Gampel USD Strength Expected Over The Medium Term 7 Pablo Bréard and Eric Theoret Global Auto Sales And Production Gain Momentum 8 Carlos Gomes June 5th OPEC Meeting — Saudi Arabia Maintains Its Policy Of Allowing Market Forces To Shake Out Higher-Cost Producers 9 Patricia Mohr Are The US Treasury Shorts Going Too Far Again? 10-11 Derek Holt Indonesia Faces Challenging Economic Conditions 12 Tuuli McCully and Neil Shankar Adding Chinese A-Shares To Major Benchmark Indices 13 Frances Donald Foreign Exchange Strategy Latin America Week Ahead: For The Week Of June 8 - 12 14-16 Eduardo Suárez Key Data Preview A1-A2 Key Indicators A3-A5 Global Auctions Calendar A6-A7 Events Calendar A8-A9 Global Central Bank Watch A10 Latest Economic Statistics A11-A12 Latest Financial Statistics A13 Global Forecast Update Report Forecasts & Data This Week’s Featured Chart Please see the Global Forecast Update, June 1, 2015, for our latest economic, interest and exchange rate and commodity price forecasts and the Foreign Exchange Outlook, June 2015, for more detailed currency forecasts and commentary. 70 75 80 85 90 95 100 105 110 115 Jan-13 Jul-13 Jan-14 Jul-14 Jan-15 Jul-15 Bond Market "Taper Fit"? index CBOE Interest Rate Volatility Index Source: Scotiabank Economics, CBOE.
Transcript of Global Views - Global Banking and Markets · Weekly commentary on economic and financial market...

Foreign Exchange Strategy Fixed Income Strategy Fixed Income Research Emerging Markets Strategy Portfolio Strategy Economics
Weekly commentary on economic and financial market developments
Global Views
Corporate Bond Research
Contact Us
Global Views is available on scotiabank.com, Bloomberg at SCOT and Reuters at SM1C
June 5, 2015
Economics
Time To Reward China For Market Reforms 2-4
Derek Holt
Global Forecast Update: Another Slow Start For The Global Economy 5-6
Aron Gampel
USD Strength Expected Over The Medium Term 7
Pablo Bréard and Eric Theoret
Global Auto Sales And Production Gain Momentum 8
Carlos Gomes
June 5th OPEC Meeting — Saudi Arabia Maintains Its Policy Of
Allowing Market Forces To Shake Out Higher-Cost Producers
9
Patricia Mohr
Are The US Treasury Shorts Going Too Far Again? 10-11
Derek Holt
Indonesia Faces Challenging Economic Conditions 12
Tuuli McCully and Neil Shankar
Adding Chinese A-Shares To Major Benchmark Indices 13
Frances Donald
Foreign Exchange Strategy
Latin America Week Ahead: For The Week Of June 8 - 12 14-16
Eduardo Suárez
Key Data Preview A1-A2
Key Indicators A3-A5
Global Auctions Calendar A6-A7
Events Calendar A8-A9
Global Central Bank Watch A10
Latest Economic Statistics A11-A12
Latest Financial Statistics A13
Global Forecast Update Report
Forecasts & Data
This Week’s Featured Chart
Please see the Global Forecast Update, June 1, 2015, for our latest economic, interest and exchange rate and commodity price forecasts and the Foreign Exchange Outlook, June 2015, for more detailed currency forecasts and commentary.
70
75
80
85
90
95
100
105
110
115
Jan-13 Jul-13 Jan-14 Jul-14 Jan-15 Jul-15
Bond Market "Taper Fit"?
index
CBOE Interest Rate Volatility Index
Source: Scotiabank Economics, CBOE.
Economics
Global Views
June 5, 2015
2
Time To Reward China For Market Reforms
Please see our full indicator, central bank, auction and event calendars on pp. A3-A10.
United States — Consumers Arriving Too Late & Possibly Fleeting?
Pretty much the only material domestic risk overhanging US markets next week will be Thursday’s retail sales release for May. It could well be a very solid print, but the bar is very high for it to be enough to rescue the overall quarter, and breadth lies in doubt. May’s 8.3% m/m surge in new domestic vehicle sales to the highest level since January 2006 will combine with a 9.8% m/m rise in gasoline prices to lift the dollar value of headline sales up by around a full percentage point. We will more closely watch sales ex-autos and ex-gasoline as a gauge of breadth to see whether there is anything, well, left in the tank for other purchases, so to speak.
With what we know so far with data only for April plus the Q2 hand-off, the volume of sales is tracking about a 1% quarterly gain in Q2 over Q1 at a seasonally adjusted and annualized rate. This follows a contraction of 1.6% q/q in Q1 that was supposed to have resulted in unleashed pent-up demand in Q2 but so far this has not happened. It would take two back-to-back monthly volume gains of a half percentage point or more to get Q2 consumption growth up to at least 3% over Q1. That may be unrealistic to expect because the surge in May auto sales may be tough to repeat, and breadth will be required beyond just a pick-up in auto sales volumes. Note that even after incorporating upsides to recent indicators including net exports, the Atlanta Fed still figures that Q2 GDP growth is tracking at about 1.1% at a seasonally adjusted and annualized rate — and thus still far below the potentially lagging consensus. Friday’s UofM consumer sentiment reading may indicate whether the confidence to drive such spending gains in the near-term is improving following the decline over recent months.
Don’t expect much by way of monetary policy communications as the Federal Reserve slips into communications black-out on Tuesday ahead of the following week’s FOMC meeting. On Thursday, the Fed releases its quarterly ‘flow of funds’ accounts showing the broad financial accounts of the US economy. This is the release that prompts headlines about changes in household wealth and indebtedness, and broader measures of national finances.
The US Treasury auctions 3s and reopens 10 and 30 year issues.
Asia — Will Mainland China Be Included In Global Equity Benchmarks?
Chinese stock market observers will want to keep a close eye on the decision late Tuesday over whether to include China A-shares (Chinese stocks listed in mainland China) in the MSCI Emerging Markets Index and probably the All Countries World Index. If that happens, then global portfolio managers that benchmark to these indices may be open to moderately raising China weights in future and thus complement further efforts of Chinese policy makers to liberalize access while providing support for mainland Chinese equity valuations. So-called H shares that are Chinese companies listed in Hong Kong are the only firms captured within the index at the moment and their weight of just under 3% in the MSCI All-World index and 25% in the Emerging Markets Index underestimates the size of China’s stock market. If the decision is made to include A-shares then only some fraction of their market capitalization — perhaps around 5% — is likely at first and by June of next year with potential future increases in this fraction raised over subsequent reviews pending further relaxation of capital account and stock market access rules by China. The decision would conclude a two-year review with supporters of the move to include A-shares noting that the market indices underweight China and fail to recognize some steps to liberalize access like the Shanghai-Hong Kong
Derek Holt 416.863.7707 [email protected]
THE WEEK AHEAD
Next Week's Risk Dashboard
Greek debt negotiations
G7 Summit
MSCI inclusion of mainland China?
Chinese exports, CPI
US retail sales
German exports
BoC communications
Australian jobs
RBNZ, BoK, BoT
European factory output, exports
Economics
Global Views
June 5, 2015
3
… continued from previous page
Stock Connect agreement that opens up access to mainland China to Hong Kong investors. Supporters also embrace the opportunity to further integrate China into the global financial system especially after ill-conceived gestures such as limiting its IMF & World Bank roles only to prompt creation of the Asian Infrastructure Investment Bank. Opponents say that China has not yet pursued enough forms of stock market and capital account liberalization. Nevertheless, the competitive pressure may be on, as Vanguard recently announced that A-shares will be included in its FTSE Emerging Market ETF and this follows similar FTSE-Russell remarks a few days prior.
Chinese macro data will also figure prominently over the week with CPI for May expected to decelerate to about 1.3% y/y and thus still around the lowest readings of the post-crisis era. Year-ago export growth has been contracting for the past two months and on a longer-run volatile trend and so markets may be sensitive toward the latest batch of figures for May. Chinese company financing volumes, retail sales, and industrial production will also be released.
Three regional central banks weigh in with policy decisions including the Reserve Bank of New Zealand on Wednesday, the Bank of Thailand the same day, and the Bank of Korea the next day. None are expected to change their policy rates.
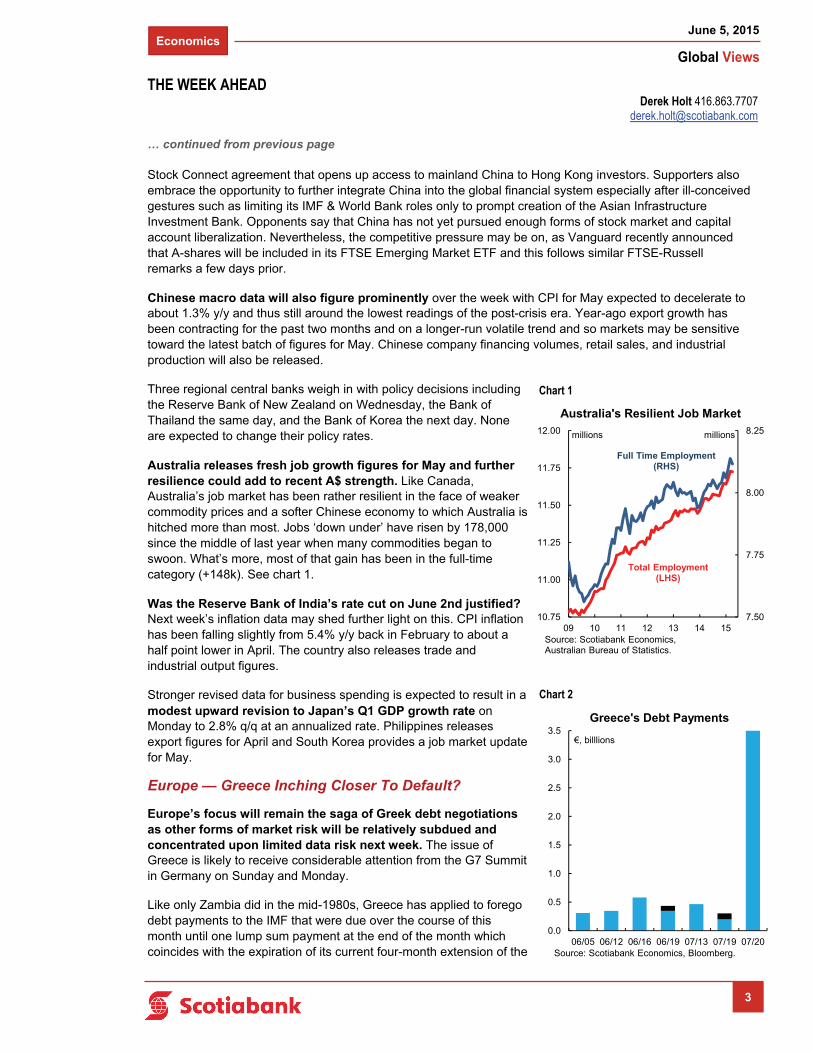
Australia releases fresh job growth figures for May and further resilience could add to recent A$ strength. Like Canada, Australia’s job market has been rather resilient in the face of weaker commodity prices and a softer Chinese economy to which Australia is hitched more than most. Jobs ‘down under’ have risen by 178,000 since the middle of last year when many commodities began to swoon. What’s more, most of that gain has been in the full-time category (+148k). See chart 1.
Was the Reserve Bank of India’s rate cut on June 2nd justified? Next week’s inflation data may shed further light on this. CPI inflation has been falling slightly from 5.4% y/y back in February to about a half point lower in April. The country also releases trade and industrial output figures.
Stronger revised data for business spending is expected to result in a modest upward revision to Japan’s Q1 GDP growth rate on Monday to 2.8% q/q at an annualized rate. Philippines releases export figures for April and South Korea provides a job market update for May.
Europe — Greece Inching Closer To Default?
Europe’s focus will remain the saga of Greek debt negotiations as other forms of market risk will be relatively subdued and concentrated upon limited data risk next week. The issue of Greece is likely to receive considerable attention from the G7 Summit in Germany on Sunday and Monday.
Like only Zambia did in the mid-1980s, Greece has applied to forego debt payments to the IMF that were due over the course of this month until one lump sum payment at the end of the month which coincides with the expiration of its current four-month extension of the
Derek Holt 416.863.7707 [email protected]
THE WEEK AHEAD
Chart 1
7.50
7.75
8.00
8.25
10.75
11.00
11.25
11.50
11.75
12.00
09 10 11 12 13 14 15
Australia's Resilient Job Market
millions
Source: Scotiabank Economics, Australian Bureau of Statistics.
Full Time Employment(RHS)
millions
Total Employment(LHS)
0.0
0.5
1.0
1.5
2.0
2.5
3.0
3.5
06/05 06/12 06/16 06/19 07/13 07/19 07/20
Greece's Debt Payments
€, billlions
Source: Scotiabank Economics, Bloomberg.
Chart 2

Economics
Global Views
June 5, 2015
4
… continued from previous page
bailout agreement. This is a legal move. Clearly if Greece thinks it may default eventually, then why make a series of smaller payments ahead of time. Of its total €320 billion debt, about three-quarters is owed to the other Eurozone governments under the auspices of the EC, as well as the IMF and ECB. Should the bailout arrangement be extended or bridged, July doesn’t get much easier with payments of €465 million due on July 13th and then two payments of €199 million and €104 million due on July 19th (chart 2). Oh, and why not throw onto the list the €3.5 billion ECB bond due on July 20th that, if missed, would cut off ECB funding because of an outright violation of the funding criteria. Piece of cake, right? A magical one-shot solution is unlikely at least judging by the moves coming from both sides so far. This link may offer foretelling images. To that effect I think some of the pressure to appease Greece at any cost that comes from this side of the pond risks being misinformed or outright self-serving in the short-run on European policy matters. The real choice here is contagion risk from allowing a Greek default and potential exit from the Eurozone, versus contagion risk from another larger bail-out unaccompanied by huge Greek concessions that would invigorate the rest of the European left and declare the austerity pain across the Eurozone over recent years to have been in vain. I think some austerity was the right approach, but if you disagree, then we’re still left with whether two wrongs — austerity, and then abandoning austerity and reversing reforms just when they were perhaps bearing fruit — would make a right.
Macro risk may emanate from three broad types of releases. Industrial output in France, Germany, Italy and the UK will provide important updates on the health of Europe’s industrial base. Export figures from Germany and the UK may do likewise. French CPI may result in revisions to the first estimate for Eurozone inflation during May which continues to reflate from the depths of exaggerated deflation worries earlier this year.
Canada — Muted House Price Gains
Canada should likely follow the broad global market tone over the course of the next week with few sources of domestic risk on the calendar. The main but still slight risk could come through two forms of Bank of Canada communications.
BoC Senior Deputy Governor Carolyn Wilkins speaks on a panel at the International Economic Forum of the Americas’ Conference of Montreal at 4:30pmET on Monday (full agenda here). The panel topic is “Fragmentation Risk In Financial Services: A Retreat From Globalization?” A description of the panel’s discussion points does not make it apparent that there will be market risk versus speculating upon what might happen to global financial services over the rest of the 21st Century. On Thursday, the BoC then releases its Financial System Review which can contain specialized topics that occasionally garner direct market interest.
Limited housing data will arrive over the course of the week including housing starts for May on Monday, and two house price measures on Thursday (new homes) and Friday (repeat sales of existing homes). While housing valuations remain high virtually straight across the country, the pace of additional gains remains more subdued than before the crisis (chart 3).
Canada auctions 2 year notes on Wednesday.
Derek Holt 416.863.7707 [email protected]
THE WEEK AHEAD
-10
-5
0
5
10
15
20
05 07 09 11 13 15
Softer Post-Crisis Price Gains
y/y % change
Teranet House Price Index
Source: Scotiabank Economics, Statistics Canada, Teranet & National Bank.
New Housing Price Index
Chart 3
Economics
Global Views
June 5, 2015
5
Another Slow Start For The Global Economy
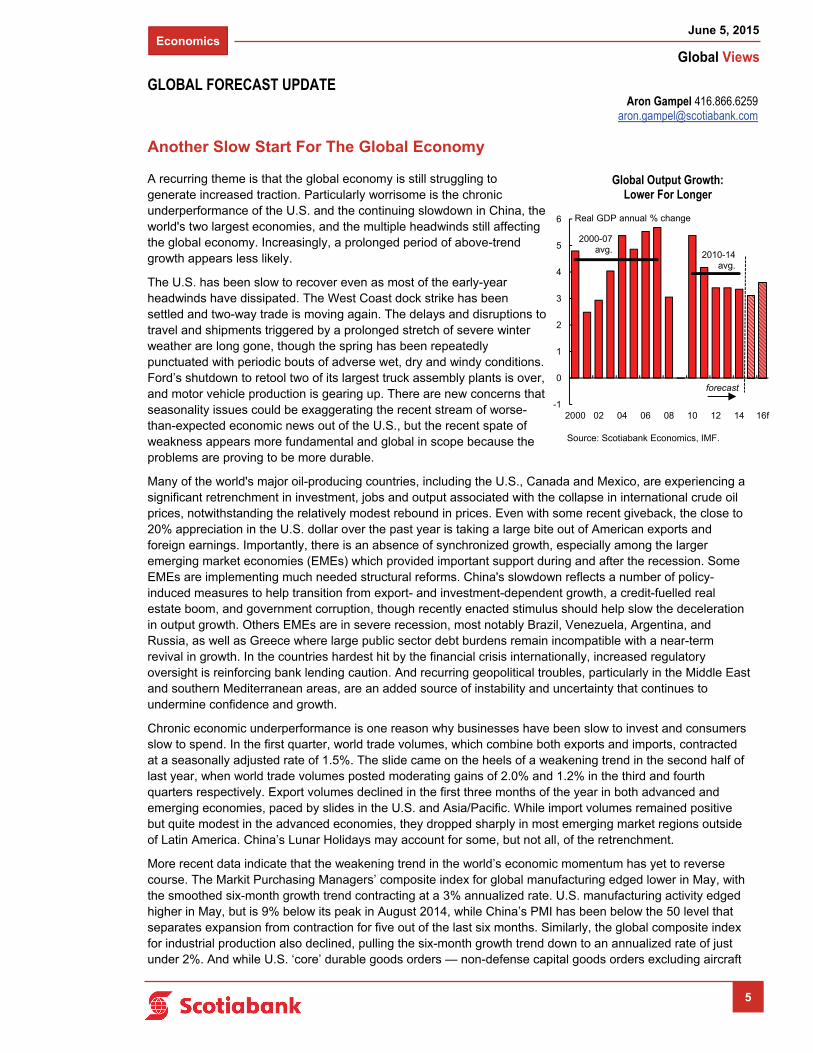
A recurring theme is that the global economy is still struggling to generate increased traction. Particularly worrisome is the chronic underperformance of the U.S. and the continuing slowdown in China, the world's two largest economies, and the multiple headwinds still affecting the global economy. Increasingly, a prolonged period of above-trend growth appears less likely.
The U.S. has been slow to recover even as most of the early-year headwinds have dissipated. The West Coast dock strike has been settled and two-way trade is moving again. The delays and disruptions to travel and shipments triggered by a prolonged stretch of severe winter weather are long gone, though the spring has been repeatedly punctuated with periodic bouts of adverse wet, dry and windy conditions. Ford’s shutdown to retool two of its largest truck assembly plants is over, and motor vehicle production is gearing up. There are new concerns that seasonality issues could be exaggerating the recent stream of worse-than-expected economic news out of the U.S., but the recent spate of weakness appears more fundamental and global in scope because the problems are proving to be more durable.
Many of the world's major oil-producing countries, including the U.S., Canada and Mexico, are experiencing a significant retrenchment in investment, jobs and output associated with the collapse in international crude oil prices, notwithstanding the relatively modest rebound in prices. Even with some recent giveback, the close to 20% appreciation in the U.S. dollar over the past year is taking a large bite out of American exports and foreign earnings. Importantly, there is an absence of synchronized growth, especially among the larger emerging market economies (EMEs) which provided important support during and after the recession. Some EMEs are implementing much needed structural reforms. China's slowdown reflects a number of policy-induced measures to help transition from export- and investment-dependent growth, a credit-fuelled real estate boom, and government corruption, though recently enacted stimulus should help slow the deceleration in output growth. Others EMEs are in severe recession, most notably Brazil, Venezuela, Argentina, and Russia, as well as Greece where large public sector debt burdens remain incompatible with a near-term revival in growth. In the countries hardest hit by the financial crisis internationally, increased regulatory oversight is reinforcing bank lending caution. And recurring geopolitical troubles, particularly in the Middle East and southern Mediterranean areas, are an added source of instability and uncertainty that continues to undermine confidence and growth.
Chronic economic underperformance is one reason why businesses have been slow to invest and consumers slow to spend. In the first quarter, world trade volumes, which combine both exports and imports, contracted at a seasonally adjusted rate of 1.5%. The slide came on the heels of a weakening trend in the second half of last year, when world trade volumes posted moderating gains of 2.0% and 1.2% in the third and fourth quarters respectively. Export volumes declined in the first three months of the year in both advanced and emerging economies, paced by slides in the U.S. and Asia/Pacific. While import volumes remained positive but quite modest in the advanced economies, they dropped sharply in most emerging market regions outside of Latin America. China’s Lunar Holidays may account for some, but not all, of the retrenchment.
More recent data indicate that the weakening trend in the world’s economic momentum has yet to reverse course. The Markit Purchasing Managers’ composite index for global manufacturing edged lower in May, with the smoothed six-month growth trend contracting at a 3% annualized rate. U.S. manufacturing activity edged higher in May, but is 9% below its peak in August 2014, while China’s PMI has been below the 50 level that separates expansion from contraction for five out of the last six months. Similarly, the global composite index for industrial production also declined, pulling the six-month growth trend down to an annualized rate of just under 2%. And while U.S. ‘core’ durable goods orders — non-defense capital goods orders excluding aircraft
Aron Gampel 416.866.6259 [email protected]
GLOBAL FORECAST UPDATE
-1
0
1
2
3
4
5
6
2000 02 04 06 08 10 12 14 16f
Real GDP annual % change
2000-07 avg.
forecast
2010-14 avg.
Global Output Growth: Lower For Longer
Source: Scotiabank Economics, IMF.

Economics
Global Views
June 5, 2015
6
… continued from previous page
— increased modestly in April for the second month in a row, the smoothed six-month growth trend has dropped at an annualized rate of just 5¼%. Canada’s new orders data for manufactured goods are significantly lagged, with the smoothed six-month growth trend slumping to an annualized rate of only 0.7% in March as the downturn in oil-related activity increasingly offset prior gains attributable to reviving U.S. activity. North American rail shipments are still moderating in response to less-than-buoyant industrial activity, and reduced demand for coal and crude oil.
On the plus side, U.S. housing-related activity is showing signs of reviving. New home sales, construction starts and building permits rebounded in April. There is a glimmer of hope that this important sector is rebuilding momentum on the back of a much improved job market, after sharply higher mortgage rates in 2013 short-circuited the sector’s recovery. Auto sales appear poised to move steadily higher against the backdrop of continuing job gains, comparatively low prices at the pump, and historically low borrowing costs. Tourism flows appear to be improving as well, with U.S. and Chinese travel expenditures gradually increasing alongside cheaper fuel prices.
The current mix of economic and financial market conditions should be very supportive of stronger and more sustainable activity throughout the NAFTA region, and internationally as well. The list includes historically low borrowing costs in most countries around the world, increasing monetary stimulus in many advanced and emerging market economies, significant foreign exchange revaluations that should boost the export competitiveness of most countries, sharply lower prices for gasoline, cash-rich corporations, a lengthy period of outsized job gains in the U.S., the increasing wealth generated by rising asset prices (equities, real estate and collectibles, for example), and increased fiscal initiatives and infrastructure expenditures in a number of nations.
That these highly stimulative factors have yet to reinvigorate U.S. and global growth suggests that the underlying problems are more structural than cyclical. There is still too much supply relative to demand internationally. Key commodity markets are a case in point. While crude oil prices have begun to firm on expectations that the sharp decline in U.S. rig counts is leading to reduced output, the potential for sizeable oversupply conditions still endures around the world. Excess capacity persists in most labour markets and many industrial sectors, highlighting the weakness in investment spending. And the continuing rise in private and public sector indebtedness leaves less flexibility for households and governments to finance sharply higher expenditures. The Bank for International Settlements calculates that outstanding debt in the globe’s twelve largest economies has essentially doubled to around US$125 trillion since 2007, with emerging market economies accounting for the largest increase through this period. Even though many Americans have successfully deleveraged their balance sheets, the demographic profile of potential borrowers — students and newly formed households — is collectively constrained by existing high levels of debt, and an underwhelming job market for higher-paying and more permanent positions.
Persistent structural deficiencies increase the odds that potential output gains around the world are likely to be on the ‘softer side’, although pent-up consumer and business demand in some countries and regions still could temporarily provide a stronger boost to activity. Growth should be led by the U.K. and the U.S. in the advanced nations, and India and China among the emerging market countries. In this environment, the U.S. dollar and sterling should strengthen further among the advanced nations, with the continuing improvement in U.S. job conditions and a modest upward bias in wages and prices enabling the Fed to begin raising the funds rate gradually in the second half of the year. While U.S. bond yields are biased higher, the extent of the rise will be limited by the differential economic performances and policy settings among the advanced nations.
Aron Gampel 416.866.6259 [email protected]
GLOBAL FORECAST UPDATE
-4
-2
0
2
4
6
8
10
China U.S. Canada Euro zone
2000-07
2008-09
2010-16f
Real GDP annual % change
Chronic Underperformance
Source: Scotiabank Economics, National Bureau of Statistics of China, BEA, Statistics Canada, Eurostat.

Economics
Global Views
June 5, 2015
7
USD Strength Expected Over The Medium Term
Renewed bullish tone in the US dollar (USD), approaching US monetary policy normalization, increasing caution within the emerging-market asset class, persistent official intervention in currency and securities markets, and directional shifts in commodity prices (particularly in the energy sector) remain critical drivers of capital flows and investor sentiment in global foreign exchange markets.
The global economy shows a divergent growth path, which is being reflected in uneven monetary policy actions. Global rebalancing forces remain present. The United States in the developed world and India in the developing world will likely lead the growth charts in 2015-16, despite signs of activity moderation in the first half of 2015. Sharp economic contraction in top-10 emerging-market economies like Brazil and Russia, coupled with gradual economic deceleration in China, will remain key factors delaying a period of higher and sustained global growth.
The USD strengthened in the latter half of May, driven mainly by renewed confidence in the US growth outlook and the implications for actions taken by a data-dependent (not date-dependent) Federal Reserve (Fed). Our medium term forecast implies broad USD strength, with key policymakers reaffirming their preference for Phase 1 of monetary policy normalization to begin sometime in late 2015. The underlying fundamentals supporting the US consumer (labour market conditions, lower energy costs and ultra-low interest rates) remain in place. The Canadian dollar (CAD) has regained a depreciating bias. CAD weakness will likely continue into year-end, driven by relative central bank policy. However, we do not expect CAD to fall back toward its March lows given the stabilization and modest recovery in oil prices.
The euro (EUR) will remain vulnerable to portfolio investment shifts guided by US-Europe interest rate differentials. The European Central Bank’s forceful commitment to a large-scale asset purchase program (i.e. QE) highlights its ongoing divergence with the Fed. Meanwhile, the Swiss franc (CHF), the Norwegian krone (NOK) and the Swedish krona (SEK) are trading as a European block, vulnerable to shifts in EUR performance. Risks surrounding Greece are elevated amid ongoing liquidity concerns and looming IMF repayment obligations due through the month of June. The British pound (GBP) has fully retraced its post-election rally, its renewed decline driven by a focus on the relative policy outlook with the Bank of England expected to lag the Fed in terms of tightening.
The Japanese yen (JPY) has finally broken out of its recent range, falling to fresh multi-year lows and adopting a clear bearish trend in response to the broader USD move. A positioning rebalancing and renewed focus on the relative policy outlook should instil further weakness into JPY as the Bank of Japan implements its aggressive monetary stimulus program. Renewed JPY weakness may trigger competitive realignments in selected (KRW for instance) floating currencies in Asia. As for the Australian dollar (AUD), the key risk remains centred on a tentatively neutral central bank tone, with risk toward a dovish monetary policy bias amid an ongoing moderation in China’s pace of economic growth.
Sharp exchange rate swings and relatively higher inflation dynamics will shape monetary conditions in the core emerging-market economies. India has positively surprised with renewed focus on structural reforms, prompting favourable financial market conditions. China is also embarked in the process of easing monetary conditions in multiple ways as a means of stimulating economic activity. Guided by active official intervention, the Chinese yuan (CNY) has retained a stable trading range since mid-March.
Latin American policymakers are cautiously awaiting the beginning of the Fed tightening cycle and, more importantly, the impact on the US treasury (UST) yield curve. A sharp economic contraction together with widening twin deficits triggered a phase of currency weakness in the Brazilian real (BRL). Mexico might be vulnerable to sudden repatriation (out)flows once the UST yield curve responds to Fed shifts. Monetary authorities within the financially integrated Latin American economies will not hesitate to intervene in conventional and unconventional ways if the Fed rate hikes leads to disorderly currency adjustments with negative inflationary effects.
FOREIGN EXCHANGE
Economics / Foreign Exchange Strategy
Eric Theoret 416.863.7030 [email protected]
Pablo Bréard 416.862.3876 [email protected]

Economics
Global Views
June 5, 2015
8
Global Auto Sales And Production Gain Momentum
Record North American vehicle assemblies during the summer.
Global car sales increased 2% y/y in April, led by a 6% y/y advance in the developed markets of Western Europe, North America and Japan. Volumes also continued to move higher across most of Asia, led by a 19% y/y surge in car sales in India, which has become the world’s fastest-growing major economy after overtaking China in mid-2014. More recent data for May point to a further acceleration, with volumes in the United States and Canada exceeding an annualized 19 million units — the highest level in nearly a decade. Preliminary data for Japan, Korea and India also point to a solid 5% y/y increase in sales across Asia last month — in line with the year-to-date advance through April.
Vehicle purchases were particularly robust in the United States in May, climbing to an annualized 17.7 million units, up from an average of 16.6 million between January and April. Crossover utility vehicles led the way, surging 17% above a year earlier and garnering a record 29% of the U.S. market, up from less than 26% a year earlier. Large luxury SUVs and pickup trucks also outperformed despite rising gasoline prices and an ongoing shortage of the all-new aluminum Ford F-series — the best-selling vehicle in the United States for more than three decades. Gasoline prices in the United States posted a double-digit increase last month, rising to US$2.80 per gallon, up from an average of US$2.47 in April and a low of US$2.12 in January.
Car and light truck sales were also strong in Canada last month, setting a record for the month of May. Purchases remained above an annualized 1.9 million units for the second consecutive month, well ahead of the full-year 2014 total of 1.85 million. Luxury vehicles led the way, with sales of luxury light trucks surging 24% above a year earlier, helping to lift overall light truck sales 2.5% above the previous year’s high-water mark.
Surging demand has prompted Ford to announce that it will reduce the summer downtime at six North American plants in order to meet strong demand for both its crossovers and pickups. We estimate that these measures combined with rising production by other automakers will likely lift vehicle assemblies across North America by 5% in the third quarter from Q2 levels. In fact, vehicle output in Canada, the United States and Mexico is set to climb above an annualized 19 million units during the summer months, surpassing the previous peak set in the opening months of 2000 during the global tech bubble.
Mexico will lead the way, with assemblies expected to post a double-digit increase in the third quarter, as Volkswagen, Mazda and Nissan ramp up production. In fact, rising North American assemblies by foreign automakers has more than offset the impact of re-tooling at several Detroit Three facilities this year. We estimate that vehicle production in North America by foreign automakers has jumped 7% so far this year, while output by the Detroit Three has slid 1%. However, with re-tooling recently concluded at Chrysler’s Windsor van plant in Canada and at Ford’s U.S. facilities that assemble the best-selling pickup, output by the Detroit Three is scheduled to jump 5% y/y in the third quarter.
Strengthening auto sales across Western Europe also point to additional production gains at European auto assembly plants. Car sales in Western Europe have accelerated this year, advancing 8%y/y through April, up from a 5% advance during all of 2014. The improvement reflects a strengthening labour market and rising credit demand for the first time in several years, and is being supported by ongoing low interest rates. Improving conditions across Western Europe are crucial for the auto industry, as the region accounts for nearly 20% of global volumes and a much higher percentage of overall industry revenue. Furthermore, Western Europe has been the largest drag on auto industry profitability in recent years.
Carlos Gomes 416.866.4735 [email protected]
AUTOS
-15
-10
-5
0
5
10
15
-1.5
-1.0
-0.5
0.0
0.5
1.0
1.5
11 12 13 14 15
y/y % change
Employment Growth
Car Sales
y/y % change
Strengthening Auto Demand In Western Europe
Source: Scotiabank Economics, Eurostat, ACEA.
Economics
Global Views
June 5, 2015
9
June 5th OPEC Meeting — Saudi Arabia Maintains Its Policy Of Allowing Market Forces To Shake Out Higher-Cost Producers
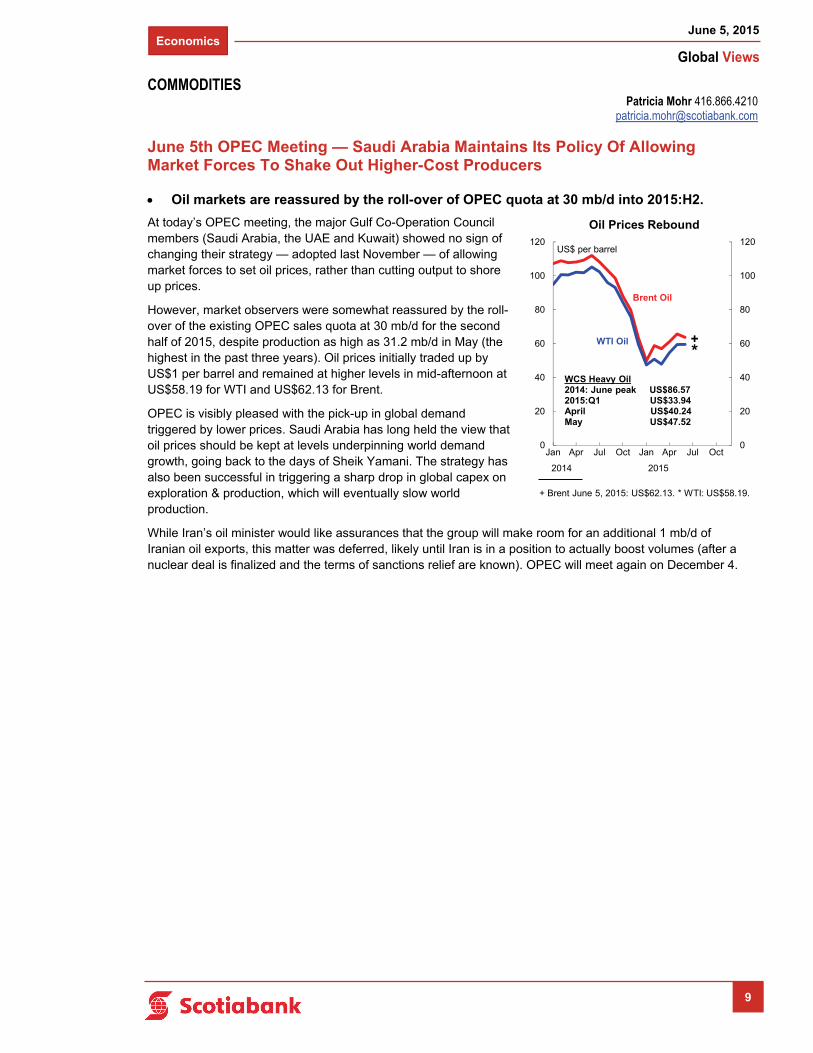
Oil markets are reassured by the roll-over of OPEC quota at 30 mb/d into 2015:H2.
At today’s OPEC meeting, the major Gulf Co-Operation Council members (Saudi Arabia, the UAE and Kuwait) showed no sign of changing their strategy — adopted last November — of allowing market forces to set oil prices, rather than cutting output to shore up prices.
However, market observers were somewhat reassured by the roll-over of the existing OPEC sales quota at 30 mb/d for the second half of 2015, despite production as high as 31.2 mb/d in May (the highest in the past three years). Oil prices initially traded up by US$1 per barrel and remained at higher levels in mid-afternoon at US$58.19 for WTI and US$62.13 for Brent.
OPEC is visibly pleased with the pick-up in global demand triggered by lower prices. Saudi Arabia has long held the view that oil prices should be kept at levels underpinning world demand growth, going back to the days of Sheik Yamani. The strategy has also been successful in triggering a sharp drop in global capex on exploration & production, which will eventually slow world production.
While Iran’s oil minister would like assurances that the group will make room for an additional 1 mb/d of Iranian oil exports, this matter was deferred, likely until Iran is in a position to actually boost volumes (after a nuclear deal is finalized and the terms of sanctions relief are known). OPEC will meet again on December 4.
Patricia Mohr 416.866.4210 [email protected]
COMMODITIES
0
20
40
60
80
100
120
0
20
40
60
80
100
120
Jan Apr Jul Oct Jan Apr Jul Oct
US$ per barrel
Brent Oil
WTI Oil
WCS Heavy Oil2014: June peak US$86.572015:Q1 US$33.94April US$40.24May US$47.52
+*
2014 2015
Oil Prices Rebound
+ Brent June 5, 2015: US$62.13. * WTI: US$58.19.
Economics
Global Views
June 5, 2015
10
Are The US Treasury Shorts Going Too Far Again?
The rise in yields is supported longer term but may be going too far in the short term.
There are at least two broad forces at play in the substantial bond market sell-off of late and they may be going too far.
One is the reflation trade that has been one of our main themes since we rejected the deflation fears at the start of the year and that has worked very well. To that effect, annual growth forecasts like the OECD’s downward revisions are less relevant to markets. What matters is the quarterly incremental pattern and so with global inflation readings carving out bottoms and growth in the Eurozone stepping back from the abyss, markets have reason to be selling German bunds and driving correlated bond market yields higher elsewhere.
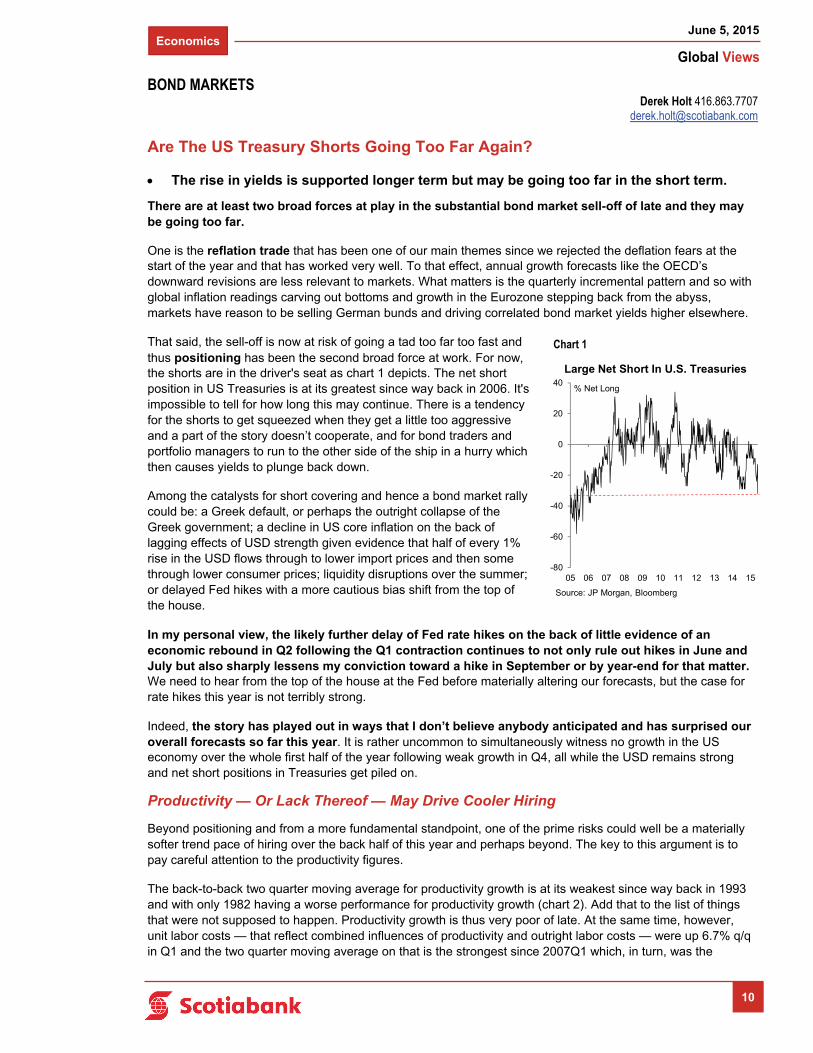
That said, the sell-off is now at risk of going a tad too far too fast and thus positioning has been the second broad force at work. For now, the shorts are in the driver's seat as chart 1 depicts. The net short position in US Treasuries is at its greatest since way back in 2006. It's impossible to tell for how long this may continue. There is a tendency for the shorts to get squeezed when they get a little too aggressive and a part of the story doesn’t cooperate, and for bond traders and portfolio managers to run to the other side of the ship in a hurry which then causes yields to plunge back down.
Among the catalysts for short covering and hence a bond market rally could be: a Greek default, or perhaps the outright collapse of the Greek government; a decline in US core inflation on the back of lagging effects of USD strength given evidence that half of every 1% rise in the USD flows through to lower import prices and then some through lower consumer prices; liquidity disruptions over the summer; or delayed Fed hikes with a more cautious bias shift from the top of the house.
In my personal view, the likely further delay of Fed rate hikes on the back of little evidence of an economic rebound in Q2 following the Q1 contraction continues to not only rule out hikes in June and July but also sharply lessens my conviction toward a hike in September or by year-end for that matter. We need to hear from the top of the house at the Fed before materially altering our forecasts, but the case for rate hikes this year is not terribly strong.
Indeed, the story has played out in ways that I don’t believe anybody anticipated and has surprised our overall forecasts so far this year. It is rather uncommon to simultaneously witness no growth in the US economy over the whole first half of the year following weak growth in Q4, all while the USD remains strong and net short positions in Treasuries get piled on.
Productivity — Or Lack Thereof — May Drive Cooler Hiring
Beyond positioning and from a more fundamental standpoint, one of the prime risks could well be a materially softer trend pace of hiring over the back half of this year and perhaps beyond. The key to this argument is to pay careful attention to the productivity figures.
The back-to-back two quarter moving average for productivity growth is at its weakest since way back in 1993 and with only 1982 having a worse performance for productivity growth (chart 2). Add that to the list of things that were not supposed to happen. Productivity growth is thus very poor of late. At the same time, however, unit labor costs — that reflect combined influences of productivity and outright labor costs — were up 6.7% q/q in Q1 and the two quarter moving average on that is the strongest since 2007Q1 which, in turn, was the
Derek Holt 416.863.7707 [email protected]
BOND MARKETS
Chart 1
-80
-60
-40
-20
0
20
40
05 06 07 08 09 10 11 12 13 14 15
Source: JP Morgan, Bloomberg
Large Net Short In U.S. Treasuries
% Net Long

Economics
Global Views
June 5, 2015
11
… continued from previous page
strongest since 2000 (chart 3). In fact, weak productivity growth is not entirely new, although it has hit a cycle-worst over the past 3 quarters from '14Q4 through '15Q2. The 4 quarter moving average for productivity growth remains toward the lows of multiple decades' worth of experiences which implies a persistence that one might think cannot be ignored by employers indefinitely.
This may not end well for US workers as there are a few possibilities going forward:
Firms may accelerate investment growth in order to raise productivity of the workers they have hired. Some of that is happening but very tentatively via just two months of faster growth in core capital goods orders albeit against a very weak longer run trend. A factor against a continuation of this faster growth might be a top in the profit cycle.
Firms may materially cool the pace of hiring. More employed people producing less with their time is not a good recipe for the US workforce in the context of a potential top in the profit cycle and may suggest that the pace of hiring will cool over the back half of this year at a minimum after potentially being too elevated since last Fall.
or strong hiring unaccompanied by short-term productivity growth may be front-loaded in anticipation of a large surge in economic activity that will suddenly result in a lot of busy workers. That’s doubtful since the acceleration that began last year probably anticipated a steadily expanding US economy. Regardless, front-loaded hiring that is only then accompanied by an anticipated, albeit persistently delayed, rebound would perhaps only justify the hiring done to date and still point toward cooler growth in payrolls.
This performance does not look like it is changing for the better in ’15Q2 as growth is disappointing again. So, where productivity is output per hour worked, still hiring at a decent trend clip with very little top line growth means a third quarter of poor productivity growth. For how much longer will shareholders and employers tolerate this is the question of the day that should be on the minds of the Treasury shorts.
Derek Holt 416.863.7707 [email protected]
BOND MARKETS
Chart 2
Chart 3
-8
-6
-4
-2
0
2
4
6
8
10
12
14
16
80 85 90 95 00 05 10 15
...Is Driving Labour Costs Higher
two-qtr mov avg, q/q % change saar
Source: Scotiabank Economics, BLS.
U.S. Unit Labour Costs
-6
-4
-2
0
2
4
6
8
10
80 85 90 95 00 05 10 15
The Weakest Productivity Growth In Decades...
two-qtr mov avg, q/q % change saar
Source: Scotiabank Economics, BLS.
U.S. Labour Productivity
Economics
Global Views
June 5, 2015
12
Indonesia Faces Challenging Economic Conditions
Inflationary pressures are rising, while economic growth is slowing.
The outlook is further threatened by the decline in commodity prices, rather slow progress on planned infrastructure outlays, and a volatile external environment given Indonesia’s relatively weak fiscal and current account positions.
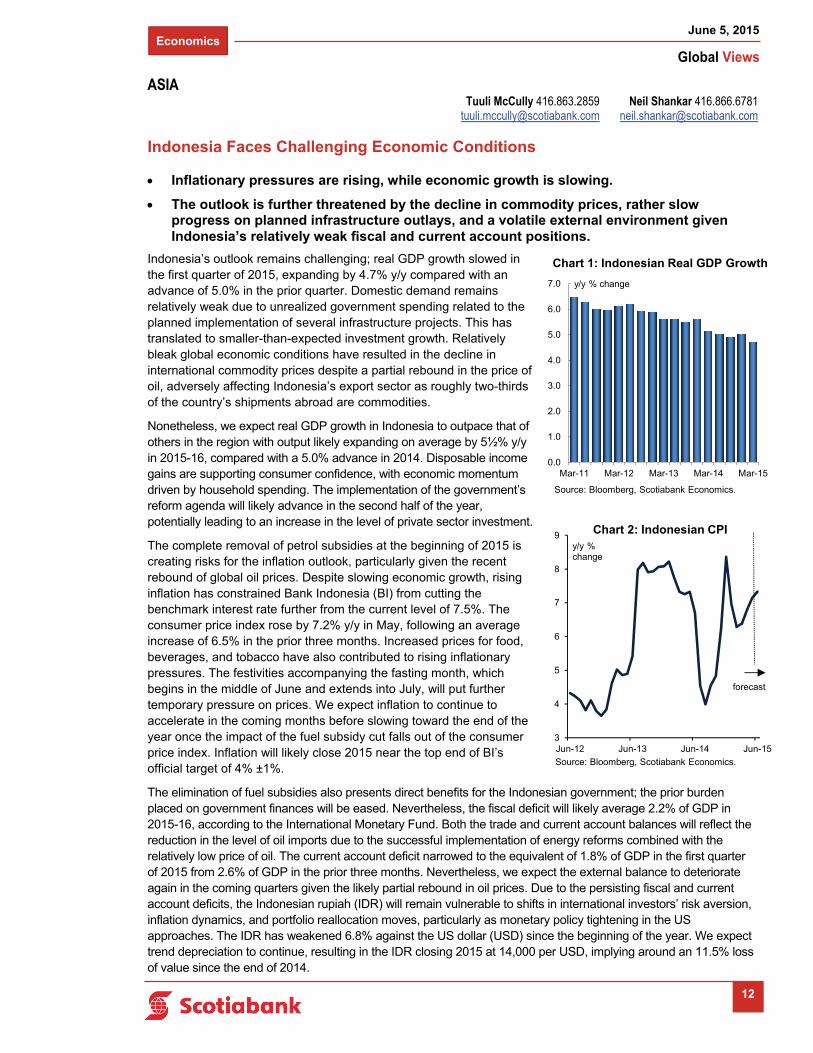
Indonesia’s outlook remains challenging; real GDP growth slowed in the first quarter of 2015, expanding by 4.7% y/y compared with an advance of 5.0% in the prior quarter. Domestic demand remains relatively weak due to unrealized government spending related to the planned implementation of several infrastructure projects. This has translated to smaller-than-expected investment growth. Relatively bleak global economic conditions have resulted in the decline in international commodity prices despite a partial rebound in the price of oil, adversely affecting Indonesia’s export sector as roughly two-thirds of the country’s shipments abroad are commodities.
Nonetheless, we expect real GDP growth in Indonesia to outpace that of others in the region with output likely expanding on average by 5½% y/y in 2015-16, compared with a 5.0% advance in 2014. Disposable income gains are supporting consumer confidence, with economic momentum driven by household spending. The implementation of the government’s reform agenda will likely advance in the second half of the year, potentially leading to an increase in the level of private sector investment.
The complete removal of petrol subsidies at the beginning of 2015 is creating risks for the inflation outlook, particularly given the recent rebound of global oil prices. Despite slowing economic growth, rising inflation has constrained Bank Indonesia (BI) from cutting the benchmark interest rate further from the current level of 7.5%. The consumer price index rose by 7.2% y/y in May, following an average increase of 6.5% in the prior three months. Increased prices for food, beverages, and tobacco have also contributed to rising inflationary pressures. The festivities accompanying the fasting month, which begins in the middle of June and extends into July, will put further temporary pressure on prices. We expect inflation to continue to accelerate in the coming months before slowing toward the end of the year once the impact of the fuel subsidy cut falls out of the consumer price index. Inflation will likely close 2015 near the top end of BI’s official target of 4% ±1%.
The elimination of fuel subsidies also presents direct benefits for the Indonesian government; the prior burden placed on government finances will be eased. Nevertheless, the fiscal deficit will likely average 2.2% of GDP in 2015-16, according to the International Monetary Fund. Both the trade and current account balances will reflect the reduction in the level of oil imports due to the successful implementation of energy reforms combined with the relatively low price of oil. The current account deficit narrowed to the equivalent of 1.8% of GDP in the first quarter of 2015 from 2.6% of GDP in the prior three months. Nevertheless, we expect the external balance to deteriorate again in the coming quarters given the likely partial rebound in oil prices. Due to the persisting fiscal and current account deficits, the Indonesian rupiah (IDR) will remain vulnerable to shifts in international investors’ risk aversion, inflation dynamics, and portfolio reallocation moves, particularly as monetary policy tightening in the US approaches. The IDR has weakened 6.8% against the US dollar (USD) since the beginning of the year. We expect trend depreciation to continue, resulting in the IDR closing 2015 at 14,000 per USD, implying around an 11.5% loss of value since the end of 2014.
ASIA
Neil Shankar 416.866.6781 [email protected]
Tuuli McCully 416.863.2859 [email protected]
3
4
5
6
7
8
9
Jun-12 Jun-13 Jun-14 Jun-15
forecast
Chart 2: Indonesian CPIy/y %change
Source: Bloomberg, Scotiabank Economics.
0.0
1.0
2.0
3.0
4.0
5.0
6.0
7.0
Mar-11 Mar-12 Mar-13 Mar-14 Mar-15
Chart 1: Indonesian Real GDP Growth
y/y % change
Source: Bloomberg, Scotiabank Economics.
Economics
Global Views
June 5, 2015
13
Adding Chinese A-Shares To Major Benchmark Indices
The need-to-know on the inclusion of A-shares in major benchmark indices.
Over the past two weeks, both FTSE Russell and then Vanguard have said they will transition Chinese stocks listed in mainland China (A-shares) into their Emerging Market (EM) indices. As noted in our Global Week Ahead article, MSCI will announce on June 9 whether it will follow suit. Either way, it is quickly becoming clear that A-shares are internationalizing and global investors will need to reconcile the gradual inclusion in benchmark indices.
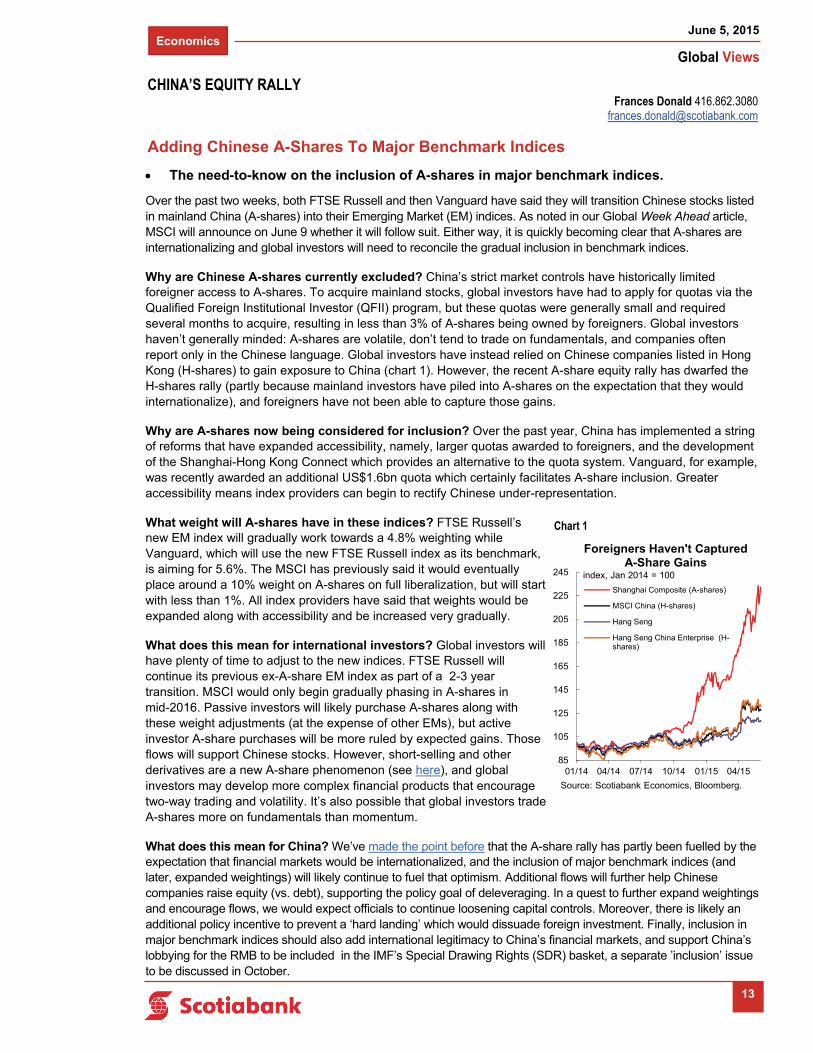
Why are Chinese A-shares currently excluded? China’s strict market controls have historically limited foreigner access to A-shares. To acquire mainland stocks, global investors have had to apply for quotas via the Qualified Foreign Institutional Investor (QFII) program, but these quotas were generally small and required several months to acquire, resulting in less than 3% of A-shares being owned by foreigners. Global investors haven’t generally minded: A-shares are volatile, don’t tend to trade on fundamentals, and companies often report only in the Chinese language. Global investors have instead relied on Chinese companies listed in Hong Kong (H-shares) to gain exposure to China (chart 1). However, the recent A-share equity rally has dwarfed the H-shares rally (partly because mainland investors have piled into A-shares on the expectation that they would internationalize), and foreigners have not been able to capture those gains.
Why are A-shares now being considered for inclusion? Over the past year, China has implemented a string of reforms that have expanded accessibility, namely, larger quotas awarded to foreigners, and the development of the Shanghai-Hong Kong Connect which provides an alternative to the quota system. Vanguard, for example, was recently awarded an additional US$1.6bn quota which certainly facilitates A-share inclusion. Greater accessibility means index providers can begin to rectify Chinese under-representation.
What weight will A-shares have in these indices? FTSE Russell’s new EM index will gradually work towards a 4.8% weighting while Vanguard, which will use the new FTSE Russell index as its benchmark, is aiming for 5.6%. The MSCI has previously said it would eventually place around a 10% weight on A-shares on full liberalization, but will start with less than 1%. All index providers have said that weights would be expanded along with accessibility and be increased very gradually.
What does this mean for international investors? Global investors will have plenty of time to adjust to the new indices. FTSE Russell will continue its previous ex-A-share EM index as part of a 2-3 year transition. MSCI would only begin gradually phasing in A-shares in mid-2016. Passive investors will likely purchase A-shares along with these weight adjustments (at the expense of other EMs), but active investor A-share purchases will be more ruled by expected gains. Those flows will support Chinese stocks. However, short-selling and other derivatives are a new A-share phenomenon (see here), and global investors may develop more complex financial products that encourage two-way trading and volatility. It’s also possible that global investors trade A-shares more on fundamentals than momentum.
What does this mean for China? We’ve made the point before that the A-share rally has partly been fuelled by the expectation that financial markets would be internationalized, and the inclusion of major benchmark indices (and later, expanded weightings) will likely continue to fuel that optimism. Additional flows will further help Chinese companies raise equity (vs. debt), supporting the policy goal of deleveraging. In a quest to further expand weightings and encourage flows, we would expect officials to continue loosening capital controls. Moreover, there is likely an additional policy incentive to prevent a ‘hard landing’ which would dissuade foreign investment. Finally, inclusion in major benchmark indices should also add international legitimacy to China’s financial markets, and support China’s lobbying for the RMB to be included in the IMF’s Special Drawing Rights (SDR) basket, a separate ’inclusion’ issue to be discussed in October.
Frances Donald 416.862.3080 [email protected]
CHINA’S EQUITY RALLY
Chart 1
85
105
125
145
165
185
205
225
245
01/14 04/14 07/14 10/14 01/15 04/15
Shanghai Composite (A-shares)
MSCI China (H-shares)
Hang Seng
Hang Seng China Enterprise (H-shares)
Foreigners Haven't Captured A-Share Gains
index, Jan 2014 = 100
Source: Scotiabank Economics, Bloomberg.

Foreign Exchange Strategy
Global Views
June 5, 2015
14
Latin America Week Ahead: For The Week Of June 8 - 12
Week-ahead highlights:
The same 2 topics are likely to continue to dominate global price action next week, in our view: The Fed’s lift-off, and the Geek-debt saga (tragedy?):
On the Fed front: today’s non farm payrolls data adds one more important piece of the puzzle, but there is still a lot of time before our expected September lift off. An interesting additional entrant into the lift-off debate, was the IMF which yesterday published its Article IV consultation of the US, in which it argued that the Fed should wait until 2016-H2 before starting its hiking cycle.
On the Greek front, we continue to wait for some form of agreement (or lack of) between the Greek government and its creditors. The latest news was that both parties seemed to reject each other’s proposal, but the Greek government is still expected to discuss the creditor proposal with its legislative today. The other news was the bundling of the June payments due to the IMF into one single payment due at month end — this is in essence a delay.
Correlations are broadly in line with each country’s main drivers, except for a couple of random ones (MXN & PEN w/ soy?)
Week-ahead views:
Brazil (BRL): This week’s COPOM meeting delivered the expected +50bps hike and, as many anticipated, left the statement’s text unchanged. The question now is whether that means we should expect another +50bps hike… Brazilian markets were closed yesterday, so we don’t have post-COPOM DI pricing, but our sense is that the amount of bps of hikes priced in by the next meeting will likely rise from the 33bps that were priced by Wednesday’s close. However, we think that a +50bps hike being delivered will depend on the evolution of inflation expectations (which makes next Monday’s survey interesting), as well as actual inflation (see the IPCA print next Wednesday). On the fiscal front, it seems like we are now in waiting mode, as markets and rating agencies will be tracking fiscal results to gauge how far the results will come from the government’s target, and whether the widely expected target misses lead to a loss of investment grade rating. Moody’s has said no move is likely before Q3, but the most relevant is S&P in our view, given it is the agency where a loss of investment grade seems more likely.
Chile (CLP): Next week’s pipeline includes both CPI and the BCCh’s MPC meeting. Given we just got an update of the central bank’s policy views in the Monetary Policy Report, and it was fairly clear in signaling that no near-term policy moves were likely, we think the MPC meeting will be somewhat of a non-event (although there is always room for some surprise, we don’t expect any). The inflation data will be much more relevant, in our view. The central bank has repeatedly flagged persistently high inflation as the main reason that is forcing the hawkish bias to remain in place (although it has also said that current settings are quite loose, which we agree with: we estimate that real rates are about 200bps on the ”loose side”). The most interesting part of the release, in our view, will be whether there are signs of FX-inflation pass-through in the tradable sectors (the BCCh said that the persistent nature of CLP weakness could lead to higher pass-through), or whether higher
Eduardo Suárez 416.945.4538 [email protected]
90‐day correlations of LATAM FX (d/d % chgs)
USD/ US10s‐2s Oil Copper S&P500
Oil / Copper
ratio Soy Gold
Baltic Dry
Index DXY index
BRL 7.2% ‐29.3% ‐11.3% ‐24.0% ‐23.5% ‐32.5% ‐25.6% 4.3% 41.4%
CLP 4.2% ‐32.9% ‐44.3% ‐21.5% ‐11.6% ‐27.4% ‐38.7% ‐0.7% 49.4%
COP ‐2.6% ‐50.0% ‐38.1% ‐29.0% ‐31.5% ‐30.9% ‐34.8% 7.5% 49.7%
MXN 9.1% ‐34.0% ‐21.1% ‐40.5% ‐23.7% ‐45.1% ‐30.7% 6.7% 60.7%
PEN 1.3% ‐22.4% ‐21.6% ‐12.7% ‐11.9% ‐27.3% ‐16.7% ‐0.8% 44.3%
Source: Bloomberg, ScotiaFX Strategy.

Foreign Exchange Strategy
Global Views
June 5, 2015
15
… continued from previous page
inflation is starting to affect “indexed sectors” (i.e., housing — wages later in the month will be interesting to look at too).
Colombia (COP): Next week’s focus will be on growth. The first part of the equation will be the release of Q1 GDP data, where we expect a slowdown, although still a relatively modest one, as credit seems to be propping up some sectors of the economy. The consensus call for Colombia’s Q1 growth print is a slowdown from the 3.5% y/y in 14Q4, to +2.7% y/y in 15Q1. We don’t believe the Colombian economy will have bottomed in Q1 yet. The other interesting release that is scheduled for next week, is the civil works payments data. In 2014-Q4, the indicator seemed to slow from 5 consecutive quarters of double-digit growth, to a +4.9% y/y print. Like in much of LATAM, the government hopes that infrastructure will serve as an offset to the commodity-price-driven slowdown in the economy which, in Colombia’s case, takes the form of the 4G road projects. It will be interesting to see if civil works are starting to pick up. With the economy still in slowdown mode, COP is particularly vulnerable to oil price swings.
On the political front, Colombia lawmakers have repealed the 2004 reform that allowed Presidents to hold office for more than one term.
Mexico (MXN): As very-very widely expected, Banxico left the policy rate unchanged in yesterday’s policy decision. Banxico’s assessment of the external economic environment remained unchanged (and still rather gloomy…in line with the consensus view). Despite relatively high levels of global financial market volatility, Banxico highlighted that Mexican assets have proven relatively resilient, and have remained range-bound in their price moves. On the domestic front, Banxico noted a deceleration in many of the components of industrial production, but an improvement in domestic demand. The balance of risks to both domestic growth and inflation remained unchanged. We maintain our call: barring a Fed move, Banxico is happy leaving rates unchanged for a long time, but if the Fed hikes, we think that it would very likely be followed by Banxico, in order to keep relative monetary conditions constant.
Yesterday’s release of Mexican private consumption data had some interesting signals to further understand what is going on with the Mexican economy. The data showed a robust, if unspectacular, +3.9% y/y expansion, but the component behaviour had some potentially interesting messages:
Domestic goods consumption expanded at a robust +5.3% y/y, which seemed consistent with the trend we are seeing in retail sales.
Domestic service consumption was much weaker, at +1.6% y/y, which seems consistent with the weakening trend we have been seeing in the services sector PMIs — we think this is a trend worth watching.
The other interesting component was imported goods consumption, which was strong (+7.4 y/y).
The most headline-producing development related to Mexico over the next week (and maybe more) is likely to be this Sunday’s mid-term elections. Although most recent surveys suggest either little change in the balance of political forces, or even a strengthening of the PRI and its allies’ position in Congress, we think the risks are related to disturbances in already unstable states such as Guerrero, Michoacán and Oaxaca. From a market standpoint, this type of geo-political problem has had little impact (especially a lasting one) across the globe, but we believe that if the Presidency continues to weaken, there are risks of some backsliding on the reform process, as well as potential disruptions to the implementation stage. The other risk of a weakened government is that it could lead to even more delays to the development of infrastructure plans, which down the line can lead to bottlenecks that could affect the booming manufacturing sector.
Finally, the IMF published an interesting paper on the relationship between crime and economic variables in Mexico (“Crime and the Economy in Mexican States: Heterogeneous Panel Estimates (1993-2012)” C.
Eduardo Suárez 416.945.4538 [email protected]
Foreign Exchange Strategy
Global Views
June 5, 2015
16
… continued from previous page
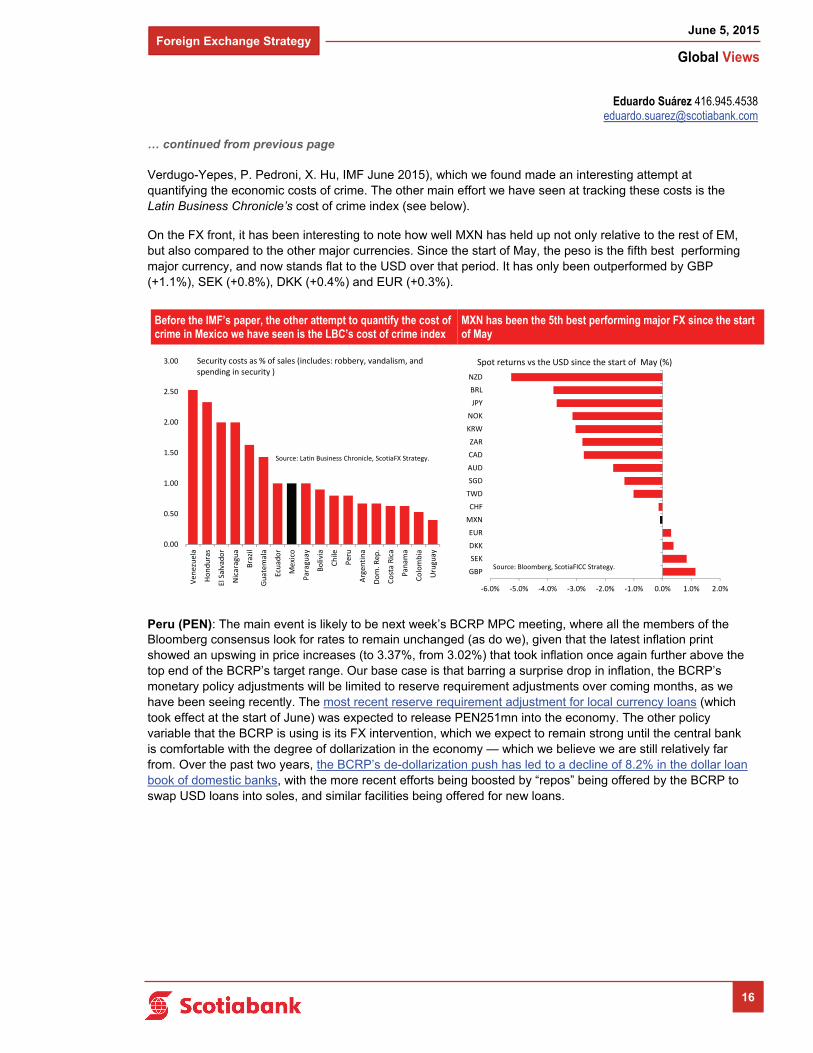
Verdugo-Yepes, P. Pedroni, X. Hu, IMF June 2015), which we found made an interesting attempt at quantifying the economic costs of crime. The other main effort we have seen at tracking these costs is the Latin Business Chronicle’s cost of crime index (see below).
On the FX front, it has been interesting to note how well MXN has held up not only relative to the rest of EM, but also compared to the other major currencies. Since the start of May, the peso is the fifth best performing major currency, and now stands flat to the USD over that period. It has only been outperformed by GBP (+1.1%), SEK (+0.8%), DKK (+0.4%) and EUR (+0.3%).
Peru (PEN): The main event is likely to be next week’s BCRP MPC meeting, where all the members of the Bloomberg consensus look for rates to remain unchanged (as do we), given that the latest inflation print showed an upswing in price increases (to 3.37%, from 3.02%) that took inflation once again further above the top end of the BCRP’s target range. Our base case is that barring a surprise drop in inflation, the BCRP’s monetary policy adjustments will be limited to reserve requirement adjustments over coming months, as we have been seeing recently. The most recent reserve requirement adjustment for local currency loans (which took effect at the start of June) was expected to release PEN251mn into the economy. The other policy variable that the BCRP is using is its FX intervention, which we expect to remain strong until the central bank is comfortable with the degree of dollarization in the economy — which we believe we are still relatively far from. Over the past two years, the BCRP’s de-dollarization push has led to a decline of 8.2% in the dollar loan book of domestic banks, with the more recent efforts being boosted by “repos” being offered by the BCRP to swap USD loans into soles, and similar facilities being offered for new loans.
Eduardo Suárez 416.945.4538 [email protected]
Before the IMF’s paper, the other attempt to quantify the cost of crime in Mexico we have seen is the LBC’s cost of crime index
MXN has been the 5th best performing major FX since the start of May
0.00
0.50
1.00
1.50
2.00
2.50
3.00
Venezuela
Honduras
El Salvador
Nicaragua
Brazil
Guatemala
Ecuador
Mexico
Paraguay
Bolivia
Chile
Peru
Argen
tina
Dom. R
ep.
Costa Rica
Panam
a
Colombia
Uruguay
Security costs as % of sales (includes: robbery, vandalism, and spending in security )
Source: Latin Business Chronicle, ScotiaFX Strategy.
‐6.0% ‐5.0% ‐4.0% ‐3.0% ‐2.0% ‐1.0% 0.0% 1.0% 2.0%
GBP
SEK
DKK
EUR
MXN
CHF
TWD
SGD
AUD
CAD
ZAR
KRW
NOK
JPY
BRL
NZD
Spot returns vs the USD since the start of May (%)
Source: Bloomberg, ScotiaFICC Strategy.

Economics
Global Views
June 5, 2015
17
Key Data Preview
CANADA
Housing starts numbers for May land on June 8, and we’re anticipating a 180k annualized monthly print in line with recent outcomes. Building permits data were fairly soft in late 2014 and early 2015, but picked up considerably in March (see chart). The takeaway from our perspective is that, even as builders are somewhat cautious, they are moving ahead with construction plans in Central Canada, even if construction in the West is likely to be soft (particularly in Alberta, where the oil price shock continues to weigh on the housing sector).
UNITED STATES
We’re anticipating a strong retail sales number of 1.1% m/m for the month of May when the number lands on June 11. Our call is predicated on a surge in vehicle sales in May on the order of 17.7m annualized vs. 16.5m annualized in April (i.e., +1.2m annualized in one month — see chart) as reported by Wards in data released in early June. Gasoline prices were also up on the month, and strongly at that, with average monthly prices rising by 10% according to Bloomberg. With vehicle sales making up 20.6% of retail sales and sales at gasoline stations making up 8.25% of total sales, there is plenty of room for retail sales to swing quite a bit on an increase in those two categories alone, although we would caution that not all sales at vehicle dealers are of new cars, and gasoline stations sell a great deal more than just gasoline. Moreover, while we know that more vehicles were sold, we’re not sure at what price. Similarly, while we know gasoline prices were up, we don’t know how much gasoline was sold. We’re much less enthusiastic about sales ex-autos, where we expect a decent but not fantastic +0.3% m/m print as consumers have been cautious this year, and consumer confidence numbers have been nothing to write home about.
Producer Price Index data should show a solid pick-up in producer prices in May as energy prices increased including the aforementioned increase of 10% in gasoline prices (see chart to the right) and a similar 10% increase in the average WTI spot price. Commodity foodstuffs were higher in price by a solid 5.6%. Both of these should pass through to a variety of input prices including those in the transportation/warehousing segment as well as some of the general trade prices. The net leaves us looking for a +0.5% m/m increase in headline PPI which should leave annual PPI near -0.9% y/y.
Dov Zigler 212.225.6631 [email protected]
Derek Holt 416.863.7707 [email protected]
Frances Donald 416.862.3080 [email protected]
A1
100
150
200
250
300
350
Jan-10 Jan-15
Permits
Starts
CDN Housing Starts:Plenty of Building Permits Issued
000s, SAAR
Source: Scotiabank Economics, Statistics Canada
1.5
2
2.5
3
3.5
4
4.5
8
10
12
14
16
18
20
22
Dec-01 Dec-06 Dec-11
Auto Sales
Inventories(RHS)
Vehicle Sales Surge ContinuesU.S. Vehicle Sales & Inventories
Millions
Source: Scotiabank Economics, Bloomberg
Millions
2
2.2
2.4
2.6
2.8
3
3.2
3.4
3.6
3.8
4
Jan-2014 Jul-2014 Jan-2015
Regular GasolinePrice, Monthly Avg.
USD/Gallon
Source: Bloomberg, Scotiabank Economics
U.S. Gasoline PricesBig Drop, Finally Rebounding?

Economics
Global Views
June 5, 2015
18
… continued from previous page
EUROPE
The major European economies — France, Germany, the UK and Italy — will release industrial production figures next week. After a sound Q1 GDP report, April’s data will provide insight into the strength of Q2 with positive expectations for production gains after the March slump. France’s INSEE publishes its production data on Wednesday. We expect that the -0.3% m/m drop in March, mainly due to lower energy sector output, will be erased by an estimated April gain of +0.7% m/m in view of improving business sentiment in all the major surveys (PMIs, INSEE). On Monday, we estimate Germany’s IP print to come in at around +1.0% m/m, cancelling out the -0.5% m/m drop seen in March. Solid April manufacturing orders data and the jump in Ifo’s current conditions survey over the past two months point in this direction. Also, with Q1 GDP’s report showing a negative contribution from inventories, we expect that some restocking will support industrial production this quarter.
LATIN AMERICA
Both Chile and Brazil will release May inflation prints on June 8th and 10th, respectively. In Chile, we expect price increases to have averaged 4.0% y/y in May, down from 4.1% in April and from a recent high of 5.7% in October of last year. If Chile’s inflation print does indeed come in at 4.0%, it will be the first reading in thirteen months to re-enter the central bank’s 2-4% target range. Recovering copper prices have provided relief to the Chilean peso, reducing imported price pressures. In Brazil, May inflation is estimated to come in around 8.3% y/y, continuing its upward trajectory despite the central bank’s recent decision to raise the benchmark borrowing rate by 50 basis points to 13.75%, higher than all Brazil’s G20 peers.
ASIA
India will release May inflation data on June 12th. We estimate that consumer price inflation remained relatively stable, hovering at 4.8% y/y compared with 4.9% a month earlier. Price pressures will likely begin intensifying by September, if not earlier, given the base effect from low international oil prices and gradually recuperating domestic demand. Furthermore, the most significant risk to the outlook is the approaching southwest monsoon season (June-September) and its impact on food prices; food makes up a substantial portion of the typical consumption basket in India and consequently accounts for 46% of the price index. The coming rainfall is expected to be below normal due to the El Niño weather phenomenon. Indeed, following the Reserve Bank of India’s monetary policy meeting on June 2nd, Governor Raghuram Rajan identified three key risks to the inflation outlook: 1) potentially below-normal southwest monsoon, 2) crude oil price developments and geopolitical risks, and 3) volatility in the external environment. We expect inflation to pick up to 6% y/y by the end of the year.
A2
Frédéric Prêtet 00 33.17037.7705 [email protected]
Tuuli McCully 416.863.2859 [email protected]
Rory Johnston 416.862.3908 [email protected]
0
1
2
3
4
5
6
7
8
9
May-11 May-12 May-13 May-14 May-15
forecast
Brazilian and Chilean CPI
y/y %change
Source: Bloomberg, Scotiabank Economics.
Chile
Brazil
0
2
4
6
8
10
Jan-14 Jul-14 Jan-15 Jul-15
India - Consumer Price Inflation
Source: Bloomberg, Scotiabank Economics.
y/y % change
forecast
-3
-2
-1
0
1
2
French and German Industrial Production
m/m %change
France
Source: Scotiabank Economics, INSEE, Deutsche Bundesbank.
Germany forecast

Economics
Global Views
June 5, 2015
1
Key Indicators for the week of June 8 – 12
Forecasts at time of publication. Source: Bloomberg, Scotiabank Economics.
North America
Europe
A3
Country Date Time Indicator Period BNS Consensus LatestCA 06/08 08:15 Housing Starts (000s a.r.) May 180.0 187.0 183.1CA 06/08 08:30 Building Permits (m/m) Apr -- -- 11.6
MX 06/09 09:00 Bi-Weekly Core CPI (% change) May 31 -- 0.1 0.0MX 06/09 09:00 Bi-Weekly CPI (% change) May 31 -- 0.1 -0.5MX 06/09 09:00 Consumer Prices (m/m) May -- -0.5 -0.3MX 06/09 09:00 Consumer Prices (y/y) May -- 2.9 3.1MX 06/09 09:00 Consumer Prices Core (m/m) May -- 0.1 0.2US 06/09 10:00 JOLTS Job Openings (000s) Apr -- -- 4994US 06/09 10:00 Wholesale Inventories (m/m) Apr 0.3 0.2 0.1
US 06/10 07:00 MBA Mortgage Applications (w/w) JUN 5 -- -- -7.6US 06/10 14:00 Treasury Budget (US$ bn) May -- -97.5 156.7
CA 06/11 08:30 Capacity Utilization (%) 1Q -- -- 83.6CA 06/11 08:30 New Housing Price Index (m/m) Apr -- -- 0.0US 06/11 08:30 Export Prices (m/m) May -- 1.0 -0.3US 06/11 08:30 Import Prices (m/m) May -- 1.0 -0.3US 06/11 08:30 Initial Jobless Claims (000s) JUN 6 -- 277 276US 06/11 08:30 Continuing Claims (000s) MAY 30 -- -- 2196US 06/11 08:30 Retail Sales (m/m) May 1.1 1.1 0.0US 06/11 08:30 Retail Sales ex. Autos (m/m) May 0.3 0.7 0.1MX 06/11 09:00 Industrial Production (m/m) Apr -- -0.9 0.0MX 06/11 09:00 Industrial Production (y/y) Apr -- 1.0 1.7US 06/11 10:00 Business Inventories (m/m) Apr -- 0.2 0.1
CA 06/12 08:30 Teranet - National Bank HPI (y/y) May -- -- 4.4US 06/12 08:30 PPI (m/m) May 0.5 0.4 -0.4US 06/12 08:30 PPI ex. Food & Energy (m/m) May 0.2 0.1 -0.2US 06/12 10:00 U. of Michigan Consumer Sentiment Jun P 91.0 91.2 90.7
Country Date Time Indicator Period BNS Consensus LatestGE 06/08 02:00 Current Account (€ bn) Apr -- 20.5 27.9GE 06/08 02:00 Industrial Production (m/m) Apr 1.0 0.6 -0.5GE 06/08 02:00 Trade Balance (€ bn) Apr -- 19.4 23.0
FR 06/09 02:45 Central Government Balance (€ bn) Apr -- -- -26.3UK 06/09 04:30 Visible Trade Balance (£ mn) Apr -- -9950 -10122
FR 06/10 02:45 Current Account (€ bn) Apr -- -- -1.5FR 06/10 02:45 Industrial Production (m/m) Apr 0.7 0.4 -0.3FR 06/10 02:45 Industrial Production (y/y) Apr 1.3 1.0 1.3FR 06/10 02:45 Manufacturing Production (m/m) Apr 0.3 0.3 0.3TU 06/10 03:00 Real GDP (y/y) 1Q -- 1.70 2.58IT 06/10 04:00 Industrial Production (m/m) Apr -- 0.2 0.4UK 06/10 04:30 Industrial Production (m/m) Apr -- 0.1 0.5UK 06/10 04:30 Manufacturing Production (m/m) Apr -- 0.1 0.4
FR 06/11 01:30 Non-Farm Payrolls (q/q) 1Q F -- -- -0.1FR 06/11 02:45 CPI (m/m) May 0.3 0.2 0.1FR 06/11 02:45 CPI (y/y) May 0.3 0.3 0.1FR 06/11 02:45 CPI - EU Harmonized (m/m) May 0.3 0.2 0.1FR 06/11 02:45 CPI - EU Harmonized (y/y) May 0.3 0.3 0.1

Economics
Global Views
June 5, 2015
2
Key Indicators for the week of June 8 – 12
Forecasts at time of publication. Source: Bloomberg, Scotiabank Economics.
A4
Europe (continued from previous page)
Asia Pacific
Country Date Time Indicator Period BNS Consensus LatestSP 06/12 03:00 CPI (m/m) May F -- 0.5 0.5SP 06/12 03:00 CPI (y/y) May F -- -0.2 -0.2SP 06/12 03:00 CPI - EU Harmonized (m/m) May F 0.4 0.4 0.4SP 06/12 03:00 CPI - EU Harmonized (y/y) May F -0.3 -0.3 -0.3EC 06/12 05:00 Industrial Production (m/m) Apr -- 0.4 -0.3EC 06/12 05:00 Industrial Production (y/y) Apr -- 1.1 1.8
Country Date Time Indicator Period BNS Consensus LatestJN 06/07 19:50 Bank Lending (y/y) May -- -- 2.6JN 06/07 19:50 Current Account (¥ bn) Apr -- 1687.3 2795.3JN 06/07 19:50 GDP (q/q) 1Q F 0.6 0.7 0.6JN 06/07 19:50 GDP Deflator (y/y) 1Q F 3.4 3.4 3.4JN 06/07 19:50 Trade Balance - BOP Basis (¥ bn) Apr -- 153.0 671.4CH JUN 07-08 Exports (y/y) May -- -4.4 -6.4CH JUN 07-08 Imports (y/y) May -- -10.0 -16.2CH JUN 07-08 Trade Balance (USD bn) May -- 44.8 34.1
JN 06/08 01:00 Eco Watchers Survey (current) May -- 54.0 53.6JN 06/08 01:00 Eco Watchers Survey (outlook) May -- 54.0 54.2TA 06/08 04:00 Exports (y/y) May -- -9.5 -11.7TA 06/08 04:00 Imports (y/y) May -- -10.9 -22.1TA 06/08 04:00 Trade Balance (US$ bn) May -- 4.9 4.8NZ 06/08 18:45 Manufacturing Activity 1Q -- -- -0.7JN 06/08 19:50 Japan Money Stock M2 (y/y) May -- 3.6 3.6JN 06/08 19:50 Japan Money Stock M3 (y/y) May -- 3.0 3.0NZ 06/08 20:00 QV House Prices (y/y) May -- -- 8.3PH 06/08 21:00 Unemployment Rate (%) Apr 6.6 -- 6.6AU 06/08 21:30 Home Loans (%) Apr -- -2.0 1.6AU 06/08 21:30 Investment Lending (% change) Apr -- -- 6.4CH 06/08 21:30 CPI (y/y) May 1.2 1.3 1.5CH 06/08 21:30 PPI (y/y) May -- -4.5 -4.6
JN 06/09 01:00 Consumer Confidence May -- 41.9 41.5JN 06/09 02:00 Machine Tool Orders (y/y) May P -- -- 10.5SK 06/09 19:00 Unemployment Rate (%) May 3.7 3.7 3.7JN 06/09 19:50 Machine Orders (m/m) Apr -- -1.8 2.9PH 06/09 21:00 Exports (y/y) Apr -- 10.9 2.1NZ JUN 09-16 REINZ House Price Index (y/y) May -- -- 9.3CH JUN 09-15 Aggregate Financing (CNY bn) May -- 1125.0 1050.4CH JUN 09-15 New Yuan Loans (bn) May -- 860.0 707.9IN JUN 09-15 Exports (y/y) May -- -- -14.0IN JUN 09-15 Imports (y/y) May -- -- -7.5
TH 06/10 03:30 BoT Repo Rate (%) Jun 10 1.50 1.50 1.50NZ 06/10 17:00 RBNZ Official Cash Rate (%) Jun 11 3.25 3.50 3.50AU 06/10 21:30 Employment (000s) May -- 15.0 -2.9AU 06/10 21:30 Unemployment Rate (%) May 6.2 6.2 6.2SK JUN 10-11 BoK Base Rate (%) Jun 11 1.75 1.50 1.75

Economics
Global Views
June 5, 2015
3
Key Indicators for the week of June 8 – 12
Forecasts at time of publication. Source: Bloomberg, Scotiabank Economics.
A5
Latin America
Asia Pacific (continued from previous page)
Country Date Time Indicator Period BNS Consensus LatestMA 06/11 00:00 Industrial Production (y/y) Apr -- 4.8 6.9CH 06/11 01:30 Fixed Asset Investment YTD (y/y) May -- 11.9 12.0CH 06/11 01:30 Industrial Production (y/y) May -- 6.0 5.9CH 06/11 01:30 Retail Sales (y/y) May -- 10.1 10.0NZ 06/11 18:30 Business NZ PMI May -- -- 51.8
JN 06/12 00:30 Capacity Utilization (m/m) Apr -- -- -1.2JN 06/12 00:30 Tertiary Industry Index (m/m) Apr -- 0.4 -1.0JN 06/12 00:30 Industrial Production (y/y) Apr F -- -- -0.1HK 06/12 04:30 Industrial Production (y/y) 1Q -- -- -3.7IN 06/12 08:00 CPI (y/y) May 4.8 -- 4.87IN 06/12 08:00 Industrial Production (y/y) Apr -- -- 2.10
Country Date Time Indicator Period BNS Consensus LatestCL 06/08 07:00 CPI (y/y) May 4.0 4.0 4.1
PE 06/09 Trade Balance (USD mn) Apr -- -- -573.0
BZ 06/10 08:00 IBGE Inflation IPCA (y/y) May 8.3 8.3 8.2
CL 06/11 17:00 Nominal Overnight Rate Target (%) Jun 11 3.00 3.00 3.00PE 06/11 19:00 Reference Rate (%) Jun 11 3.25 3.25 3.25
CO 06/12 12:00 GDP (y/y) 1Q -- 2.7 3.5

Economics
Global Views
June 5, 2015
4
Global Auctions for the week of June 8 – 12
North America
Europe
Source: Bloomberg, Scotiabank Economics.
A6
Country Date Time EventUS 06/08 11:30 U.S. to Sell USD24 Bln 3-Month BillsUS 06/08 11:30 U.S. to Sell USD24 Bln 6-Month Bills
US 06/09 11:30 U.S. to Sell 4-Week BillsUS 06/09 13:00 U.S. to Sell USD24 Bln 3-Year Notes
CA 06/10 12:00 Canada to Sell 2-Year BondsUS 06/10 13:00 U.S. to Sell USD21 Bln 10-Year Notes Reopening
US 06/11 13:00 U.S. to Sell USD13 Bln 30-Year Bonds Reopening
Country Date Time EventGE 06/08 05:30 Germany to Sell EUR2 Bln 182-Day Bills FR 06/08 08:50 France to Sell Up to EUR3.8 Bln 91-Day BillsFR 06/08 08:50 France to Sell Up to EUR1.4 Bln 140-Day BillsFR 06/08 08:50 France to Sell Up to EUR1.6 Bln 350-Day Bills
NE 06/09 04:00 Netherlands to Sell Up to EUR3.5 Bln 0% 2018 BondsCC 06/09 05:00 Cyprus to Sell 26-Week BillsMB 06/09 05:00 Malta to Sell BillsEC 06/09 05:10 ECB Main Refinancing Operation ResultSZ 06/09 05:15 Switzerland to Sell 91-Day Bills AS 06/09 05:15 Austria to Sell 1.65% 2024 Bonds AS 06/09 05:15 Austria to Sell 0.25% 2019 Bonds UK 06/09 05:30 U.K. to Sell GBP900 Mln 0.125% I/L 2024 Bonds
IT 06/10 05:00 Italy to Sell BillsGR 06/10 05:00 Greece to Sell EUR1.25 Bln 182-Day BillsGR 06/10 05:00 Greece to Sell EUR1 Bln 91-Day BillsSW 06/10 05:03 Sweden to Sell SEK7.5 Bln 96-Day BillsSW 06/10 05:03 Sweden to Sell SEK15 Bln 187-Day BillsNO 06/10 05:05 Norway to Sell BondsSZ 06/10 05:15 Switzerland to Sell BondsGE 06/10 05:30 Germany to Sell EUR5 Bln 0% 2017 Bonds
SP 06/11 04:30 Spain to Sell 0.25% 2018 BondsSP 06/11 04:30 Spain to Sell 1.15% 2020 BondsSP 06/11 04:30 Spain to Sell 5.4% 2023 BondsIT 06/11 05:00 Italy to Sell Bonds
SW 06/11 05:03 Sweden to Sell I/L BondsUK 06/11 05:30 U.K. to Sell GBP2 Bln 3.5% 2045 BondsIR 06/11 05:30 Ireland to Sell BondsIC 06/11 06:00 Iceland to Sell Bills
CC 06/12 05:00 Cyprus to Sell 30-Day BillsMB 06/12 05:00 Malta to Sell 2020 BondsMB 06/12 05:00 Malta to Sell 2029 BondsUK 06/12 06:00 U.K. to Sell GBP2 Bln 28-Day BillsUK 06/12 06:00 U.K. to Sell GBP1.5 Bln 91-Day BillsUK 06/12 06:00 U.K. to Sell GBP2 Bln 182-Day Bills
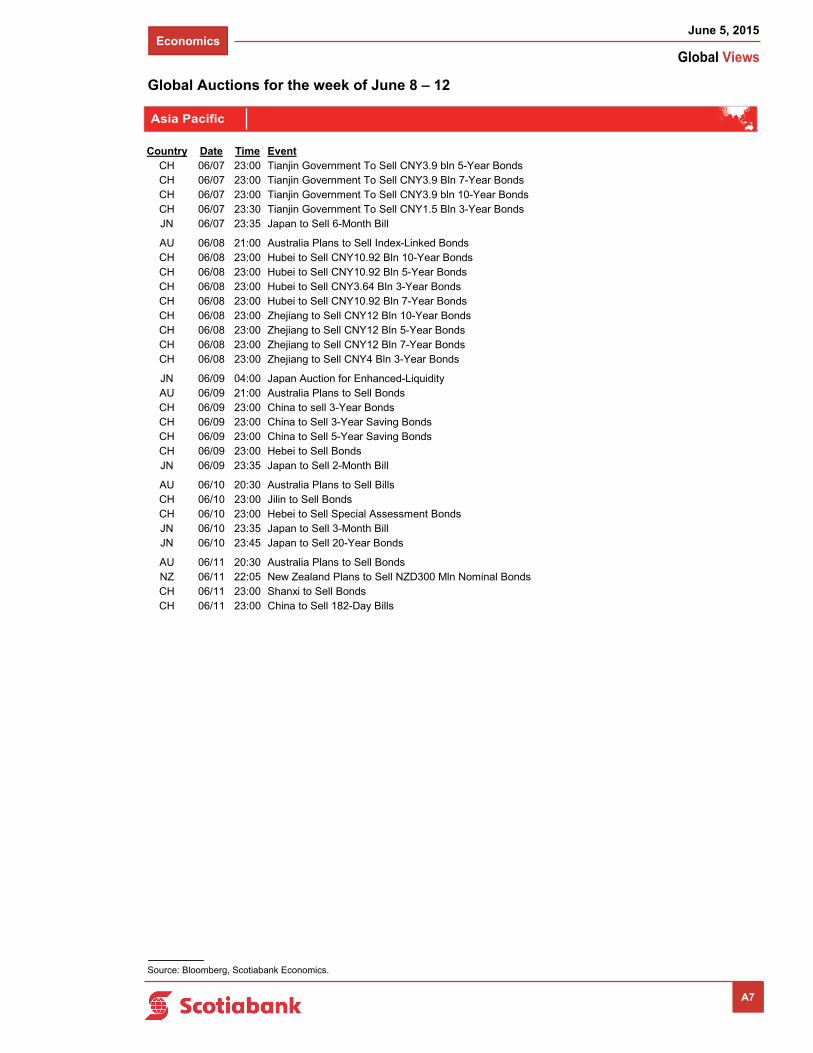
Economics
Global Views
June 5, 2015
5
Global Auctions for the week of June 8 – 12
Source: Bloomberg, Scotiabank Economics.
A7
Asia Pacific
Country Date Time EventCH 06/07 23:00 Tianjin Government To Sell CNY3.9 bln 5-Year BondsCH 06/07 23:00 Tianjin Government To Sell CNY3.9 Bln 7-Year BondsCH 06/07 23:00 Tianjin Government To Sell CNY3.9 bln 10-Year Bonds CH 06/07 23:30 Tianjin Government To Sell CNY1.5 Bln 3-Year Bonds JN 06/07 23:35 Japan to Sell 6-Month Bill
AU 06/08 21:00 Australia Plans to Sell Index-Linked BondsCH 06/08 23:00 Hubei to Sell CNY10.92 Bln 10-Year Bonds CH 06/08 23:00 Hubei to Sell CNY10.92 Bln 5-Year Bonds CH 06/08 23:00 Hubei to Sell CNY3.64 Bln 3-Year Bonds CH 06/08 23:00 Hubei to Sell CNY10.92 Bln 7-Year Bonds CH 06/08 23:00 Zhejiang to Sell CNY12 Bln 10-Year Bonds CH 06/08 23:00 Zhejiang to Sell CNY12 Bln 5-Year Bonds CH 06/08 23:00 Zhejiang to Sell CNY12 Bln 7-Year Bonds CH 06/08 23:00 Zhejiang to Sell CNY4 Bln 3-Year Bonds
JN 06/09 04:00 Japan Auction for Enhanced-LiquidityAU 06/09 21:00 Australia Plans to Sell BondsCH 06/09 23:00 China to sell 3-Year BondsCH 06/09 23:00 China to Sell 3-Year Saving BondsCH 06/09 23:00 China to Sell 5-Year Saving BondsCH 06/09 23:00 Hebei to Sell Bonds JN 06/09 23:35 Japan to Sell 2-Month Bill
AU 06/10 20:30 Australia Plans to Sell BillsCH 06/10 23:00 Jilin to Sell BondsCH 06/10 23:00 Hebei to Sell Special Assessment BondsJN 06/10 23:35 Japan to Sell 3-Month BillJN 06/10 23:45 Japan to Sell 20-Year Bonds
AU 06/11 20:30 Australia Plans to Sell BondsNZ 06/11 22:05 New Zealand Plans to Sell NZD300 Mln Nominal BondsCH 06/11 23:00 Shanxi to Sell BondsCH 06/11 23:00 China to Sell 182-Day Bills
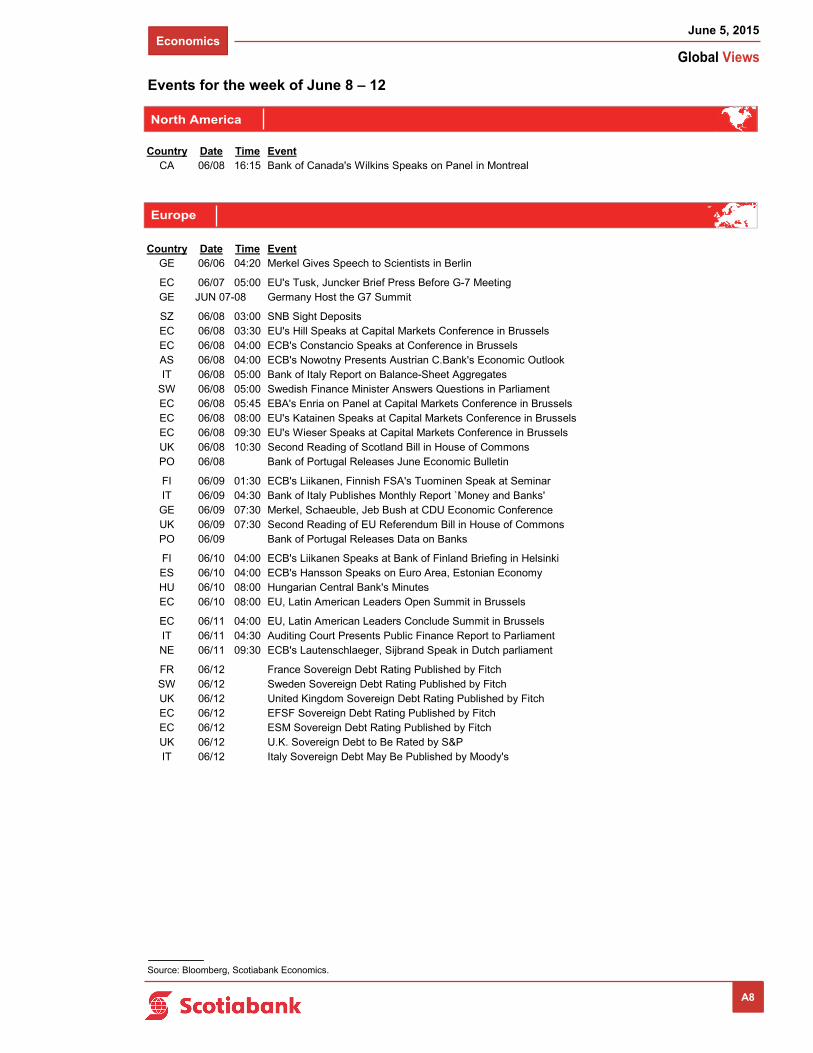
Economics
Global Views
June 5, 2015
6
Events for the week of June 8 – 12
Europe
Source: Bloomberg, Scotiabank Economics.
A8
North America
Country Date Time EventCA 06/08 16:15 Bank of Canada's Wilkins Speaks on Panel in Montreal
Country Date Time EventGE 06/06 04:20 Merkel Gives Speech to Scientists in Berlin
EC 06/07 05:00 EU's Tusk, Juncker Brief Press Before G-7 MeetingGE JUN 07-08 Germany Host the G7 Summit
SZ 06/08 03:00 SNB Sight DepositsEC 06/08 03:30 EU's Hill Speaks at Capital Markets Conference in BrusselsEC 06/08 04:00 ECB's Constancio Speaks at Conference in BrusselsAS 06/08 04:00 ECB's Nowotny Presents Austrian C.Bank's Economic OutlookIT 06/08 05:00 Bank of Italy Report on Balance-Sheet Aggregates
SW 06/08 05:00 Swedish Finance Minister Answers Questions in ParliamentEC 06/08 05:45 EBA's Enria on Panel at Capital Markets Conference in BrusselsEC 06/08 08:00 EU's Katainen Speaks at Capital Markets Conference in BrusselsEC 06/08 09:30 EU's Wieser Speaks at Capital Markets Conference in BrusselsUK 06/08 10:30 Second Reading of Scotland Bill in House of CommonsPO 06/08 Bank of Portugal Releases June Economic Bulletin
FI 06/09 01:30 ECB's Liikanen, Finnish FSA's Tuominen Speak at SeminarIT 06/09 04:30 Bank of Italy Publishes Monthly Report `Money and Banks'GE 06/09 07:30 Merkel, Schaeuble, Jeb Bush at CDU Economic ConferenceUK 06/09 07:30 Second Reading of EU Referendum Bill in House of CommonsPO 06/09 Bank of Portugal Releases Data on Banks
FI 06/10 04:00 ECB's Liikanen Speaks at Bank of Finland Briefing in HelsinkiES 06/10 04:00 ECB's Hansson Speaks on Euro Area, Estonian EconomyHU 06/10 08:00 Hungarian Central Bank's MinutesEC 06/10 08:00 EU, Latin American Leaders Open Summit in Brussels
EC 06/11 04:00 EU, Latin American Leaders Conclude Summit in BrusselsIT 06/11 04:30 Auditing Court Presents Public Finance Report to ParliamentNE 06/11 09:30 ECB's Lautenschlaeger, Sijbrand Speak in Dutch parliament
FR 06/12 France Sovereign Debt Rating Published by FitchSW 06/12 Sweden Sovereign Debt Rating Published by FitchUK 06/12 United Kingdom Sovereign Debt Rating Published by FitchEC 06/12 EFSF Sovereign Debt Rating Published by FitchEC 06/12 ESM Sovereign Debt Rating Published by FitchUK 06/12 U.K. Sovereign Debt to Be Rated by S&PIT 06/12 Italy Sovereign Debt May Be Published by Moody's

Economics
Global Views
June 5, 2015
7
Events for the week of June 8 – 12
Source: Bloomberg, Scotiabank Economics.
A9
Asia Pacific
Latin America
Country Date Time EventNZ 06/08 18:00 N.Z. Government 10-Month Financial Statements
JN 06/09 21:00 BOJ Sato makes a speech in KofuAU 06/09 22:50 RBA's Stevens Gives Speech to Economic Society of Australia
TH 06/10 03:30 BoT Benchmark Interest RateNZ 06/10 17:00 RBNZ Official Cash RateNZ 06/10 17:05 RBNZ Governor Wheeler News Conference on OCRSK JUN 10-11 BoK 7-Day Repo Rate
Country Date Time EventBZ 06/11 07:30 COPOM Monetary Policy Meeting MinutesCL 06/11 17:00 Overnight Rate TargetPE 06/11 19:00 Reference Rate

Economics
Global Views
June 5, 2015
8
Global Central Bank Watch
NORTH AMERICARate Current Rate Next Meeting Scotia's Forecasts Consensus ForecastsBank of Canada – Overnight Target Rate 0.75 July 15, 2015 0.75 --
Federal Reserve – Federal Funds Target Rate 0.25 June 17, 2015 0.25 0.25
Banco de México – Overnight Rate 3.00 July 23, 2015 3.00 --
EUROPERate Current Rate Next Meeting Scotia's Forecasts Consensus ForecastsEuropean Central Bank – Refinancing Rate 0.05 July 16, 2015 0.05 --
Bank of England – Bank Rate 0.50 July 9, 2015 0.50 0.50
Swiss National Bank – Libor Target Rate -0.75 June 18, 2015 -0.75 --
Central Bank of Russia – One-Week Auction Rate 12.50 June 15, 2015 12.50 11.50
Central Bank of the Republic of Turkey – 1 Wk Repo Rate 7.50 June 23, 2015 7.50 --
Sweden Riksbank – Repo Rate -0.25 July 2, 2015 -0.35 --
Norges Bank – Deposit Rate 1.25 June 18, 2015 1.00 --
ASIA PACIFICRate Current Rate Next Meeting Scotia's Forecasts Consensus ForecastsReserve Bank of Australia – Cash Target Rate 2.00 July 7, 2015 2.00 2.00
Reserve Bank of New Zealand – Cash Rate 3.50 June 10, 2015 3.25 3.50
People's Bank of China – Lending Rate 5.10 TBA -- --
Reserve Bank of India – Repo Rate 7.25 August 4, 2015 7.25 --
Bank of Korea – Bank Rate 1.75 June 11, 2015 1.75 1.50
Bank of Thailand – Repo Rate 1.50 June 10, 2015 1.50 --
Bank Indonesia – Reference Interest Rate 7.50 June 18, 2015 7.50 --
LATIN AMERICARate Current Rate Next Meeting Scotia's Forecasts Consensus ForecastsBanco Central do Brasil – Selic Rate 13.75 July 29, 2015 13.75 --
Banco Central de Chile – Overnight Rate 3.00 June 11, 2015 3.00 3.00
Banco de la República de Colombia – Lending Rate 4.50 June 24, 2015 4.50 --
Banco Central de Reserva del Perú – Reference Rate 3.25 June 11, 2015 3.25 3.25
AFRICARate Current Rate Next Meeting Scotia's Forecasts Consensus ForecastsSouth African Reserve Bank – Repo Rate 5.75 July 23, 2015 5.75 --
The Fed slips into communication blackout on Tuesday ahead of the following week’s FOMC meeting, and will release its quarterly Flow of Funds accounts showing broad financial accounts on Thursday. Retail sales (Thursday) are the only material domestic data risk to US markets, though the Fed’s Labor Market Conditions Index (Monday), NFIB small business optimism (Tuesday), JOLTS Job Openings (Tuesday), PPI (Friday) and U. of Michigan’s consumer confidence reading (Friday) will also be watched by policymakers as secondary data points. BoC Senior Deputy Governor Carolyn Wilkins speaks on a panel at the International Economic Forum of the Americas’ Conference of Montreal on Monday, but will probably present little market risk. On Thursday, the BoC will release its Financial System Review. Canadian data risk is light with only housing starts and building permits (Monday), and two measures of house prices (new homes on Thursday and repeat sales of existing homes on Friday).
We expect both the Banco Central de Chile and the Banco Central de Reserva del Perú to maintain benchmark interest rates at 3.00% and 3.25%, respectively, when monetary authorities in each country meet on June 11th. In Chile, inflation has continued to ease from its October high and is expected to have re-entered the central bank’s 2-4% target range in May. In Peru, inflation has hovered around the upper bound of the central bank’s 1-3% target range for the past year, hitting 3.4% y/y in May; however, as the Latin American inflation slows, it is unlikely that Peruvian monetary authorities will hike ahead of US policy normalization.
Monetary authorities at the Reserve Bank of New Zealand (RBNZ) will meet and announce a policy decision on June 10th. The consumer price index rose by 0.1% y/y in the first quarter of 2015; well below the RBNZ's 1-3% target range. Monetary authorities continue to signal a preference for weaker currency to support the export sector. Accordingly, we expect authorities will cut the key rate at next week's meeting by 25 basis points and shift to a neutal bias thereafter. In Thailand, deflation persists for the fourth consecutive month; although we don't expect further stimulus, monetary conditions will likely remain accomodative for an extended period of time, with the benchmark interest rate set at 1.5%. In Korea, the consumer price index increased by 0.4% in April, well below the Bank of Korea's target corridor of 2½-3½%. Our base case forecast does not include further monetary easing in the near term, yet the likelihood of an additonal rate cut has increased recently.
North America
Europe
Asia Pacific
Latin America
Africa
Forecasts at time of publication. Source: Bloomberg, Scotiabank Economics.
A10

Economics
Global Views
June 5, 2015
9
North America
Canada 2014 14Q4 15Q1 Latest United States 2014 14Q4 15Q1 Latest Real GDP (annual rates) 2.4 2.2 -0.6 Real GDP (annual rates) 2.4 2.2 -0.7 Current Acc. Bal. (C$B, ar) -41.5 -52.2 -69.9 Current Acc. Bal. (US$B, ar) -411 -454 Merch. Trade Bal. (C$B, ar) 5.0 -8.1 -31.0 -35.7 (Apr) Merch. Trade Bal. (US$B, ar) -741 -744 -756 -728 (Apr) Industrial Production 2.5 1.3 -1.7 -2.4 (Apr) Industrial Production 4.1 4.5 3.3 1.9 (Apr) Housing Starts (000s) 189 184 175 183 (Apr) Housing Starts (millions) 1.00 1.06 0.97 1.14 (Apr) Employment 0.6 0.7 0.6 1.0 (May) Employment 1.9 2.2 2.3 2.2 (May) Unemployment Rate (%) 6.9 6.7 6.7 6.8 (May) Unemployment Rate (%) 6.2 5.7 5.6 5.5 (May) Retail Sales 4.6 4.4 2.3 3.1 (Mar) Retail Sales 3.6 3.8 1.6 -0.1 (Apr) Auto Sales (000s) 1850 1906 1796 1793 (Mar) Auto Sales (millions) 16.4 16.7 16.6 17.7 (May) CPI 1.9 1.9 1.1 0.8 (Apr) CPI 1.6 1.2 -0.1 -0.2 (Apr) IPPI 2.5 1.3 -1.7 2.4 (Apr) PPI 1.9 0.8 -3.2 -4.4 (Apr) Pre-tax Corp. Profits 8.8 6.2 -10.8 Pre-tax Corp. Profits 8.3 6.7 8.9
Mexico Real GDP 2.1 2.6 2.5 Current Acc. Bal. (US$B, ar) -26.5 -20.3 -37.8 Merch. Trade Bal. (US$B, ar) -2.8 -3.3 -8.8 -1.0 (Apr) Industrial Production 1.9 2.4 1.4 1.7 (Mar) CPI 4.0 4.2 3.1 3.1 (Apr)
Euro Zone 2014 14Q4 15Q1 Latest Germany 2014 14Q4 15Q1 Latest Real GDP 0.9 1.0 Real GDP 1.6 1.5 1.0 Current Acc. Bal. (US$B, ar) 281 454 216 324 (Mar) Current Acc. Bal. (US$B, ar) 219.7 301.7 290.2 363.2 (Mar) Merch. Trade Bal. (US$B, ar) 327.1 405.2 294.4 371.2 (Mar) Merch. Trade Bal. (US$B, ar) 287.5 294.5 262.3 300.2 (Mar) Industrial Production 0.8 0.3 1.5 1.8 (Mar) Industrial Production 1.5 0.7 0.2 -0.1 (Mar) Unemployment Rate (%) 11.6 11.5 11.2 11.1 (Apr) Unemployment Rate (%) 6.7 6.6 6.5 6.4 (May) CPI 0.4 0.2 -0.3 0.0 (Apr) CPI 0.9 0.5 0.0 1.4 (May)
France United Kingdom Real GDP 0.2 0.0 0.7 Real GDP 2.8 3.0 2.4 Current Acc. Bal. (US$B, ar) -28.1 0.8 -9.6 -23.7 (Mar) Current Acc. Bal. (US$B, ar) -97.9 -101.2 Merch. Trade Bal. (US$B, ar) -40.4 -34.2 -40.9 -33.5 (Apr) Merch. Trade Bal. (US$B, ar) -197.1 -184.5 -181.2 -181.9 (Mar) Industrial Production -1.1 -1.5 1.0 1.3 (Mar) Industrial Production 1.6 1.0 0.6 0.7 (Mar) Unemployment Rate (%) 10.3 10.5 10.5 10.5 (Apr) Unemployment Rate (%) 6.2 5.7 5.5 (Feb) CPI 0.5 0.3 -0.2 0.1 (Apr) CPI 1.5 0.9 0.1 -0.1 (Apr)
Italy Russia Real GDP -0.4 -0.4 0.1 Real GDP 0.6 0.4 -1.9 Current Acc. Bal. (US$B, ar) 30.9 57.4 22.2 23.6 (Mar) Current Acc. Bal. (US$B, ar) 59.5 15.4 23.5 Merch. Trade Bal. (US$B, ar) 56.7 73.3 34.7 52.8 (Mar) Merch. Trade Bal. (US$B, ar) 15.8 14.1 14.5 15.0 (Mar) Industrial Production -0.5 -1.0 -0.5 0.9 (Mar) Industrial Production -1.6 2.1 -0.4 -4.5 (Apr) CPI 0.2 0.1 -0.4 -0.1 (Apr) CPI 7.8 9.6 16.2 15.8 (May)
Europe
All data expressed as year-over-year % change unless otherwise noted.
Economic Statistics
Source: Bloomberg, Global Insight, Scotiabank Economics.
A11

Economics
Global Views
June 5, 2015
10
Asia Pacific
Australia 2014 14Q4 15Q1 Latest Japan 2014 14Q4 15Q1 Latest Real GDP 2.7 2.4 2.3 Real GDP -0.1 -0.8 -1.4 Current Acc. Bal. (US$B, ar) -40.3 -40.1 -34.2 Current Acc. Bal. (US$B, ar) 24.4 54.0 143.5 278.6 (Mar) Merch. Trade Bal. (US$B, ar) 12.4 4.7 2.4 -24.6 (Apr) Merch. Trade Bal. (US$B, ar) -122.5 -78.8 -29.1 -20.9 (Apr) Industrial Production 4.4 3.7 2.8 Industrial Production 2.1 -1.4 -2.2 -0.1 (Apr) Unemployment Rate (%) 6.1 6.2 6.2 6.2 (Apr) Unemployment Rate (%) 3.6 3.5 3.5 3.3 (Apr) CPI 2.5 1.7 1.3 CPI 2.7 2.5 2.3 0.6 (Apr)
South Korea China Real GDP 3.3 2.7 2.5 Real GDP 7.4 7.3 7.0 Current Acc. Bal. (US$B, ar) 89.2 108.9 93.8 97.6 (Apr) Current Acc. Bal. (US$B, ar) 219.7 Merch. Trade Bal. (US$B, ar) 47.2 73.4 86.7 75.8 (May) Merch. Trade Bal. (US$B, ar) 382.5 599.6 494.9 409.6 (Apr) Industrial Production 0.5 -1.7 -1.6 -2.5 (Apr) Industrial Production 7.9 7.9 5.6 5.9 (Apr) CPI 1.3 1.0 0.6 2.3 (May) CPI 1.5 1.5 1.4 1.5 (Apr)
Thailand India Real GDP 0.9 2.1 3.0 Real GDP 7.0 7.5 6.1 Current Acc. Bal. (US$B, ar) 13.1 8.7 8.2 Current Acc. Bal. (US$B, ar) -27.4 -8.2 Merch. Trade Bal. (US$B, ar) 2.0 2.5 2.5 1.7 (Apr) Merch. Trade Bal. (US$B, ar) -11.6 -13.2 -9.0 -11.0 (Apr) Industrial Production -4.6 -2.1 0.1 -5.8 (Apr) Industrial Production 1.8 2.0 3.2 2.1 (Mar) CPI 1.9 1.1 -0.5 -1.3 (May) WPI 3.8 0.3 -1.8 -2.7 (Apr)
Indonesia Real GDP 5.0 5.0 4.7 Current Acc. Bal. (US$B, ar) -25.4 -5.7 -3.8 Merch. Trade Bal. (US$B, ar) -0.2 -0.1 0.8 0.5 (Apr) Industrial Production 4.6 4.8 4.7 6.7 (Mar) CPI 6.4 6.5 6.5 7.1 (May)
Brazil 2014 14Q4 15Q1 Latest Chile 2014 14Q4 15Q1 Latest Real GDP 0.1 -0.2 -1.6 Real GDP 1.9 1.8 2.4 Current Acc. Bal. (US$B, ar) -104.0 -119.3 -101.6 Current Acc. Bal. (US$B, ar) -5.1 -2.8 4.8 Merch. Trade Bal. (US$B, ar) -3.9 -12.9 -22.2 33.1 (May) Merch. Trade Bal. (US$B, ar) 6.7 7.0 10.9 13.8 (Apr) Industrial Production -3.0 -3.9 -6.1 -7.6 (Apr) Industrial Production 0.4 -1.0 0.6 -0.7 (Apr) CPI 6.3 6.5 7.7 8.2 (Apr) CPI 4.4 5.3 4.4 4.1 (Apr)
Peru Colombia Real GDP 2.4 1.0 1.7 Real GDP 4.6 3.5 Current Acc. Bal. (US$B, ar) -8.0 -1.3 -2.6 Current Acc. Bal. (US$B, ar) -19.8 -6.4 Merch. Trade Bal. (US$B, ar) -0.1 0.0 -0.4 -0.6 (Mar) Merch. Trade Bal. (US$B, ar) -0.5 -1.4 -1.4 -1.0 (Mar) Unemployment Rate (%) 6.0 5.6 6.8 6.8 (Apr) Industrial Production 1.5 0.4 -0.1 (Mar) CPI 3.2 3.2 3.0 3.4 (May) CPI 2.9 3.5 4.2 4.6 (Apr)
Latin America
Economic Statistics
All data expressed as year-over-year % change unless otherwise noted.
Source: Bloomberg, Global Insight, Scotiabank Economics.
A12

Economics
Global Views
June 5, 2015
11
Financial Statistics
A12
Interest Rates (%, end of period)
Canada 14Q4 15Q1 May/29 Jun/05* United States 14Q4 15Q1 May/29 Jun/05*BoC Overnight Rate 1.00 0.75 0.75 0.75 Fed Funds Target Rate 0.25 0.25 0.25 0.25 3-mo. T-bill 0.92 0.55 0.63 0.63 3-mo. T-bill 0.04 0.02 0.00 0.01 10-yr Gov’t Bond 1.79 1.36 1.62 1.81 10-yr Gov’t Bond 2.17 1.92 2.12 2.38 30-yr Gov’t Bond 2.34 1.98 2.21 2.39 30-yr Gov’t Bond 2.75 2.54 2.88 3.07 Prime 3.00 2.85 2.85 2.85 Prime 3.25 3.25 3.25 3.25 FX Reserves (US$B) 74.6 77.6 77.7 (Apr) FX Reserves (US$B) 119.0 108.2 110.2 (Apr)
Germany France 3-mo. Interbank 0.02 -0.02 -0.04 -0.06 3-mo. T-bill -0.05 -0.16 -0.19 -0.19 10-yr Gov’t Bond 0.54 0.18 0.49 0.85 10-yr Gov’t Bond 0.83 0.48 0.80 1.17 FX Reserves (US$B) 62.3 61.2 61.6 (Apr) FX Reserves (US$B) 49.5 50.5 48.4 (Apr)
Euro Zone United Kingdom Refinancing Rate 0.05 0.05 0.05 0.05 Repo Rate 0.50 0.50 0.50 0.50 Overnight Rate 0.14 0.05 -0.08 -0.14 3-mo. T-bill 0.44 0.45 0.47 0.47 FX Reserves (US$B) 327.6 330.9 330.7 (Apr) 10-yr Gov’t Bond 1.76 1.58 1.81 2.08
FX Reserves (US$B) 95.7 106.2 106.2 (Mar)
Japan Australia Discount Rate 0.30 0.30 0.30 0.30 Cash Rate 2.50 2.25 2.00 2.00 3-mo. Libor 0.05 0.04 0.04 0.04 10-yr Gov’t Bond 2.74 2.32 2.73 3.04 10-yr Gov’t Bond 0.33 0.41 0.39 0.49 FX Reserves (US$B) 50.8 53.8 51.1 (Apr) FX Reserves (US$B) 1231.0 1216.1 1221.0 (Apr)
Exchange Rates (end of period)
USDCAD 1.16 1.27 1.25 1.25 ¥/US$ 119.78 120.13 124.15 125.54CADUSD 0.86 0.79 0.80 0.80 US¢/Australian$ 0.82 0.76 0.76 0.76GBPUSD 1.558 1.482 1.529 1.526 Chinese Yuan/US$ 6.21 6.20 6.20 6.20EURUSD 1.210 1.073 1.099 1.112 South Korean Won/US$ 1091 1110 1108 1111JPYEUR 0.69 0.78 0.73 0.72 Mexican Peso/US$ 14.752 15.264 15.378 15.669USDCHF 0.99 0.97 0.94 0.94 Brazilian Real/US$ 2.658 3.197 3.179 3.160
Equity Markets (index, end of period)
United States (DJIA) 17823 17776 18011 17896 U.K. (FT100) 6566 6773 6984 6813 United States (S&P500) 2059 2068 2107 2096 Germany (Dax) 9806 11966 11414 11209 Canada (S&P/TSX) 14632 14902 15014 15021 France (CAC40) 4273 5034 5008 4925 Mexico (IPC) 43146 43725 44704 44655 Japan (Nikkei) 17451 19207 20563 20461 Brazil (Bovespa) 50007 51150 52760 53070 Hong Kong (Hang Seng) 23605 24901 27424 27260 Italy (BCI) 1038 1273 1297 1285 South Korea (Composite) 1916 2041 2115 2068
Commodity Prices (end of period)
Pulp (US$/tonne) 1020 980 980 980 Copper (US$/lb) 2.88 2.74 2.76 2.69 Newsprint (US$/tonne) 595 570 560 560 Zinc (US$/lb) 0.98 0.94 1.00 0.97 Lumber (US$/mfbm) 340 282 265 279 Gold (US$/oz) 1206.00 1187.00 1191.40 1164.60 WTI Oil (US$/bbl) 53.27 47.60 60.30 58.12 Silver (US$/oz) 15.97 16.60 16.67 16.15 Natural Gas (US$/mmbtu) 2.89 2.64 2.64 2.59 CRB (index) 229.96 211.86 223.18 221.18
* Latest observation taken at time of writing. Source: Bloomberg, Scotiabank Economics.
A13

Global Views
June 5, 2015
Foreign Exchange Strategy This publication has been prepared by The Bank of Nova Scotia (Scotiabank) for informational and marketing purposes only. Opinions, estimates and projections contained herein are our own as of the date hereof and are subject to change without notice. The information and opinions contained herein have been compiled or arrived at from sources believed reliable, but no representation or warranty, express or implied, is made as to their accuracy or completeness and neither the information nor the forecast shall be taken as a representation for which Scotiabank, its affiliates or any of their employees incur any responsibility. Neither Scotiabank nor its affiliates accept any liability whatsoever for any loss arising from any use of this information. This publication is not, and is not constructed as, an offer to sell or solicitation of any offer to buy any of the currencies referred to herein, nor shall this publication be construed as an opinion as to whether you should enter into any swap or trading strategy involving a swap or any other transaction. The general transaction, financial, educational and market information contained herein is not intended to be, and does not constitute, a recommendation of a swap or trading strategy involving a swap within the meaning of U.S. Commodity Futures Trading Commission Regulation 23.434 and Appendix A thereto. This material is not intended to be individually tailored to your needs or characteristics and should not be viewed as a “call to action” or suggestion that you enter into a swap or trading strategy involving a swap or any other transaction. You should note that the manner in which you implement any of the strategies set out in this publication may expose you to significant risk and you should carefully consider your ability to bear such risks through consultation with your own independent financial, legal, accounting, tax and other professional advisors. Scotiabank, its affiliates and/or their respective officers, directors or employees may from time to time take positions in the currencies mentioned herein as principal or agent, and may have received remuneration as financial advisor and/or underwriter for certain of the corporations mentioned herein. Directors, officers or employees of Scotiabank and its affiliates may serve as directors of corporations referred to herein. All Scotiabank products and services are subject to the terms of applicable agreements and local regulations. This publication and all information, opinions and conclusions contained in it are protected by copyright. This information may not be reproduced in whole or in part, or referred to in any manner whatsoever nor may the information, opinions and conclusions contained in it be referred to without the prior express written consent of Scotiabank. ™Trademark of The Bank of Nova Scotia. Used under license, where applicable. Scotiabank, together with “Global Banking and Markets”, is a marketing name for the global corporate and investment banking and capital markets businesses of The Bank of Nova Scotia and certain of its affiliates in the countries where they operate, all members of the Scotiabank group and authorized users of the mark. The Bank of Nova Scotia is incorporated in Canada with limited liability and is authorised and regulated by the Office of the Superintendent of Financial Institutions Canada. The Bank of Nova Scotia and Scotiabank Europe plc are authorised by the UK Prudential Regulation Authority. The Bank of Nova Scotia is subject to regulation by the UK Financial Conduct Authority and limited regulation by the UK Prudential Regulation Authority. Scotiabank Europe plc is authorised by the UK Prudential Regulation Authority and regulated by the UK Financial Conduct Authority and the UK Prudential Regulation Authority. Details about the extent of The Bank of Nova Scotia's regulation by the UK Prudential Regulation Authority are available on request. Scotiabank Inverlat, S.A., Scotia Inverlat Casa de Bolsa, S.A. de C.V., and Scotia Inverlat Derivados, S.A. de C.V., are each authorized and regulated by the Mexican financial authorities.Not all products and services are offered in all jurisdictions. Services described are available in jurisdictions where permitted by law.
Disclaimer
Scotiabank Economics
Scotia Plaza 40 King Street West, 63rd Floor
Toronto, Ontario Canada M5H 1H1
Tel: 416.866.6253 Fax: 416.866.2829
Email: [email protected]
For general and publication-related inquiries, contact
us by telephone, email and/or fax.
Scotiabank Economics
This report has been prepared by Scotiabank Economics as a resource for the clients of Scotiabank. Opinions, estimates and projections contained herein are our own as of the date hereof and are subject to change without notice. The information and opinions contained herein have been compiled or arrived at from sources believed reliable but no representation or warranty, express or implied, is made as to their accuracy or completeness. Neither Scotiabank nor its affiliates accepts any liability whatsoever for any loss arising from any use of this report or its contents. TM Trademark of The Bank of Nova Scotia. Used under license, where applicable.
Disclaimer
Global Views
June 5, 2015