Global Views 04-21-11 - Scotiabank Global Site
24
Global Views is available on: www.scotiabank.com, Bloomberg at SCOE and Reuters at SM1C Global Views Weekly commentary on economic and financial market developments April 21, 2011 Economics > Corporate Bond Research Emerging Markets Strategy > Contact Us > Economic Statistics > Financial Statistics > Forecasts > Equity Strategy Foreign Exchange Strategy > Fixed Income Research Regional Outlook of the Euro Zone Periphery .................................................................. Pablo Bréard & Tuuli McCully Canadian Consumers Hit By Widespread Price Increases ...............................................................Adrienne Warren Challenging Year Ahead for Canadian Retailers ................................................................................ Alex Koustas Trimming Personal Income Tax Expenditures — A Tough Agenda ..................................... Nathan Joshua & Mary Webb Asian Currency Gains Aimed at Cushioning the Effect of Elevated Oil Prices ....................................... Oscar Sánchez Peru Elections Update: Building Support ............................................................................................ Joe Kogan A Notable Week for Asian FX ....................................................................................................... Sacha Tihanyi 2-8 Economics Key Data Preview ................................................................................................................................... A1-A2 Key Indicators ......................................................................................................................................... A3-A5 Global Auctions Calendar ....................................................................................................................... A6-A7 Events Calendar ........................................................................................................................................... A8 Global Central Bank Watch .......................................................................................................................... A9 Forecasts.................................................................................................................................................... A10 Latest Economic Statistics.......................................................................................................................... A11 Latest Financial Statistics ........................................................................................................................... A12 A1-A12 Forecasts & Data 2-3 4-5 6 7 8 9 Emerging Markets Strategy 10-11 Foreign Exchange Strategy
Transcript of Global Views 04-21-11 - Scotiabank Global Site
Global Views is available on: www.scotiabank.com, Bloomberg at SCOE and Reuters at SM1C
Global Views
Weekly commentary on economic and financial market developments April 21, 2011
Economics > Corporate Bond Research
Emerging Markets Strategy >
Contact Us >
Economic Statistics > Financial Statistics >
Forecasts >
Equity Strategy Foreign Exchange Strategy >
Fixed Income Research
Regional Outlook of the Euro Zone Periphery .................................................................. Pablo Bréard & Tuuli McCully
Canadian Consumers Hit By Widespread Price Increases ...............................................................Adrienne Warren
Challenging Year Ahead for Canadian Retailers ................................................................................ Alex Koustas
Trimming Personal Income Tax Expenditures — A Tough Agenda ..................................... Nathan Joshua & Mary Webb
Asian Currency Gains Aimed at Cushioning the Effect of Elevated Oil Prices ....................................... Oscar Sánchez
Peru Elections Update: Building Support............................................................................................Joe Kogan
A Notable Week for Asian FX .......................................................................................................Sacha Tihanyi
2-8 Economics
Key Data Preview................................................................................................................................... A1-A2
Key Indicators......................................................................................................................................... A3-A5
Global Auctions Calendar....................................................................................................................... A6-A7
Events Calendar ...........................................................................................................................................A8
Global Central Bank Watch ..........................................................................................................................A9
Forecasts....................................................................................................................................................A10
Latest Economic Statistics..........................................................................................................................A11
Latest Financial Statistics ...........................................................................................................................A12
A1-A12 Forecasts & Data
2-3
4-5
6
7
8
9 Emerging Markets Strategy
10-11 Foreign Exchange Strategy

2
Global Views
Economics
April 21, 2011
EUROPE
Ambitious fiscal consolidation and policy coordination continue in the euro zone periphery in order to restore fiscal sustainability, and to alleviate the sovereign credit turmoil.
Improved Governance: Decisive Joint Intervention to Address Fiscal & Debt Shocks European political leaders are showing a greater sense of unity and cohesiveness in managing the financial and political shocks linked to fiscal and debt sustainability in selected countries within the euro zone’s periphery. Investors are beginning to reward the effectiveness by which multilateral financial schemes can be designed and executed. Financial assistance is being provided to three of the so-called group of PIGS (Portugal, Ireland, Greece and Spain). The joint programmes — the European Financial Stability Facility (EFSF) and the European Stability Mechanism (ESM) — established by the European Union (EU), the International Monetary Fund (IMF) and the European Commission incorporate rigorous conditions aimed at restoring fiscal health and secure financial stability within the euro zone. The effective lending capability of the EFSF will be enlarged to €440 billion (lending to Greece did not come from this facility, only those to Ireland and Portugal, which total around €160 billion). The permanent ESM will be established in 2013 with a lending capability of €500 billion. When announcing the forthcoming multilateral support to Portugal in April, the official communiqué released by the EU Finance Ministers stressed that the adjustment program to be endorsed by the new Portuguese government will require ambitious fiscal consolidation, growth and productivity enhancement reforms, and measures to safeguard financial stability. Massive bond issuance will complement the multilateral arrangements as primary sources of funding for European economies in fiscal distress. Diverging Growth Prospects Within the Euro Zone; Further Monetary Tightening in Sight Widening growth differentials remain in place within the euro zone. Germany’s economic strength (real GDP is expected to expand by 2.7% in 2011) contrasts sharply with the fragile economic conditions and high unemployment rates present in the PIGS countries, linked to the fiscal tightening needed to place government finances on a sustainable path. Worth noting, however, is that Portugal, Ireland and Greece represent only 6% of the euro zone’s economy, while Spain accounts for around 11% of the regional GDP. Spain is the only economy within this group will record a modest expansion in 2011/12 while Portugal, Ireland and Greece will continue to suffer from negative growth rates. In order to fulfill its mandate to secure price stability, the European Central Bank (ECB) recently initiated an orderly process of interest rate normalization. The monetary tightening cycle — the ECB increased its main refinancing rate by 25 bps to 1.25% on April 7th — should not derail the growth prospects of the core economies within the euro zone, but might adversely affect the recovery of the peripheral euro zone members, due to increasing costs of funds to businesses and households. Nevertheless, tighter monetary conditions limit inflationary expectations, which should lower the cost of longer term international financing, in turn helping the troubled economies to gain access to favourable funding conditions. Safeguarding Financial Stability is a Key Priority in Europe Systemic risk considerations will continue to affect the European periphery’s financial sector, and the ECB remains a primary provider of liquidity to distressed European banks. The ECB’s intervention to provide unlimited liquidity highlights the precarious situation still present in both Ireland and Portugal, while the risk of a debt restructuring of Greek debt obligations weighs on the region, both in the context of a persistently fragile UK banking sector. The tightening of credit conditions due to the introduction of a more stringent regulatory framework under the new Basle III rules also provides an economic growth-deterrent, as
Tuuli McCully (416) 863-2859 [email protected]
Pablo Bréard (416) 862-3876 [email protected]
Regional Outlook of the Euro Zone Periphery

3
Global Views
Economics
April 21, 2011
EUROPE
… continued from previous page
deleveraging remains in place in most of these peripheral economies. Since May 2010, the ECB has conducted liquidity-neutral interventions in distressed government debt markets under the Securities Markets Programme (SMP); to date, the programme has accumulated €77 billion in peripheral debt. Consolidation of Currency Regime Despite Financial Market Turbulence Successive sovereign debt and financial sector shocks within the euro zone have provided a solid test to the currency union. The euro (EUR) is here to stay; in fact, market trends point towards an appreciating exchange rate versus the US dollar (USD) in the near term. The recovery in the core European economies together with the financial assistance provided to Greece, Ireland and now Portugal, has helped the EUR gather strength versus the USD. The relative fiscal position of the euro area as a whole against that of the US, the UK, and Japan remains favourable, despite significant fiscal imbalances within the PIGS group. Persistent Sovereign Debt Shocks Lead to Deteriorating Creditworthiness International rating agencies are on alert, placing the four peripheral European countries under review for further sovereign debt rating downgrades. At present, financial market metrics imply that Spain, the top-rated credit within the PIGS group, will avoid the degree of contagion that affected other distressed economies. However, recent shifts in market trends have not prevented the rating agency community from keeping a “negative” outlook on the Spanish sovereign credit. Until now, Moody’s has downgraded Spain by two notches from the top rating category. At the other extreme is Greece, which is now rated as a speculative-grade economy, four notches below the investment-grade threshold. The risk of a debt restructuring increases Greece’s vulnerability of even further rating erosion. It is worth noting the velocity by which the systemic crisis in the banking sector ended in a rapid downgrade of Ireland’s sovereign debt ratings — down nine notches from “AAA”-rate status since July 2009. Finally, the latest casualty of investors’ anxiety, Portugal, has also suffered from multiple downgrade revisions, yet it still maintains an investment-grade position. Besides uncertain growth prospects, implementation risk (due to demanding fiscal adjustment plans) remains a key factor influencing the ratings outlook. For more detailed analysis on the economic outlook of Portugal, Ireland, Greece, and Spain, please refer to the Europe - Regional Economic Outlook report, published on Monday April 18th at http://www.scotiacapital.com/English/bns_econ/europe.pdf.
Tuuli McCully (416) 863-2859 [email protected]
Pablo Bréard (416) 862-3876 [email protected]
4
Global Views
Economics
April 21, 2011
INFLATION
Widespread consumer price increases in March are likely to raise some alarm bells, and suggest rising energy and non-energy commodity prices are beginning to infiltrate broader price trends. For the time being, however, underlying inflation should be kept in check by continued excess capacity, Canadian dollar strength, a highly competitive retail sector and well anchored inflation expectations.
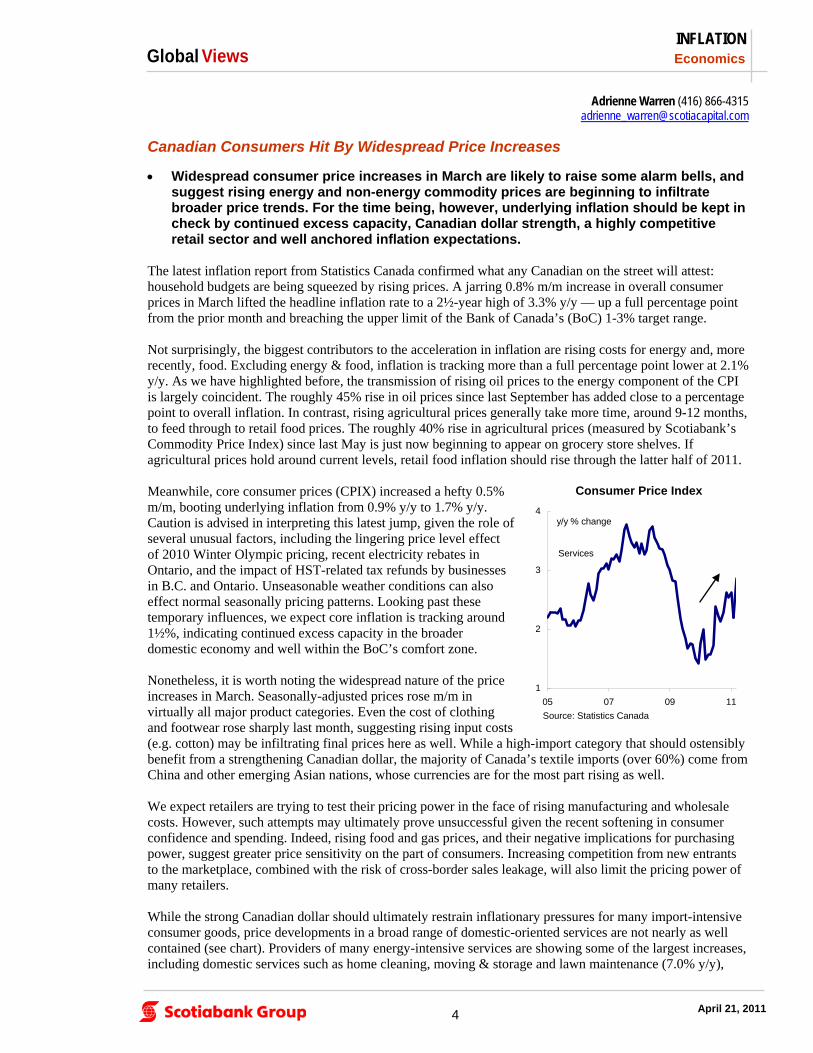
The latest inflation report from Statistics Canada confirmed what any Canadian on the street will attest: household budgets are being squeezed by rising prices. A jarring 0.8% m/m increase in overall consumer prices in March lifted the headline inflation rate to a 2½-year high of 3.3% y/y — up a full percentage point from the prior month and breaching the upper limit of the Bank of Canada’s (BoC) 1-3% target range. Not surprisingly, the biggest contributors to the acceleration in inflation are rising costs for energy and, more recently, food. Excluding energy & food, inflation is tracking more than a full percentage point lower at 2.1% y/y. As we have highlighted before, the transmission of rising oil prices to the energy component of the CPI is largely coincident. The roughly 45% rise in oil prices since last September has added close to a percentage point to overall inflation. In contrast, rising agricultural prices generally take more time, around 9-12 months, to feed through to retail food prices. The roughly 40% rise in agricultural prices (measured by Scotiabank’s Commodity Price Index) since last May is just now beginning to appear on grocery store shelves. If agricultural prices hold around current levels, retail food inflation should rise through the latter half of 2011. Meanwhile, core consumer prices (CPIX) increased a hefty 0.5% m/m, booting underlying inflation from 0.9% y/y to 1.7% y/y. Caution is advised in interpreting this latest jump, given the role of several unusual factors, including the lingering price level effect of 2010 Winter Olympic pricing, recent electricity rebates in Ontario, and the impact of HST-related tax refunds by businesses in B.C. and Ontario. Unseasonable weather conditions can also effect normal seasonally pricing patterns. Looking past these temporary influences, we expect core inflation is tracking around 1½%, indicating continued excess capacity in the broader domestic economy and well within the BoC’s comfort zone. Nonetheless, it is worth noting the widespread nature of the price increases in March. Seasonally-adjusted prices rose m/m in virtually all major product categories. Even the cost of clothing and footwear rose sharply last month, suggesting rising input costs (e.g. cotton) may be infiltrating final prices here as well. While a high-import category that should ostensibly benefit from a strengthening Canadian dollar, the majority of Canada’s textile imports (over 60%) come from China and other emerging Asian nations, whose currencies are for the most part rising as well. We expect retailers are trying to test their pricing power in the face of rising manufacturing and wholesale costs. However, such attempts may ultimately prove unsuccessful given the recent softening in consumer confidence and spending. Indeed, rising food and gas prices, and their negative implications for purchasing power, suggest greater price sensitivity on the part of consumers. Increasing competition from new entrants to the marketplace, combined with the risk of cross-border sales leakage, will also limit the pricing power of many retailers. While the strong Canadian dollar should ultimately restrain inflationary pressures for many import-intensive consumer goods, price developments in a broad range of domestic-oriented services are not nearly as well contained (see chart). Providers of many energy-intensive services are showing some of the largest increases, including domestic services such as home cleaning, moving & storage and lawn maintenance (7.0% y/y),
Adrienne Warren (416) 866-4315 [email protected]
Canadian Consumers Hit By Widespread Price Increases
1
2
3
4
05 07 09 11
y/y % change
Services
Consumer Price Index
Source: Statistics Canada

5
Global Views
Economics
April 21, 2011
INFLATION
… continued from previous page
personal care services such as dry cleaning and hair salons (6.2% y/y), child care (4.2% y/y), dental & eye care (3.8% y/y), car rentals (4.1% y/y), airfares (12.2% y/y), rail & bus transportation (4.8% y/y), taxis (3.9% y/y), postal services (8.0% y/y) and spectator sports (4.9% y/y). Also rising is the cost of many regulated or less elastic services, including home insurance (4.9% y/y), car insurance (4.7% y/y), tuition fees (3.8% y/y), parking fees (8.2% y/y), cable (7.1% y/y) and internet (3.7% y/y). For the time being, continued excess capacity, Canadian dollar strength, a highly competitive retail sector and well anchored inflation expectations should prevent a major breakout in underlying inflation. Indeed, we expect core inflation could fall back slightly in April given the tougher year-ago comparison for March. Nonetheless, the trend is biased higher as excess capacity is gradually absorbed, and rising manufacturing costs continue to pressure wholesale and retail margins. Headline inflation may well move even higher in the coming months before stabilizing in the second half of the year, assuming energy and non-energy commodity prices stabilize around current levels.
Adrienne Warren (416) 866-4315 [email protected]

6
Global Views
Economics
April 21, 2011
RETAIL
“Can I help you find anything? Anything?” Customers proving to be hard to convince. Retail sales numbers for the month of February highlight some of the difficulty faced by Canadian retailers. While a m/m advance of 0.4% is a decent gain, this proved to be just enough to offset losses incurred the month prior. Overall, Canadians have pulled back their expenditures so far this year, and while there are signs of improvement, retailers are faced with a number of challenges that will limit gains. Given the import intensity of the retail industry, the strong Canadian dollar offers a means to widen margins, but it also presents a genuine threat in the form of intensified online and cross-border competition. Travel data released this week highlight the extent to which cross-border shopping has increased in a post-recession high-dollar climate, with a y/y gain of 21.4% marking the 12th straight double digit increase in Canadian cross-border traffic. Although rising fuel costs have ebbed travel somewhat, it is evident that consumers are increasingly aware of price differentials south of the border. Online shopping and the proliferation of smart phones have increased this challenge, as price comparisons can be made almost instantaneously. With many U.S. sites now offering generous shipping terms, Canadian retailers now find non-traditional competitors extending their grasp into the Canadian market. This is particularly the case for travel tickets, books, clothing and jewelry – the most common items purchased online by Canadians. While the clothing and footwear component of CPI jumped 2.1% m/m in March, this amounted to a y/y increase of only 0.3%, such was the extent of discounting in the latter half of 2010. The Retail Council of Canada reports that while many retailers adopted a conservative inventory management strategy, they still found themselves overstocked after the holiday season. March may well have marked the month where excess inventories were finally purged, re-establishing some pricing power on new stock. However, price increases on clothing and electronics will be limited. The Retail Council of Canada reports that while conversion ratios— the amount of sales over the number of customers—are favourable, traffic at most retailers remains low. This is an indication that shoppers are researching and targeting specific items, giving the retailer limited power to attract the customer’s attention to any new or complimentary items, and promotions are constraining their ability to push them to higher margin items. Continued employment gains will support moderate sales growth this year, but consumer attitudes will remain cautious. Retailers are faced with value-conscious consumers who remain weary of increasing their debt burdens in the current economic climate. Product differentiation and loyalty programs will remain key strategies to gain market share in a low-price environment.
Alex Koustas (416) 866-4212 [email protected]
Challenging Year Ahead for Canadian Retailers
-30
-20
-10
0
10
20
30
40
09 10 11
y/y % change
Same-Day Cross Border Trips to the U.S.
Source: Statistics Canada
7
Global Views
Economics
April 21, 2011
FISCAL
Trimming U.S. personal income tax expenditures is likely to prove only slightly less contentious than other fiscal repair options
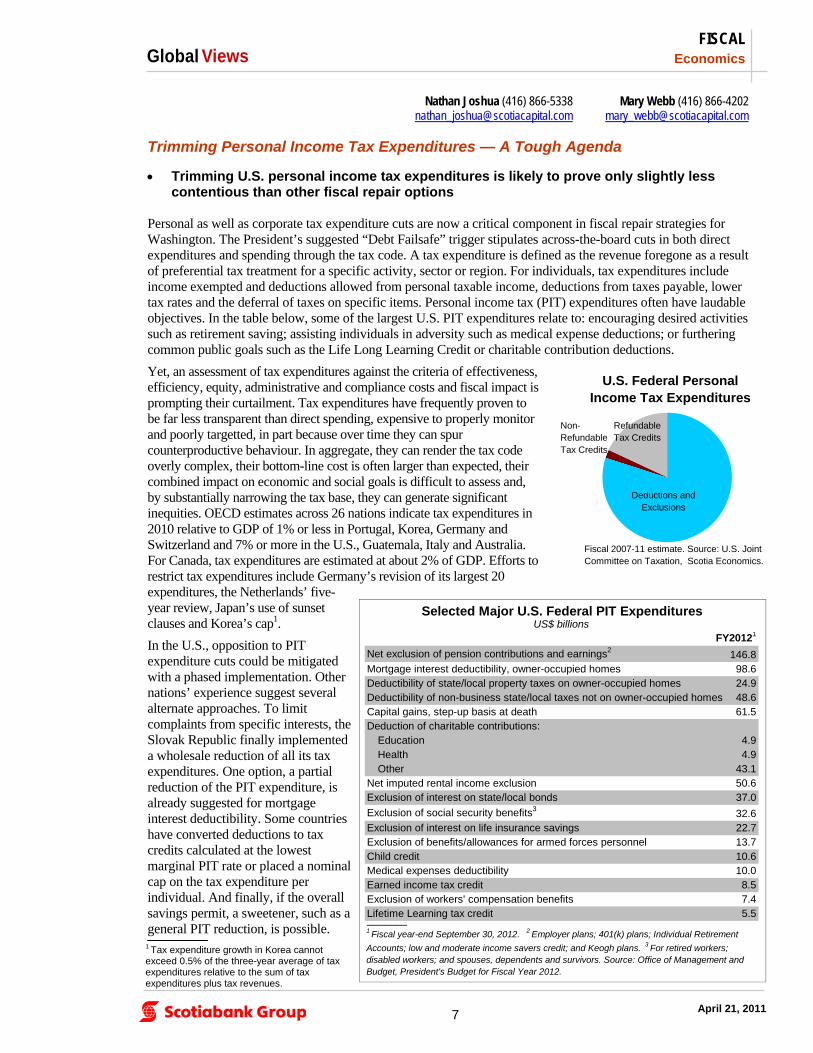
Personal as well as corporate tax expenditure cuts are now a critical component in fiscal repair strategies for Washington. The President’s suggested “Debt Failsafe” trigger stipulates across-the-board cuts in both direct expenditures and spending through the tax code. A tax expenditure is defined as the revenue foregone as a result of preferential tax treatment for a specific activity, sector or region. For individuals, tax expenditures include income exempted and deductions allowed from personal taxable income, deductions from taxes payable, lower tax rates and the deferral of taxes on specific items. Personal income tax (PIT) expenditures often have laudable objectives. In the table below, some of the largest U.S. PIT expenditures relate to: encouraging desired activities such as retirement saving; assisting individuals in adversity such as medical expense deductions; or furthering common public goals such as the Life Long Learning Credit or charitable contribution deductions.
Yet, an assessment of tax expenditures against the criteria of effectiveness, efficiency, equity, administrative and compliance costs and fiscal impact is prompting their curtailment. Tax expenditures have frequently proven to be far less transparent than direct spending, expensive to properly monitor and poorly targetted, in part because over time they can spur counterproductive behaviour. In aggregate, they can render the tax code overly complex, their bottom-line cost is often larger than expected, their combined impact on economic and social goals is difficult to assess and, by substantially narrowing the tax base, they can generate significant inequities. OECD estimates across 26 nations indicate tax expenditures in 2010 relative to GDP of 1% or less in Portugal, Korea, Germany and Switzerland and 7% or more in the U.S., Guatemala, Italy and Australia. For Canada, tax expenditures are estimated at about 2% of GDP. Efforts to restrict tax expenditures include Germany’s revision of its largest 20 expenditures, the Netherlands’ five-year review, Japan’s use of sunset clauses and Korea’s cap1.
In the U.S., opposition to PIT expenditure cuts could be mitigated with a phased implementation. Other nations’ experience suggest several alternate approaches. To limit complaints from specific interests, the Slovak Republic finally implemented a wholesale reduction of all its tax expenditures. One option, a partial reduction of the PIT expenditure, is already suggested for mortgage interest deductibility. Some countries have converted deductions to tax credits calculated at the lowest marginal PIT rate or placed a nominal cap on the tax expenditure per individual. And finally, if the overall savings permit, a sweetener, such as a general PIT reduction, is possible.
Mary Webb (416) 866-4202 [email protected]
Nathan Joshua (416) 866-5338 [email protected]
Trimming Personal Income Tax Expenditures — A Tough Agenda
FY20121
Net exclusion of pension contributions and earnings2146.8
Mortgage interest deductibility, owner-occupied homes 98.6Deductibility of state/local property taxes on owner-occupied homes 24.9Deductibility of non-business state/local taxes not on owner-occupied homes 48.6Capital gains, step-up basis at death 61.5Deduction of charitable contributions:
Education 4.9Health 4.9Other 43.1
Net imputed rental income exclusion 50.6Exclusion of interest on state/local bonds 37.0
Exclusion of social security benefits332.6
Exclusion of interest on life insurance savings 22.7Exclusion of benefits/allowances for armed forces personnel 13.7Child credit 10.6Medical expenses deductibility 10.0Earned income tax credit 8.5Exclusion of workers' compensation benefits 7.4Lifetime Learning tax credit 5.5_______1 Fiscal year-end September 30, 2012. 2 Employer plans; 401(k) plans; Individual Retirement
Accounts; low and moderate income savers credit; and Keogh plans. 3 For retired workers; disabled workers; and spouses, dependents and survivors. Source: Office of Management and Budget, President's Budget for Fiscal Year 2012.
Selected Major U.S. Federal PIT ExpendituresUS$ billions
Fiscal 2007-11 estimate. Source: U.S. Joint Committee on Taxation, Scotia Economics.
U.S. Federal Personal Income Tax Expenditures
Non-Refundable Tax Credits
Deductions and Exclusions
Refundable Tax Credits
1 Tax expenditure growth in Korea cannot exceed 0.5% of the three-year average of tax expenditures relative to the sum of tax expenditures plus tax revenues.

8
Global Views
Economics
April 21, 2011
ASIA
Regional monetary conditions will continue to tighten as rising inflationary pressures have Asian monetary authorities on edge.
While further interest rate increases are expected, exchange rates will bear a significant share of the load.
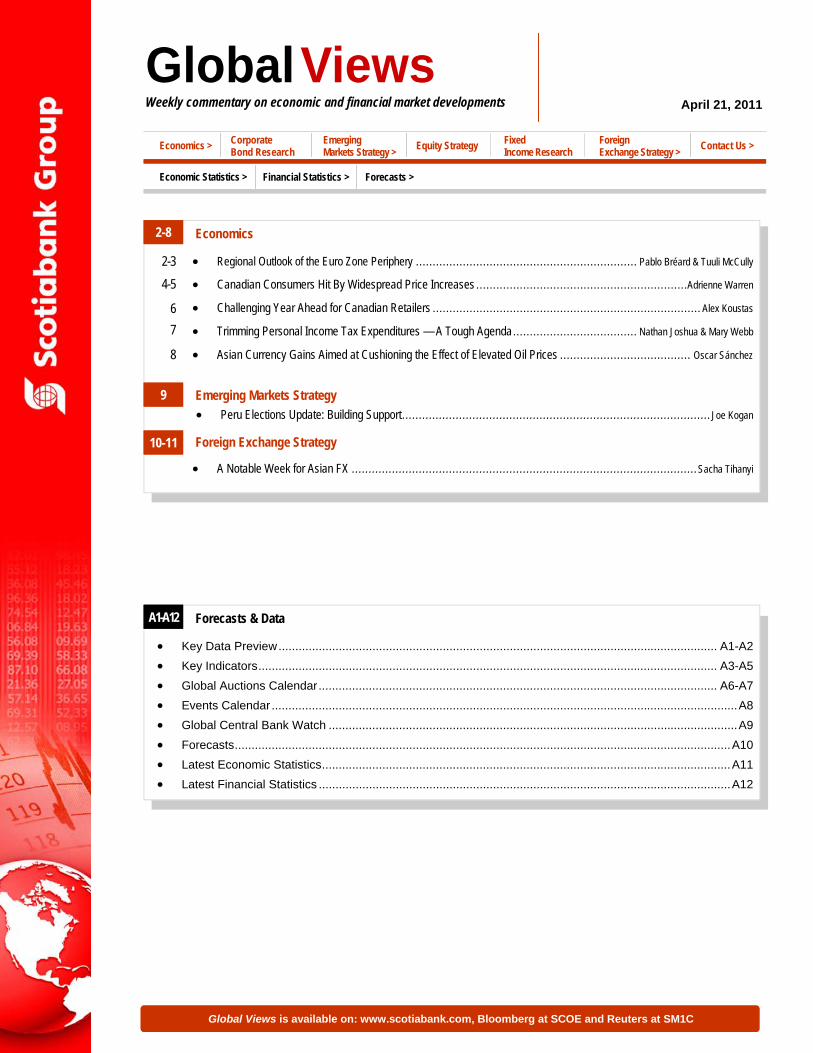
Asian currencies will bear a significant amount of the monetary policy tightening weight as they are aimed at cushioning the impact of elevated fuel, food and raw material imports. Inflationary concerns top the agendas of Asian monetary authorities’ as economies currently operate at output levels that surpass those observed in mid-2008, the peak of the previous business cycle. Home-grown momentum evident in declining unemployment rates is thus colliding with the surge in imported price pressures. Recent exchange rate trends reaffirm the perception that currency appreciation would have to play a significant role in mitigating the effect of elevated oil and raw materials costs. After a bout of volatility during the first three months of the year, regional exchange rates have either recovered or reaffirmed previous appreciation trends (refer to first chart). We expect to see more of this through the remainder of the year. While monetary normalization will continue as central banks move benchmark interest rates back to pre-crisis levels, the nature of the inflationary shock implies that a significant dose of foreign exchange appreciation will need to be part of the recipe. Although economies are running at close to full speed on the back of solid exports and domestic demand momentum, there not yet any evidence of wage-price spirals, which highlights the imported content of the current bout of price pressures. Therefore, unless inflationary expectations become contaminated, currency appreciation would be the most effective monetary response. The effect of elevated oil prices on Asian economies will differ depending on their international oil trade position relative to GDP. This ratio attempts to measure how intensively oil is used to produce a unit of output. While most Asian countries are net oil importers, some have positive net oil exports, like Malaysia and Vietnam (refer to second chart). A measure of oil intensity can thus indicate how capable the economy will be to cushion the blow of elevate world oil prices. To illustrate how oil price exposure is affecting currencies in differing ways, the cases of South Korea and Malaysia are worth highlighting. The Korean won’s (KRW) year to date (ytd) 3.8% appreciation against the US dollar is consistent with the economy’s high dependence on oil imports. Malaysia, on the other hand, is in a privileged position, as its net oil exporter status implies it is benefiting from the recent bout of elevated energy costs. This is consistent as well with a 1.7% ytd appreciation of the Malaysian ringgit (MYR), and a second place in the MYR’s position in the regional currency chart. Finally, the appreciation of the Thai baht (THB) (the leader of the pack in the first chart) can be regarded under this light as an effective measure to withstand imported inflationary pressures given the country’s relative oil intensity.
Oscar Sánchez (416) 862-3174 [email protected]
Asian Currency Gains Aimed at Cushioning the Effect of Elevated Oil Prices
-1.0 -0.5 0.0 0.5 1.0
Malaysia
Vietnam
Indonesia
China
India
Thailand
Taiwan
South Korea
Net Oil Trade as Share of GDP. Source: Scotia Economics.
Oil Intensity
0.7
0.8
0.9
1.0
1.1
1.2
Sep-08 Sep-09 Sep-10
index, Sept/08 = 1 THB
Asian Currencies
Source: Bloomberg, Scotia Economics.
CNY
MYR
KRW
INR
TWD

Emerging Markets Strategy Global Views
9 April 21, 2011
The following article was published on April 20, 2011. The campaign has been proceeding slowly in the ten days since leftist-candidate Humala captured a larger than expected vote in the first-round election. In particular, attempts at the formation of alliances have had only limited success. Toledo met with Humala on Saturday but has not met with Fujimori; on Sunday, some of Toledo’s advisors also met with Humala, and the author of Toledo’s economic plan, Kurt Burneo, now appears willing to work with Humala’s campaign. While Toledo himself insists that he will not endorse a particular candidate, some members of his party clearly may do so, and a future alliance in Congress seems possible as well. Felix Jimenez, Humala’s economic advisor, previously served as a director of Public Credit under the Toledo government, which provides another potential link between the two candidates. After a meeting Monday afternoon, a number of former government officials, economists, and academics seemed prepared to join Humala’s party. In order to entice such support, Humala’s idealogical stance continues to moderate. Over the weekend, the spokesperson for Humala’s party said that they are willing to make changes to their government plan if those are necessary to achieve a true national consensus and ensure the governability of the country. A cynical interpretation of this noble stance is that Humala is willing to make whatever changes are necessary in order to win; afterwards, it is anyone’s guess what he will do. Humala’s policies remain ambiguous, and perhaps intentionally so. In an interview on Sunday, Humala said that the nationalization of firms called for in his government plan does not actually mean nationalization in the “economic sense” but rather in the “political sense”; he endorses public policies that ensure that economic activity generates economic development. Obviously, that can mean anything. In an interview with CNN Mexico on Monday night, Humala rejected any fondness for the Venezuelan model, and the only type of revolution that Humala wanted to discuss was a revolution in education. One, so far minor, roadblock to Humala’s moderation that has appeared recently is that it is not clear whether electoral rules allow candidates to alter a previously submitted government plan, a plan which in Humala’s case has generated much criticism. In terms of alliances, Fujimori has grown closer to former rival Kuczynski. Even without a formal alliance, it is reasonable to expect that she should be able to capture many Kuczynski voters based on economic ideology. Meanwhile, she continues to deflect attacks on her father’s administration, which predictably have grown stronger now that there are only two candidates remaining. Caretas magazine published a list of 78 Fujimoristas that are either in jail or have received suspended sentences for corruption and human rights violations. The list includes the prime minister, five other ministers, congressmen, and of course the former president. Keiko repeatedly insists that she will not pardon her father if she is elected. Her attitude to her father’s administration remains fluid, however. Sometimes she praises that government as the best in the country’s history, while other times she recognizes that mistakes were made. Her support base in the first round came from those who had a favourable impression of her father, but of course she needs to widen her base for the second round. Thus, both candidates offend a portion of the electorate, a relationship demonstrated in terms of high rejection rates in prior polls. In a Datum poll published April 3rd (prior to the first round of elections), 33% of voters said they would never vote for Humala while 18% said they would never vote for Fujimori. In contrast, rejection rates according to an Ipsos poll from the same date were 41% for Humala and 40% for Fujimori. A difference between the two polls is that the Ipsos poll allowed voters to say they would never vote for more than one candidate. There may well be voters who said they would never vote for either Humala or Fuimori prior to the first round who may now be forced to decide over the next two months between these two candidates. The next important data point is likely to be the Ipsos-Apoyo poll scheduled for publication on Sunday, which will be the first Ipsos poll since the completion of first round elections. Still, Peruvian election history shows that much can change in two months, and the final outcome could differ substantially from an early poll.
Peru Elections Update: Building Support
Joe Kogan (212) 225-6541 [email protected]
Foreign Exchange Strategy Global Views
10 April 21, 2011
This week has brought key developments in EM Asian FX, including the signs of greater CNY flexibility from the PBoC, THB-supportive Bank of Thailand hawkishness, and sharp USD weakness; these factors have helped push the USD to new lows vs. EM Asia and favour continued gains in our recommended basket trade.
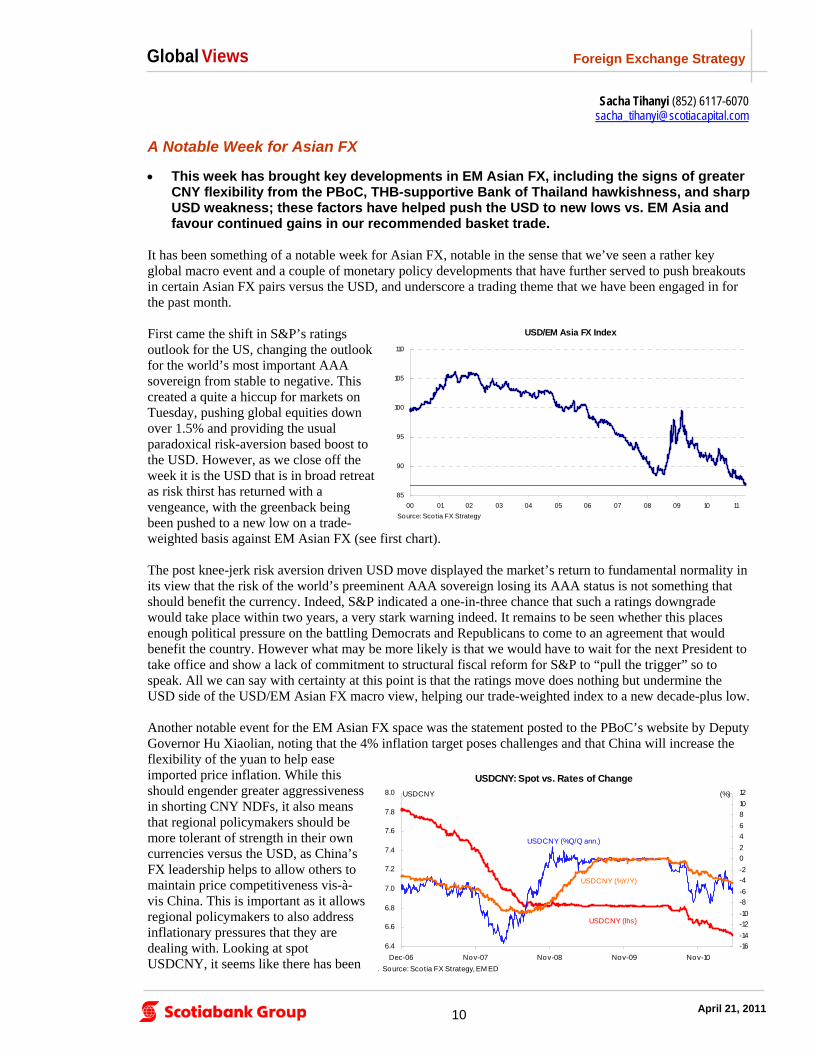
It has been something of a notable week for Asian FX, notable in the sense that we’ve seen a rather key global macro event and a couple of monetary policy developments that have further served to push breakouts in certain Asian FX pairs versus the USD, and underscore a trading theme that we have been engaged in for the past month. First came the shift in S&P’s ratings outlook for the US, changing the outlook for the world’s most important AAA sovereign from stable to negative. This created a quite a hiccup for markets on Tuesday, pushing global equities down over 1.5% and providing the usual paradoxical risk-aversion based boost to the USD. However, as we close off the week it is the USD that is in broad retreat as risk thirst has returned with a vengeance, with the greenback being been pushed to a new low on a trade-weighted basis against EM Asian FX (see first chart). The post knee-jerk risk aversion driven USD move displayed the market’s return to fundamental normality in its view that the risk of the world’s preeminent AAA sovereign losing its AAA status is not something that should benefit the currency. Indeed, S&P indicated a one-in-three chance that such a ratings downgrade would take place within two years, a very stark warning indeed. It remains to be seen whether this places enough political pressure on the battling Democrats and Republicans to come to an agreement that would benefit the country. However what may be more likely is that we would have to wait for the next President to take office and show a lack of commitment to structural fiscal reform for S&P to “pull the trigger” so to speak. All we can say with certainty at this point is that the ratings move does nothing but undermine the USD side of the USD/EM Asian FX macro view, helping our trade-weighted index to a new decade-plus low. Another notable event for the EM Asian FX space was the statement posted to the PBoC’s website by Deputy Governor Hu Xiaolian, noting that the 4% inflation target poses challenges and that China will increase the flexibility of the yuan to help ease imported price inflation. While this should engender greater aggressiveness in shorting CNY NDFs, it also means that regional policymakers should be more tolerant of strength in their own currencies versus the USD, as China’s FX leadership helps to allow others to maintain price competitiveness vis-à-vis China. This is important as it allows regional policymakers to also address inflationary pressures that they are dealing with. Looking at spot USDCNY, it seems like there has been
A Notable Week for Asian FX
Sacha Tihanyi (852) 6117-6070 [email protected]
85
90
95
100
105
110
00 01 02 03 04 05 06 07 08 09 10 11
USD/EM Asia FX Index
Source: Scotia FX Strategy
6.4
6.6
6.8
7.0
7.2
7.4
7.6
7.8
8.0
Dec-06 Nov-07 Nov-08 Nov-09 Nov-10
-16
-14
-12
-10
-8
-6
-4
-2
0
2
4
6
8
10
12
. Source: Scotia FX Strategy, EM ED
USDCNY: Spot vs. Rates of Change
USDCNY (%)
USDCNY (lhs)
USDCNY (%Q/Q ann.)
USDCNY (%Y/Y)
Foreign Exchange Strategy Global Views
11 April 21, 2011
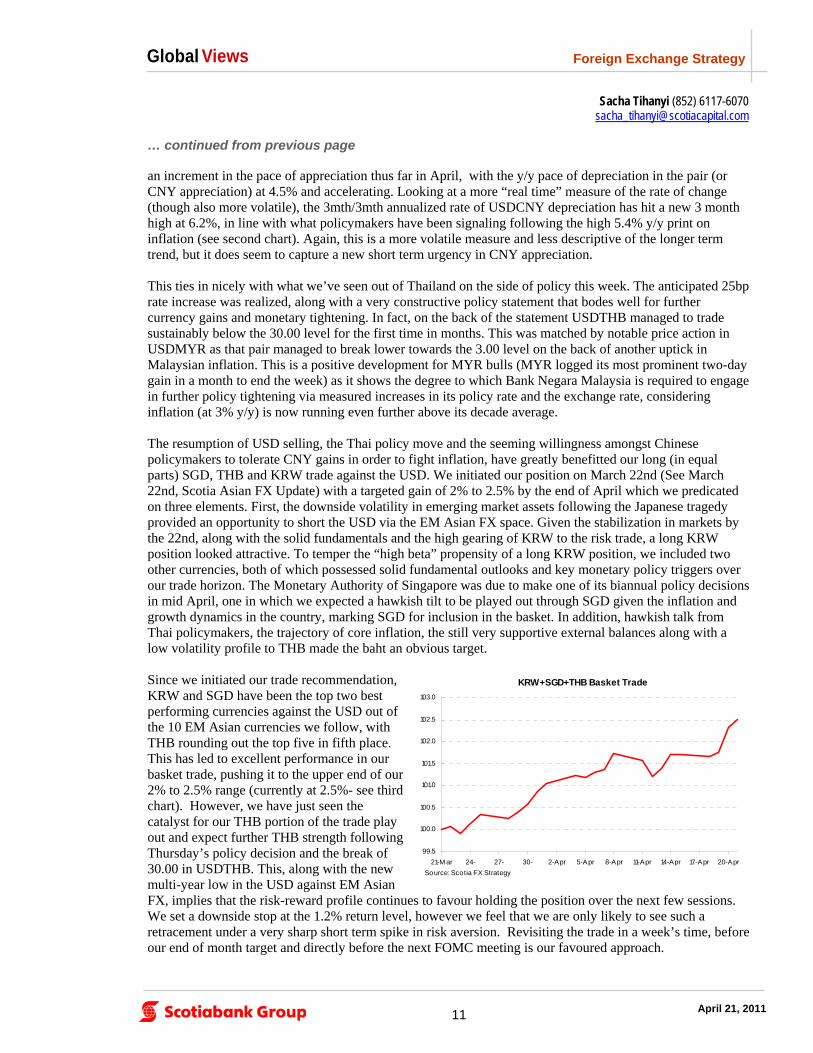
an increment in the pace of appreciation thus far in April, with the y/y pace of depreciation in the pair (or CNY appreciation) at 4.5% and accelerating. Looking at a more “real time” measure of the rate of change (though also more volatile), the 3mth/3mth annualized rate of USDCNY depreciation has hit a new 3 month high at 6.2%, in line with what policymakers have been signaling following the high 5.4% y/y print on inflation (see second chart). Again, this is a more volatile measure and less descriptive of the longer term trend, but it does seem to capture a new short term urgency in CNY appreciation. This ties in nicely with what we’ve seen out of Thailand on the side of policy this week. The anticipated 25bp rate increase was realized, along with a very constructive policy statement that bodes well for further currency gains and monetary tightening. In fact, on the back of the statement USDTHB managed to trade sustainably below the 30.00 level for the first time in months. This was matched by notable price action in USDMYR as that pair managed to break lower towards the 3.00 level on the back of another uptick in Malaysian inflation. This is a positive development for MYR bulls (MYR logged its most prominent two-day gain in a month to end the week) as it shows the degree to which Bank Negara Malaysia is required to engage in further policy tightening via measured increases in its policy rate and the exchange rate, considering inflation (at 3% y/y) is now running even further above its decade average. The resumption of USD selling, the Thai policy move and the seeming willingness amongst Chinese policymakers to tolerate CNY gains in order to fight inflation, have greatly benefitted our long (in equal parts) SGD, THB and KRW trade against the USD. We initiated our position on March 22nd (See March 22nd, Scotia Asian FX Update) with a targeted gain of 2% to 2.5% by the end of April which we predicated on three elements. First, the downside volatility in emerging market assets following the Japanese tragedy provided an opportunity to short the USD via the EM Asian FX space. Given the stabilization in markets by the 22nd, along with the solid fundamentals and the high gearing of KRW to the risk trade, a long KRW position looked attractive. To temper the “high beta” propensity of a long KRW position, we included two other currencies, both of which possessed solid fundamental outlooks and key monetary policy triggers over our trade horizon. The Monetary Authority of Singapore was due to make one of its biannual policy decisions in mid April, one in which we expected a hawkish tilt to be played out through SGD given the inflation and growth dynamics in the country, marking SGD for inclusion in the basket. In addition, hawkish talk from Thai policymakers, the trajectory of core inflation, the still very supportive external balances along with a low volatility profile to THB made the baht an obvious target. Since we initiated our trade recommendation, KRW and SGD have been the top two best performing currencies against the USD out of the 10 EM Asian currencies we follow, with THB rounding out the top five in fifth place. This has led to excellent performance in our basket trade, pushing it to the upper end of our 2% to 2.5% range (currently at 2.5%- see third chart). However, we have just seen the catalyst for our THB portion of the trade play out and expect further THB strength following Thursday’s policy decision and the break of 30.00 in USDTHB. This, along with the new multi-year low in the USD against EM Asian FX, implies that the risk-reward profile continues to favour holding the position over the next few sessions. We set a downside stop at the 1.2% return level, however we feel that we are only likely to see such a retracement under a very sharp short term spike in risk aversion. Revisiting the trade in a week’s time, before our end of month target and directly before the next FOMC meeting is our favoured approach.
… continued from previous page
Sacha Tihanyi (852) 6117-6070 [email protected]
99.5
100.0
100.5
101.0
101.5
102.0
102.5
103.0
21-M ar 24- 27- 30- 2-Apr 5-Apr 8-Apr 11-Apr 14-Apr 17-Apr 20-Apr
KRW+SGD+THB Basket Trade
Source: Scotia FX Strategy

12
Global Views
Economics
April 21, 2011
KEY DATA PREVIEW
A1
KEY DATA PREVIEW
Key Data Preview
CANADA A rebound in price-adjusted retail sales and further gains in housing starts will hopefully keep real GDP out of the red in February, resulting in a flat, rather than negative print. However, the risk is skewed to the downside after real wholesale sales, aggregate hours worked, net exports and manufacturing shipments all contracted during the month. Add to this the fact that condos, rather than singles, ac-counted for a large portion of the increase in housing starts, resulting in a smaller impact on growth. Should this come to fruition, February’s report will be the first non-positive report in four months. Nonetheless, with the strong gain in January, real GDP is still on track to post the largest quar-terly expansion since Q1 2010. After a small correction last Fall, Canadian resale house prices have started to increase once again, with an-other gain expected in the Teranet/National Bank Home Price Index — the Canadian equivalent of the U.S. S&P/Case-Shiller measure of resale house prices — in February. This revival, however, will likely be short-lived as tighter mortgage regulations, rising borrowing costs, constrained household balance sheets and already record-high home ownership rates limit housing growth. UNITED STATES Thursday’s GDP report will provide the initial estimate of first-quarter GDP. Data released to date leave intact soft growth. Our fore-cast predicts a gain of 2.0% q/q annualized, more moderate than the prior quarter’s 3.0% print, in part due to weaker consumer spending, on services in particular — which account for the largest slice (65%) (see chart 2). Estimates range broadly from 1.0% to 2.9%. Most sup-port is still likely to come from business investment in machinery and equipment and to a lesser extent household consumption, although inventories, too, should provide some boost on a weak base effect. Our call is for personal income (Friday) to post a gain of 0.4% m/m in March, on higher labour earnings, dividend payouts and rental income, dampened by lower unemployment benefits, at the State level in particular. We are looking for modest growth of 0.4% m/m in personal consumption, as headline retail sales — which account for 40% of overall household spending — moder-ated in March to the slowest pace since mid-2010. Unseasonably warmer weather may have lowered the de-mand for utilities. The personal savings rate is worth monitoring as US consumers remain cautious. Durable goods orders (Wednesday) are expected to have advanced in March, with our forecast looking for a headline gain of 3.0% m/m — partly supported by a weak base effect — and a core (ex. transportation) advance of 2.2%. Industry data corroborate this view on stronger commercial aircraft and motor vehicles bookings, defense procurement and capital spending intentions as well as the boost to foreign orders from a weaker US dollar. New home sales (Monday) — considered a more timely gauge of demand in the housing market than resale activity — have been moving along the floor since mid-2010, after the expiry of the extended first-time home-buyers’ tax credit. Our forecast is looking for a gain of 10% m/m to 275k annualized units, as new home sales fell a sharp 17% in the prior month.
A1
Gorica Djeric (416) 866-4214 [email protected]
Derek Holt (416) 863-7707 [email protected]
Karen Cordes Woods (416) 862-3080 [email protected]
100
105
110
115
Jan-10 Apr-10 Jul-10 Oct-10 Jan-11
Durables (13% of total PCE)
Non-Durables (22%)
Services (65%)
US Consumer SpendingIndex, Jan. 2010=100
Source: US BEA, Scotia Capital Economics.
-4
-2
0
2
4
6
8
MfgShipments
WholesaleSales
Emply. RetailSales
HousingStarts
m/m % change
Source: Scotia Capital Economics, Statistics Canada.
Major Input Factors into Canadian Real GDP in February

13
Global Views
Economics
April 21, 2011
KEY DATA PREVIEW
EUROPE The UK will release its first estimate for first-quarter 2011 real GDP growth on April 27th. Output dropped by 0.5% q/q (up by 1.5% y/y) in the final quarter of 2010, partly reflecting adverse weather conditions. We anticipate a rebound of 0.6% q/q (1.9% y/y) in the January-March period. Indeed, purchasing managers’ indices for the manufacturing, construction, and services sectors indicate significant acceleration in activity from the final quarter of 2010. We assess that growth in con-sumer spending and investment likely returned to positive territory in the January-March period, while government expenditure continued to reflect ongoing fiscal consolidation efforts. LATIN AMERICA
For the coming week (25th-29th April), Chile will be at the centre of investors’ attention as it will be releasing relevant economic infor-mation, such as industrial production and retail sales. After three con-secutive months of improvement, industrial production growth decel-erated from 4.0% y/y to 1.9%y/y in February due to a weaker manu-facturing sector, despite strong local and external demand. Other indi-cators, such as mining production and electricity generation, have also shown some signs of moderation. However, retail sales have been sup-porting economic growth, expanding 16.8% y/y in February. We ex-pect the Chilean economy to remain strong, with growth of 6.0% in 2011. ASIA
Taiwan’s unemployment rate is expected to remain on track to con-verge towards pre-crisis levels as a result of the economy’s continuing recovery. The fall in the jobless rate is supporting domestic demand momentum, while better-than-expected export performance is still propelling manufacturing output. The story is similar across most Asian economies, where notwithstanding the gains experienced by currencies during the past twelve months, export sectors remain rela-tively healthy. We expect the unemployment rate in Taiwan to have fallen to 4.3% in March, from the previous 4.5%.
Oscar Sánchez (416) 862-3174 [email protected]
Tuuli McCully (416) 863-2859 [email protected]
Daniela Blancas (416) 862-3908 daniela_blancas@scotiacapital
A2
-3
-2
-1
0
1
2
3
Mar-08 Mar-09 Mar-10 Mar-11
-7
-6
-5
-4
-3
-2
-1
0
1
2
3
Source: Bloomberg. Scotia Economics
q/q % change
y/y % change
UK Real GDP Growth
forecast
3.0
3.5
4.0
4.5
5.0
5.5
6.0
6.5
01 03 05 07 09 11
%
Taiwan's Unemployment Rate
Source: Bloomberg.
-20
-15
-10
-5
0
5
10
15
20
25
Jan-09 Jun-09 Nov-09 Apr-10 Sep-10 Feb-11
y/y % change
Chilean Industrial Production and Retail Sales
Source: Bloomberg.
Industrial production
Retail sales
E
-3
-2
-1
0
1
2
3
Mar-08 Mar-09 Mar-10 Mar-11
-7
-6
-5
-4
-3
-2
-1
0
1
2
3
Source: Bloomberg. Scotia Economics
q/q % change
y/y % change
UK Real GDP Growth
forecast
LHS
RHS

Economics
1
Global Views
April 21, 2011
KEY INDICATORS
North America
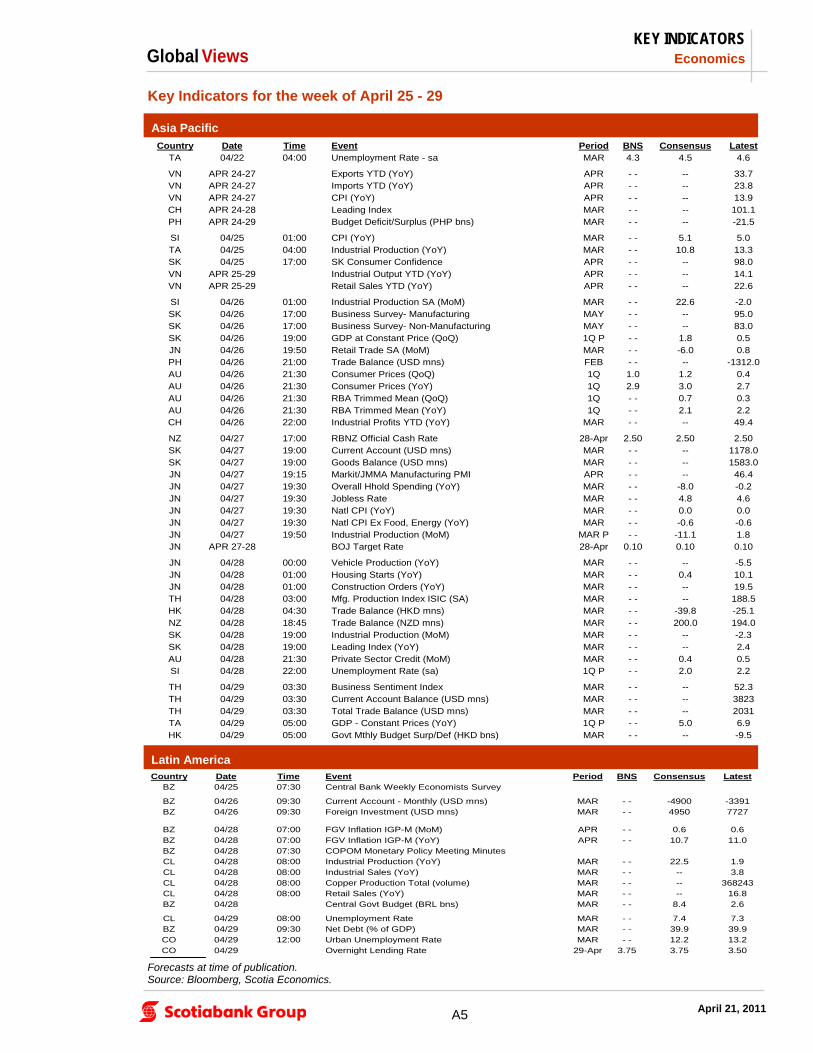
Key Indicators for the week of April 25 - 29
Forecasts at time of publication. Source: Bloomberg, Scotia Economics.
A3
Country Date Time Event Period BNS Consensus LatestUS 04/25 10:00 New Home Sales (MoM) MAR 10.0 12.0 -16.9US 04/25 10:00 New Home Sales (000s) MAR 275 280 250US 04/25 10:30 Dallas Fed Manf. Activity APR - - 12.7 11.5
MX 04/26 09:00 Retail Sales (INEGI) (YoY) FEB - - 3.2 3.0US 04/26 09:00 S&P/CS Composite-20 (YoY) FEB -3.0 -3.2 -3.1US 04/26 10:00 Consumer Confidence APR - - 64.4 63.4US 04/26 10:00 Richmond Fed Manufact. Index APR 20.0 20.0 20.0
US 04/27 07:00 MBA Mortgage Applications (WoW) 22-Apr - - -- 5.3US 04/27 08:30 Durable Goods Orders (MoM) MAR 3.0 2.0 -0.6US 04/27 08:30 Durables Ex Transportation (MoM) MAR 2.2 2.2 -0.3US 04/27 08:30 Cap Goods Orders Nondef Ex. Air (MoM) MAR - - -- -0.7MX 04/27 09:00 Global Economic Indicator IGAE (YoY) FEB - - 4.7 5.9MX 04/27 09:00 Trade Balance (USD mns) MAR P - - 432.9 274.7CA 04/27 09:00 Teranet/National Bank HPI (MoM) FEB 0.1 0.1 0.4US 04/27 12:30 FOMC Rate Decision 27-Apr 0.3 0.3 0.3
US 04/28 08:30 Chicago Fed Nat Activity Index MAR - - -- 0.0US 04/28 08:30 GDP (QoQ, Annualized) 1Q A 2.0 1.8 3.1US 04/28 08:30 Initial Jobless Claims (000s) 23-Apr 395 -- 403US 04/28 08:30 Continuing Claims (000s) 16-Apr 3680 -- 3695US 04/28 10:00 Pending Home Sales (MoM) MAR 1.3 1.5 2.1
CA 04/29 08:30 Gross Domestic Product (MoM) FEB 0.0 0.0 0.5US 04/29 08:30 Employment Cost Index 1Q - - 0.5 0.4US 04/29 08:30 PCE Core (MoM) MAR 0.1 0.1 0.2US 04/29 08:30 Personal Spending (MoM) MAR 0.4 0.5 0.7US 04/29 08:30 Personal Income (MoM) MAR 0.4 0.4 0.3US 04/29 09:45 Chicago Purchasing Manager Index APR - - 69.2 70.6US 04/29 09:55 U. of Michigan Confidence APR F - - 70.0 69.6US 04/29 10:00 Annual Revisions: Retail SalesMX 04/29 13:00 Central Bank Monetary Policy Minutes

Economics
2
Global Views
April 21, 2011
KEY INDICATORS
Europe
Key Indicators for the week of April 25 - 29
Forecasts at time of publication. Source: Bloomberg, Scotia Economics.
A4
Country Date Time Event Period BNS Consensus Latest
FR 04/22 02:45 Business Confidence Indicator APR - - 109 109IT 04/22 04:00 Retail Sales s.a. (MoM) FEB - - 0.2 -0.3
SP 04/25 03:00 Producer Prices (MoM) MAR - - -- 0.9SP 04/25 03:00 Producer Prices (YoY) MAR - - -- 7.6FR 04/25 12:00 Jobseekers- Net Change (000s) MAR - - -10.0 -2.1FR 04/25 12:00 Total Jobseekers (000s) MAR - - -- 2701.1
EC 04/26 05:00 Euro-Zone Govt Debt/GDP Ratio 2010 - - -- 79.2UK 04/26 06:00 CBI Business Optimism APR - - 10.0 7.0
GE 04/27 02:00 GfK Consumer Confidence Survey MAY - - 5.8 5.9FR 04/27 02:45 Consumer Confidence Indicator APR - - 83.0 83.0IT 04/27 04:00 Consumer Confidence Ind. sa APR - - 105.0 105.2UK 04/27 04:30 GDP (QoQ) 1Q A 0.6 0.5 -0.5
UK 04/27 04:30 BBA Loans for House Purchase MAR - - 30450 29923EC 04/27 05:00 Industrial New Orders NSA (YoY) FEB - - 21.7 21.9EC 04/27 05:00 Industrial New Orders SA (MoM) FEB - - 1.7 1.2
UK 04/27 19:01 GfK Consumer Confidence Survey APR - - -27.0 -28.0GE 04/27 Consumer Price Index (MoM) APR P - - 0.2 0.5GE 04/27 Consumer Price Index (YoY) APR P - - 2.4 2.1
GE 04/27 CPI - Brandenburg (MoM) APR - - -- 0.5GE 04/27 CPI - Brandenburg (YoY) APR - - -- 2.0GE 04/27 CPI - Bavaria (MoM) APR - - -- 0.5
GE 04/27 CPI - Bavaria (YoY) APR - - -- 2.1GE 04/27 CPI - Baden Wuerttemberg (MoM) APR - - -- 0.5GE 04/27 CPI - Baden Wuerttemberg (YoY) APR - - -- 2.1
GE 04/27 CPI - Hesse (MoM) APR - - -- 0.4GE 04/27 CPI - Hesse (YoY) APR - - -- 1.8GE 04/27 CPI - EU Harmonised (MoM) APR P 0.1 0.2 0.6
GE 04/27 CPI - EU Harmonised (YoY) APR P 2.5 2.6 2.3GE 04/27 CPI - North Rhine-West. (MoM) APR - - -- 0.5GE 04/27 CPI - North Rhine-West. (YoY) APR - - -- 2.0
GE 04/27 CPI - Saxony (MoM) APR - - -- 0.5GE 04/27 CPI - Saxony (YoY) APR - - -- 2.0
FR 04/28 02:45 Consumer Spending (MoM) MAR - - 0.2 0.9
SP 04/28 03:00 Mortgages on Houses (YoY) FEB - - -- -7.9GE 04/28 03:55 Unemployment Change (000's) APR - - -40.0 -55.0GE 04/28 03:55 Unemployment Rate (s.a) APR - - 7.0 7.1IT 04/28 04:00 Business Confidence APR - - 103.6 103.8
SP 04/28 Total Housing Permits (MoM) FEB - - -- -15.3
FR 04/29 02:45 Producer Prices (YoY) MAR - - 6.4 6.3SP 04/29 03:00 CPI (EU Harmonised) (YoY) APR P - - 3.4 3.3
SP 04/29 03:00 Retail Sales (Real) (YoY) MAR - - -- -4.8SP 04/29 03:00 Unemployment Rate (Survey) 1Q - - 20.7 20.3EC 04/29 04:00 Euro-Zone M3 s.a. (YoY) MAR - - 2.2 2.0
IT 04/29 04:00 Unemployment Rate (SA) MAR P - - -- 8.4EC 04/29 05:00 Euro-Zone CPI Estimate (YoY) APR 2.7 2.7 2.6EC 04/29 05:00 Euro-Zone Consumer Confidence APR F - - -11.4 -11.4
EC 04/29 05:00 Euro-Zone Unemployment Rate MAR 9.9 9.9 9.9IT 04/29 05:00 CPI - EU Harmonized (MoM) APR P - - 0.6 2.2IT 04/29 05:00 CPI - EU Harmonized (YoY) APR P 2.8 2.5 2.8
IT 04/29 06:00 PPI (MoM) MAR - - -- 0.6IT 04/29 06:00 PPI (YoY) MAR - - -- 5.7BP 04/29 Base Rate MAY - - -- 0.19
RU 04/29 Russia Refinancing Rate 29-Apr 8.25 -- 8.00SP 04/29 Current Account (€ bns) FEB - - -- -6.6
Economics
3
Global Views
April 21, 2011
KEY INDICATORS
Asia Pacific
Key Indicators for the week of April 25 - 29
Forecasts at time of publication. Source: Bloomberg, Scotia Economics.
A5
Latin America
Country Date Time Event Period BNS Consensus LatestTA 04/22 04:00 Unemployment Rate - sa MAR 4.3 4.5 4.6
VN APR 24-27 Exports YTD (YoY) APR - - -- 33.7VN APR 24-27 Imports YTD (YoY) APR - - -- 23.8VN APR 24-27 CPI (YoY) APR - - -- 13.9CH APR 24-28 Leading Index MAR - - -- 101.1PH APR 24-29 Budget Deficit/Surplus (PHP bns) MAR - - -- -21.5
SI 04/25 01:00 CPI (YoY) MAR - - 5.1 5.0TA 04/25 04:00 Industrial Production (YoY) MAR - - 10.8 13.3SK 04/25 17:00 SK Consumer Confidence APR - - -- 98.0VN APR 25-29 Industrial Output YTD (YoY) APR - - -- 14.1VN APR 25-29 Retail Sales YTD (YoY) APR - - -- 22.6
SI 04/26 01:00 Industrial Production SA (MoM) MAR - - 22.6 -2.0SK 04/26 17:00 Business Survey- Manufacturing MAY - - -- 95.0SK 04/26 17:00 Business Survey- Non-Manufacturing MAY - - -- 83.0SK 04/26 19:00 GDP at Constant Price (QoQ) 1Q P - - 1.8 0.5JN 04/26 19:50 Retail Trade SA (MoM) MAR - - -6.0 0.8PH 04/26 21:00 Trade Balance (USD mns) FEB - - -- -1312.0AU 04/26 21:30 Consumer Prices (QoQ) 1Q 1.0 1.2 0.4AU 04/26 21:30 Consumer Prices (YoY) 1Q 2.9 3.0 2.7AU 04/26 21:30 RBA Trimmed Mean (QoQ) 1Q - - 0.7 0.3AU 04/26 21:30 RBA Trimmed Mean (YoY) 1Q - - 2.1 2.2CH 04/26 22:00 Industrial Profits YTD (YoY) MAR - - -- 49.4
NZ 04/27 17:00 RBNZ Official Cash Rate 28-Apr 2.50 2.50 2.50SK 04/27 19:00 Current Account (USD mns) MAR - - -- 1178.0SK 04/27 19:00 Goods Balance (USD mns) MAR - - -- 1583.0JN 04/27 19:15 Markit/JMMA Manufacturing PMI APR - - -- 46.4JN 04/27 19:30 Overall Hhold Spending (YoY) MAR - - -8.0 -0.2JN 04/27 19:30 Jobless Rate MAR - - 4.8 4.6JN 04/27 19:30 Natl CPI (YoY) MAR - - 0.0 0.0JN 04/27 19:30 Natl CPI Ex Food, Energy (YoY) MAR - - -0.6 -0.6JN 04/27 19:50 Industrial Production (MoM) MAR P - - -11.1 1.8JN APR 27-28 BOJ Target Rate 28-Apr 0.10 0.10 0.10
JN 04/28 00:00 Vehicle Production (YoY) MAR - - -- -5.5JN 04/28 01:00 Housing Starts (YoY) MAR - - 0.4 10.1JN 04/28 01:00 Construction Orders (YoY) MAR - - -- 19.5TH 04/28 03:00 Mfg. Production Index ISIC (SA) MAR - - -- 188.5HK 04/28 04:30 Trade Balance (HKD mns) MAR - - -39.8 -25.1NZ 04/28 18:45 Trade Balance (NZD mns) MAR - - 200.0 194.0SK 04/28 19:00 Industrial Production (MoM) MAR - - -- -2.3SK 04/28 19:00 Leading Index (YoY) MAR - - -- 2.4AU 04/28 21:30 Private Sector Credit (MoM) MAR - - 0.4 0.5SI 04/28 22:00 Unemployment Rate (sa) 1Q P - - 2.0 2.2
TH 04/29 03:30 Business Sentiment Index MAR - - -- 52.3TH 04/29 03:30 Current Account Balance (USD mns) MAR - - -- 3823TH 04/29 03:30 Total Trade Balance (USD mns) MAR - - -- 2031TA 04/29 05:00 GDP - Constant Prices (YoY) 1Q P - - 5.0 6.9HK 04/29 05:00 Govt Mthly Budget Surp/Def (HKD bns) MAR - - -- -9.5
Country Date Time Event Period BNS Consensus LatestBZ 04/25 07:30 Central Bank Weekly Economists Survey
BZ 04/26 09:30 Current Account - Monthly (USD mns) MAR - - -4900 -3391BZ 04/26 09:30 Foreign Investment (USD mns) MAR - - 4950 7727
BZ 04/28 07:00 FGV Inflation IGP-M (MoM) APR - - 0.6 0.6BZ 04/28 07:00 FGV Inflation IGP-M (YoY) APR - - 10.7 11.0BZ 04/28 07:30 COPOM Monetary Policy Meeting MinutesCL 04/28 08:00 Industrial Production (YoY) MAR - - 22.5 1.9CL 04/28 08:00 Industrial Sales (YoY) MAR - - -- 3.8CL 04/28 08:00 Copper Production Total (volume) MAR - - -- 368243CL 04/28 08:00 Retail Sales (YoY) MAR - - -- 16.8BZ 04/28 Central Govt Budget (BRL bns) MAR - - 8.4 2.6
CL 04/29 08:00 Unemployment Rate MAR - - 7.4 7.3BZ 04/29 09:30 Net Debt (% of GDP) MAR - - 39.9 39.9CO 04/29 12:00 Urban Unemployment Rate MAR - - 12.2 13.2CO 04/29 Overnight Lending Rate 29-Apr 3.75 3.75 3.50
Economics
4
Global Views
April 21, 2011
AUCTIONS
North America
Europe
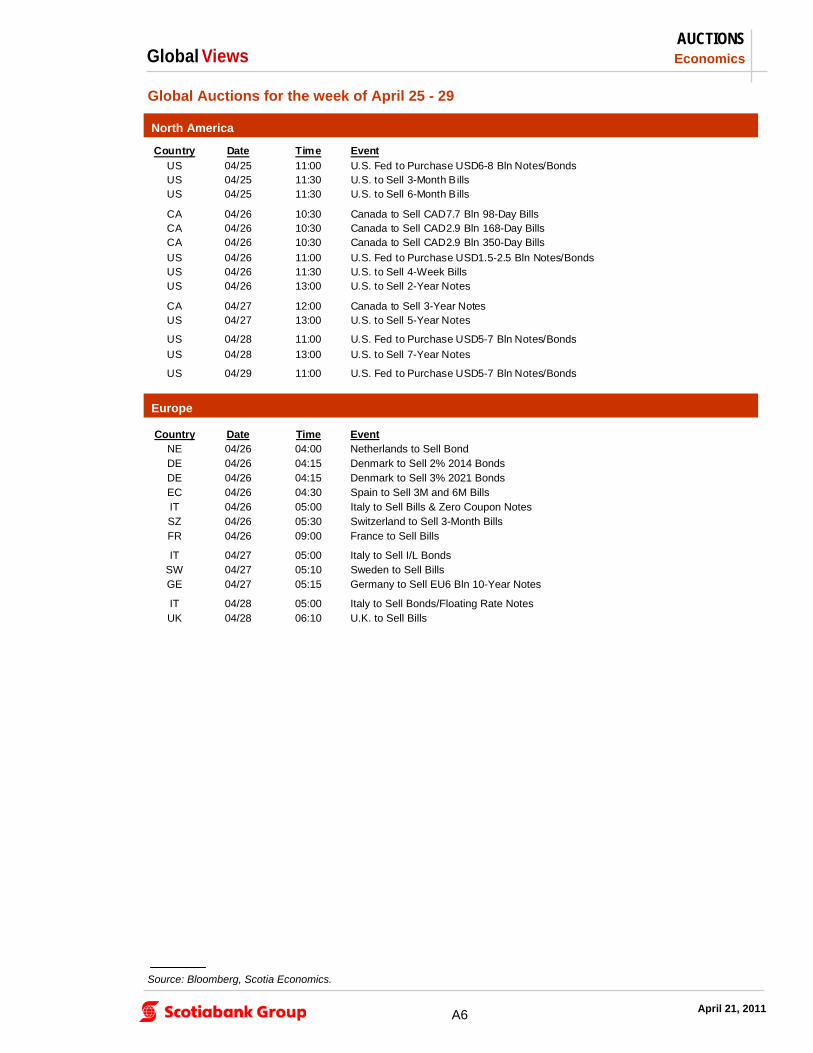
Global Auctions for the week of April 25 - 29
Source: Bloomberg, Scotia Economics.
A6
Country Date Time Event
US 04/25 11:00 U.S. Fed to Purchase USD6-8 Bln Notes/BondsUS 04/25 11:30 U.S. to Sell 3-Month B illsUS 04/25 11:30 U.S. to Sell 6-Month B ills
CA 04/26 10:30 Canada to Sell CAD7.7 Bln 98-Day BillsCA 04/26 10:30 Canada to Sell CAD2.9 Bln 168-Day BillsCA 04/26 10:30 Canada to Sell CAD2.9 Bln 350-Day Bills
US 04/26 11:00 U.S. Fed to Purchase USD1.5-2.5 Bln Notes/BondsUS 04/26 11:30 U.S. to Sell 4-Week BillsUS 04/26 13:00 U.S. to Sell 2-Year Notes
CA 04/27 12:00 Canada to Sell 3-Year NotesUS 04/27 13:00 U.S. to Sell 5-Year Notes
US 04/28 11:00 U.S. Fed to Purchase USD5-7 Bln Notes/Bonds
US 04/28 13:00 U.S. to Sell 7-Year Notes
US 04/29 11:00 U.S. Fed to Purchase USD5-7 Bln Notes/Bonds
Country Date Time EventNE 04/26 04:00 Netherlands to Sell BondDE 04/26 04:15 Denmark to Sell 2% 2014 BondsDE 04/26 04:15 Denmark to Sell 3% 2021 BondsEC 04/26 04:30 Spain to Sell 3M and 6M BillsIT 04/26 05:00 Italy to Sell Bills & Zero Coupon NotesSZ 04/26 05:30 Switzerland to Sell 3-Month BillsFR 04/26 09:00 France to Sell Bills
IT 04/27 05:00 Italy to Sell I/L BondsSW 04/27 05:10 Sweden to Sell BillsGE 04/27 05:15 Germany to Sell EU6 Bln 10-Year Notes
IT 04/28 05:00 Italy to Sell Bonds/Floating Rate NotesUK 04/28 06:10 U.K. to Sell Bills
Economics
5
Global Views
April 21, 2011
AUCTIONS
Asia Pacific
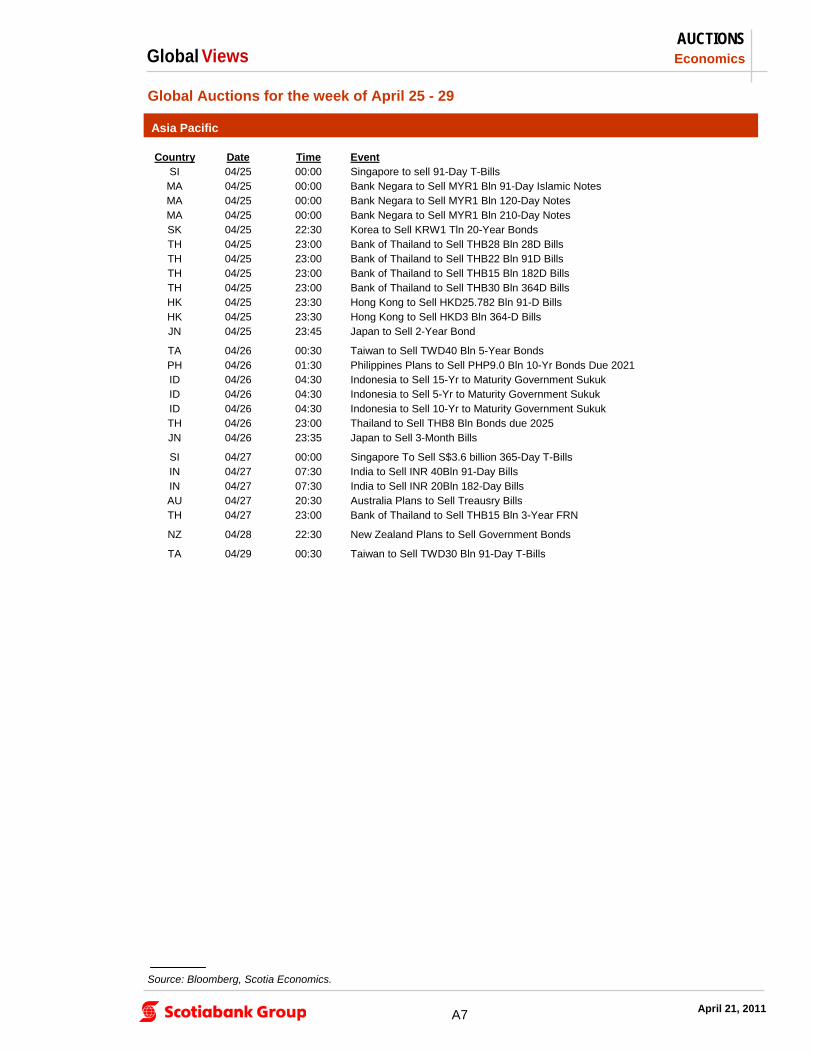
Global Auctions for the week of April 25 - 29
Source: Bloomberg, Scotia Economics.
A7
Country Date Time EventSI 04/25 00:00 Singapore to sell 91-Day T-BillsMA 04/25 00:00 Bank Negara to Sell MYR1 Bln 91-Day Islamic Notes MA 04/25 00:00 Bank Negara to Sell MYR1 Bln 120-Day Notes MA 04/25 00:00 Bank Negara to Sell MYR1 Bln 210-Day Notes SK 04/25 22:30 Korea to Sell KRW1 Tln 20-Year BondsTH 04/25 23:00 Bank of Thailand to Sell THB28 Bln 28D BillsTH 04/25 23:00 Bank of Thailand to Sell THB22 Bln 91D BillsTH 04/25 23:00 Bank of Thailand to Sell THB15 Bln 182D BillsTH 04/25 23:00 Bank of Thailand to Sell THB30 Bln 364D BillsHK 04/25 23:30 Hong Kong to Sell HKD25.782 Bln 91-D BillsHK 04/25 23:30 Hong Kong to Sell HKD3 Bln 364-D BillsJN 04/25 23:45 Japan to Sell 2-Year Bond
TA 04/26 00:30 Taiwan to Sell TWD40 Bln 5-Year BondsPH 04/26 01:30 Philippines Plans to Sell PHP9.0 Bln 10-Yr Bonds Due 2021ID 04/26 04:30 Indonesia to Sell 15-Yr to Maturity Government SukukID 04/26 04:30 Indonesia to Sell 5-Yr to Maturity Government SukukID 04/26 04:30 Indonesia to Sell 10-Yr to Maturity Government SukukTH 04/26 23:00 Thailand to Sell THB8 Bln Bonds due 2025JN 04/26 23:35 Japan to Sell 3-Month Bills
SI 04/27 00:00 Singapore To Sell S$3.6 billion 365-Day T-BillsIN 04/27 07:30 India to Sell INR 40Bln 91-Day BillsIN 04/27 07:30 India to Sell INR 20Bln 182-Day BillsAU 04/27 20:30 Australia Plans to Sell Treausry BillsTH 04/27 23:00 Bank of Thailand to Sell THB15 Bln 3-Year FRN
NZ 04/28 22:30 New Zealand Plans to Sell Government Bonds
TA 04/29 00:30 Taiwan to Sell TWD30 Bln 91-Day T-Bills

Economics
6
Global Views
April 21, 2011
EVENTS
Country Date Time EventIT 04/26 06:30 Berlusconi, Sarkozy Press Conferece at Villa Madama, RomeEC 04/26 08:00 ECB's Gonzalez-Paramo Speaks in Cordoba, Spain
EC 04/27 04:00 ECB's Orphanides presents Annual Report 2010 on EconomyEC 04/27 EU's Rehn Gives Speech at Finland's Parliament
HU 04/28 06:30 Hungary Economy State Secretary Csefalvay SpeaksLX 04/28 ECB's Mersch Speaks At Event in Luxembourg
EC 04/29 02:00 EU's Vimont Speaks at European Policy CentreBP 04/29 Base RateRU 04/29 Refinancing Rate
Source: Bloomberg, Scotia Economics.
Events for the week of April 25 - 29
North America
Europe
A8
Country Date Time EventUS 04/27 12:30 FOMC Rate DecisionUS 04/27 14:15 Bernanke Speaks at Fed Press Conference
US 04/28 08:30 Fed's Williams Speaks at Community Affairs Conference
US 04/29 12:30 Bernanke Speaks at Fed Community-Affairs Conference
Country Date Time EventNZ 04/27 17:00 RBNZ Official Cash RateJN APR 27-28 BOJ Target Rate
Asia Pacific
Country Date Time EventCO 04/29 Overnight Lending Rate
Latin America
Economics
7
Global Views
April 21, 2011
NORTH AMERICARate Current Rate Next Meeting Scotia's Forecasts Consensus ForecastsBank of Canada – Overnight Target Rate 1.00 May 31, 2011 1.00 --
Federal Reserve – Federal Funds Target Rate 0.25 April 27, 2011 0.25 0.25
Banco de México – Overnight Rate 4.50 May 27, 2011 4.50 --
EUROPERate Current Rate Next Meeting Scotia's Forecasts Consensus ForecastsEuropean Central Bank – Refinancing Rate 1.25 May 5, 2011 1.25 1.25
Bank of England – Bank Rate 0.50 May 5, 2011 0.50 0.50
Swiss National Bank – Libor Target Rate 0.25 June 16, 2011 0.25 --
Central Bank of Russia – Refinancing Rate 8.00 April 29, 2011 8.25 --
Hungarian National Bank – Base Rate 6.00 May 16, 2011 6.00 --
Central Bank of the Republic of Turkey –1 Week Repo Rate
6.25 May 25, 2011 6.25 --
ASIA PACIFICRate Current Rate Next Meeting Scotia's Forecasts Consensus ForecastsBank of Japan – Target Rate 0.10 April 28, 2011 0.10 0.10
Reserve Bank of Australia – Cash Target Rate 4.75 May 3, 2011 4.75 4.75
Reserve Bank of New Zealand – Cash Rate 2.50 April 27, 2011 2.50 2.50
People's Bank of China – Lending Rate 6.31 TBA -- --
Reserve Bank of India – Repo Rate 6.75 May 3, 2011 -- --
Hong Kong Monetary Authority – Base Rate 0.50 TBA 0.50 --
Central Bank of China Taiwan – Discount Rate 1.75 June 24, 2011 1.75 --
Bank Negara Malaysia – Overnight Policy Rate 2.75 May 5, 2011 2.75 --
Bank of Korea – Bank Rate 3.00 May 12, 2011 3.00 --
Bank of Thailand – Repo Rate 2.75 June 1, 2011 2.50 --
Bank Indonesia – Reference Interest Rate 6.75 May 12, 2011 6.75 --
LATIN AMERICARate Current Rate Next Meeting Scotia's Forecasts Consensus ForecastsBanco Central do Brasil – Selic Rate 12.00 June 8, 2011 12.25 --
Banco Central de Chile – Overnight Rate 4.50 May 12, 2011 4.75 --
Banco de la República de Colombia – Lending Rate 3.50 April 29, 2011 3.75 3.75
Banco Central de Reserva del Perú – Reference Rate 4.00 May 12, 2011 4.25 --
AFRICARate Current Rate Next Meeting Scotia's Forecasts Consensus ForecastsSouth African Reserve Bank – Repo Rate 5.50 May 12, 2011 5.50 --
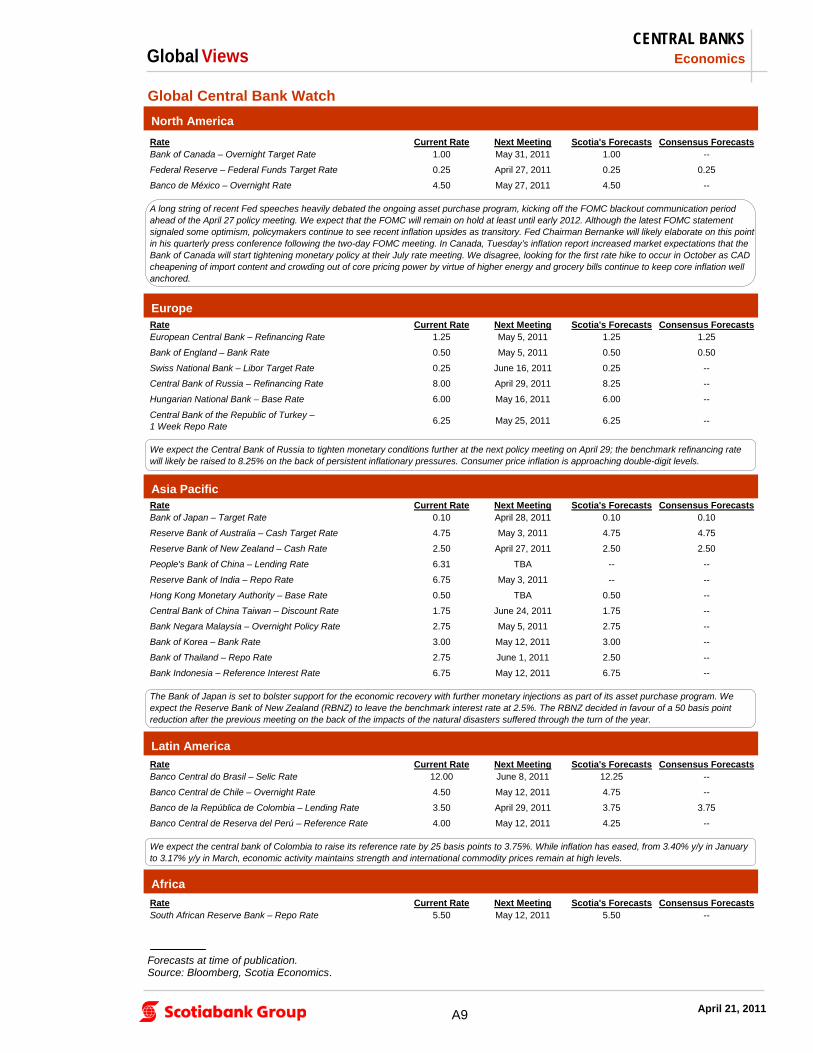
A long string of recent Fed speeches heavily debated the ongoing asset purchase program, kicking off the FOMC blackout communication period ahead of the April 27 policy meeting. We expect that the FOMC will remain on hold at least until early 2012. Although the latest FOMC statement signaled some optimism, policymakers continue to see recent inflation upsides as transitory. Fed Chairman Bernanke will likely elaborate on this point in his quarterly press conference following the two-day FOMC meeting. In Canada, Tuesday’s inflation report increased market expectations that the Bank of Canada will start tightening monetary policy at their July rate meeting. We disagree, looking for the first rate hike to occur in October as CAD cheapening of import content and crowding out of core pricing power by virtue of higher energy and grocery bills continue to keep core inflation well anchored.
We expect the Central Bank of Russia to tighten monetary conditions further at the next policy meeting on April 29; the benchmark refinancing rate will likely be raised to 8.25% on the back of persistent inflationary pressures. Consumer price inflation is approaching double-digit levels.
The Bank of Japan is set to bolster support for the economic recovery with further monetary injections as part of its asset purchase program. We expect the Reserve Bank of New Zealand (RBNZ) to leave the benchmark interest rate at 2.5%. The RBNZ decided in favour of a 50 basis point reduction after the previous meeting on the back of the impacts of the natural disasters suffered through the turn of the year.
We expect the central bank of Colombia to raise its reference rate by 25 basis points to 3.75%. While inflation has eased, from 3.40% y/y in January to 3.17% y/y in March, economic activity maintains strength and international commodity prices remain at high levels.
Global Central Bank Watch
North America
Europe
Asia Pacific
CENTRAL BANKS
A9
Forecasts at time of publication. Source: Bloomberg, Scotia Economics.
Latin America
Africa
Economics
8
Global Views
April 21, 2011
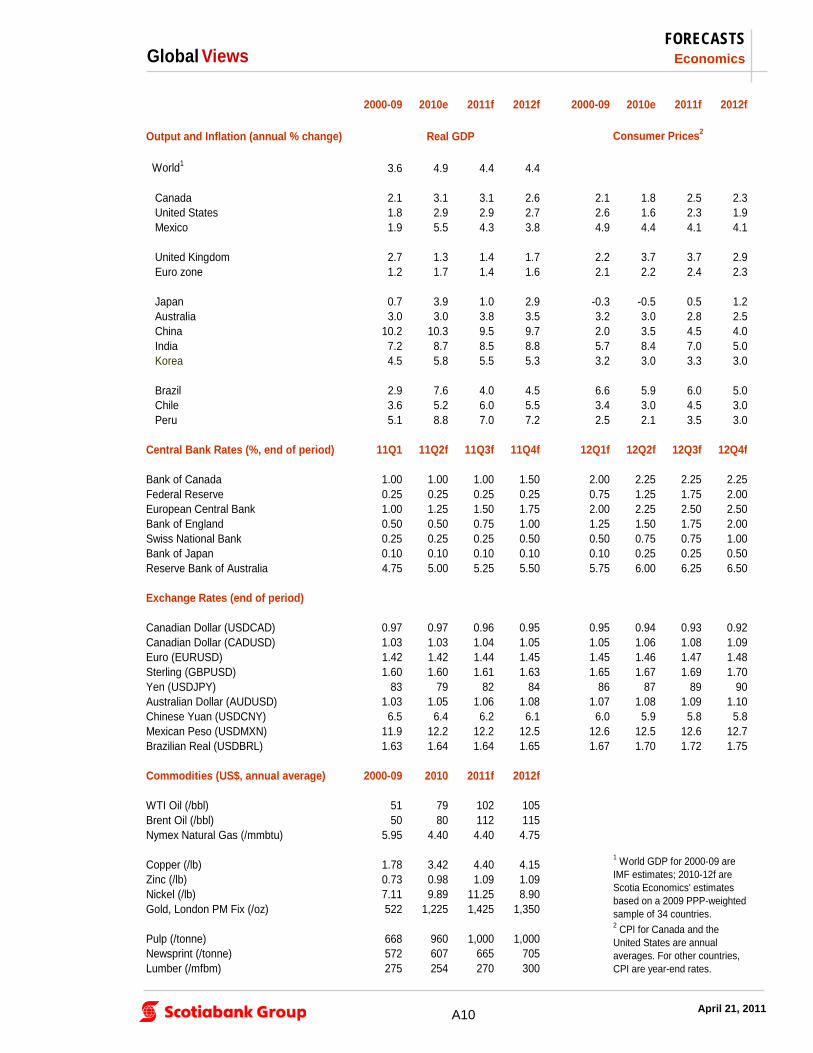
FORECASTS
2000-09 2010e 2011f 2012f 2000-09 2010e 2011f 2012f
Output and Inflation (annual % change) Real GDP Consumer Prices2
World1 3.6 4.9 4.4 4.4
Canada 2.1 3.1 3.1 2.6 2.1 1.8 2.5 2.3 United States 1.8 2.9 2.9 2.7 2.6 1.6 2.3 1.9 Mexico 1.9 5.5 4.3 3.8 4.9 4.4 4.1 4.1
United Kingdom 2.7 1.3 1.4 1.7 2.2 3.7 3.7 2.9 Euro zone 1.2 1.7 1.4 1.6 2.1 2.2 2.4 2.3
Japan 0.7 3.9 1.0 2.9 -0.3 -0.5 0.5 1.2 Australia 3.0 3.0 3.8 3.5 3.2 3.0 2.8 2.5 China 10.2 10.3 9.5 9.7 2.0 3.5 4.5 4.0 India 7.2 8.7 8.5 8.8 5.7 8.4 7.0 5.0 Korea 4.5 5.8 5.5 5.3 3.2 3.0 3.3 3.0
Brazil 2.9 7.6 4.0 4.5 6.6 5.9 6.0 5.0 Chile 3.6 5.2 6.0 5.5 3.4 3.0 4.5 3.0 Peru 5.1 8.8 7.0 7.2 2.5 2.1 3.5 3.0
Central Bank Rates (%, end of period) 11Q1 11Q2f 11Q3f 11Q4f 12Q1f 12Q2f 12Q3f 12Q4f
Bank of Canada 1.00 1.00 1.00 1.50 2.00 2.25 2.25 2.25Federal Reserve 0.25 0.25 0.25 0.25 0.75 1.25 1.75 2.00European Central Bank 1.00 1.25 1.50 1.75 2.00 2.25 2.50 2.50Bank of England 0.50 0.50 0.75 1.00 1.25 1.50 1.75 2.00Swiss National Bank 0.25 0.25 0.25 0.50 0.50 0.75 0.75 1.00Bank of Japan 0.10 0.10 0.10 0.10 0.10 0.25 0.25 0.50Reserve Bank of Australia 4.75 5.00 5.25 5.50 5.75 6.00 6.25 6.50
Exchange Rates (end of period)
Canadian Dollar (USDCAD) 0.97 0.97 0.96 0.95 0.95 0.94 0.93 0.92Canadian Dollar (CADUSD) 1.03 1.03 1.04 1.05 1.05 1.06 1.08 1.09Euro (EURUSD) 1.42 1.42 1.44 1.45 1.45 1.46 1.47 1.48Sterling (GBPUSD) 1.60 1.60 1.61 1.63 1.65 1.67 1.69 1.70Yen (USDJPY) 83 79 82 84 86 87 89 90Australian Dollar (AUDUSD) 1.03 1.05 1.06 1.08 1.07 1.08 1.09 1.10Chinese Yuan (USDCNY) 6.5 6.4 6.2 6.1 6.0 5.9 5.8 5.8Mexican Peso (USDMXN) 11.9 12.2 12.2 12.5 12.6 12.5 12.6 12.7Brazilian Real (USDBRL) 1.63 1.64 1.64 1.65 1.67 1.70 1.72 1.75
Commodities (US$, annual average) 2000-09 2010 2011f 2012f
WTI Oil (/bbl) 51 79 102 105Brent Oil (/bbl) 50 80 112 115Nymex Natural Gas (/mmbtu) 5.95 4.40 4.40 4.75
Copper (/lb) 1.78 3.42 4.40 4.15Zinc (/lb) 0.73 0.98 1.09 1.09Nickel (/lb) 7.11 9.89 11.25 8.90Gold, London PM Fix (/oz) 522 1,225 1,425 1,350
Pulp (/tonne) 668 960 1,000 1,000Newsprint (/tonne) 572 607 665 705Lumber (/mfbm) 275 254 270 300
1 World GDP for 2000-09 are IMF estimates; 2010-12f are Scotia Economics' estimates based on a 2009 PPP-weighted sample of 34 countries. 2 CPI for Canada and the United States are annual averages. For other countries, CPI are year-end rates.
A10
Economics
9
Global Views
April 21, 2011
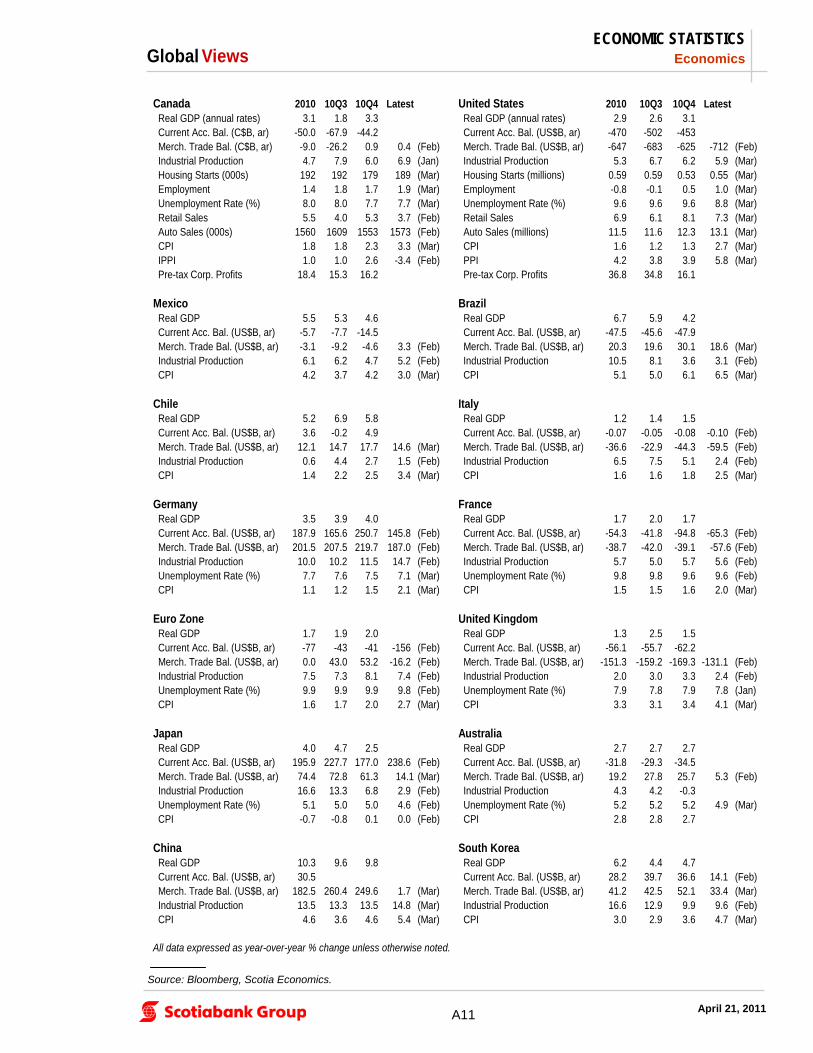
ECONOMIC STATISTICS
Source: Bloomberg, Scotia Economics.
Canada 2010 10Q3 10Q4 Latest United States 2010 10Q3 10Q4 Latest Real GDP (annual rates) 3.1 1.8 3.3 Real GDP (annual rates) 2.9 2.6 3.1 Current Acc. Bal. (C$B, ar) -50.0 -67.9 -44.2 Current Acc. Bal. (US$B, ar) -470 -502 -453 Merch. Trade Bal. (C$B, ar) -9.0 -26.2 0.9 0.4 (Feb) Merch. Trade Bal. (US$B, ar) -647 -683 -625 -712 (Feb) Industrial Production 4.7 7.9 6.0 6.9 (Jan) Industrial Production 5.3 6.7 6.2 5.9 (Mar) Housing Starts (000s) 192 192 179 189 (Mar) Housing Starts (millions) 0.59 0.59 0.53 0.55 (Mar) Employment 1.4 1.8 1.7 1.9 (Mar) Employment -0.8 -0.1 0.5 1.0 (Mar) Unemployment Rate (%) 8.0 8.0 7.7 7.7 (Mar) Unemployment Rate (%) 9.6 9.6 9.6 8.8 (Mar) Retail Sales 5.5 4.0 5.3 3.7 (Feb) Retail Sales 6.9 6.1 8.1 7.3 (Mar) Auto Sales (000s) 1560 1609 1553 1573 (Feb) Auto Sales (millions) 11.5 11.6 12.3 13.1 (Mar) CPI 1.8 1.8 2.3 3.3 (Mar) CPI 1.6 1.2 1.3 2.7 (Mar) IPPI 1.0 1.0 2.6 -3.4 (Feb) PPI 4.2 3.8 3.9 5.8 (Mar) Pre-tax Corp. Profits 18.4 15.3 16.2 Pre-tax Corp. Profits 36.8 34.8 16.1
Mexico Brazil Real GDP 5.5 5.3 4.6 Real GDP 6.7 5.9 4.2 Current Acc. Bal. (US$B, ar) -5.7 -7.7 -14.5 Current Acc. Bal. (US$B, ar) -47.5 -45.6 -47.9 Merch. Trade Bal. (US$B, ar) -3.1 -9.2 -4.6 3.3 (Feb) Merch. Trade Bal. (US$B, ar) 20.3 19.6 30.1 18.6 (Mar) Industrial Production 6.1 6.2 4.7 5.2 (Feb) Industrial Production 10.5 8.1 3.6 3.1 (Feb) CPI 4.2 3.7 4.2 3.0 (Mar) CPI 5.1 5.0 6.1 6.5 (Mar)
Chile Italy Real GDP 5.2 6.9 5.8 Real GDP 1.2 1.4 1.5 Current Acc. Bal. (US$B, ar) 3.6 -0.2 4.9 Current Acc. Bal. (US$B, ar) -0.07 -0.05 -0.08 -0.10 (Feb) Merch. Trade Bal. (US$B, ar) 12.1 14.7 17.7 14.6 (Mar) Merch. Trade Bal. (US$B, ar) -36.6 -22.9 -44.3 -59.5 (Feb) Industrial Production 0.6 4.4 2.7 1.5 (Feb) Industrial Production 6.5 7.5 5.1 2.4 (Feb) CPI 1.4 2.2 2.5 3.4 (Mar) CPI 1.6 1.6 1.8 2.5 (Mar)
Germany France Real GDP 3.5 3.9 4.0 Real GDP 1.7 2.0 1.7 Current Acc. Bal. (US$B, ar) 187.9 165.6 250.7 145.8 (Feb) Current Acc. Bal. (US$B, ar) -54.3 -41.8 -94.8 -65.3 (Feb) Merch. Trade Bal. (US$B, ar) 201.5 207.5 219.7 187.0 (Feb) Merch. Trade Bal. (US$B, ar) -38.7 -42.0 -39.1 -57.6 (Feb) Industrial Production 10.0 10.2 11.5 14.7 (Feb) Industrial Production 5.7 5.0 5.7 5.6 (Feb) Unemployment Rate (%) 7.7 7.6 7.5 7.1 (Mar) Unemployment Rate (%) 9.8 9.8 9.6 9.6 (Feb) CPI 1.1 1.2 1.5 2.1 (Mar) CPI 1.5 1.5 1.6 2.0 (Mar)
Euro Zone United Kingdom Real GDP 1.7 1.9 2.0 Real GDP 1.3 2.5 1.5 Current Acc. Bal. (US$B, ar) -77 -43 -41 -156 (Feb) Current Acc. Bal. (US$B, ar) -56.1 -55.7 -62.2 Merch. Trade Bal. (US$B, ar) 0.0 43.0 53.2 -16.2 (Feb) Merch. Trade Bal. (US$B, ar) -151.3 -159.2 -169.3 -131.1 (Feb) Industrial Production 7.5 7.3 8.1 7.4 (Feb) Industrial Production 2.0 3.0 3.3 2.4 (Feb) Unemployment Rate (%) 9.9 9.9 9.9 9.8 (Feb) Unemployment Rate (%) 7.9 7.8 7.9 7.8 (Jan) CPI 1.6 1.7 2.0 2.7 (Mar) CPI 3.3 3.1 3.4 4.1 (Mar)
Japan Australia Real GDP 4.0 4.7 2.5 Real GDP 2.7 2.7 2.7 Current Acc. Bal. (US$B, ar) 195.9 227.7 177.0 238.6 (Feb) Current Acc. Bal. (US$B, ar) -31.8 -29.3 -34.5 Merch. Trade Bal. (US$B, ar) 74.4 72.8 61.3 14.1 (Mar) Merch. Trade Bal. (US$B, ar) 19.2 27.8 25.7 5.3 (Feb) Industrial Production 16.6 13.3 6.8 2.9 (Feb) Industrial Production 4.3 4.2 -0.3 Unemployment Rate (%) 5.1 5.0 5.0 4.6 (Feb) Unemployment Rate (%) 5.2 5.2 5.2 4.9 (Mar) CPI -0.7 -0.8 0.1 0.0 (Feb) CPI 2.8 2.8 2.7
China South Korea Real GDP 10.3 9.6 9.8 Real GDP 6.2 4.4 4.7 Current Acc. Bal. (US$B, ar) 30.5 Current Acc. Bal. (US$B, ar) 28.2 39.7 36.6 14.1 (Feb) Merch. Trade Bal. (US$B, ar) 182.5 260.4 249.6 1.7 (Mar) Merch. Trade Bal. (US$B, ar) 41.2 42.5 52.1 33.4 (Mar) Industrial Production 13.5 13.3 13.5 14.8 (Mar) Industrial Production 16.6 12.9 9.9 9.6 (Feb) CPI 4.6 3.6 4.6 5.4 (Mar) CPI 3.0 2.9 3.6 4.7 (Mar)
All data expressed as year-over-year % change unless otherwise noted.
A11

Economics
10
Global Views
April 21, 2011
FINANCIAL STATISTICS
* Latest observation taken at time of writing. Source: Bloomberg, Scotia Economics.
Interest Rates (%, end of period)
Canada 10Q4 11Q1 Apr/14 Apr/21* United States 10Q4 11Q1 Apr/14 Apr/21*BoC Overnight Rate 1.00 1.00 1.00 1.00 Fed Funds Target Rate 0.25 0.25 0.25 0.25 3-mo. T-bill 1.05 0.96 0.94 0.89 3-mo. T-bill 0.12 0.09 0.07 0.05 10-yr Gov’t Bond 3.12 3.35 3.37 3.29 10-yr Gov’t Bond 3.29 3.47 3.50 3.38 30-yr Gov’t Bond 3.53 3.76 3.78 3.74 30-yr Gov’t Bond 4.33 4.51 4.55 4.45 Prime 3.00 3.00 3.00 3.00 Prime 3.25 3.25 3.25 3.25 FX Reserves (US$B) 59.4 57.0 60.2 (Feb) FX Reserves (US$B) 122.1 121.4 123.6 (Feb)
Germany France 3-mo. Interbank 0.96 1.26 1.31 1.21 3-mo. T-bill 0.40 0.80 0.89 0.99 10-yr Gov’t Bond 2.96 3.35 3.43 3.27 10-yr Gov’t Bond 3.36 3.71 3.74 3.61 FX Reserves (US$B) 62.4 62.3 63.0 (Feb) FX Reserves (US$B) 52.2 55.8 58.4 (Feb)
Euro-Zone United Kingdom Refinancing Rate 1.00 1.00 1.25 1.25 Repo Rate 0.50 0.50 0.50 0.50 Overnight Rate 0.82 0.90 1.14 1.22 3-mo. T-bill 4.85 4.85 4.85 4.85 FX Reserves (US$B) 300.1 300.3 308.9 (Feb) 10-yr Gov’t Bond 3.40 3.69 3.69 3.54
FX Reserves (US$B) 67.2 68.3 73.5 (Feb)
Japan Australia Discount Rate 0.30 0.30 0.30 0.30 Cash Rate 4.75 4.75 4.75 4.75 3-mo. Libor 0.13 0.14 0.14 0.14 10-yr Gov’t Bond 5.55 5.49 5.60 5.51 10-yr Gov’t Bond 1.13 1.26 1.30 1.24 FX Reserves (US$B) 38.1 38.7 36.9 (Feb) FX Reserves (US$B) 1077.4 1061.5 1056.8 (Feb)
Exchange Rates (end of period)
USDCAD 1.00 0.97 0.96 0.95 ¥/US$ 81.16 83.13 83.50 81.70CADUSD 1.00 1.03 1.04 1.05 US¢/Australian$ 102.33 103.29 105.44 107.42GBPUSD 1.561 1.603 1.635 1.655 Chinese Yuan/US$ 6.59 6.55 6.53 6.49EURUSD 1.339 1.416 1.449 1.457 South Korean Won/US$ 1125 1100 1086 1081JPYEUR 0.92 0.85 0.83 0.84 Mexican Peso/US$ 12.360 11.906 11.713 11.607USDCHF 0.93 0.92 0.89 0.88 Brazilian Real/US$ 1.660 1.632 1.578 1.567
Equity Markets (index, end of period)
United States (DJIA) 11578 12320 12285 12474 U.K. (FT100) 5900 5909 5964 6016 United States (S&P500) 1258 1326 1315 1335 Germany (Dax) 6914 7041 7147 7291 Canada (S&P/TSX) 13443 14116 13822 13935 France (CAC40) 3805 3989 3970 4023 Mexico (Bolsa) 38551 37441 37348 36816 Japan (Nikkei) 10229 9755 9654 9686 Brazil (Bovespa) 69305 68587 66486 67058 Hong Kong (Hang Seng) 23035 23528 24014 24138 Italy (BCI) 1048 1120 1134 1111 South Korea (Composite) 2051 2107 2141 2199
Commodity Prices (end of period)
Pulp (US$/tonne) 960 990 990 990 Copper (US$/lb) 4.42 4.26 4.23 4.36 Newsprint (US$/tonne) 640 640 640 640 Zinc (US$/lb) 1.10 1.05 1.08 1.06 Lumber (US$/mfbm) 308 290 262 -- Gold (US$/oz) 1405.50 1439.00 1465.75 1504.00 WTI Oil (US$/bbl) 91.38 106.72 108.11 111.34 Silver (US$/oz) 30.63 37.87 40.67 46.26 Natural Gas (US$/mmbtu) 4.41 4.39 4.21 4.34 CRB (index) 332.80 359.43 360.66 365.26
A12

This report has been prepared by SCOTIA CAPITAL INC. Opinions, estimates and projections contained herein are our own as of the date hereof and are subject to change without notice. The information and opinions contained herein have been compiled or arrived at from sources believed reliable but no representation or warranty, express or implied, is made as to their accuracy or completeness. Neither Scotia Capital Inc., nor its affiliates accept liability whatsoever for any loss arising from any use of this report or its contents. This report is not, and is not to be construed as, an offer to sell or solicitation of an offer to buy any securities and/or commodity futures contracts. Scotia Capital Inc., its affiliates and/or their respective officers, directors or employees may from time to time acquire, hold or sell securities and/or commodities and/or commodity futures contracts mentioned herein as principal or agent. This report may not be reproduced in whole or in part, or referred to in any manner whatsoever, nor may the information, opinions, and conclusions contained in it be referred to without in each case the prior express consent of Scotia Capital. SCI is authorized and regulated by The Financial Services Authority. U.S. residents: Scotia Capital (USA) Inc., a wholly owned subsidiary of Scotia Capital Inc., accepts responsibility for the contents herein, subject to the terms and limitations set out above. Any U.S. person wishing further information or to effect transactions in any security discussed herein should contact Scotia Capital (USA) Inc. at 212-225-6500. Each research analyst named in this report or any subsection of this report certifies that (1) the views expressed in this report in connection with securities or issuers that he or she analyzes accurately reflect his or her personal views; and (2) no part of his or her compensation was, is, or will be directly or indirectly, related to the specific recommendations or views expressed by him or her in this report. The Research Analyst's compensation is based on various performance and market criteria and is charged as an expense to certain departments of Scotia Capital Inc., including investment banking. Scotia Capital Inc. and/or its affiliates: expects to receive or intends to seek compensation for investment banking services from issuers covered in this report within the next three months; and has or seeks a business relationship with the issuers referred to herein which involves providing services, other than securities underwriting or advisory services, for which compensation is or may be received. These may include services relating to lending, cash management, foreign exchange, securities trading, derivatives, structured finance or precious metals.
Economics Global Views
Scotia Economics
Scotia Plaza 40 King Street West, 63rd Floor
Toronto, Ontario Canada M5H 1H1
Tel: (416) 866-6253 Fax: (416) 866-2829
Email: [email protected]
For general and publication-related inquiries, contact
us by telephone, email and/or fax.
DISCLAIMER