Global Views 11-28-14 - Global Banking and Markets · Global Views is available on scotiabank.com,...
37
Foreign Exchange Strategy Fixed Income Strategy Fixed Income Research Emerging Markets Strategy Portfolio Strategy Economics Weekly commentary on economic and financial market developments Global Views Corporate Bond Research Contact Us Global Views is available on scotiabank.com, Bloomberg at SCOT and Reuters at SM1C November 28, 2014 Key Data Preview A1-A2 Key Indicators A3-A5 Global Auctions Calendar A6 Events Calendar A7-A8 Global Central Bank Watch A9 Forecasts A10 Latest Economic Statistics A11-A12 Latest Financial Statistics A13 Forecasts & Data This Week’s Featured Chart Economics Central Bankers Have The Greatest Job Security 2-5 Derek Holt Saudi Arabia Triggers Lower Oil Prices To Slow Development Of The U.S. Shales 6-7 Patricia Mohr Who Is Most Sensitive To Falling Oil Prices? 8 Rory Johnston Low Oil Prices Will Drive Global Auto Sales Higher 9 Carlos Gomes Provincial Mid-Year Reports Commence The Recalibration To Lower Oil Prices 10 Warren Kirkland and Mary Webb Oil Price Impact On Core Latin American Countries 11 Pablo Bréard Fixed Income Strategy UK Autumn Statement Preview 12-15 Alan Clarke ECB December Meeting Preview 16-18 Frédéric Prêtet Foreign Exchange Strategy Latin America Week Ahead: For The Week Of December 1 - 5 19-21 Eduardo Suárez 4 5 6 7 8 9 10 11 07 08 09 10 11 12 13 14 U.S. & Canadian Unemployment Rates Converge Source: BLS, Statistics Canada, Global Insight, Scotiabank Economics. unemployment rate, % U.S. Canada - Official Canada - Adjusted to Match U.S.
Transcript of Global Views 11-28-14 - Global Banking and Markets · Global Views is available on scotiabank.com,...

Foreign Exchange Strategy Fixed Income Strategy Fixed Income Research Emerging Markets Strategy Portfolio Strategy Economics
Weekly commentary on economic and financial market developments
Global Views
Corporate Bond Research
Contact Us
Global Views is available on scotiabank.com, Bloomberg at SCOT and Reuters at SM1C
November 28, 2014
Key Data Preview A1-A2
Key Indicators A3-A5
Global Auctions Calendar A6
Events Calendar A7-A8
Global Central Bank Watch A9
Forecasts A10
Latest Economic Statistics A11-A12
Latest Financial Statistics A13
Forecasts & Data
This Week’s Featured Chart
Economics
Central Bankers Have The Greatest Job Security 2-5
Derek Holt
Saudi Arabia Triggers Lower Oil Prices To Slow Development Of The
U.S. Shales
6-7
Patricia Mohr
Who Is Most Sensitive To Falling Oil Prices? 8
Rory Johnston
Low Oil Prices Will Drive Global Auto Sales Higher 9
Carlos Gomes
Provincial Mid-Year Reports Commence The Recalibration To Lower Oil
Prices
10
Warren Kirkland and Mary Webb
Oil Price Impact On Core Latin American Countries 11
Pablo Bréard
Fixed Income Strategy
UK Autumn Statement Preview 12-15
Alan Clarke
ECB December Meeting Preview 16-18
Frédéric Prêtet
Foreign Exchange Strategy
Latin America Week Ahead: For The Week Of December 1 - 5 19-21
Eduardo Suárez
4
5
6
7
8
9
10
11
07 08 09 10 11 12 13 14
U.S. & Canadian Unemployment Rates Converge
Source: BLS, Statistics Canada, Global Insight, Scotiabank Economics.
unemployment rate, %
U.S.
Canada -Official
Canada -Adjusted to Match U.S.

Economics
Global Views
November 28, 2014
2
Central Bankers Have The Greatest Job Security
Please see our full indicator, central bank, auction and event calendars on pp. A3-A9.
A cluster of significant central banks will issue policy updates over the coming week and this will combine with US jobs data to shape the global market tone for some time. Each of the ECB, Bank of England, Bank of Canada, Reserve Bank of Australia, Reserve Bank of India, and Bank of Brazil will make announcements. A rate hike is expected from Brazil given an ongoing focus to lower inflation in that country, the ECB is likely to continue to emphasize a potential sovereign bond buying program in 2015, and rate cuts are a point of speculation in Australia and India, while the other central banks will jawbone markets. Absent from the list are the Federal Reserve which steps in on December 17th, the Bank of Japan, and the People’s Bank of China which does not abide by a formal schedule of announcements. That said, a fairly heavy calendar of Fed-speak will carry potential added influence and is likely to err on a somewhat cautious note; I think there is a very high bar against removing or watering down ‘considerable time’ language in the December statement. A Q1 rate hike as suggested by some officials like St. Louis Fed President James Bullard isn’t credible to me, and our forecast for a hike by Q2 faces the risk of being delayed.
US — This Time May Be Different
Friday’s nonfarm payrolls report will be the marquee US-led event by way of market risks. We expect around a 250k print. I’m comfortable extrapolating solid trend growth in jobs for some time, as opposed to emphasizing the risk of years past whereby solid job gains repeatedly turned toward renewed disappointment. Chart 1 provides one reason for such an expectation. As-yet-unfilled job openings have soared this year like no other. Apart from being a sign of hiring confidence, this could also point toward sustained momentum in nonfarm payroll gains as pent-up hiring demand is gradually filled. That would make this time different, indeed. By the time we think the Federal Reserve begins hiking its fed funds target rate in 2015Q2, the unemployment rate is likely to be moving toward 5½% and it merits noting that this is the rate that even the most dovish of FOMC officials — like Minneapolis Fed President Narayana Kocherlakota — long expressed as the catalyst for rate hike discussions.
Thanksgiving weekend retail sales results will also be a focal point in the first half of the week. During that stretch, company reports and anecdotes will combine with first estimates from the National Retailers’ Association, and IBM tracks Cyber Monday sales (here) at about 800 retail web sites in real time throughout the day and benchmarks the figures to prior years.
The ISM-manufacturing print for November will arrive on Tuesday. It will likely remain strongly in expansionary territory but the exact print is always a wild card. Regional surveys like the Philly Fed provide a loose guide over what to expect, but the key transportation sector of the US economy tends to be underrepresented in the regional surveys and better captured in ISM. That means that the record-high order book in the aerospace sector and trend strength in vehicle sales have been better captured in ISM readings. A downside risk to ISM expectations may therefore take the form of softer vehicle production quite recently. Wednesday’s ADP private payrolls will be a sideshow to nonfarm in large part because the first prints for it and private nonfarm payrolls can be so far off one another that markets typically choose to emphasize nonfarm much more heavily.
How Federal Reserve officials view the economy may quickly become stale by Friday when jobs data is released. Nevertheless, a long line-up of heavy hitters take to the podium. The list starts on Monday with NY Federal Reserve President William Dudley who speaks on the outlook, and then builds with the perennially
Derek Holt (416) 863-7707 [email protected]
THE WEEK AHEAD
2000
2500
3000
3500
4000
4500
5000
5500
De
c-0
0
Mar
-02
Jun-
03
Sep
-04
De
c-0
5
Mar
-07
Jun-
08
Sep
-09
De
c-1
0
Mar
-12
Jun-
13
Sep
-14
Source: Scotiabank Economics, Bureau of Labor Statistics.
Thousands
US Hiring MomentumJOLTS Job Vacancies
Chart 1

Economics
Global Views
November 28, 2014
3
… continued from previous page
hawkish duo of Plosser and Fisher on Wednesday, the Cleveland Fed’s Loretta Mester who is also hawkish and will speak on Thursday and again on Friday, Governor Brainard on Thursday, and finally Vice Chair Stanley Fischer on Friday.
More limited data risk may arise via updates on construction spending and vehicle sales on Tuesday, ISM-services and the Fed’s Beige Book of regional economic conditions on Wednesday, and factory orders and trade on Friday.
Canada — Poloz’s ‘Temporary’ Guidance Not Yet Panning Out
Canada risks will be concentrated on Wednesday’s Bank of Canada policy statement and Friday’s jobs print for November. While there will not be an accompanying press conference, there may as well be one as Governor Poloz will speak later in the day at a ‘Canada Summit’ put on by The Economist magazine. There will be no published remarks for the event and it is a live on-stage interview after the market close. At 2.4% y/y and 2.3% y/y for recent headline and core inflation respectively, the BoC’s guidance to look through much of it as temporary and sector-specific is in one respect getting somewhat less credible in the markets with each upside surprise to inflation. After all, recall that at the start of the year in its January Monetary Policy Report, the BoC had forecast that both headline and core inflation would end 2014 at 1.5% y/y. Now that both inflation readings are firmly above the 2% target as the mid-point of the 1-3% operational band, markets will be looking for further guidance from the Governor. Since the latest inflation reading was for October, it doesn’t capture the roughly US$10 additional decline in WTI oil prices since the end of that month up to the point of writing. I would expect the Governor to continue to emphasize how their policy risks are asymmetrically skewed more toward concern out of getting inflation forecasts wrong by way of renewed downside risk rather than further upsides. BoC communications have tended to emphasize that it believes it has greater tools for controlling inflation upsides than significant downsides with a 1% overnight rate that is toward the lower zero bound and given difficulties of implementing a QE program in Canada that made it resisted in the depths of the global crisis. As a consequence, Scotiabank Economics continues to expect the BoC to be on hold throughout all of 2015 at a minimum.
A further issue is whether Friday’s jobs report can sustain the pace of hiring that has been observed over the prior two reports. We don’t think so, but markets could well just look through the report in the context of volatility surrounding job growth estimates this year. Canada gained 117 thousand new jobs in September and October that would be proportionately equivalent to over 1.2 million US jobs created. Of those, private sector jobs have gone up by just shy of 200 thousand over the same two month period (chart 2). The unemployment rate sat at 6.5% in October which was pushing into 2008 territory before the worst effects of the global financial crisis hit job markets in lagging fashion. We’re inclined to downplay the durability of the figures.
Trade figures for October also arrive on Friday but will be lost behind US and Canadian jobs with no likely incremental market impact.
Europe — ECB Laying The Groundwork For More
Thursday will pretty much be the only day that matters by way of Europe-specific risks as opposed to spillover effects from developments abroad including the next day’s US job growth figures. On Thursday, both the European Central Bank and Bank of England issue policy updates.
The Bank of England’s Monetary Policy Council Meeting will be a tame affair on the day and until meeting minutes are released a couple of weeks later. No policy changes are expected. Governor Mark
Derek Holt (416) 863-7707 [email protected]
THE WEEK AHEAD
-180
-130
-80
-30
20
70
120
170
Feb
-00
Jun-
01
Oct
-02
Feb
-04
Jun-
05
Oct
-06
Feb
-08
Jun-
09
Oct
-10
Feb
-12
Jun-
13
Oct
-14
Source: Scotiabank Economics, Statistics Canada.
Last two months of private sector job gains, thousands
Is A Private Sector Hiring Boom Sustainable?
Chart 2

Economics
Global Views
November 28, 2014
4
… continued from previous page
Carney has put increased emphasis upon global risks and recently noted: “In recent months, global economic conditions have deteriorated in two of the major economies — Europe and Japan. The geopolitical situation remains difficult. The combination of that suggests a heightened degree of external risks to the UK.” That said, other MPC members have emphasized traction on domestic variables like wage growth. MPC member Ian McCafferty has remarked that “Wages are now starting to outstrip inflation and there are a number of signals to suggest that as 2015 unfolds that will continue and wages will start to rise slightly faster than they have done.” At issue is therefore the trade-off between emphasizing risks abroad versus domestic developments and the balance of the MPC is likely to err on the more cautious side for some time yet particularly in the context of concern over prospects for further instability in Russia including spillover effects on the rest of Europe.
Across the channel, the ECB is buying time to evaluate current initiatives but nonetheless becoming more aggressive and spirited in defending the potential merits of an unsterilized sovereign bond purchase program. Expect more of the same Thursday with no policy rate changes expected and the risk therefore concentrated on the press conference held by President Draghi. Regarding recent initiatives and possible future ones, Draghi recently remarked that “...time is needed for the positive effects to fully materialize. However, should it become necessary to further address risks of too prolonged a period of low inflation, the Governing Council is unanimous in its commitment to using additional unconventional instruments within its mandate. In this context, we have also tasked relevant ECB staff and Eurosystem committees with the timely preparation of further measures to be implemented, if needed.” The recent drop in Eurozone inflation to 0.3% y/y may add further urgency and in the context of an ongoing decline in oil prices which matters for a central bank that is among the most likely to emphasize headline inflation over core.
More direct remarks recently came from ECB Vice-President Vitor Constâncio who went further in countering assertions that sovereign bond buying by the ECB would have no effect due to already-low yields on government bonds. Constâncio remarked the following: “The transmission channels involved include signaling and influencing inflation expectations, exploring spillovers resulting from investors using the cash received to buy other assets, including foreign assets with influence on the exchange rate, and finally, the freeing up of space in banks’ balance sheets to increase credit to the real economy. It is therefore not well founded the counter argument that the policy would not be effective on account of already low sovereign yields. The transmission goes well beyond the direct effect on yields of the purchased securities.”
In timing a potential decision, Constâncio also provided a firmer clue: “We expect the adopted measures will lead within the time of the programme the balance sheet to go back to the size it had in early 2012. We have, of course, to closely monitor if the pace of its evolution is in line with that expectation. In particular, during the first quarter of next year we will be able to gauge better if that is the case.”
European data risk should be fairly light and focused on German factory orders on Friday, and the November UK manufacturing PMI on Monday.
Asia — Pressure On The RBA And RBI
The Monday market open may be influenced by a fresh batch of Chinese manufacturing data. The state version of the purchasing managers’ index for the manufacturing sector arrives into the Asia market open on Monday and so does the revised second print for the private sector PMI. Both are hovering at or near 50 (and thus no growth) in the case of the private and state measures, respectively.
The Reserve Bank of India is not expected to cut its repo rate or cash reserve ratio next week according to the Bloomberg consensus, but the RBI is under pressure from the government to cut. India’s Finance Minister Arun Jaitley is scheduled to meet with RBI Governor Rajan on Monday and is widely believed to be in favour of a rate cut.
Derek Holt (416) 863-7707 [email protected]
THE WEEK AHEAD

Economics
Global Views
November 28, 2014
5
… continued from previous page
The Reserve Bank of Australia is open to adding stimulus but likely not for some time as markets expect the cash target rate to remain unchanged until mid-2015 or possibly later. RBA Deputy Governor Philip Lowe noted recently that “My judgement would be that if further interest rate reductions were required, they would have some effect in stimulating economic activity.” The mid-week Australian Q3 GDP print may further inform such a bias, particularly if it disappoints expectations for growth of 3.1% y/y and 0.7% q/q (non-annualized). Australia also releases retail sales and trade figures.
Taiwan’s weekend election may be worth watching. It is widely viewed as a referendum of sorts on President Ma Ying-jeou’s efforts to draw closer ties with China. Over eleven thousand local seats will be contested and the opposition Democratic Progressive Party (DPP) is expected to come out ahead, which could position it for a serious challenge in the 2016 Presidential elections and observers have an eye on the implications for another possible sore spot in China’s relations with its neighbours and the potential for added geopolitical risk.
CPI inflation figures will be in focus throughout much of Asia with releases on tap for Indonesia, Philippines, South Korea and Thailand. A recent cut in Indonesia’s fuel subsidy could make it the upside outlier by way of renewed downward pressure on everyone else’s headline inflation readings. Trade figures from Indonesia, Malaysia and Korea will round out the hits along with Q3 GDP revisions in Korea and Japanese vehicle sales.
Derek Holt (416) 863-7707 [email protected]
THE WEEK AHEAD

Economics
Global Views
November 28, 2014
6
Saudi Arabia Triggers Lower Oil Prices To Slow Development Of The U.S. Shales
Western Canada’s ‘In-situ bitumen’ & conventional oil production is cost-competitive.
Oil Price Forecast Revised Down Following OPEC Meeting
After a brief OPEC meeting on November 27, Saudi Arabia and the other Gulf Co-Operation Council members — Kuwait, the UAE and Qatar — decided not to cut output to shore up prices, but instead to allow oil prices to move in line with international supply & demand conditions. While the OPEC communique was vague, it appears that Saudi Arabia is content to endure a period of low international prices to slow development of the U.S. shales.
The huge gains in ‘light, tight’ oil production in the North Dakota Bakken and the Permian and Eagle Ford Basins in Texas have been remarkable — up 1.15 mb/d in 2014 (yr/yr) — helping to rejuvenate U.S. economic growth (especially in the U.S. refining, petrochemical, NGL processing and associated transportation industries). However, this rapid oil production growth, in an environment of sub-par gains in global consumption (a mere 0.6 mb/d) has essentially destabilized international oil markets. Nigerian crude — backed out of the U.S. market — has had difficulty finding new outlets in a weak European economy. The rebound in Libyan oil exports (though volatile) has contributed to an oil supply glut in the North Atlantic Basin.
The decision of Saudi Arabia and the Gulf Co-Operation Council members (Kuwait, the UAE and Qatar) not to cut production to shore up prices spells a period of low oil prices — at least for the coming year and possibly medium-term. In the absence of a slowdown in U.S. shale development or production cuts in Russia or Mexico (which these countries are not willing to implement), supply and demand conditions for oil in 2015 will remain over-supplied. The ‘call’ on OPEC crude could be well below actual production.
The net result, we have revised down the 2015 oil price forecast for WTI to US$70 per barrel and for Brent to US$75. Significantly stronger world economic conditions than currently expected would boost demand and market sentiment, allowing higher prices.
Based upon an analysis of more than 50 oil plays across Canada and the United States, we estimate that ‘mid-cycle breakeven costs’ in the North Dakota Bakken (1.05 mb/d) are roughly US$69 per barrel and in the Permian Basin in Texas (1.63 mb/d) about US$68. While some producers have hedged forward at higher prices, if WTI oil remains around US$70 for more than six months, it appears likely that drilling activity will slow in more marginal areas of these plays as 2015 unfolds. Funding for independent oil producers will also tighten. However, the ‘liquids-rich’ Eagle Ford (1.45 mb/d) will be little impacted, with breakeven costs averaging only US$50. (Cost data was prepared with the assistance of Scotiabank Equity Research.)
Patricia Mohr (416) 866-4210 [email protected]
COMMODITIES
Oil Prices Plunge in Wake of OPEC Meeting
0
20
40
60
80
100
120
140
0
20
40
60
80
100
120
140
60 65 70 75 80 85 90 95 00 05 10 15 20
US$ per barrel
Arab OilEmbargo
IranianRevolution
Gulf War
Iraq War
Record High:July 11, 2008: US$147.90
*
+
WTI Oil Prices
+ November 28, 2014: US$66.
1.491
1.722
1.936
0.5
1.0
1.5
2.0
0.5
1.0
1.5
2.0
2012 2013 2014 YTD
mb/d
* Data to August 2014; +13% YTD.Data Source: NEB.
Canadian Heavy Oil Exports Continue to Climb
-50
-40
-30
-20
-10
0
10
-50
-40
-30
-20
-10
0
10
12 13 14 15
US$ per barrel
'Light, Sweet' Oil @Edmonton
WCS Heavy Oil @Hardisty, Alberta*
Discounts Narrow
* Western Canadian Select Heavy Oil: blend of 25heavy oil grades (conventional + unconventionalwith diluent).Data Source: TMX/Shorcan Energy Brokers.
DiscountsWCS Light Sweet
2012 -21.00 -8.262013 -25.21 -7.542014 Avg -19.42 -7.17
Q4 -14.21 -6.33
Western Canada Oil Price Discounts Off WTI Prices

Economics
Global Views
November 28, 2014
7
… continued from previous page
Interestingly, the EIA anticipates that overall U.S. oil production growth will slow to 660,000 b/d in 2015 after an extraordinary 1.11 mb/d in 2014. This may set the stage for moderately higher oil prices in 2016, as would better world economic conditions.
Western Canada’s Oil Production Is Cost Competitive, But 2015 Drilling Activity Could Decline By 15%
Moving into a low oil price environment — triggered by structural changes due to the rapid development of U.S. shales as well as the decision of Saudi Arabia not to act as a swing producer — it is important to assess the cost competitiveness of the Alberta oil sands and conventional light/heavy oil plays in Western Canada. Our analysis reveals that the oil plays in Western Canada are on average lower-cost than in the United States, partly due to royalty credits and a more flexible royalty system. While several senior and integrated oil producers have indicated little scaling back in their capital spending intentions, junior oil producers face a tougher funding environment. Drilling activity in Western Canada could drop by 15% in 2015.
Further details on relative costs follow:
The Montney oil plays in Alberta and Northeast B.C. are on the bottom of the Canada/U.S. cost curve. Ranking the plays with significant volume, the Southwest Saskatchewan Bakken is also on the bottom.
A number of the ‘conventional heavy oil’ plays in Western Canada — such as ‘Lloyd Heavy’ and ‘Seal’ in Alberta — are also quite low cost, yielding some of the best profit investment ratios across North America.
Most importantly, ‘In-situ bitumen’ (SAGD and CSI) production — accounting for 1.81 mb/d or 71% of Alberta oil sands output and likely to represent most of the 1.46 mb/d of growth projected through 2020 — is more cost competitive than the ’North Dakota Bakken’ and the Permian Basin — the home of WTI oil — in Texas. Mid-cycle costs for SAGD bitumen are as low as US$40.
Existing ‘integrated mining/upgrading’ oil sands projects around Fort McMurray are also cost competitive, with mid-cycle breakeven costs averaging US$53 (727,000 b/d). These projects involve long-life, low decline rate assets, in contrast to U.S. ‘light, tight’ oil, offering scale, but with rapid decline rates. However, most new projects would be high cost; the Total/Voyageur mining/upgrading project was shelved earlier this year.
Heavy oil (a cheaper feedstock than ‘light, sweet oil’) represents a strong card for Canada. Canadian exports of heavy oil continue to climb to the United States (+13% in 2014 YTD).
Patricia Mohr (416) 866-4210 [email protected]
COMMODITIES
OPEC Rolls Over Existing Quota
ProductionOct. 2014
Sustainable Production Capacity
Algeria 1.13 1.17Angola 1.72 1.80Ecuador 0.54 0.57Iran 2.76 2.90Iraq 3.32 3.40Kuwait* 2.82 2.85Libya 0.87 0.85Nigeria 1.88 2.00Qatar 0.69 0.73Saudi Arabia* 9.68 12.40UAE 2.74 2.90Venezuela 2.46 2.60Total OPEC 30.60 34.17
* Includes half of Neutral Zone production; IEA data.+ Quota in place since January 1, 2012, with no individualcountry quotas set. Iraq has not been subject to quota.Demand for OPEC oil -- 2013: 30.5 mb/d; 2014: 29.6 mb/d;2015: 29.2 mb/d.
Quota+ November 2014: 30 mb/d rolled over for 2015:H1
(mb/d)
Economics
Global Views
November 28, 2014
8
Who Is Most Sensitive To Falling Oil Prices?
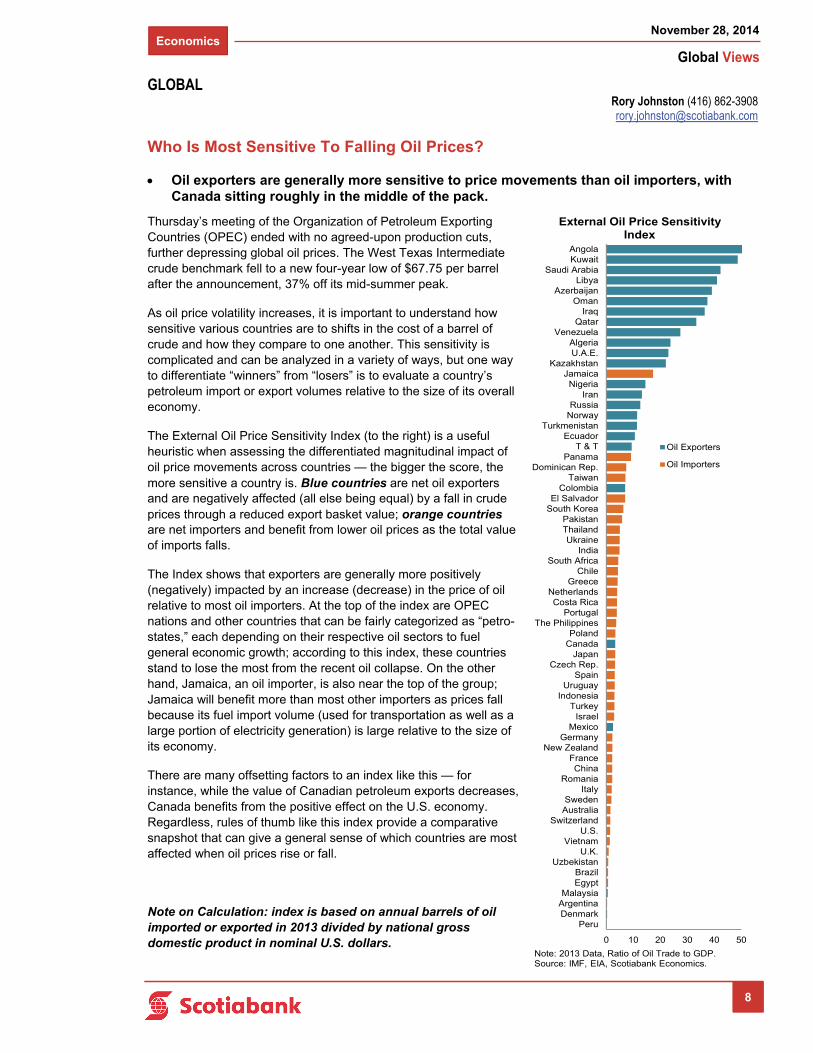
Oil exporters are generally more sensitive to price movements than oil importers, with Canada sitting roughly in the middle of the pack.
Thursday’s meeting of the Organization of Petroleum Exporting Countries (OPEC) ended with no agreed-upon production cuts, further depressing global oil prices. The West Texas Intermediate crude benchmark fell to a new four-year low of $67.75 per barrel after the announcement, 37% off its mid-summer peak.
As oil price volatility increases, it is important to understand how sensitive various countries are to shifts in the cost of a barrel of crude and how they compare to one another. This sensitivity is complicated and can be analyzed in a variety of ways, but one way to differentiate “winners” from “losers” is to evaluate a country’s petroleum import or export volumes relative to the size of its overall economy.
The External Oil Price Sensitivity Index (to the right) is a useful heuristic when assessing the differentiated magnitudinal impact of oil price movements across countries — the bigger the score, the more sensitive a country is. Blue countries are net oil exporters and are negatively affected (all else being equal) by a fall in crude prices through a reduced export basket value; orange countries are net importers and benefit from lower oil prices as the total value of imports falls.
The Index shows that exporters are generally more positively (negatively) impacted by an increase (decrease) in the price of oil relative to most oil importers. At the top of the index are OPEC nations and other countries that can be fairly categorized as “petro-states,” each depending on their respective oil sectors to fuel general economic growth; according to this index, these countries stand to lose the most from the recent oil collapse. On the other hand, Jamaica, an oil importer, is also near the top of the group; Jamaica will benefit more than most other importers as prices fall because its fuel import volume (used for transportation as well as a large portion of electricity generation) is large relative to the size of its economy.
There are many offsetting factors to an index like this — for instance, while the value of Canadian petroleum exports decreases, Canada benefits from the positive effect on the U.S. economy. Regardless, rules of thumb like this index provide a comparative snapshot that can give a general sense of which countries are most affected when oil prices rise or fall.
Note on Calculation: index is based on annual barrels of oil imported or exported in 2013 divided by national gross domestic product in nominal U.S. dollars.
Rory Johnston (416) 862-3908 [email protected]
GLOBAL
8
0 10 20 30 40 50
PeruDenmarkArgentinaMalaysia
EgyptBrazil
UzbekistanU.K.
VietnamU.S.
SwitzerlandAustraliaSweden
ItalyRomania
ChinaFrance
New ZealandGermany
MexicoIsrael
TurkeyIndonesia
UruguaySpain
Czech Rep.Japan
CanadaPoland
The PhilippinesPortugal
Costa RicaNetherlands
GreeceChile
South AfricaIndia
UkraineThailandPakistan
South KoreaEl Salvador
ColombiaTaiwan
Dominican Rep.Panama
T & TEcuador
TurkmenistanNorwayRussia
IranNigeria
JamaicaKazakhstan
U.A.E.Algeria
VenezuelaQatar
IraqOman
AzerbaijanLibya
Saudi ArabiaKuwaitAngola
External Oil Price Sensitivity Index
Oil Exporters
Oil Importers
Note: 2013 Data, Ratio of Oil Trade to GDP.Source: IMF, EIA, Scotiabank Economics.

Economics
Global Views
November 28, 2014
9
Low Oil Prices Will Drive Global Auto Sales Higher
U.S. households will benefit most.
The recent sharp drop in oil prices to the lowest level since 2010 is positive for the global auto industry and economic activity. It boosts household purchasing power and reduces overall transportation costs at a time when labour markets are strengthening and household balance sheets are improving in most regions, led by the United States. Lower fuel costs will also accelerate the shift towards light trucks, helping to boost industry profitability, as crossovers, SUVs and pickups are more profitable than small- and mid-size cars.
Oil prices have dropped more than 20% in eight previous occasions during the past 30 years. On four occasions, the decline was linked to global economic downturns and lower prices at the pump were not enough to prevent deteriorating economic fundamentals from leading to sharp declines in global vehicle sales. However, on four other occasions — 1986, 1988, 1994 and 1998 — the situation was more in line with current developments, with the oil price contraction driven by accelerating supplies and slowing, but not declining, demand. During these periods, global economic growth strengthened, especially in the revitalized industrial economies, and new vehicle sales increased an average of 4% the following year.
Lower oil prices provided the greatest boost to global auto sales in 1994, with volumes advancing 9%, alongside solid gains in every region. However, the impact was smallest in Western Europe, as the economy was struggling to build momentum following the recession of the early 1990s — a development analogous to the current cycle.
We believe that the current environment is most similar to 1994, with the North American economy beginning to build momentum and providing a boost to global activity. In both periods, interest rates had remained low for an extended period and labour markets — the key economic driver of new vehicle sales — were finally recovering following a long period of sub-par performance. In the current cycle, the U.S. job market has posted nine consecutive monthly gains in excess of 200,000, lifting year-over-year growth to the highest level since 2006, and job growth has finally resumed in Western Europe.
More importantly, household balance sheets will be further fortified by the recent decline in oil prices. The ratio of U.S. household debt to net worth is at the lowest level since the new millennium. Debt-servicing charges for U.S. households are at record lows, while as of the third quarter, energy costs absorbed the lowest share of disposable income since 2008 and are set to fall significantly in response to the decline in global oil prices. As a result, vehicle sales and household finances are on a stronger footing, consumers are feeling more confident and are getting an additional boost in purchasing power. These developments have prompted a shift towards purchases of higher-priced mid-size crossovers and other larger vehicles at the expense of small- and mid-size cars. Small cars now account for less than 18% of overall sales in the United States — the lowest level since 2007. The trend towards larger vehicles is similar in Canada, with the share of small cars dropping to 28% this year from an average of 31% over the past decade.
However, if sustained, lower oil prices will make it more challenging to achieve long-term fuel efficiency goals. In order to reach government-mandated fuel efficiency targets by 2025, the fuel economy of the U.S. fleet will have to increase by more than 6% per annum over the next eleven years. Those targets seemed achievable last year, with the fuel-efficiency of new U.S. vehicles advancing in excess of 5% per annum. However, according to the Transportation Research Institute at the University of Michigan, the recent change in vehicle-buying patterns has cut the pace of improvement in half.
Carlos Gomes (416) 866-4735 [email protected]
AUTOS
0
1
2
3
4
5
-40
-30
-20
-10
0
10
20
-2 -1 0 1
% change
Oil Price
GlobalCar Sales
% change
0 = 1986, 1988, 1994, 1998 Avg.
Lower Oil Prices Lift Global Auto Sales

Economics
Global Views
November 28, 2014
10
Provincial Mid-Year Reports Commence The Recalibration To Lower Oil Prices
Alberta and Saskatchewan confirm FY15 black ink and the FY16 challenges.
Our forecast of more balanced regional growth across Canada over the next two years is reinforced by our revised forecast of WTI and Brent oil prices averaging US$70/barrel and US$75, respectively, during calendar 2015. Alberta’s real GDP growth is forecast to ease from almost 4.0% in 2014 to the 3.0% range next year, and slightly stronger advances are anticipated for the Maritime, Quebec and Manitoba economies, while Ontario’s 2015 gain is expected to top 2.5%. If we are right that the period of lower world oil prices will be extended, then the impacts will multiply, such as the moderating trend anticipated for net interprovincial migration to Alberta. Yet lower world oil prices represent a two-edged sword for both the Canadian economy that receives wide-ranging benefits from its major oil-related projects and the U.S. economy, given its expanding role as an oil producer.
The Alberta and Saskatchewan Updates for fiscal 2014-15 (FY15) emphasize a solid first half, with WTI oil prices averaging a robust US$100/barrel that will help to sustain projected black ink this year (bottom left table). Newfoundland and Labrador’s Update, anticipated in December, also should show some positive momentum for the first half of FY15, given that the Brent prices received for its oil averaged just over US$106/barrel. The oil-producing Provinces now have several months before their spring Budgets to develop FY16 plans given the dramatic oil price shift. Positive factors, though they will likely offset only a fraction of the impact, include our expectation of a slightly softer Canadian dollar, the cost competitiveness of most Canadian producers and, a narrower discount for Western Canadian Select (WCS) heavy crude, buoyed by strong refinery demand for this heavier oil, recent pipeline expansions and stepped-up oil shipments by rail.1
Alberta’s Budget last February projected bitumen production by FY17 would be five times the volume of conventional output, after four years of annual increases averaging 10%. As a result, Alberta now projects that a one percentage point decline in the WCS /WTI differential (in C$) will boost receipts by C$274 million (bottom right chart), larger than the C$215 million impact from a US$1/barrel increase in average WTI oil prices. Nevertheless, Alberta warns of the potential effects of low oil prices over several years on provincial employment, business investment and housing, underlining the dampening impact on income taxes as well as royalties.
Thus, somewhat greater provincial austerity is anticipated through mid-decade with Alberta, Saskatchewan and British Columbia all focused on maintaining budget surpluses, and the other Provinces still concentrating on fiscal repair. Ottawa, in its Fall Update, also incorporated the impact of lower oil prices, assuming WTI prices averaging US$81 from the fourth quarter of 2014 through 2019.
1 For further commentary on oil prices, please see article on pages 6-7 titled “Saudi Arabia Triggers Lower Oil Prices To Slow Development Of The U.S. Shales”.
Mary Webb (416) 866-4202 [email protected]
Warren Kirkland (416) 866-4212 [email protected]
PROVINCES
0
4
8
12
16
FY00 02 04 06 08 10 12 14
natural gas
$ billions
Alberta's Non-Renewable Resource Receipts
* Includes bonuses/sales of Crown leases, rentals & fees and coal royalties. Source: Alberta Finance.
synthetic/bitumen
conventional oil
other*FY14
Final Budget Q1 Q2NB -499 -391 -387 -377ON -10,453 -12,505 n.a. -12,507
SK 589 71 75 71AB: Consolidated Bal. -302 n.a. 767 576 Change in Net Assets 755 1,087 1,385 933 Operational Balance 2,499 2,644 3,168 2,706BC 353 184 266 444
Federal -5,150 -2,900 n.a. -2,900________Source: Provincial Public Accounts and Budget documents.
FY15
Provincial Mid-Year Updates To Date for Fiscal 2014-15$ millions except where noted

Economics
Global Views
November 28, 2014
11
Oil Price Impact On Core Latin American Countries
The collapse in oil prices is sending shock waves around the world. Latin America will not be immune to heightened financial market volatility associated with such a sharp oil price decline, yet the impact will vary from country to country depending on the structure of the energy mix and relative oil revenue dependence.
Mexico is a major producer and exporter of crude oil and is influenced by the capital flows associated with its petroleum industry. An acute oil price decline will impair the country’s external accounts, yet the dependence on oil exports for total external sales is relatively low compared to other major producers. Nevertheless, the government’s reliance on oil-related budgetary receipts is very high, accounting for 31% of total fiscal revenue during the first nine months of 2014. Growth prospects linked to public sector capital expenditure programs may be subject to revisions and/or delays in the context of persistent bearish trends affecting oil prices. The Mexican peso (MXN) and global investors’ perception of Mexican sovereign credit risk reflect a less benign near-term economic outlook. Mexico is a significant emerging-market player in both USD-denominated and local-currency fixed income markets, accounting for roughly 12% of the benchmark EMBIG index. The Mexican sovereign debt spread (over equivalent US Treasury bond yields) has been widening since early September to the current level of 195 basis points. However, Mexico’s creditworthiness remains sound, supported by favourable trade links with the improving US economy, ongoing structural reforms, and the announcement of a new precautionary US$70 billion two-year flexible credit line (FCL) with the International Monetary Fund (IMF). The Mexican stock market, one of the best performing among emerging markets, has been barely affected by the collapse in oil prices given the low relevance of publicly listed energy companies.
Colombia is also affected by the oil price gyrations. In fiscal terms, it is less dependent on oil-related revenue than Mexico. However, the bulk of planned long-term foreign investment flows are dominated by the oil and coal sectors. The Colombian peso (COP) is immersed in a bearish directional trend, reaching an exchange rate of 2,218 per USD by the end of the week. The steep depreciation of the peso, in place since early July, has also been fuelled by the broad-based move in favour of the USD and shifts away from emerging-market securities. Colombia is a minor player in global equity markets, accounting for a mere 0.26% of global market capitalization (vs 1.4% in Brazil); nevertheless, the energy sector represents a dominant component in the country’s benchmark index. In fact, the state-owned firm Ecopetrol (which accounts for 12% of the Colombian equity market index) has been a major casualty of the oil price fall since June, exerting further depreciating pressure on the COP. On a positive note, declining oil prices have not had a material impact on Colombia’s sovereign risk levels. Finally, Colombia may receive a boost from a likely renewal of an IMF flexible credit line that expires in June 2015, something that would be supported by the dominant position of the US in the Fund.
Venezuela, an OPEC member, and the Latin American economy most structurally dependent on oil exports and oil-linked fiscal receipts, is at risk of deeper financial market stress. The likelihood of a distressed credit event has been reflected in both credit market metrics and sovereign rating actions. All three international credit agencies maintain a “negative outlook” on the country’s sovereign credit ratings. The country’s five-year credit default swaps (CDS), which have averaged 1,300 bps over the past 12 months, are closing the month at near 2,400 bps. In similar fashion, Venezuela’s sovereign debt spread (measured in EMBIG indices) has edged the 2,000 bps mark this week. Both Moody’s and Standard and Poor’s rate the country’s long-term foreign-currency debt assets in the triple C category.
Brazil is well positioned to withstand the heightened volatility affecting global energy markets. Net energy trade is not a major factor shaping currency market swings in the largest Latin American economy, despite a dominant share of the state-owned oil firm Petrobras in the country’s equity index. Global market participants are more concerned about the fiscal adjustment program that will be unveiled by the newly elected economic team, led by Finance Minister Joaquin Levy. Nevertheless, we anticipate a period of currency weakness, high inflation, and monetary policy tightening in the next six months as Brazil takes firm action to restore fiscal discipline and prevent a rating downgrade. Elsewhere in the region, Chile, Peru and Argentina are in a relatively sound position to mitigate the shock waves from declining oil prices.
Pablo Bréard (416) 862-3876 [email protected]
LATIN AMERICA

Fixed Income Strategy
Global Views
November 28, 2014
12
UK Autumn Statement Preview
Overview
Chancellor George Osborne’s Budget speeches typically follow a tried and tested format:
i. The good news: i.e., the UK economy is growing more strongly than expected and faster than most other developed economies (including Germany, France etc). Low unemployment and rising real wages will also be flagged as signs of light at the end of the tunnel. The point that Osborne wants to ram home is that despite the austerity drive, the economy is doing well, but there is more work to be done.
ii. The formalities: i.e., updating the economic projections and headline borrowing figures;
iii. The pre-flagged policy measures: i.e., confirmation of several of the measures that are either leaked or flagged in the press leading up the Budget / Autumn Statement; and
iv. The grand finale: i.e., some highly politically motivated but surprising headline-grabbing policy measures. A good example of this was the cocktail of measures targeted at savers and pensioners announced at the last budget.
Economic Projections
This Autumn Statement should mark the third consecutive occasion when the Chancellor has been able to upgrade the GDP growth projection (at least the near term portion of it). Table 1 below shows the recent evolution in the growth projection coupled with the latest consensus / Scotiabank forecasts. In short, the growth forecasts for 2014 and 2015 will probably be pushed up by around ¼%.
Updated Borrowing Projections
In light of stronger-than-expected GDP growth and lower-than-expected unemployment, the public finances should have been better than expected. Unfortunately, it hasn’t worked out that way. On the positive side, claimant count unemployment has fallen, which has reduced government expenditure on benefit payments (see Annex Chart 5). While falling unemployment has been matched with rising employment, there hasn’t been a particularly big improvement in income tax receipts. There are two reasons for this:
Firstly, wage inflation has been surprisingly subdued, which has held back overall nominal income growth;
Secondly, a significant proportion of the new jobs that have been created are in low pay positions. In combination with the rise in the income tax personal allowance threshold to £10k per year, much of the near-record increase in employment over the last year has not been particularly lucrative in terms of income tax receipts.
Alan Clarke (44 207) 826-5986 [email protected]
Table 1: Updated GDP Growth Projections

Fixed Income Strategy
Global Views
November 28, 2014
13
… continued from previous page
Table 2 below shows the projection for government borrowing at the time of the March Budget. Given the monthly public finances data so far this fiscal year, we are likely to see an upward revision of at least GBP10bn to the estimate for the current fiscal year. Future years will be dependent on whether additional policy measures are introduced in this Autumn Statement.
One minor complication (which tends to re-occur on a regular basis) is the change in definition of the headline PSNB measure. The new headline measure (as of September) is Public Sector Net Borrowing excluding public sector banks. Previously the headline measure was PSNB excluding financial sector interventions. Hence the new headline figures are not strictly comparable (at least without a little additional tweaking). Table 2 shows the March-2014 projections under the old headline definition, alongside a proxy from the OBR for how borrowing should look under the new definition.
Key Revenue / Expenditure Streams
The charts and bullet points in the annex show the performance of the key tax and spending streams. To summarise:
Taxes on production tend to move in tandem with GDP growth. The latter is starting to roll over, which suggests that the improvement in this tax inflow will slow.
VAT receipts tend to move broadly in tandem with nominal spending growth. We expect this series to remain robust, albeit with slight downside risks.
Income tax receipts have not grown dramatically. However, if wage inflation continues to accelerate, then there could be some better news in the pipeline for next year.
Stamp duty receipts have surged thanks to the buoyancy of the housing market. However, there are signs of a slowdown in prices and transactions, hence this revenue stream is likely to be less lucrative over the next year or so.
Unemployment benefits have been falling thanks to a surprisingly quick reduction in claimant count unemployment. It would be surprising if that pace were to persist much longer, hence the good news for the public finances is close to an end.
In all five cases, the takeaway message is that the revenue and expenditure streams are more likely to deteriorate than improve over the coming year.
Key Discretionary Measures
As ever, we are likely to get more clues about most of the policy decisions as the Autumn Statement speech gets closer. Given the close proximity to the next General Election, the discretionary policy measures announced now are likely to be highly politically motivated, rather than purely intended to address the trajectory of the public finances. As has been a running theme, the Chancellor has little or no wiggle room for
Alan Clarke (44 207) 826-5986 [email protected]
Table 2: Updated PSNB Projections

Fixed Income Strategy
Global Views
November 28, 2014
14
… continued from previous page
giveaways — especially given the overshoot in recent monthly borrowing numbers. Hence any sweeteners for certain target groups are likely to be paid for elsewhere.
Past Budget statements have coincided with elevated petrol prices, provoking the Chancellor to push back or cancel previously planned petrol tax hikes. With petrol prices down substantially in the last month or so, there is a case for raising this tax. However, the Chancellor is unlikely to win many votes by doing so, hence we believe the likelihood of this happening is low.
Petrol taxes aside, the early speculation about discretionary measures has included the following:
Restricting the personal allowance for non-residents (following the results of a consultation);
Raising the inheritance tax threshold;
Reduction in SME business rates;
Support for creative industries;
Further measures to support pensioners
Annex Key Revenue Streams / Expenditure
Represents 38% of total receipts.
With GDP growth now rolling over, the boost from this revenue stream is likely to rise more slowly from here.
This is a sub-component of ‘taxes on production’ shown above.
Represents 20% of total receipts
Tends to rise (or fall) in tandem with inflation and the buoyancy of consumer spending.
There have been two opposing forces of late:
Consumer spending growth has been the main driving force behind overall GDP growth. In turn this has been boosted by rising employment and the feel-good factor from the buoyant housing market.
Meanwhile, inflation has slowed over the last year, which has reduced the pace of nominal consumer spending growth and hence the growth in VAT receipts.
Alan Clarke (44 207) 826-5986 [email protected]
Chart 1: Taxes on Production vs GDP Chart 2: VAT vs Retail Sales

Fixed Income Strategy
Global Views
November 28, 2014
15
… continued from previous page
Represents almost 30% of total receipts.
Tends to be fairly volatile throughout the year…
…although the trend tends to hug nominal income growth.
Nominal income growth should accelerate moderately from here as
Wage inflation should finally gain traction…
…but employment growth is slowing a little.
Ultimately, what will determine the pace of increase in income tax receipts is how pay increases are distributed by income group. If pay rises or employment gains remain concentrated among the low paid, then income tax receipts are likely to disappoint.
Represents around 1.5% of total receipts.
Tends to be influenced by the volume of housing transactions (which has jumped)…
…and the pace of house price inflation (shown on the chart above).
We expect house price inflation to decelerate from here, dampening this source of tax receipts.
Represents 30% of government expenditure.
Falling unemployment has helped to reduce this burden…
…and there is probably more (albeit more moderate) downside to come.
Alan Clarke (44 207) 826-5986 [email protected]
Chart 3: Income Tax vs Nominal Income Proxy Chart 4: Stamp Duty vs House Price Inflation

Fixed Income Strategy
Global Views
November 28, 2014
16
ECB December Meeting Preview
Recent comments from the ECB president, Mario Draghi, have refuelled speculation that the ECB will embark on a new round of monetary easing in the not too distant future. While there is little expectation for concrete action at its next meeting on December 4th, market participants are hoping that the ECB will provide additional information on what these new measures could be and a timeframe for their implementation!
New actions: what type and what timing?
What new measures?
While the press conference after last month’s meeting seemed to suggest that any additional action would likely not be in the form of sovereign bond purchases, more recent comments by Draghi in front of the EU Parliament gave the impression that we could actually be closer to this point. His comments have immediately unleashed diverging views from the Bundesbank and Austrian Central Bank President Weidman and Novotny, respectively. So, the press conference on December 4th will be closely watched to see how the balance of power inside the board is evolving and how close the governing council could be in agreeing to this type of stimulus.
Our personal view remains that, before a full-scale QE program is announced, the ECB might still opt to focus on private sector asset purchases, such as corporate bonds if necessary. Another angle of actions could be to focus on buying EIB bonds. This would make sense at a time when the EU Commission is launching its €300 bn investment plan. Within this framework, the EIB could be able to finance a massive investment program by selling more bonds to be bought by the ECB.
At the end of the day, the ECB president needs to lay the groundwork for any potential concrete action that it could take in order to avoid any strengthening in the euro. In the short term, a lower euro exchange rate remains fundamental in reflating the euro zone economy and the ECB president appears to be well aware of this by delivering dovish speeches each time the euro tends to move higher.
What timing?
At this stage, it seems that there is a common agreement inside the ECB board to first have a better view on how successful the current measures in place are in increasing the ECB’s balance sheet to its intended €3 trillion target. Up until now, the ECB’s balance sheet has been roughly stable at around €2.03 trillion as the purchase of covered bonds has largely offset the impact of LTRO1/LTRO repayment. As a result, the ECB will choose to wait until after the second TLTRO allotment in mid-December and the impact of its just launched ABS program can be better assessed.
If there are additional actions, it seems nonetheless clear that it would take place in the first half of next year as favourable base effects in H2 2015 should help inflation accelerate and therefore remove any consensus view inside the board for additional actions.
Watch December’s macroeconomic forecast!
The ECB’s December macroeconomic forecast will be released next week and could be a key factor in driving the balance of power inside the board, and therefore, to address more precisely the timing of any actions. Indeed, any significant downside revision to the inflation forecast would fuel speculations for quick action after the recent comments from ECB president on the need to “raise inflation and inflation expectations as fast as possible”.
Frédéric Prêtet (00 33) 17037-7705 [email protected]
Fixed Income Strategy
Global Views
November 28, 2014
17
… continued from previous page
ECB macroeconomic forecast: What to do with the oil shock?
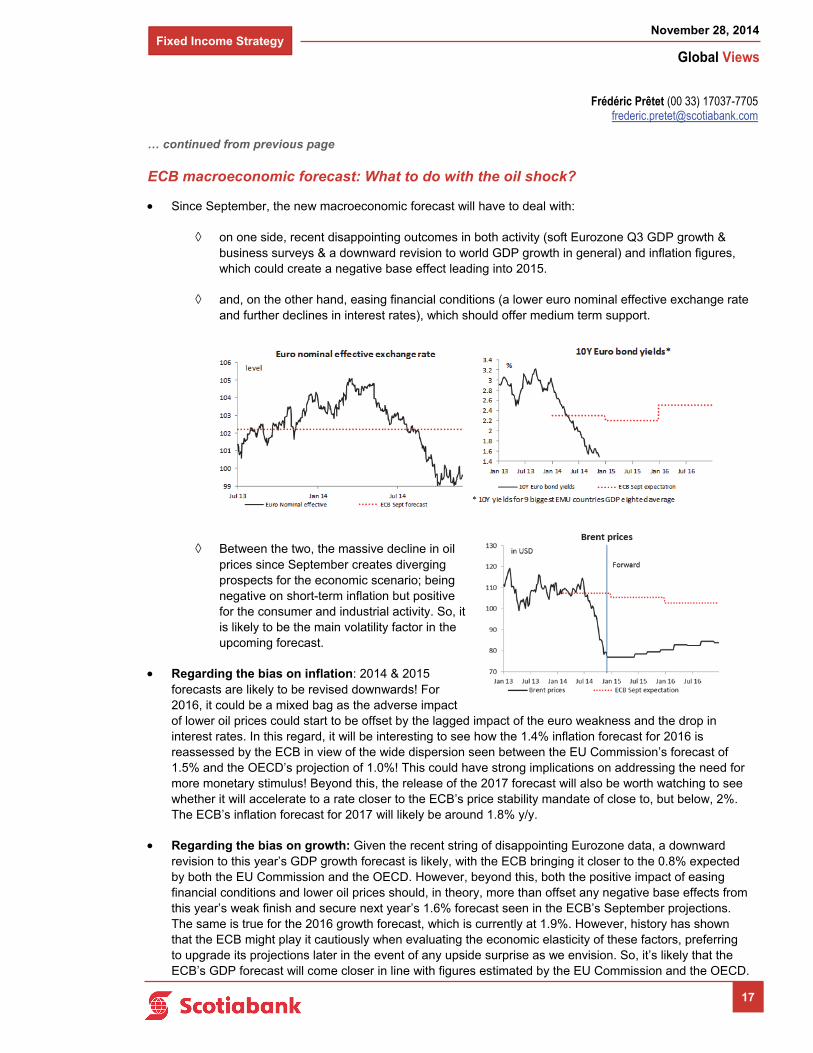
Since September, the new macroeconomic forecast will have to deal with:
on one side, recent disappointing outcomes in both activity (soft Eurozone Q3 GDP growth & business surveys & a downward revision to world GDP growth in general) and inflation figures, which could create a negative base effect leading into 2015.
and, on the other hand, easing financial conditions (a lower euro nominal effective exchange rate and further declines in interest rates), which should offer medium term support.
Between the two, the massive decline in oil prices since September creates diverging prospects for the economic scenario; being negative on short-term inflation but positive for the consumer and industrial activity. So, it is likely to be the main volatility factor in the upcoming forecast.
Regarding the bias on inflation: 2014 & 2015 forecasts are likely to be revised downwards! For 2016, it could be a mixed bag as the adverse impact of lower oil prices could start to be offset by the lagged impact of the euro weakness and the drop in interest rates. In this regard, it will be interesting to see how the 1.4% inflation forecast for 2016 is reassessed by the ECB in view of the wide dispersion seen between the EU Commission’s forecast of 1.5% and the OECD’s projection of 1.0%! This could have strong implications on addressing the need for more monetary stimulus! Beyond this, the release of the 2017 forecast will also be worth watching to see whether it will accelerate to a rate closer to the ECB’s price stability mandate of close to, but below, 2%. The ECB’s inflation forecast for 2017 will likely be around 1.8% y/y.
Regarding the bias on growth: Given the recent string of disappointing Eurozone data, a downward revision to this year’s GDP growth forecast is likely, with the ECB bringing it closer to the 0.8% expected by both the EU Commission and the OECD. However, beyond this, both the positive impact of easing financial conditions and lower oil prices should, in theory, more than offset any negative base effects from this year’s weak finish and secure next year’s 1.6% forecast seen in the ECB’s September projections. The same is true for the 2016 growth forecast, which is currently at 1.9%. However, history has shown that the ECB might play it cautiously when evaluating the economic elasticity of these factors, preferring to upgrade its projections later in the event of any upside surprise as we envision. So, it’s likely that the ECB’s GDP forecast will come closer in line with figures estimated by the EU Commission and the OECD.
Frédéric Prêtet (00 33) 17037-7705 [email protected]

Fixed Income Strategy
Global Views
November 28, 2014
18
… continued from previous page
How will the ECB’s inflation forecast be impacted by lower oil prices? Usually, a central bank tends to ignore the short term downside risks on inflation linked to a fall in oil prices by rather focussing on its medium term positive impact on growth, and therefore, on the reduction of the output gap. But this time, things could be different as Eurozone inflation is close to zero and there is the risk that any adverse developments could impact inflation expectations. It is this metric which would gauge the ECB’s sensitivity to the short term impact of lower oil prices on inflation. Over the past month, 5-year/5-year inflation swap seems to have stabilised in a range of 1.8%/1.85% despite the further drop in Brent prices. However, it still remains at a low level that is no doubt concerning for the ECB!
Frédéric Prêtet (00 33) 17037-7705 [email protected]
Table: ECB forecast & potential bias

Foreign Exchange Strategy
Global Views
November 28, 2014
19
Latin America Week Ahead: For The Week Of December 1 - 5
Today’s trading is likely to be very quiet due to the US Thanksgiving holiday, with the main event in LATAM being the policy meeting by BanRep, and Brazil’s third-quarter GDP, which showed that the economy continued in contraction territory (-0.2% y/y for the third quarter, following the -0.9% y/y print we saw in the second quarter). Regional FX moves have been fairly muted today, outside of BRL (off -0.6%) which is being weighed down by continued economic weakness. For next week, the pipeline is fairly heavy, with the US nonfarm payrolls data likely to take centre stage as markets continue to gauge when the start of the Fed’s rate hike cycle will take place. However, besides payrolls, we also have the Fed’s Beige Book in the pipeline, as well as PMIs for a number of important economies. Our sense is that the bias remains for a stronger USD, although positioning does present a risk for a temporary pullback.
Week-ahead views:
Brazil: The market reaction to the appointment of Joaquim Levy to replace Mantega as FinMin of Brazil has been modest, which likely resulted from the appointment being previously telegraphed. We see Levy as a strong signal from President Rousseff that her second term will do what it can to keep the country’s investment grade rating. However, Levy faces a tough task in balancing public finances, without destabilizing the economy.
Levy said he plans to gradually improve the country’s fiscal stance, targeting a 1.2% of GDP primary surplus in 2015, and gradually continuing the adjustment to reach a 2% of GDP primary surplus in 2018.
The country’s manufacturing sector would likely benefit from a weaker BRL (the depreciation has to be a “real-depreciation”, as opposed to nominal), but the speed of the depreciation likely has to be gradual to avoid causing problems in the financial / corporate sectors. In addition, with inflation currently hovering around the top of the BCB’s target range (despite controlled prices serving as inflation suppressors), FX-inflation pass-through needs to be considered.
The government needs to reverse the trend of rising public sector indebtedness. Barring restructuring (which we don’t think is anywhere near a possibility for the next few years), there are two ways to improve fiscal dynamics (see “The Challenge of Debt Reduction During Fiscal Consolidation” L. Eyrand, A. Weber; IMF; March 2013):
Paying lower interest rates: one way of achieving this is to restore investor trust in the markets — and on this front Levy’s appointment helps, while another is to reduce the structural level of interest rates. Our sense is that one of the reasons for Brazil’s high interest rates is the segmentation of the market. Providing lending to what are the de facto tier-1 borrowers in the economy at a ~600bps subsidized rate (i.e. the large corporates who borrow at BNDES) means the pool of borrowing that is done at “market prices” is to some degree the lower-tier part of the market, thus leading to a higher clearing interest rate. Accordingly, reducing subsidized lending by state-owned banks may help reduce the clearing rates in the economy (either by reducing the amount of subsidized state-owned bank lending, or through a convergence of the TJLP to market rates).
Reducing the fiscal deficit: our sense is that given the fragile state of the economy, this will have to be done gradually — which is what incoming FinMin Levy suggested he plans to do.
Outside of the FinMin, the government will need to think what role trade agreements can play in boosting potential growth. Mercosur is a very restrictive agreement, and Brazil’s corporate sector would likely benefit from more competition… as well as better access to more markets. However, we have not seen any signals to suggest that trade liberalization is part of Dilma’s agenda.
Next week, the highlight is likely to be the BCB’s COPOM meeting, where the market is leaning towards a +50bps hike (markets are only pricing in about a 5% chance of a continuation of the 25bps pace). Our sense
Eduardo Suárez (416) 945-4538 [email protected]

Foreign Exchange Strategy
Global Views
November 28, 2014
20
… continued from previous page
is that the acceleration in the pace of rate hikes is likely, given the BCB signaled it wants to front-load the tightening in order to minimize the amount of tightening needed. However, we don’t think a 50bps hike is a given. In addition, we are scheduled to get PMIs and IPCA inflation, which are worth watching.
Chile: The statement from the latest BCCh MPC meeting was unusually brief, highlighting:
A normalization of global financial conditions, but not discarding bouts of volatility.
Falling oil prices, and relatively stable copper prices.
A modest deceleration in Asia, and confirmed weakness in much of Latam.
Subdued domestic demand in Chile, along with weak employment.
However, the BCCh also highlighted a substantial inflation surprise (5.7%).
The BCCh attributes this surprise to transitory factors.
Inflation is expected to remain high for several months.
However, medium term inflation expectations remain anchored near 3%.
Our sense is that on the back of the large inflation surprise, the central bank switched its stance from an easing bias that was conditional on inflation dropping, to a neutral stance, given inflation expectations risked becoming “unanchored” after the 5.7% inflation print. However, with the economy still very weak, our sense is that if inflation gets back near 4%, we could see the easing bias return. On this front, next week’s release of monthly economic activity will be relevant to track if we are seeing a rebound. More importantly, given the briefness of the latest statement, next week’s minutes will likely be closely watched to better assess the board’s stance.
Colombia: Today, BanRep is widely expected to leave the overnight lending rate unchanged, with all 31 economists surveyed by Bloomberg looking for no change. However, it will be interesting to monitor the communication coming out of the central bank over coming days to get a sense of the direction of interest rates going forward. Consensus still looks for the country’s growth rate to be relatively robust, with the 2015 consensus standing at 5.5%, and 2016’s also at 4.5%. At the same time, inflation expectations stand at 3.2% for 2015, and 3.0% for 2016, hence the anchored expectations should give the central bank some comfort. This is consistent with FinMin Cardenas’ comments on November 27, when he said he expects no change in today’s meeting, and also mentioned that he sees current growth, inflation, and the exchange rate as “near optimum levels”. Next week’s main data release is likely to be the publication of the CPI data, where inflation is expected to rise to 3.57%, up from 3.29% in October, but the spike seems to be seen as temporary. In addition, export data will be interesting to see if the weakening COP has had any impact, which we don’t expect given the depreciation of the peso is too recent in our view.
Mexico: The Mexican government has been under intense pressure from domestic / foreign demonstrations against the country’s security problems for the past couple of months, while the government has been scrambling to put together an action plan. President Peña Nieto last night announced a number of planned actions, which we see as an important step. These include:
Replacing municipal police forces with unified state forces, meaning the country will now only have 32 local police forces, as opposed to over 1800. These will complement the federal forces.
The responsibilities of the different orders of government for combating crime will be redefined.
Establishing a single citizen identification number to make information sharing across government functions easier (we see this step as a positive on several fronts).
Eduardo Suárez (416) 945-4538 [email protected]

Foreign Exchange Strategy
Global Views
November 28, 2014
21
… continued from previous page
Creating a procedure for the Federal Government to take over local governments that have been infiltrated by organized crime.
Providing incentives for companies to set up operations in the poorer states, many of which also face among the most intense security-related pressures (these incentives include development bank financing, infrastructure, trade support, tax benefits and discounts to social security contributions).
Creating a new “emergency number” (911).
The planned steps seem consistent with many of the key recommendations we have heard are seen as necessary by security experts, and we see them as positive, if properly implemented. However, besides the security plan’s design, the implementation stage will be important. Over recent weeks there appears to have been a deterioration of the trust the population has in the government, and it is not yet clear what the reaction to the plan will be. Some of the reactions we think are important to look for in coming days are:
Initial reactions from major opposition parties have so far indicated they don’t see the plans as enough (a more inclusive plan, where the opposition and key players from the private sector / civil society, could potentially have helped here).
In addition, some of the country’s political commentators have initially written they were looking for a more apologetic tone, although it is not yet clear is this is indeed the broad perception.
Given the importance of the energy reform, for the government’s success, it is important to regain trust in government bidding processes following the recent problems with the Queretaro — Mexico City high speed train. An overhaul of the process for bidding on government projects will likely be necessary — particularly on the transparency front (the importance of transparency in infrastructure projects seemed to be one of the important factors highlighted as necessary for infra to boost growth in the latest WEO from the IMF).
For next week, the main event seems likely to be Banxico’s MPC meeting, where all the economists surveyed by Bloomberg look for unchanged rates (which we agree with). In addition, the PMI data should be watched.
Peru: Next week’s main data release seems likely to be CPI for November, where an acceleration to 3.22% is anticipated by consensus, which would put inflation 120bps above the BCRP’s target range. Similar to Chile, our sense is that the BCRP is waiting for inflation to abate in order to provide further stimulus to the slowing Peruvian economy, although in Peru’s case, the government’s fiscal stimulus package should also help. Our local economics team put out an interesting piece where they outline how the ultimate stimulus will depend on how successfully its contents are executed, and also highlighted that the tax changes included in the package presents a risk of fiscal slippage but, given the strength of Peru’s fiscal position, this risk is not a major concern.
Depending on whether the program is fully implemented or only partially successful, its economic impact is seen as ranging from 1% to 2.2% of GDP by our local team.
Our local team sees a risk that the fiscal changes, combined with softer metals prices could lead Peru to have a structural fiscal deficit of over 1% of GDP going forward.
This last risk could derail the country’s new fiscal rule even as it is implemented for the first time.
Eduardo Suárez (416) 945-4538 [email protected]

Economics
Global Views
November 28, 2014
22
Key Data Preview
CANADA
Canadian jobs numbers have been volatile in 2014, with large swings muddying perceptions of the actual state of affairs in Canada’s labour market. We’re looking for a modest 5k print for November when the data lands on Friday. This is in part due to a base effect following a +43k print in October and a +74k print in September which adds some downside risk to this month. Plus, recent gains in employment have been somewhat stronger than the year-on-year pace of increase in total hours worked. As the chart to the right shows, while this is by no means unprecedented, it is fairly anomalous. We anticipate that the two will converge in the months ahead, with the pace of cumulative job gains dwindling (and hopefully with hours worked picking up a little).
Can the Canadian trade balance maintain its recent strength amidst falling oil prices and a weaker C$? In the short-run, we’re anticipating that weak oil prices plus deceleration in U.S. auto assemblies in October should translate into a bit of a pullback in Canada’s trade balance to a smaller surplus of C$200m in nominal terms on the month. Key data points supporting that view include U.S. vehicle assemblies at 11.07m in Oct. vs. 11.47m in September implying less demand for shipment of parts and even finished units from Canada into the integrated North American supply chain. Oil prices also fell quite a bit on the month (-9.3% m/m in terms of the average price for WTI and -10.1% in terms of the average price of Western Canada Select) pointing to downside to Canada’s nominal exports. The weaker C$ (-2% on the month in terms of average level against the USD) should mitigate this somewhat.
UNITED STATES
Will the ISM manufacturing index follow the Philly Fed survey higher? As the chart to the right shows, the relationship between ISM and the Philly Fed survey, while close, is not airtight, and the Philly Fed survey offers no guarantee for a gangbuster ISM, leaving us expecting an improvement to a reading of 60 on ISM, but nothing off the charts.
We’re looking for ongoing strength in US employment in November, and anticipating a 250k nonfarm print . Watch out for potential upgrades to October nonfarm payrolls as the not-seasonally-adjusted (NSA) nonfarm print for October came in at +1.064m and yet the seasonally adjusted job change was only 214k. By way of comparison, October payrolls clocked a seasonally adjusted gain of 237k in 2013 on a +944k NSA improvement, a +225 gain in 2012 on a +922k NSA improvement, and a +241k gain in 2010 on a +974k NSA improvement, i.e. the NSA gain this October was somewhat consistent with a stronger seasonally adjusted number than the BLS initially printed. We’re looking for the unemployment rate to tick down to 5.7%.
The trade deficit could well narrow to USD 41bn in October on a number of factors, starting with the stronger trade-weighted dollar (+1.7% m/m on average) and carrying over to lower oil prices (although the U.S. is undergoing a renaissance in domestic oil production, it still imported 7.55m barrels per day of raw crude in September). Note that there has been a tendency on the part of importers to bring in more crude when prices fall, so we will be eagerly watching to see how the import picture is developing with respect to the crude oil trade balance.
Dov Zigler (212) 225-6631 [email protected]
Derek Holt (416) 863-7707 [email protected]
Frances Donald (416) 862-3080 [email protected]
A1
-600
-400
-200
0
200
400
600
-7.5 -5 -2.5 0 2.5 5
Job Gains Outpacing Hours WorkedHours Worked vs. Job Change, Y/Y
(1980- Present)
Jobs, 000s
Total HoursWorked, %
Oct. 2014
Source: Scotiabank Economics, Statistics Canada
30
35
40
45
50
55
60
65
70
-50
-40
-30
-20
-10
0
10
20
30
40
50
2010 2011 2012 2013 2014
Philly Fed (LHS)
ISM Manufacturing (RHS)
Index Index
Source: Scotiabank Economics, ISM, FRB.
ISM to Follow Philly Fed?

Economics
Global Views
November 28, 2014
23
… continued from previous page
EUROPE
The European Central Bank’s (ECB) governing council will meet and announce its policy decision next week on December 4th. Key interest rates will remain unchanged and the ECB is not expected to announce any new unconventional monetary accommodation. However, given the euro zone’s ongoing economic challenges and disinflationary pressures (flash HICP edged lower to 0.3% y/y in November), The press conference with ECB President, Mario Draghi, will be closely watched for any clues on prospects and timing for a larger-scale quantitative easing program. Draghi, and Vice-President Vitor Constâncio, have both hinted that the ECB is considering a program of sovereign debt purchases in the first three months of 2015 if current measures (covered bond and asset-backed security purchases) prove insufficient. Our view remains that, before a full-scale QE program is announced, the ECB might opt to purchase corporate bonds or European Investment Bank bonds. Nevertheless, it is critical that the groundwork for new stimulus is laid out at the December meeting in order to avoid a strengthening in the euro. ECB officials, however, continue to reiterate that monetary policy is no cure-all and must act in tandem with fiscal policy. Draghi has stepped up his push for economic union, alluding that the currency bloc’s fiscal unification must go beyond the existing EU budget rules to prevent actions taken at the national level from undermining regional growth.
LATIN AMERICA
Peru, Brazil, and Colombia will release November inflation figures on December 1st, 5th, and 5th, respectively. Peruvian inflation is expected to tick up to 3.2% y/y in November, up from 3.1% the previous month. Strong economic performance coupled with a weaker currency pushed the pace of price growth up slightly, but Peruvian authorities believe that this is a temporary phenomenon and that falling food and energy prices will counteract some of the inflationary pressures. In Brazil, we believe that November price growth will come in at around 6.6% y/y, unchanged from October but down from September’s 3-year-high of 6.8%. However, this is still over 200 basis points above the Brazilian central bank’s inflation target band and will likely prompt further tightening in the months ahead. Colombian price growth will likely accelerate to 3.6% y/y in November, up 30 basis points over the October print. The economy is running hot and there is plenty of upward pressure on prices; however, recent plunging oil prices will likely slow Colombia’s economy and ease inflationary dynamics somewhat.
ASIA/PACIFIC
Australia will release third quarter GDP data on December 2nd (EST). We estimate that output expanded by 0.5% q/q (2.9% y/y) following a similar 0.5% q/q (3.1% y/y) increase in the second quarter. The economy’s performance is underpinned by rising resource exports that reflect increased mining capacity following several investment project completions. However, economic momentum will be dampened by weakening mining investment activity and the government’s fiscal consolidation efforts. The Australian labour market is showing signs of modest improvement, though demand for labour will likely remain soft for the time being. Nevertheless, the combined effect of strong house price gains and accommodative monetary policy should continue to support consumer confidence and household spending, thereby offsetting lower investment growth. We expect Australia’s real GDP growth to average 3.0% this year, followed by a slight moderation to 2.7% in 2015.
A2
Tuuli McCully (416) 863-2859 [email protected]
Rory Johnston (416) 862-3908 [email protected]
Erika Cain (416) 866-4205 [email protected]
0.0
0.2
0.4
0.6
0.8
1.0
1.2
Mar-12 Mar-13 Mar-14
Australian Real GDP Growth
y/y % change
Source: Scotiabank Economics.
forecast
0
1
2
3
4
5
6
7
8
Nov-10 Nov-11 Nov-12 Nov-13 Nov-14
Source: Bloomberg, Scotiabank Economics.
y/y %change
Colombia
Peru
Brazil
Brazilian, Colombian, & Peruvian CPIforecast

Economics
Global Views
November 28, 2014
1
Key Indicators for the week of December 1 – 5
Forecasts at time of publication. Source: Bloomberg, Scotiabank Economics.
North America
Europe
A3
Country Date Time Indicator Period BNS Consensus LatestIT 12/01 03:45 Manufacturing PMI Nov 50.0 49.4 49.0FR 12/01 03:50 Manufacturing PMI Nov F 47.6 47.6 47.6GE 12/01 03:55 Manufacturing PMI Nov F 50.0 50.0 50.0EC 12/01 04:00 Manufacturing PMI Nov F 50.4 50.4 50.4IT 12/01 04:00 Real GDP (q/q) 3Q F -0.1 -0.1 -0.1UK 12/01 04:30 Manufacturing PMI Nov -- 53.0 53.2IT 12/01 Budget Balance (€ bn) Nov -- -- -8.5UK DEC 1-5 Halifax House Price (3 month, y/y) Nov -- 8.0 8.8
UK 12/02 04:30 PMI Construction Nov -- 61.0 61.4EC 12/02 05:00 PPI (m/m) Oct -0.3 -0.3 0.2
SZ 12/03 01:45 GDP (y/y) 3Q -- 1.4 1.4HU 12/03 03:00 GDP (y/y) 3Q F -- -- 3.2IT 12/03 03:45 Services PMI Nov 49.5 50.2 50.8FR 12/03 03:50 Services PMI Nov F 48.8 48.8 48.8GE 12/03 03:55 Services PMI Nov F 52.1 52.1 52.1EC 12/03 04:00 Composite PMI Nov F 51.4 51.4 51.4EC 12/03 04:00 Services PMI Nov F 51.3 51.3 51.3UK 12/03 04:30 Official Reserves (£ bn) Nov -- -- -652.0UK 12/03 04:30 Services PMI Nov -- 56.5 56.2EC 12/03 05:00 Retail Trade (m/m) Oct -- 0.5 -1.3
UK 12/04 07:00 BoE Asset Purchase Target (£ bn) Dec -- 375.0 375.0UK 12/04 07:00 BoE Policy Announcement (%) Dec 4 0.50 0.50 0.50EC 12/04 07:45 ECB Announces Interest Rates (%) Dec 4 0.05 0.05 0.05
GE 12/05 02:00 Factory Orders (m/m) Oct 0.2 0.5 0.8SP 12/05 03:00 Industrial Output NSA (y/y) Oct -- -- 3.6EC 12/05 05:00 GDP (q/q) 3Q P 0.2 0.2 0.2
Country Date Time Indicator Period BNS Consensus LatestUS 12/01 10:00 ISM Manufacturing Index Nov 60.0 57.9 59.0
US 12/02 10:00 Construction Spending (m/m) Oct 0.6 0.6 -0.4US 12/02 Domestic Vehicle Sales (mn a.r.) Nov 13.8 13.3 13.1US 12/02 Total Vehicle Sales (mn a.r.) Nov 17.0 16.6 16.4
US 12/03 07:00 MBA Mortgage Applications (w/w) NOV 28 -- -- -4.3US 12/03 08:15 ADP Employment Report (000s m/m) Nov 230.0 221.0 229.6US 12/03 08:30 Productivity (q/q a.r.) 3Q F -- 2.2 2.0US 12/03 08:30 Unit Labor Costs (q/q a.r.) 3Q F -- 0.2 0.3CA 12/03 10:00 BoC Interest Rate Announcement (%) Dec 3 1.00 1.00 1.00US 12/03 10:00 ISM Non-Manufacturing Composite Nov 57.0 57.5 57.1
US 12/04 08:30 Initial Jobless Claims (000s) NOV 28 285 295 313US 12/04 08:30 Continuing Claims (000s) NOV 21 2335 2318 2316
CA 12/05 08:30 Unemployment Rate (%) Nov 6.5 6.6 6.5CA 12/05 08:30 Employment (000s m/m) Nov 5.0 5.0 43.1CA 12/05 08:30 Merchandise Trade Balance (C$ bn) Oct 0.2 0.1 0.7CA 12/05 08:30 Productivity (q/q a.r.) 3Q -- -- 1.8US 12/05 08:30 Unemployment Rate (%) Nov 5.7 5.8 5.8US 12/05 08:30 Nonfarm Employment Report (000s m/m) Nov 250.0 225.0 214.0US 12/05 08:30 Household Employment Report (000s m/m) Nov -- 350.0 683.0US 12/05 08:30 Average Hourly Earnings (m/m) Nov -- 0.2 0.1US 12/05 08:30 Average Weekly Hours Nov -- 34.6 34.6US 12/05 08:30 Trade Balance (US$ bn) Oct -41.0 -41.2 -43.0MX 12/05 10:00 Overnight Rate (%) Dec 5 3.00 3.00 3.00US 12/05 10:00 Factory Orders (m/m) Oct -0.1 0.00 -0.60US 12/05 15:00 Consumer Credit (US$ bn m/m) Oct -- 16.5 15.9

Economics
Global Views
November 28, 2014
2
Key Indicators for the week of December 1 – 5
Forecasts at time of publication. Source: Bloomberg, Scotiabank Economics.
A4
Asia Pacific
Country Date Time Indicator Period BNS Consensus LatestNZ 11/30 16:45 Terms of Trade Index (q/q) 3Q -- -4.5 0.3JN 11/30 18:50 Capital Spending (y/y) 3Q -- 2.0 3.0SK 11/30 19:00 Exports (y/y) Nov -- 1.8 2.3SK 11/30 19:00 Imports (y/y) Nov -- -2.2 -3.0SK 11/30 19:00 Trade Balance (US$ mn) Nov -- 6200.0 7382.0CH 11/30 20:00 Manufacturing PMI Nov -- 50.5 50.8JN 11/30 20:35 Markit/JMMA Manufacturing PMI Nov F 52.1 -- 52.1CH 11/30 20:45 HSBC Flash China Manufacturing PMI Nov F 50.0 50.0 50.0ID 11/30 23:00 Exports (y/y) Oct -- -1.5 3.9ID 11/30 23:00 CPI (y/y) Nov 6.2 6.1 4.8ID 11/30 23:00 Core CPI (y/y) Nov -- 4.4 4.0
JN 12/01 00:00 Vehicle Sales (y/y) Nov -- -- -9.1HK 12/01 03:30 Retail Sales - Volume (y/y) Oct -- 2.1 6.6SK 12/01 18:00 CPI (y/y) Nov 1.1 1.1 1.2SK 12/01 18:00 Core CPI (y/y) Nov -- 1.7 1.8JN 12/01 18:50 Monetary Base (y/y) Nov -- -- 36.9AU 12/01 19:30 Building Approvals (m/m) Oct -- 5.0 -11.0AU 12/01 19:30 Current Account (AUD bn) 3Q -- -13.0 -13.7AU 12/01 19:30 Australia Net Exports of GDP 3Q -- 0.7 -0.9AU 12/01 22:30 RBA Cash Target Rate (%) Dec 2 2.50 2.50 2.50ID 12/01 Imports (y/y) Oct -- -1.6 0.2ID 12/01 Trade Balance (US$ mn) Oct -- -60.5 -270.3JN DEC 1-5 Official Reserve Assets (US$ bn) Nov -- -- 1265.9TH 12/01 CPI (y/y) Nov 1.4 1.3 1.5TH 12/01 Core CPI (y/y) Nov -- 1.6 1.7
IN 12/02 00:30 Repo Rate (%) Dec 2 8.00 8.00 8.00IN 12/02 00:30 Reverse Repo Rate (%) Dec 2 7.00 7.00 7.00IN 12/02 00:30 Cash Reserve Ratio (%) Dec 2 4.00 4.00 4.00SI 12/02 08:30 Purchasing Managers Index Nov -- 51.6 51.9AU 12/02 19:30 GDP (y/y) 3Q 2.9 3.1 3.1CH 12/02 20:00 Non-manufacturing PMI Nov -- -- 53.8CH 12/02 20:45 HSBC Services PMI Nov -- -- 52.9HK 12/02 21:30 Purchasing Managers Index Nov -- -- 47.7
NZ 12/03 18:00 QV House Prices (y/y) Nov -- -- 5.9SK 12/03 18:00 GDP (y/y) 3Q F 3.2 3.2 3.2AU 12/03 19:30 Retail Sales (m/m) Oct -- 0.1 1.2AU 12/03 19:30 Trade Balance (AUD mn) Oct -- -1800.0 -2261.0TH 12/03 22:30 Consumer Confidence Economic Nov -- -- 69.6
TA 12/04 19:30 CPI (y/y) Nov 1.2 1.3 1.1PH 12/04 20:00 CPI (y/y) Nov 4.1 4.0 4.3PH 12/04 20:00 Core CPI (y/y) Nov -- -- 3.2MA 12/04 23:01 Exports (y/y) Oct -- 0.2 2.0MA 12/04 23:01 Imports (y/y) Oct -- -0.1 1.1MA 12/04 23:01 Trade Balance (MYR bn) Oct -- 8.9 9.3ID DEC 3-4 Consumer Confidence Index Nov -- -- 120.6
JN 12/05 00:00 Coincident Index CI Oct P -- 110.0 109.8JN 12/05 00:00 Leading Index CI Oct P -- 104.1 105.6AU 12/05 00:30 Foreign Reserves (AUD bn) Nov -- -- 53.6
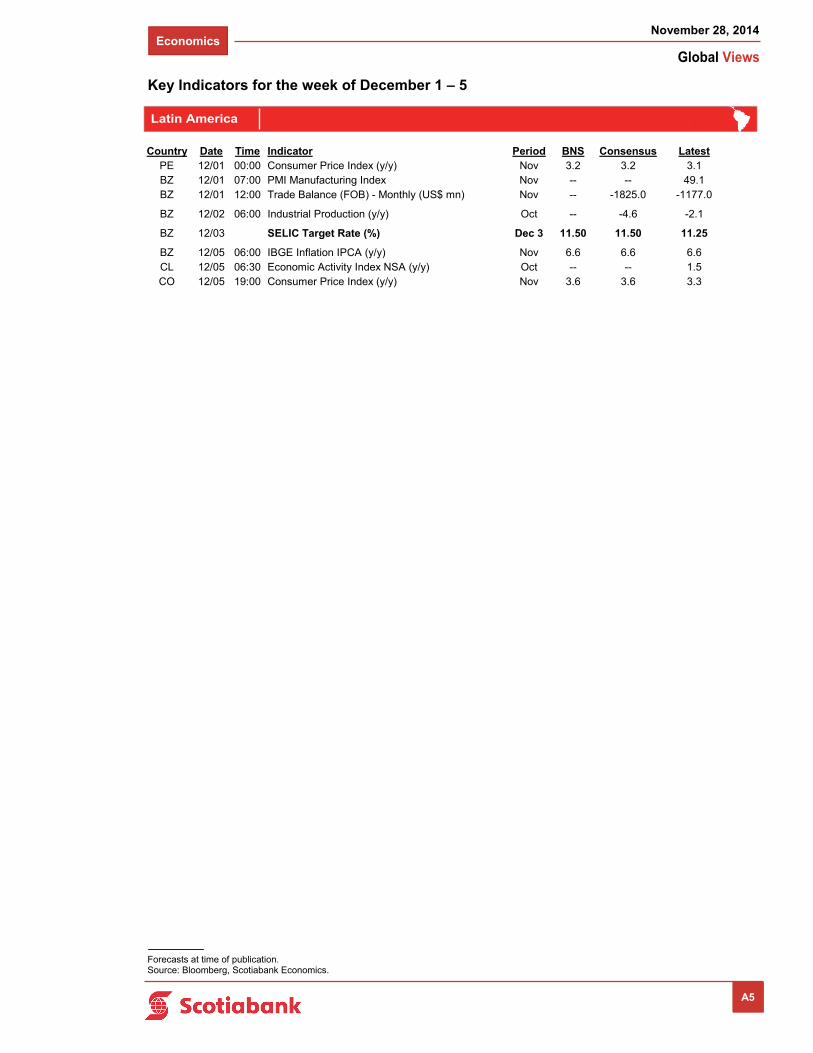
Economics
Global Views
November 28, 2014
3
Key Indicators for the week of December 1 – 5
Forecasts at time of publication. Source: Bloomberg, Scotiabank Economics.
A5
Latin America
Country Date Time Indicator Period BNS Consensus LatestPE 12/01 00:00 Consumer Price Index (y/y) Nov 3.2 3.2 3.1BZ 12/01 07:00 PMI Manufacturing Index Nov -- -- 49.1BZ 12/01 12:00 Trade Balance (FOB) - Monthly (US$ mn) Nov -- -1825.0 -1177.0
BZ 12/02 06:00 Industrial Production (y/y) Oct -- -4.6 -2.1
BZ 12/03 SELIC Target Rate (%) Dec 3 11.50 11.50 11.25
BZ 12/05 06:00 IBGE Inflation IPCA (y/y) Nov 6.6 6.6 6.6CL 12/05 06:30 Economic Activity Index NSA (y/y) Oct -- -- 1.5CO 12/05 19:00 Consumer Price Index (y/y) Nov 3.6 3.6 3.3

Economics
Global Views
November 28, 2014
4
Global Auctions for the week of December 1 – 5
North America
Europe
Source: Bloomberg, Scotiabank Economics.
A6
Asia Pacific
Latin America
Country Date Time EventUS 12/01 11:30 U.S. to Sell 3-Month BillsUS 12/01 11:30 U.S. to Sell 6-Month Bills
US 12/02 11:30 U.S. to Sell 4-Week Bills
Country Date Time EventNE 12/01 06:00 Netherlands Cancels Bills AuctionFR 12/01 08:50 France to Sell Bills
MB 12/02 05:00 Malta to Sell BillsNO 12/02 05:00 Norway to Sell BondsEC 12/02 05:10 ECB Main Refinancing Operation ResultSZ 12/02 05:15 Switzerland to Sell 91-Day BillsBE 12/02 05:30 Belgium to Sell 3-Month BillsBE 12/02 05:30 Belgium to Sell 6-Month BillsUK 12/02 05:30 U.K. to Sell GBP3.75 Bln 2% 2020 Bonds
PO 12/03 05:00 Portugal to Sell 3-Month & 12 Month BillsSW 12/03 05:03 Sweden to Sell BillsGE 12/03 05:30 Germany to Sell EUR3 Bln 0.25% 2019 Bonds
SP 12/04 04:30 Spain to Sell BondsFR 12/04 04:50 France to Sell BondsSW 12/04 05:03 Sweden to Sell I/L Bonds
IC 12/05 06:00 Iceland to Sell BondsUK 12/05 06:00 U.K. to Sell 1-Month BillsUK 12/05 06:00 U.K. to Sell 3-Month BillsUK 12/05 06:00 U.K. to Sell 6-Month Bills
Country Date Time EventCH 11/30 22:00 China Development Bank To Sell 1-Year Bonds
JN 12/01 22:45 Japan to Sell 10-Year Bonds
CH 12/02 22:00 China to Sell 7-Year Bonds
NZ 12/03 20:05 New Zealand Plans to Sell NZD100 Mln Indexed Linked BondsJN 12/03 22:35 Japan to Sell 3-Month Bill
JN 12/04 03:00 Japan Auction for Enhanced-Liquidity
Country Date Time EventBZ 12/02 09:15 Brazil to Sell I/L Bonds due 5/15/2019 - NTN-BBZ 12/02 09:15 Brazil to Sell I/L Bonds due 5/15/2023 - NTN-BBZ 12/02 09:15 Brazil to Sell I/L Bonds due 8/15/2030 - NTN-BBZ 12/02 09:15 Brazil to Sell I/L Bonds due 8/15/2040 - NTN-BBZ 12/02 09:15 Brazil to Sell I/L Bonds due 8/15/2050 - NTN-B
BZ 12/04 09:15 Brazil to Sell Bills due 10/01/2015 - LTNBZ 12/04 09:15 Brazil to Sell Bills due 10/01/2016 - LTNBZ 12/04 09:15 Brazil to Sell Bills due 07/01/2018 - LTNBZ 12/04 09:15 Brazil to Sell Floating-rate Notes due 9/1/2020 - LFT

Economics
Global Views
November 28, 2014
5
Events for the week of December 1 – 5
North America
Europe
Source: Bloomberg, Scotiabank Economics.
A7
Country Date Time EventUS 12/01 12:15 Fed's Dudley Speaks on Economic Outlook in New YorkUS 12/01 13:00 Fed's Fischer Speaks on Global Economics in New York
US 12/02 08:10 Fed's Fischer Speaks on Panel in WashingtonUS 12/02 08:30 Fed's Yellen Gives Welcoming Remarks to Students in WashingtonUS 12/02 12:00 Fed's Brainard Speaks by Video on Paperwork Reduction
CA 12/03 10:00 Bank of Canada Rate DecisionUS 12/03 12:30 Fed's Plosser Speaks on the Economic Outlook in Charlotte, NCUS 12/03 14:00 U.S. Federal Reserve Releases Beige BookUS 12/03 14:00 Fed's Brainard Speaks on Financial Stability in WashingtonCA 12/03 17:30 Stephen Poloz Speaks at the Canada SummitUS 12/03 19:30 Fed's Fisher Addresses Dallas Business Club
US 12/04 08:30 Fed's Mester Gives Opening Remarks at Conference in WashingtonCA 12/04 11:15 Ontario Premier Wynne Speaks at Women of Influence LuncheonUS 12/04 12:30 Fed's Brainard Speaks on Financial Stability at in Washington
US 12/05 08:45 Fed's Mester Speaks on Financial Stability in WashingtonMX 12/05 10:00 Overnight RateUS 12/05 14:45 Fed's Fischer Speaks Via Video to IMF Event in Washington
Country Date Time EventEC 11/29 05:30 ECB's Lautenschlaeger Speaks in Berlin
PO 12/01 04:30 Bank of Portugal's Costa, Finance Minister Speak at ConferencePO 12/01 10:00 ECB's Costa Speaks at Conference in Lisbon
GR 12/02 03:00 ECB Governing Council member Y. Stournaras speaks in AthensIT 12/02 10:00 Bank of Italy's Panetta Speaks at Banking Union Conference
SW 12/04 03:30 Riksbank Financial Stability ReportEC 12/04 03:40 ECB's Coeure, BNP's Lemierre Speak at Conference in BrusselsNO 12/04 04:00 Norway's Statistics Office Releases Economic ForecastsUK 12/04 07:00 Bank of England Bank RateUK 12/04 07:00 BOE Asset Purchase TargetEC 12/04 07:45 ECB Main Refinancing RateEC 12/04 07:45 ECB Deposit Facility RateEC 12/04 07:45 ECB Marginal Lending FacilityEC 12/04 08:30 ECB'S Draghi Holds Press Conference After Rate DecisionUK 12/04 09:00 BOE's Andrew Gracie Speaks in London
GE 12/05 03:00 Zeit Economic Forum With Schaeuble, Weidmann: FrankfurtEC 12/05 04:00 ECB's Nowotny Presents Austrian Central Bank's GDP ForecastEC 12/05 06:00 ECB Announces 3-Year LTRO RepaymentIR 12/05 Ireland Sovereign Debt Rating Published by S&PIT 12/05 Italy Sovereign Debt Rating Published by S&P
SW 12/05 Sweden Sovereign Debt Rating May Be Published by Moody's

Economics
Global Views
November 28, 2014
6
Latin America
Events for the week of December 1 – 5
Source: Bloomberg, Scotiabank Economics.
A8
Asia Pacific
Country Date Time EventMA 11/24 00:00 United Malays National Organization Convenes General Assembly
TA 11/29 03:00 Taiwan's Election Polls Close
NZ 11/30 14:45 RBNZ Governor Wheeler Speaks at Inflation ConferenceNZ 11/30 20:00 Treasury Publishes Monthly Economic IndicatorsNZ NOV 30-DEC 1 RBNZ Hosts Conference on Inflation Targeting
AU 12/01 00:30 Commodity Index YoYAU 12/01 22:30 RBA Cash Rate Target
IN 12/02 00:30 RBI Cash Reserve RatioIN 12/02 00:30 RBI Repurchase RateIN 12/02 00:30 RBI Reverse Repo Rate
Country Date Time EventPE 12/01 UN Climate Change Conference
BZ 12/03 Selic Rate
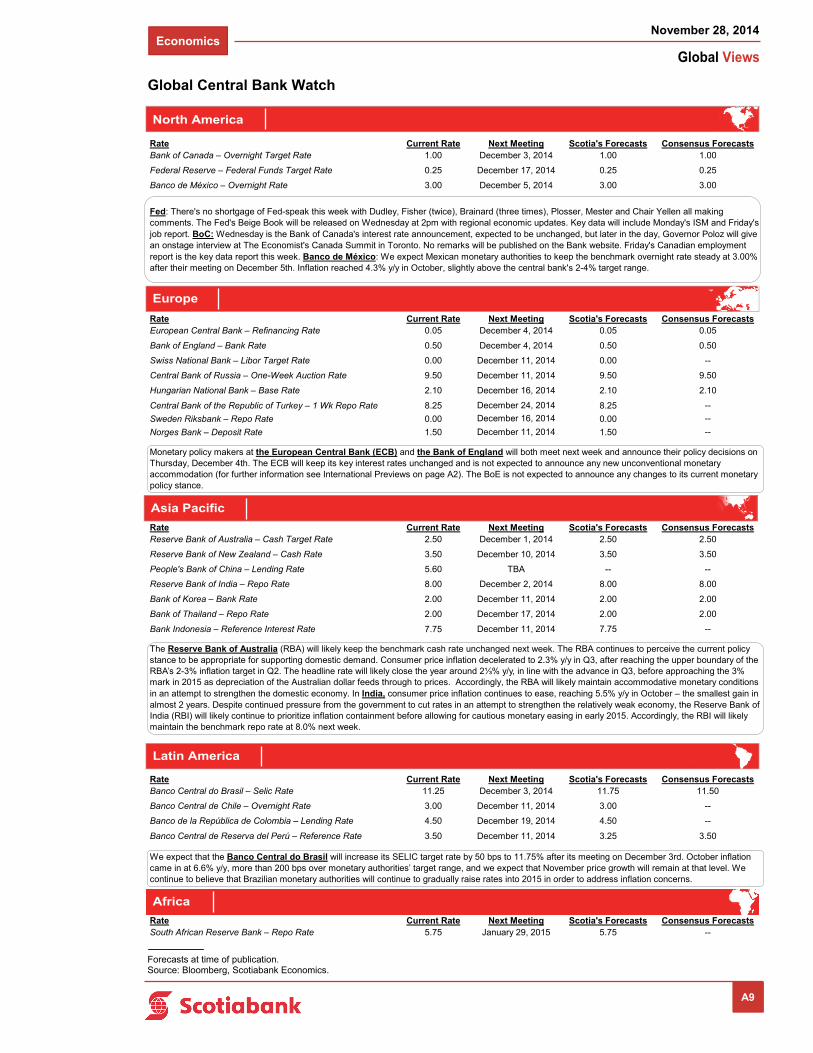
Economics
Global Views
November 28, 2014
7
Global Central Bank Watch
NORTH AMERICARate Current Rate Next Meeting Scotia's Forecasts Consensus ForecastsBank of Canada – Overnight Target Rate 1.00 December 3, 2014 1.00 1.00
Federal Reserve – Federal Funds Target Rate 0.25 December 17, 2014 0.25 0.25
Banco de México – Overnight Rate 3.00 December 5, 2014 3.00 3.00
EUROPERate Current Rate Next Meeting Scotia's Forecasts Consensus ForecastsEuropean Central Bank – Refinancing Rate 0.05 December 4, 2014 0.05 0.05
Bank of England – Bank Rate 0.50 December 4, 2014 0.50 0.50
Swiss National Bank – Libor Target Rate 0.00 December 11, 2014 0.00 --
Central Bank of Russia – One-Week Auction Rate 9.50 December 11, 2014 9.50 9.50
Hungarian National Bank – Base Rate 2.10 December 16, 2014 2.10 2.10
Central Bank of the Republic of Turkey – 1 Wk Repo Rate 8.25 December 24, 2014 8.25 --
Sweden Riksbank – Repo Rate 0.00 December 16, 2014 0.00 --
Norges Bank – Deposit Rate 1.50 December 11, 2014 1.50 --
ASIA PACIFICRate Current Rate Next Meeting Scotia's Forecasts Consensus ForecastsReserve Bank of Australia – Cash Target Rate 2.50 December 1, 2014 2.50 2.50
Reserve Bank of New Zealand – Cash Rate 3.50 December 10, 2014 3.50 3.50
People's Bank of China – Lending Rate 5.60 TBA -- --
Reserve Bank of India – Repo Rate 8.00 December 2, 2014 8.00 8.00
Bank of Korea – Bank Rate 2.00 December 11, 2014 2.00 2.00
Bank of Thailand – Repo Rate 2.00 December 17, 2014 2.00 2.00
Bank Indonesia – Reference Interest Rate 7.75 December 11, 2014 7.75 --
LATIN AMERICARate Current Rate Next Meeting Scotia's Forecasts Consensus ForecastsBanco Central do Brasil – Selic Rate 11.25 December 3, 2014 11.75 11.50
Banco Central de Chile – Overnight Rate 3.00 December 11, 2014 3.00 --
Banco de la República de Colombia – Lending Rate 4.50 December 19, 2014 4.50 --
Banco Central de Reserva del Perú – Reference Rate 3.50 December 11, 2014 3.25 3.50
AFRICARate Current Rate Next Meeting Scotia's Forecasts Consensus ForecastsSouth African Reserve Bank – Repo Rate 5.75 January 29, 2015 5.75 --
Fed: There's no shortgage of Fed-speak this week with Dudley, Fisher (twice), Brainard (three times), Plosser, Mester and Chair Yellen all making comments. The Fed's Beige Book will be released on Wednesday at 2pm with regional economic updates. Key data will include Monday's ISM and Friday's job report. BoC: Wednesday is the Bank of Canada's interest rate announcement, expected to be unchanged, but later in the day, Governor Poloz will give an onstage interview at The Economist's Canada Summit in Toronto. No remarks will be published on the Bank website. Friday's Canadian employment report is the key data report this week. Banco de México: We expect Mexican monetary authorities to keep the benchmark overnight rate steady at 3.00% after their meeting on December 5th. Inflation reached 4.3% y/y in October, slightly above the central bank's 2-4% target range.
We expect that the Banco Central do Brasil will increase its SELIC target rate by 50 bps to 11.75% after its meeting on December 3rd. October inflation came in at 6.6% y/y, more than 200 bps over monetary authorities’ target range, and we expect that November price growth will remain at that level. We continue to believe that Brazilian monetary authorities will continue to gradually raise rates into 2015 in order to address inflation concerns.
The Reserve Bank of Australia (RBA) will likely keep the benchmark cash rate unchanged next week. The RBA continues to perceive the current policy stance to be appropriate for supporting domestic demand. Consumer price inflation decelerated to 2.3% y/y in Q3, after reaching the upper boundary of the RBA’s 2-3% inflation target in Q2. The headline rate will likely close the year around 2⅓% y/y, in line with the advance in Q3, before approaching the 3% mark in 2015 as depreciation of the Australian dollar feeds through to prices. Accordingly, the RBA will likely maintain accommodative monetary conditions in an attempt to strengthen the domestic economy. In India, consumer price inflation continues to ease, reaching 5.5% y/y in October – the smallest gain in almost 2 years. Despite continued pressure from the government to cut rates in an attempt to strengthen the relatively weak economy, the Reserve Bank of India (RBI) will likely continue to prioritize inflation containment before allowing for cautious monetary easing in early 2015. Accordingly, the RBI will likely maintain the benchmark repo rate at 8.0% next week.
Monetary policy makers at the European Central Bank (ECB) and the Bank of England will both meet next week and announce their policy decisions on Thursday, December 4th. The ECB will keep its key interest rates unchanged and is not expected to announce any new unconventional monetary accommodation (for further information see International Previews on page A2). The BoE is not expected to announce any changes to its current monetary policy stance.
North America
Europe
Asia Pacific
Latin America
Africa
Forecasts at time of publication. Source: Bloomberg, Scotiabank Economics.
A9

Economics
Global Views
November 28, 2014
8
Forecasts as at October 30, 2014* 2000-13 2014f 2015f 2016f 2000-13 2014f 2015f 2016f
Output and Inflation (annual % change) Real GDP Consumer Prices2
World13.9 3.3 3.7 3.7
Canada 2.2 2.3 2.5 2.4 2.0 1.9 1.7 2.1 United States 1.9 2.3 3.2 3.0 2.4 1.7 1.8 2.3 Mexico 2.3 2.2 3.6 3.8 4.7 4.2 4.2 4.0
United Kingdom 1.8 3.0 2.5 2.0 2.3 1.6 2.0 2.1 Euro zone 1.2 0.7 1.2 1.4 2.0 0.5 1.0 1.1
Japan 0.9 1.3 1.0 0.8 -0.1 2.5 2.5 1.4 Australia 3.0 3.0 2.7 2.9 3.0 2.3 2.9 2.7 China 9.1 7.4 7.2 6.8 2.4 2.3 2.7 3.0 India 7.0 5.5 5.8 6.2 6.7 3.5 5.0 5.8 Korea 4.1 3.5 3.6 3.8 2.9 1.4 2.4 3.0 Thailand 4.1 1.5 3.8 4.0 2.6 1.7 2.4 3.0
Brazil 3.4 0.3 1.0 2.5 6.5 6.5 6.2 5.5 Chile 4.4 2.0 3.1 4.0 3.2 4.2 2.9 3.0 Peru 5.6 2.9 5.0 6.2 2.6 3.0 3.0 2.8
Central Bank Rates (%, end of period) 14Q4f 15Q1f 15Q2f 15Q3f 15Q4f 16Q1f 16Q2f 16Q3f
Bank of Canada 1.00 1.00 1.00 1.00 1.00 1.25 1.50 2.00Federal Reserve 0.25 0.25 0.50 0.75 1.25 1.50 1.75 2.25European Central Bank 0.05 0.05 0.05 0.05 0.05 0.05 0.05 0.05Bank of England 0.50 0.50 0.75 0.75 1.00 1.00 1.25 1.50Swiss National Bank 0.00 0.00 0.00 0.00 0.00 0.00 0.00 0.00Reserve Bank of Australia 2.50 2.50 2.50 2.75 3.00 3.25 3.50 3.75
Exchange Rates (end of period)
Canadian Dollar (USDCAD) 1.11 1.12 1.12 1.13 1.13 1.14 1.14 1.15Canadian Dollar (CADUSD) 0.90 0.89 0.89 0.88 0.88 0.88 0.88 0.87Euro (EURUSD) 1.25 1.24 1.23 1.22 1.21 1.20 1.19 1.18Sterling (GBPUSD) 1.60 1.60 1.59 1.58 1.58 1.57 1.56 1.55Yen (USDJPY) 109 110 111 112 113 114 115 116Australian Dollar (AUDUSD) 0.87 0.86 0.86 0.87 0.88 0.89 0.89 0.90Chinese Yuan (USDCNY) 6.1 6.1 6.0 6.0 6.0 6.0 5.9 5.9Mexican Peso (USDMXN) 13.4 13.5 13.4 13.5 13.7 13.5 13.3 13.3Brazilian Real (USDBRL) 2.45 2.50 2.55 2.55 2.60 2.70 2.70 2.80
Commodities (annual average) 2000-13 2014f 2015f 2016f
WTI Oil (US$/bbl) 63 95 85 90Brent Oil (US$/bbl) 65 102 88 93Nymex Natural Gas (US$/mmbtu) 5.32 4.40 4.00 4.00
Copper (US$/lb) 2.30 3.16 3.05 3.00Zinc (US$/lb) 0.79 1.00 1.25 1.60Nickel (US$/lb) 7.58 8.00 10.00 12.00Gold, London PM Fix (US$/oz) 792 1,275 1,225 1,300
Pulp (US$/tonne) 745 1,025 1,005 1,020Newsprint (US$/tonne) 587 605 625 630Lumber (US$/mfbm) 280 355 385 400
1 World GDP for 2000-13 are IMF PPP estimates; 2014-16f are Scotiabank Economics' estimates based on a 2013 PPP-weighted sample of 38 countries. 2 CPI for Canada and the United States are annual averages. For other countries, CPI are year-end rates.
* See Scotiabank Economics 'Global Forecast Update' report for additional forecasts & commentary.
Brazil
India South Korea Thailand
Chile Peru
Japan
Canada
United States
Mexico
United Kingdom
Australia China
Euro Zone
A10
Forecasts as at October 30, 2014*

Economics
Global Views
November 28, 2014
9
North America
Canada 2013 14Q2 14Q3 Latest United States 2013 14Q2 14Q3 Latest Real GDP (annual rates) 2.0 3.6 2.8 Real GDP (annual rates) 2.2 4.6 3.9 Current Acc. Bal. (C$B, ar) -56.3 -39.6 -33.6 Current Acc. Bal. (US$B, ar) -400 -394 Merch. Trade Bal. (C$B, ar) -7.3 5.2 9.0 8.5 (Sep) Merch. Trade Bal. (US$B, ar) -702 -757 -731 -752 (Sep) Industrial Production 0.4 3.4 2.7 2.5 (Oct) Industrial Production 2.9 4.1 4.1 4.0 (Oct) Housing Starts (000s) 188 197 199 184 (Oct) Housing Starts (millions) 0.93 0.99 1.03 1.01 (Oct) Employment 1.3 0.6 0.7 1.1 (Oct) Employment 1.7 1.8 1.9 2.0 (Oct) Unemployment Rate (%) 7.1 7.0 6.9 6.5 (Oct) Unemployment Rate (%) 7.4 6.2 6.1 5.8 (Oct) Retail Sales 3.2 5.2 4.8 4.5 (Sep) Retail Sales 4.3 4.5 4.2 3.8 (Oct) Auto Sales (000s) 1744 1816 1958 1987 (Sep) Auto Sales (millions) 15.5 16.5 16.7 16.3 (Oct) CPI 0.9 2.2 2.1 2.4 (Oct) CPI 1.5 2.1 1.8 1.7 (Oct) IPPI 0.4 3.4 2.7 -2.5 (Oct) PPI 1.2 2.8 2.4 1.7 (Oct) Pre-tax Corp. Profits -0.6 12.0 10.3 Pre-tax Corp. Profits 4.6 10.4 9.0
Mexico Real GDP 1.4 1.6 2.2 Current Acc. Bal. (US$B, ar) -26.5 -30.6 -10.8 Merch. Trade Bal. (US$B, ar) -1.2 4.3 -6.1 1.7 (Oct) Industrial Production -0.5 1.1 2.0 3.0 (Sep) CPI 3.8 3.6 4.1 4.3 (Oct)
Euro Zone 2013 14Q2 14Q3 Latest Germany 2013 14Q2 14Q3 Latest Real GDP -0.4 0.7 Real GDP 0.2 1.4 1.2 Current Acc. Bal. (US$B, ar) 263 245 430 480 (Sep) Current Acc. Bal. (US$B, ar) 189.2 280.7 308.5 344.6 (Sep) Merch. Trade Bal. (US$B, ar) 274.2 331.1 285.6 317.4 (Sep) Merch. Trade Bal. (US$B, ar) 278.9 287.3 321.6 301.0 (Sep) Industrial Production -0.7 0.8 0.4 0.1 (Sep) Industrial Production 0.1 1.1 0.1 -0.2 (Sep) Unemployment Rate (%) 11.9 11.6 11.5 11.5 (Oct) Unemployment Rate (%) 6.9 6.7 6.7 6.6 (Nov) CPI 1.4 0.6 0.4 0.4 (Oct) CPI 1.5 1.1 0.8 1.6 (Nov)
France United Kingdom Real GDP 0.4 0.0 0.4 Real GDP 1.7 3.2 3.0 Current Acc. Bal. (US$B, ar) -40.3 -62.7 -2.0 46.7 (Sep) Current Acc. Bal. (US$B, ar) -72.4 -92.4 Merch. Trade Bal. (US$B, ar) -46.5 -41.4 -46.4 -43.9 (Sep) Merch. Trade Bal. (US$B, ar) -172.3 -189.2 -194.0 -192.1 (Sep) Industrial Production -0.6 -2.1 -0.1 -0.3 (Sep) Industrial Production -0.1 2.4 1.9 1.4 (Sep) Unemployment Rate (%) 10.3 10.2 10.5 10.5 (Oct) Unemployment Rate (%) 7.6 6.3 6.0 (Aug) CPI 0.9 0.6 0.4 0.5 (Oct) CPI 2.6 1.7 1.5 1.3 (Oct)
Italy Russia Real GDP -1.9 -0.3 -0.4 Real GDP 1.3 0.8 0.7 Current Acc. Bal. (US$B, ar) 16.6 24.6 40.1 7.6 (Sep) Current Acc. Bal. (US$B, ar) 34.1 14.1 11.4 Merch. Trade Bal. (US$B, ar) 38.8 57.4 58.9 31.2 (Sep) Merch. Trade Bal. (US$B, ar) 15.2 17.3 15.3 13.0 (Sep) Industrial Production -3.1 -0.2 -1.3 -2.3 (Sep) Industrial Production 0.4 1.9 1.4 2.9 (Oct) CPI 1.2 0.3 0.0 0.1 (Oct) CPI 6.8 7.6 7.7 8.3 (Oct)
Europe
All data expressed as year-over-year % change unless otherwise noted.
Economic Statistics
Source: Bloomberg, Global Insight, Scotiabank Economics.
A11

Economics
Global Views
November 28, 2014
10
Asia Pacific
Australia 2013 14Q2 14Q3 Latest Japan 2013 14Q2 14Q3 Latest Real GDP 2.3 3.1 Real GDP 1.5 -0.1 -1.1 Current Acc. Bal. (US$B, ar) -49.7 -39.1 Current Acc. Bal. (US$B, ar) 33.6 14.0 63.5 107.9 (Sep) Merch. Trade Bal. (US$B, ar) 20.7 17.1 9.8 4.1 (Sep) Merch. Trade Bal. (US$B, ar) -117.5 -109.5 -115.5 -108.6 (Oct) Industrial Production 3.6 4.6 Industrial Production -0.6 2.6 -1.1 -1.0 (Oct) Unemployment Rate (%) 5.7 6.0 6.1 6.2 (Oct) Unemployment Rate (%) 4.0 3.6 3.6 3.5 (Oct) CPI 2.4 3.0 2.3 CPI 0.4 3.6 3.3 2.9 (Oct)
South Korea China Real GDP 3.0 3.5 3.2 Real GDP 7.7 7.5 7.3 Current Acc. Bal. (US$B, ar) 81.1 96.5 89.8 108.2 (Oct) Current Acc. Bal. (US$B, ar) 182.8 Merch. Trade Bal. (US$B, ar) 44.0 59.3 35.3 88.6 (Oct) Merch. Trade Bal. (US$B, ar) 259.2 345.6 512.6 544.9 (Oct) Industrial Production 0.2 1.2 1.1 -3.0 (Oct) Industrial Production 9.7 9.2 8.0 7.7 (Oct) CPI 1.3 1.6 1.4 1.2 (Oct) CPI 2.5 2.3 1.6 1.6 (Oct)
Thailand India Real GDP 2.9 0.4 0.6 Real GDP 4.7 5.7 5.3 Current Acc. Bal. (US$B, ar) -2.5 0.5 -1.5 Current Acc. Bal. (US$B, ar) -49.3 -7.8 Merch. Trade Bal. (US$B, ar) 0.6 2.0 1.6 2.1 (Oct) Merch. Trade Bal. (US$B, ar) -12.7 -11.1 -12.4 -13.4 (Oct) Industrial Production -3.1 -5.2 -3.8 -2.5 (Oct) Industrial Production 0.6 4.5 1.1 2.5 (Sep) CPI 2.2 2.5 2.0 1.5 (Oct) WPI 6.3 5.8 3.9 1.8 (Oct)
Indonesia Real GDP 5.8 5.1 5.0 Current Acc. Bal. (US$B, ar) -29.1 -8.7 -6.8 Merch. Trade Bal. (US$B, ar) -0.3 -0.7 -0.2 -0.3 (Sep) Industrial Production 6.0 4.2 6.2 10.9 (Sep) CPI 6.4 7.1 4.4 4.8 (Oct)
Brazil 2013 14Q2 14Q3 Latest Chile 2013 14Q2 14Q3 Latest Real GDP 2.3 -0.7 -0.1 Real GDP 4.1 1.9 0.8 Current Acc. Bal. (US$B, ar) -81.1 -72.5 -77.4 Current Acc. Bal. (US$B, ar) -4.8 -0.6 -6.7 Merch. Trade Bal. (US$B, ar) 2.6 14.3 7.2 -14.1 (Oct) Merch. Trade Bal. (US$B, ar) 8.0 11.6 4.8 6.8 (Oct) Industrial Production 2.2 -4.2 -3.8 -4.7 (Sep) Industrial Production 3.0 2.1 -1.4 -0.1 (Oct) CPI 6.2 6.4 6.6 6.6 (Oct) CPI 1.9 4.5 4.7 5.7 (Oct)
Peru Colombia Real GDP 5.9 1.7 1.8 Real GDP 4.7 4.3 Current Acc. Bal. (US$B, ar) -9.1 -3.5 Current Acc. Bal. (US$B, ar) -12.3 -4.2 Merch. Trade Bal. (US$B, ar) 0.1 -0.4 -0.2 -0.3 (Sep) Merch. Trade Bal. (US$B, ar) 0.2 -0.2 -0.4 -0.4 (Sep) Unemployment Rate (%) 5.9 5.9 5.7 5.7 (Oct) Industrial Production -1.8 -0.4 1.1 1.4 (Sep) CPI 2.8 3.5 2.9 3.1 (Oct) CPI 2.0 2.8 2.9 3.3 (Oct)
Latin America
Economic Statistics
All data expressed as year-over-year % change unless otherwise noted.
Source: Bloomberg, Global Insight, Scotiabank Economics.
A12

Economics
Global Views
November 28, 2014
11
Financial Statistics
A12
Interest Rates (%, end of period)
Canada 14Q2 14Q3 Nov/21 Nov/28* United States 14Q2 14Q3 Nov/21 Nov/28*BoC Overnight Rate 1.00 1.00 1.00 1.00 Fed Funds Target Rate 0.25 0.25 0.25 0.25 3-mo. T-bill 0.95 0.92 0.91 0.91 3-mo. T-bill 0.02 0.02 0.01 0.01 10-yr Gov’t Bond 2.24 2.15 2.01 1.88 10-yr Gov’t Bond 2.53 2.49 2.31 2.20 30-yr Gov’t Bond 2.78 2.67 2.55 2.44 30-yr Gov’t Bond 3.36 3.20 3.02 2.91 Prime 3.00 3.00 3.00 3.00 Prime 3.25 3.25 3.25 3.25 FX Reserves (US$B) 75.7 73.6 73.8 (Oct) FX Reserves (US$B) 134.1 126.0 125.2 (Oct)
Germany France 3-mo. Interbank 0.15 0.04 0.03 0.04 3-mo. T-bill 0.02 -0.03 -0.03 -0.03 10-yr Gov’t Bond 1.25 0.95 0.77 0.70 10-yr Gov’t Bond 1.70 1.29 1.11 0.97 FX Reserves (US$B) 66.1 65.1 65.4 (Oct) FX Reserves (US$B) 55.2 50.6 52.2 (Oct)
Euro Zone United Kingdom Refinancing Rate 0.15 0.05 0.05 0.05 Repo Rate 0.50 0.50 0.50 0.50 Overnight Rate 0.34 0.20 -0.01 0.05 3-mo. T-bill 0.44 0.51 0.47 0.46 FX Reserves (US$B) 340.3 329.4 330.1 (Oct) 10-yr Gov’t Bond 2.67 2.43 2.05 1.93
FX Reserves (US$B) 99.4 94.4 95.7 (Oct)
Japan Australia Discount Rate 0.30 0.30 0.30 0.30 Cash Rate 2.50 2.50 2.50 2.50 3-mo. Libor 0.07 0.05 0.05 0.04 10-yr Gov’t Bond 3.54 3.48 3.26 3.03 10-yr Gov’t Bond 0.57 0.53 0.46 0.42 FX Reserves (US$B) 55.9 50.1 44.2 (Oct) FX Reserves (US$B) 1251.5 1234.4 1237.2 (Oct)
Exchange Rates (end of period)
USDCAD 1.07 1.12 1.12 1.14 ¥/US$ 101.33 109.65 117.79 118.73CADUSD 0.94 0.89 0.89 0.88 US¢/Australian$ 0.94 0.87 0.87 0.85GBPUSD 1.711 1.621 1.566 1.564 Chinese Yuan/US$ 6.20 6.14 6.12 6.15EURUSD 1.369 1.263 1.239 1.244 South Korean Won/US$ 1012 1055 1114 1108JPYEUR 0.72 0.72 0.69 0.68 Mexican Peso/US$ 12.968 13.429 13.618 13.916USDCHF 0.89 0.96 0.97 0.97 Brazilian Real/US$ 2.214 2.447 2.516 2.572
Equity Markets (index, end of period)
United States (DJIA) 16827 17043 17810 17884 U.K. (FT100) 6744 6623 6751 6726 United States (S&P500) 1960 1972 2064 2074 Germany (Dax) 9833 9474 9733 9967 Canada (S&P/TSX) 15146 14961 15111 14860 France (CAC40) 4423 4416 4347 4386 Mexico (IPC) 42737 44986 44633 44313 Japan (Nikkei) 15162 16174 17358 17460 Brazil (Bovespa) 53168 54116 56084 54894 Hong Kong (Hang Seng) 23191 22933 23437 23987 Italy (BCI) 1155 1119 1067 1083 South Korea (Composite) 2002 2020 1965 1981
Commodity Prices (end of period)
Pulp (US$/tonne) 1030 1030 1030 1030 Copper (US$/lb) 3.15 3.06 3.08 2.96 Newsprint (US$/tonne) 605 605 605 605 Zinc (US$/lb) 1.00 1.04 1.04 1.01 Lumber (US$/mfbm) 346 340 330 N/A Gold (US$/oz) 1315.00 1216.50 1203.75 1182.75 WTI Oil (US$/bbl) 105.37 91.16 76.51 68.91 Silver (US$/oz) 20.87 17.11 16.30 15.97 Natural Gas (US$/mmbtu) 4.46 4.12 4.27 4.20 CRB (index) 308.22 278.55 269.11 258.87
* Latest observation taken at time of writing. Source: Bloomberg, Scotiabank Economics.
A13

Global Views
November 28, 2014
Fixed Income Strategy (London) www.gbm.scotiabank.com © 2012, The Bank of Nova Scotia This material, its content, or any copy of it, may not be altered in any way, transmitted to, copied or distributed to any other party without the prior express written consent of ScotiabankTM. This material has not been prepared by a member of the research department of Scotiabank, it is solely for the use of sophisticated institutional investors, and this material does not constitute investment advice or any personal recommendation to invest in a financial instrument or “investment research” as defined by the Financial Services Authority. This material is provided for information and discussion purposes only. An investment decision should not be made solely on the basis of the contents of this publication. It is not to be construed as a solicitation or an offer to buy or sell any financial instruments and has no regard to the specific investment objectives, financial situation or particular needs of any recipient. It is not intended to provide legal, tax, accounting or other advice and recipients should obtain specific professional advice from their own legal, tax, accounting or other appropriate professional advisers before embarking on any course of action. The information in this material is based on publicly available information and although it has been compiled or obtained from sources believed to be reliable, such information has not been independently verified and no guarantee, representation or warranty, express or implied, is made as to its accuracy, completeness or correctness. Information included in this material related to comparison performance (whether past or future) or simulated performance (whether past or future) is not a reliable indicator of future returns. This presentation is not directed to or intended for use by any person resident or located in any country where the distribution of such information is contrary to the laws of such country. Scotiabank its directors, officers, employees or clients may currently or from time to time own or hold interests in long or short positions in any securities referred to herein, and may at any time make purchases or sales of these securities as principal or agent. Scotiabank may also have provided or may provide investment banking, capital markets or other services to the companies referred to in this communication.
TM Trademark of The Bank of Nova Scotia. Used under license, where applicable. Scotiabank, together with "Global Banking and Markets", is a marketing name for the global corporate and investment banking and capital markets businesses of The Bank of Nova Scotia and certain of its affiliates in the countries where they operate, including Scotia Capital Inc., Scotia Capital (USA) Inc., Scotiabanc Inc.; Citadel Hill Advisors L.L.C.; The Bank of Nova Scotia Trust Company of New York; Scotiabank Europe plc; Scotia Capital (Europe) Limited; Scotiabank (Ireland) Limited; Scotiabank Inverlat S.A., Institución de Banca Múltiple, Scotia Inverlat Casa de Bolsa S.A. de C.V., Scotia Inverlat Derivados S.A. de C.V. – all members of the Scotiabank Group and authorized users of the mark. The Bank of Nova Scotia is incorporated in Canada with limited liability. Scotia Capital Inc. is a member of CIPF. Scotia Capital (USA) Inc. is a registered broker-dealer with the SEC and is a member of the NASD and SIPC. The Bank of Nova Scotia, Scotiabank Europe plc, Scotia Capital (Europe) Limited and Scotia Capital Inc. are each authorised and regulated by the Financial Services Authority (FSA) in the U.K. Scotiabank Inverlat, S.A., Scotia Inverlat Casa de Bolsa, S.A. de C.V., and Scotia Derivados, S.A. de C.V., are each authorized and regulated by the Mexican financial authorities. Fixed Income Strategy (Paris) Disclaimer © 2011, The Bank of Nova Scotia This material, its content, or any copy of it, may not be altered in any way, transmitted to, copied or distributed to any other party without the prior express written consent of Scotiabank™. This material has not been prepared by a member of the research department of Scotiabank, it is solely for the use of sophisticated institutional investors, and this material does not constitute investment advice or any personal recommendation to invest in a financial instrument or “investment research” as defined by the Financial Services Authority. This material is provided for information and discussion purposes only. An investment decision should not be made solely on the basis of the contents of this publication. It is not to be construed as a solicitation or an offer to buy or sell any financial instruments and has no regard to the specific investment objectives, financial situation or particular needs of any recipient. It is not intended to provide legal, tax, accounting or other advice and recipients should obtain specific professional advice from their own legal, tax, accounting or other appropriate professional advisers before embarking on any course of action. The information in this material is based on publicly available information and although it has been compiled or obtained from sources believed to be reliable, such information has not been independently verified and no guarantee, representation or warranty, express or implied, is made as to its accuracy, completeness or correctness. Information included in this material related to comparison performance (whether past or future) or simulated performance (whether past or future) is not a reliable indicator of future returns. This presentation is not directed to or intended for use by any person resident or located in any country where the distribution of such information is contrary to the laws of such country. Scotiabank its directors, officers, employees or clients may currently or from time to time own or hold interests in long or short positions in any securities referred to herein, and may at any time make purchases or sales of these securities as principal or agent. Scotiabank may also have provided or may provide investment banking, capital markets or other services to the companies referred to in this communication.
Disclaimer

Global Views
November 28, 2014
Foreign Exchange Strategy This publication has been prepared by The Bank of Nova Scotia (Scotiabank) for informational and marketing purposes only. Opinions, estimates and projections contained herein are our own as of the date hereof and are subject to change without notice. The information and opinions contained herein have been compiled or arrived at from sources believed reliable, but no representation or warranty, express or implied, is made as to their accuracy or completeness and neither the information nor the forecast shall be taken as a representation for which Scotiabank, its affiliates or any of their employees incur any responsibility. Neither Scotiabank nor its affiliates accept any liability whatsoever for any loss arising from any use of this information. This publication is not, and is not constructed as, an offer to sell or solicitation of any offer to buy any of the currencies referred to herein, nor shall this publication be construed as an opinion as to whether you should enter into any swap or trading strategy involving a swap or any other transaction. The general transaction, financial, educational and market information contained herein is not intended to be, and does not constitute, a recommendation of a swap or trading strategy involving a swap within the meaning of U.S. Commodity Futures Trading Commission Regulation 23.434 and Appendix A thereto. This material is not intended to be individually tailored to your needs or characteristics and should not be viewed as a “call to action” or suggestion that you enter into a swap or trading strategy involving a swap or any other transaction. You should note that the manner in which you implement any of the strategies set out in this publication may expose you to significant risk and you should carefully consider your ability to bear such risks through consultation with your own independent financial, legal, accounting, tax and other professional advisors. Scotiabank, its affiliates and/or their respective officers, directors or employees may from time to time take positions in the currencies mentioned herein as principal or agent, and may have received remuneration as financial advisor and/or underwriter for certain of the corporations mentioned herein. Directors, officers or employees of Scotiabank and its affiliates may serve as directors of corporations referred to herein. All Scotiabank products and services are subject to the terms of applicable agreements and local regulations. This publication and all information, opinions and conclusions contained in it are protected by copyright. This information may not be reproduced in whole or in part, or referred to in any manner whatsoever nor may the information, opinions and conclusions contained in it be referred to without the prior express written consent of Scotiabank. ™Trademark of The Bank of Nova Scotia. Used under license, where applicable. Scotiabank, together with “Global Banking and Markets”, is a marketing name for the global corporate and investment banking and capital markets businesses of The Bank of Nova Scotia and certain of its affiliates in the countries where they operate, all members of the Scotiabank group and authorized users of the mark. The Bank of Nova Scotia is incorporated in Canada with limited liability and is authorised and regulated by the Office of the Superintendent of Financial Institutions Canada. The Bank of Nova Scotia and Scotiabank Europe plc are authorised by the UK Prudential Regulation Authority. The Bank of Nova Scotia is subject to regulation by the UK Financial Conduct Authority and limited regulation by the UK Prudential Regulation Authority. Scotiabank Europe plc is authorised by the UK Prudential Regulation Authority and regulated by the UK Financial Conduct Authority and the UK Prudential Regulation Authority. Details about the extent of The Bank of Nova Scotia's regulation by the UK Prudential Regulation Authority are available on request. Scotiabank Inverlat, S.A., Scotia Inverlat Casa de Bolsa, S.A. de C.V., and Scotia Inverlat Derivados, S.A. de C.V., are each authorized and regulated by the Mexican financial authorities.Not all products and services are offered in all jurisdictions. Services described are available in jurisdictions where permitted by law.
Disclaimer

Scotiabank Economics
Scotia Plaza 40 King Street West, 63rd Floor
Toronto, Ontario Canada M5H 1H1
Tel: (416) 866-6253 Fax: (416) 866-2829
Email: [email protected]
For general and publication-related inquiries, contact
us by telephone, email and/or fax.
Scotiabank Economics
This report has been prepared by Scotiabank Economics as a resource for the clients of Scotiabank. Opinions, estimates and projections contained herein are our own as of the date hereof and are subject to change without notice. The information and opinions contained herein have been compiled or arrived at from sources believed reliable but no representation or warranty, express or implied, is made as to their accuracy or completeness. Neither Scotiabank nor its affiliates accepts any liability whatsoever for any loss arising from any use of this report or its contents. TM Trademark of The Bank of Nova Scotia. Used under license, where applicable.
Disclaimer
Global Views
November 28, 2014