GLOBAL VIDEO INDEX Q3 2014 - Ooyala | Imagine...
17
GLOBAL VIDEO INDEX Q3 2014
Transcript of GLOBAL VIDEO INDEX Q3 2014 - Ooyala | Imagine...
GLOBALVIDEOINDEXQ3 2014
GLOBAL VIDEO INDEX Q3 2014 2
TABLE OF CONTENTS
Introduction ........................................................3
Executive Summary .............................................5
Tablet and Smartphone Video Trends .....................6
Engagement Patterns by Device ............................8
Premium (Long-form) Video Consumption ..............9
Device Shifting: Daily Trends ..............................11
Turning Information into Insights ........................16
About Ooyala’s Global Video Index ......................17
GLOBAL VIDEO INDEX Q3 2014 3
Tom Wheeler’s words, from an October blog post rallying support for new rules that would ease market entry for Internet-based video service providers, may seem obvious to those of us who live and breathe OTT. We see on a daily basis the migration of the traditional TV audience from the living room to the outdoors, from the TV to the tablet and smartphone.
It’s not a wholesale exodus, as some Silicon Valley TV-doomsday-theorists suggest. It’s an expansion of our TV experience across a broader landscape of devices. It’s about the right device for the right time of day, ideally suited to our immediate surroundings and circumstance.
In fact, studies show that the total amount of time spent consuming media in the United States is growing, among both younger and older viewers and across all ethnic groups. That growth stems from a 16% jump in video viewing on mobile devices, PCs and connected TVs, according to the latest Nielsen Cross-Platform Report.
The surging demand for premium video experiences that cater to our personal preferences (and budgets) is at the heart of Wheeler’s rallying cry. It may seem a long time coming to the media and technology companies who’ve spent the better part of the last decade paving the way for the next generation of TV. But it’s a heartening sign that the call is now being made by those with the influence and authority to help remove the fences that divide the future from the past.
“We have passed from an era where it was necessary to build a purpose-specific pathway to deliver video. The innovation of Internet Protocol has freed video from these closed pathways and single-purpose devices.”
TOM WHEELER, CHAIRMAN, U.S. FEDERAL COMMUNICATIONS COMMISSION
INTRODUCTION
GLOBAL VIDEO INDEX Q3 2014 4
Another critical sign of the times is that the Internet-driven evolution of TV and video is now embraced, rather than spurned, by the TV establishment. HBO, CBS and others are touting new IP-delivered offerings. Charter Communications CEO Tom Rutledge says the number of programmers planning OTT deployments is good for the cable industry, which will have more flexibility in content bundling; and good for the consumer, who will have more choice. And discussing heightened competition for audiences and ad dollars in VARIETY, Josh Sapan, president-CEO of AMC Networks, referred to “an almost unstoppable trend for technology to facilitate consumer discretion and choice.”
Technology and choice are the common threads underlying the evolutionary thinking that’s precipitating a new crop of web-delivered services, and keeping OTT at the top of every major player’s to-do list. Not only are the largest broadcasters in the world taking to the Internet for audience engagement, companies like Amazon and Netflix are investing hundreds of millions in made-for-Internet programming.
Today’s spirited attitude towards the video evolution is a far cry from the tone of the industry in years past. That more conservative stance was well summed up in 2010 by CBS Chief Les Moonves, who said of web-based distribution at the time, “It’s nice to have our toe in the water. I’m glad we didn’t dive in head first... If too many people shift to online, I’m not going to be able to produce CSI.”
This quarter, our Global Video Index examines the current state of this evolution: the trends developing as we consume our news, sports and entertainment across many different screens across the hours and days. We take a look at the ongoing takeover of mobile and tablet video, and the impact of major news and sporting events on over-the-top consumption.
The industry’s collective vision for the future of television is still coming into focus. But our data demonstrates significant progress toward that future. The complexity inherent in providing the choice consumers desire is still growing. But every quarter, viewers around the world move closer to a simpler, more personalized experience. One with more freedom, more choice, and more satisfaction.
In Tom Wheeler’s words, “Such benefits follow from innovation.”
INTRODUCTION
GLOBAL VIDEO INDEX Q3 2014 5
EXECUTIVE SUMMARY
Highlights from Ooyala’s latest report include:
TABLET AND SMARTPHONE VIDEO
■ Smartphone and tablet views made up 30% of all video plays in the quarter, a 20% increase over Q2.
■ Year-over-year, smartphone and tablet views more than doubled, showing a 114% increase.
■ Smartphone and tablet video views made up just 6% of all online video views in Q3 2012. In eight subsequent quarters, growth has exceeded 400%.
■ Online coverage of major news and sporting events are significant contributors to growth.
PREMIUM (LONG-FORM) VIDEO CONSUMPTION
■ On connected TVs, long-form content is by far the most popular. Connected TV viewers spent 80% of their time watching video longer than 10 minutes.
■ Tablet viewers spent 68% of their time watching video exceeding 10 minutes.
■ Tablet viewers spent more of their time with video 30–60 minutes in length than users of any other device.
■ On PCs, about one third of the time spent (32%) was with video 10–30 minutes long.
■ Viewers watched video exceeding an hour in length 4X more on connected TVs than on tablets, and almost 10X more than on mobile phones.
DEVICE-SHIFTING: DAILY TRENDS
■ In North America, mobile phones see steady video viewership all day long, spiking in the evening… but still not as much as with tablets which see bigger night-time spikes.
■ Latin American viewers are more tied to smartphones than tablets, with phones having higher usage in the evenings than any other device; this the only region in which that occurs.
■ APAC viewers flock to smartphones and tablets after 5 p.m., more so than in any other region.
■ EMEA viewers watch on their desktops throughout the day and into the evening; more so than in other regions.

GLOBAL VIDEO INDEX Q3 2014 6
SHARE OFMOBILE VIDEO PLAYS
THE RISE OF MOBILE VIDEOQ3 2014
Mobile+Tablet plays surpassed 30% share in Q3,and maintains a 20% quarter-over-quarter growth
MAY2013
SEP2012
JAN2012
JAN2014
SEP2014
0%
15%
10%
25%
20%
30%
35%
For the past several quarters, we’ve seen consistent, some might say relentless, growth in the number of video views on tablets and smartphones. The third quarter was no different. In fact Q3 showed that the industry trend toward using mobile devices to view content is accelerating.
Mobile and tablet views made up 30% of all video plays in the quarter, compared to 25% in the second quarter, an increase quarter-over-quarter of 20%.
Year-over-year figures are even more striking:
■ In Q3 2013, smartphone and tablet views made up just 14% of all video views. So last quarter’s views represent over 200% of what we saw just a year ago.
■ Since Q3 2012, when mobile and tablet video views made up just 6% of all online video views, growth has exceeded 400%.
SPORTS IS A MAJOR DRIVER
Much of this growth has been organic, what we’ve begun to see as “normal” quarterly increases in mobile traffic. But July and August showed spikes in mobile video views, exceeding the numbers we might have expected.
The cause? Much can be attributed to major sporting events around the world. In particular:
■ The FIFA World Cup (July)
■ Wimbledon (July)
■ Tour de France (July)
■ British Open (July)
■ US PGA Championship (August)
■ US Open Tennis (August-September)
■ The Ryder Cup (September)
A recent study from Sports News Media and Kantar Media found 42% of U.S. consumers say they use mobile devices to watch sports, with slightly more (34%) saying they primarily watch on smartphones and 22% saying they watch on tablets.
TABLET AND SMARTPHONE VIDEO TRENDS
GLOBAL VIDEO INDEX Q3 2014 7
ALL THE NEWS
Also worth noting: July and August saw a plethora of major news events around the world, and news is another segment where online consumption is rising.
For example:
■ In July, a passenger jet with 298 souls on board was downed by a missile over Ukraine. The event generated a tremendous amount of global news coverage, especially on video.
■ From late July into mid-August, Israeli and Hamas battled in Gaza. The compelling and often tragic personal stories, as well as footage of the ongoing conflict, created a huge library of content daily.
The abundance of available news footage is even prompting more traditional news organizations to ponder online platforms. Both CBS and Reuters have said they could launch new Internet TV programs in the coming year.
THE BOTTOM LINEBroadcasters and publishers who are making content rapidly available on mobile are benefiting from the near ubiquity of video-capable smartphones and tablets in mature markets. Particularly for news and sports content, audiences are increasingly engaging with content outside of the home. In emerging regions, meanwhile, operators have found that the cost of building out mobile broadband networks compares favorably to the exorbitant cost of fixed networks, and this is also driving the expansion of mobile usage.
In Q1 2014, we forecast that 50% of all video views would be on mobile devices by 2016. In fact, YouTube is already seeing mobile viewership of over 50%; a strong indicator that premium content will catch up before long. But mobile and tablet growth is now accelerating more rapidly and universally than even six months ago.
We now believe more than half of all video views could occur on smartphone and tablet devices as soon as the third quarter of 2015. Now is the time to start thinking about diversified advertising and monetization strategies to reach audiences on mobile devices in particular.
TABLET AND SMARTPHONE VIDEO TRENDS

GLOBAL VIDEO INDEX Q3 2014 8
SHARE OF TIME WATCHED BY DEVICEAND VIDEO LENGTHQ3 2014
SHARE OF PLAYS BY DEVICE AND VIDEO LENGTHQ3 2014
DESKTOP PHONE TABLET CTV DESKTOP PHONE TABLET CTV
50%
25%
0%
90%
45%
0%
0–1 MINUTES 1–3 MINUTES 3–6 MINUTES 6–10 MINUTES 10 MINUTES OR MORE
While online video has become increasingly popular on mobile devices, the smaller screens of smartphones (even the increasingly larger ones seen on Android and, more recently, on iOS devices) trail larger screens for watching content longer than 10 minutes. A recent report by IHS, Inc. and Mobidia technology, however, shows that as screen sizes increase, so does time spent streaming video.
On connected TVs, including those connected to the internet via peripheral devices, the vast majority of time spent viewing was with content longer than 10 minutes. In fact, 80% of sessions lasted 10 minutes or more, up from 71% a year ago.
Tablet viewers increased the amount of time they spent with videos longer than 10 minutes to 68%, up from 60% a year ago. They also spent about a quarter (23%) of their time watching videos between 30 and 60 minutes long, the most of any device.
The use of tablets continues to rise, partly driven by their increasing numbers in most markets. An IHS Technology forecast said tablet sales were expected to increase 25% in 2014, even as the technology reached a point of saturation.
PCs saw an increase in the amount of time spent watching content longer than 10 minutes (63%), compared to a year ago when it was at 40%. This result might be attributed in part to viewers watching coverage of the 2014 FIFA World Cup while at work.
Mobile phones were more prominent than ever in terms of share of time watched for videos 1–3 minutes long (22%), the most of any device. Viewers often use their phones to sample content, watch previews, check scores and highlights, or quickly catch up with the news before switching to larger screens.
ENGAGEMENT PATTERNS BY DEVICE
GLOBAL VIDEO INDEX Q3 2014 9
DESKTOP PHONE TABLET CTV
10–30 MINUTES 30–60 MINUTES 60 MINUTES OR MORE
60%
0%
40%
20%
SHARE OF TIME WATCHED BY DEVICEAND VIDEO LENGTHQ3 2014
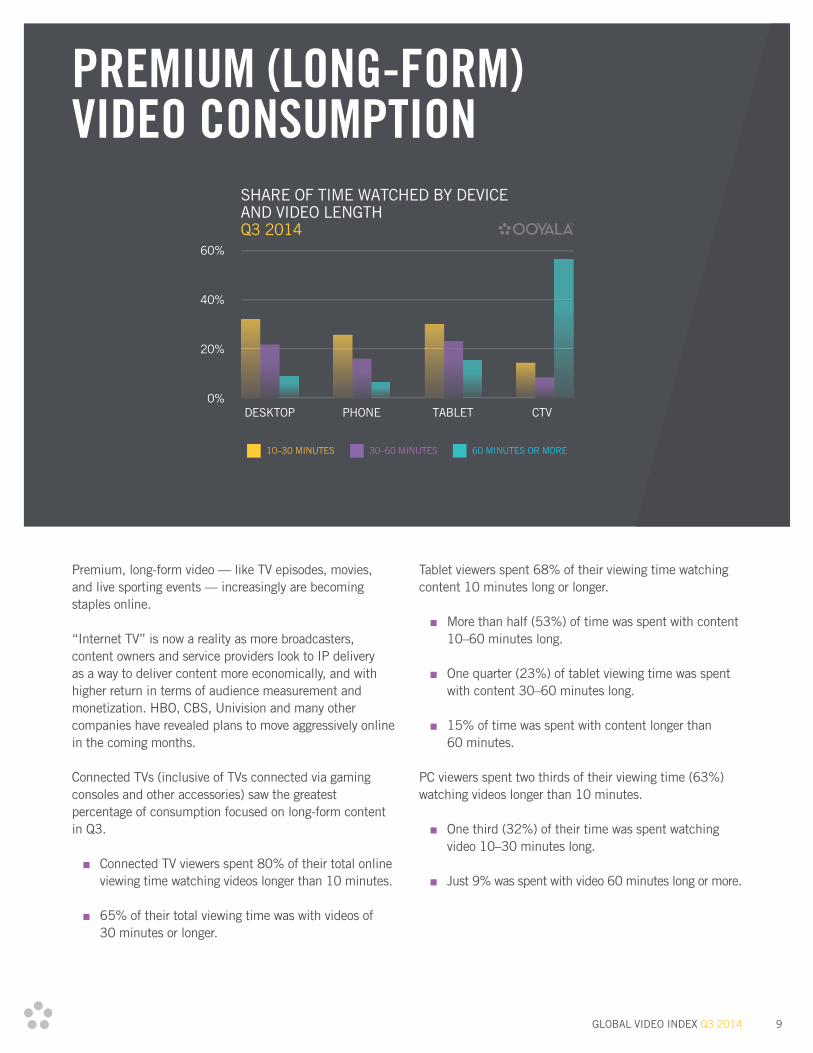
Premium, long-form video — like TV episodes, movies, and live sporting events — increasingly are becoming staples online.
“Internet TV” is now a reality as more broadcasters, content owners and service providers look to IP delivery as a way to deliver content more economically, and with higher return in terms of audience measurement and monetization. HBO, CBS, Univision and many other companies have revealed plans to move aggressively online in the coming months.
Connected TVs (inclusive of TVs connected via gaming consoles and other accessories) saw the greatest percentage of consumption focused on long-form content in Q3.
■ Connected TV viewers spent 80% of their total online viewing time watching videos longer than 10 minutes.
■ 65% of their total viewing time was with videos of 30 minutes or longer.
Tablet viewers spent 68% of their viewing time watching content 10 minutes long or longer.
■ More than half (53%) of time was spent with content 10–60 minutes long.
■ One quarter (23%) of tablet viewing time was spent with content 30–60 minutes long.
■ 15% of time was spent with content longer than 60 minutes.
PC viewers spent two thirds of their viewing time (63%) watching videos longer than 10 minutes.
■ One third (32%) of their time was spent watching video 10–30 minutes long.
■ Just 9% was spent with video 60 minutes long or more.
PREMIUM (LONG-FORM) VIDEO CONSUMPTION
GLOBAL VIDEO INDEX Q3 2014 10
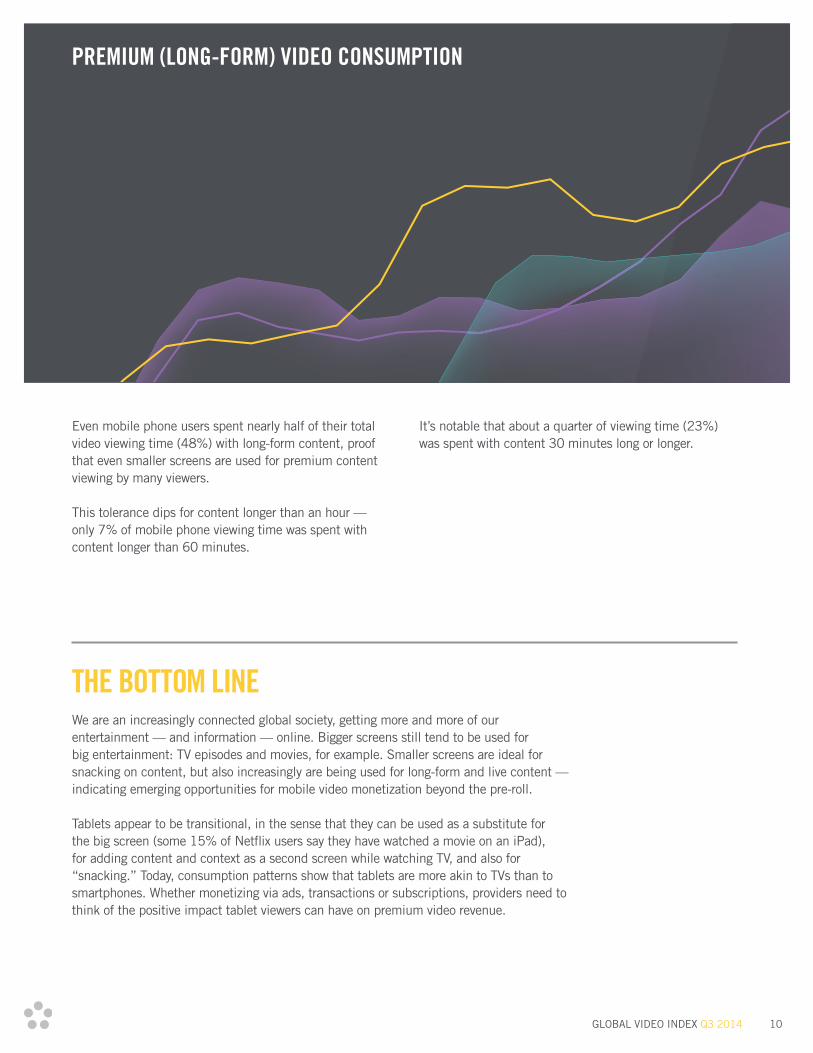
Even mobile phone users spent nearly half of their total video viewing time (48%) with long-form content, proof that even smaller screens are used for premium content viewing by many viewers.
This tolerance dips for content longer than an hour — only 7% of mobile phone viewing time was spent with content longer than 60 minutes.
It’s notable that about a quarter of viewing time (23%) was spent with content 30 minutes long or longer.
THE BOTTOM LINEWe are an increasingly connected global society, getting more and more of our entertainment — and information — online. Bigger screens still tend to be used for big entertainment: TV episodes and movies, for example. Smaller screens are ideal for snacking on content, but also increasingly are being used for long-form and live content — indicating emerging opportunities for mobile video monetization beyond the pre-roll.
Tablets appear to be transitional, in the sense that they can be used as a substitute for the big screen (some 15% of Netflix users say they have watched a movie on an iPad), for adding content and context as a second screen while watching TV, and also for “snacking.” Today, consumption patterns show that tablets are more akin to TVs than to smartphones. Whether monetizing via ads, transactions or subscriptions, providers need to think of the positive impact tablet viewers can have on premium video revenue.
PREMIUM (LONG-FORM) VIDEO CONSUMPTION
GLOBAL VIDEO INDEX Q3 2014 11
6AM NOON 6PM MIDNIGHT
10%
5%
0%
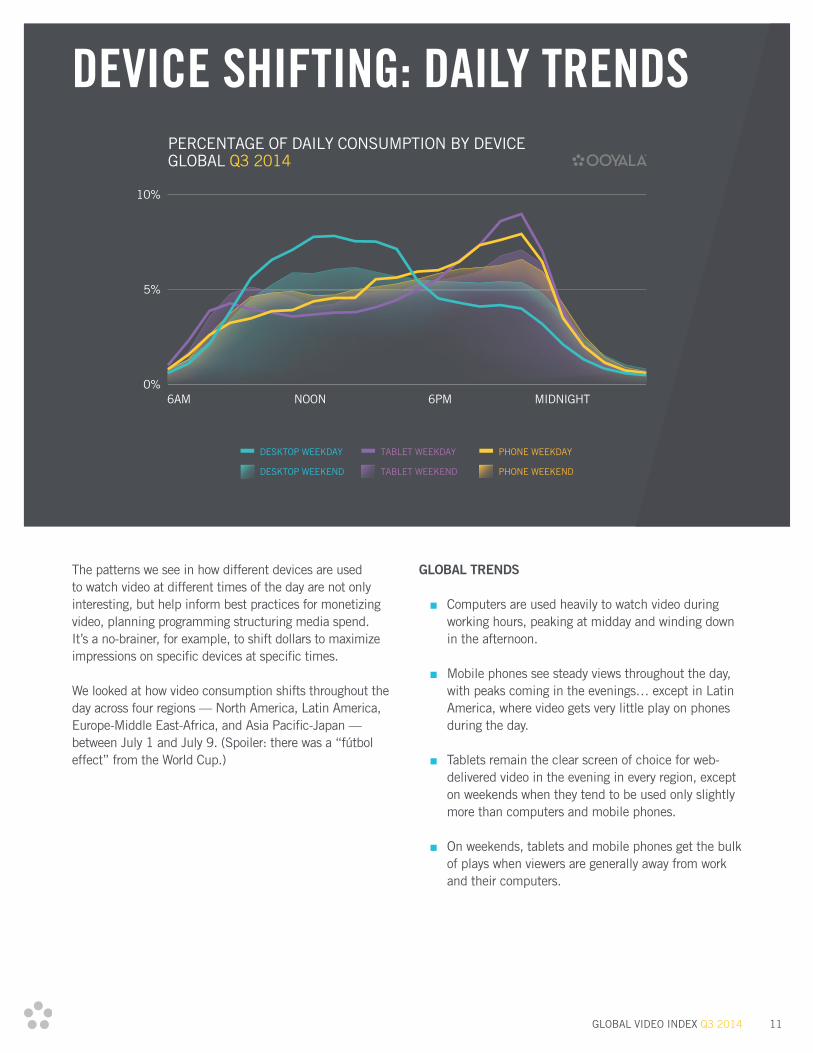
PERCENTAGE OF DAILY CONSUMPTION BY DEVICEGLOBAL Q3 2014
PHONE WEEKDAY
PHONE WEEKEND
TABLET WEEKDAY
TABLET WEEKEND
DESKTOP WEEKDAY
DESKTOP WEEKEND
The patterns we see in how different devices are used to watch video at different times of the day are not only interesting, but help inform best practices for monetizing video, planning programming structuring media spend. It’s a no-brainer, for example, to shift dollars to maximize impressions on specific devices at specific times.
We looked at how video consumption shifts throughout the day across four regions — North America, Latin America, Europe-Middle East-Africa, and Asia Pacific-Japan — between July 1 and July 9. (Spoiler: there was a “fútbol effect” from the World Cup.)
GLOBAL TRENDS
■ Computers are used heavily to watch video during working hours, peaking at midday and winding down in the afternoon.
■ Mobile phones see steady views throughout the day, with peaks coming in the evenings… except in Latin America, where video gets very little play on phones during the day.
■ Tablets remain the clear screen of choice for web-delivered video in the evening in every region, except on weekends when they tend to be used only slightly more than computers and mobile phones.
■ On weekends, tablets and mobile phones get the bulk of plays when viewers are generally away from work and their computers.
DEVICE SHIFTING: DAILY TRENDS
GLOBAL VIDEO INDEX Q3 2014 12
6AM NOON 6PM MIDNIGHT
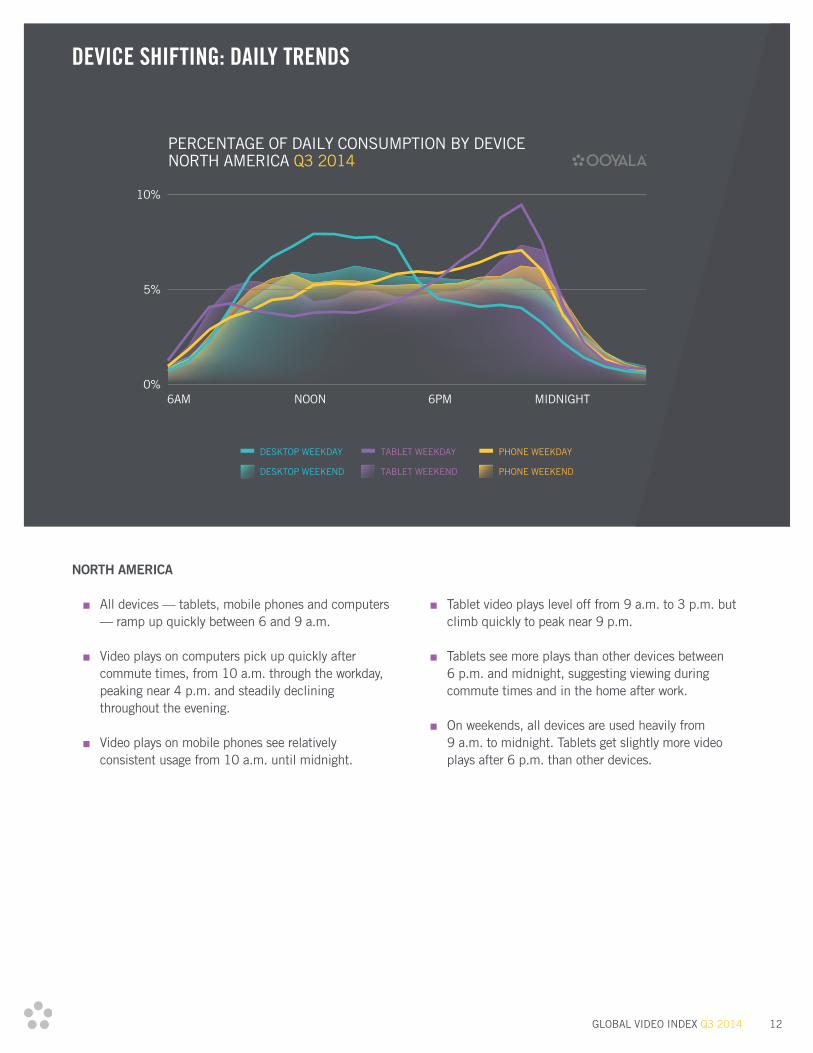
PERCENTAGE OF DAILY CONSUMPTION BY DEVICENORTH AMERICA Q3 2014
PHONE WEEKDAY
PHONE WEEKEND
TABLET WEEKDAY
TABLET WEEKEND
DESKTOP WEEKDAY
DESKTOP WEEKEND
10%
5%
0%
NORTH AMERICA
■ All devices — tablets, mobile phones and computers — ramp up quickly between 6 and 9 a.m.
■ Video plays on computers pick up quickly after commute times, from 10 a.m. through the workday, peaking near 4 p.m. and steadily declining throughout the evening.
■ Video plays on mobile phones see relatively consistent usage from 10 a.m. until midnight.
■ Tablet video plays level off from 9 a.m. to 3 p.m. but climb quickly to peak near 9 p.m.
■ Tablets see more plays than other devices between 6 p.m. and midnight, suggesting viewing during commute times and in the home after work.
■ On weekends, all devices are used heavily from 9 a.m. to midnight. Tablets get slightly more video plays after 6 p.m. than other devices.
DEVICE SHIFTING: DAILY TRENDS
GLOBAL VIDEO INDEX Q3 2014 13
6AM NOON 6PM MIDNIGHT
12%
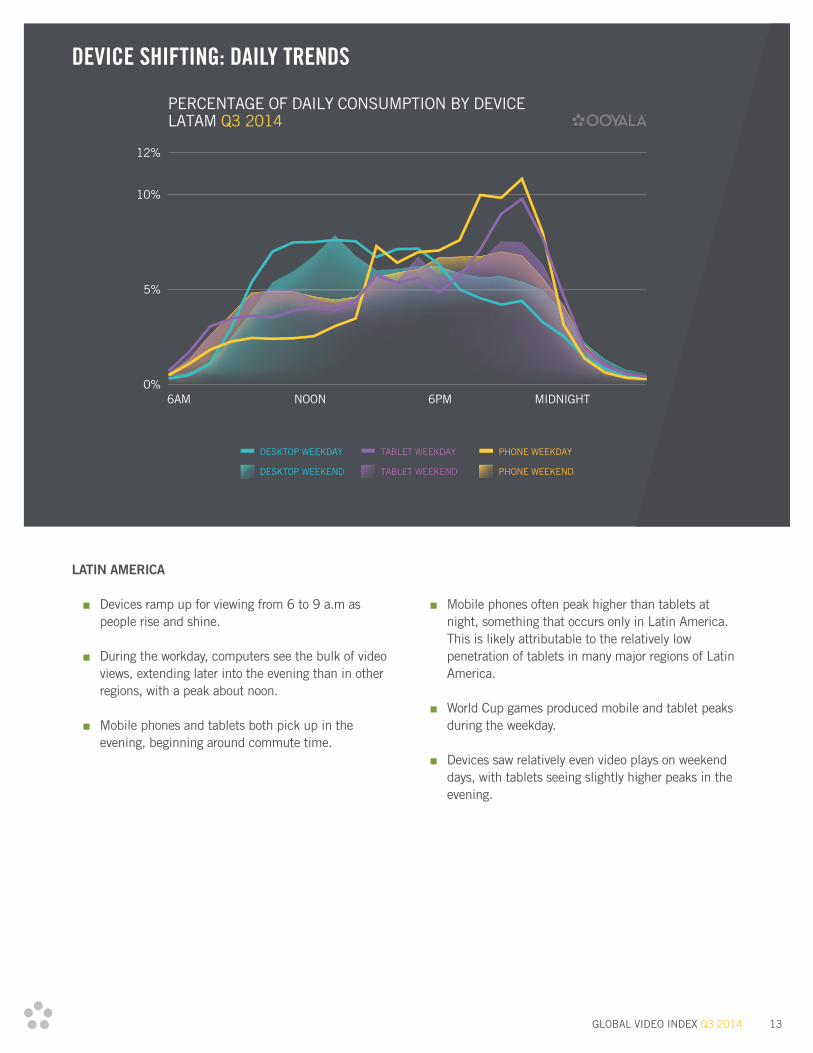
PERCENTAGE OF DAILY CONSUMPTION BY DEVICELATAM Q3 2014
10%
5%
0%
PHONE WEEKDAY
PHONE WEEKEND
TABLET WEEKDAY
TABLET WEEKEND
DESKTOP WEEKDAY
DESKTOP WEEKEND
LATIN AMERICA
■ Devices ramp up for viewing from 6 to 9 a.m as people rise and shine.
■ During the workday, computers see the bulk of video views, extending later into the evening than in other regions, with a peak about noon.
■ Mobile phones and tablets both pick up in the evening, beginning around commute time.
■ Mobile phones often peak higher than tablets at night, something that occurs only in Latin America. This is likely attributable to the relatively low penetration of tablets in many major regions of Latin America.
■ World Cup games produced mobile and tablet peaks during the weekday.
■ Devices saw relatively even video plays on weekend days, with tablets seeing slightly higher peaks in the evening.
DEVICE SHIFTING: DAILY TRENDS
GLOBAL VIDEO INDEX Q3 2014 14
6AM NOON 6PM MIDNIGHT
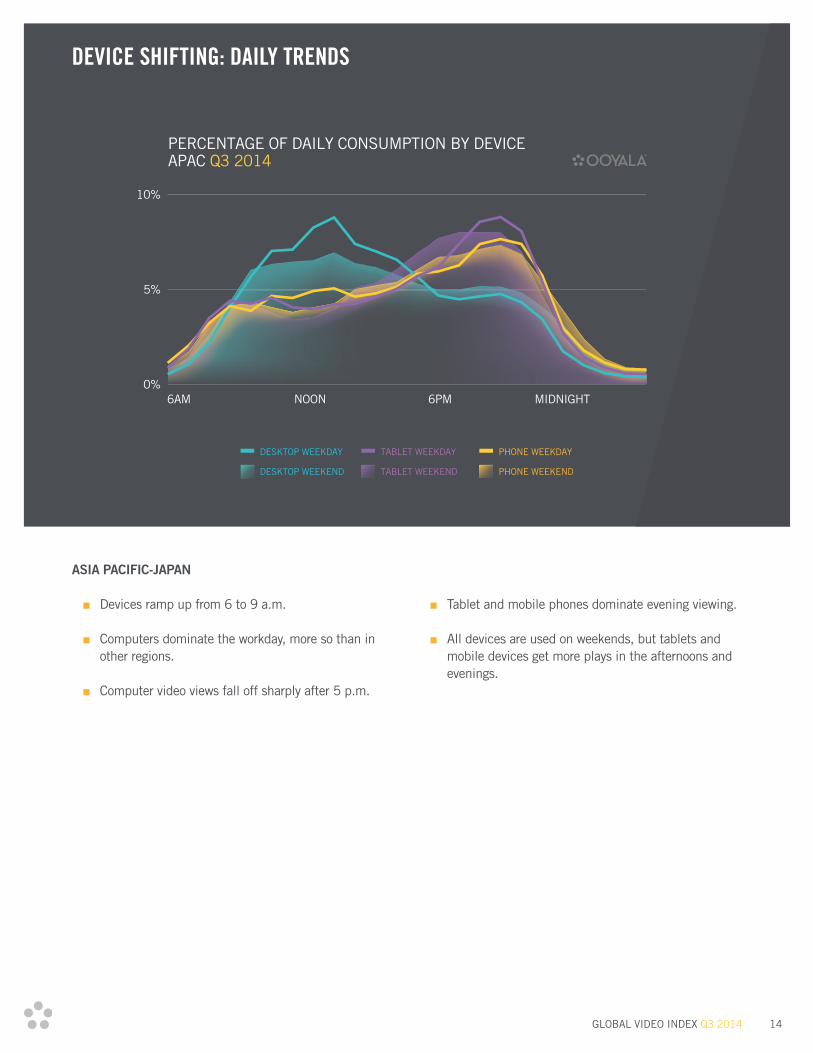
PERCENTAGE OF DAILY CONSUMPTION BY DEVICEAPAC Q3 2014
10%
5%
0%
PHONE WEEKDAY
PHONE WEEKEND
TABLET WEEKDAY
TABLET WEEKEND
DESKTOP WEEKDAY
DESKTOP WEEKEND
ASIA PACIFIC-JAPAN
■ Devices ramp up from 6 to 9 a.m.
■ Computers dominate the workday, more so than in other regions.
■ Computer video views fall off sharply after 5 p.m.
■ Tablet and mobile phones dominate evening viewing.
■ All devices are used on weekends, but tablets and mobile devices get more plays in the afternoons and evenings.
DEVICE SHIFTING: DAILY TRENDS
GLOBAL VIDEO INDEX Q3 2014 15
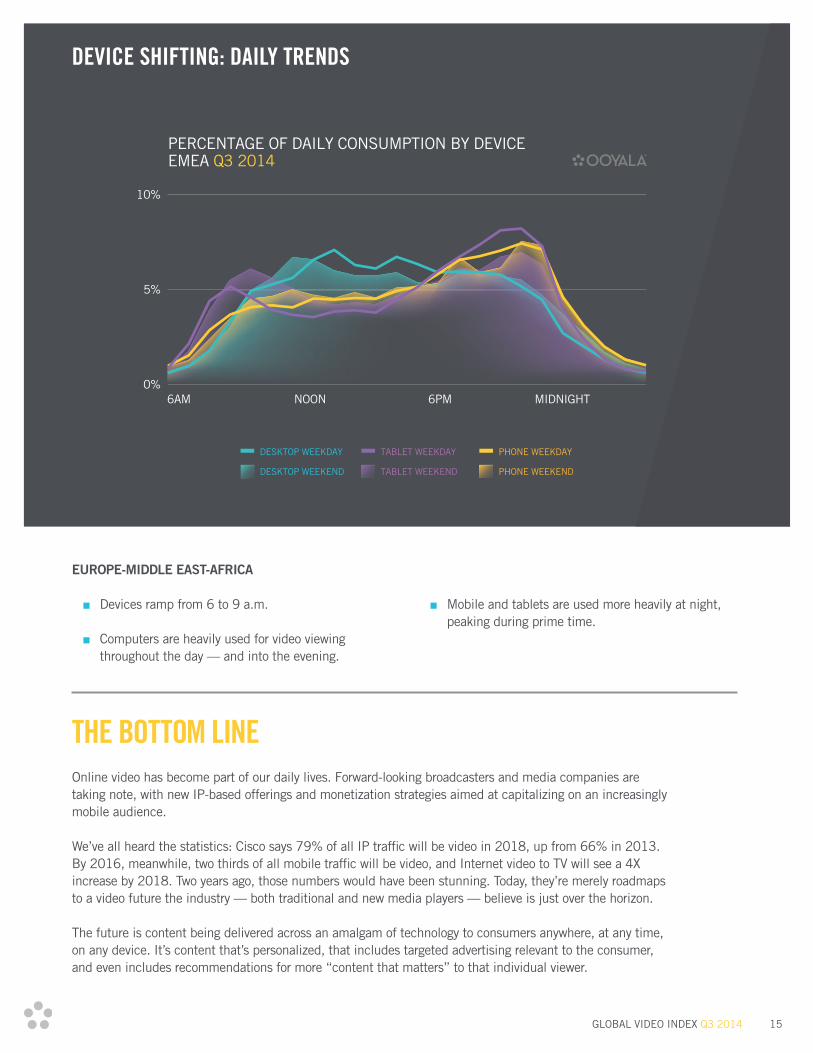
6AM NOON 6PM MIDNIGHT
PERCENTAGE OF DAILY CONSUMPTION BY DEVICEEMEA Q3 2014
PHONE WEEKDAY
PHONE WEEKEND
TABLET WEEKDAY
TABLET WEEKEND
DESKTOP WEEKDAY
DESKTOP WEEKEND
10%
5%
0%
THE BOTTOM LINEOnline video has become part of our daily lives. Forward-looking broadcasters and media companies are taking note, with new IP-based offerings and monetization strategies aimed at capitalizing on an increasingly mobile audience.
We’ve all heard the statistics: Cisco says 79% of all IP traffic will be video in 2018, up from 66% in 2013. By 2016, meanwhile, two thirds of all mobile traffic will be video, and Internet video to TV will see a 4X increase by 2018. Two years ago, those numbers would have been stunning. Today, they’re merely roadmaps to a video future the industry — both traditional and new media players — believe is just over the horizon.
The future is content being delivered across an amalgam of technology to consumers anywhere, at any time, on any device. It’s content that’s personalized, that includes targeted advertising relevant to the consumer, and even includes recommendations for more “content that matters” to that individual viewer.
EUROPE-MIDDLE EAST-AFRICA
■ Devices ramp from 6 to 9 a.m.
■ Computers are heavily used for video viewing throughout the day — and into the evening.
■ Mobile and tablets are used more heavily at night, peaking during prime time.
DEVICE SHIFTING: DAILY TRENDS
GLOBAL VIDEO INDEX Q3 2014 16
When you optimize digital revenue strategies for each viewer, device and location, you deliver more relevant content to connected viewers, who, in turn, watch more media.
The result is greater monetization — more ads served, more transactions, lower subscriber churn and ultimately more money for video publishers.
Ooyala uses Big Data and real-time video analytics to help our clients understand audiences like never before, and connect with them in meaningful ways.
Only Ooyala delivers a more personalized and profitable media experience that benefits viewers and content publishers alike.
That is the power of information. That is the power of Ooyala video technology.
TURNING INFORMATION INTO INSIGHTS
GLOBAL VIDEO INDEX Q3 2014 17
ABOUT THE GLOBAL VIDEO INDEX
Ooyala measures the anonymized viewing habits of viewers in nearly every country in the world, from Argentina to Zimbabwe. We process billions of video analytics events each day. Our market-leading video analytics help media companies and consumer brands grow their audiences and earn more money from mobile, multi-screen broadcasting.
One in every four Americans watches video on an Ooyala player, and more than half of our traffic comes from outside of the United States.
ABOUT OOYALA VIDEO PUBLISHERS
Ooyala video publishers include hundreds of forward-thinking brands, broadcasters and operators like Univision, Sky Sports, ESPN, Telstra, Foxtel, Comedy Central, Rolling Stone, Pac-12 Networks, Sephora, Caracol TV and CJ Entertainment.
This report reflects the anonymized online video metrics of all of Ooyala’s publishers. It does not document the online video consumption patterns of the Internet as a whole. But the size of the Ooyala video footprint, along with the variety of our customers, means this report offers a representative view of the overall state of online video.
ABOUT OOYALA’S GLOBAL VIDEO INDEX