Global Power Synergy · GPSC to list 374,575,200 IPO shares on the SET: Global Power Synergy Plc...
27
See disclaimer at the end of report IPO Report Global Power Synergy 20 April 2015 Debut of a Power heavyweight Blackout period: 22 Apr - 6 May 2015 Thanatthep Chantarakarn Securities Fundamental Investment Analyst [email protected] +66 2 618 1340 Jiramate Ratapipat Analyst Assistant
Transcript of Global Power Synergy · GPSC to list 374,575,200 IPO shares on the SET: Global Power Synergy Plc...

See disclaimer at the end of report
IPO Report
Global Power Synergy
20 April 2015
Debut of a Power heavyweight Blackout period: 22 Apr - 6 May 2015 Thanatthep Chantarakarn
Securities Fundamental Investment Analyst [email protected] +66 2 618 1340
Jiramate Ratapipat Analyst Assistant

GPSC - 2
GPSC : Financial Tables – Year PROFIT & LOSS (Btm) 2013 2014 2015E 2016E 2017ERevenue 26,328 23,755 23,197 23,287 23,910Cost of sales and services (24,337) (21,665) (20,856) (21,013) (21,576)Gross profit 1,991 2,090 2,341 2,274 2,334SG&A (284) (407) (423) (423) (430)EBIT 1,707 1,683 1,917 1,851 1,904Interest expense (618) (470) (592) (403) (449)Other income/exp. 99 135 174 175 179EBT 1,188 1,348 1,500 1,623 1,634Corporate tax (4) (27) (177) (209) (206)After-tax net profit (loss) 1,184 1,321 1,322 1,414 1,427Minority interest (5) (3) 0 0 0Equity earnings from aff iliates 2 268 827 761 877Extra items (20) (8) 0 0 0Net profit (loss) 1,161 1,578 2,150 2,175 2,304Reported EPS 1.03 1.40 1.43 1.45 1.54Fully diluted EPS 1.03 1.40 1.43 1.45 1.54Core net profit 1,181 1,586 2,150 2,175 2,304Core EPS 1.05 1.41 1.43 1.45 1.54EBITDA 2,723 2,726 2,957 2,937 3,196KEY RATIOSRevenue grow th (%) 6.5 (9.8) (2.4) 0.4 2.7Gross margin (%) 7.6 8.8 10.1 9.8 9.8EBITDA margin (%) 10.3 11.5 12.7 12.6 13.4Operating margin (%) 6.5 7.1 8.3 7.9 8.0Net margin (%) 4.4 6.6 9.3 9.3 9.6Core profit margin (%) 4.5 6.7 9.3 9.3 9.6ROA (%) 2.9 3.7 4.6 4.4 4.4ROCE (%) 3.3 4.1 5.0 4.8 4.8Asset turnover (x) 0.7 0.6 0.5 0.5 0.5Current ratio (x) 1.8 1.6 2.6 2.4 1.8Gearing ratio (x) 0.6 0.5 0.3 0.3 0.4Interest coverage (x) 2.8 3.6 3.2 4.6 4.2
BALANCE SHEET (Btm)Cash & Equivalent 7,215 3,421 8,916 8,029 5,201Accounts receivable 4,999 3,013 3,912 3,927 4,032Inventory 389 359 360 363 372PP&E-net 18,178 20,048 21,227 22,388 31,148Other assets 12,563 16,091 15,350 14,676 14,063Total assets 43,344 42,932 49,765 49,383 54,817Accounts payable 3,112 2,276 2,593 2,613 2,683ST debts & current portion 2,614 1,595 1,606 1,833 2,060Long-term debt 10,927 11,711 9,591 7,757 11,593Other liabilities 2,330 1,332 1,282 1,292 1,327Total liabilities 18,983 16,914 15,073 13,495 17,662Paid-up capital 11,237 11,237 14,983 14,983 14,983Share premium 3,393 3,393 7,139 7,139 7,139Retained earnings 9,297 10,655 11,837 13,033 14,301Shareholders equity 23,927 25,285 33,959 35,155 36,422Minority interests 434 733 733 733 733Total Liab.&Shareholders' equity 43,344 42,932 49,765 49,383 54,817CASH FLOW (Btm)Net income 1,161 1,578 2,150 2,175 2,304Depreciation and amortization 1,016 1,043 1,039 1,086 1,292Change in w orking capital (216) 1,844 (605) 7 (41)FX, non-cash adjustment & others 558 138 0 0 (0)Cash flows from operating activities 2,519 4,603 2,585 3,268 3,555Capex (Invest)/Divest (363) (3,082) (2,218) (2,248) (10,052)Others (3,132) (3,871) 714 678 644Cash flows from investing activities (3,495) (6,953) (1,504) (1,570) (9,408)Debt financing (repayment) (2,653) (809) (2,109) (1,606) 4,062Equity f inancing 6,000 302 7,492 0 0Dividend payment 0 (112) (967) (979) (1,037)Others (3,132) (3,871) 714 678 644Cash flows from financing activities 3,347 (619) 4,415 (2,585) 3,025Net change in cash 2,371 (2,969) 5,495 (888) (2,827)
Free cash flow (Btm) 2,156 1,521 367 1,020 (6,496)FCF per share (Bt) 1.9 1.4 0.2 0.7 (4.3)
Key assumptions 2013 2014 2015E 2016E 2017EBt/US$ 30.7 32.6 32.9 32.9 32.9Base rate (Bt/unit) 3.23 3.23 3.23 3.23 3.23
0.00.20.40.60.81.01.21.41.6
(15)(10)
(5)05
10
11 12 13 14 15E 16E 17E
Revenue growth (%) (LHS)Asset turnover (x) (RHS)% x
01020304050607080
11 12 13 14 15E 16E 17E
AR / Sales (days)AP / Cost of Goods (days)
days
02468
1012
11 12 13 14 15E 16E 17E
Gross margin (%) EBIT margin (%)%
05101520253035
02468
1012
11 12 13 14 15E 16E 17E
Capex (Bt,bn) Capex / Net PPE (%)Bt,bn %
01234567
11 12 13 14 15E 16E 17E
(ST debt + Interest) / EBITDA(Debt + Interest) / EBITDA
x
0.00 0.02 0.00 0.10
0.65 0.65 0.69
0
10
20
30
40
50
0.000.100.200.300.400.500.600.700.80
11 12 13 14 15E 16E 17E
Dividend (Bt) Payout ratio (%)Bt/Shr %
Revenue growth and asset turnover
A/C receivable & A/C payable days
Profit margins
Capital expenditure
Debt serviceability
Dividend payout

GPSC - 3
Contents Executive summary ………………………………………………………………………………………….. 4
Transaction summary ………………………………………………………………………………………... 5
Valuation ………….……………………………………….…………………………………………….…….. 6
Outlook ……………………………………………………………………………………………..………….. 7
Earnings and financials …………………………………………………………………………………...….. 17
Key risks …………….…...…………………………………………………………………………….…….... 20
SWOT analysis …………….…...…………………………………………………………………………….. 21
Background ……………………………………………………………………….…….….…………………. 22
Appendix 1: Glossary ………………………………………………….…….….…………..……………….. 24
Appendix 2: GPSC’s project details ……………………………………………….…….….………………. 25
Appendix 3: GPSC’s Key contractual agreements ……………………………….…….….………...….... 26

GPSC - 4
Executive summary Fair value estimated in the range of Bt30–32/share. We applied the discounted cash flow (DCF) methodology to GPSC’s existing projects and using a weighted average cost of capital (WACC) sensitivity of 6.5-7.5%, our equity value estimate ranges from Bt30-32/share with the inclusion of all pipeline projects. Nonetheless, we preserve our conservative assumption by valuing all GPSC projects based only on their contractual power purchase agreement (PPA) lives. Our fair value per share assumes full dilution of 374.57m IPO shares.
Regional growth in power market. Although the near-term power outlook in Thailand is somewhat subdued, we believe growth opportunities still exist outside Thailand for power generation, mainly in the Cambodia, Laos, Myanmar and Vietnam subregion (CLMV). But once the domestic economy picks up, we believe that GPSC will benefit from increased demand for their electricity and for their other utilities services. There will also be ample of upside for additional renewables capacity in the long term. We expect to see up to 6,000MW in solar capacity and 3,000MW for wind allocation as well as tariffs that will give much more attractive project internal rates of return (IRR) for waste, biogas and biomass projects. This will provide GPSC with many opportunities for growth.
Leverage on PTT Group. GPSC’s parent firm PTT Group has a strong track record in new project development and a three-decade presence throughout the ASEAN region. This definitely provides the firm with an advantageous position to exploit new utilities opportunities on both a corporate and governmental level. Also, by being under the PTT Group umbrella, the firm has the benefit of being allocated the group’s utilities requirements from its various projects. Finally, the firm’s strong relationships with its investment partners will definitely provide further scope in new joint ventures both within and outside Thailand as well.
Secured and diversified capacity growth. GPSC’s in-hand secured capacity allocations mean that it has the best generating capacity expansion profile within the Thai Utilities space—a 2015-19 CAGR of 7% versus a 4% peer mean for the same period. The start-up of IRPC Clean Power Phase I (IRPCCP) this year and Nava Nakorn Electricity Generating (NNEG) in 2016 will boost its equity capacity from 1,315MW at YE14 to 1,376MW by YE16 and to a massive 1,851MW by YE19. Its power capacity growth is just the beginning—its steam and chilled water capacity growth is far more substantial. Its chilled water operation is set to double from 6,000 refrigeration tons (RT) to 12,000 RT by 2016 and its steam capacity will expand 12% from 1,345 ton/hour (tn/hr) to 1,512 tn/hr by the year 2017. Furthermore, its asset locations are well diversified across Thailand and Laos, mitigating operational risks associated with particular locations and assets.
Opportunities in power-related business. Apart from GPSC’s strong earnings visibility from its utilities business, there are also ample of opportunities from its transmission, energy-advisory and energy-storage businesses. These businesses will add income, diversify the firm’s revenue streams, and their research and innovation will also support the growth and advancement of its core utilities business. We believe these should bear fruit in the future once the company starts to commercialize its expertise and research knowledge.
Earnings on upward trend with spectacular profit growth foreseen through 2020. This year, GPSC will start to realize substantial earnings from its investments and profit growth will start in earnest. We anticipate a 36% YoY profit expansion in 2015. The key driver would come from the first full-year realization of its five solar photovoltaic (PV) farms with combined capacity of 40MW (40% stake), which became operational in June last year. GPSC’s 700MW gas-fired IPP (100% stake) is also to ramp up its capacity to a full-run status after its major overhaul in 2014. Going forward, the raft of its pipeline profits would support the firm’s forward profitability through to 2020. With that in mind, we anticipate the firm’s bottom line to reach almost Bt4bn by 2020, significantly up from Bt1, 578m in 2014 with a projected CAGR of 16% during 2015-20.

GPSC - 5
Transaction summary
GPSC to list 374,575,200 IPO shares on the SET: Global Power Synergy Plc (Ticker: GPSC) will issue an additional 374,575,200 shares and list all new shares for sale on the SET at a par value of Bt10.00 per share.
Up to 374,575,200 shares offered: A maximum of 374,575,200 shares will be offered for sale in the IPO of which: 1) 9,310,000 will be initially offered in the form of employee stock options (ESOP) to GPSC management and 2) 365,265,200 shares (plus any remaining unsubscribed ESOP shares) will be offered to the public.
Public shareholding to represent largest portion following IPO: Currently, GPSC is owned entirely by the PTT Group, with its members holding proportionate shares. The pre-IPO shareholding structure is as follows—PTT Global Chemical, 30.31%; PTT, 30.10%; Thai Oil Power, 27.71%; and, Thai Oil, 11.88%.
Immediately following the IPO, the shareholding structure of GPSC will be as follows (assuming ESOP fully subscribed)—Public, 24.38%; PTT Global Chemical, 22.73%; PTT, 22.58%; Thai Oil Power, 20.79%; Thai Oil, 8.91%; and, management, 0.62%.
Proceeds from IPO: GPSC intends to use the IPO proceeds for: 1) expansion of domestic and international businesses and 2) working capital.
Bualuang Securities (BLS) is an underwriter: BLS is an underwriter of this IPO.
Research blackout period: April 22 – May 06, 2015
IPO subscription period: May 07-12, 2015.
Inaugural SET trading date: May 18, 2015. Figure 1: Pre-IPO shareholding structure (as of March 2015)—Total shares outstanding: 1,123,725,600 Figure 2: Post-IPO shareholding structure (as of March 2015)—
Total shares outstanding: 1,498,300,800
PTT Global Chemicals
30%
PTT30%
Thai Oil Power28%
Thai Oil12%
PTT Global Chemicals
23%PTT22%
Thai Oil Power21%
Thai Oil9%
Management1%
Public24%
Source: Company data Source: Company data
GPSC - 6
Valuations
Not only is GPSC a defensive in-nature Thai utilities player but it is also at the growth stage from its raft of projects in the pipeline. Thus, we deem that the DCF model is the most appropriate method by which to value the firm.
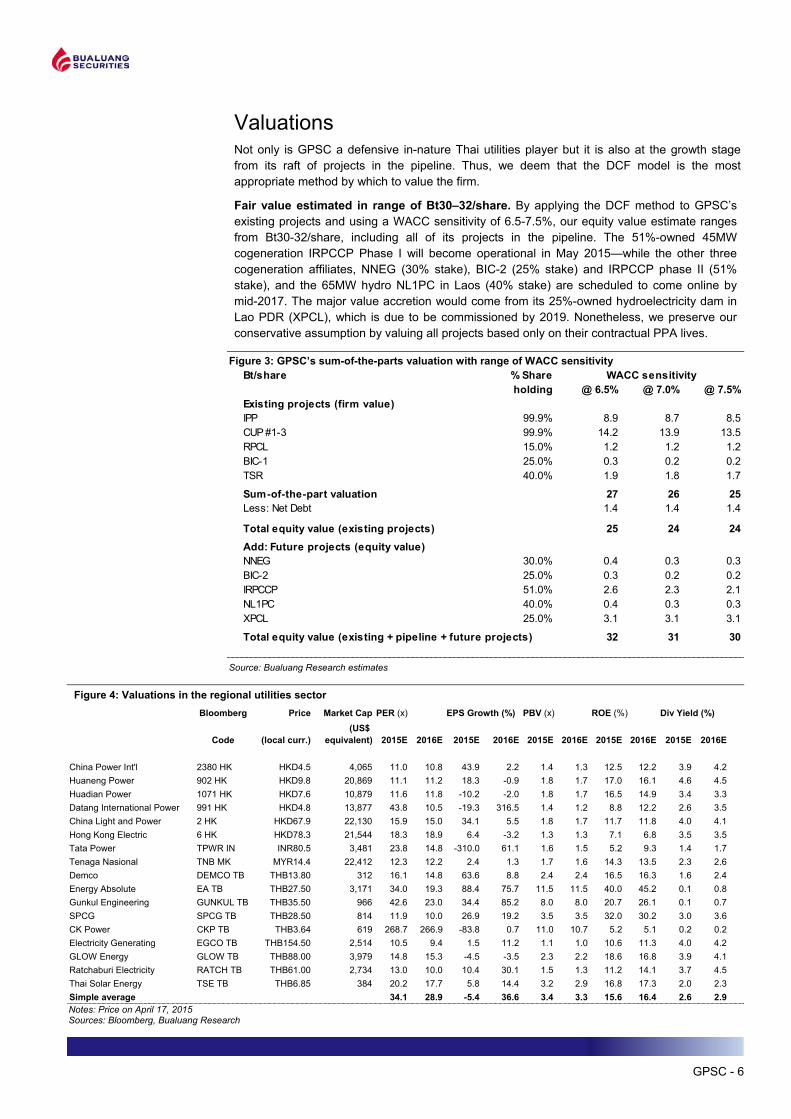
Fair value estimated in range of Bt30–32/share. By applying the DCF method to GPSC’s existing projects and using a WACC sensitivity of 6.5-7.5%, our equity value estimate ranges from Bt30-32/share, including all of its projects in the pipeline. The 51%-owned 45MW cogeneration IRPCCP Phase I will become operational in May 2015—while the other three cogeneration affiliates, NNEG (30% stake), BIC-2 (25% stake) and IRPCCP phase II (51% stake), and the 65MW hydro NL1PC in Laos (40% stake) are scheduled to come online by mid-2017. The major value accretion would come from its 25%-owned hydroelectricity dam in Lao PDR (XPCL), which is due to be commissioned by 2019. Nonetheless, we preserve our conservative assumption by valuing all projects based only on their contractual PPA lives.
Figure 3: GPSC’s sum-of-the-parts valuation with range of WACC sensitivity
Source: Bualuang Research estimates
Figure 4: Valuations in the regional utilities sector Bloomberg Price Market Cap PER (x) EPS Growth (%) PBV (x) ROE (%) Div Yield (%)
Code (local curr.)(US$
equivalent) 2015E 2016E 2015E 2016E 2015E 2016E 2015E 2016E 2015E 2016E
China Power Int'l 2380 HK HKD4.5 4,065 11.0 10.8 43.9 2.2 1.4 1.3 12.5 12.2 3.9 4.2Huaneng Power 902 HK HKD9.8 20,869 11.1 11.2 18.3 -0.9 1.8 1.7 17.0 16.1 4.6 4.5Huadian Power 1071 HK HKD7.6 10,879 11.6 11.8 -10.2 -2.0 1.8 1.7 16.5 14.9 3.4 3.3Datang International Power 991 HK HKD4.8 13,877 43.8 10.5 -19.3 316.5 1.4 1.2 8.8 12.2 2.6 3.5China Light and Power 2 HK HKD67.9 22,130 15.9 15.0 34.1 5.5 1.8 1.7 11.7 11.8 4.0 4.1Hong Kong Electric 6 HK HKD78.3 21,544 18.3 18.9 6.4 -3.2 1.3 1.3 7.1 6.8 3.5 3.5Tata Power TPWR IN INR80.5 3,481 23.8 14.8 -310.0 61.1 1.6 1.5 5.2 9.3 1.4 1.7Tenaga Nasional TNB MK MYR14.4 22,412 12.3 12.2 2.4 1.3 1.7 1.6 14.3 13.5 2.3 2.6Demco DEMCO TB THB13.80 312 16.1 14.8 63.6 8.8 2.4 2.4 16.5 16.3 1.6 2.4Energy Absolute EA TB THB27.50 3,171 34.0 19.3 88.4 75.7 11.5 11.5 40.0 45.2 0.1 0.8Gunkul Engineering GUNKUL TB THB35.50 966 42.6 23.0 34.4 85.2 8.0 8.0 20.7 26.1 0.1 0.7SPCG SPCG TB THB28.50 814 11.9 10.0 26.9 19.2 3.5 3.5 32.0 30.2 3.0 3.6CK Power CKP TB THB3.64 619 268.7 266.9 -83.8 0.7 11.0 10.7 5.2 5.1 0.2 0.2Electricity Generating EGCO TB THB154.50 2,514 10.5 9.4 1.5 11.2 1.1 1.0 10.6 11.3 4.0 4.2GLOW Energy GLOW TB THB88.00 3,979 14.8 15.3 -4.5 -3.5 2.3 2.2 18.6 16.8 3.9 4.1Ratchaburi Electricity RATCH TB THB61.00 2,734 13.0 10.0 10.4 30.1 1.5 1.3 11.2 14.1 3.7 4.5Thai Solar Energy TSE TB THB6.85 384 20.2 17.7 5.8 14.4 3.2 2.9 16.8 17.3 2.0 2.3Simple average 34.1 28.9 -5.4 36.6 3.4 3.3 15.6 16.4 2.6 2.9Notes: Price on April 17, 2015 Sources: Bloomberg, Bualuang Research
Bt/share % Shareholding @ 6.5% @ 7.0% @ 7.5%
Existing projects (firm value)IPP 99.9% 8.9 8.7 8.5CUP #1-3 99.9% 14.2 13.9 13.5RPCL 15.0% 1.2 1.2 1.2BIC-1 25.0% 0.3 0.2 0.2TSR 40.0% 1.9 1.8 1.7
Sum-of-the-part valuation 27 26 25Less: Net Debt 1.4 1.4 1.4
Total equity value (existing projects) 25 24 24Add: Future projects (equity value)NNEG 30.0% 0.4 0.3 0.3BIC-2 25.0% 0.3 0.2 0.2IRPCCP 51.0% 2.6 2.3 2.1NL1PC 40.0% 0.4 0.3 0.3XPCL 25.0% 3.1 3.1 3.1
Total equity value (existing + pipeline + future projects) 32 31 30
WACC sensitivity

GPSC - 7
Outlook Positive #1: Regional growth in power market
Although the near-term power outlook in Thailand is somewhat subdued, we believe growth opportunities still exist outside Thailand for power generation, mainly in the CLMV subregion. However, once the domestic economy picks up, we believe that GPSC will benefit from increased electricity demand, and increased demand for its other utilities services. Also, there will be ample upside for extra renewables capacity in the long term. We expect to see up to 6,000MW in solar capacity and 3,000MW for wind allocation as well as tariffs that will give much more attractive project IRRs for waste, biogas and biomass projects. This will provide GPSC with many opportunities for growth.
Lower demand growth expectation for PDP2015 … With the ongoing power demand–supply mismatch, the scope of the upcoming Power Development Plan 2015 (PDP2015) will not be as exciting as the market may expect. Power demand expansion correlates closely with macroeconomic growth and under the new 21-year plan (2015–2036), the total capacity will reflect lower demand growth based on the revised GDP growth projection of 3.9%. The PDP projections for peak demand were 27,443MW for 2013 and 28,790MW for 2014, while actual demand was 2.2% lower for 2013 and 5.0% lower for 2014. The numbers were weaker than forecasts because they were pegged to GDP growth assumptions that proved to be too high (the current PDP assumed mean annual GDP growth of 4.4% for 2013-20). In fact, GDP rose only 2.9% in 2013 and inched up just 0.7% in 2014.
Apart from specifying the scope for power supply, the Ministry of Energy (MoE) has also pushed for more rigorous power efficiency schemes and thus the new PDP will also incorporate the Energy Efficiency Development Plan (EEDP) and the Alternative Energy Development Plan (AEDP) altogether. As a result, total capacity of 70.3GW is expected in the new PDP2015, 5.6GW less than the planned capacity of 76.0GW. Bearing in mind the revised capacity on top of the signed PPAs in the pipeline, we forecast that the total power reserve margin will reach as high as 39% by YE24. This foreseeable demand–supply imbalance will inevitably push back any new IPP or SPP bidding timeline.
Figure 5: Load projections under current PDP versus actual numbers
Sources: PDP 2010 (Revision 3), EPPO, BOT, Bualuang Research
0%
2%
4%
6%
8%
10,000
20,000
30,000
40,000
2011 2012 2013 2014 2015 2016 2017 2018 2019 2020
Peak demand under the current PDP Actual peak demand
GDP projections under the current PDP Actual GDP growth
Actual power demand and GDP missed expectations
GPSC - 8
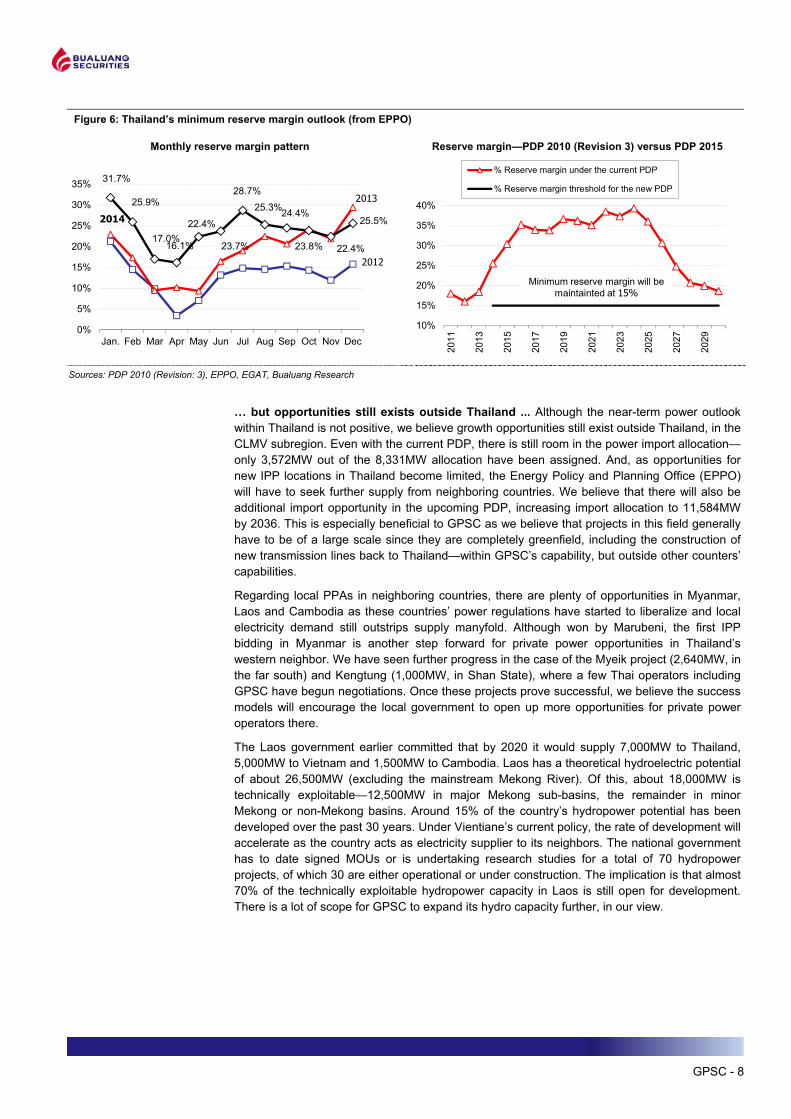
Figure 6: Thailand’s minimum reserve margin outlook (from EPPO)
Monthly reserve margin pattern Reserve margin—PDP 2010 (Revision 3) versus PDP 2015
31.7%
25.9%
17.0%16.1%
22.4%
23.7%
28.7%25.3%24.4%
23.8% 22.4%
25.5%
0%
5%
10%
15%
20%
25%
30%
35%
Jan. Feb Mar Apr May Jun Jul Aug Sep Oct Nov Dec
2013
2012
2014
10%
15%
20%
25%
30%
35%
40%
2011
2013
2015
2017
2019
2021
2023
2025
2027
2029
% Reserve margin under the current PDP
% Reserve margin threshold for the new PDP
Minimum reserve margin will be maintainted at 15%
Sources: PDP 2010 (Revision: 3), EPPO, EGAT, Bualuang Research
… but opportunities still exists outside Thailand ... Although the near-term power outlook
within Thailand is not positive, we believe growth opportunities still exist outside Thailand, in the CLMV subregion. Even with the current PDP, there is still room in the power import allocation—only 3,572MW out of the 8,331MW allocation have been assigned. And, as opportunities for new IPP locations in Thailand become limited, the Energy Policy and Planning Office (EPPO) will have to seek further supply from neighboring countries. We believe that there will also be additional import opportunity in the upcoming PDP, increasing import allocation to 11,584MW by 2036. This is especially beneficial to GPSC as we believe that projects in this field generally have to be of a large scale since they are completely greenfield, including the construction of new transmission lines back to Thailand—within GPSC’s capability, but outside other counters’ capabilities.
Regarding local PPAs in neighboring countries, there are plenty of opportunities in Myanmar, Laos and Cambodia as these countries’ power regulations have started to liberalize and local electricity demand still outstrips supply manyfold. Although won by Marubeni, the first IPP bidding in Myanmar is another step forward for private power opportunities in Thailand’s western neighbor. We have seen further progress in the case of the Myeik project (2,640MW, in the far south) and Kengtung (1,000MW, in Shan State), where a few Thai operators including GPSC have begun negotiations. Once these projects prove successful, we believe the success models will encourage the local government to open up more opportunities for private power operators there.
The Laos government earlier committed that by 2020 it would supply 7,000MW to Thailand, 5,000MW to Vietnam and 1,500MW to Cambodia. Laos has a theoretical hydroelectric potential of about 26,500MW (excluding the mainstream Mekong River). Of this, about 18,000MW is technically exploitable—12,500MW in major Mekong sub-basins, the remainder in minor Mekong or non-Mekong basins. Around 15% of the country’s hydropower potential has been developed over the past 30 years. Under Vientiane’s current policy, the rate of development will accelerate as the country acts as electricity supplier to its neighbors. The national government has to date signed MOUs or is undertaking research studies for a total of 70 hydropower projects, of which 30 are either operational or under construction. The implication is that almost 70% of the technically exploitable hydropower capacity in Laos is still open for development. There is a lot of scope for GPSC to expand its hydro capacity further, in our view.
GPSC - 9
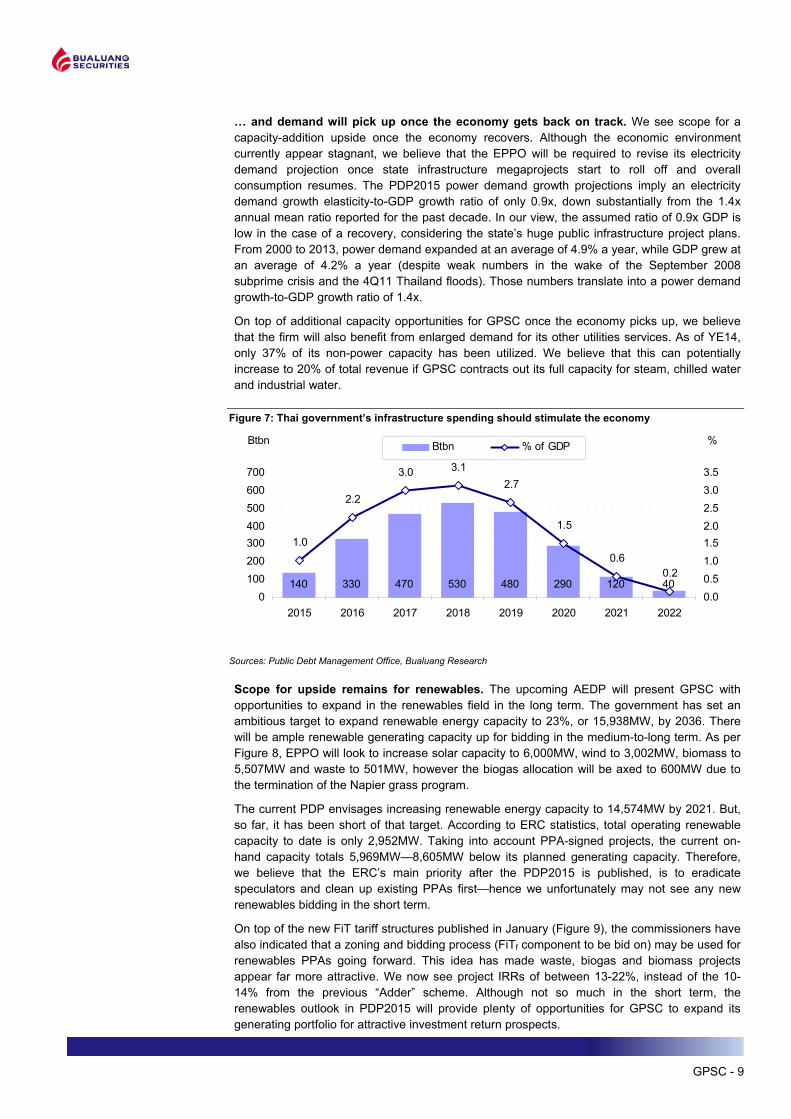
… and demand will pick up once the economy gets back on track. We see scope for a
capacity-addition upside once the economy recovers. Although the economic environment currently appear stagnant, we believe that the EPPO will be required to revise its electricity demand projection once state infrastructure megaprojects start to roll off and overall consumption resumes. The PDP2015 power demand growth projections imply an electricity demand growth elasticity-to-GDP growth ratio of only 0.9x, down substantially from the 1.4x annual mean ratio reported for the past decade. In our view, the assumed ratio of 0.9x GDP is low in the case of a recovery, considering the state’s huge public infrastructure project plans. From 2000 to 2013, power demand expanded at an average of 4.9% a year, while GDP grew at an average of 4.2% a year (despite weak numbers in the wake of the September 2008 subprime crisis and the 4Q11 Thailand floods). Those numbers translate into a power demand growth-to-GDP growth ratio of 1.4x.
On top of additional capacity opportunities for GPSC once the economy picks up, we believe that the firm will also benefit from enlarged demand for its other utilities services. As of YE14, only 37% of its non-power capacity has been utilized. We believe that this can potentially increase to 20% of total revenue if GPSC contracts out its full capacity for steam, chilled water and industrial water.
Figure 7: Thai government’s infrastructure spending should stimulate the economy
Sources: Public Debt Management Office, Bualuang Research
Scope for upside remains for renewables. The upcoming AEDP will present GPSC with opportunities to expand in the renewables field in the long term. The government has set an ambitious target to expand renewable energy capacity to 23%, or 15,938MW, by 2036. There will be ample renewable generating capacity up for bidding in the medium-to-long term. As per Figure 8, EPPO will look to increase solar capacity to 6,000MW, wind to 3,002MW, biomass to 5,507MW and waste to 501MW, however the biogas allocation will be axed to 600MW due to the termination of the Napier grass program.
The current PDP envisages increasing renewable energy capacity to 14,574MW by 2021. But, so far, it has been short of that target. According to ERC statistics, total operating renewable capacity to date is only 2,952MW. Taking into account PPA-signed projects, the current on-hand capacity totals 5,969MW—8,605MW below its planned generating capacity. Therefore, we believe that the ERC’s main priority after the PDP2015 is published, is to eradicate speculators and clean up existing PPAs first—hence we unfortunately may not see any new renewables bidding in the short term.
On top of the new FiT tariff structures published in January (Figure 9), the commissioners have also indicated that a zoning and bidding process (FiTf component to be bid on) may be used for renewables PPAs going forward. This idea has made waste, biogas and biomass projects appear far more attractive. We now see project IRRs of between 13-22%, instead of the 10-14% from the previous “Adder” scheme. Although not so much in the short term, the renewables outlook in PDP2015 will provide plenty of opportunities for GPSC to expand its generating portfolio for attractive investment return prospects.
140 330 470 530 480 290 120 40
1.0
2.2
3.0 3.12.7
1.5
0.60.2
0100200300400500600700
2015 2016 2017 2018 2019 2020 2021 20220.00.51.01.52.02.53.03.5
Btbn % of GDPBtbn %

GPSC - 10
Figure 8: EPPO’s draft plan for renewable energy capacity, 2015-36
Sources: EPPO, Bualuang Research
Figure 9: Newly published renewables tariffs have made some renewable types more attractive
Sources: Thailand Energy Regulatory Commission, Bualuang Research estimates
Project Type FiTf FiT2016 Total Est. IRR (Bt/kWh) (Bt/kWh) (Bt/kWh)
Solar farm 5.66 - - 5.66 - 25 11.0% 6.5 adder
Industrial solar rooftop (>10-250 kW) 6.55 - - 6.55 - 25 17.1% 6.5 adder
Industrial solar rooftop (>250-1,000 kW) 6.16 - - 6.16 - 25 16.4% 6.5 adder
Residential Solar Rooftop (<10 kW) 6.85 - - 6.85 - 25 18.8% 6.5 adder
Local solar 5.66 - - 5.66 - 25 11.0% 6.5 adder
Waste thermal (<1 MW) 3.13 3.21 0.70 7.04 0.50 20 20.5% N/A
Waste thermal (>1 MW-3 MW) 2.61 3.21 0.70 6.52 0.50 20 18.6% N/A
Waste thermal (>3 MW) 2.39 2.69 0.70 5.78 0.50 20 15.9% 3.5 adder
Waste (industrial) 5.60 - - 5.60 0.50 10 22.0% 2.5 adder
Wind 6.06 - - 6.06 0.50 20 10.9% 4.5 adder
Biomass (<1MW) 3.13 2.21 0.50 5.84 0.50 20 18.2% 0.5 adder
Biomass (>1MW-3MW) 2.61 2.21 0.40 5.22 0.50 20 15.9% 0.3 adder
Biomass (>3MW) 2.39 1.85 0.30 4.54 0.50 20 13.2% 0.3 adder
Biogas (waste) 3.76 - 0.50 4.26 0.50 20 18.0% 2.85 adder
Biogas (plants) 2.79 2.55 0.50 5.84 0.50 20 18.2% 0.5 adder
Hydro (<200 kW) 4.90 - - 4.90 0.50 20 N/A 1.5 adder
Southern province subsidy (full period)
Length (yrs)
Previous Adder rate
Additional premium (8 yrs)
02,0004,0006,0008,000
10,00012,00014,00016,000
2014 2016 2018 2020 2022 2024 2026 2028 2030 2032 2034 2036
Solar Wind Hydro Waste Biogas Biomass

GPSC - 11
Positive #2: Leverage on PTT Group GPSC is the best utilities play within the ASEAN sector space. Its parent firm, PTT Group, has a strong track record in new project development and a three-decade presence across the region. This definitely places the firm in an advantageous position to exploit new utilities opportunities on both a corporate and governmental level. Also, by being under the PTT Group umbrella, the firm has the benefit of being allocated group companies’ utility requirements for their various projects. Finally, the firm’s strong links with investment partners will definitely provide further scope in new joint ventures both within and outside Thailand as well.
PTT Group power flagship. PTT Group is a Fortune 500-level conglomerate and Thailand’s leading energy player. Similarly, it is fair to say that under PTT, GPSC is one of Thailand’s leading power and utilities players. As the firm was established as the sole power investment arm for the group in domestic and international markets, it would be able to utilize PTT Group’s global relationships with other conglomerates and governments to seek new power and power-related opportunities inside and outside Thailand.
Furthermore, leveraging on PTT Group’s size and experience in the market gives GPSC key market know-how and credibility as a serious player in the Thai utilities industry. PTT Group’s business footprint in the region is diverse, which will allow the firm to attract high-value commercial customers while simultaneously sustaining and increasing co-operation with public sector customers in Thailand.
Figure 10: Corporates under PTT Group
Source: Company data

GPSC - 12
Growth within PTT Group. As GPSC is the utilities arm of PTT Group, it will definitely be preferable for all group subsidiaries to endow GPSC with their power projects. To begin with, we believe immediate utilities projects include CUP-4 (to accommodate PTTGC’s expansion), and building power plants on the back end of TOP’s refinery upgrade venture with Pertamina in Indonesia, PTT’s “Victory” refinery and petrochemicals complex in Vietnam and PTT’s Thanlyin (major port city near Yangon) oil refinery project in Myanmar.
Figure 11: PTT Group is one of Thailand’s biggest global players
Source: Company data
External opportunities with PTT Group and partners. GPSC’s strong relationships with its partners will enable it to grow swiftly. We see scope for the firm to expand its reach alongside PTT Group as well as its strategic partners globally. With PTT Group’s capability for business expansion on a global scale (as we have seen in the case of PTTEP and PTTGC), we believe that GPSC will be able to utilize this network in a similar manner. Additionally, its continuing strong relationships with existing partners will also allow the firm to grow along with existing partners in new joint venture projects regionally.

GPSC - 13
Positive #3: Secured and diversified capacity growth GPSC’s in-hand secured capacity allocations mean that it has the best generating capacity expansion profile within the Thai Utilities space—a 2015-19 CAGR of 7% versus a 4% peer mean for the same period. The start-up of IRPCCP Phase I this year and NNEG in 2016 will boost its equity capacity from 1,315MW at YE14 to 1,376MW by YE16 and to a massive 1,851MW by YE19 with the commencement of its remaining projects. Its power capacity growth is just the beginning—its steam and chilled water capacity growth is far more substantial. Its chilled water operation is set to double from 6,000 RT to 12,000 RT by 2016 and its steam capacity will increase 12% from 1,345 tn/hr to 1,512 tn/hr by the year 2017. Additionally, its asset locations are well diversified in Thailand and Laos, mitigating the operational risks associated with particular locations and assets.
Figure 12: Power capacity growth profiles—GPSC versus EGCO, RATCH and GLOW
Sources: Company data, Bualuang Research Figure 13: GPSC’s other services capacity growth profile
Chilled water operation to double by 2016 Steam capacity to jump by 12% by 2017
4,0005,0006,0007,0008,0009,000
10,00011,00012,00013,000
2014 2015E 2016E 2017E 2018E 2019E
0
500
1,000
1,500
2,000
2,500
2014 2015E 2016E 2017E 2018E 2019E
Steam (tn/hr) Industrial water (cu.m/hr)
Sources: Company data, Bualuang Research
2,0002,5003,0003,5004,0004,5005,0005,5006,0006,5007,000
2013 2014 2015E 2016E 2017E 2018E 2019E
GPSC EGCO GLOW RATCHMWMW
1,0001,2001,4001,6001,8002,000
2013 2014 2015E 2016E 2017E 2018E 2019E
7% FY15-19 CAGR

GPSC - 14
Secured growth in pipeline. Most of GPSC’s electricity and utilities sales are made under long-term sales contracts. Its biggest counterparties are EGAT, PEA and PTT Group. Both EGAT and the PEA are state-chartered enterprises under the Ministry of the Interior and have always honored payment obligations to date. PTT Group is the major shareholder in GPSC and we believe that it is unlikely that their offtake agreements will be dishonored. Therefore, we believe it is safe to assume that GPSC’s projects, and thus offtake contracts, are secure, providing an element of stability and predictability that affords the company some level of insulation from competition.
GPSC’s in-hand capacity allocations currently have a power capacity CAGR of 7% during 2015-19—the best capacity growth within the Thai Utilities space. On top of the 513MW growth in the next four years, its chilled water operation is set to double from 6,000 RT to 12,000 RT by 2016 and its steam capacity will increase 12% from 1,345 tn/hr to 1,512 tn/hr by the year 2017. However, its industrial water capacity will remain at 2,080 cu.m/hr from 2015-19.
Varied asset mix. The firm has a good mix of assets generating a varied mix of services— including conventional (gas and coal), hydroelectric, and renewable power generating capacity in addition to steam, chilled water and industrial water capacity. This will help to mitigate against GPSC’s dependency on any particular fuel resource or revenue stream and ensure its long-term competitiveness as a major player in the Thai Utilities supply market.
Figure 14: GPSC’s existing power capacity by category
Sources: Company data, Bualuang Research
- 200 400 600 800
1,000 1,200 1,400 1,600 1,800 2,000
2014 2015E 2016E 2017E 2018E 2019E
Conventional Electricity (MW) Hydroelectric (MW) Solar Power (MW)
MW

GPSC - 15
Strategic asset locations. As seen below, GPSC’s assets are spread out across various
provinces within Thailand on top of two assets located in Laos. The focus in a few key locations is a significant competitive advantage. The strategic concentration of GPSC’s power plants within the Central and Eastern Seaboard areas will allow the firm to capture some of the largest and most important industrial estates for petrochemical and automotive-related manufacturers operating in Thailand. However, by also diversifying its investments cross-border to Laos, this will also help to prevent the firm’s dependency upon a particular province or country’s power demand at any point in time.
Figure 15: GPSC’s well diversified project locations
Source: Company data
Positive #4: Opportunities in power-related business Apart from GPSC’s strong earnings visibility from its utilities business, there are also ample of opportunities from its transmission, energy-advisory services and energy-storage businesses. Not only will these businesses add income and diversify the firm’s revenue streams, these research and innovation providers will also support the growth and advancement of its core utilities business. We believe these should bear fruit in the future once the firm starts to commercialize its expertise and research knowledge.
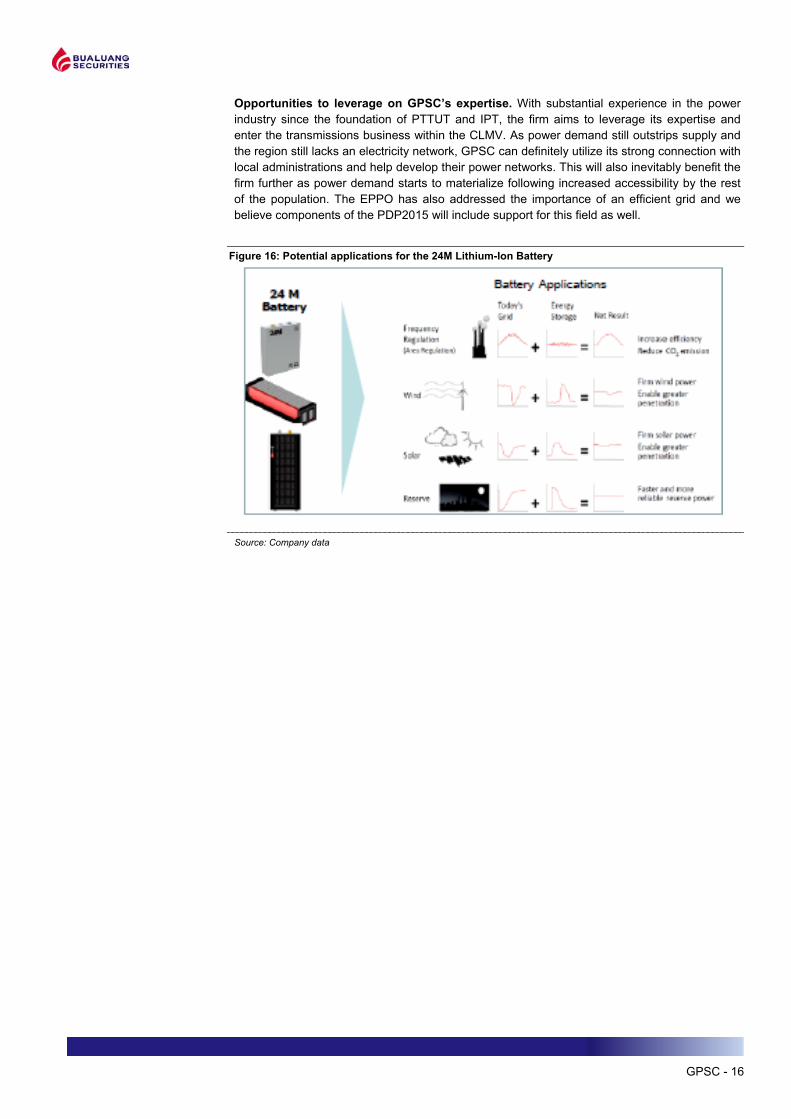
Research and innovation to support long-term growth. GPSC’s investment into 24M Technologies Inc. is one of the moves by the firm to innovate the power business. The firm is currently conducting research into power storage systems that would help to make power output from non-conventional sources more reliable, or even, on demand. This would inevitably convert non-conventional power generation into conventional power generation, a great breakthrough for the power industry.
Additional research includes improving Lithium-Ion batteries that would potentially be a marketable product for electric vehicles (EV). Similarly, GPSC is looking into providing consulting services in EPC, O&M and energy saving for power projects.
GPSC - 16
Opportunities to leverage on GPSC’s expertise. With substantial experience in the power industry since the foundation of PTTUT and IPT, the firm aims to leverage its expertise and enter the transmissions business within the CLMV. As power demand still outstrips supply and the region still lacks an electricity network, GPSC can definitely utilize its strong connection with local administrations and help develop their power networks. This will also inevitably benefit the firm further as power demand starts to materialize following increased accessibility by the rest of the population. The EPPO has also addressed the importance of an efficient grid and we believe components of the PDP2015 will include support for this field as well.
Figure 16: Potential applications for the 24M Lithium-Ion Battery
Source: Company data

GPSC - 17
Earnings outlook
GPSC is different from other comparable Thai utilities counters, as it has the most spectacular profit growth profile from the raft of its projects in the pipeline. Organic expansion through the PTT Group’s franchises, which have long-standing presence in the ASEAN region; and inorganic opportunities, would provide scope for an earnings upside in a foreseeable future. Its power plants’ cogeneration bases give GPSC a unique business feature—today it has highest steam and industrial water capacity among Thai utilities providers with as much as 1,345t/hr and 2,080 cu.m/hr respectively—these products are typically much more profitable than electricity sales to EGAT. Unlike EGCO and RATCH, which are IPP-based, about 70% of the firm’s electricity sales are obliged under long-term PPA agreement with EGAT, with sales to industrial clients making up the balance. While less of its capacity is tied to EGAT PPAs, which would also mean a less resilient revenue profile (than that of IPP-based providers), most of its industrial sales contracts are with PTT Group, which has a proven track record for power offtake reliability.
Earnings on uptrend with spectacular profit growth through 2020. This year, GPSC will start realizing substantial earnings from its investments, and profit growth will start in earnest. We anticipated a 36% YoY profit expansion in 2015 to Bt2,150m from the Bt1,578m it posted for the 2014. The key driver would come from the first full-year realization of its five solar PV farms, with combined capacity of 40MW (40% stake), which already became operational in June last year following the commencement of the first five in late 2013. Also, GPSC’s 700MW gas-fired IPP (100% stake) is to ramp up to full-run capacity after its major overhaul in 2014 and the 45MW and 180tn/hr-worth of IRPCCP Phase I (51% stake) is due to start-up in May this year.
Going forward, its raft of pipeline projects would support the firm’s forward profitability through 2020. With that in mind, we anticipate the firm’s bottom line will reach almost Bt4bn by 2020, significantly up from Bt1,578m in 2014 with projected CAGR of 16% during 2015-20. The start-up of other two cogenerations, 117MW BIC 2 (25% stake) and 195MW IRPCCP Phase II (51% stake); and also the 65MW hydropower NL1PC (40% stake)—all of which are due to be commissioned in 2017—would present a further boost to GPSC’s profit growth profile after 2016. Lastly, a substantial profit accretion will be attributed by its largest-ever 1,285MW hydroelectric dam scheme in Laos, XPCL (25% stake), which is scheduled to come online in 2019.
Figure 17: GPSC’s profit growth profile, 2015-20
Source: Company data, Bualuang Research estimates
1,5782,150 2,175 2,304
2,760 3,030
3,820
0
1,000
2,000
3,000
4,000
5,000
2014 2015E 2016E 2017E 2018E 2019E 2020E
Existing projects BIC2 IRPCCP NL1PC XPCLBtm
16% CAGR over the next 6 years
GPSC - 18
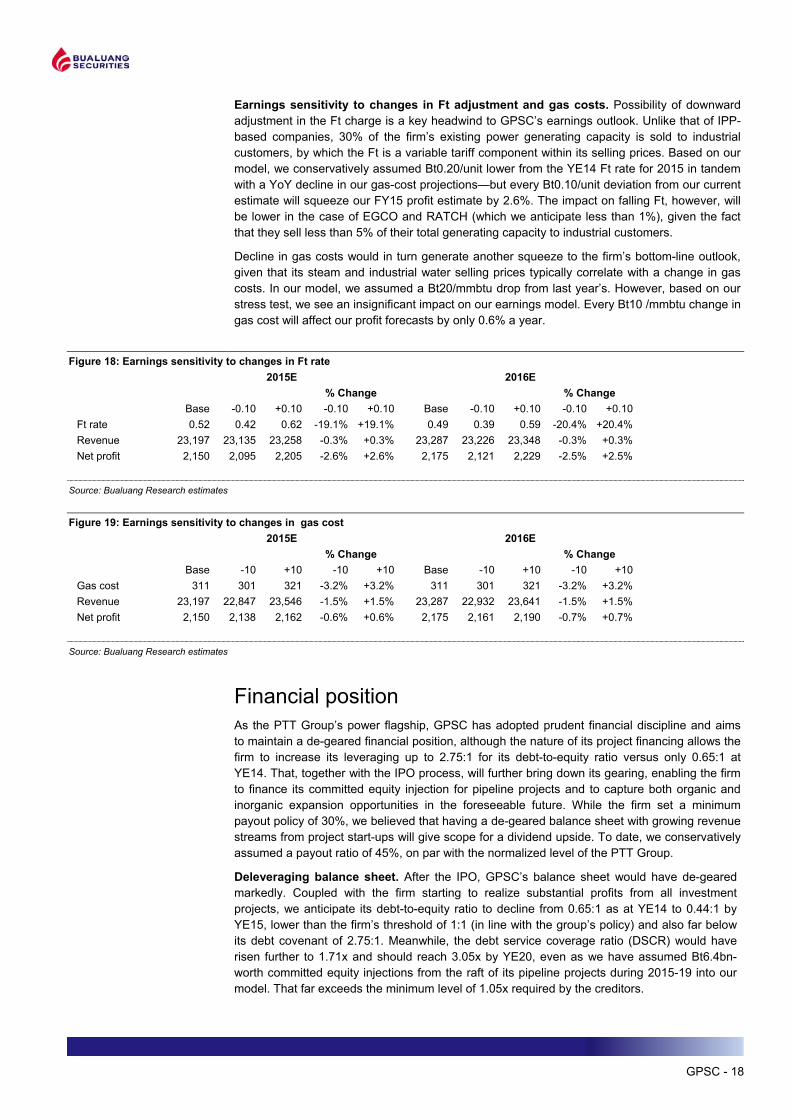
Earnings sensitivity to changes in Ft adjustment and gas costs. Possibility of downward adjustment in the Ft charge is a key headwind to GPSC’s earnings outlook. Unlike that of IPP-based companies, 30% of the firm’s existing power generating capacity is sold to industrial customers, by which the Ft is a variable tariff component within its selling prices. Based on our model, we conservatively assumed Bt0.20/unit lower from the YE14 Ft rate for 2015 in tandem with a YoY decline in our gas-cost projections—but every Bt0.10/unit deviation from our current estimate will squeeze our FY15 profit estimate by 2.6%. The impact on falling Ft, however, will be lower in the case of EGCO and RATCH (which we anticipate less than 1%), given the fact that they sell less than 5% of their total generating capacity to industrial customers.
Decline in gas costs would in turn generate another squeeze to the firm’s bottom-line outlook, given that its steam and industrial water selling prices typically correlate with a change in gas costs. In our model, we assumed a Bt20/mmbtu drop from last year’s. However, based on our stress test, we see an insignificant impact on our earnings model. Every Bt10 /mmbtu change in gas cost will affect our profit forecasts by only 0.6% a year.
Figure 18: Earnings sensitivity to changes in Ft rate
Source: Bualuang Research estimates Figure 19: Earnings sensitivity to changes in gas cost
Source: Bualuang Research estimates
Financial position As the PTT Group’s power flagship, GPSC has adopted prudent financial discipline and aims to maintain a de-geared financial position, although the nature of its project financing allows the firm to increase its leveraging up to 2.75:1 for its debt-to-equity ratio versus only 0.65:1 at YE14. That, together with the IPO process, will further bring down its gearing, enabling the firm to finance its committed equity injection for pipeline projects and to capture both organic and inorganic expansion opportunities in the foreseeable future. While the firm set a minimum payout policy of 30%, we believed that having a de-geared balance sheet with growing revenue streams from project start-ups will give scope for a dividend upside. To date, we conservatively assumed a payout ratio of 45%, on par with the normalized level of the PTT Group.
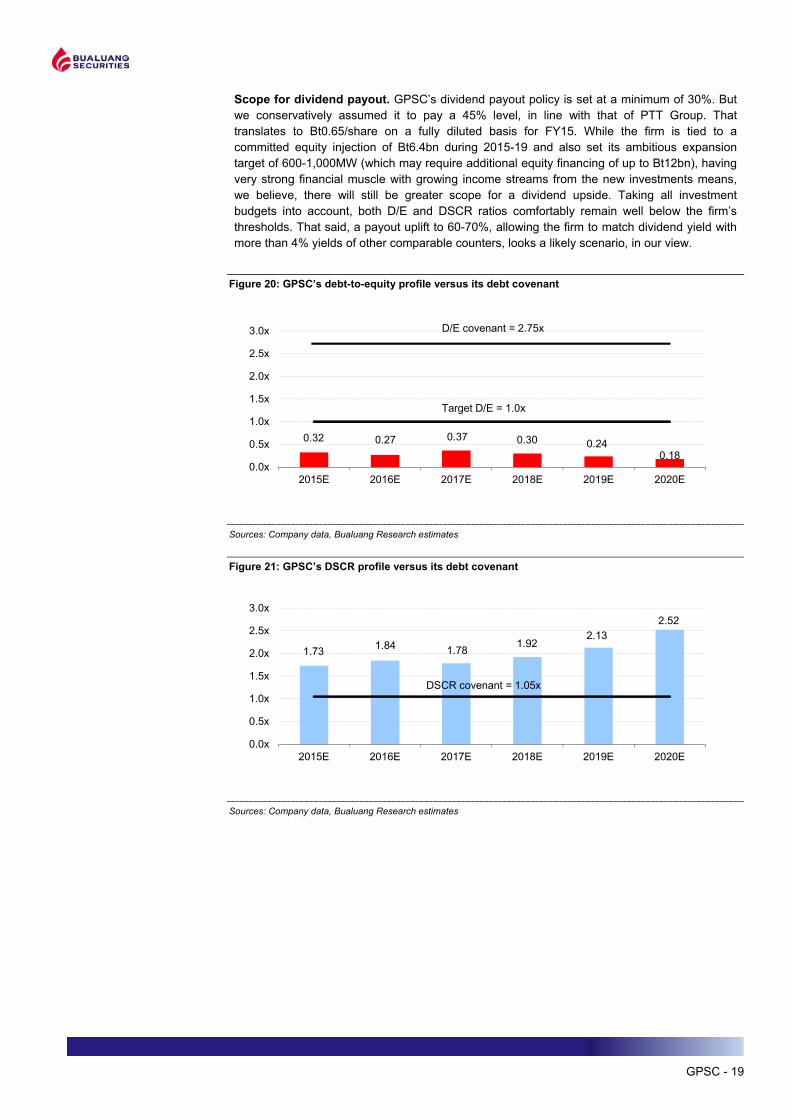
Deleveraging balance sheet. After the IPO, GPSC’s balance sheet would have de-geared markedly. Coupled with the firm starting to realize substantial profits from all investment projects, we anticipate its debt-to-equity ratio to decline from 0.65:1 as at YE14 to 0.44:1 by YE15, lower than the firm’s threshold of 1:1 (in line with the group’s policy) and also far below its debt covenant of 2.75:1. Meanwhile, the debt service coverage ratio (DSCR) would have risen further to 1.71x and should reach 3.05x by YE20, even as we have assumed Bt6.4bn-worth committed equity injections from the raft of its pipeline projects during 2015-19 into our model. That far exceeds the minimum level of 1.05x required by the creditors.
Base -0.10 +0.10 -0.10 +0.10 Base -0.10 +0.10 -0.10 +0.10Ft rate 0.52 0.42 0.62 -19.1% +19.1% 0.49 0.39 0.59 -20.4% +20.4%Revenue 23,197 23,135 23,258 -0.3% +0.3% 23,287 23,226 23,348 -0.3% +0.3%Net profit 2,150 2,095 2,205 -2.6% +2.6% 2,175 2,121 2,229 -2.5% +2.5%
2015E 2016E% Change % Change
Base -10 +10 -10 +10 Base -10 +10 -10 +10Gas cost 311 301 321 -3.2% +3.2% 311 301 321 -3.2% +3.2%Revenue 23,197 22,847 23,546 -1.5% +1.5% 23,287 22,932 23,641 -1.5% +1.5%Net profit 2,150 2,138 2,162 -0.6% +0.6% 2,175 2,161 2,190 -0.7% +0.7%
% Change2015E 2016E
% Change
GPSC - 19
Scope for dividend payout. GPSC’s dividend payout policy is set at a minimum of 30%. But we conservatively assumed it to pay a 45% level, in line with that of PTT Group. That translates to Bt0.65/share on a fully diluted basis for FY15. While the firm is tied to a committed equity injection of Bt6.4bn during 2015-19 and also set its ambitious expansion target of 600-1,000MW (which may require additional equity financing of up to Bt12bn), having very strong financial muscle with growing income streams from the new investments means, we believe, there will still be greater scope for a dividend upside. Taking all investment budgets into account, both D/E and DSCR ratios comfortably remain well below the firm’s thresholds. That said, a payout uplift to 60-70%, allowing the firm to match dividend yield with more than 4% yields of other comparable counters, looks a likely scenario, in our view.
Figure 20: GPSC’s debt-to-equity profile versus its debt covenant
Sources: Company data, Bualuang Research estimates Figure 21: GPSC’s DSCR profile versus its debt covenant
Sources: Company data, Bualuang Research estimates
0.32 0.27 0.37 0.30 0.24 0.18
0.0x
0.5x
1.0x
1.5x
2.0x
2.5x
3.0x
2015E 2016E 2017E 2018E 2019E 2020E
Target D/E = 1.0x
D/E covenant = 2.75x
1.73 1.84 1.78 1.92 2.13
2.52
0.0x
0.5x
1.0x
1.5x
2.0x
2.5x
3.0x
2015E 2016E 2017E 2018E 2019E 2020E
DSCR covenant = 1.05x

GPSC - 20
Key risks
GPSC is a well-established player in the utilities industry, with well diversified assets in its portfolio. Its earnings profile could be regarded as vulnerable to the following risks: 1) changes in government policy with regard to the power industry, 2) an economic slowdown, 3) underperformance of its assets, 4) fluctuations in fuel prices 5) low levels of sunlight and rainfall; 6) project financing costs, 7) the Ft adjustment, set by the government, and 8) limited number of off-takers.
Government policy. The national power industry is regulated and there is a substantial amount of political influence over which entities are awarded new capacity and how big the allocation is. There is also the risk of government policy shifts (such as plans to restructure the tariff regime for new solar PPAs, SPP PPAs and delays imposed on pipeline projects).
The economy. Thailand’s power demand correlates closely with GDP growth. An economic slowdown or recession would prompt downgrades to load projections from the current PDP. That could mean lower generating capacity allocations, which would limit the scope for business growth. A slumping economic environment may also cause GPSC to lose some of its Industrial Users (IUs) as their demand falls, yet GPSC has also secured some PPAs with EGAT and PEA, ensuring the long-term security of its off-takers.
Underperformance of plants. The performance of power plants is mainly dependent on either plant efficiency or reliability. Conventional power plants are often vulnerable to unplanned downtime. Plants with lower-than-expected utilization rates or heat rates will also see their efficiency lowered. Less availability or operating hours for any of GPSC’s plants would inevitably result in less revenue for the firm.
Fluctuations in fuel prices. Although most GPSC plants operate on pass-through contracts, there are still some risks concerning fuel-price swings that operators will have to bear. It relies the heaviest regarding fuel-type on natural gas, which accounts for 84% of its cost of goods sold, hence any changes in gas price will significantly effect the firm’s bottom line.
Low solar radiation and rainfall. As TSR’s panels rely on sunlight to generate electricity, an unusually cloudy year would reduce radiation and hence generating capability. However, the vendor output guarantee sets a revenue floor for all of TSR’s solar farms. This is also a similar case with GPSC’s hydropower investments, whereby an unusually dry year may result in lower water levels and hence their generating capability. Again, the use of Energy Accounts will help even out the fluctuations between the years.
Project financing. Most of the outstanding debts of GPSC and its subsidiaries are referenced to the THBFIX and the six-month savings rate, which are floating interest rates. Any rise in prevailing interest rates would increase interest costs, squeezing profitability. The firm has indicated that should it see any large fluctuations, they will look to lock their rates with interest-rate swaps. We calculate that every 25 bps rise in the THBFIX would increase GPSC’s interest servicing cost by 2.2% and a 25 bps rise in the six-month savings rate would subsequently increase its interest cost by 5.4%.
Ft adjustments. GPSC’s power plants have PPAs referenced to the base tariff (Bt3.23/kWh) plus the Ft rate (currently Bt0.59/kWh). The Ft rate is adjusted to reflect mainly the cost of fuel stock for power generation, inflation and exchange rate changes. However, any changes in a particular fuel type may not be fully reflected in the adjustment of the Ft, as there are also other fuel types and components that make up the tariff. This will prove a risk to GPSC should gas prices rise significantly (as gas is a major fuel type for the firm). Our sensitivity analysis shows that a Bt0.10 decrease in the Ft would decrease the 2015 bottom line by Bt55m or 2.6%
Limited off-takers. GPSC’s major off-takers are PTT Group, EGAT and PEA. PTT Group is GPSC’s parent company, thus we believe it is unlikely that there will be any associated off-taker risk. In the case of EGAT and PEA, if they were private sector entities, GPSC would be exposed to the risks normally associated with having a very limited client base. But, as they are state-chartered enterprises, the risk is negligible. In addition to its main electricity supplier, EGAT, which has to date always honored its payment obligations, it has numerous SPP and VSPP suppliers. We therefore believe that single-client risk is inapplicable in this instance.

GPSC - 21
Figure 22: SWOT analysis
Strengths Opportunities
• GPSC has continuous capacity growth profile within the region, including 34% growth in power, 12% in steam (to and 100% growth in cold water operations over the next four years.
• The BOI granted generous tax holidays for all the firm’s projects.
• Well diversified asset types in portfolio.
• Large amounts of excess cash after IPO.
• Large client base when compared to other players in sector.
• Can leverage on PTT Group for internal opportunities in securing PTT Group companies’ power projects.
• The synergy and fine track record of GPSC and PTT Group make the former one of the strongest contenders in the growing renewables pool.
• With its strategic alliances, the firm should be able to build new capacity in Thailand and also enter foreign markets.
• At the forefront of the power innovation frontier, there is growth potential for GPSC in other power-related businesses, including the commercialization of its power storage development unit.
Weaknesses Threats
• The BOI for CHPP is about to expire, and power plants are unlikely to be awarded tax benefits under the new BOI scheme.
• Flat earnings profile between 2015 and 2016.
• Its current PPA adder tariffs for solar farms are not as attractive as the first generation of PPAs issued to earlier solar power applicants.
• Competition in the Thai power market is intensifying. As such, the return on future projects might not be as attractive as it has been to date.
• There are PPA structure concerns for projects outside Thailand, especially in the CLMV subregion, where power regulation is less developed.
• May not see scope for new IPP and SPP expansion any time soon as the PDP2015 will have reduced capacity, and thus IPP and SPP bidding will be limited.
• Future renewables PPAs will be subject to zoning and bidding, making the field much more competitive.
Source: Bualuang Research

GPSC - 22
Background
Global Power Synergy Company Limited (GPSC) was established in 2013 through the amalgamation of PTT Utility and IPT to create the power flagship company of the PTT Group, with initial registered capital of Bt8,630m. During 2013-2014, PTT Group transferred its utilities assets to GPSC and the company has increased its registered capital to Bt14,983m with paid-up capital now at Bt11,237m. GPSC now has three companies in its holdings and five further equity investments.
Figure 23: GPSC’s current group structure
Source: Company data
Figure 24: Shareholding structure, pre- versus post-IPO
Pre-IPO shareholding structure (as of March 2015) Post-IPO shareholding structure (as of March 2015)
PTT Global Chemicals
30%
PTT30%
Thai Oil Power28%
Thai Oil12%
PTT Global Chemicals
23%PTT22%
Thai Oil Power21%
Thai Oil9%
Management1%
Public24%
Source: Company data
SteamIndustrial Water
Electricity
Chilled Water
Constructing
Key:
1,340 t/hr2,080 cu.m/hr
1,039 MW
Combined cycle / Cogeneration Plants
Solar Farms Hydroelectric Other Businesses
12,000 RT5 MWCombined Heat and
Power Producing Co., Ltd
300 t/hr240 MW
Scheduled: 2017IRPC Clean Power
Co., Ltd
30 t/hr125 MW
Scheduled: 2016NavanakornElectricity Generating
Co., Ltd
1,400 MWRatchaburi Power
Co., Ltd
20 t/hr117 MW
20 t/hr117 MWBangpa-in
Cogeneration Co., Ltd
Scheduled: 2017
100%
51%
30%
25%
15%
80 MW
Thai Solar Renewable Co., Ltd
Siam Solar Energy 1 Co., Ltd
40%
100%
1,285 MW
Natee Synergy Co., Ltd
Xayaburi Power Co., Ltd
Scheduled: 2019
65 MW
Nam Lik 1 Power Co., Ltd
Scheduled: 2017
25%
100%
40%
100%
24M Technologies Inc.
Business Services Alliance Co., Ltd
Sport Services Alliance Co., Ltd
25%
17%

GPSC - 23
Utilities portfolio and pipeline of projects. GPSC currently has an operating equity capacity
of 1,315.25MW for its power business, 1,345 tons/hr of steam, 2,080 cu.m/hr capacity for industrial water and operating capacity of 6,000 RT of chilled water. For secured future projects, the firm has 536.40MW-worth of power, 167 tn/hr of steam and another 6,000 RT of chilled water in the pipeline. These projects are due for commission during 2015-2019.
Figure 25: Cumulative operating capacity for GPSC’s current and pipeline of projects
Sources: Company data
GPSC’s diversified portfolio. Apart from GPSC’s assets being a balanced mix in power, steam, chilled water and industrial water, its power assets are also well diversified. Among the firm’s current and pipeline power projects (1,851MW in total), 1,472MW are in cogeneration, 32MW are solar and 347MW, hydroelectric.
ASEAN presence. On top of varied assets, its projects are also geographically diversified. GPSC currently has projects in Thailand and Laos, with PPA exposure to both off-takers in the two countries.
Figure 26: GPSC’s project details
Sources: Company data, Bualuang Research estimates
1Q15 2015 2016 2017 2018 2019
Hydroelectric (MW) - - - 26 26 347 Solar Power (MW) 32 32 32 32 32 32 Conventional Electricity (MW) 1,283 1,306 1,344 1,472 1,472 1,472 Steam (tn/hr) 1,345 1,437 1,446 1,512 1,512 1,512 Chilled water (RT) 6,000 6,000 12,000 12,000 12,000 12,000 Industrial water (cu.m/hr) 2,080 2,080 2,080 2,080 2,080 2,080

GPSC - 24
Appendix 1: Glossary
Adder tariff A form of payment tariff paid to renewable energy producers. The additional “Adder” rate is paid on top of the base rate to the energy producer for a given amount supplied to The Grid.
Alternative energy development plan (AEDP)
A 10-year plan outlining the plan set for the alternative energy market.
Cubic meter (cu.m) The SI derived unit of volume. It is the volume of a cube with edges one meter in length.
Electricity Generating Authority of Thailand (EGAT)
State-owned enterprise that generates, acquires, transmits and sells bulk electricity through its subsidiaries and affiliates.
Energy Policy and Planning Office (EPPO)
The state office that bears responsibility for the development and recommendation of energy policies.
Energy Regulatory Commission (ERC)
Thailand’s energy industry regulator
Fixed feed in tariff (FiT) A form of payment tariff paid to renewable energy producers. The rate is fixed according to the PPA for a given amount supplied to The Grid
Gigawatt (GW) 1,000,000,000 watts (1,000MW).
Gigawatt hour (GWh) One gigawatt of power supplied or demanded for one hour.
Installed capacity The maximum power that could be produced continuously throughout a prolonged period of operation. All equipment is assumed to be fully operational.
Kilowatt (kW) 1,000 watts.
Kilowatt hour (kWh) One kilowatt of power supplied or demanded for one hour.
Megawatt (MW) 1,000,000 watts (1,000 kilowatts).
Megawatt hour (MWh) One megawatt of power supplied or demanded for one hour.
National Energy Policy Council (NEPC)
Council responsible for the granting and operation of energy licenses in Thailand
Power Purchase Agreement (PPA)
Contracts for the purchase of power between supplier and purchaser of electricity.
Refrigeration Ton (RT) Power rating for refrigerating equipment. One RT is approximately equal to the cooling power of one short ton (907 kilograms) of ice melting in a 24-hour period.
Substation Place storing equipment that switches and/or changes or regulates the voltage of electricity in a transmission and distribution system.
Watt The basic unit of active electrical power.
GPSC - 25
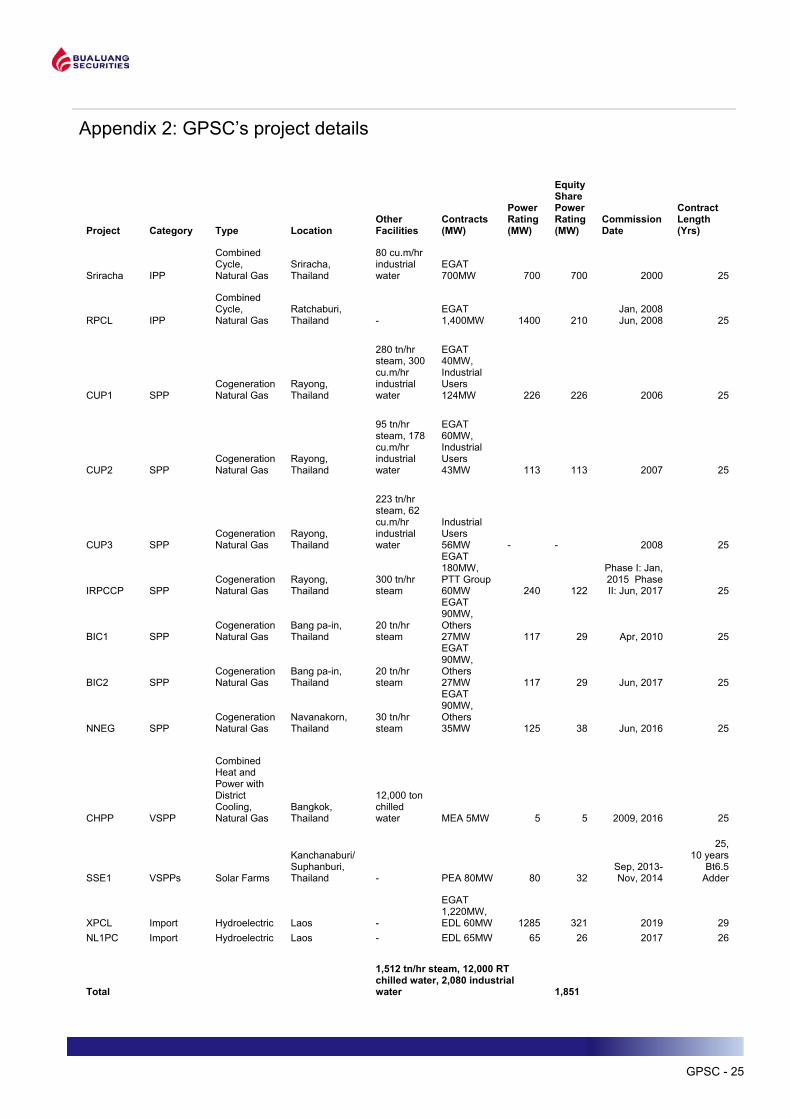
Appendix 2: GPSC’s project details
Project Category Type Location Other Facilities
Contracts (MW)
Power Rating (MW)
Equity Share Power Rating (MW)
Commission Date
Contract Length (Yrs)
Sriracha IPP
Combined Cycle, Natural Gas
Sriracha, Thailand
80 cu.m/hr industrial water
EGAT 700MW 700 700 2000 25
RPCL IPP
Combined Cycle, Natural Gas
Ratchaburi, Thailand -
EGAT 1,400MW 1400 210
Jan, 2008 Jun, 2008 25
CUP1 SPP Cogeneration Natural Gas
Rayong, Thailand
280 tn/hr steam, 300 cu.m/hr industrial water
EGAT 40MW, Industrial Users 124MW 226 226 2006 25
CUP2 SPP CogenerationNatural Gas
Rayong, Thailand
95 tn/hr steam, 178 cu.m/hr industrial water
EGAT 60MW, Industrial Users 43MW 113 113 2007 25
CUP3 SPP CogenerationNatural Gas
Rayong, Thailand
223 tn/hr steam, 62 cu.m/hr industrial water
Industrial Users 56MW - - 2008 25
IRPCCP SPP CogenerationNatural Gas
Rayong, Thailand
300 tn/hr steam
EGAT 180MW, PTT Group 60MW 240 122
Phase I: Jan, 2015 Phase II: Jun, 2017 25
BIC1 SPP Cogeneration Natural Gas
Bang pa-in, Thailand
20 tn/hr steam
EGAT 90MW, Others 27MW 117 29 Apr, 2010 25
BIC2 SPP Cogeneration Natural Gas
Bang pa-in, Thailand
20 tn/hr steam
EGAT 90MW, Others 27MW 117 29 Jun, 2017 25
NNEG SPP CogenerationNatural Gas
Navanakorn, Thailand
30 tn/hr steam
EGAT 90MW, Others 35MW 125 38 Jun, 2016 25
CHPP VSPP
Combined Heat and Power with District Cooling, Natural Gas
Bangkok, Thailand
12,000 ton chilled water MEA 5MW 5 5 2009, 2016 25
SSE1 VSPPs Solar Farms
Kanchanaburi/ Suphanburi, Thailand - PEA 80MW 80 32
Sep, 2013- Nov, 2014
25, 10 years
Bt6.5 Adder
XPCL Import Hydroelectric Laos -
EGAT 1,220MW, EDL 60MW 1285 321 2019 29
NL1PC Import Hydroelectric Laos - EDL 65MW 65 26 2017 26
Total
1,512 tn/hr steam, 12,000 RT chilled water, 2,080 industrial water
1,851
GPSC - 26
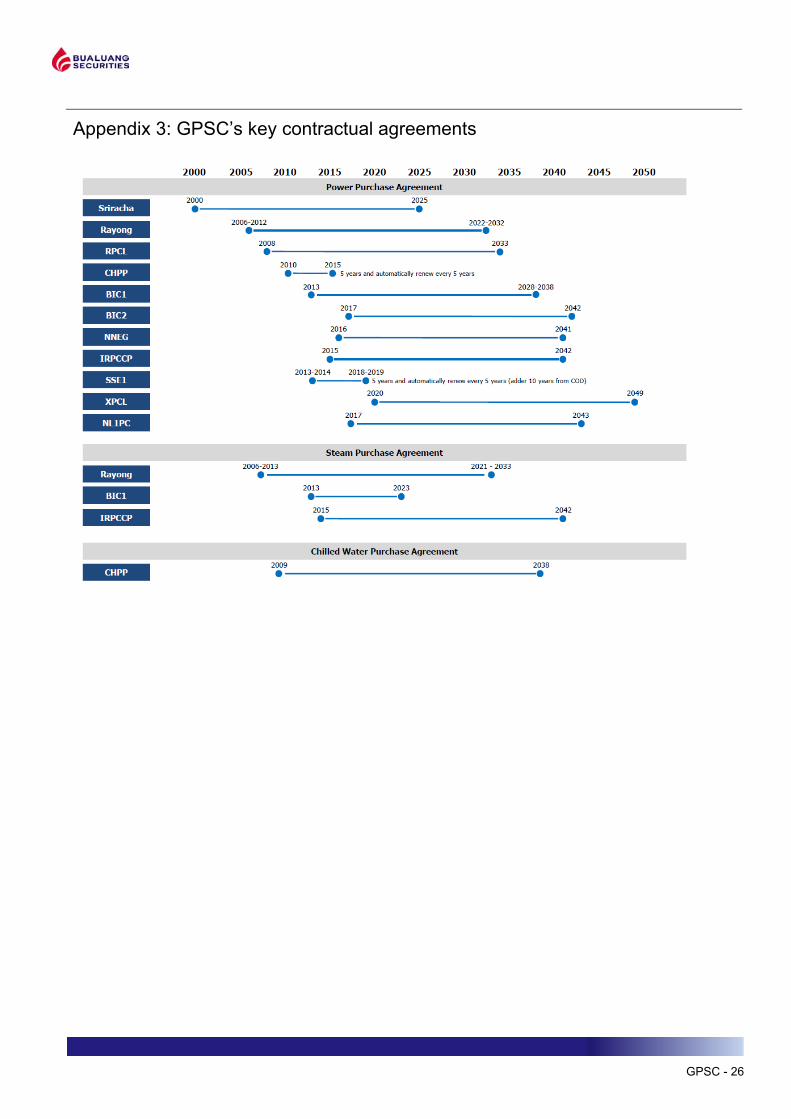
Appendix 3: GPSC’s key contractual agreements
GPSC - 27
Bualuang Securities Public Company Limited
BUALUANG SECURITIES PUBLIC COMPANY LIMITED (BLS) is a subsidiary of BANGKOK BANK PUBLIC COMPANY LIMITED (BBL). This document is produced based upon sources believed to be reliable but their accuracy, completeness or correctness is not guaranteed. The statements or expressions of opinion herein were arrived at after due and careful consideration to use as information for investment. Expressions of opinion contained herein are subject to change without notice. This document is not, and should not be construed as, an offer or the solicitation of an offer to buy or sell any securities. The use of any information shall be at the sole discretion and risk of the user.
BUALUANG SECURITIES PUBLIC COMPANY LIMITED MAY BE IN RELATIONSHIP WITH THE SECURITIES IN THIS REPORT. “Opinions, projections and other information contained in this report are based upon sources believed to be accurate including the draft prospectus, but no responsibility is accepted for any loss occasioned by reliance placed upon the contents hereof. Bualuang Securities Public Company Limited may from time to time perform investment, advisory or other services for companies mentioned in this report, as well as dealing (as principal or otherwise) in, or otherwise being interested in, any securities mentioned herein, This report does not constitute a solicitation to buy or sell any securities”. Investors should carefully read details in the prospectus before making investment decision.
BUALUANG SECURITIES PUBLIC COMPANY LIMITED MAY ACT AS MARKET MAKER AND ISSUER OF DWs, AND ISSUER OF STRUCTURED NOTES ON THESE SECURITIES. The company may prepare the research reports on those underlying securities. Investors should carefully read the details of the derivative warrants and structured notes in the prospectus before making investment decisions.
BUALUANG SECURITIES PUBLIC COMPANY LIMITED IS OR MAY BE AN UNDERWRITER/CO-UNDERWRITER/JOINT LEAD IN RESPECT OF THE INITIAL PUBLIC OFFERING (“IPO”) OF SECURITIES.
Financial Advisor Lead underwriter/
Underwriter/ Co-underwriter
PLAT
Score Range Score Range Description
90 – 100 Excellent 80 – 89 Very Good 70 – 79 Good 60 – 69 Satisfactory 50 – 59 Pass
Below 50 No logo given N/A
CORPORATE GOVERMANCE REPORT DISCLAIMER
This research report was prepared by Bualuang Securities Public Company Limited and refers to research prepared by Morgan Stanley. Morgan Stanley does not warrant or guarantee the accuracy or completeness of its research reports. Morgan Stanley reserves copyright and other proprietary rights in the material reproduced in this report. Morgan Stanley is under no obligation to inform Bualuang Securities or you if the views or information referred to or reproduced in this research report change.
Corporate Governance Report disclaimer
The disclosure of the survey result of the Thai Institute of Directors Association (“IOD”) regarding corporate governance is made pursuant to the policy of the Office of the Securities and Exchange Commission. The survey of the IOD is based on the information of a company listed on the Stock Exchange of Thailand and the Market for Alternative Investment disclosed to the public and able to be accessed by a general public investor. The result, therefore, is from the perspective of a third party. It is not an evaluation of operation and is not based on inside information. The survey result is as of the date appearing in the Corporate Governance Report of Thai Listed Companies. As a result, the survey result may be changed after that date. Bualuang Securities Public Company Limited does not conform nor certify the accuracy of such survey result. BUALUANG RESEARCH – RECOMMENDATION FRAMEWORK STOCK RECOMMENDATIONS BUY: Expected positive total returns of 15% or more over the next 12 months. HOLD: Expected total returns of between -15% and +15% over the next 12 months. SELL: Expected negative total returns of 15% or more over the next 12 months. TRADING BUY: Expected positive total returns of 15% or more over the next 3 months.
SECTOR RECOMMENDATIONS OVERWEIGHT: The industry, as defined by the analyst's coverage universe, is expected to outperform the relevant primary market index over the next 12 months. NEUTRAL: The industry, as defined by the analyst's coverage universe, is expected to perform in line with the relevant primary market index over the next 12 months. UNDERWEIGHT: The industry, as defined by the analyst's coverage universe, is expected to underperform the relevant primary market index over the next 12 months.
DISCLAIMER