Global Ma h1 Leag
39
GLOB A L FINA NCIAL A DVI SORY MERGERS & A CQUISITIONS RA NKINGS H1 2013
-
Upload
sohini-mo-banerjee -
Category
Documents
-
view
218 -
download
0
Transcript of Global Ma h1 Leag
7/29/2019 Global Ma h1 Leag
http://slidepdf.com/reader/full/global-ma-h1-leag 1/39
GLOBAL FINANCIAL ADVISORY MERGERS & ACQUISITIONS RANKINGS H1 2013

7/29/2019 Global Ma h1 Leag
http://slidepdf.com/reader/full/global-ma-h1-leag 2/39
MA <GO> LEAG <GO> MA <GO> LMX <GO> MA <GO> LEAG <GO> 1
Bloomberg Bloomberg 2013 1st Half
07/02/2013
Mergers & Acquisitions Financial Advisory Rankings The Bloomberg M&A Advisory League Tables are the definitive publication of M&A advisory rankings. The tables represent the top financial and legal advisors across a broad array of deal types, regions, and industry sectors.The rankings data is comprised of mergers, acquisitions, divestitures, spin-offs, debt-for-equity-swaps, joint ventures, private placements of common equity and convertible securities, and the cash injection component of recapitalizations according to Bloomberg standards.Bloomberg M&A delivers real-time coverage of the M&A market from nine countries around the world. We provide a global perspective and local insight into unique deal structures in various markets through a network of over 800 financial and legal advisory firms, ensuring an accurate reflection of key market trends. Our quarterly league table rankings are a leading benchmark for legal and financial advisory performance, and DealSpace & DealBrief newsletters provide summary highlights of weekly M&A activity and top deal trends.
Visit {NI LEAG CRL <GO>} to download copies of the final release and a full range of market specific league table results. Type MA <GO> 96 <GO> 42 <GO> to view live rankings.
For data submissions or queries, please contact: Contact Phone Fax Email
North America
EMEA
Asia Pacific LATAM
Mariana Trindade Inesa Smigola Devanshi Desai Fernando Simon
+1-212-617-3692
+44-20-3525-7149
+61-2-9777-8661
+55-11-3048-4619
+1-917-369-3965
+44-20-7942-1792
+61-2-9770-8561
+55-11-3048-4669
[email protected] [email protected] [email protected] [email protected]
General M&A queries may be submitted to: [email protected]
For 24 hour global customer support call +1 212 318 2000 +44 20 7330 7500 +65 6212 1000 +81 3 3201 8900 or press the HELP key twice on the BLOOMBERG PROFESSIONAL(R) service.
Table of Contents
1. Introduction
2. Global Market Commentary
3. Notable Highlights I
4. Notable Highlights II
5. Americas Notable Highlights
6. EMEA Notable Highlights
7. APAC Notable Highlights8. Global M&A Activity
9. M&A League Tables by Industry
10. Global Announced Deals
11. Cross Border Announced Deals
12. Global Private Equity Announced Deals
13. United States Announced Deals I
14. United States Announced Deals II
15. Canada Announced Deals I
16. Canada Announced Deals II
17. Latin America Announced Deals
18. Brazil Announced Deals
19. Europe Announced Deals I
20. Europe Announced Deals II21. United Kingdom Announced Deals
22. Germany Announced Deals
23. France Announced Deals
24. Italy Announced Deals
25. Benelux Announced Deals
26. Iberia Announced Deals
27. Nordic Announced Deals
28. Africa/Middle East Announced Deals
29. Eastern Europe Announced Deals
30. Asia Pacific Ex-Japan Announced Deals I
31. Asia Pacific Ex-Japan Announced Deals II
32. Australia & New Zealand Announced Deals
33. Japan Announced Deals
34. China Announced Deals
35. Hong Kong Announced Deals
36. India Announced Deals
37. South East Asia Announced Deals

7/29/2019 Global Ma h1 Leag
http://slidepdf.com/reader/full/global-ma-h1-leag 3/39
Global ReviewBloomberg
MA <GO> LEAG <GO> NI DEALSPACE <GO> MARB <GO>
Regional Deal Activity Firms in the US contributed 44% of the total volume, exceeding the aggregate volume from non-US firms by nearly a third. This was
attributable in part to the $16 billion mega-acquisition of Life Technologies Corp by Thermo Fischer Scientific, the largest deal of the
quarter.
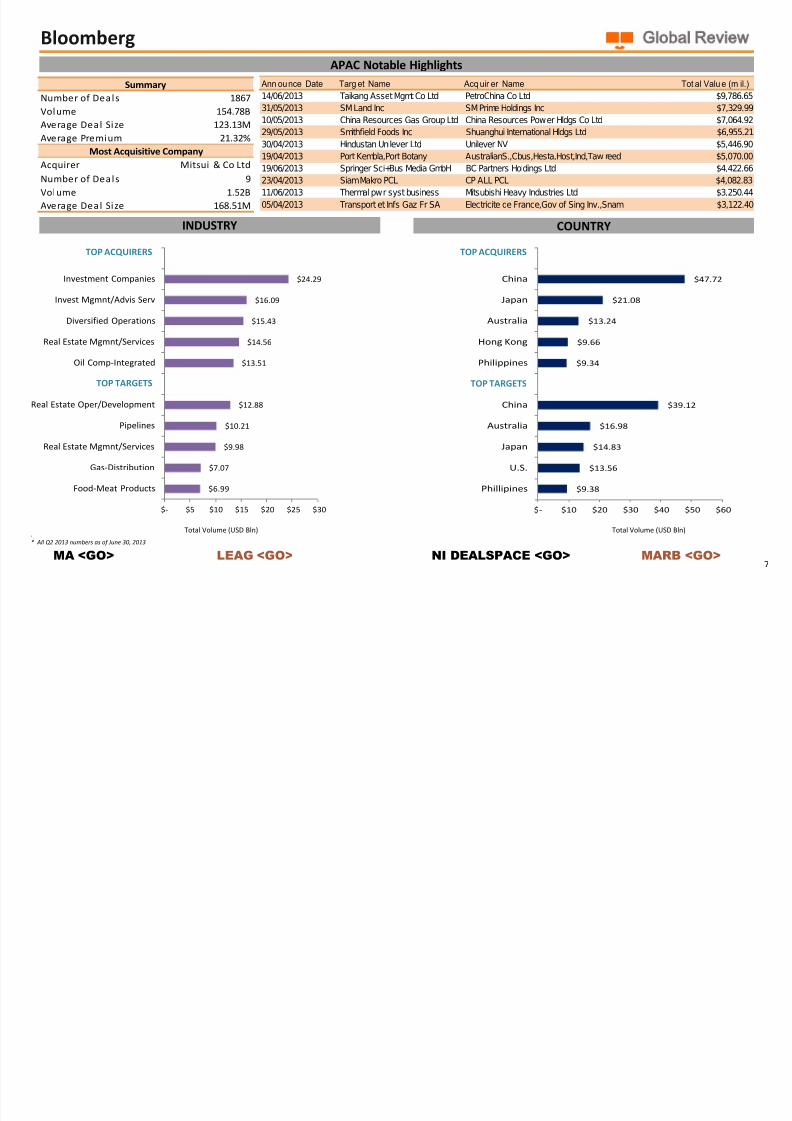
China was the second most active region in terms of deal-making with 275 deals collectively worth $47.72 billion. The late-quarter joint
venture announced by PetroChina Co Ltd for Taikang Asset Management Co Ltd was the region's largest deal worth nearly $10 billion.
UK firms spent close to $40 billion on 463 acquisitions, a 17% increase year-over-year in total value. In Asia, Japanese firms announced 468
worth $22.13 billion, representing a 49% drop from the same period last year.
Industry Sector Deal Activity Consumer Non-Cyclical was for the second quarter in a row the most targeted industry both in terms of deal value and deal count, with
1,245 deals totalling nearly $120 billion and constituting 24% of overall volume. This tops the highest deal volume in the first quarter— $96
billion in the Financial sector—by 15%. Biomendical companies were the most popular targets.
The average deal premium across industries for the quarter was 26%, with buyers paying the most in the Diversified and Consumer Cyclical
sectors (63% and 37% respectively).
In the Utilities industry, Berkshire Hathaway completed the third largest deal of the quarter with the purchase of NV Energy Inc. on May
29th. What would have been the largest, the $38 billion bid for Sprint Nextel by DISH Network Corp, was terminated on June 16th.
Top buyers were once again private equity (PE) and venture capital (VC) firms, even though strategic buyers out-bought financial buyers.
Kleiner Perkins Caufield was the busiest firm, with 18 deals totalling $363 million. The total number of PE deals fell by 20% compared to
the same period last year, with average premiums falling from 26% to 15%.
In the Investment Banking industry, announced deals declined approximately 25% in the second quarter, despite CEO confidence and cashlevels above the 4% long-term average (Bloomberg Industries).
Total Volume by Industry: Q2 2013
* All Q2 2013 numbers as of June 30, 2013.
2
Heat Map: Q2 2013 Volume by Region
Diversified
0%
Technology
4%
Utilities6%
Basi c Materials
4%
Consumer, Cyclical
10%
Energy
11%
Industrial
10%
Communications
9%
Financial
22%
Consume r Non-cyclical
24%
North America (39%) 39%
Asia Pacific (24%) 24%
Western Europe (19%) 19%
Latin America & Caribbean (11%) 11%
Eastern Europe (4%) 4%
Middle East & Africa (4%) 4%

7/29/2019 Global Ma h1 Leag
http://slidepdf.com/reader/full/global-ma-h1-leag 4/39
Global ReviewBloomberg
MA <GO> LEAG <GO> NI DEALSPACE <GO> MARB <GO>
Global M&A Quarterly Volume
Notable Highlights
Global M&A volume increased by 3% to $489 billion from last quarter but decreased by 10% from the same period last year. The trend in deal count is similarly negative,
falling from 6,727 deals in the second quarter of 2012 to 5,956 in June.
Deal making activity was highest in North America & Latin America, where 3,389 deals made up 56% of the total global volume. M&A deal activity in Asia Pacific also fell by
14% following a four-year low in the first quarter. In the EMEA region, deal volume fell to $186.4 billion, down 5% compared to the first quarter.
D e a l C o u n t
3
EMEA M&A Quarterly Volume
Americas M&A Quarterly Volume
APAC M&A Quarterly Volume
T o t a l V o l u m e ( U S D M l n )
*All Total Value figures in USD millions.
* All Q2 2013 numbers as of June 30, 2013
D e a l C o u n t
T o t a l V o l u m e ( U S D M l n )
D e a l C o u n t
T o t a l V o l u m e ( U S D M l n )
D e a l C o u n t
T o t a l V o l u m e ( U S D M l n )
0
100000
200000
300000
400000
500000
600000
0
500
1000
1500
2000
2500
3000
3500
4000
4500
2008
Q2
2009
Q2
2010
Q2
2011
Q2
2012
Q2
2013
Q2
Volume Deal Count
0
100000
200000
300000
400000
500000
600000
700000
800000
900000
0
1000
2000
3000
4000
5000
6000
7000
8000
9000
2008
Q2
2009
Q2
2010
Q2
2011
Q2
2012
Q2
2013
Q2
Volume Deal Count
0
50000
100000
150000
200000
250000
300000
350000
400000
450000
0
500
1000
1500
2000
2500
3000
3500
4000
2008
Q2
2009
Q2
2010
Q2
2011
Q2
2012
Q2
2013
Q2
Volume Deal Count
0
50000
100000
150000
200000
250000
0
500
1000
1500
2000
2500
3000
3500
2008
Q2
2009
Q2
2010
Q2
2011
Q2
2012
Q2
2013
Q2
Vol um e Deal Count

7/29/2019 Global Ma h1 Leag
http://slidepdf.com/reader/full/global-ma-h1-leag 5/39
Global ReviewBloomberg
MA <GO> LEAG <GO> NI DEALSPACE <GO> MARB <GO>
Notable Highlights
The majority of deal making occurred in the mid-market range (below $500 million), with only four mega-deals (over $10 billion) being brokered.
Cash continued to be the preferred payment method, used in 79% of transactions. Only 4% of buyers used a hybrid of cash & stock payment, representing a drop of
over 60% compared to the same period last year.
Announced premiums fell this quarter, with only 3% of deals producing a premium of between 50-75% compared to about 4% in the second quarter of last year.
4
Q2 2013 Global M&A Aggregate Statistics
Public Target Multiples # Deals Min - Max Median Deal Type Sum m ary # Deals Volum e Percent
Total Assets 427 .00 - 97.46 0.82 Company Takeover 2392 288.64B 58.96
Revenue 399 .00 - 1729.81 1.13 Cross Border 2070 212.1B 43.32
Stockholder Eqty 402 .00 - 795.70 1.85 Asset sale 1391 107.76B 22.01
Book Value 397 .00 - 208.12 1.89 Minority purchase 1438 45.35B 9.26
Market Cap 349 .00 - 85.03 1.27 Private Equity 1263 83.45B 17.04
Enterprise Value 328 .00 - 122.05 1.03 Additional Stake Purchase 766 46.31B 9.46
Net Income +Deprec 316 .00 - 930.67 12.48 Venture Capital 886 10.2B 2.08
EBIT 260 .00 - 1815.79 13.02 Majority purchase 402 33.65B 6.87
Net Income 282 .00 - 4409.63 18.92 J oint Venture 199 10.45B 2.13Cashflow fromOps. 231 .00 - 596.73 10.73 Private Placement 125 7.04B 1.44
EBITDA 240 .01 - 453.57 7.83 Tender Offer 87 51.58B 10.54
Income B/F XO 230 .01 - 2260.15 19.39 Leveraged Buyout 130 29.81B 6.09
Free Cashflow 168 .00 - 1941.81 24.81 Spin-off 41 4.4B 0.9
Paym ent Type Sum m ary # Deals Volum e Percent Prem ium s Paid # Deals Volum e Percent
Cash 3742 374.43B 79.1 0-10% 49 45.05B 16.83
Stock 253 53.19B 11.2 10.01-25% 54 72.89B 27.23
Cash & Stock 109 20.2B 4.3 25.01-50% 52 34.11B 12.74
Cash & Debt 20 4.73B 1.0 50.01-75% 19 8.75B 3.27
Cash or Stock 10 657.39M 0.1 >100% 13 443.96M 0.17Debt 15 545.52M 0.1
Undisclosed 1525 17.68B 3.7 Current Status # Deals Volum e Percent
Pending 2587 388.96B 73.03
Deal Size Breakdow n # Deals Volum e Percent Completed 3368 100.6B 18.89
0-500M 5776 143.3B 97.0 Terminated 15 43.06B 8.08
500.01-1000M 90 63.13B 1.5
1000.01-5000M 71 133.74B 1.2 Cur rent Prem ium # Deals Volum e Percent
5000.01-10,000M 14 99.58B 0.2 0-10% 5910 476.93B 97.42
>10,000M 4 49.82B 0.1 10.01-25% 18 6.74B 1.38

7/29/2019 Global Ma h1 Leag
http://slidepdf.com/reader/full/global-ma-h1-leag 6/39
Global ReviewBloomberg
MA <GO> LEAG <GO> NI DEALSPACE <GO> MARB <GO>
.
* All Q2 2013 numbers as of June 30, 2013
INDUSTRY
Americas Notable Highlights
5
COUNTRY
Total Volume (USD Bln) Total Volume (USD Bln)
TOP TARGETSTOP TARGETS
TOP ACQUIRERS TOP ACQUIRERS
Number of Deals 3389
Volume 275.87B
Average Deal Size 160.86M
Average Premium 26.65%
Acquirer Kleine r Perkins Caufield
Number of Deals 18
Volume 363.00M
Average Deal Size 20.17M
Summary
Most Acquisitive Company
Announce Date Target Name Acquirer Name Total Value (mil.)
15/04/2013 Life Technologies Corp Thermo Fisher Scientific Inc $15,901.0
29/05/2013 NV Energy Inc Berkshire Hathaway Inc $10,365.6
27/04/2013 RPI portfolio asset Credit Suisse Group,Lone Star Funds $8,722.7
27/05/2013 Bausch & Lomb Inc Valeant Pharmaceuticals Int $8,700.0
20/05/2013 Warner Chilcott PLC Actavis Inc $7,809.4
29/05/2013 Smithfield Foods Inc Shuanghui International $6,955.2
06/05/2013 BMC Software Inc Bain Capital,GIC,Golden Gate,Insight Venture $6,735.7
12/06/2013 Canada Safeway Ltd Empire Co Ltd $5,694.1
31/05/2013 Portfolio of US Residential MBS Goldman Sachs,Unnamed Buyer $5,007.4
24/06/2013 Vanguard Health Systems Inc Tenet Healthcare Corp $4,126.8
$9.67
$9.78
$10.45
$12.50
$17.83
$13.67
$14.69
$15.91
$23.08
$28.20
$- $5 $10 $15 $20 $25 $30
Oil Comp-Explor&Prodtn
Food-Meat Products
Electric-Integrated
Real Estate Oper/Development
Medical-Biomedical/Gene
Medical-Drugs
Diversified Financial Services
Instruments-Scientific
Investment Companies
Private Equity
$7.31
$8.85
$13.49
$14.45
$193.65
$11.75
$12.18
$13.75
$26.50
$194.75
$- $50 $100 $150 $200 $250
U.K.
Belgium
Brazil
Canada
U.S.
China
U.K.
Brazil
Canada
U.S.

7/29/2019 Global Ma h1 Leag
http://slidepdf.com/reader/full/global-ma-h1-leag 7/39
Global ReviewBloomberg
MA <GO> LEAG <GO> NI DEALSPACE <GO> MARB <GO>
INDUSTRY
EMEA Notable Highlights
6
COUNTRY
Total Volume (USD Bln) Total Volume (USD Bln)
TOP TARGETS
TOP ACQUIRERS TOP ACQUIRERS
.
* All Q2 2013 numbers as of June 30, 2013
TOP TARGETS
Number of Deals 2008
Volume 186.93B
Average Deal Size 196.57M
Average Premi um 31.51%
Acquirer Index Ventures
Number of Deals 11
Volume 330.39M
Average Deal Size 30.04M
Summary
Most Acquisitive Company
$7.50
$9.32
$9.55
$10.08
$13.48
$13.53
$14.80
$17.07
$20.73
$23.29
$- $5 $10 $15 $20 $25
Metal Processors&Fabrica
Commer Banks Non-US
Investment Companies
Coffee
Cable/Satellite TV
Cellular Telecom
Diversified Financial S ervices
Diversified Operations
Investment Companies
Private Equity
$11.31
$16.80
$18.01
$20.40
$26.02
$11.64
$13.89
$16.14
$34.35
$39.89
$- $10 $20 $30 $40 $50
France
U.K.
Netherlands
U.S.
Germany
Austria
U.A.E.
Switzerland
U.S.
U.K.
Announce Date Target Name Acquirer Name Total Value (mil.)
24/06/2013 Kabel Deutschland Holding AG Vodafone Group PLC $13,480.9
12/04/2013 DE Master Blenders 1753 NV J oh A Benckiser SE $10,075.5
27/04/2013 RPI portfolio asset Credit Suisse,Lone Star Funds $8,722.7
11/06/2013 Eurobank Ergasias SA Hellenic Financial Stability Fund $7,753.0
03/06/2013 Dubai AluminiumCo Ltd Emirates AluminiumCo Ltd $7,500.0
30/04/2013 Hindustan Unilever Ltd Unilever NV $5,446.9
19/04/2013 Port Kembla,Port Botany AustralianS.,Cbus,Hesta,Host,Ind,Tawreed $5,070.0
31/05/2013 Portfolio of US Residential MBS Goldman Sachs,Unnamed Buyer $5,007.4
19/06/2013 Springer Science+Business BC Partners Holdings Ltd $4,422.7
23/04/2013 SiamMakro PCL CP ALL PCL $4,082.8
7/29/2019 Global Ma h1 Leag
http://slidepdf.com/reader/full/global-ma-h1-leag 8/39
Global ReviewBloomberg
MA <GO> LEAG <GO> NI DEALSPACE <GO> MARB <GO>
.
* All Q2 2013 numbers as of June 30, 2013
TOP ACQUIRERS
INDUSTRY
APAC Notable Highlights
7
COUNTRY
Total Volume (USD Bln) Total Volume (USD Bln)
TOP TARGETS
TOP ACQUIRERS
TOP TARGETS
Number of Deals 1867
Volume 154.78B
Average Deal Size 123.13M
Average Premium 21.32%
Acquirer Mitsui & Co Ltd
Number of Deals 9
Volume 1.52B
Average Deal Size 168.51M
Summary
Most Acquisitive Company
$6.99
$7.07
$9.98
$10.21
$12.88
$13.51
$14.56
$15.43
$16.09
$24.29
$- $5 $10 $15 $20 $25 $30
Food-Meat Products
Gas-Distribution
Real Estate Mgmnt/Services
Pipelines
Real Estate Oper/Development
Oil Comp-Integrated
Real Estate Mgmnt/Services
Diversified Operations
Invest Mgmnt/Advis Serv
Investment Companies
Ann ounce Date Targ et Name Acq uir er Name Tot al Valu e (m il.)
14/06/2013 Taikang Asset Mgmt Co Ltd PetroChina Co Ltd $9,786.65
31/05/2013 SM Land Inc SM Prime Holdings Inc $7,329.99
10/05/2013 China Resources Gas Group Ltd China Resources Power Hldgs Co Ltd $7,064.92
29/05/2013 Smithfield Foods Inc Shuanghui International Hldgs Ltd $6,955.21
30/04/2013 Hindustan Unilever Ltd Unilever NV $5,446.90
19/04/2013 Port Kembla,Port Botany AustralianS.,Cbus,Hesta,Host,Ind,Taw reed $5,070.00
19/06/2013 Springer Sci+Bus Media GmbH BC Partners Holdings Ltd $4,422.66
23/04/2013 SiamMakro PCL CP ALL PCL $4,082.83
11/06/2013 Thermal pwr syst business Mitsubishi Heavy Industries Ltd $3,250.44
05/04/2013 Transport et Infs Gaz Fr SA Electricite de France,Gov of Sing Inv.,Snam $3,122.40
$9.38
$13.56
$14.83
$16.98
$39.12
$9.34
$9.66
$13.24
$21.08
$47.72
$- $10 $20 $30 $40 $50 $60
Phillipines
U.S.
Japan
Australia
China
Philippines
Hong Kong
Australia
Japan
China
7/29/2019 Global Ma h1 Leag
http://slidepdf.com/reader/full/global-ma-h1-leag 9/39
MA <GO> LEAG <GO> MA <GO> LMX <GO> MA <GO> LEAG <GO> 8
Bloomberg
1/1/13 - 6/30/13 2013 2012
VOLUME CHANGE
FIRM VOLUME DEAL USD (Mln) COUNT
VOLUME DEAL USD (Mln) COUNT
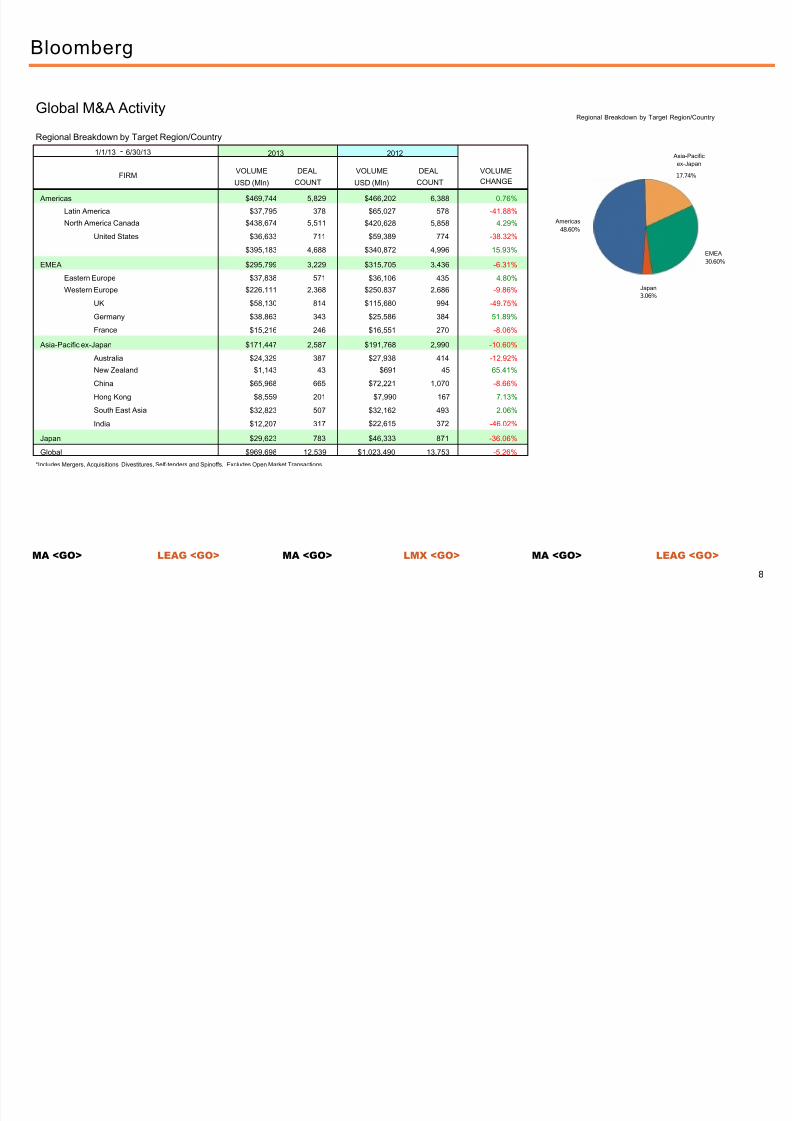
Americas $469,744 5,829 $466,202 6,388 0.76%
Latin America
North America Canada United States
$37,795 378
$438,674 5,511
$36,633 711
$395,183 4,688
$65,027 578
$420,628 5,858
$59,389 774
$340,872 4,996
-41.88%
4.29%
-38.32%
15.93%
EMEA $295,799 3,229 $315,705 3,436 -6.31%
Eastern Europe
Western Europe UK Germany France
$37,838 571
$226,111 2,368
$58,130 814
$38,863 343
$15,216 246
$36,106 435
$250,837 2,686
$115,680 994
$25,586 384
$16,551 270
4.80%
-9.86%
-49.75%
51.89%
-8.06%
Asia-Pacific ex-Japan $171,447 2,587 $191,768 2,990 -10.60%
Australia
New Zealand
China
Hong Kong South East Asia India
$24,329 387
$1,143 43
$65,968 665
$8,559 201
$32,823 507
$12,207 317
$27,938 414
$691 45
$72,221 1,070
$7,990 167
$32,162 493
$22,615 372
-12.92%
65.41%
-8.66%
7.13%
2.06%
-46.02%
Japan $29,623 783 $46,333 871 -36.06%
Global $969,698 12,539 $1,023,490 13,753 -5.26%
Global M&A Activity Regional Breakdown by Target Region/Country
Regional Breakdown by Target Region/Country
Americas
48.60%
Japan
3.06%
Asia-Pacific ex-Japan
17.74%
EMEA
30.60%
*Includes Mergers, Acquisitions, Divestitures, Self-tenders and Spinoffs. Excludes Open Market Transactions.

7/29/2019 Global Ma h1 Leag
http://slidepdf.com/reader/full/global-ma-h1-leag 10/39
MA <GO> LEAG <GO> MA <GO> LMX <GO> MA <GO> LEAG <GO> 9
Bloomberg
01/01/13 - 06/30/13 2013
FIRM RANK MKT VOLUME DEAL
SHARE USD (Mln) COUNT
Goldman Sachs & Co 1 10.5 11,160 20
Lazard Ltd
2
7.7
8,183
8
Barclays Capital Group 3 7.2 7,688 8
Rothschild 4 6.9 7,366 19
Bank of America Merrill Lynch 5 6.6 7,078 9
Morgan Stanley 6 6.6 7,065 17
Siam Commercial Bank PCL 7 6.0 6,418 2
Credit Suisse Group AG 8 5.1 5,481 12
Deutsche Bank AG 9 4.4 4,679 9
HSBC Bank PLC 10 4.2 4,461 3
TOTAL $106,755 1,701
M&A League Tables by Industry
Global Announced Deals - Consumer, Non-cyclical Global Announced Deals - Financial
01/01/13 - 06/30/13 2013 01/01/13 - 06/30/13 2013
FIRM RANK MKT VOLUME DEAL
SHARE USD (Mln) COUNTFIRM
RANK MKT VOLUME DEAL SHARE USD (Mln) COUNT
JP Morgan 1 39.7 80,268 23 Goldman Sachs & Co 1 13.8 27,834 32
Bank of America Merrill Lynch 2 30.8 62,285 18 JP Morgan 2 13.1 26,394 18
Goldman Sachs & Co 3 25.1 50,712 24 Morgan Stanley 3 9.3 18,788 23
Lazard Ltd 4 24.2 48,926 14 Bank of America Merrill Lynch 4 7.8 15,801 19
Morgan Stanley 5 22.7 45,799 34 Credit Suisse Group AG 5 6.5 13,099 12
Moelis & Co 6 22.1 44,613 8 Barclays Capital Group 6 6.5 13,098 18
Centerview Partners LLC 7 15.8 32,006 4 Leonardo & Co 7 6.2 12,523 8
Deutsche Bank
AG
8
15.5
31,329
11
BNP
Paribas
SA
8
5.5
11,132
7
Barclays Capital Group 9 15.4 31,047 20 Macquarie Group Ltd 9 5.0 10,111 11
Wells Fargo & Co 10 13.6 27,403 3 Societe Generale SA 10 4.6 9,343 5
TOTAL $202,127 2,576 TOTAL $201,435 1,803
Global Announced Deals - Communications Global Announced Deals - Consumer, Cyclical
01/01/13 - 06/30/13 2013
FIRM RANK MKT VOLUME DEAL
SHARE USD (Mln) COUNT
Goldman Sachs & Co 1 55.7 60,746 16
JP Morgan 2
44.3
48,248
10
Morgan Stanley 3 31.2 33,989 12
Credit Suisse Group AG 4 26.3 28,643 10
Bank of America Merrill Lynch 5 24.0 26,135 11
LionTree Advisors LLC 6 19.2 20,974 3
UBS AG 7 17.0 18,499 5
CBRE Capital Advisors Inc 8 15.3 16,700 1
Centerview Partners LLC 8 15.3 16,700 1
Perella Weinberg Partners LP 10 13.1 14,329 2
TOTAL $109,023 1,555

7/29/2019 Global Ma h1 Leag
http://slidepdf.com/reader/full/global-ma-h1-leag 11/39
MA <GO> LEAG <GO> MA <GO> LMX <GO> MA <GO> LEAG <GO> 10
Bloomberg
1/1/13 - 6/30/13 2013 2012 MKT SHARE CHANGE
FIRM RANK MKT VOLUME DEAL
SHARE USD (Mln) COUNT
RANK MKT SHARE
Goldman Sachs & Co 1 21.1 204,467 130 1 24.3 (3.2)
JP Morgan 2 20.0 194,049 89 3 20.2 (0.2)
Morgan Stanley 3 16.5 159,476 125 2 23.5 (7.0)
Bank of America Merrill Lynch 4 15.0 145,332 76 8 13.2 1.8
Barclays Capital Group 5 11.1 107,190 76 5 19.2 (8.1)
Credit Suisse Group AG 6 10.9 105,296 75 6 16.1 (5.2)
Lazard Ltd 7 9.5 91,820 87 11 7.8 1.7
Citigroup Inc 8 9.1 88,675 84 7 15.2 (6.1)
Deutsche Bank AG 9 8.9 86,638 67 4 19.6 (10.7)
UBS AG 10 6.2 60,172 73 13 6.0 0.2
Moelis & Co 11 5.4 52,616 33 24 2.0 3.4
Centerview Partners LLC 12 5.0 48,706 5 16 3.1 1.9
Evercore Partners Inc 13 4.1 39,458 49 17 3.1 1.0
Rothschild 14 3.9 38,196 86 10 9.2 (5.3)
LionTree Advisors LLC 15 3.9 38,027 6 142 0.1 3.8
Wells Fargo & Co 16 3.9 37,300 24 31 1.5 2.4
RBC Capital Markets 17 3.7 35,730 62 14 4.9 (1.2)
HSBC Bank PLC 18 3.5 33,655 29 15 4.1 (0.6)
Leonardo & Co 19 3.1 29,837 22 421 0.0 3.1
BNP Paribas SA 20 2.7 26,239 43 12 6.6 (3.9)
TOTAL $969,698 12,539 $1,023,490
M&A Financial Advisory League Tables
Global Announced Deals
Ranked by Volume
*Includes Mergers, Acquisitions, Divestitures, Self-tenders and Spinoffs. Excludes Open Market Transactions.
*Total Volume represents all announced transactions in US$ millions.

7/29/2019 Global Ma h1 Leag
http://slidepdf.com/reader/full/global-ma-h1-leag 12/39
MA <GO> LEAG <GO> MA <GO> LMX <GO> MA <GO> LEAG <GO> 11
Bloomberg
1/1/13 - 6/30/13 2013 2012 MKT SHARE CHANGE
FIRM RANK MKT VOLUME DEAL
SHARE USD (Mln) COUNT
RANK MKT SHARE
Goldman Sachs & Co 1 26.6 105,948 71 3 27.8 (1.2)
Morgan Stanley 2 21.9 87,395 66 1 31.5 (9.6)
JP Morgan 3 15.7 62,453 40 4 25.2 (9.5)
Citigroup Inc 4 12.2 48,733 46 9 14.8 (2.6)
Credit Suisse Group AG 5 12.2 48,626 39 6 19.8 (7.6)
Bank of America Merrill Lynch 6 9.9 39,418 39 7 17.7 (7.8)
Barclays Capital Group 7 9.7 38,528 40 5 24.5 (14.8)
UBS AG 8 9.3 37,190 42 13 8.8 0.5
Lazard Ltd 9 7.8 31,088 41 11 13.4 (5.6)
Deutsche Bank AG 10 6.8 26,934 39 2 30.9 (24.1)
Leonardo & Co 11 6.3 25,111 16 239 0.0 6.3
HSBC Bank PLC 12 6.2 24,634 22 14 7.6 (1.4)
Cooperatieve Centrale Raiffeisen-Boerenleenbank 13 5.4 21,587 6 50 0.8 4.6
BNP Paribas SA 14 5.0 19,831 34 12 12.4 (7.4)
Rothschild 15 4.9 19,611 53 10 14.0 (9.1)
LionTree Advisors LLC 16 4.8 19,100 2 - - 4.8
Societe Generale SA 17 4.6 18,259 17 20 2.5 2.1
Perella Weinberg Partners LP 18 3.6 14,415 2 44 1.1 2.5
Bank of Nova Scotia 19 2.9 11,366 10 26 1.9 1.0
Allen & Co Inc 20 2.6 10,488 1 33 1.7 0.9
TOTAL $398,894 4,266 $498,811
M&A Financial Advisory League Tables
Cross Border Announced Deals
Ranked by Volume
*Includes Mergers, Acquisitions, Divestitures, Self-tenders and Spinoffs. Excludes Open Market Transactions.
*Total Volume represents all announced transactions in US$ millions.

7/29/2019 Global Ma h1 Leag
http://slidepdf.com/reader/full/global-ma-h1-leag 13/39
MA <GO> LEAG <GO> MA <GO> LMX <GO> MA <GO> LEAG <GO> 12
Bloomberg
1/1/13 - 6/30/13 2013 2012 MKT SHARE CHANGE
FIRM RANK MKT VOLUME DEAL
SHARE USD (Mln) COUNT
RANK MKT SHARE
JP Morgan 1 33.9 61,697 21 3 20.5 13.4
Bank of America Merrill Lynch 2 31.9 57,917 14 8 10.3 21.6
Goldman Sachs & Co 3 28.1 51,155 30 1 26.9 1.2
Credit Suisse Group AG 4 23.7 43,117 22 7 11.3 12.4
Lazard Ltd 5 21.0 38,158 27 18 4.0 17.0
Barclays Capital Group 6 16.4 29,773 17 2 23.4 (7.0)
Wells Fargo & Co 7 16.2 29,389 7 29 1.1 15.1
Moelis & Co 8 16.0 29,115 6 20 3.0 13.0
Deutsche Bank AG 9 15.1 27,491 22 5 18.3 (3.2)
Centerview Partners LLC 10 15.1 27,403 1 12 5.4 9.7
RBC Capital Markets 11 14.3 25,983 11 9 9.3 5.0
Morgan Stanley 12 13.2 23,970 27 4 19.8 (6.6)
Citigroup Inc 13 12.2 22,265 21 6 11.7 0.5
Evercore Partners Inc 14 9.0 16,289 7 10 6.7 2.3
LionTree Advisors LLC 14 9.0 16,289 2 65 0.3 8.7
BNP Paribas SA 16 7.4 13,368 11 26 1.7 5.7
UBS AG 17
6.5
11,730
17 13
4.6 1.9
Societe Generale SA 18 5.9 10,679 5 32 0.9 5.0
Leonardo & Co 19 5.3 9,708 7 - - 5.3
Nomura Holdings Inc 20 4.3 7,880 10 16 4.3 -
TOTAL $181,852 2,605 $229,599
M&A Financial Advisory League Tables
Global Private Equity Announced Deals
Ranked by Volume
*Includes Mergers, Acquisitions, Divestitures, Self-tenders and Spinoffs. Excludes Open Market Transactions.
*Total Volume represents all announced transactions in US$ millions.

7/29/2019 Global Ma h1 Leag
http://slidepdf.com/reader/full/global-ma-h1-leag 14/39
MA <GO> LEAG <GO> MA <GO> LMX <GO> MA <GO> LEAG <GO> 13
Bloomberg
1/1/13 - 6/30/13 2013 2012 MKT SHARE CHANGE
FIRM RANK MKT VOLUME DEAL
SHARE USD (Mln) COUNT
RANK MKT SHARE
JP Morgan 1 28.7 142,151 53 3 17.8 10.9
Bank of America Merrill Lynch 2 25.4 125,654 54 8 11.4 14.0
Goldman Sachs & Co 3 24.8 123,058 76 1 25.1 (0.3)
Credit Suisse Group AG 4 16.0 79,468 45 7 14.4 1.6
Barclays Capital Group 5 15.2 75,431 47 5 16.3 (1.1)
Morgan Stanley 6 15.0 74,565 69 2 18.7 (3.7)
Deutsche Bank AG 7 13.3 66,021 45 4 17.4 (4.1)
Lazard Ltd 8 12.8 63,559 56 12 5.4 7.4
Moelis & Co 9 10.3 50,932 24 15 3.8 6.5
Centerview Partners LLC 10 9.8 48,706 5 9 7.1 2.7
Citigroup Inc 11 9.7 47,823 51 6 14.9 (5.2)
LionTree Advisors LLC 12 7.7 38,027 6 75 0.1 7.6
Wells Fargo & Co 13 7.5 37,300 24 17 3.3 4.2
Evercore Partners Inc 14 6.9 34,167 37 10 6.6 0.3
RBC Capital Markets 15 6.2 30,741 37 13 4.8 1.4
Greenhill & Co Inc 16 3.5 17,573 6 24 1.9 1.6
CBRE Capital
Advisors
Inc 17
3.4
16,728
4 -
- 3.4
UBS AG 18 3.2 16,074 36 11 6.3 (3.1)
BNP Paribas SA 19 3.2 15,676 16 28 1.3 1.9
Bank of Nova Scotia 20 2.1 10,408 8 91 0.1 2.0
TOTAL $495,714 5,979 $452,376
M&A Financial Advisory League Tables
United States Announced Deals
Any Involvement
*Includes Mergers, Acquisitions, Divestitures, Self-tenders and Spinoffs. Excludes Open Market Transactions.
*Total Volume represents all announced transactions in US$ millions.
7/29/2019 Global Ma h1 Leag
http://slidepdf.com/reader/full/global-ma-h1-leag 15/39
MA <GO> LEAG <GO> MA <GO> LMX <GO> MA <GO> LEAG <GO> 14
Bloomberg
1/1/13 - 6/30/13 2013 2012 MKT SHARE CHANGE
FIRM RANK MKT VOLUME DEAL
SHARE USD (Mln) COUNT
RANK MKT SHARE
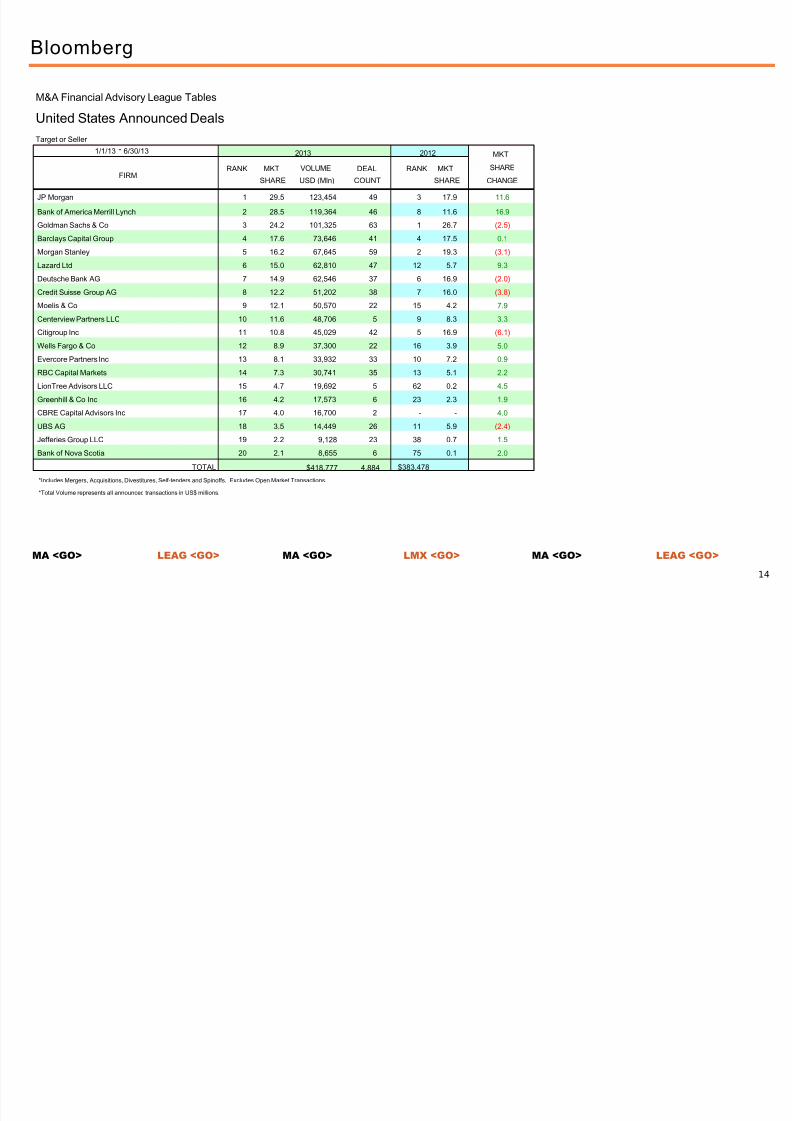
JP Morgan 1 29.5 123,454 49 3 17.9 11.6
Bank of America Merrill Lynch 2 28.5 119,364 46 8 11.6 16.9
Goldman Sachs & Co 3 24.2 101,325 63 1 26.7 (2.5)
Barclays Capital Group 4 17.6 73,646 41 4 17.5 0.1
Morgan Stanley 5 16.2 67,645 59 2 19.3 (3.1)
Lazard Ltd 6 15.0 62,810 47 12 5.7 9.3
Deutsche Bank AG 7 14.9 62,546 37 6 16.9 (2.0)
Credit Suisse Group AG 8 12.2 51,202 38 7 16.0 (3.8)
Moelis & Co 9 12.1 50,570 22 15 4.2 7.9
Centerview Partners LLC 10 11.6 48,706 5 9 8.3 3.3
Citigroup Inc 11 10.8 45,029 42 5 16.9 (6.1)
Wells Fargo & Co 12 8.9 37,300 22 16 3.9 5.0
Evercore Partners Inc 13 8.1 33,932 33 10 7.2 0.9
RBC Capital Markets 14 7.3 30,741 35 13 5.1 2.2
LionTree Advisors LLC 15 4.7 19,692 5 62 0.2 4.5
Greenhill & Co Inc 16 4.2 17,573 6 23 2.3 1.9
CBRE Capital
Advisors
Inc 17
4.0
16,700
2 -
- 4.0
UBS AG 18 3.5 14,449 26 11 5.9 (2.4)
Jefferies Group LLC 19 2.2 9,128 23 38 0.7 1.5
Bank of Nova Scotia 20 2.1 8,655 6 75 0.1 2.0
TOTAL $418,777 4,884 $383,478
M&A Financial Advisory League Tables
United States Announced Deals
Target or Seller
*Includes Mergers, Acquisitions, Divestitures, Self-tenders and Spinoffs. Excludes Open Market Transactions.
*Total Volume represents all announced transactions in US$ millions.

7/29/2019 Global Ma h1 Leag
http://slidepdf.com/reader/full/global-ma-h1-leag 16/39
MA <GO> LEAG <GO> MA <GO> LMX <GO> MA <GO> LEAG <GO> 15
Bloomberg
1/1/13 - 6/30/13 2013 2012 MKT SHARE CHANGE
FIRM RANK MKT VOLUME DEAL
SHARE USD (Mln) COUNT
RANK MKT SHARE
Morgan Stanley 1 19.9 14,666 11 10 8.4 11.5
Goldman Sachs & Co 2 17.2 12,726 8 6 16.7 0.5
Bank of Nova Scotia 3 16.3 12,036 11 5 19.7 (3.4)
CIBC 4 15.1 11,167 17 8 15.0 0.1
BMO Capital Markets Corp 5 10.6 7,855 24 4 20.9 (10.3)
TD Securities Inc 6 9.8 7,241 16 3 22.4 (12.6)
Canaccord Genuity Corp 7 9.6 7,054 15 9 8.8 0.8
Bank of America Merrill Lynch 8 8.1 5,993 11 2 25.4 (17.3)
RBC Capital Markets 9 7.4 5,437 28 1 32.3 (24.9)
Evercore Partners Inc 10 5.6 4,112 2 25 1.6 4.0
Barclays Capital Group 11 5.5 4,043 6 12 8.1 (2.6)
Deutsche Bank AG 12 4.9 3,634 4 14 5.6 (0.7)
GMP Securities LP 13 3.6 2,665 9 18 4.3 (0.7)
Citigroup Inc 14 3.4 2,515 5 43 0.3 3.1
Rothschild 15 3.3 2,402 6 11 8.2 (4.9)
KPMG Corporate Finance LLC 16 2.9 2,168 3 70 0.0 2.9
JP Morgan 17 2.3 1,695 6 17 4.5 (2.2)
Houlihan Lokey 18 2.1 1,543 4 53 0.1 2.0
Macquarie Group Ltd 19 2.1 1,533 7 13 7.2 (5.1)
HSBC Bank PLC 20 2.0 1,479 3 20 3.7 (1.7)
TOTAL $73,854 1,100 $96,956
M&A Financial Advisory League Tables
Canada Announced Deals
Any Involvement
*Includes Mergers, Acquisitions, Divestitures, Self-tenders and Spinoffs. Excludes Open Market Transactions.
*Total Volume represents all announced transactions in US$ millions.

7/29/2019 Global Ma h1 Leag
http://slidepdf.com/reader/full/global-ma-h1-leag 17/39
MA <GO> LEAG <GO> MA <GO> LMX <GO> MA <GO> LEAG <GO> 16
Bloomberg
1/1/13 - 6/30/13 2013 2012 MKT SHARE CHANGE
FIRM RANK MKT VOLUME DEAL
SHARE USD (Mln) COUNT
RANK MKT SHARE
CIBC 1 25.2 11,167 17 6 16.3 8.9
Canaccord Genuity Corp 2 15.8 7,000 13 7 12.8 3.0
TD Securities Inc 3 14.9 6,616 13 2 27.8 (12.9)
BMO Capital Markets Corp 4 13.5 5,990 21 3 26.7 (13.2)
Morgan Stanley 5 11.8 5,226 4 10 5.8 6.0
Bank of Nova Scotia 6 11.5 5,081 7 4 23.4 (11.9)
RBC Capital Markets 7 11.0 4,874 24 1 34.0 (23.0)
Evercore Partners Inc 8 9.3 4,112 2 16 2.2 7.1
GMP Securities LP 9 6.0 2,665 9 9 6.1 (0.1)
Goldman Sachs & Co 10 5.4 2,385 3 13 3.2 2.2
Barclays Capital Group 11 4.1 1,819 4 12 5.1 (1.0)
Houlihan Lokey 12 3.5 1,543 4 - - 3.5
Citigroup Inc 13 3.0 1,350 2 32 0.5 2.5
Rothschild 14 2.7 1,200 3 26 0.5 2.2
HSBC Bank PLC 15 2.2 979 2 45 0.1 2.1
Bank of America Merrill Lynch 16 2.0 881 4 5 23.0 (21.0)
Jefferies Group LLC 17 1.4 618 5 40 0.2 1.2
National Bank of Canada Financial Inc 18 1.0 423 5 8 12.2 (11.2)
JP Morgan 19 0.9 390 3 21 1.0 (0.1)
Macquarie Group Ltd 20 0.9 383 5 15 2.5 (1.6)
TOTAL $44,349 804 $66,545
M&A Financial Advisory League Tables
Canada Announced Deals
Target or Seller
*Includes Mergers, Acquisitions, Divestitures, Self-tenders and Spinoffs. Excludes Open Market Transactions.
*Total Volume represents all announced transactions in US$ millions.
7/29/2019 Global Ma h1 Leag
http://slidepdf.com/reader/full/global-ma-h1-leag 18/39
MA <GO> LEAG <GO> MA <GO> LMX <GO> MA <GO> LEAG <GO> 17
Bloomberg
1/1/13 - 6/30/13 2013 2012 MKT SHARE CHANGE
FIRM RANK MKT VOLUME DEAL
SHARE USD (Mln) COUNT
RANK MKT SHARE
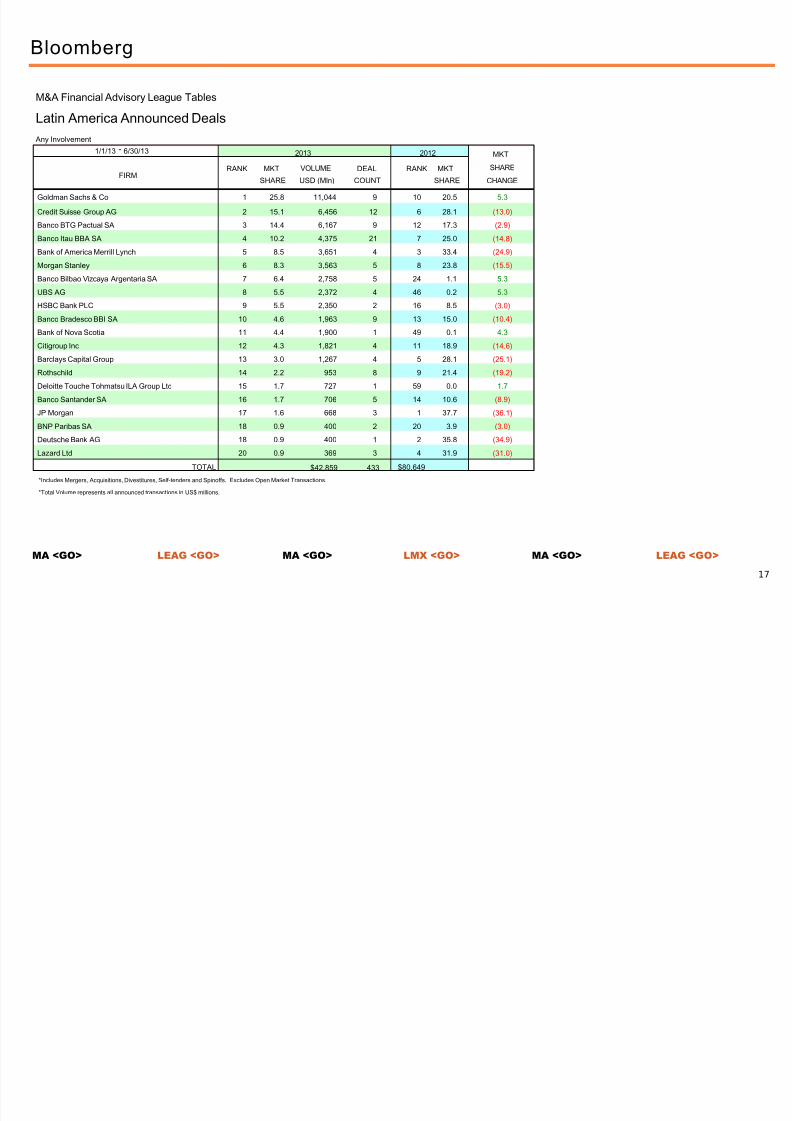
Goldman Sachs & Co 1 25.8 11,044 9 10 20.5 5.3
Credit Suisse Group AG 2 15.1 6,456 12 6 28.1 (13.0)
Banco BTG Pactual SA 3 14.4 6,167 9 12 17.3 (2.9)
Banco Itau BBA SA 4 10.2 4,375 21 7 25.0 (14.8)
Bank of America Merrill Lynch 5 8.5 3,651 4 3 33.4 (24.9)
Morgan Stanley 6 8.3 3,563 5 8 23.8 (15.5)
Banco Bilbao Vizcaya Argentaria SA 7 6.4 2,758 5 24 1.1 5.3
UBS AG 8 5.5 2,372 4 46 0.2 5.3
HSBC Bank PLC 9 5.5 2,350 2 16 8.5 (3.0)
Banco Bradesco BBI SA 10 4.6 1,963 9 13 15.0 (10.4)
Bank of Nova Scotia 11 4.4 1,900 1 49 0.1 4.3
Citigroup Inc 12 4.3 1,821 4 11 18.9 (14.6)
Barclays Capital Group 13 3.0 1,267 4 5 28.1 (25.1)
Rothschild 14 2.2 953 8 9 21.4 (19.2)
Deloitte Touche Tohmatsu ILA Group Ltd 15 1.7 727 1 59 0.0 1.7
Banco Santander SA 16 1.7 706 5 14 10.6 (8.9)
JP Morgan
17
1.6
668
3
1
37.7
(36.1)
BNP Paribas SA 18 0.9 400 2 20 3.9 (3.0)
Deutsche Bank AG 18 0.9 400 1 2 35.8 (34.9)
Lazard Ltd 20 0.9 369 3 4 31.9 (31.0)
TOTAL $42,859 433 $80,649
M&A Financial Advisory League Tables
Latin America Announced Deals
Any Involvement
*Includes Mergers, Acquisitions, Divestitures, Self-tenders and Spinoffs. Excludes Open Market Transactions.
*Total Volume represents all announced transactions in US$ millions.
7/29/2019 Global Ma h1 Leag
http://slidepdf.com/reader/full/global-ma-h1-leag 19/39
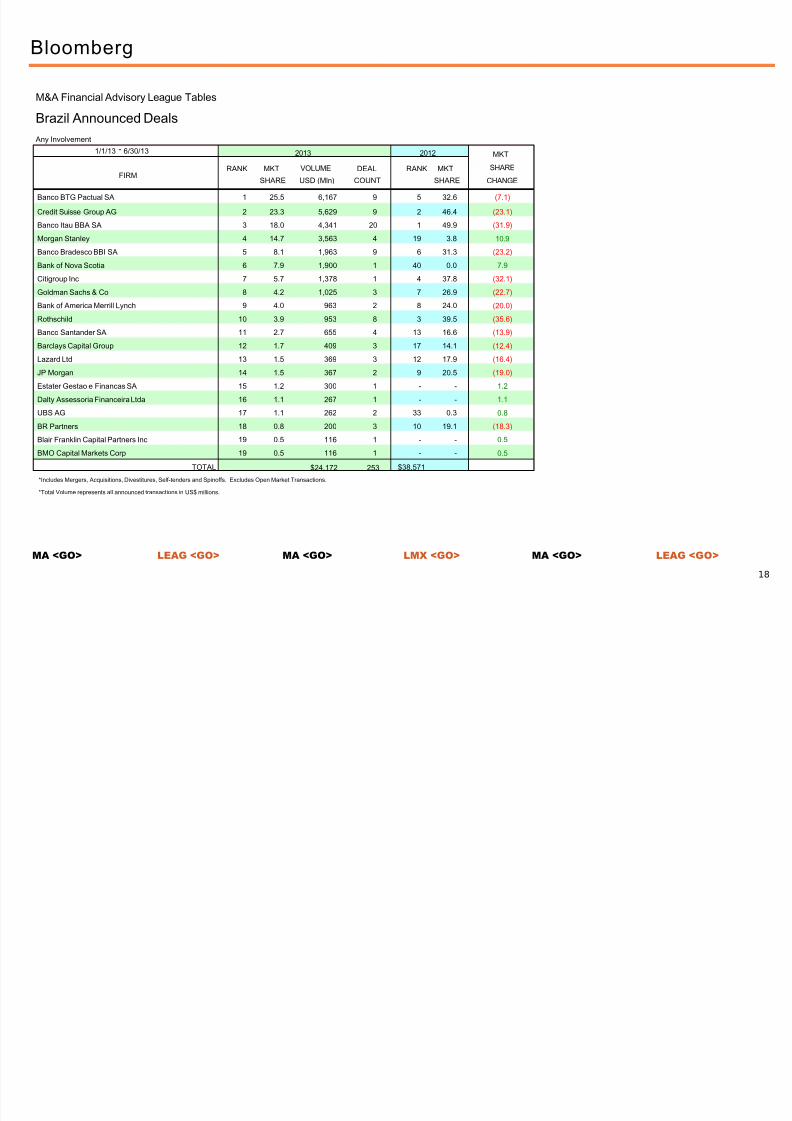
MA <GO> LEAG <GO> MA <GO> LMX <GO> MA <GO> LEAG <GO> 18
Bloomberg
1/1/13 - 6/30/13 2013 2012 MKT SHARE CHANGE
FIRM RANK MKT VOLUME DEAL
SHARE USD (Mln) COUNT
RANK MKT SHARE
Banco BTG Pactual SA 1 25.5 6,167 9 5 32.6 (7.1)
Credit Suisse Group AG 2 23.3 5,629 9 2 46.4 (23.1)
Banco Itau BBA SA 3 18.0 4,341 20 1 49.9 (31.9)
Morgan Stanley 4 14.7 3,563 4 19 3.8 10.9
Banco Bradesco BBI SA 5 8.1 1,963 9 6 31.3 (23.2)
Bank of Nova Scotia 6 7.9 1,900 1 40 0.0 7.9
Citigroup Inc 7 5.7 1,378 1 4 37.8 (32.1)
Goldman Sachs & Co 8 4.2 1,025 3 7 26.9 (22.7)
Bank of America Merrill Lynch 9 4.0 963 2 8 24.0 (20.0)
Rothschild 10 3.9 953 8 3 39.5 (35.6)
Banco Santander SA 11 2.7 655 4 13 16.6 (13.9)
Barclays Capital Group 12 1.7 409 3 17 14.1 (12.4)
Lazard Ltd 13 1.5 369 3 12 17.9 (16.4)
JP Morgan 14 1.5 367 2 9 20.5 (19.0)
Estater Gestao e Financas SA 15 1.2 300 1 - - 1.2
Dalty Assessoria Financeira Ltda 16 1.1 267 1 - - 1.1
UBS AG 17 1.1 262 2 33 0.3 0.8
BR Partners 18 0.8 200 3 10 19.1 (18.3)
Blair Franklin Capital Partners Inc 19 0.5 116 1 - - 0.5
BMO Capital Markets Corp 19 0.5 116 1 - - 0.5
TOTAL $24,172 253 $38,571
M&A Financial Advisory League Tables
Brazil Announced Deals
Any Involvement
*Includes Mergers, Acquisitions, Divestitures, Self-tenders and Spinoffs. Excludes Open Market Transactions.
*Total Volume represents all announced transactions in US$ millions.

7/29/2019 Global Ma h1 Leag
http://slidepdf.com/reader/full/global-ma-h1-leag 20/39
MA <GO> LEAG <GO> MA <GO> LMX <GO> MA <GO> LEAG <GO> 19
Bloomberg
1/1/13 - 6/30/13 2013 2012 MKT SHARE CHANGE
FIRM RANK MKT VOLUME DEAL
SHARE USD (Mln) COUNT
RANK MKT SHARE
Goldman Sachs & Co 1 25.9 93,052 52 4 30.2 (4.3)
Morgan Stanley 2 18.8 67,504 45 2 32.5 (13.7)
JP Morgan 3 17.2 61,719 34 5 25.7 (8.5)
Credit Suisse Group AG 4 12.7 45,565 28 8 17.3 (4.6)
Citigroup Inc 5 12.1 43,611 35 10 15.4 (3.3)
Lazard Ltd 6 10.0 35,784 40 9 15.8 (5.8)
Barclays Capital Group 7 9.5 34,084 34 3 31.2 (21.7)
UBS AG 8 9.3 33,240 34 14 6.7 2.6
Rothschild 9 8.7 31,242 67 6 18.4 (9.7)
Leonardo & Co 10 8.3 29,837 22 194 0.0 8.3
Deutsche Bank AG 11 7.9 28,489 31 1 35.0 (27.1)
Bank of America Merrill Lynch 12 7.3 26,156 21 7 17.4 (10.1)
BNP Paribas SA 13 7.1 25,503 40 12 15.1 (8.0)
Cooperatieve Centrale Raiffeisen-Boerenleenbank 14 6.4 22,939 8 46 0.9 5.5
HSBC Bank PLC 15 6.1 21,907 18 13 6.8 (0.7)
LionTree Advisors LLC 16 5.3 19,100 2 78 0.1 5.2
Societe Generale SA 17 5.2 18,673 24 18 3.7 1.5
Perella Weinberg Partners LP 18 4.3 15,263 3 37 1.2 3.1
VTB Capital ZAO 19 3.0 10,735 8 56 0.5 2.5
Allen & Co Inc 20 2.9 10,488 1 194 0.0 2.9
TOTAL $359,507 3,869 $420,647
M&A Financial Advisory League Tables
Europe Announced Deals
Any Involvement
*Includes Mergers, Acquisitions, Divestitures, Self-tenders and Spinoffs. Excludes Open Market Transactions.
*Total Volume represents all announced transactions in US$ millions.
7/29/2019 Global Ma h1 Leag
http://slidepdf.com/reader/full/global-ma-h1-leag 21/39
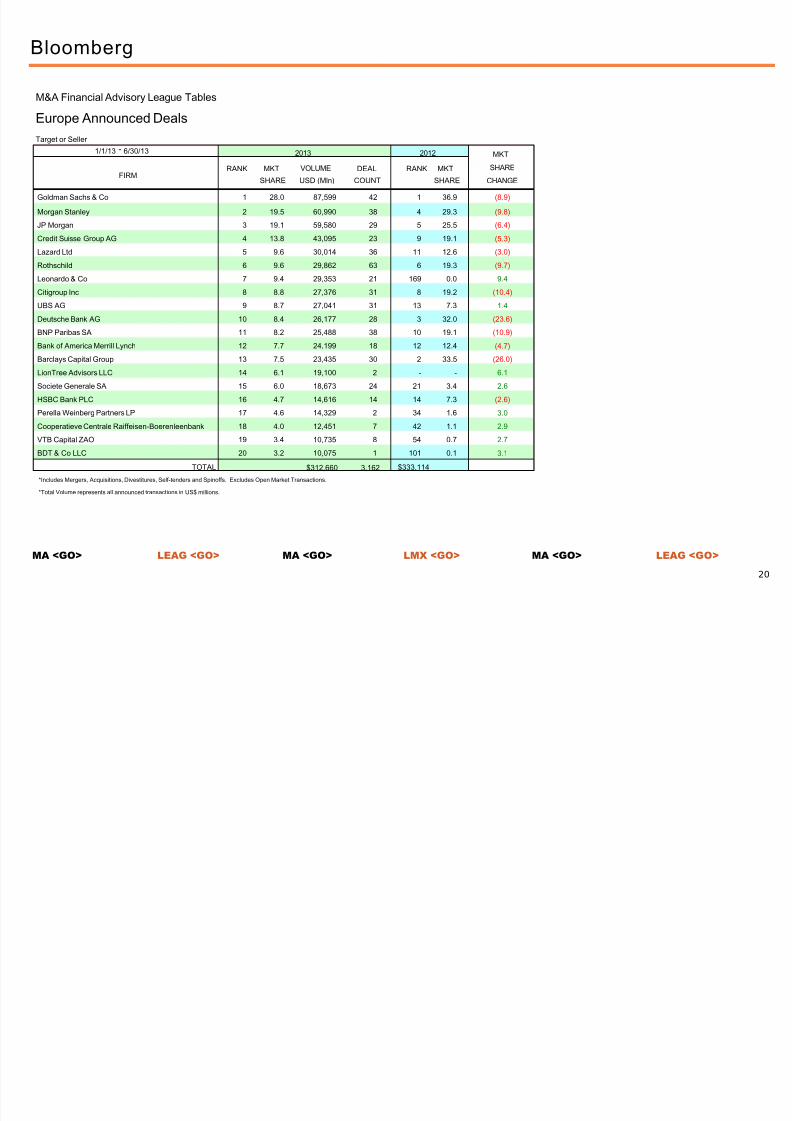
MA <GO> LEAG <GO> MA <GO> LMX <GO> MA <GO> LEAG <GO> 20
Bloomberg
1/1/13 - 6/30/13 2013 2012 MKT SHARE CHANGE
FIRM RANK MKT VOLUME DEAL
SHARE USD (Mln) COUNT
RANK MKT SHARE
Goldman Sachs & Co 1 28.0 87,599 42 1 36.9 (8.9)
Morgan Stanley 2 19.5 60,990 38 4 29.3 (9.8)
JP Morgan 3 19.1 59,580 29 5 25.5 (6.4)
Credit Suisse Group AG 4 13.8 43,095 23 9 19.1 (5.3)
Lazard Ltd 5 9.6 30,014 36 11 12.6 (3.0)
Rothschild 6 9.6 29,862 63 6 19.3 (9.7)
Leonardo & Co 7 9.4 29,353 21 169 0.0 9.4
Citigroup Inc 8 8.8 27,376 31 8 19.2 (10.4)
UBS AG 9 8.7 27,041 31 13 7.3 1.4
Deutsche Bank AG 10 8.4 26,177 28 3 32.0 (23.6)
BNP Paribas SA 11 8.2 25,488 38 10 19.1 (10.9)
Bank of America Merrill Lynch 12 7.7 24,199 18 12 12.4 (4.7)
Barclays Capital Group 13 7.5 23,435 30 2 33.5 (26.0)
LionTree Advisors LLC 14 6.1 19,100 2 - - 6.1
Societe Generale SA 15 6.0 18,673 24 21 3.4 2.6
HSBC Bank PLC 16 4.7 14,616 14 14 7.3 (2.6)
Perella Weinberg Partners LP 17 4.6 14,329 2 34 1.6 3.0
Cooperatieve Centrale Raiffeisen-Boerenleenbank 18 4.0 12,451 7 42 1.1 2.9
VTB Capital ZAO 19 3.4 10,735 8 54 0.7 2.7
BDT & Co LLC 20 3.2 10,075 1 101 0.1 3.1
TOTAL $312,660 3,162 $333,114
M&A Financial Advisory League Tables
Europe Announced Deals
Target or Seller
*Includes Mergers, Acquisitions, Divestitures, Self-tenders and Spinoffs. Excludes Open Market Transactions.
*Total Volume represents all announced transactions in US$ millions.

7/29/2019 Global Ma h1 Leag
http://slidepdf.com/reader/full/global-ma-h1-leag 22/39
MA <GO> LEAG <GO> MA <GO> LMX <GO> MA <GO> LEAG <GO> 21
Bloomberg
1/1/13 - 6/30/13 2013 2012 MKT SHARE CHANGE
FIRM RANK MKT VOLUME DEAL
SHARE USD (Mln) COUNT
RANK MKT SHARE
Goldman Sachs & Co 1 38.0 44,514 20 2 42.4 (4.4)
JP Morgan 2 27.9 32,644 16 5 31.4 (3.5)
Credit Suisse Group AG 3 23.8 27,878 10 8 26.2 (2.4)
UBS AG 4 19.4 22,701 12 13 8.1 11.3
Morgan Stanley 5 18.3 21,388 18 3 39.3 (21.0)
LionTree Advisors LLC 6 15.7 18,336 1 48 0.3 15.4
Perella Weinberg Partners LP 7 12.3 14,415 2 44 0.5 11.8
Deutsche Bank AG 8 7.3 8,496 8 4 36.1 (28.8)
Lazard Ltd 9 6.0 7,047 10 11 13.7 (7.7)
HSBC Bank PLC 10 5.6 6,611 9 16 6.1 (0.5)
VTB Capital ZAO 11 5.0 5,844 3 45 0.4 4.6
Nomura Holdings Inc 12 4.8 5,642 7 7 29.0 (24.2)
Rothschild 13 4.6 5,360 28 10 17.6 (13.0)
Jefferies Group LLC 14 4.5 5,250 6 71 0.1 4.4
Societe Generale SA 15 4.0 4,731 5 43 0.5 3.5
Renaissance Capital Group Inc 16 3.1 3,616 2 72 0.1 3.0
Bank of America Merrill Lynch 17 3.0 3,489 6 12 8.9 (5.9)
Barclays Capital Group 18 2.8 3,285 9 1 45.4 (42.6)
ING Groep NV 19 2.2 2,596 4 117 0.0 2.2
PricewaterhouseCoopers LLP 20 2.1 2,488 30 60 0.2 1.9
TOTAL $117,178 1,355 $190,837
M&A Financial Advisory League Tables
United Kingdom Announced Deals
Any Involvement
*Includes Mergers, Acquisitions, Divestitures, Self-tenders and Spinoffs. Excludes Open Market Transactions.
*Total Volume represents all announced transactions in US$ millions.

7/29/2019 Global Ma h1 Leag
http://slidepdf.com/reader/full/global-ma-h1-leag 23/39
MA <GO> LEAG <GO> MA <GO> LMX <GO> MA <GO> LEAG <GO> 22
Bloomberg
1/1/13 - 6/30/13 2013 2012 MKT SHARE CHANGE
FIRM RANK MKT VOLUME DEAL
SHARE USD (Mln) COUNT
RANK MKT SHARE
Goldman Sachs & Co 1 35.6 19,593 5 3 22.8 12.8
UBS AG 2 32.7 17,981 4 15 4.4 28.3
Morgan Stanley 3 30.9 17,010 5 2 29.2 1.7
Perella Weinberg Partners LP 4 24.5 13,481 1 12 8.4 16.1
Deutsche Bank AG 5 16.4 9,047 7 1 34.7 (18.3)
Citigroup Inc 6 14.9 8,176 6 11 8.5 6.4
JP Morgan 7 14.4 7,919 7 4 22.4 (8.0)
Credit Suisse Group AG 8 11.3 6,241 6 10 9.0 2.3
Nomura Holdings Inc 9 8.0 4,423 3 19 1.6 6.4
Jefferies Group LLC 9 8.0 4,423 1 - - 8.0
Rothschild 11 6.8 3,714 7 5 19.6 (12.8)
Bank of America Merrill Lynch 12 5.7 3,136 5 7 12.1 (6.4)
Lazard Ltd 13 5.7 3,132 6 8 11.7 (6.0)
Barclays Capital Group 14 4.9 2,709 3 16 3.9 1.0
KPMG Corporate Finance LLC 15 4.7 2,576 13 31 0.9 3.8
HSBC Bank PLC 16 2.7 1,505 3 14 5.4 (2.7)
BNP Paribas SA 17 2.0 1,120 5 17 3.5 (1.5)
Banco Itau BBA SA 18 1.3 737 2 23 1.1 0.2
Banco Bradesco BBI SA 19 1.3 703 1 23 1.1 0.2
Banco BTG Pactual SA 19 1.3 703 1 18 1.9 (0.6)
TOTAL $55,054 587 $42,027
M&A Financial Advisory League Tables
Germany Announced Deals
Any Involvement
*Includes Mergers, Acquisitions, Divestitures, Self-tenders and Spinoffs. Excludes Open Market Transactions.
*Total Volume represents all announced transactions in US$ millions.
7/29/2019 Global Ma h1 Leag
http://slidepdf.com/reader/full/global-ma-h1-leag 24/39
MA <GO> LEAG <GO> MA <GO> LMX <GO> MA <GO> LEAG <GO> 23
Bloomberg
1/1/13 - 6/30/13 2013 2012 MKT SHARE CHANGE
FIRM RANK MKT VOLUME DEAL
SHARE USD (Mln) COUNT
RANK MKT SHARE
Morgan Stanley 1 28.3 9,805 8 2 29.5 (1.2)
Citigroup Inc 2 16.9 5,861 3 16 4.0 12.9
JP Morgan 3 14.9 5,161 3 9 16.9 (2.0)
Barclays Capital Group 4 14.8 5,124 6 7 19.1 (4.3)
BNP Paribas SA 5 13.3 4,617 22 3 28.0 (14.7)
Deutsche Bank AG 6 12.8 4,439 5 12 11.9 0.9
Credit Agricole Corporate & Investment Bank SA 7 11.7 4,045 8 14 4.7 7.0 Goldman Sachs & Co 8 11.1 3,838 7 11 16.4 (5.3)
HSBC Bank PLC 9 10.6 3,660 3 5 19.8 (9.2)
Natixis 10 10.3 3,576 3 26 0.5 9.8
Lazard Ltd 11 10.3 3,558 8 1 43.1 (32.8)
Societe Generale SA 12 8.7 3,032 14 8 17.4 (8.7)
Rothschild 13 7.2 2,502 18 4 25.1 (17.9)
Bank of America Merrill Lynch 14 7.1 2,458 2 15 4.1 3.0
UBS AG 15 3.6 1,250 4 50 0.0 3.6
Macquarie Group Ltd 16 2.2 764 2 17 3.2 (1.0)
LionTree Advisors LLC 16 2.2 764 1 - - 2.2
Nomura Holdings Inc 16 2.2 764 1 6 19.8 (17.6)
Citigroup Global Markets Inc 19 2.2 757 1 - - 2.2
Mediobanca SpA 19 2.2 757 1 49 0.0 2.2
TOTAL $34,689 482 $60,821
M&A Financial Advisory League Tables
France Announced Deals
Any Involvement
*Includes Mergers, Acquisitions, Divestitures, Self-tenders and Spinoffs. Excludes Open Market Transactions.
*Total Volume represents all announced transactions in US$ millions.
7/29/2019 Global Ma h1 Leag
http://slidepdf.com/reader/full/global-ma-h1-leag 25/39
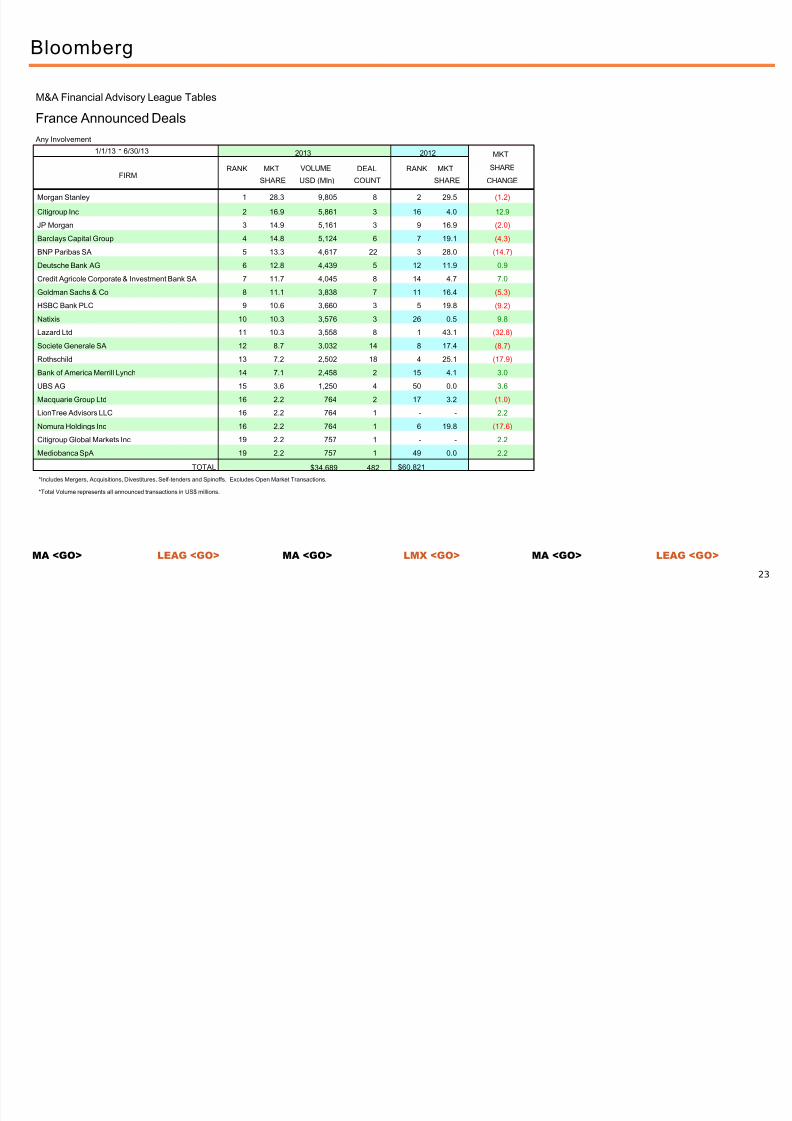
MA <GO> LEAG <GO> MA <GO> LMX <GO> MA <GO> LEAG <GO> 24
Bloomberg
1/1/13 - 6/30/13 2013 2012 MKT SHARE CHANGE
FIRM RANK MKT VOLUME DEAL
SHARE USD (Mln) COUNT
RANK MKT SHARE
Goldman Sachs & Co 1 32.5 9,895 4 1 38.2 (5.7)
Deutsche Bank AG 2 31.2 9,498 5 12 5.8 25.4
Intesa Sanpaolo SpA 3 29.3 8,921 14 15 2.7 26.6
Barclays Capital Group 4 26.9 8,193 4 21 1.4 25.5
Lazard Ltd 5 24.7 7,512 9 5 16.0 8.7
Leonardo & Co 6 22.6 6,874 4 - - 22.6
Rothschild 7 22.5 6,841 8 2 36.2 (13.7) BNP Paribas SA 8 22.1 6,719 10 20 1.9 20.2
Morgan Stanley 9 18.9 5,764 2 3 35.0 (16.1)
Credit Suisse Group AG 10 18.4 5,610 3 10 6.6 11.8
JP Morgan 11 15.6 4,751 3 8 7.5 8.1
Mediobanca SpA 12 15.5 4,716 2 4 26.5 (11.0)
HSBC Bank PLC 13 15.1 4,611 3 13 4.6 10.5
UniCredit SpA 14 15.1 4,597 6 - - 15.1
Royal Bank of Scotland PLC 15 13.0 3,959 1 - - 13.0
Nomura Holdings Inc 16 7.9 2,390 3 14 3.6 4.3
Natixis 17 6.9 2,109 1 - - 6.9
UniCredit SpA 18 2.5 771 2 - - 2.5
Citigroup Global Markets Inc 19 2.5 757 1 - - 2.5
UBS AG 20 1.3 399 2 28 0.3 1.0
TOTAL $30,459 169 $18,243
M&A Financial Advisory League Tables
Italy Announced Deals
Any Involvement
*Includes Mergers, Acquisitions, Divestitures, Self-tenders and Spinoffs. Excludes Open Market Transactions.
*Total Volume represents all announced transactions in US$ millions.

7/29/2019 Global Ma h1 Leag
http://slidepdf.com/reader/full/global-ma-h1-leag 26/39
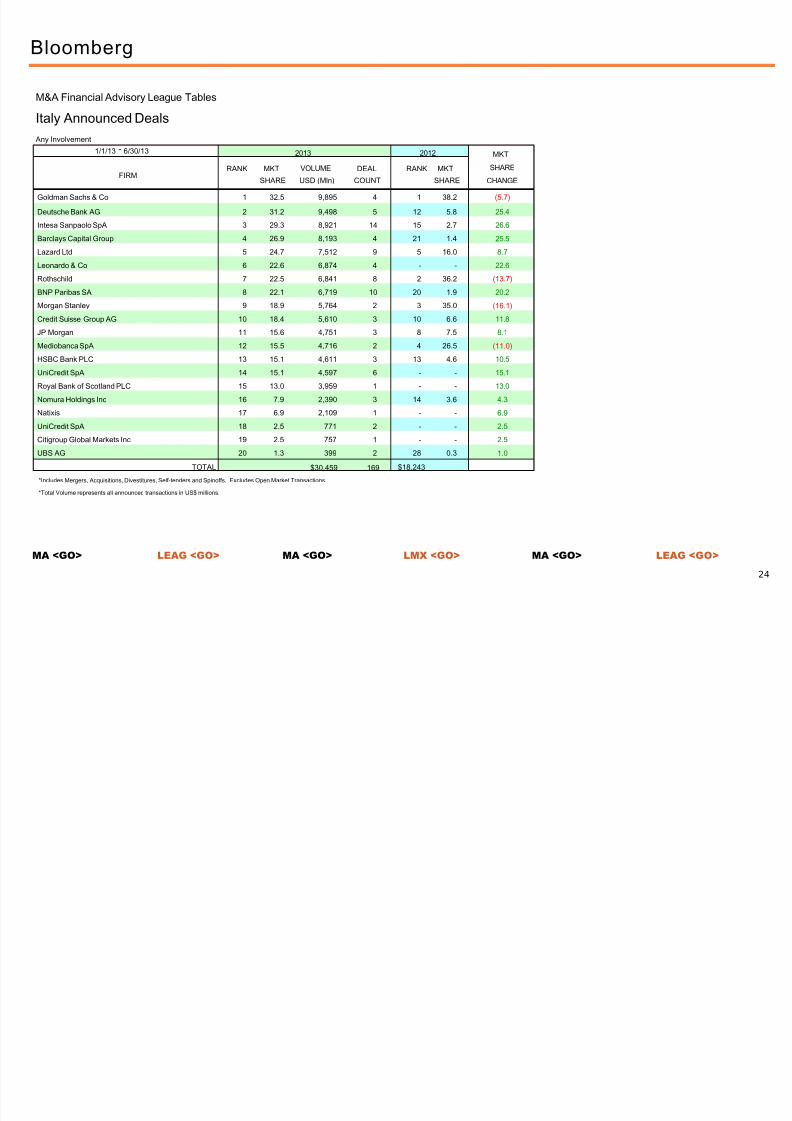
MA <GO> LEAG <GO> MA <GO> LMX <GO> MA <GO> LEAG <GO> 25
Bloomberg
1/1/13 - 6/30/13 2013 2012 MKT SHARE CHANGE
FIRM RANK MKT VOLUME DEAL
SHARE USD (Mln) COUNT
RANK MKT SHARE
Goldman Sachs & Co 1 36.0 32,291 9 4 38.3 (2.3)
Citigroup Inc 2 31.2 28,004 7 19 3.4 27.8
Morgan Stanley 3 29.6 26,532 10 6 35.5 (5.9)
Leonardo & Co 4 27.3 24,502 8 - - 27.3
JP Morgan 5 24.6 22,063 6 3 49.8 (25.2)
Cooperatieve Centrale Raiffeisen-Boerenleenbank 6 24.4 21,916 6 35 0.3 24.1
Bank of America Merrill Lynch 7 17.3 15,506 6 5 36.4 (19.1) Barclays Capital Group 8 16.6 14,919 8 2 50.6 (34.0)
Lazard Ltd 9 16.2 14,534 7 7 30.2 (14.0)
BNP Paribas SA 10 14.9 13,334 12 27 1.1 13.8
Rothschild 11 13.1 11,732 10 16 6.0 7.1
Credit Suisse Group AG 12 12.2 10,922 5 23 2.0 10.2
HSBC Bank PLC 13 12.0 10,788 5 50 0.0 12.0
Allen & Co Inc 14 11.7 10,488 1 - - 11.7
BDT & Co LLC 15 11.2 10,075 1 - - 11.2
Societe Generale SA 16 9.7 8,723 2 34 0.4 9.3
UBS AG 17 8.0 7,222 4 33 0.4 7.6
Deutsche Bank AG 18 5.8 5,223 6 1 53.3 (47.5)
Siam Commercial Bank PCL 19 4.6 4,083 1 - - 4.6
Nordea Bank AB 20 3.5 3,128 1 14 7.5 (4.0)
TOTAL $89,784 397 $64,245
M&A Financial Advisory League Tables
Benelux Announced Deals
Any Involvement
*Includes Mergers, Acquisitions, Divestitures, Self-tenders and Spinoffs. Excludes Open Market Transactions.
*Total Volume represents all announced transactions in US$ millions.

7/29/2019 Global Ma h1 Leag
http://slidepdf.com/reader/full/global-ma-h1-leag 27/39
MA <GO> LEAG <GO> MA <GO> LMX <GO> MA <GO> LEAG <GO> 26
Bloomberg
1/1/13 - 6/30/13 2013 2012 MKT SHARE CHANGE
FIRM RANK MKT VOLUME DEAL
SHARE USD (Mln) COUNT
RANK MKT SHARE
Goldman Sachs & Co 1 28.6 5,815 6 6 25.7 2.9
Banco Santander SA 2 12.7 2,574 10 7 24.9 (12.2)
Barclays Capital Group 3 9.6 1,951 5 1 51.3 (41.7)
Citigroup Inc 4 8.2 1,666 5 5 26.5 (18.3)
Banco Bilbao Vizcaya Argentaria SA 5 8.1 1,641 9 26 2.4 5.7
BNP Paribas SA 6 5.6 1,134 2 27 1.8 3.8
JP Morgan 7 5.5 1,124 3 21 7.0 (1.5) Bank of America Merrill Lynch 8 5.0 1,021 1 8 24.3 (19.3)
Banco Espirito Santo de Investimento SA 9 4.7 950 3 3 44.1 (39.4)
Caixa Banco de Investimento SA 10 4.2 848 1 2 44.4 (40.2)
Perella Weinberg Partners LP 10 4.2 848 1 25 2.8 1.4
Morgan Stanley 12 3.8 769 3 20 8.7 (4.9)
UBS AG 13 3.4 692 4 19 9.4 (6.0)
Rothschild 14 2.4 491 4 4 32.1 (29.7)
Nomura Holdings Inc 15 2.3 457 3 22 5.0 (2.7)
CITIC Securities Co Ltd 16 2.0 412 1 - - 2.0
Intesa Sanpaolo SpA 17 1.5 307 2 - - 1.5
Credit Agricole Corporate & Investment Bank SA 18 1.3 263 1 - - 1.3
Societe Generale SA 19 1.0 199 1 18 11.0 (10.0)
DC Advisory Partners Ltd 20 0.9 180 2 30 0.1 0.8
TOTAL $20,317 187 $28,051
M&A Financial Advisory League Tables
Iberia Announced Deals
Any Involvement
*Includes Mergers, Acquisitions, Divestitures, Self-tenders and Spinoffs. Excludes Open Market Transactions.
*Total Volume represents all announced transactions in US$ millions.
7/29/2019 Global Ma h1 Leag
http://slidepdf.com/reader/full/global-ma-h1-leag 28/39
MA <GO> LEAG <GO> MA <GO> LMX <GO> MA <GO> LEAG <GO> 27
Bloomberg
1/1/13 - 6/30/13 2013 2012 MKT SHARE CHANGE
FIRM RANK MKT VOLUME DEAL
SHARE USD (Mln) COUNT
RANK MKT SHARE
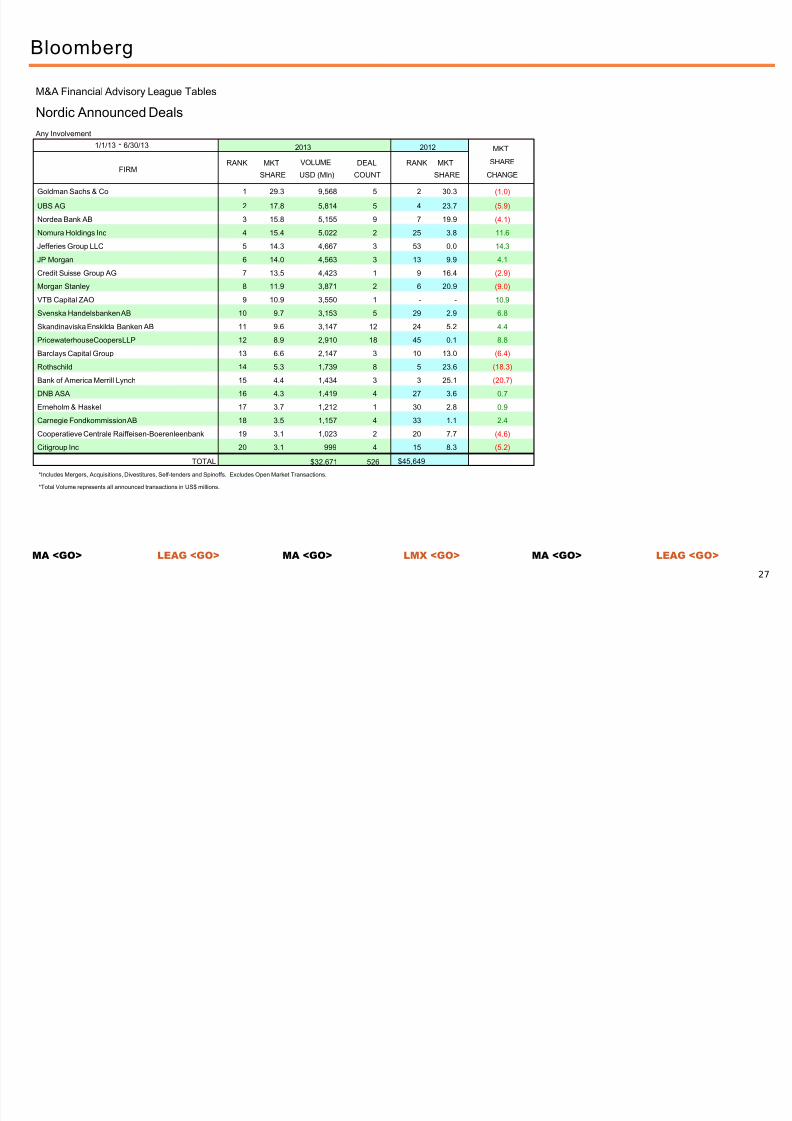
Goldman Sachs & Co 1 29.3 9,568 5 2 30.3 (1.0)
UBS AG 2 17.8 5,814 5 4 23.7 (5.9)
Nordea Bank AB 3 15.8 5,155 9 7 19.9 (4.1)
Nomura Holdings Inc 4 15.4 5,022 2 25 3.8 11.6
Jefferies Group LLC 5 14.3 4,667 3 53 0.0 14.3
JP Morgan 6 14.0 4,563 3 13 9.9 4.1
Credit Suisse Group AG 7 13.5 4,423 1 9 16.4 (2.9)
Morgan Stanley 8 11.9 3,871 2 6 20.9 (9.0)
VTB Capital ZAO 9 10.9 3,550 1 - - 10.9
Svenska Handelsbanken AB 10 9.7 3,153 5 29 2.9 6.8
Skandinaviska Enskilda Banken AB 11 9.6 3,147 12 24 5.2 4.4
PricewaterhouseCoopers LLP 12 8.9 2,910 18 45 0.1 8.8
Barclays Capital Group 13 6.6 2,147 3 10 13.0 (6.4)
Rothschild 14 5.3 1,739 8 5 23.6 (18.3)
Bank of America Merrill Lynch 15 4.4 1,434 3 3 25.1 (20.7)
DNB ASA 16 4.3 1,419 4 27 3.6 0.7
Erneholm & Haskel 17 3.7 1,212 1 30 2.8 0.9
Carnegie Fondkommission AB 18 3.5 1,157 4 33 1.1 2.4
Cooperatieve Centrale Raiffeisen-Boerenleenbank 19 3.1 1,023 2 20 7.7 (4.6)
Citigroup Inc 20 3.1 999 4 15 8.3 (5.2)
TOTAL $32,671 526 $45,649
M&A Financial Advisory League Tables
Nordic Announced Deals
Any Involvement
*Includes Mergers, Acquisitions, Divestitures, Self-tenders and Spinoffs. Excludes Open Market Transactions.
*Total Volume represents all announced transactions in US$ millions.

7/29/2019 Global Ma h1 Leag
http://slidepdf.com/reader/full/global-ma-h1-leag 29/39
MA <GO> LEAG <GO> MA <GO> LMX <GO> MA <GO> LEAG <GO> 28
Bloomberg
1/1/13 - 6/30/13 2013 2012 MKT SHARE CHANGE
FIRM RANK MKT VOLUME DEAL
SHARE USD (Mln) COUNT
RANK MKT SHARE
Morgan Stanley 1 36.3 17,183 8 18 3.3 33.0
Barclays Capital Group 2 24.9 11,797 6 4 10.7 14.2
Citigroup Inc 3 24.7 11,685 9 8 8.5 16.2
Allen & Co Inc 4 22.2 10,488 1 - - 22.2
Cooperatieve Centrale Raiffeisen-Boerenleenbank 4 22.2 10,488 1 50 0.0 22.2
Lazard Ltd 6 11.0 5,220 4 7 8.7 2.3
Credit Suisse Group AG 7 10.4 4,920 6 10 7.8 2.6 Goldman Sachs & Co 8 8.2 3,878 4 1 21.0 (12.8)
Bank of America Merrill Lynch 9 7.1 3,373 4 11 7.5 (0.4)
UBS AG 10 6.0 2,820 3 15 5.7 0.3
Ernst & Young 11 5.4 2,542 2 26 0.7 4.7
HSBC Bank PLC 12 5.2 2,465 4 2 14.2 (9.0)
National Bank of Abu Dhabi PJSC 13 3.7 1,772 1 - - 3.7
Deutsche Bank AG 14 2.0 955 2 9 8.3 (6.3)
Societe Generale SA 15 2.0 938 2 12 7.0 (5.0)
Moelis & Co 16 1.4 682 1 29 0.6 0.8
HSB Partners 17 1.4 658 1 - - 1.4
PricewaterhouseCoopers LLP 18 1.2 588 5 50 0.0 1.2
QInvest LLC 19 0.8 400 1 - - 0.8
Rothschild 20 0.6 296 2 17 4.1 (3.5)
TOTAL $47,338 442 $44,395
M&A Financial Advisory League Tables
Africa/Middle East Announced Deals
Any Involvement
*Includes Mergers, Acquisitions, Divestitures, Self-tenders and Spinoffs. Excludes Open Market Transactions.
*Total Volume represents all announced transactions in US$ millions.
7/29/2019 Global Ma h1 Leag
http://slidepdf.com/reader/full/global-ma-h1-leag 30/39
MA <GO> LEAG <GO> MA <GO> LMX <GO> MA <GO> LEAG <GO> 29
Bloomberg
1/1/13 - 6/30/13 2013 2012 MKT SHARE CHANGE
FIRM RANK MKT VOLUME DEAL
SHARE USD (Mln) COUNT
RANK MKT SHARE
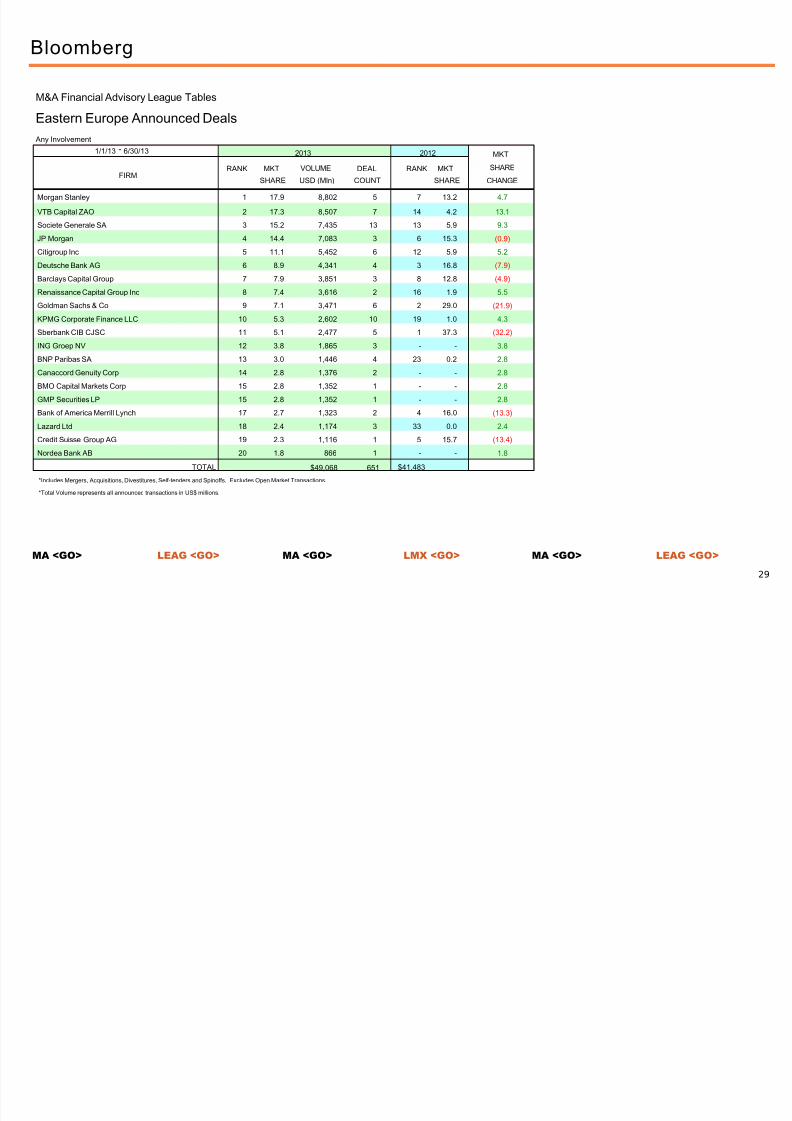
Morgan Stanley 1 17.9 8,802 5 7 13.2 4.7
VTB Capital ZAO 2 17.3 8,507 7 14 4.2 13.1
Societe Generale SA 3 15.2 7,435 13 13 5.9 9.3
JP Morgan 4 14.4 7,083 3 6 15.3 (0.9)
Citigroup Inc 5 11.1 5,452 6 12 5.9 5.2
Deutsche Bank AG 6 8.9 4,341 4 3 16.8 (7.9)
Barclays Capital Group 7 7.9 3,851 3 8 12.8 (4.9) Renaissance Capital Group Inc 8 7.4 3,616 2 16 1.9 5.5
Goldman Sachs & Co 9 7.1 3,471 6 2 29.0 (21.9)
KPMG Corporate Finance LLC 10 5.3 2,602 10 19 1.0 4.3
Sberbank CIB CJSC 11 5.1 2,477 5 1 37.3 (32.2)
ING Groep NV 12 3.8 1,865 3 - - 3.8
BNP Paribas SA 13 3.0 1,446 4 23 0.2 2.8
Canaccord Genuity Corp 14 2.8 1,376 2 - - 2.8
BMO Capital Markets Corp 15 2.8 1,352 1 - - 2.8
GMP Securities LP 15 2.8 1,352 1 - - 2.8
Bank of America Merrill Lynch 17 2.7 1,323 2 4 16.0 (13.3)
Lazard Ltd 18 2.4 1,174 3 33 0.0 2.4
Credit Suisse Group AG 19 2.3 1,116 1 5 15.7 (13.4)
Nordea Bank AB 20 1.8 866 1 - - 1.8
TOTAL $49,068 651 $41,483
M&A Financial Advisory League Tables
Eastern Europe Announced Deals
Any Involvement
*Includes Mergers, Acquisitions, Divestitures, Self-tenders and Spinoffs. Excludes Open Market Transactions.
*Total Volume represents all announced transactions in US$ millions.
7/29/2019 Global Ma h1 Leag
http://slidepdf.com/reader/full/global-ma-h1-leag 31/39
MA <GO> LEAG <GO> MA <GO> LMX <GO> MA <GO> LEAG <GO> 30
Bloomberg
1/1/13 - 6/30/13 2013 2012 MKT SHARE CHANGE
FIRM RANK MKT VOLUME DEAL
SHARE USD (Mln) COUNT
RANK MKT SHARE
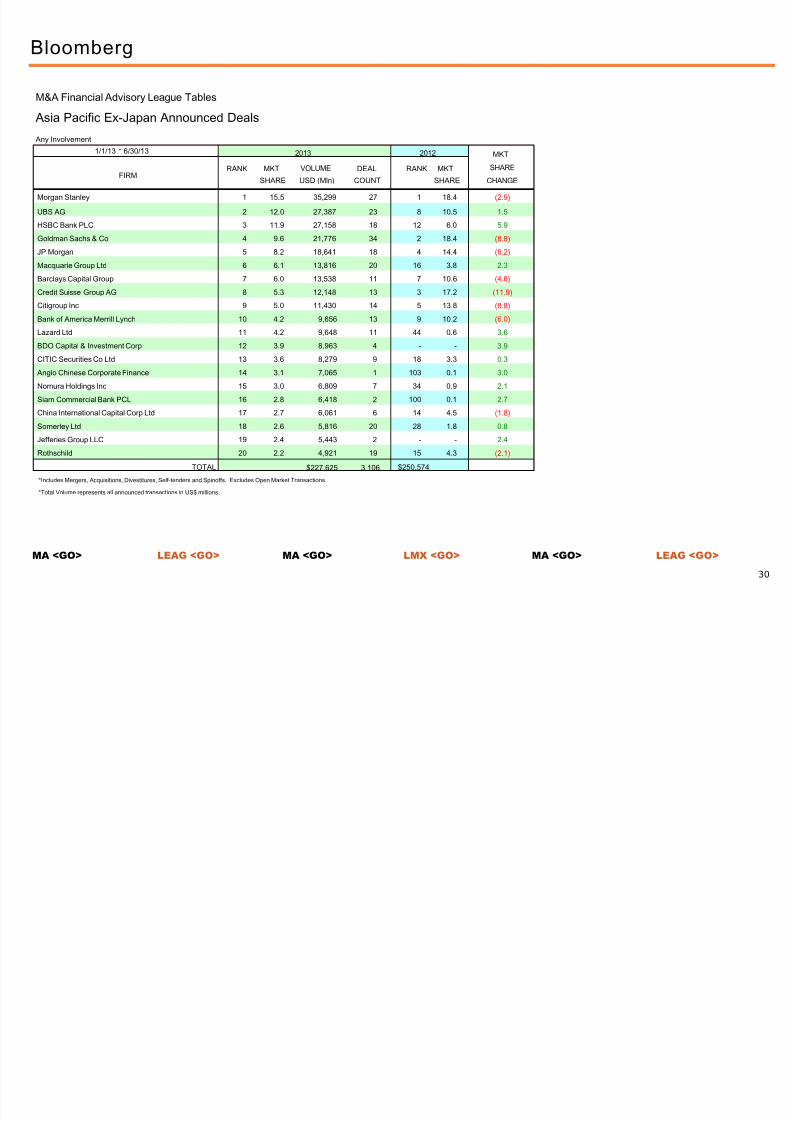
Morgan Stanley 1 15.5 35,299 27 1 18.4 (2.9)
UBS AG 2 12.0 27,387 23 8 10.5 1.5
HSBC Bank PLC 3 11.9 27,158 18 12 6.0 5.9
Goldman Sachs & Co 4 9.6 21,776 34 2 18.4 (8.8)
JP Morgan 5 8.2 18,641 18 4 14.4 (6.2)
Macquarie Group Ltd 6 6.1 13,816 20 16 3.8 2.3
Barclays Capital Group 7 6.0 13,538 11 7 10.6 (4.6) Credit Suisse Group AG 8 5.3 12,148 13 3 17.2 (11.9)
Citigroup Inc 9 5.0 11,430 14 5 13.8 (8.8)
Bank of America Merrill Lynch 10 4.2 9,656 13 9 10.2 (6.0)
Lazard Ltd 11 4.2 9,648 11 44 0.6 3.6
BDO Capital & Investment Corp 12 3.9 8,963 4 - - 3.9
CITIC Securities Co Ltd 13 3.6 8,279 9 18 3.3 0.3
Anglo Chinese Corporate Finance 14 3.1 7,065 1 103 0.1 3.0
Nomura Holdings Inc 15 3.0 6,809 7 34 0.9 2.1
Siam Commercial Bank PCL 16 2.8 6,418 2 100 0.1 2.7
China International Capital Corp Ltd 17 2.7 6,061 6 14 4.5 (1.8)
Somerley Ltd 18 2.6 5,816 20 28 1.8 0.8
Jefferies Group LLC 19 2.4 5,443 2 - - 2.4
Rothschild 20 2.2 4,921 19 15 4.3 (2.1)
TOTAL $227,625 3,106 $250,574
M&A Financial Advisory League Tables
Asia Pacific Ex-Japan Announced Deals
Any Involvement
*Includes Mergers, Acquisitions, Divestitures, Self-tenders and Spinoffs. Excludes Open Market Transactions.
*Total Volume represents all announced transactions in US$ millions.

7/29/2019 Global Ma h1 Leag
http://slidepdf.com/reader/full/global-ma-h1-leag 32/39
MA <GO> LEAG <GO> MA <GO> LMX <GO> MA <GO> LEAG <GO> 31
Bloomberg
1/1/13 - 6/30/13 2013 2012 MKT SHARE CHANGE
FIRM RANK MKT VOLUME DEAL
SHARE USD (Mln) COUNT
RANK MKT SHARE
UBS AG 1 13.7 25,121 15 7 11.0 2.7
HSBC Bank PLC 2 11.7 21,393 14 12 6.2 5.5
Morgan Stanley 3 11.5 21,122 18 1 21.0 (9.5)
Goldman Sachs & Co 4 10.4 19,081 27 2 19.3 (8.9)
JP Morgan 5 9.3 17,049 14 5 11.7 (2.4)
Macquarie Group Ltd 6 7.5 13,645 18 21 2.3 5.2
Credit Suisse Group AG 7 5.3 9,770 9 3 16.3 (11.0) Citigroup Inc 8 5.2 9,553 12 4 11.8 (6.6)
BDO Capital & Investment Corp 9 4.9 8,963 4 - - 4.9
CITIC Securities Co Ltd 10 4.5 8,279 9 16 3.7 0.8
Anglo Chinese Corporate Finance 11 3.9 7,065 1 85 0.1 3.8
Nomura Holdings Inc 12 3.6 6,502 6 28 1.1 2.5
Lazard Ltd 13 3.5 6,469 8 43 0.5 3.0
Siam Commercial Bank PCL 14 3.5 6,418 2 83 0.1 3.4
China International Capital Corp Ltd 15 3.3 6,061 6 13 5.5 (2.2)
Somerley Ltd 16 3.1 5,690 19 22 2.2 0.9
Jefferies Group LLC 17 2.4 4,423 1 - - 2.4
Bank of America Merrill Lynch 18 1.9 3,553 7 9 9.0 (7.1)
Barclays Capital Group 19 1.8 3,271 7 10 8.7 (6.9)
Ernst & Young 20 1.8 3,219 26 33 0.9 0.9
TOTAL $183,067 2,668 $204,721
M&A Financial Advisory League Tables
Asia Pacific Ex-Japan Announced Deals
Target or
Seller
*Includes Mergers, Acquisitions, Divestitures, Self-tenders and Spinoffs. Excludes Open Market Transactions.
*Total Volume represents all announced transactions in US$ millions.

7/29/2019 Global Ma h1 Leag
http://slidepdf.com/reader/full/global-ma-h1-leag 33/39
MA <GO> LEAG <GO> MA <GO> LMX <GO> MA <GO> LEAG <GO> 32
Bloomberg
1/1/13 - 6/30/13 2013 2012 MKT SHARE CHANGE
FIRM RANK MKT VOLUME DEAL
SHARE USD (Mln) COUNT
RANK MKT SHARE
Lazard Ltd 1 19.5 6,062 5 13 1.8 17.7
Morgan Stanley 2 16.7 5,206 4 4 12.9 3.8
Macquarie Group Ltd 3 13.1 4,082 12 1 20.3 (7.2)
Goldman Sachs & Co 4 6.6 2,058 12 2 18.1 (11.5)
Citigroup Inc 5 6.1 1,884 5 9 6.1 -
CIMB 6 5.1 1,597 4 33 0.6 4.5
Deutsche Bank AG 7 2.7 824 3 8 7.7 (5.0) Nomura Holdings Inc 8 2.6 818 1 - - 2.6
Credit Suisse Group AG 9 2.6 803 1 7 8.3 (5.7)
Flagstaff Partners Pty Ltd 10 2.2 673 2 - - 2.2
Bank of Nova Scotia 11 2.1 650 1 - - 2.1
RBC Capital Markets 12 1.6 503 3 3 16.2 (14.6)
Gresham Partners Ltd 13 1.6 487 5 29 0.8 0.8
PricewaterhouseCoopers LLP 14 1.5 466 8 63 0.0 1.5
Australia & New Zealand Banking Group Ltd 15 1.5 466 1 - - 1.5
HSBC Bank PLC 16 1.4 450 1 22 1.3 0.1
Barclays Capital Group 17 1.4 448 2 23 1.2 0.2
Ernst & Young 18 1.3 406 3 58 0.0 1.3
Standard Chartered Bank 19 0.7 216 1 43 0.1 0.6
Rothschild 20 0.7 215 4 5 9.1 (8.4)
TOTAL $31,149 577 $45,115
M&A Financial Advisory League Tables
Australia & New Zealand Announced Deals
Any Involvement
*Includes Mergers, Acquisitions, Divestitures, Self-tenders and Spinoffs. Excludes Open Market Transactions.
*Total Volume represents all announced transactions in US$ millions.

7/29/2019 Global Ma h1 Leag
http://slidepdf.com/reader/full/global-ma-h1-leag 34/39
MA <GO> LEAG <GO> MA <GO> LMX <GO> MA <GO> LEAG <GO> 33
Bloomberg
1/1/13 - 6/30/13 2013 2012 MKT SHARE CHANGE
FIRM RANK MKT VOLUME DEAL
SHARE USD (Mln) COUNT
RANK MKT SHARE
Nomura Holdings Inc 1 23.5 10,898 50 1 43.3 (19.8)
Morgan Stanley 2 22.0 10,216 25 2 30.3 (8.3)
Mizuho Financial Group Inc 3 16.8 7,772 69 3 27.9 (11.1)
GCA Savvian Corp 4 9.7 4,499 16 21 2.1 7.6
Sumitomo Mitsui Financial Group Inc 5 9.3 4,307 39 5 21.2 (11.9)
JP Morgan 6 8.4 3,883 4 4 26.5 (18.1)
Goldman Sachs
&
Co 7
8.3
3,865
7 7
4.7 3.6
Daiwa Securities Group Inc 8 7.6 3,538 22 10 4.0 3.6
Houlihan Lokey 9 5.6 2,593 3 56 0.0 5.6
Barclays Capital Group 9 5.6 2,593 1 8 4.5 1.1
Leonardo & Co 9 5.6 2,593 1 63 0.0 5.6
Citigroup Inc 12 2.8 1,315 3 9 4.3 (1.5)
Credit Suisse Group AG 13 2.7 1,246 3 12 2.7 -
Brutus Consulting KK 14 2.6 1,223 1 - - 2.6
Lazard Ltd 15 2.4 1,101 3 22 1.9 0.5
Wells Fargo & Co 16 2.4 1,100 1 - - 2.4
Benedi Consulting Co Ltd 17 2.3 1,050 1 - - 2.3
Deloitte Touche Tohmatsu ILA Group Ltd 18 2.2 1,040 14 15 2.5 (0.3)
Yamada FAS Co Ltd 19 1.7 803 4 - - 1.7
KPMG Corporate Finance LLC 20 1.7 776 18 20 2.1 (0.4)
TOTAL $46,347 1,152 $81,602
M&A Financial Advisory League Tables
Japan Announced Deals
Any Involvement
*Includes Mergers, Acquisitions, Divestitures, Self-tenders and Spinoffs. Excludes Open Market Transactions.
*Total Volume represents all announced transactions in US$ millions.

7/29/2019 Global Ma h1 Leag
http://slidepdf.com/reader/full/global-ma-h1-leag 35/39
MA <GO> LEAG <GO> MA <GO> LMX <GO> MA <GO> LEAG <GO> 34
Bloomberg
1/1/13 - 6/30/13 2013 2012 MKT SHARE CHANGE
FIRM RANK MKT VOLUME DEAL
SHARE USD (Mln) COUNT
RANK MKT SHARE
Morgan Stanley 1 17.8 16,544 8 12 4.7 13.1
UBS AG 2 12.4 11,489 14 6 9.9 2.5
HSBC Bank PLC 3 12.0 11,154 7 5 11.8 0.2
Goldman Sachs & Co 4 10.5 9,738 10 2 13.5 (3.0)
Barclays Capital Group 5 10.0 9,260 6 26 1.1 8.9
CITIC Securities Co Ltd 6 8.9 8,279 9 7 9.4 (0.5)
Anglo Chinese
Corporate
Finance 7
7.6
7,065
1 -
- 7.6
China International Capital Corp Ltd 8 6.5 6,061 6 3 12.8 (6.3)
Somerley Ltd 9 5.9 5,452 12 10 5.2 0.7
JP Morgan 10 2.4 2,188 4 9 6.1 (3.7)
Platinum Securities Co Ltd 11 1.9 1,737 2 66 0.1 1.8
Guotai Junan Securities Co Ltd 12 1.8 1,707 2 23 1.3 0.5
Credit Suisse Group AG 13 1.7 1,600 4 1 15.7 (14.0)
Citigroup Inc 14 1.7 1,562 3 14 4.2 (2.5)
Bank of Nova Scotia 15 1.6 1,520 1 - - 1.6
Nomura Holdings Inc 16 1.6 1,478 3 21 1.6 -
Bank of China Ltd 17 1.3 1,220 1 11 4.9 (3.6)
Standard Chartered Bank 18 1.3 1,184 1 15 4.0 (2.7)
Minsheng Securities Co Ltd 19 1.1 1,058 5 - - 1.1
Jefferies Group LLC 20 1.1 1,020 1 - - 1.1
TOTAL $92,882 838 $87,228
M&A Financial Advisory League Tables
China Announced Deals
Any Involvement
*Includes Mergers, Acquisitions, Divestitures, Self-tenders and Spinoffs. Excludes Open Market Transactions.
*Total Volume represents all announced transactions in US$ millions.

7/29/2019 Global Ma h1 Leag
http://slidepdf.com/reader/full/global-ma-h1-leag 36/39
MA <GO> LEAG <GO> MA <GO> LMX <GO> MA <GO> LEAG <GO> 35
Bloomberg
1/1/13 - 6/30/13 2013 2012 MKT SHARE CHANGE
FIRM RANK MKT VOLUME DEAL
SHARE USD (Mln) COUNT
RANK MKT SHARE
HSBC Bank PLC 1 15.7 3,629 5 9 6.3 9.4
Somerley Ltd 2 10.0 2,319 14 35 0.2 9.8
Rothschild 3 6.9 1,604 5 6 10.5 (3.6)
UBS AG 4 5.6 1,295 2 7 9.5 (3.9)
Credit Suisse Group AG 5 5.4 1,258 1 - - 5.4
Deutsche Bank AG 6 4.8 1,120 4 17 1.3 3.5
Goldman Sachs
&
Co 7
4.7
1,078
3 3
13.5 (8.8)
Carnegie Fondkommission AB 8 4.4 1,023 1 - - 4.4
Cooperatieve Centrale Raiffeisen-Boerenleenbank 8 4.4 1,023 1 - - 4.4
DNB ASA 8 4.4 1,023 1 - - 4.4
Skandinaviska Enskilda Banken AB 8 4.4 1,023 1 - - 4.4
Bank of America Merrill Lynch 12 4.4 1,021 1 10 5.3 (0.9)
BNP Paribas SA 12 4.4 1,021 1 19 1.0 3.4
JP Morgan 12 4.4 1,021 1 2 23.2 (18.8)
Macquarie Group Ltd 15 3.7 845 3 16 1.4 2.3
Morgan Stanley 16 3.6 841 3 1 26.1 (22.5)
Optima Capital Ltd 17 2.6 612 3 - - 2.6
Kingsway Group Ltd 18 2.6 601 1 - - 2.6
Oriental Patron Securities Ltd 18 2.6 601 1 - - 2.6
Maybank 20 2.5 582 2 27 0.5 2.0
TOTAL $23,147 396 $22,800
M&A Financial Advisory League Tables
Hong Kong Announced Deals
Any Involvement
*Includes Mergers, Acquisitions, Divestitures, Self-tenders and Spinoffs. Excludes Open Market Transactions.
*Total Volume represents all announced transactions in US$ millions.

7/29/2019 Global Ma h1 Leag
http://slidepdf.com/reader/full/global-ma-h1-leag 37/39
MA <GO> LEAG <GO> MA <GO> LMX <GO> MA <GO> LEAG <GO> 36
Bloomberg
1/1/13 - 6/30/13 2013 2012 MKT SHARE CHANGE
FIRM RANK MKT VOLUME DEAL
SHARE USD (Mln) COUNT
RANK MKT SHARE
UBS AG 1 42.3 7,947 2 38 0.0 42.3
Morgan Stanley 2 36.0 6,767 5 1 61.6 (25.6)
HSBC Bank PLC 3 31.0 5,825 3 24 0.7 30.3
Citigroup Inc 4 29.0 5,447 1 5 55.1 (26.1)
Bank of America Merrill Lynch 5 27.7 5,209 3 8 50.6 (22.9)
Credit Suisse Group AG 6 15.3 2,878 2 9 28.6 (13.3)
Ernst &
Young 7
14.8
2,780
23 10
8.4 6.4
Deutsche Bank AG 8 13.0 2,438 2 14 2.3 10.7
I'm Investment & Securities Co Ltd 9 12.4 2,331 1 - - 12.4
Jefferies LLC 10 8.5 1,600 1 15 1.6 6.9
Goldman Sachs & Co 11 7.3 1,374 2 6 54.5 (47.2)
Rothschild 12 3.3 621 5 22 0.8 2.5
Macquarie Group Ltd 13 2.6 481 1 29 0.3 2.3
Standard Chartered Bank 13 2.6 481 1 - - 2.6
PricewaterhouseCoopers LLP 15 2.3 439 3 - - 2.3
JM Financial Ltd 16 1.7 327 2 21 0.8 0.9
Kotak Mahindra Bank Ltd 17 1.4 266 5 12 3.1 (1.7)
Lazard Ltd 18 1.4 257 2 38 0.0 1.4
Credit Agricole Corporate & Investment Bank SA 18 1.4 257 1 - - 1.4
BNP Paribas SA 20 0.6 113 2 - - 0.6
TOTAL $18,782 383 $25,191
M&A Financial Advisory League Tables
India Announced Deals
Any Involvement
*Includes Mergers, Acquisitions, Divestitures, Self-tenders and Spinoffs. Excludes Open Market Transactions.
*Total Volume represents all announced transactions in US$ millions.

7/29/2019 Global Ma h1 Leag
http://slidepdf.com/reader/full/global-ma-h1-leag 38/39
MA <GO> LEAG <GO> MA <GO> LMX <GO> MA <GO> LEAG <GO> 37
Bloomberg
1/1/13 - 6/30/13 2013 2012 MKT SHARE CHANGE
FIRM RANK MKT VOLUME DEAL
SHARE USD (Mln) COUNT
RANK MKT SHARE
JP Morgan 1 26.7 14,861 9 13 6.7 20.0
Macquarie Group Ltd 2 18.7 10,399 8 60 0.0 18.7
BDO Capital & Investment Corp 3 16.1 8,963 4 - - 16.1
HSBC Bank PLC 4 14.4 8,052 5 15 6.0 8.4
Credit Suisse Group AG 5 12.9 7,214 8 3 16.4 (3.5)
UBS AG 6 11.6 6,451 3 2 21.0 (9.4)
Siam Commercial
Bank
PCL 7
11.5
6,418
2 32
0.5 11.0
Goldman Sachs & Co 8 9.7 5,420 5 10 9.7 -
Nomura Holdings Inc 9 8.1 4,513 2 22 1.3 6.8
Morgan Stanley 10 8.0 4,454 6 6 15.5 (7.5)
Jefferies Group LLC 11 7.9 4,423 1 - - 7.9
Lazard Ltd 12 7.3 4,075 4 29 0.5 6.8
Barclays Capital Group 13 5.6 3,122 1 25 0.8 4.8
Bank of America Merrill Lynch 14 4.6 2,556 6 1 21.3 (16.7)
Citigroup Inc 15 4.0 2,205 4 14 6.6 (2.6)
CIMB 16 3.6 2,002 9 16 5.9 (2.3)
Moorpark Capital Partners LLP 17 2.0 1,111 1 - - 2.0
Rothschild 18 1.9 1,076 3 60 0.0 1.9
Banco Itau BBA SA 19 1.5 850 1 - - 1.5
Maybank 20 1.3 743 13 12 8.6 (7.3)
TOTAL $55,763 705 $48,898
M&A Financial Advisory League Tables
South East Asia Announced Deals
Any Involvement
*Includes Mergers, Acquisitions, Divestitures, Self-tenders and Spinoffs. Excludes Open Market Transactions.
*Total Volume represents all announced transactions in US$ millions.

7/29/2019 Global Ma h1 Leag
http://slidepdf.com/reader/full/global-ma-h1-leag 39/39
Bloomberg
38
For data submissions or queries, please contact:
Mariana Trindade
North America
+1-212-617-3692
+1-917-369-3965 [email protected]
Inesa Smigola
EMEA
+44-20-3525-7149
+44-20-7942-1792
Devanshi Desai
Asia Pacific
+61-2-9777-8661
+61-2-9770-8561 [email protected]
Bloomberg 2013 1st Half
Mergers & Acquisitions Financial Advisory Rankings
Bloomberg M&A league tables represent transactions that are either pending or completed, and for which Bloomberg has been notified.
Bloomberg M&A league tables include mergers, acquisitions, divestitures, self-tenders, spinoffs, debt-for-equity swaps, private placements of common equity and convertible securities, and purchases of convertible securities and cash injection components of recapitalizations according to Bloomberg standards. Excludes open market transactions. All deals except additional stake purchases are subjected to a minimum threshold of 5% equity or USD 50 million total value. League table credit is based on announced total value of a deal.
Bloomberg LP and its suppliers believe the information herein was obtained from reliable sources, but they do not guarantee its accuracy. Neither the information nor the opinion expressed constitutes a solicitation of the purchase or sale of securities or commodities.
07/02/2013
Fernando Simon
LATAM
+55-11-3048-4619
+55-11-3048-4669
For 24 hour global customer support call
+1 212 318 2000 +44 20 7330 7500 +65 6212 1000 +81 3 3201 8900 or press the HELP key twice on the BLOOMBERG PROFESSIONAL(R) service.
MA <GO> MA <GO> MA <GO>


![Characterizing Test Methods and Emissions Reduction ...184-H1. 155-H1. 170-H1. 198-H1. 218-H1. 1. 10. 100. 1000. Axis Title Diameter [nm] A_0581_492_H1. A_0581_466_H1. A_0581_482_H1.](https://static.fdocuments.us/doc/165x107/5f74a0f484fbe405e9323ea1/characterizing-test-methods-and-emissions-reduction-184-h1-155-h1-170-h1.jpg)