
KONE H1 2019 · kone h1 2019 july 18, 2019 henrik ehrnrooth, president & ceo ilkka hara, cfo

IPO Watch EuropeQ2 2019
pwc.co.uk/ipowatch

Trainline plcConsumer Services
€1,227mLondon
European IPO markets raised €12.1bn in H1 2019, with proceeds down 47% compared to H1 2018
Top five European IPOs in H1 2019 – five mega-IPOs1
Global IPO activity European IPO activity (incl. UK)
UK IPO activity
Value ($bn)
Volume of IPOs
Value (€bn)
Volume of IPOs
Value (£bn)
Volume of IPOs
$82.2bnin H1 2019
€12.1bnin H1 2019
£4.4bnin H1 2019
28% decrease on H1 2018
47% decrease on H1 2018
5%increase on H1 2018
1 Mega-IPOs defined as raising in excess of €1bn
H1 2015 H1 2016 H1 2017 H1 2018 H1 2019 H1 2015 H1 2016 H1 2017 H1 2018 H1 2019 H1 2015 H1 2016 H1 2017 H1 2018 H1 2019
Stadler Rail AGIndustrials
€1,351mSIX Swiss Exchange
Network International Holdings plc
Financials
€1,414mLondon
Traton SEIndustrials
€1,350mDeutsche Börse;
Nasdaq Stockholm
Nexi SpAFinancials
€2,056mBorsa Italiana
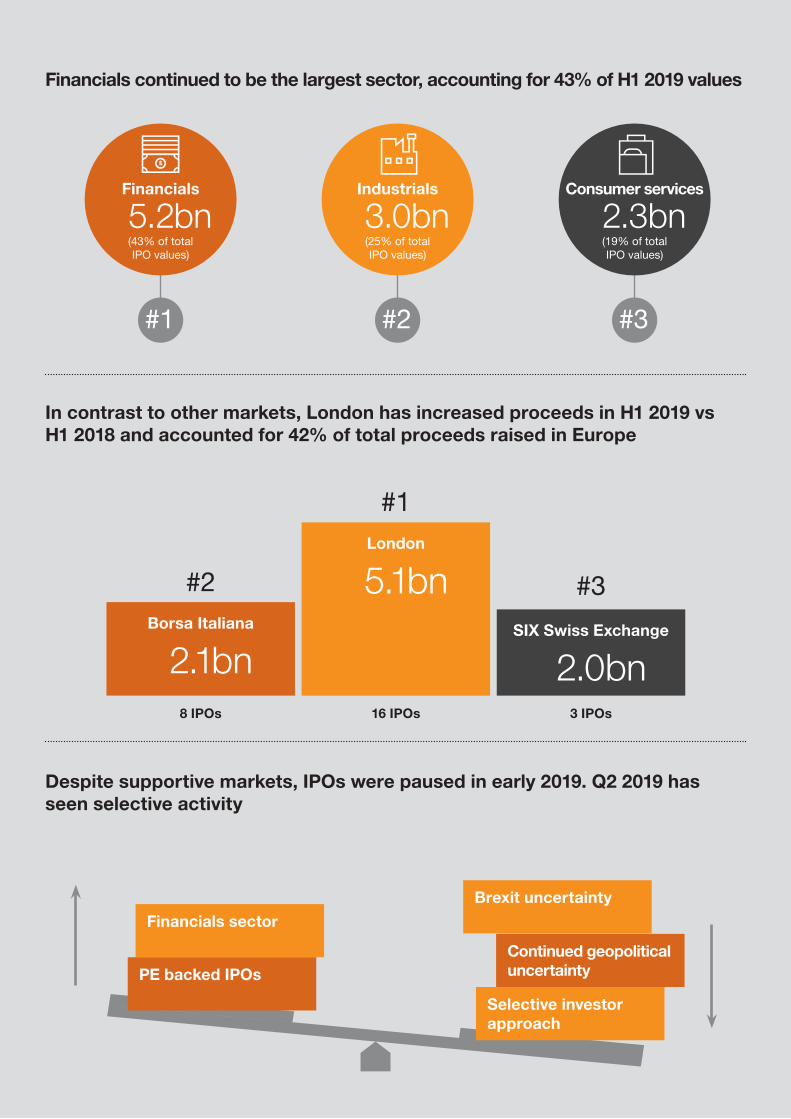
Despite supportive markets, IPOs were paused in early 2019. Q2 2019 has seen selective activity
Financials continued to be the largest sector, accounting for 43% of H1 2019 values
#1
Financials
€5.2bn(43% of total IPO values)
#2
Industrials
€3.0bn(25% of total IPO values)
#3
Consumer services
€2.3bn(19% of total IPO values)
In contrast to other markets, London has increased proceeds in H1 2019 vs H1 2018 and accounted for 42% of total proceeds raised in Europe
16 IPOs
London
€5.1bn
#1
8 IPOs
Borsa Italiana
€2.1bn
#2
3 IPOs
SIX Swiss Exchange
€2.0bn
#3
Financials sector
PE backed IPOsContinued geopolitical uncertainty
Selective investor approach
Brexit uncertainty
Outlook
“Peter WhelanPartner, UK IPO Lead at PwC
Contents
UK focus 3
Overview 4
Top five UK IPOs 5
European focus 6
European IPO trends 7
Market volatility 9
Pricing of top five IPOs 10
European PE trends 10
The sector story 11
Global focus 13
Global money raised via IPOs 14
Appendix 16
IPOs by market 17
The European IPO market is showing signs of recovery following a particularly quiet first quarter. Although geopolitical tensions and looming Brexit deadlines caused companies and markets to exercise caution earlier in the year, this now appears to be less of a concern. While there have been fewer small deals in this quarter, we have seen a number of major transactions. This has included a good number of private equity backed companies that delivered significant investor demand and positive aftermarket performance – notably Network International, Watches of Switzerland and Trainline – providing some of the best debuts among large European companies in 2019.”
4 | IPO Watch Europe Q2 2019 | PwC

UK focus
PwC | IPO Watch Europe Q2 2019 | 5
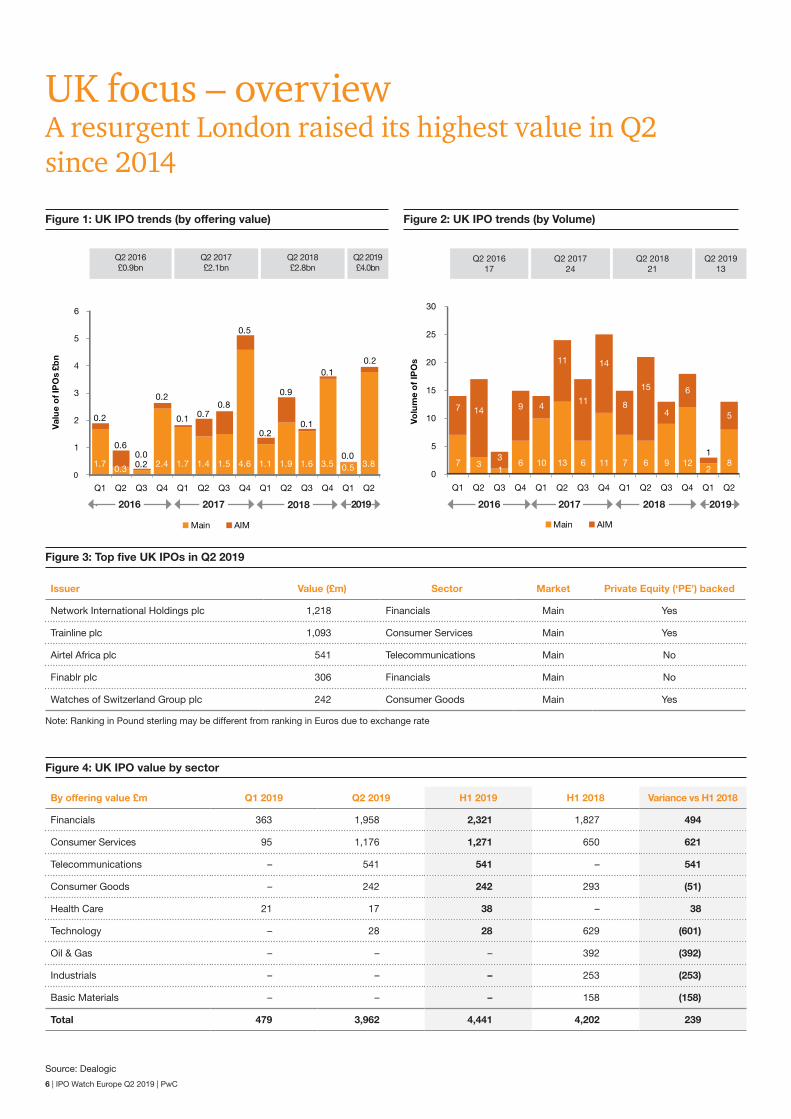
Figure 1: UK IPO trends (by offering value)
Figure 3: Top five UK IPOs in Q2 2019
Figure 4: UK IPO value by sector
Figure 2: UK IPO trends (by Volume)
UK focus – overviewA resurgent London raised its highest value in Q2 since 2014
1.7 0.3 0.2 2.4 1.7 1.4 1.5 4.6 1.1 1.9 1.6 3.5 0.5 3.8
0.2
0.60.0
0.2
0.1 0.70.8
0.5
0.2
0.9
0.1
0.1
0.0
0.2
0
1
2
3
4
5
6
Q1 Q2 Q3 Q4 Q1 Q2 Q3 Q4 Q1 Q2 Q3 Q4 Q1 Q2
Valu
e o
f IP
Os
£bn
Main AIM
7 31
6 10 13 6 11 7 6 9 122
8
7 14
3
9 4
11
11
14
8
15
4
6
1
5
0
5
10
15
20
25
30
Q1 Q2 Q3 Q4 Q1 Q2 Q3 Q4 Q1 Q2 Q3 Q4 Q1 Q2
Volu
me
of
IPO
s
Main AIM
2016 2017 2018 2016 2017 2018
Q2 2016£0.9bn
Q2 201617
Q2 2017£2.1bn
Q2 201724
Q2 2018£2.8bn
Q2 201821
Q2 2019£4.0bn
Q2 201913
Issuer Value (£m) Sector Market Private Equity (‘PE’) backed
Network International Holdings plc 1,218 Financials Main Yes
Trainline plc 1,093 Consumer Services Main Yes
Airtel Africa plc 541 Telecommunications Main No
Finablr plc 306 Financials Main No
Watches of Switzerland Group plc 242 Consumer Goods Main Yes
By offering value £m Q1 2019 Q2 2019 H1 2019 H1 2018 Variance vs H1 2018
Financials 363 1,958 2,321 1,827 494
Consumer Services 95 1,176 1,271 650 621
Telecommunications – 541 541 – 541
Consumer Goods – 242 242 293 (51)
Health Care 21 17 38 – 38
Technology – 28 28 629 (601)
Oil & Gas – – – 392 (392)
Industrials – – – 253 (253)
Basic Materials – – – 158 (158)
Total 479 3,962 4,441 4,202 239
Note: Ranking in Pound sterling may be different from ranking in Euros due to exchange rate
Source: Dealogic
20192019
6 | IPO Watch Europe Q2 2019 | PwC

UK focus – H1 relative performance of UK IPOsThe majority of IPOs have outperformed indices, despite strong performance across equity markets
Figure 5: Share price performance of UK IPOs relative to the FTSE all share index, from IPO to 28 June 2019 (%)
96
2,175
73
60
1,682
363
185
53
34
153
136
647
79
366
3,007
1,225
Market cap asof pricing date (£m)
Distribution Finance Capital Holdings plc (DFC)
Network International Holdings plc
Essensys plc
Argentex Group plc
Trainline plc
Schiehallion Fund Ltd
Loungers plc
Diaceutics plc
Induction Healthcare Group plc
US Solar Fund plc
Aquila European Renewables Income Fund plc
Watches of Switzerland Group plc
Riverstone Credit Opportunities Income plc
DWF Group plc
(30%) (20%) (10%) 0% 10% 20% 30% 40% 50% 60%
Airtel Africa plc
Finablr plc
51.7%
36.6%
31.9%
27.2%
17.7%
14.3%
14.2%
13.4%
7.2%
2.9%
(0.3%)
(1.3%)
(1.4%)
(4.7%)
(15.6%)
(16.4%)
Source: Thomson Reuters as of 28 June 2019 and Dealogic as of pricing date.
Relative performance based on the FTSE All Share Index for Main Market listed companies and FTSE AIM All Share index for AIM quoted companies.
10companies have
outperformed the index
6companies have underperformed
the index
“We continue to see domestic and international issuers choosing London as the most attractive market. Whilst we have less visibility on the H2 pipeline at the moment, we do have several significant transactions preparing for an IPO in London in the medium term.”
Roslyn GamsaDirector, UK Capital Markets Group at PwC
Main AIM
PwC | IPO Watch Europe Q2 2019 | 7

European focus
8 | IPO Watch Europe Q2 2019 | PwC

Figure 6: Top three stock exchanges in Europe in Q2 2019 (by offering value)
European IPO trendsAs IPO activity has picked up across Europe, the London Stock Exchange has retained its leading position by value raised and volume
London13 IPOs raised: €4.5bnLargest sector: FinancialsLargest IPO: Network International Holdings plc (€1.4bn)
Borsa Italiana6 IPOs raised: €2.1bn Largest sector: FinancialsLargest IPO: Nexi SpA (€2.1bn)
SIX Swiss Exchange3 IPOs raised: €2.0bnLargest sector: IndustrialsLargest IPO: Stadler Rail AG (€1.4bn)
1
2
3
PwC | IPO Watch Europe Q2 2019 | 9

Figure 7: European H1 IPO activity since 2015
Figure 8: Quarterly European IPO activity since 2015
European IPO trendsFollowing a quiet first quarter, activity rebounded strongly in Q2 2019, although aggregate first half values were down 47% in H1 2019 compared to H1 2018
34.6 15.3 22.0 22.7 12.1
138
94
118 121
53
0
20
40
60
80
100
120
140
160
0
5
10
15
20
25
30
35
40
H1 2015 H1 2016 H1 2017 H1 2018 H1 2019
Vo
lum
e o
f IP
Os
Va
lue
of I
PO
s €b
n
Value €bn Volume of IPOs
Value €bn Volume of IPOs
18.1 16.5 4.8 22.1 3.7 11.6 3.9 10.0 5.0 17.1 10.5 12.8 13.5 9.2 3.7 10.2 0.7 11.4
62
76
31
66
27
67
15
47
38
80
39
73
52
69
33
46
12
41
0
10
20
30
40
50
60
70
80
90
0
5
10
15
20
25
Q1 Q2 Q3 Q4 Q1 Q2 Q3 Q4 Q1 Q2 Q3 Q4 Q1 Q2 Q3 Q4 Q1 Q2
Volu
me
of
IPO
s
Valu
e o
f IP
Os
€bn
2015 2016 2017 2018 2019
10 | IPO Watch Europe Q2 2019 | PwC

€1bn+ IPO of Ceva Logistics AG
Jan Feb Mar Apr May Jun Jul Aug Sep Oct Nov Dec Jan Feb Mar Apr May Jun
% c
hang
e si
nce
1 Ja
n 20
18IP
O m
one
y ra
ised
(€b
n)
VS
TOX
X50
ind
ex
2019
Spike in volatility ahead of the original 31 March Brexit deadline
Jan Feb Mar Apr May Jun Jul Aug Sep Oct Nov Dec Jan Feb Mar Apr May Jun
€1bn+ IPO of Siemens Healthineers AG and DWS Group GmbH & Co KGaA
€1bn+ IPO of Knorr-Bremse AG and Aston Martin Lagonda Global Holdings plc
€1bn+ IPO of Nexi SpA, Network International Holding plc and Stadler Retail AG
€1bn+ IPO of Traton SE and Trainline plc
€1bn+ IPO of SIG Combibloc AG
IPO money raised €bn VSTOXX50 index
0
2
4
6
8
10
12
0
5
10
15
20
25
30
35
40
(30%)
(25%)
(20%)
(15%)
(10%)
(5%)
0%
5%
10%
15%
20% DAX 30FTSE 100CAC 40IBEX 35
2018 2019
Volatility continues largely due to Federal Reserve’s rate increase and fear of global economic slowdown
Fears of rising US bond yields and higher inflation saw $4tn wiped o� the value of shares
around the world after a correction of the US markets
2018
Figure 9: Volatility tracked against European IPO values
Figure 10: Historical performance of major European market indices since January 2018
Market volatilityRelative stability in the markets has continued to support the performance of major European indices in H1 2019
Source: Thomson Reuters as at 28 June 2019
PwC | IPO Watch Europe Q2 2019 | 11

Pricing of top five IPOsFive mega-IPOs¹ priced across the Italian, London, Swiss, German and Swedish exchanges
Figure 11: Top five European IPOs in H1 2019
European PE trendsQ2 2019 saw a reversal of the prior trend with the highest PE-backed IPO activity for over a year, with values up 56% on Q2 2018
Figure 12: Quarterly value and volume of European PE backed IPOs since 2015
Nexi SpA Network International Holdings plc Stadler Rail AG Traton SE Trainline plc
Exchange Borsa Italiana London SIX Swiss Exchange Deutsche Börse; Nasdaq Stockholm London
Pricing date 12-Apr 10-Apr 12-Apr 27-Jun 21-Jun
Money raised (€m) 2,056 1,414 1,351 1,350 1,227
Price range €8.50 – €10.35 £3.95 – £4.65 CHF33 – CHF41 €27.00 – €33.00 £3.40 – £3.55
Offer price €9.00 £4.35 CHF38 €27.00 £3.50
Source: Dealogic
1 Mega-IPOs defined as raising in excess of €1bn
10.4 7.4 1.8 7.9 1.7 7.0 2.4 3.2 1.8 4.5 1.0 6.4 1.3 3.6 1.6
1.3 0.0
5.6
22 23
6
16
5
21
3
7
9
18
5
19
9 8
4 2 1
9
0
5
10
15
20
25
0
2
4
6
8
10
12
Q1 Q2 Q3 Q4 Q1 Q2 Q3 Q4 Q1 Q2 Q3 Q4 Q1 Q2 Q3 Q4 Q1 Q2
Vo
lum
e o
f IP
Os
Val
ue o
f IP
Os
€bn
Value €bn Volume of IPOs
2015 2016 2017 2018 2019
12 | IPO Watch Europe Q2 2019 | PwC

The sector storyThe mega-IPOs¹ of payments companies Nexi and Network International helped ensure Financials remained the largest sector, accounting for 43% of all H1 2019 IPOs by value
Figure 13: European IPO values by sector
By offering value (€m) Q1 2019 Q2 2019 H1 2019 H1 2018 Variance vs H1 2018
Financials 451 4,733 5,184 7,711 (2,527)
Industrials 33 2,958 2,991 3,326 (335)
Consumer Services 111 2,151 2,262 1,987 275
Health Care 94 635 729 5,184 (4,455)
Telecommunications – 604 604 70 534
Consumer Goods – 287 287 1,037 (750)
Technology 6 44 50 1,640 (1,590)
Oil & Gas – 27 27 453 (426)
Basic Materials – – – 921 (921)
Utilities – – – 419 (419)
Total 695 11,439 12,134 22,748 (10,614)
Industrials13 IPOs in H1 2019
€3.0bnLargest IPO
Stadler Rail AG
€1,351m
Financials13 IPOs in H1 2019
€5.2bnLargest IPO
Nexi SpA
€2,056m
Consumer Services9 IPOs in H1 2019
€2.3bnLargest IPO
Trainline plc
€1,227m
1 Mega-IPOs defined as raising in excess of €1bn
PwC | IPO Watch Europe Q2 2019 | 13

Global focus
14 | IPO Watch Europe Q2 2019 | PwC

Global money raised via IPOs With Silicon Valley backing, the United States takes the lead in terms of IPO activity, and accounts for almost half of global proceeds YTD
Figure 14: Global money raised via IPOs (ten year overview)
Figure 15: Top ten largest IPOs 2019YTD
Note: IPOs are classified as ‘In Range’ if the IPO is priced in the middle 50% of the price range. The top and bottom 25% are classified as ‘Top of Range’ and ‘Bottom of Range’.
Source: Dealogic, Bloomberg as of 30 June 2019
IPO
mo
ney
rais
ed &
# o
f d
eals
Value $bn IPOs
$299.1bn
$178.8bn$142.5bn
$195.6bn
$274.3bn
$206.9bn
$142.5bn
$208.9bn $223.6bn
$82.2bn
1,2581,041
728 8651,167 1,185
1,013
1,5221,196
456
2010 2011 2012 2013 2014 2015 2016 2017 2018 2019YTD
Source: Dealogic as of 30 June 2019
Pricing date
Issuer name Issuer country
Sector Exchange Filing range Offer price
Pricing Money raised
Free float
Secondary shares (%)
Performance
1-day 1-month Current
9-May-19 Uber Technologies
Consumer Services
NYSE 44.00 – 50.00 45.00 Bottom of range
$8.1bn 10.7% 0.0% (7.6%) (1.9%) 3.1%
16-May-19 Avantor Health Care NYSE 18.00 – 21.00 14.00 Below range
$3.3bn 44.6% 0.0% 3.6% 34.3% 36.4%
28-Mar-19 Lyft Consumer Services
NASDAQ 62.00 – 68.00 72.00 Above range
$2.6bn 12.4% 0.0% 8.7% (20.5%) (8.7%)
12-Apr-19 Nexi Industrials Borsa Italiana 8.50 – 10.35 9.00 In range $2.3bn 36.4% 65.2% (6.2%) (6.6%) 0.7%
17-Apr-19 Pinterest Technology NYSE 15.00 – 17.00 19.00 Above range
$1.6bn 16.3% 0.0% 28.4% 40.5% 43.3%
10-Apr-19 Network International
Industrials LSE 3.95 – 4.65 4.35 In range $1.6bn 56.0% 100.0% 14.9% 20.2% 36.3%
27-Jun-19 Traton Industrials Deutsche Börse, Nasdaq S’holm
27.00 – 33.00 27.00 Bottom of range
$1.5bn 10.0% 100.0% (2.0%) N/A (2.0%)
12-Apr-19 Stadler Rail Industrials SIX Swiss Exchange
33.00 – 41.00 38.00 In range $1.5bn 40.3% 100.0% 13.4% 10.6% 21.6%
21-Jun-19 Trainline Consumer Services
LSE 3.18 – 3.60 3.50 Top of range
$1.4bn 65.0% 88.4% 17.4% N/A 17.8%
3-Apr-19 Tradeweb Markets
Industrials NASDAQ 24.00 – 26.00 27.00 Above range
$1.2bn 20.7% 0.0% 32.6% 45.1% 62.3%
PwC | IPO Watch Europe Q2 2019 | 15

Appendix
16 | IPO Watch Europe Q2 2019 | PwC

Appendix 1: European IPOs by market
Q2 2018 Q3 2018 Q4 2018 Q1 2019 Q2 2019IPOs €m IPOs €m IPOs €m IPOs €m IPOs €m
Total
London Stock Exchange Group 28 3,948 22 2,040 24 4,397 5 591 19 6,616
London Stock Exchange 22 3,314 13 1,903 18 4,110 3 556 13 4,514
Borsa Italiana 6 634 9 137 6 287 2 35 6 2,102
SIX Swiss Exchange 3 1,026 1 1,503 – – – – 3 2,014
Nasdaq Nordic 18 2,235 1 14 10 237 3 35 10 1,860
Nasdaq Stockholm 9 677 1 14 6 167 2 29 8 1,848
Nasdaq Helsinki 3 595 – – 3 65 1 6 1 6
Nasdaq Copenhagen 3 494 – – 1 5 – – 1 6
Nasdaq Iceland 2 322 – – – – – – – –
Nasdaq Tallinn 1 147 – – – – – – – –
Deutsche Börse 6 514 1 17 3 4,016 – – 3 1,582
Oslo 1 86 2 71 – – 1 12 4 454
BME (Spanish Exchange) – – – – 2 200 – – 1 250
Wiener Börse – – – – – – 1 22 1 52
Warsaw 2 37 1 5 – – – – 1 8
Borsa Istanbul 3 460 – – – – – – 1 5
Euronext 9 1,253 5 86 5 1,321 2 35 – –
Euronext Brussels – – – – 1 575 1 27 – –
Euronext Paris 7 231 5 86 3 741 1 8 – –
Euronext Lisbon – – – – 1 5 – – – –
Euronext Amsterdam 1 947 – – – – – – – –
Euronext Dublin¹ 1 75 – – – – – – – –
Sofia 1 42 – – – – – – – –
Europe total 71 9,601 33 3,736 46 10,178 12 695 43 12,841
Europe total (excl. dual listings)²
69 9,213 33 3,736 46 10,178 12 695 41 11,439
Appendix – IPOs by market
1 Acquired by Euronext on 27 March 2018
² Dual listings in Q2 2019 comprised Frequentis AG (Wiener Börse and Deutsche Börse) and Traton SE (Deutsche Börse and Nasdaq Stockholm) (Q2 2018: Yew Grove REIT plc (Euronext Dublin and London AIM) and Arion Banki (Nasdaq Iceland and Nasdaq Stockholm)).
PwC | IPO Watch Europe Q2 2019 | 17

Q2 2018 Q3 2018 Q4 2018 Q1 2019 Q2 2019IPOs €m IPOs €m IPOs €m IPOs €m IPOs €m
EU-REGULATED
London – Main 6 2,191 9 1,785 12 4,002 2 532 8 4,292
Borsa Italiana – Main 2 440 – – 3 254 – – 2 2,076
SIX Swiss Exchange 3 1,026 1 1,503 – – – – 3 2,014
Nasdaq Nordic – Main 10 2,081 – – 3 120 1 21 4 1,784
Deutsche Börse – Prime and General Standard
6 514 1 17 3 4,016 – – 3 1,582
Oslo Børs & Oslo Axess 1 86 2 71 – – 1 12 4 454
Wiener Börse – – – – – – 1 22 1 52
Warsaw – Main 2 37 1 5 – – – – 1 8
Euronext 6 1,189 3 66 4 1,308 1 27 – –
Prague – – – – 1 1 – – – –
BME (Spanish Exchange) – Main – – – – 2 200 – – – –
Belgrade Stock Exchange – – – – 1 6 – – – –
Sofia 1 42 – – – – – – – –
EU-regulated sub-total 37 7,606 17 3,447 29 9,907 6 614 26 12,262
EXCHANGE-REGULATED
BME – Alternative – – – – – – – – 1 250
London – AIM 16 1,123 4 118 6 108 1 24 5 222
Nasdaq Nordic – First North 8 154 1 14 7 117 2 14 6 76
Borsa Italiana – AIM 4 194 9 137 3 33 2 35 4 26
Borsa Istanbul 3 460 – – – – – – 1 5
Euronext – Alternext 3 64 2 20 1 13 1 8 – –
Exchange-regulated sub-total 34 1,995 16 289 17 271 6 81 17 579
Europe total 71 9,601 33 3,736 46 10,178 12 695 43 12,841
Europe total (excl. dual listings)²
69 9,213 33 3,736 46 10,178 12 695 41 11,439
² Dual listings in Q2 2019 comprised Frequentis AG (Wiener Börse and Deutsche Börse) and Traton SE (Deutsche Börse and Nasdaq Stockholm) (Q2 2018: Yew Grove REIT plc (Euronext Dublin and London AIM) and Arion Banki (Nasdaq Iceland and Nasdaq Stockholm)).
18 | IPO Watch Europe Q2 2019 | PwC

PwC | IPO Watch Europe Q2 2019 | 19

ContactsPeter Whelan
M: +44 (0)7770 977937 E: [email protected]
Roslyn Gamsa
M: +44 (0)7789 298590 E: [email protected]
This content is for general information purposes only, and should not be used as a substitute for consultation with professional advisors.
© 2019 PricewaterhouseCoopers LLP. All rights reserved. PwC refers to the UK member firm, and may sometimes refer to the PwC network. Each member firm is a separate legal entity. Please see www.pwc.com/structure for further details.
190628-165049-NF-OS
About IPO Watch Europe
About IPO Watch Europe
IPO Watch Europe surveys all new primary market equity IPOs on Europe’s principal stock markets and market segments (including exchanges in Austria, Belgium, Bulgaria, Croatia, Denmark, Estonia, Finland, France, Germany, Greece, Hungary, Iceland, Ireland, Italy, Latvia, Lithuania, Luxembourg, the Netherlands, Norway, Poland, Portugal, Romania, Serbia, Spain, Sweden, Switzerland, Turkey and the UK) on a quarterly basis. Movements between markets on the same exchange are excluded.
The data in this report is based on data extracted from Dealogic and includes greenshoe (if exercised). Only transactions with a minimum of $5 million money raised have been included. The data excludes PIPOs and transactions on Over-The-Counter exchanges. In case IPOs take place on two or more exchanges, the full amount of money raised is attributed to all exchanges. Industry classification is based on the FTSE Russell Industry Classification Benchmark (ICB).
This survey was conducted between 1 January and 28 June 2019 and IPOs based on their pricing date. All market data is sourced from Dealogic and has not been independently verified by PricewaterhouseCoopers LLP.
Basis of preparation for Global IPO Watch
Global IPO Watch analyses IPO and FO trends on a quarterly basis, both at a global and regional level. It is based on data extracted from Dealogic, whereby only transactions with a minimum of $5 million money raised have been included. Transaction proceeds include the overallotment option (if exercised). The data excludes PIPOs and transactions on Over-The-Counter exchanges. In case IPOs or FOs take place on two or more exchanges, the full amount of money raised is attributed to all exchanges. If a transaction is executed in two or more regions, the money raised is also attributed to all regions. Industry classification is based on the FTSE Russell Industry Classification Benchmark. Index performance is based on pricing data extracted from Bloomberg.
Executing a successful IPO is typically the culmination of a complex process, whatever market you list on. From strategy, accounting, reporting, financial systems, governance, adviser selection, marketing process, media and investor relations, to treasure and financial risk management, legal, tax, HR, technology – every piece of the puzzle must be in place, and connected before you proceed.
Planning and good preparation are crucial to a successful IPO, regardless of the market or stock exchange. PwC’s dedicated team of capital markets professionals are here to help and make the task at hand an easier experience for you. We have deep experience and knowledge of the rules and regulations governing all major capital markets—and a successful history of working on both international and domestic IPOs.
Find out more at www.pwc.co.uk/capitalmarkets