Global Invested Capital Market - Aon · Market February 2014 ... Investors need only adjust the mix...
17
Aon Hewitt Retirement and Investment Risk. Reinsurance. Human Resources. Global Invested Capital Market February 2014 Investment advice and consulting services provided by Aon Hewitt Investment Consulting, Inc., an Aon Company.
Transcript of Global Invested Capital Market - Aon · Market February 2014 ... Investors need only adjust the mix...

Aon Hewitt Retirement and Investment
Risk. Reinsurance. Human Resources.
Global Invested Capital Market February 2014
Investment advice and consulting services provided by Aon Hewitt Investment Consulting, Inc., an Aon Company.

Aon Hewitt Retirement and Investment
Investment advice and consulting services provided by Aon Hewitt Investment Consulting, Inc., an Aon Company. Global Invested Capital Market 1
Global Invested Capital Market
Key Points The concept of a market portfolio plays an important role in many financial theories and models
Knowledge of each asset’s share of the invested capital markets is both useful information and a good starting point for investors considering the appropriate allocation to the asset
We estimate, primarily using established market indices, the total size of the global invested capital market to be USD $101.1 trillion at the end of June 30, 2013
We also illustrate the historical growth and composition of global invested capital markets since 2004
Introduction The concept of a market portfolio plays an important role in many financial theories and models, including the capital asset pricing model (CAPM). CAPM theory states that the market portfolio (a portfolio that includes all risky assets in proportion to their relative market value) is the ideal portfolio of risky assets for every investor. Investors need only adjust the mix of risk-free assets and the market portfolio in accordance with their own risk tolerance. That is, in theory, the market portfolio is the optimal portfolio (in terms of risk-return trade-off) of risky assets and should be the portfolio of choice for a truly passive investor1. In reality, investors actively choose allocations that deviate from the market portfolio based on their views and/or circumstances (e.g., risk tolerance, liquidity preferences, time horizons, active management views).
We generally believe that the market portfolio is the best choice, barring a view driven by information/insight superior to everyone else’s, or a substantial difference in an investor’s risk tolerance and/or other circumstances2. As such, the knowledge of each asset’s share of the invested capital markets is both useful information and a good starting point for investors considering the appropriate allocation to the asset. This identification of the value of existing assets and the market’s aggregate portfolio allocation is important to bear in mind when formulating investment policy for any asset class. Information about the market portfolio therefore:
Describes the aggregate portfolio of all investors
Describes the investment opportunity set
Can serve as a neutral or starting point when establishing long-term asset allocation policies based on circumstances and objectives (e.g., risk, liquidity, time horizon), or views driven by information better than everyone else’s (e.g., long-term capital market forecasts, medium-term views)
Can serve as a benchmark for strategic asset allocationTo make a bulleted list that follows the template format, select some text to start the list. Apply the style “Aon Bullet 1” to the first level bullet, then use tabs, styles, or increase/decrease indent buttons to create the rest of the bullets. There are 5 pre-defined bullet levels built into this style sheet.
1 This does not imply that the market portfolio has been the optimal portfolio in practice. Asness, Frazzini and Pedersen (2012)
indicate that assuming leverage aversion, the tangency portfolio formed on the idea of risk parity between asset classes leads to a higher risk-adjusted return than the market portfolio. 2 The less desirable aspect is basing the return-seeking/risk-reducing (stock/bond) allocations on the market allocations. We believe
that these should be customized to each investor's circumstances and/or objectives.
Aon Hewitt Retirement and Investment
Investment advice and consulting services provided by Aon Hewitt Investment Consulting, Inc., an Aon Company. Global Invested Capital Market 2
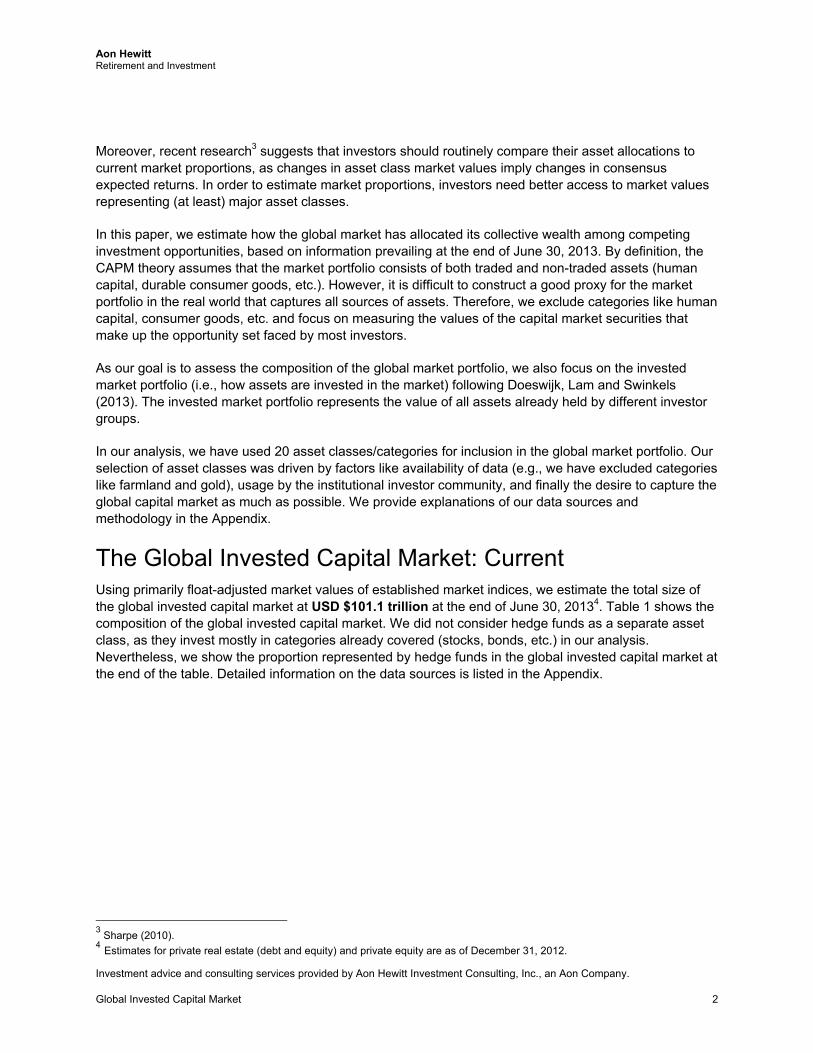
Moreover, recent research3 suggests that investors should routinely compare their asset allocations to current market proportions, as changes in asset class market values imply changes in consensus expected returns. In order to estimate market proportions, investors need better access to market values representing (at least) major asset classes.
In this paper, we estimate how the global market has allocated its collective wealth among competing investment opportunities, based on information prevailing at the end of June 30, 2013. By definition, the CAPM theory assumes that the market portfolio consists of both traded and non-traded assets (human capital, durable consumer goods, etc.). However, it is difficult to construct a good proxy for the market portfolio in the real world that captures all sources of assets. Therefore, we exclude categories like human capital, consumer goods, etc. and focus on measuring the values of the capital market securities that make up the opportunity set faced by most investors.
As our goal is to assess the composition of the global market portfolio, we also focus on the invested market portfolio (i.e., how assets are invested in the market) following Doeswijk, Lam and Swinkels (2013). The invested market portfolio represents the value of all assets already held by different investor groups.
In our analysis, we have used 20 asset classes/categories for inclusion in the global market portfolio. Our selection of asset classes was driven by factors like availability of data (e.g., we have excluded categories like farmland and gold), usage by the institutional investor community, and finally the desire to capture the global capital market as much as possible. We provide explanations of our data sources and methodology in the Appendix.
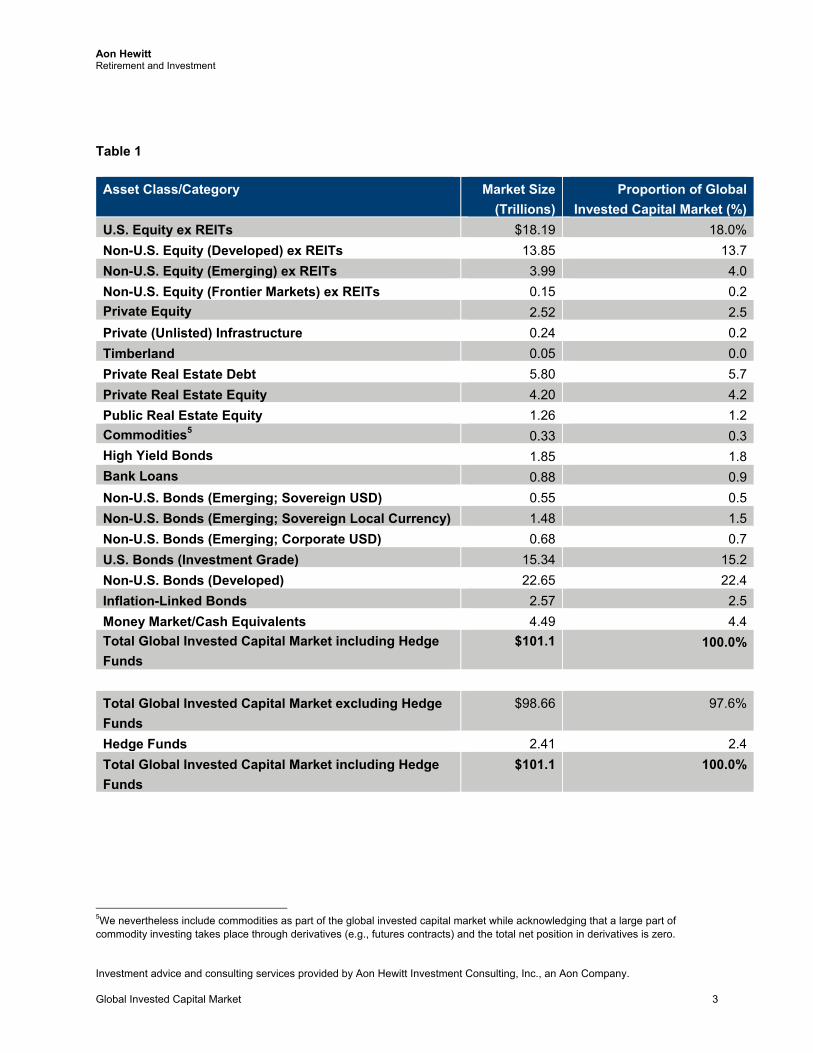
The Global Invested Capital Market: Current Using primarily float-adjusted market values of established market indices, we estimate the total size of the global invested capital market at USD $101.1 trillion at the end of June 30, 20134. Table 1 shows the composition of the global invested capital market. We did not consider hedge funds as a separate asset class, as they invest mostly in categories already covered (stocks, bonds, etc.) in our analysis. Nevertheless, we show the proportion represented by hedge funds in the global invested capital market at the end of the table. Detailed information on the data sources is listed in the Appendix.
3 Sharpe (2010).
4 Estimates for private real estate (debt and equity) and private equity are as of December 31, 2012.
Aon Hewitt Retirement and Investment
Investment advice and consulting services provided by Aon Hewitt Investment Consulting, Inc., an Aon Company. Global Invested Capital Market 3
Table 1
Asset Class/Category Market Size
(Trillions)
Proportion of Global
Invested Capital Market (%)
U.S. Equity ex REITs $18.19 18.0%
Non-U.S. Equity (Developed) ex REITs 13.85 13.7
Non-U.S. Equity (Emerging) ex REITs 3.99 4.0
Non-U.S. Equity (Frontier Markets) ex REITs 0.15 0.2
Private Equity 2.52 2.5
Private (Unlisted) Infrastructure 0.24 0.2
Timberland 0.05 0.0
Private Real Estate Debt 5.80 5.7
Private Real Estate Equity 4.20 4.2
Public Real Estate Equity 1.26 1.2
Commodities5 0.33 0.3
High Yield Bonds 1.85 1.8
Bank Loans 0.88 0.9
Non-U.S. Bonds (Emerging; Sovereign USD) 0.55 0.5
Non-U.S. Bonds (Emerging; Sovereign Local Currency) 1.48 1.5
Non-U.S. Bonds (Emerging; Corporate USD) 0.68 0.7
U.S. Bonds (Investment Grade) 15.34 15.2
Non-U.S. Bonds (Developed) 22.65 22.4
Inflation-Linked Bonds 2.57 2.5
Money Market/Cash Equivalents 4.49 4.4
Total Global Invested Capital Market including Hedge
Funds
$101.1 100.0%
Total Global Invested Capital Market excluding Hedge
Funds
$98.66 97.6%
Hedge Funds 2.41 2.4
Total Global Invested Capital Market including Hedge
Funds
$101.1 100.0%
5We nevertheless include commodities as part of the global invested capital market while acknowledging that a large part of commodity investing takes place through derivatives (e.g., futures contracts) and the total net position in derivatives is zero.

Aon Hewitt Retirement and Investment
Investment advice and consulting services provided by Aon Hewitt Investment Consulting, Inc., an Aon Company. Global Invested Capital Market 4
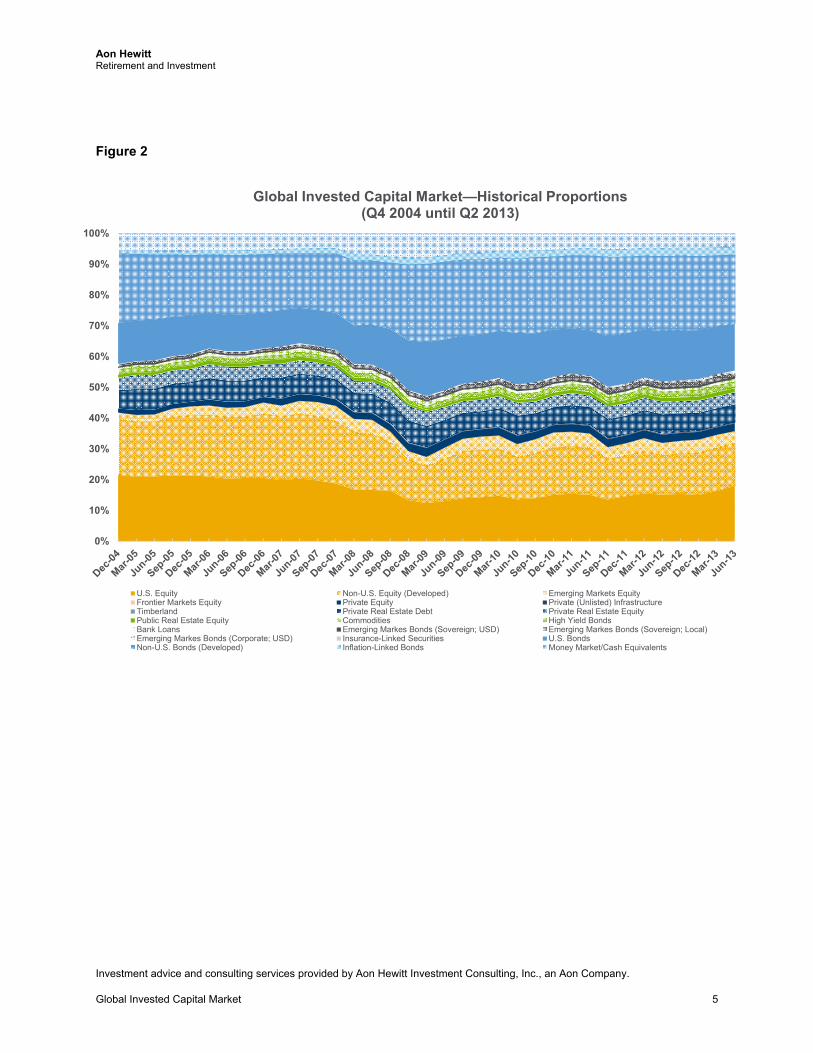
The Global Invested Capital Market: History Figures 1 and 2 below illustrate the historical growth and composition of the global invested capital market since the fourth quarter 2004, the earliest date that we could obtain reliable data for all the asset classes used in our analysis. The size of the global invested capital market grew from $61.4 trillion in 2004 to $101.1 trillion by the end of the second quarter 2013. The credit crisis of 2008–09 led to big declines in equity assets (with offsetting increases in asset values of U.S. bonds and non-U.S. bonds). Since then, equities have performed well, and this resulted in the current composition of the global invested capital market being roughly similar to the composition back in 2004.
Figure 1
Aon Hewitt Retirement and Investment
Investment advice and consulting services provided by Aon Hewitt Investment Consulting, Inc., an Aon Company. Global Invested Capital Market 5
Figure 2
0%
10%
20%
30%
40%
50%
60%
70%
80%
90%
100%
Global Invested Capital Market—Historical Proportions(Q4 2004 until Q2 2013)
U.S. Equity Non-U.S. Equity (Developed) Emerging Markets EquityFrontier Markets Equity Private Equity Private (Unlisted) InfrastructureTimberland Private Real Estate Debt Private Real Estate EquityPublic Real Estate Equity Commodities High Yield BondsBank Loans Emerging Markes Bonds (Sovereign; USD) Emerging Markes Bonds (Sovereign; Local)Emerging Markes Bonds (Corporate; USD) Insurance-Linked Securities U.S. BondsNon-U.S. Bonds (Developed) Inflation-Linked Bonds Money Market/Cash Equivalents

Aon Hewitt Retirement and Investment
Investment advice and consulting services provided by Aon Hewitt Investment Consulting, Inc., an Aon Company. Global Invested Capital Market 6
Asset Class Classifications and Structures As the number and type of asset classes/categories available for investment have evolved, different classification schemes or categories have proliferated. Among the popular ones are growth-oriented assets, diversifying assets, alternatives and real assets. While the framework used for asset classification varies by investor, common approaches to classifying (or grouping) assets include asset class roles and economic risk exposures, among others.
Investors then structure or allocate among various assets within those groupings based on factors such as their investment beliefs, asset class return and risk expectations, asset class size/opportunity set and liquidity preferences. We believe it is important to bear in mind the market share of an asset class when making allocations to various assets or structuring portfolios. As an example, U.S. institutional investors typically display a significant home bias6 within their public equity component. Table 2 shows the dollar-weighted asset mix of equities within institutional investor portfolios7 and compares it to the global market capitalizations of equities as of June 30, 2013.
Table 2
Corporate Public Funds Endowments and
Foundations
Market
Composition
U.S. Equity 63.9% 59.0% 55.5% 50.3%
Non-U.S. Equity 36.1 41.0 44.5 49.7
Total Public Equity 100.0% 100.0% 100.0% 100.0%
In the absence of a view on a particular market (U.S. or non-U.S.), we generally recommend our clients have a neutral market weight allocation to U.S. and non-U.S. equities within their public equity component.
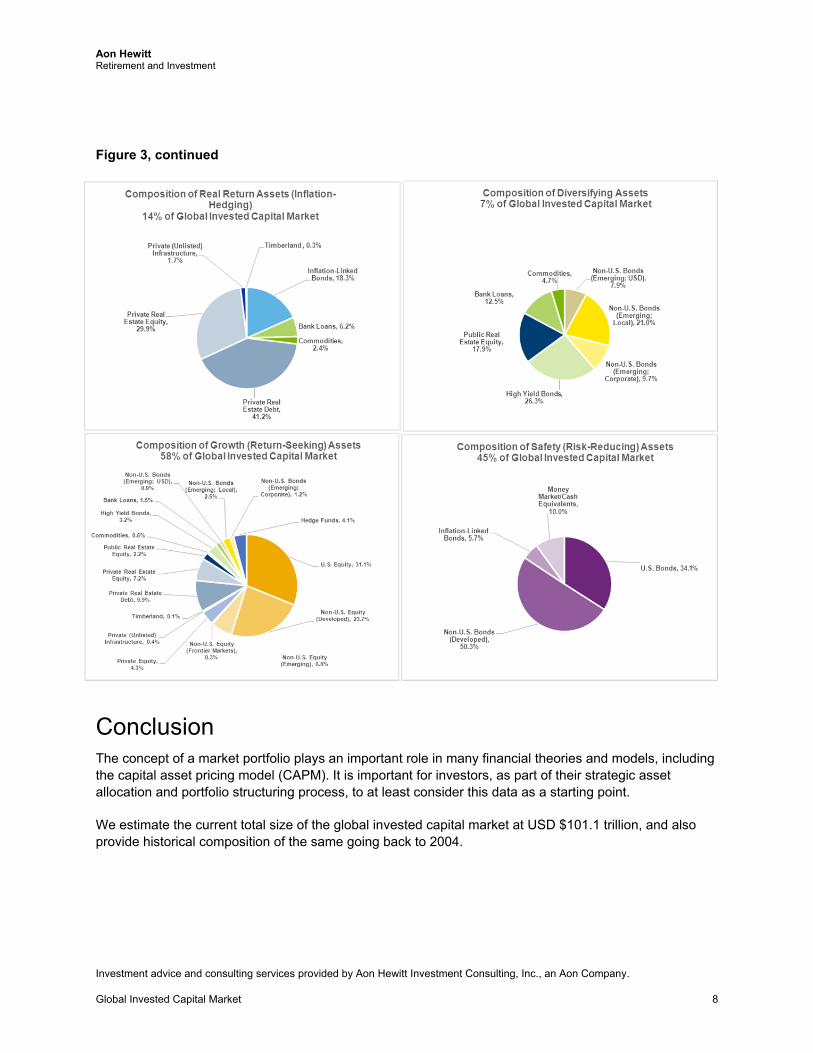
Based on global invested capital market data, Figure 3 shows current market proportions of various classification schemes described above. Please note that this is simply based on our mapping8 of various assets into those classification schemes. Investors can follow alternative mappings based on data shown in Table 1.
6 We note, however, that the equity home bias trend has been declining in recent years. 7 Greenwich Associates 2013 Market Trends Report. 8 We have included hedge funds in some of the classification schemes. While we recognize that double-counting takes place, it is impossible to estimate or correct for this.

Aon Hewitt Retirement and Investment
Investment advice and consulting services provided by Aon Hewitt Investment Consulting, Inc., an Aon Company. Global Invested Capital Market 7
Figure 3
Aon Hewitt Retirement and Investment
Investment advice and consulting services provided by Aon Hewitt Investment Consulting, Inc., an Aon Company. Global Invested Capital Market 8
Figure 3, continued
Conclusion The concept of a market portfolio plays an important role in many financial theories and models, including the capital asset pricing model (CAPM). It is important for investors, as part of their strategic asset allocation and portfolio structuring process, to at least consider this data as a starting point.
We estimate the current total size of the global invested capital market at USD $101.1 trillion, and also provide historical composition of the same going back to 2004.

Aon Hewitt Retirement and Investment
Investment advice and consulting services provided by Aon Hewitt Investment Consulting, Inc., an Aon Company. Global Invested Capital Market 9
Appendix Data Sources and Methodology
Below we discuss our current data sources and the methodology that we use to arrive at our estimates of the global invested capital market. As data sources improve in quality and scope, we will continue to refine and make changes to our process. For publicly traded asset classes (e.g., stocks, bonds), we have mainly relied on the float-adjusted market capitalizations of the broadest available index proxy for the respective asset class. For alternative investment categories (e.g., private real estate, private equity), we have used estimates from third-party research providers and/or money management firms. All estimates are quoted in U.S. dollars.
Domestic (U.S.) Equities
We use the float-adjusted market capitalization of the Dow Jones U.S. Total Stock Market Index, and then subtract the weight of REITs to avoid double-counting since we include publicly listed real estate equity as a separate category in the global invested capital market. The index, with 3,612 constituents9, measures all U.S. equity securities that have readily available prices and is the broadest measure of the aggregate domestic stock market. (Data source: S&P Dow Jones Indices)
Non-U.S. Equities (Developed Markets)
Starting in September 2006, we began using the float-adjusted market capitalization of the MSCI World ex-U.S. investable market index (IMI), from which we subtract the weight of REITs. Prior to that, we used the full market capitalization of the index and included REITs. The index captures large, mid and small cap representation across 23 of 24 developed countries excluding the United States. With 3,376 constituents10, the index covers approximately 99% of the free float-adjusted market capitalization in each country. (Data source: MSCI)
Non-U.S. Equities (Emerging Markets)
Starting in September 2006, we began using the float-adjusted market capitalization of the MSCI Emerging Markets investable market index (IMI), from which we subtract the weight of REITs. Prior to that, we used the full market capitalization of the index and included REITs. The index captures large, mid and small cap representation across 21 emerging market countries. With 2,596 constituents11, the index covers approximately 99% of the free float-adjusted market capitalization in each country. (Data source: MSCI)
Non-U.S. Equities (Frontier Markets)
Starting in December 2010, we began using the float-adjusted market capitalization of the MSCI Frontier Markets investable market index (IMI). Prior to that, we used the market capitalization of the MSCI Frontier Markets standard index. There are currently no REITs in the MSCI Frontier Markets investable market index. The Frontier Markets IMI captures large, mid and small cap representation across 25
9 As of October 31, 2013. 10 As of October 31, 2013. 11 As of October 31, 2013.

Aon Hewitt Retirement and Investment
Investment advice and consulting services provided by Aon Hewitt Investment Consulting, Inc., an Aon Company. Global Invested Capital Market 10
frontier markets countries. The index includes 376 constituents 12 covering about 99% of the free float-adjusted market capitalization in each country. (Data source: MSCI)
U.S. Bonds (Investment Grade)
Starting in September 2009, we began using the float-adjusted market capitalization of the Barclays U.S. Aggregate Bond Index. Prior to that, we used the full market capitalization of the index. The index represents securities that are SEC-registered, taxable and dollar-denominated. The index covers the U.S. investment-grade fixed-rate bond market, with index components for government and corporate securities, mortgage pass-through securities and asset-backed securities. (Data source: Barclays Capital)
Non-U.S. Bonds (Developed)
Starting in September 2009, we began using the float-adjusted market capitalization of the Barclays Global Aggregate ex-USD Index. Prior to that, we used the full market capitalization of the index. The Barclays Global Aggregate Index provides a broad-based measure of the global investment-grade fixed income markets. We use the ex-USD version of this index, which has the same constituents as the standard global aggregate index but excludes the U.S. dollar-denominated components. (Data source: Barclays Capital)
Non-U.S. Bonds (Emerging)
Sovereign External/USD Denominated: We use the market capitalization of the JP Morgan Emerging Markets Bond Index Global (EMBI Global). The index tracks total returns for traded external debt instruments in the emerging markets, and is an expanded version of the JP Morgan Emerging Markets Bond Index Plus (EMBI+). As with the EMBI+, the EMBI Global includes U.S. dollar-denominated Brady bonds, loans and Eurobonds with an outstanding face value of at least $500 million. It covers more of the eligible instruments than the EMBI+ by relaxing somewhat the strict EMBI+ limits on secondary market trading liquidity. (Data source: JP Morgan)
Sovereign Local Currency Denominated: We use the market capitalization of the JP Morgan Government Bond Index-Emerging Markets Global (GBI-EM Global), which is part of JP Morgan’s suite of comprehensive emerging market debt benchmarks that track local currency bonds issued by emerging market governments. GBI-EM Global is an investable benchmark that includes only those countries that are directly accessible by most of the international investor base. The index excludes countries with explicit capital controls, but does not factor in regulatory/tax hurdles in assessing eligibility. The index is classified as the most investable among JP Morgan’s suite of local currency emerging market debt benchmarks and includes all GBI-EM countries except China and India. (Data source: JP Morgan)
Corporate External/USD Denominated: We use the market capitalization of the JP Morgan Corporate Emerging Markets Bond Index Broad (CEMBI Broad). The index is part of JP Morgan’s Corporate Emerging Market Bond Index series, which tracks US dollar-denominated debt issued by emerging market corporations. The CEMBI Broad is more comprehensive and includes smaller issues by covering a wider array of corporate bonds. (Data source: JP Morgan)
12 As of October 31, 2013.
Aon Hewitt Retirement and Investment
Investment advice and consulting services provided by Aon Hewitt Investment Consulting, Inc., an Aon Company. Global Invested Capital Market 11
Inflation-Linked Bonds
Starting in March 2006, we began using the market capitalization of the Barclays Universal Government Inflation-Linked Bond (UGILB) Index. The index is intended to be a single broad measure of the major developed and emerging government inflation-linked bond markets, combining primarily their flagship World Government (WGILB) and EM Government (EMGILB) inflation-linked bond indices. The index includes government debt only (i.e., direct obligations of the state issuer); quasi-government and corporate debt is not included in the index. Prior to 2006, we used the market capitalization of the Barclays Global Inflation-Linked Index (Series-L). This index is the legacy version from Lehman Brothers and represents the global inflation-linked bond market. (Data source: Barclays Capital)
Money Market/Cash Equivalents
This measure is based on worldwide mutual fund assets in money market funds. The data is obtained from Investment Company Institute’s (ICI Global) quarterly Worldwide Mutual Fund Market Assets and Flows report13. (Data source: Investment Company Institute [ICI])
High Yield Bonds
We use the market capitalization of the Barclays Global High Yield Bond Index. The index provides a broad-based measure of the global fixed rate, non-investment grade (high yield) debt of companies in the U.S., developed markets and emerging markets. (Data source: Barclays Capital)
Public (Listed) Real Estate Equity
We use the free-float adjusted market capitalization of the S&P Global Property Index. The index defines and measures the investable universe of publicly traded property companies domiciled in developed and emerging market countries. The index contains more than 500 property companies trading in 36 countries, and is market-capitalization weighted. The index is composed of stocks of publicly traded equity real estate investment trusts (REITs) and real estate operating companies (REOCs). (Data source: S&P Dow Jones Indices)
Bank Loans
We use institutional leveraged loan, market-size data from Credit Suisse14. The data is aggregated for the U.S. and Western Europe. The U.S. institutional data (this is a subset of the overall U.S. leveraged loan market size) includes US dollar-denominated, non-investment grade fully drawn institutional term loans. The Western European institutional data (this is a subset of the overall Western European leveraged loan market size) includes non-investment grade fully drawn institutional term loans of issuers with assets located in or revenues derived from Western Europe, or loans denominated in a Western European currency. (Data source: Credit Suisse)
13 http://www.iciglobal.org/iciglobal/stats/worldwide/ci.ww_06_13.global. 14 Credit Suisse Leveraged Finance Strategy Monthly publication.

Aon Hewitt Retirement and Investment
Investment advice and consulting services provided by Aon Hewitt Investment Consulting, Inc., an Aon Company. Global Invested Capital Market 12
Commodities
This measure is based on the total (institutional and retail) commodity assets-under-management data from Barclays Capital15. The data is aggregated by combining three categories: commodity index investments (index swaps), commodity exchange-traded products (ETPs) and commodity medium term-notes (MTNs). (Data source: Barclays Capital)
Private Real Estate
The 2012 year-end data was obtained from the Money into Property Global 2013 publication from DTZ Research16. Their publication focuses on the commercial real estate market and reports global invested capital across four quadrants of the real estate market: public equity, public debt, private equity and private debt. As we are concerned with private real estate, we use only the data on private equity and private debt categories to arrive at our estimate for global private real estate. We exclude public equity real estate to avoid double-counting because we include publicly listed real estate equity as a separate category in the global invested capital market. We also exclude public real estate debt (e.g., CMBS) as they are typically considered part of the fixed income asset class and are mostly captured in our estimates for the same (although we show this separately as part of the composition of the real estate figure). Prior to 2012, we estimated private real estate data using quarterly returns from the IPD Global Composite Index. (Data source: DTZ Research, Investment Property Databank [IPD is a subsidiary of MSCI])
Private Equity
This is based on total private equity assets under management (AUM) data from Preqin17. Preqin defines AUM of a private equity firm as “the sum of all uncalled commitments (dry powder) and the (unrealized) market value of the remaining companies in its portfolio.” Preqin reports this data across the following fund types: buyouts, venture capital, distressed private equity, growth, mezzanine, real estate, infrastructure and other. Our estimate of global private equity is the aggregation of data across various fund types excluding real estate and infrastructure18. We exclude real estate and infrastructure because we already include them as separate categories in our analysis. (Data source: Preqin)
Private (Unlisted) Infrastructure
Global listed infrastructure (public) is already included in our estimates of public equity markets. Here, we focus on unlisted infrastructure assets. This is based on total infrastructure assets under management (AUM) data from Preqin19. Preqin defines AUM as “the sum of all uncalled commitments (dry powder) and the (unrealized) market value of the remaining companies.” (Data source: Preqin)
15 Barclays Capital Commodities Research (The Commodity Investor publication). 16 http://www.dtz.lt/uus/failid/File/DTZ+Money+into+Property+2013+Global.pdf. 17
Illustrative report: https://www.preqin.com/docs/quarterly/PE/Private_Equity_Quarterly_Q3_2012.pdf. 18 We had access to historical data on dry powder and unrealized market value for total private equity assets under management. We also had access to historical data on dry powder by fund type (buyouts, venture capital, etc.). However, we didn’t have access to historical data by fund type on unrealized market value. Therefore, in order to estimate the yearly global private equity excluding real estate and infrastructure categories, we first calculated the proportion of dry powder values excluding real estate and infrastructure (as a percentage of total dry powder across all fund types), and then assumed that the same proportion applied to unrealized market values. 19 Illustrative report: https://www.preqin.com/docs/samples/Preqin_Global_Infrastructure_Report_2012_Sample_Pages.pdf.
Aon Hewitt Retirement and Investment
Investment advice and consulting services provided by Aon Hewitt Investment Consulting, Inc., an Aon Company. Global Invested Capital Market 13
Timberland
Our estimate of global timberland investments is based on data provided by Forest Investment Associates (FIA)20. FIA tracks assets under management by U.S.-based timber investment management organizations (TIMOs) that make investments both in U.S. and international markets. FIA estimates this data from its own internal research on transactions, reported market values, historical data and conversations with other market participants. (Data source: Forest Investment Associates)
Hedge Funds
This measure is based on estimated assets under management data from Hedge Fund Research21. The firm compiles total capital invested in the global hedge fund industry on a quarterly basis as part of its Global Hedge Fund Industry Report. (Data source: Hedge Fund Research, Inc. [HFR])
20 http://www.forestinvest.com/. 21 HFR Global Hedge Fund Industry Report https://www.hedgefundresearch.com/index.php?fuse=products-irglo.
Aon Hewitt Retirement and Investment
Investment advice and consulting services provided by Aon Hewitt Investment Consulting, Inc., an Aon Company. Global Invested Capital Market 14
References Asness, Clifford S., Frazzini, Andrea and Pedersen, Lasse H. “Leverage Aversion and Risk Parity,” Financial Analysts Journal (January/February 2012). Also available at SSRN: http://papers.ssrn.com/sol3/papers.cfm?abstract_id=1990493
Doeswijk, Ronald Q., Lam, Trevin W. and Swinkels, Laurens. Strategic Asset Allocation: The Global Multi-Asset Market Portfolio 1959–2012 (November 2013). Also available at SSRN: http://papers.ssrn.com/sol3/papers.cfm?abstract_id=2352932
Ennis, Richard M., “Parsimonious Asset Allocation,” Editor’s Corner, Financial Analysts Journal (May/June 2009).
Sharpe, William F., “Adaptive Asset Allocation Policies,” Financial Analysts Journal (May/June 2010). Also available at SSRN: http://papers.ssrn.com/sol3/papers.cfm?abstract_id=1615459

Aon Hewitt Retirement and Investment
Investment advice and consulting services provided by Aon Hewitt Investment Consulting, Inc., an Aon Company. Global Invested Capital Market 15
Contact Information
Sudhakar Attaluri Senior Consultant Aon Hewitt Investment Consulting, Inc. +1.312.381.1821 [email protected]
Aon Hewitt Retirement and Investment
Investment advice and consulting services provided by Aon Hewitt Investment Consulting, Inc., an Aon Company. Global Invested Capital Market 16
About Aon Hewitt Investment Consulting, Inc.
Aon Hewitt Investment Consulting, Inc., an Aon plc company (NYSE:AON), is an SEC-registered investment adviser. We provide independent, innovative solutions to address the complex challenges of over 480 clients in North America with total client assets of approximately $1.7 trillion as of June 30, 2014. More than 270 investment consulting professionals in the U.S. advise institutional investors such as corporations, public organizations, union associations, health systems, endowments, and foundations with investments ranging from $3 million to $310 billion.
About Aon Hewitt
Aon Hewitt empowers organizations and individuals to secure a better future through innovative talent, retirement and health solutions. We advise, design and execute a wide range of solutions that enable clients to cultivate talent to drive organizational and personal performance and growth, navigate retirement risk while providing new levels of financial security, and redefine health solutions for greater choice, affordability and wellness. Aon Hewitt is the global leader in human resource solutions, with over 30,000 professionals in 90 countries serving more than 20,000 clients worldwide. For more information, please visit aonhewitt.com.
© Aon plc 2014. All rights reserved. Investment advice and consulting services provided by Aon Hewitt Investment Consulting, Inc. This document is intended for general information purposes only and should not be construed as advice or opinions on any specific facts or circumstances. The comments in this summary are based upon Aon Hewitt Investment Consulting’s preliminary analysis of publicly available information. The content of this document is made available on an “as is” basis, without warranty of any kind. Aon Hewitt Investment Consulting disclaims any legal liability to any person or organization for loss or damage caused by or resulting from any reliance placed on that content. Aon Hewitt Investment Consulting reserves all rights to the content of this document.