
Global Integration in Primary Equity Markets: The...
43
Global Integration in Primary Equity Markets: The Role of U.S. Banks and U.S. Investors ∗ Alexander P. Ljungqvist † Tim Jenkinson Stern School of Business Said Business School New York University Oxford University and CEPR and CEPR William J. Wilhelm, Jr. Carroll School of Management Boston College Abstract We examine the costs and benefits of the global integration of primary equity markets associated with the parallel diffusion of U.S. underwriting methods. We analyze both direct and indirect costs (associated with underpricing) using a unique dataset of 2,132 IPOs by non-U.S. issuers from 65 countries in 1992-1999. Bookbuilding typically costs twice as much as a fixed-price offer, but on its own, does not lead to lower underpricing. However, when conducted by U.S. banks and/or targeted at U.S. investors, bookbuilding can reduce underpricing significantly, relative to fixed-price offerings or bookbuilding efforts conducted by ‘local’ banks. These results are obtained after allowing for the endogeneity and interdependence of issuers’ choices. For the great majority of issuers, the gains associated with lower underpricing outweighed the additional costs associated with hiring U.S. banks or marketing in the U.S. This suggests a quality/price trade-off contrasting with the findings of Chen and Ritter [Journal of Finance 55, 2000], particularly since non-U.S. issuers raising US$20m-80m also typically pay a 7% spread when U.S. banks and investors are involved. Key words: Initial public offerings; bookbuilding; underwriting spreads; market integration. JEL classification: G32 Draft: 8 September 2000 ∗ We are grateful to Walid Busaba, François DeGeorge, Michel Habib, Robert Hansen, Josh Lerner, William Megginson, Clara Raposo, Jay Ritter, George Sofianos, and seminar participants at the WFA (Sun Valley) and EFA (LBS) meetings, the U.S. Securities and Exchange Commission, the NYSE/CEPR Conference on Primary Markets (Capri), the ABN-Amro IPO Conference (Amsterdam), New York University, HEC Paris, and the University of Arizona for helpful comments. Ljungqvist gratefully acknowledges financial support from the European Union (Training and Mobility of Researchers grant no. ERBFMRXCT960054) and an Oxford faculty research grant. † Corresponding author. Address: NYU Stern School of Business, # 9-190, 44 W 4 th Street, NY NY 10012-1126. Phone: 212-998 0304. Fax: 212-995 4233.E-mail: [email protected].
Transcript of Global Integration in Primary Equity Markets: The...

Global Integration in Primary Equity Markets:
The Role of U.S. Banks and U.S. Investors∗
Alexander P. Ljungqvist † Tim Jenkinson Stern School of Business Said Business School New York University Oxford University and CEPR and CEPR William J. Wilhelm, Jr. Carroll School of Management Boston College
Abstract
We examine the costs and benefits of the global integration of primary equity markets associated with the parallel diffusion of U.S. underwriting methods. We analyze both direct and indirect costs (associated with underpricing) using a unique dataset of 2,132 IPOs by non-U.S. issuers from 65 countries in 1992-1999. Bookbuilding typically costs twice as much as a fixed-price offer, but on its own, does not lead to lower underpricing. However, when conducted by U.S. banks and/or targeted at U.S. investors, bookbuilding can reduce underpricing significantly, relative to fixed-price offerings or bookbuilding efforts conducted by ‘local’ banks. These results are obtained after allowing for the endogeneity and interdependence of issuers’ choices. For the great majority of issuers, the gains associated with lower underpricing outweighed the additional costs associated with hiring U.S. banks or marketing in the U.S. This suggests a quality/price trade-off contrasting with the findings of Chen and Ritter [Journal of Finance 55, 2000], particularly since non-U.S. issuers raising US$20m-80m also typically pay a 7% spread when U.S. banks and investors are involved.
Key words: Initial public offerings; bookbuilding; underwriting spreads; market integration.
JEL classification: G32 Draft: 8 September 2000
∗ We are grateful to Walid Busaba, François DeGeorge, Michel Habib, Robert Hansen, Josh Lerner, William Megginson, Clara Raposo, Jay Ritter, George Sofianos, and seminar participants at the WFA (Sun Valley) and EFA (LBS) meetings, the U.S. Securities and Exchange Commission, the NYSE/CEPR Conference on Primary Markets (Capri), the ABN-Amro IPO Conference (Amsterdam), New York University, HEC Paris, and the University of Arizona for helpful comments. Ljungqvist gratefully acknowledges financial support from the European Union (Training and Mobility of Researchers grant no. ERBFMRXCT960054) and an Oxford faculty research grant. † Corresponding author. Address: NYU Stern School of Business, # 9-190, 44 W 4th Street, NY NY 10012-1126. Phone: 212-998 0304. Fax: 212-995 4233.E-mail: [email protected].

Global Integration in Primary Equity Markets: The Role of U.S. Banks and U.S. Investors
Abstract
We examine the costs and benefits of the global integration of primary equity markets associated with the
parallel diffusion of U.S. underwriting methods. We analyze both direct and indirect costs (associated
with underpricing) using a unique dataset of 2,132 IPOs by non-U.S. issuers from 65 countries in 1992-
1999. Bookbuilding typically costs twice as much as a fixed-price offer, but on its own, does not lead to
lower underpricing. However, when conducted by U.S. banks and/or targeted at U.S. investors,
bookbuilding can reduce underpricing significantly, relative to fixed-price offerings or bookbuilding
efforts conducted by ‘local’ banks. These results are obtained after allowing for the endogeneity and
interdependence of issuers’ choices. For the great majority of issuers, the gains associated with lower
underpricing outweighed the additional costs associated with hiring U.S. banks or marketing in the U.S.
This suggests a quality/price trade-off contrasting with the findings of Chen and Ritter [Journal of
Finance, 2000], particularly since non-U.S. issuers raising US$20m-80m also typically pay a 7% spread
when U.S. banks and investors are involved.

1
Traditionally, firms going public have engaged domestic banks to market their IPO to domestic investors. Both
tradition and regulatory guidelines caused share pricing and allocation practices to vary substantially from country to
country. In most countries, banks used fixed-price methods whereby shares were priced and then put up for
subscription. Alternatively, the bookbuilding approach long used by U.S. banks was perhaps the most prominent
example of a variety of practices that sought to assess market conditions before pricing the transaction. Although
these practices had the obvious attraction of conditioning the final issue price on market demand conditions, fixed-
price methods remained predominant outside the U.S. until the 1990s.1
Triggered in large part by a worldwide privatization movement that forced issuers to seek capital from beyond
domestic markets, international marketing efforts and non-domestic listings became commonplace and the
predominance of fixed-price marketing practices diminished. U.S. investment banks were perhaps the most
prominent catalysts for change as evidenced by the widespread adoption of bookbuilding practices as the default
IPO mechanism. Indeed, by July 1999 we estimate that about 80% of non-U.S. offerings were brought to market
using bookbuilding methods or some hybrid. In contrast to this enthusiastic reception abroad, U.S. banking practices
face increasing criticism at home for favoring institutional investors over retail investors and for the apparent
impunity with which they set fees for their services at 7% of gross proceeds; fees that some observers assert exceed
competitive levels.2
Against this backdrop, we examine the costs and benefits of the global integration of primary equity markets
associated with the parallel diffusion of U.S. underwriting methods. This requires consideration of both the direct
costs of conducting IPOs and the indirect costs associated with underpricing. We employ a unique dataset containing
2,132 initial public offerings in 65 non-U.S. markets during the period January 1992 – July 1999. The dataset
includes information on underwriting fees, initial returns, syndicate membership, and the markets in which shares
are sold and listed. The data permit a detailed examination of the consequences of international marketing, non-
domestic listing, the choice of marketing method and whether transactions are led by domestic banks or the U.S.
banks that pioneered the increasingly popular bookbuilding technology.
The direct costs of bookbuilding are, in our sample, around twice as high as in fixed-price offerings. U.S. banks
rarely participate in fixed-price offerings. When they lead a bookbuilding effort they charge an average premium of
2
75 basis points over domestic banks. This is true in spite of the fact that U.S. bank-led IPOs are many times
larger than those led by domestic banks. Once we control for economies of scale in underwriting, we find that U.S.
banks charge premia for helping firms list in the U.S. but not for marketing to U.S. investors. They also charge
premia, averaging 57 basis points, for IPOs that are neither listed nor marketed in the U.S. This raises the question
why issuers, who clearly have a choice between U.S. banks and local banks, should choose a more expensive
service. We investigate the hypothesis that higher direct costs reflect higher quality services. One dimension of the
quality of service is the accuracy with which IPOs are priced.
Perhaps surprisingly, the average underpricing associated with bookbuilding and fixed-price methods is
remarkably similar, at around 20%, though in Europe bookbuilt IPOs are in fact more underpriced than fixed-price
offerings. However, these simple averages do not control for such well-known influences on underpricing as ex ante
valuation uncertainty and ‘hot issue’ market conditions. Moreover, they do not control for the possibility that issuers
choose endogenously between different pricing and distribution methods on the basis of their characteristics.
Chemmanur (1993) suggests issuers can encourage IPO investors to ‘produce’ information about the firm’s value.
Benveniste and Spindt (1989) model bookbuilding as a mechanism designed to promote revelation of such
information, in return for preferential allocations of underpriced stock. Sherman and Titman (2000) model certain
design elements of bookbuilding (such as the size of the investor pool targeted) and link them to issuers’ ‘demand’
for information production. These models all suggest that sectors with high degrees of asymmetry of information,
such as IT or biotech, are more likely to benefit from the information production and revelation often associated with
bookbuilding.
Habib and Ljungqvist (2000) suggest another reason for taking seriously the potential endogeneity of the pricing
and distribution method. They argue that reductions in underpricing are worth more to the issuer’s owners at the
margin, the greater the issue size. As a consequence, we allow for endogeneity by estimating two-stage models that
relate issuer choice to industry sector and issue size, as well as control variables.
Finally, we investigate whether the identities of the bank conducting the bookbuilding effort and of the investors
targeted affect underpricing. In Benveniste and Spindt’s model, the success of bookbuilding depends on repeated
interactions between the underwriter and investors and on involving informed investors. This leads us to expect that

3
banks which have a higher expected IPO deal flow and which can access high-quality investors are likely
to extract more information during bookbuilding per unit of reward, reducing the degree of underpricing.
Our empirical results suggest that bookbuilding on its own does not lead to lower underpricing. However, when
used in combination with U.S. banks and U.S. investors, bookbuilding can reduce underpricing significantly, relative
to fixed-price offerings or bookbuilding efforts conducted by ‘local’ banks. This is consistent with our prediction:
because of their longer bookbuilding experience, U.S. banks are more likely to have access to key institutional
investors, and may be in a better position to reward investors dynamically for their information revelation.
Moreover, U.S. banks might implicitly ‘bundle’ non-U.S. IPOs with domestic IPOs in the very active U.S. IPO
market in ways that non-U.S. banks cannot, thus further strengthening their ability to induce investors to reveal
information.
The pricing benefits we estimate are large compared to the premia U.S. banks charge for their services. Our
results suggest that a switch towards a cheaper IPO strategy (replacing U.S. banks and not marketing to U.S.
investors) would have made 68% of issuers worse off, in the sense that the additional underpricing cost would have
exceeded the savings on the spread. The median switcher would have suffered a reduction in net proceeds of US$8.2
million. A switch towards a more expensive IPO strategy (including U.S. banks in bookbuildings not already
managed by U.S. banks), on the other hand, would have made 69% of issuers better off. This confirms our result that
bookbuilding per se does not reduce underpricing. What appears to matter more is the composition of the syndicate
and choice of target market.
Loughran, Ritter and Rydqvist (1994) offer a bird’s eye perspective on international differences in primary
markets by consolidating measures of average underpricing calculated in a large number of country-specific studies.
Although their ‘meta-analytic’ approach sheds some light on how initial returns vary conditional on whether
information is solicited prior to pricing and whether the underwriter maintains allocation discretion, it does not
control for firm-specific, industry-specific, and time-specific effects or the endogeneity of choices regarding the
syndicate structure and marketing practices. Thus our study is the first comprehensive and controlled analysis of
some key international differences in primary equity markets and provides insight into the likely consequences of
market integration. It thus complements Sherman’s (1999) descriptive account of different IPO mechanisms around
the world.

4
The study also complements recent research on the French experience with IPO auctions. Derrien and
Womack (2000) suggest that issuers are better served by the existing auction mechanism (Offre à Prix Minimal) than
by bookbuilding. Our findings are more nearly consistent with those of Biais and Faugeron-Crouzet (2000) who
identify strong parallels between bookbuilding and the French auction mechanism. In fact, our results suggest that to
whom and by whom the IPO is marketed probably has considerably more bearing on expected proceeds than subtle
differences in the degree of underwriter discretion like those that distinguish bookbuilding from the French auction
mechanism. This should be of interest to those involved in ongoing experiments with online securities auctions.
Stulz (1999) surveys the arguments why market liberalization and integration might reduce the cost of capital.
Improved corporate governance, better investor protection, higher disclosure requirements, and access to foreign
investment banks with the ability to certify the quality of a deal should lower the adverse selection and agency costs
of raising outside funds. At the same time, liquidity may increase and trading costs fall due to the greater size and
diversity of the shareholder base, a reduction in the opportunities for insider trading, or simply a listing on an
exchange with more efficient price discovery. Finally, greater competition amongst providers of underwriting
services should reduce the cost (or improve the quality) of fundraising.
Our focus on primary equity markets contributes a novel facet to the empirical side of this literature, which has
tended to focus on secondary-market integration. Notable examples are Henry (2000) on cost of capital changes in
response to the opening of emerging capital markets and the large literature on foreign listings in the U.S., including
the initiation of ADR programs, by firms already listed in their home market [see Karolyi (1998) for a survey]. In
relation to these secondary-market studies, we find much larger effects of market integration. But the premia issuers
pay for marketing in the U.S., and the substantial reductions in underpricing, are consistent with the predictions of
the globalization literature.
Finally, our analysis highlights two methodological concerns relevant to the controversy surrounding the
clustering of underwriting spreads around 7% in the U.S. Chen and Ritter (2000) appeal to the lower average spreads
for non-U.S. IPOs to bolster their argument that U.S. spreads are above competitive levels. The traditionally
widespread use of low (direct) cost, fixed-price methods has much to do with the low average spreads cited by Chen
and Ritter. But our results suggest that many issuing firms would have benefited on net from a higher direct-cost
bookbuilding effort that might have reduced the indirect cost of underpricing. Our analysis also suggests that

5
accounting for the endogeneity of the issuing firm’s choices regarding marketing methods is important in
establishing a link between spreads (price) and underpricing (quality) [see Habib and Ljungqvist (2000) for related
evidence from the U.S.]. Although they do not account for endogeneity, Chen and Ritter suggest that there is no such
link in the U.S.
The remainder of the paper is organized as follows. In the following section, we describe our data and sources. In
section 2 we consider the evidence on direct costs. Section 3 turns to the indirect costs associated with underpricing
and estimates the impact of the choices facing the firm – in particular, where to market the issue and whether to
include a U.S. bank – on underpricing. We also estimate a switching model to evaluate whether issuers’ chosen IPO
strategies were optimal. Section 4 contains our conclusions.
1. Sample and data
1.1. Sources and coverage
The sample is derived from Equityware, a database of international IPOs compiled by a subsidiary of Euromoney
Publications plc. The July 1999 CD-ROM contains a total of 2,497 equity offerings by non-U.S. issuers between
Jan. 1992 and July 1999. We exclude 56 cancelled and 4 postponed offerings. Of the remaining 2,437 IPOs, 87 turn
out not to be bona fide IPOs (having been traded previously, sometimes in another country), 176 are investment
trusts, 3 are preference shares offerings, and 39 lack after-market trading prices. The final sample consists of 2,132
IPOs by issuers from 65 countries.
The sample contains three types of offerings: companies going public on a domestic stock exchange only (1,588
companies, 74.5% of the sample); companies going public on a domestic and a foreign stock exchange (259
companies, 12.1% of the sample); and companies going public on a foreign stock exchange only (285 companies,
13.4% of the sample). Companies in the second category most often list at home and in the U.S. (186 of the 259
companies). Amongst the 285 companies that do not go public in their domestic market, 166 companies list only in
the U.S., 27 list in the U.S. and on another foreign market, and 92 list only on a non-U.S. foreign exchange, such as
EASDAQ or Germany’s Neuer Markt.
In the early sample years (1992-3), the sample consists entirely of foreign-only and domestic-and-foreign listings,
and is therefore incomplete.3 This reflects Equityware’s origins as a database of cross-border IPOs. Panel A of Table
6
1 reports Equityware’s coverage by geographic region (Europe, Asia-Pacific, North and South America,
Africa and the Middle East) and year. European IPOs comprise two-thirds of the sample and Asia-Pacific ones
nearly a quarter. Beginning in 1994, Equityware extended coverage beyond cross-border IPOs to domestic-only
offerings in East and West Europe, Latin America markets, Hong Kong and Singapore, and from 1997 onwards to
other Asian and African markets. Comprehensive coverage of Japanese domestic IPOs begins in 1998. Some notable
countries with large domestic IPO markets – such as India, Israel, Taiwan and Korea – are not covered. As a
consequence of Equityware’s coverage criteria, IPOs in the early sample years are likely to be larger than the local
average in many sample countries.4 Panel B of Table 1 confirms this: the median offer size drops from US$61
million in 1992 to US$32.6 million in 1999. Throughout the paper, we convert all currency amounts into U.S.
dollars using exchange rates on the pricing day.
We examine how comprehensive Equityware’s coverage is in countries for which it claims coverage, by studying
two markets in detail: Germany, and Singapore. From 1994 onwards, German coverage is extremely thorough, with
only the occasional small IPO on a regional over-the-counter market missing. In Singapore, Equityware captured all
but three firms that went public in Singapore, as well as capturing an additional IPO missing from a list of IPOs
provided by the Singapore Stock Exchange.5
In addition to information on the countries where sample firms obtained a listing, Equityware reports the
countries where each IPO was marketed. This feature allows us to investigate the effect of involving foreign (usually
institutional) investors, and in particular U.S. investors, in the bookbuilding process.6 We define IPOs as being
marketed in the U.S. when they are either S.E.C. registered, mention eligibility under Rule 144A, have a tranche
labeled ‘U.S. tranche’, or when they are to be listed on a U.S. exchange.
1.2 Initial returns
We obtain aftermarket prices from Equityware where available and manually fill gaps using Datastream and a
variety of news sources (Nexis-Lexis, Reuters Business Briefing, Bloomberg, Dow Jones, and the London Stock
Exchange’s Regulatory News Service). Where we convert between currencies, we use the exchange rate on the
relevant trading day. We measure initial returns over the first week rather than the first day of trading. We do so
partly because Equityware’s coverage of seven-day prices is far more comprehensive than its coverage of first-day

7
prices, and partly because some countries impose restrictions on daily price fluctuations, which delay the
emergence of an equilibrium price. In France and Japan, for instance, ‘circuit-breakers’ prevent post-IPO prices
rising by more than a certain percentage per day. In 62 cases, we could not find a seven-day price and instead used
the first-day close (27 cases) or the thirty-day price reported in Equityware (35 cases). As noted above, we excluded
39 IPOs for which aftermarket prices were unavailable.
We cross-checked all initial returns in excess of ±30% manually using Datastream and the aforementioned news
sources as well as data provided by national stock exchanges. In 12 cases Equityware’s data was clearly wrong,
typically as a result of offer prices and seven-day prices being recorded for a different number of shares (for example
where an ADS contains more than 1 share) or in different currencies. A small number of the Datastream-generated
initial returns turned out to be wrong as a result of partial-paid shares or misplaced decimal points.
1.3 Pricing methods
We distinguish between three principal pricing methods:
º fixed-price: where the offer price is set before the issue is marketed to investors;
º auction: where the offer price is set according to either a mandatory or a discretionary clearing rule but
allocations to bidders are non-discretionary, i.e. any two bidders with the same bid will receive the same
allocation of shares;
º bookbuilding: where the offer price is set after indications of interest are sought from investors, the investment
bank is not constrained by a mandatory price rule, and allocation decisions typically are discretionary.
Equityware does not explicitly identify the pricing method used. We manually identify the pricing method for
every offering in our sample using our set of news sources (Nexis-Lexis, Reuters Business Briefing, Bloomberg,
Dow Jones, and the London Stock Exchange’s Regulatory News Service) as well as information from national stock
markets and IPO prospectuses contained in Disclosure’s Global Access service and Ljungqvist’s (1997) database of
German IPOs. 7 Identifying auctions is relatively straightforward since there is little ambiguity in the country-
specific terminology used. In our sample, auctions are rarely used: only 35 IPOs were priced in auctions, 21 of
which were in France. This perhaps surprising result is partly due to the way our sample is constructed (e.g.
8
Equityware does not cover Japan during its ‘auction phase’ of 1989-1997), and partly to the increasing
world-wide popularity of bookbuilding, not only relative to fixed-price but also to auction offerings.
Identifying bookbuildings is slightly less straightforward than identifying auctions. In some countries, what is
regulated is the way securities are offered and distributed to investors, not the way they are priced. For instance, the
London Stock Exchange’s Yellow Book, which governs London listings, does not contain any reference to
‘bookbuilding’. Therefore, where our sources do not explicitly mention the term ‘bookbuilding’ or its local
translation, we classify an offering as using bookbuilding if a reading of the IPO process strongly suggests that the
final offer price was set after indications from investors were sought (though not if it was an auction). To qualify as
a bookbuilding effort, we do not require the entire offering to be aimed at investors whose indications of interest are
sought. Where regulations require or issuers desire participation by retail investors, the price is typically set via
bookbuilding targeted at local or international institutions, followed by a retail offer at a fixed price set in reference
(and possibly at a discount) to the price paid by the institutions. We do not distinguish between these ‘hybrid’ and
‘pure’ bookbuilding efforts. In total, we classify 1,312 sample IPOs as using bookbuilding. The remaining 785 IPOs
are fixed-price offerings.
Taking 1994 as perhaps the first representative year in our sample, 45% of the IPOs were conducted via pure or
hybrid bookbuilding methods, rising to 80% during the first seven months of 1999. This pattern is largely a
European phenomenon: there, the proportion rose from 29% in 1994 to 88% in 1999. In Asia, by contrast, fixed-
price methods remain dominant, especially outside Japan (which switched from auctions to bookbuilding in
September 1997).
Bookbuilding involves setting an ‘indicative’ (non-binding) price range as a basis for feedback from potential
investors.8 We collect information on the price range for bookbuilding offerings from Equityware, IPO prospectuses,
and news searches. In total, we obtain price ranges for 1,189 of the 1,312 bookbuilt IPOs. We were also able to
collect data on the minimum (reserve) price set in 31 of the 35 auctions.
1.4 Underwriting syndicates
Equityware reports the composition of the underwriting syndicate and the capacity in which each participating bank
serves. Panel B of Table 1 reveals that the leadership role of U.S. banks has declined somewhat over time in our
9
sample. The fraction of offerings in which a U.S. bank served as global coordinator, bookrunner, or (co-)
lead manager (our definition of ‘senior’ syndicate positions) fell from 36.1% in 1994 to 24.7% of the firms floated
through the end of July 1999. Mirroring this decline, the rate of listings in the U.S. by sample firms fell from 24.9%
in 1994 to 9.5% in 1999 while the fraction of sample IPOs marketed to U.S. investors fell from 38.2% to 25.3%.9
After consolidating the regional and overseas offices of each bank and taking into account name changes and
acquisitions after they take effect, there are 592 different banks in the sample, 551 of which serve at least once in a
senior syndicate capacity. Table 2 ranks the 25 most active banks in our sample, judged by their involvement in a
senior syndicate position. We also summarize the frequency with which each bank, as a senior syndicate member,
marketed an offering to U.S. investors, used bookbuilding methods, or was involved with a privatization. Between
them, the top 25 banks are involved in a senior syndicate capacity in 1,050 IPOs, just under half the total.10 The next
25 most-active banks (not shown) account for another 273 IPOs. The remaining 809 IPOs involve 348 other banks,
which are involved in a senior capacity in between 1 and 18 deals.
Between them the top 25 banks account for 81.6% of all sample IPOs that are marketed to U.S. investors. This
suggests that the ability to ‘talk to U.S. investors’ is concentrated amongst a small number of banks. All but 7 (11) of
the top 25 (50) banks in the table are international rather than U.S. investment banks, and these international banks
also frequently lead-manage IPOs marketed to U.S. investors. This impression is, however, somewhat misleading
because of the possibility that U.S. and non-U.S. banks co-lead such deals. Only 158 of the 670 sample offerings
marketed in the U.S. do not include a U.S. bank in a senior syndicate position. And even in these 158 offerings, U.S.
banks often serve in a junior (co-managing) capacity, possibly to look after U.S. marketing. In 110 cases, syndicates
include no U.S. bank at any level but the lead is invariably a well-established international investment bank with a
strong Wall Street presence, such as Deutsche Morgan Grenfell and Warburg Dillon Read.
The top 25 banks almost always use bookbuilding methods, irrespective of their nationality. In fact, they account
for 65% of the IPOs brought to market via bookbuilding methods while the top 50 banks account for 75%. In other
words, bookbuilding technology remains concentrated amongst a relatively small number of banks. Of the 592
different banks in the sample, only 41 have served 20 or more times in a senior syndicate capacity in a bookbuilding
effort.

10
1.5 Underwriting spreads
Since Equityware reports cross-sectional information for each tranche of a multi-tranche offering separately, the
spread information for multi-tranche offerings is manually consolidated. To illustrate, where U.K. issuers combine a
private placement with a public offering, spreads are calculated as the weighted-average of the placement and
public-offer spreads. Where Equityware reports a total-fee figure or a combination of a fixed and a variable fee
(common in the U.K.), the gross spread is calculated as total-fee paid/gross proceeds.
Spread information for all European and Asian IPOs and for all IPOs due to list in the U.S. was checked for
accuracy against SDC’s new issues databases. In the few instances where discrepancies arose, a news search was
used to correct any errors. In a few cases, we used SDC data to fill gaps in Equityware’s spread information. In cases
where Equityware reports that no spread was disclosed (particularly prevalent in Germany and France), we consulted
the issuer’s prospectus. In 43 cases, the information was available in the (final) prospectus. In total, we have spread
information for 1,629 of the 2,132 IPOs.
1.6 Sample descriptive statistics
Table 3 reports descriptive statistics by country. The busiest IPO markets are in the United Kingdom, Germany,
France, Hong Kong and China. For the sample as a whole, median gross proceeds are about US$33 million, with a
substantially higher mean of US$156 million. The large difference between the median and mean gross proceeds
reflects, amongst other things, the importance of privatization IPOs, which are often very large and constitute 9% of
our sample. Among countries with relatively high IPO volume, median gross proceeds range from below US$10
million in Japan, Malaysia and Singapore to more than US$75 million in Italy and Mexico.
The exchange(s) on which the issuing firm lists its shares is a key decision variable and, because most non-
domestic listings include a U.S. listing, is closely related to the presence (and status) of U.S. banks in the
underwriting syndicates. For example, in Israel, where not a single IPO in our sample is exclusively domestically
listed, 82% of the underwriting syndicates include a U.S. bank in a senior position. By contrast, around 90% of
French, German, and U.K. IPOs list only domestically, and less than 20% are led by U.S. banks. This inverse
relationship is present in each of the four geographic regions reported in Table 3. Where the issuing firm’s home
country has relatively well developed capital markets, as in the U.K., Japan or Singapore, the relative frequency of a

11
U.S. listing is lower. On the other hand, Table 3 also indicates that firms frequently market their offerings
in the U.S. even when they are not seeking a U.S. listing. In Europe, only 12% of sample firms seek a U.S. listing,
but 24.1% include the U.S. as part of their target market. Likewise, although only 13.2% of sample firms in
Asia/Pacific seek a U.S. listing, 33.2% target U.S. investors. Thus, even if an issuing firm is not seeking a U.S.
listing, including a U.S. bank in the underwriting syndicate may be beneficial if it improves access to the U.S.
(institutional) investor community.
The mean gross spread of 3.67% confirms Chen and Ritter’s (2000) claim that spreads are generally lower
outside the U.S. But variation across countries is substantial, with mean gross spreads among countries with
relatively high IPO volume ranging from a low of 1.52% in Malaysia to a high of 7.29% in Israel. This variation is
correlated with variation in the frequency with which bookbuilding methods are used. Amongst the countries with
active primary equity markets, Germany stands out for using bookbuilding in over 90% of IPOs, whereas 80% of
U.K. offerings use fixed-price methods. Indeed, the majority of fixed-price offerings in our sample took place either
in the U.K. or in the larger Asian-Pacific markets (with the exception of Japan). The common denominator among
these markets is their longstanding adherence to the tenets of British company law [see Koh and Walter (1989),
Loughran, Ritter and Rydqvist (1994) and Sherman (1999) for further institutional details].
The final column of Table 3 reports mean underpricing for each country. Particularly high levels of underpricing
are observed in Germany, China and Japan, and over the sample as a whole underpricing averages 20.1%.
Table 4 reports the sample distribution by industry. The largest sector in our sample is IT (hardware and
software), accounting for around 14% of the IPOs. The remainder of the sample is spread widely across a range of
industries. Privatizations are concentrated in four sectors: energy/utilities, oil, coal & gas, banking & financial
services, and telecoms. Bookbuilding efforts are most common amongst companies in the energy/utilities, telecoms,
and IT sectors, and least common amongst construction, hotels & leisure, and real estate companies. To the extent
that valuation is more uncertain in the IT industry than in construction, the patterns in bookbuilding use are to be
expected. The most ‘domestic’ industries, in terms of both listings and marketing and inclusion of U.S. banks in
senior syndicate functions, are hotels & leisure, consultancies, retailers, and manufacturing companies, whilst the
sectors dominated by privatizations are the most likely to involve foreign listings or marketing drives and to hire
U.S. banks. Underpricing, shown in the last column, varies considerably by industry, with industries that are likely
12
to be characterized by greater valuation uncertainty (IT, media & publishing) prone to much greater
underpricing than more stable and mature industries (construction, real estate).
2. Direct Costs
2.1 Fixed-price versus bookbuilding methods
Table 5 reports on a country-by-country basis the average direct cost, or gross spread, incurred by issuing firms
using either fixed-price or bookbuilding methods. We focus on the direct costs associated with employing the
investment banking syndicate rather than the total IPO costs incurred by the issuing firm, as it is difficult to obtain
consistent information on other IPO expenses (such as the costs of conducting a road show, advertising, or
management time). In every country in the table, fixed-price IPOs involve lower fees. For the whole sample,
bookbuilding efforts are charged a mean gross spread of 4.6% of proceeds against 2.2% for fixed-price deals. Of
course, these figures are simple averages and do not control for economies of scale usually associated with
conducting an IPO.
2.2 How expensive are U.S. banks?
As a general rule, U.S. banks are not active in (cheaper) fixed-price offers – the sample for which we have spread
data contains only 30 such cases – so to see whether they charge more than non-U.S. banks we focus on bookbuilt
IPOs. Table 6 reports the results of three univariate analyses of gross spreads for bookbuilding efforts. The first
block of the table splits the sample according to whether a U.S. bank served in a senior syndicate position.
Syndicates led by U.S. banks generally charge higher spreads than syndicates led by non-U.S. banks. The premia
charged average 75 basis points (4.91% – 4.16%) for the sample as a whole, which is significant at the 0.1% level.
In European countries, premia average 50 basis points, ranging from 232 basis points in the U.K. to –32 basis points
in Germany. For Asian-Pacific, North/South American, and African/Middle Eastern countries premia average 32
basis points, 81 basis points, and 284 basis points, respectively. At first sight, therefore, U.S. banks appear to charge
higher fees even when we filter out the effects of fixed-price offerings.
There are several possible, not necessarily mutually exclusive explanations for these premia. First, because U.S.
banks lead-managed all but 19 of the bookbuilt IPOs which listed in the U.S., the premia could reflect the greater

13
complexity of listing in the U.S. Second, U.S. banks might charge issuers for access to their established
networks of U.S. (institutional) investors whose information might be valuable in determining the offer price via
bookbuilding. Third, U.S. banks might possess superior valuation technology (in the form of sectoral expertise or
analysts). The second and third blocks in Table 6 look at particular sub-samples of the data in an attempt to shed
light on these hypotheses.
The second block concentrates on the 598 bookbuilt and U.S.-marketed IPOs for which we have spread
information. The majority (487) were led by U.S. banks. Splitting these U.S. bank-led bookbuildings into the 352
IPOs which were to be listed in the U.S. and the 135 which were only marketed in the U.S. reveals a substantial cost
increase of 209 basis points (5.62% – 3.53%) associated with U.S. listings. This difference is highly statistically
significant for the sample as a whole and in every region bar North/South America (t-tests not shown). This is
consistent with the hypothesis that U.S. banks charge a premium for facilitating access to U.S. capital markets.
Do they charge an independent premium for access to their U.S. investor networks? The average spread that U.S.
banks charge in the 135 issues marketed but not listed in the U.S. is in fact 40 basis points lower than the average
spread charged in the 111 IPOs marketed in the U.S. by non-U.S. banks (3.53% – 3.93%). This difference is
significant at the 1% level but it is a fragile result driven by Germany. Here U.S. banks appear to have competed
aggressively on fees and it is also the one country in which domestic banks have retained the largest share of U.S.
marketed IPOs. Excluding Germany, average spreads cease to be significantly different across banks. As we argued
in section 1.4, most of the non-U.S. banks that market IPOs to U.S. investors do have an established Wall Street
presence. It is perhaps not surprising, therefore, that these ‘international’ investment banks have similar fee
structures as U.S. banks. Their investor networks surely are close substitutes for U.S. bank networks.
Do U.S. banks charge a premium in ‘domestic’ deals? The third block of Table 6 concentrates on the 413 IPOs
not marketed in the U.S., which were large sold domestically. Of these, only 58 were led by U.S. banks. Syndicates
not led by U.S. banks charged an average spread of 423 basis points. Syndicates with U.S. banks in a senior position
charged 39 basis points less on average, but this discount is not significant at the 5% level. Moreover, a simple
comparison of means fails to control for differences in size. The 58 ‘domestic’ IPOs lead-managed by U.S. banks are
almost six times larger (averaging US$324 million) than IPOs led by non-U.S. banks (averaging US$57 million).

14
Given economies of scale in underwriting, it is unclear whether U.S. banks charge less or more in these
deals. We return to this question later when we estimate cost regressions controlling explicitly for offer size.
Do U.S. banks charge less for their services outside the U.S. than they do in domestic U.S. IPOs? On average
U.S. banks charge 5% in international IPOs marketed to U.S. investors – the category of offering in our sample that
is perhaps closest to a domestic U.S. IPO. This certainly appears considerably lower than the average 7% spread
most medium-sized U.S. IPOs pay [see Chen and Ritter (2000)]. However, international IPOs led by U.S. banks are
not medium-sized: the average issue size is US$465.5 million. If we concentrate on the 104 IPOs in our sample
which fulfil Chen and Ritter’s size criterion (US$20 million – US$80 million), we find that U.S. banks charge 6.4%
on average in U.S.-marketed deals, with a median of 7% and a proportion of issuers paying exactly 7% of 56
percent. These results look similar to Chen and Ritter’s and raise the interesting question why foreign companies
apparently voluntarily pay U.S. banks what Chen and Ritter argue are inflated fees.
To summarize our univariate analysis of direct costs, U.S. banks charge considerably more in bookbuilding
efforts than do non-U.S. banks. U.S. banks are most active in IPOs marketed and/or listed in the U.S. Much of the
premium they demand can be traced to U.S. listings; there is no evidence that U.S. banks charge a premium for
access to their U.S. investor networks as non-U.S. banks charge just as much when marketing to U.S. investors.
When the target market does not include U.S. investors, U.S. banks are rarely given senior syndicate positions, and
they charge fees that are similar to those of domestic banks. And compared to fees charged in domestic U.S. IPOs,
international IPOs led by U.S. banks do not appear to be any cheaper.
2.3 Cost functions for bookbuilding and fixed-price offers
The univariate analysis suggests gross spreads are influenced by a variety of factors including the use of
bookbuilding practices, the cost of listing and marketing in the U.S., possibly the presence of a U.S. bank, and
country-specific regulatory and competitive circumstances. It does not, however, shed light on their marginal
contributions to the spread. We provide a more detailed characterization of the determinants of gross spreads by
regressing spreads on:
º a dummy variable indicating whether a U.S. bank serves in a senior syndicate position;
º a dummy variable for bookbuildings;

15
º a dummy variable indicating whether the issue is marketed to U.S. investors;
º a dummy variable for companies that are to be listed on a U.S. exchange;
º a set of country, year and industry dummy variables;
º and a measure of the size of the offering, to control for the possibility that substantial fixed costs in securities
underwriting result in economies of scale.
Like Dunbar (2000), we include both the level and the natural log of gross proceeds (in million U.S. dollars) to allow
for non-linearities in the relationship between spread and size. We also control separately for privatizations. Jones,
Megginson, Nash and Netter (1999) speculate that governments deliberately underprice privatization offerings (by
more than do private issuers) which has the effect of reducing syndicates’ underwriting risk and thus, potentially,
underwriting fees.
The regression results are reported in Table 7 (standard errors, adjusted for heteroskedasticity using White’s
(1980) correction, are reported beneath the coefficient estimates). Regression R1 is estimated over the sample as a
whole and thus assumes that U.S. and non-U.S. banks have the same cost (or at least pricing) functions.11 The
regression exhibits considerable explanatory power with an R2 of 65.7%. The negative coefficients estimated for the
level and log of proceeds are consistent with the presence of convex scale economies in IPO underwriting.
Controlling for offer size, the marginal cost of engaging a U.S. bank in a senior capacity is about 62 basis points and
is statistically significant (p<0.1%). Bookbuilding costs an estimated 130 basis points more than a fixed-price
offering (p<0.1%). The U.S. marketing and U.S. listing coefficients are both positive and statistically significant
(p<0.1%). Since all offerings listed in the U.S. are also marketed to U.S. investors, the two coefficients have to be
interpreted jointly. Listing in the U.S. increases the spread by 137 basis points for the listing itself (perhaps
reflecting the banks’ greater costs involved in due diligence and S.E.C. registration) and another 37 basis points for
marketing to U.S. investors (both significant with p<0.1%). This implies that listing in the U.S. costs an additional
174 basis points on average, compared to listing domestically (or in another non-U.S. market). Offerings marketed
to U.S. investors without also being listed in the U.S. are charged only the extra 37 basis points. These results are
consistent with U.S. banks charging higher fees in part because they often lead-manage a different type of IPO –
those that seek a U.S. stock market listing.
16
Spreads for privatization offerings are 49 basis points lower than for private-sector offerings (p<0.1%),
consistent with Jones et al.’s claim. The industry dummy coefficients, not reported in the table, are generally
statistically significant. Biotechnology and IT IPOs have higher-than-average spreads while IPOs by banks,
construction companies or retailers have lower than average spreads. This suggests industry-specific differences in
underwriting risk or valuation uncertainty. There is also a negative time trend in gross spreads since the early 1990s,
as evidenced by statistically significant negative coefficients for the year dummies after 1994. Coefficients estimated
for the country dummies for ‘Anglo’ capital markets (the U.K., Singapore, Malaysia, and South Africa) are
significant and negative. In contrast, the coefficients are significant and positive for Germany, Sweden, Italy, Japan,
Canada, and Israel.12
Recalling that we have spread information for only 1,629 of the 2,132 IPOs, we investigate the possibility that
our results are spuriously driven by an unobserved but nonrandom selection criterion. To test (and if necessary
correct) for selection bias, we estimate a maximum-likelihood version of Heckman’s (1979) selection model of
regression R1, where the spread is observed if γZ + ε > 0. Z is a matrix of variables which determines whether the
spread is observed, γ is a vector of coefficients to be estimated, and ε ~ N(0,1) will be correlated with the error of
regression R1 if selection is nonrandom. We use all right-hand side variables from regression R1 to form Z. To
ensure the model is identified, we also include a dummy equaling one where the IPO consists purely of primary
(new) shares. The results, reported in column R2, indicate that selection appears to be random: we cannot reject the
null hypothesis that the spread regression R1 and the selection equation are uncorrelated. As a consequence, the
selection-adjusted coefficient estimates are not significantly different from the simple coefficients of regression R1.
Regression R1 showed that U.S. banks charge an average premium of 62 basis points compared to syndicates led
by non-U.S. banks. To see what drives this premium, regression R3 replaces the dummy for IPOs led by U.S. banks
in R1 with two interaction variables: the first equals one if a U.S. bank markets an IPO to U.S. investors, the second
equals one if a U.S. bank conducts a bookbuilding. These interaction terms provide estimates of the premium over
non-U.S. banks that U.S. banks charge for marketing in the U.S. and for bookbuilding. The interaction coefficients
show that the average U.S. bank premium of 62 basis points is not driven by a U.S. marketing effect: U.S. banks
charge only an insignificant 11 basis points more than non-U.S. banks when marketing in the U.S. But U.S. banks
charge a statistically significant premium of 41 basis points for bookbuilding.13

17
Regression R3 controls for scale economies and cost differences associated with marketing and listing
in the U.S. It therefore qualifies our earlier finding in Table 6 that U.S. banks appear not to charge more than non-
U.S. banks when not marketing to U.S. investors. Specifically, the apparent discount arising from U.S. banks
charging average spreads of 3.84% compared to the non-U.S. banks’ 4.23% (see Table 6) becomes a 41 basis point
premium when controlling for differences in offer size. We confirm this by running a simple version of regression
R1 restricted to the subsample of bookbuildings not marketed in the U.S. (this corresponds to the comparison of
means in the last block of Table 6). The estimate for the U.S. bank dummy in this regression R4 indicates that U.S.
banks charge 57 basis points more than non-U.S. banks even when the U.S. banks do not provide access to U.S.
capital markets or U.S. investors. This raises the question why companies choose to hire more expensive U.S. banks
in what are effectively domestic offerings. A possible answer is that U.S. banks possess superior valuation
technology or certification ability [Titman and Trueman (1986)], in which case their degree of underpricing should
be lower in domestic deals.
3. The Indirect Cost of Underpricing
The gross spread evidence suggests that despite the ready availability of lower-cost alternatives, some non-U.S.
issuers willingly bear the higher cost of engaging a U.S. bank. Presumably, this reflects an expectation that U.S.
banks deliver a higher-quality bundle of services. In this section, we examine one quality dimension of this bundle,
the pricing of the offering. A widely cited benefit of bookbuilding is that it allows the offer price to be conditioned
on information about market demand conditions, and hence should result in more accurate pricing. So we begin by
comparing the underpricing of bookbuilt and fixed-price offers.
The average underpricing for the 785 fixed-price issues is 18.6% but this masks significant variation across the
various geographical regions.14 European fixed-price offers experienced average underpricing of 15.4%, whilst the
underpricing of Asian and African fixed-price offers averaged 24.3% and 31.4% respectively. The average
underpricing among the 1,312 bookbuilding efforts of 21.2% is actually higher than that of fixed-price offers, though
not significantly so. Again, there are large geographical differences. European bookbuilding efforts – with average
underpricing of 21.4% – are in fact significantly more underpriced on average than fixed-price offers. A similar
picture emerges in the Asian markets, where bookbuilt IPOs are underpriced by 31% on average (which is not

18
significantly greater than the 24.3% mean for fixed-price offerings). On the other hand, African/Middle
Eastern bookbuildings are less underpriced than fixed-price offerings in the region, with underpricing averaging only
9.5%.
3.1 A multivariate underpricing model
Univariate comparisons of average underpricing fail to control for issuer choices regarding its bank and syndicate
structure, the marketing method and target market, and the myriad other factors that might influence the initial price
run-up. For example, Hanley (1993) provides empirical support for Benveniste and Spindt’s (1989) prediction that
underpricing will be greater for deals drawing strong interest from institutional investors during the bookbuilding
effort. Jones, Megginson, Nash and Netter (1999) show that privatization IPOs are considerably more underpriced
than private-sector IPOs, perhaps reflecting political motives [see Guney and Perotti (1993)]. The existing literature
also suggests that underpricing run-ups are directly related to uncertainty (or the value of information in the
Benveniste-Spindt framework) regarding the issuing firm’s prospects.
Following Hanley, we proxy for offerings drawing strong (weak) interest by computing the price revision
between the midpoint of the initial price range and the offer price. The size and breadth of our database coupled with
the relatively weak reporting standards maintained in many sample countries limit our ability to control for other
influences as fully as we might like. However, if ex ante valuation uncertainty is similar within industries, industry
dummy variables provide some control for cross-sectional variation in ex ante uncertainty. Country dummies can
serve a similar function by controlling for differences in ‘IPO microstructure’ or the degree of informational
asymmetries between different groups of IPO investors. Finally, year dummies can control for the well-known, but
largely unexplained, time variation in underpricing. Thus we estimate a multivariate regression of the following
form:15
UNDERPRICING = β0 + β1 D_Bookbuilding + β2 D_USbank + β3 D_MarketUS
+ β4 D_privatization + β5 price revision
+ country/industry/year controls + ε (1)
The first column of Table 8 shows the results of a least-squares estimation of Model 1. Relative to previous attempts
to explain cross-sectional variation in initial returns, the R2 of 13.4% for the regression indicates a good fit, in
19
particular in view of the substantial heterogeneity across countries (a Wald test indicates that the country
dummies are jointly significant at p<0.1%). Bookbuilding alone does not lead to significantly less underpricing.
However, the negative coefficients estimated for the other two choice dummies indicate that underpricing is reduced
by 4.6 percentage points when engaging a U.S. bank (p=4.6%) and 12.8 percentage points after marketing to U.S.
investors (p<0.1%). Privatizations are discounted an additional 9 percentage points (p=2.5%).
Consistent with Hanley’s (1993) findings, underpricing is more pronounced among firms subject to substantial
positive price revisions in the aftermath of the bank’s marketing effort. The joint significance (Wald test: p<1%) of
the industry dummy variables (not shown) indicates considerable cross-sectional variation. For example,
construction companies are significantly less underpriced than average whereas media & publishing, IT, and
telecoms companies are significantly more underpriced than average. This intuitive ranking suggests that the
industry dummies help filter the effects of variation in ex ante uncertainty. Finally, the year variables account for a
statistically significant fraction of the cross-sectional variation in underpricing (p<0.1%).
Model 1 treats the choice variables separately and thus ignores the fact that issuers can choose between different
combinations of bookbuilding, U.S. bank involvement, and marketing to U.S. investors. In Model 2, we use four
interaction terms and the regression constant to allow issuers to choose between five alternative IPO strategies:
or
investors U.S.andbank U.S.aboth .4 bank U.S.nobut investors U.S..3
investors U.S.nobut bank U.S.a .2 investors nor U.S.bank U.S.aneither .1
involving ngbookbuildi
5. a fixed-price offering (captured via the constant).16
The least-squares results for Model 2, reported in column 2 of Table 8, help explain why the bookbuilding
dummy in Model 1 was insignificant. Bookbuilding efforts are associated with lower underpricing than fixed-price
offerings, but only if they include either a U.S. bank (p=4.5%), U.S. investors (p<0.1%), or both (p<0.1%). The
effects are large, ranging from reductions of 9.6 percentage points when using a U.S. bank to 13.9 percentage points
when marketing to U.S. investors (these effects are not significantly different from each other). Bookbuildings
which involve neither a U.S. bank nor market to U.S. investors do not significantly reduce underpricing relative to
fixed-price offerings.

20
3.2 Controlling for endogeneity
Both Model 1 and Model 2 are estimated on the implicit assumption that the three choice variables are exogenous.
However, this is unlikely to be the case. Habib and Ljungqvist (2000) model issuers’ IPO design choices assuming
they aim to maximize net IPO proceeds. Using U.S. data they show that issuers spend more on promoting their IPOs
when the marginal benefit of lower underpricing is large. Moreover, they document that failing to account for the
endogeneity of promotion choices and underpricing leads to spurious empirical results (such as the spurious finding
that higher-quality banks appear to underprice more during the 1990s). In our context, OLS estimates for the
coefficients of endogenous choice dummies are likely to be inconsistent and serious bias will lead to understatement
of the effect on underpricing of bookbuilding, choice of U.S. bank, and marketing to U.S. investors. The threat of
understatement arises because companies that otherwise would be heavily discounted have the most to gain from
taking costly actions to reduce underpricing, all else equal.
To derive consistent estimates of the effect of the choice variables we employ two-stage least-squares in Model 3.
In the first stage we estimate a multinomial logit of the probability of a firm choosing each of our four alternatives
over a fixed-price offering. The second stage uses the predicted probabilities from the first stage to instrument the
endogenous choice variables. Following Habib and Ljungqvist (2000), we assume in the first stage that issuers aim
to minimize underpricing subject to the constraint that doing so is costly. For instance, say U.S. banks are better at
pricing IPOs but also charge more for their services. Then we expect only those issuers to hire U.S. banks for whom
the reduction in underpricing outweighs the increase in fees. The same applies to the choice whether to market to
U.S. investors. The marginal benefit of these choices depends on the size of the offering: hiring a more expensive
U.S. bank makes most sense in larger issues where underpricing translates into larger reductions in issuers’ wealth.
Issuers who float little equity stand to gain very little from more accurate pricing and should thus be less inclined to
spend much when going public; issuers who float a lot stand to gain much more. Therefore, a key determinant of the
IPO choices we investigate is offer size.17 We capture this by including the level and natural log of gross proceeds
(in million US$) in the first-stage multinomial logit. We also separately control for privatizations, given that political
or domestic considerations may cause their objective function to differ from that of private-sector issuers. Finally,
we include a full set of country, year and industry dummies.18

21
The multinomial logit estimates are reported in the upper half of Table 8. The pseudo-R2 of 44.3% and
the significant likelihood-ratio test indicate considerable explanatory power. The coefficients for the log of gross
proceeds are consistently positive, indicating that larger issuers are less likely to use fixed-price offerings. The
negative coefficients for the level of proceeds are consistent with diminishing returns. Comparing the size
coefficients across the four bookbuilding choices, we find that as issues become larger, they are incrementally more
likely to add a U.S. bank or marketing to U.S. investors to their bookbuilding effort. Indeed, compared to domestic
bookbuildings with domestic banks, the size coefficients are significantly larger when either U.S. banks, or U.S.
investors, or both are involved. The insignificant privatization dummy indicates that privatizations are as likely to
involve fixed-price as bookbuilding efforts if U.S. banks and investors are not included. They are, however,
significantly less likely to use bookbuilding involving both U.S. banks and U.S. investors (p<1%), after controlling
for size. The industry dummies (not reported) show that companies in the IT, media, electronics, and drugs
industries are significantly more likely to be bookbuilt, and are incrementally more likely to employ a U.S. bank in a
senior syndicate role and/or to market to U.S. investors. The reverse is true for hotels & leisure and real estate
companies. This is consistent with the hypothesis that more risky companies, or those whose value is more difficult
to determine, tend to choose more expensive marketing techniques.
The second stage of Model 3 uses the predicted probabilities from the first stage as instrumental variables for
alternatives 1-4 in a least-squares regression with underpricing as the dependent variable. Comparison of the least-
squares estimates in Model 2 and the 2SLS estimates in Model 3 suggests significant bias introduced by the failure
to treat issuing firm choices as endogenous. Compared to Model 2, the coefficients on bookbuilding efforts
involving U.S. banks or U.S. investors or both become larger in magnitude, significantly so when involving U.S.
investors. The estimates indicate that bookbuilding efforts led by U.S. banks but not marketed in the U.S. still reduce
underpricing but the standard error quintuples causing significance to be lost. Note that this combination of choices
is relatively rare in our data. The reduction in underpricing from marketing to U.S. investors in the absence of a U.S.
bank more than doubles. However, bearing in mind that this is another low-probability choice, the economic
magnitude of the effect is more moderate: an increase in the likelihood of this choice from the 1st quartile to the 3rd
quartile reduces underpricing from 22.4% to 19.6%, holding all other covariates at their sample means. Finally,
using a U.S. bank to market the offering to U.S. investors continues to reduce underpricing significantly (p<0.1%),

22
by 26 percentage points compared to a fixed-price offering. Bookbuilding without U.S. banks or investors
still exerts little influence on underpricing.
3.3 Underpricing in bookbuilding efforts
In this section, we concentrate on companies that choose to conduct a bookbuilding effort and model the effect on
underpricing of their remaining two choices: whether to hire a U.S. bank and/or market to U.S. investors. Model 4
re-estimates Model 2 in the subsample of bookbuildings, including interaction terms for choices 2-4 above; choice 1,
bookbuildings without U.S. banks and investors, is captured in the regression constant. Model 4 is estimated using
OLS and thus makes no attempt to endogenize the choice variables. As in Model 2, the interaction terms are
negative and significant, indicating that issuers can reduce underpricing in bookbuildings by hiring a U.S. bank,
marketing to U.S. investors, or both. The effect of these three choices is similar in magnitude so it appears not to
matter which combination issuers choose. However, the fact that U.S. banks can reduce underpricing even when
they do not market to their U.S. investors suggests that U.S. banks may be better at bookbuilding per se than ‘local’
banks which have adopted the practice.
As before, the binary variables – if endogenous – will be inconsistently estimated by OLS. To correct for this, we
use probit two-stage least squares [see Maddala (1983), p. 240] where the first-stage involves a bivariate probit
model of the choices of whether to hire a U.S. bank and whether to market to U.S. investors. We model these
choices as functions of offer size, a dummy for privatizations, and a set of country, industry and year dummies. The
second-stage underpricing regressions use the predicted probabilities from the first stage as instruments for the
observed choices. We use a bivariate probit in the first stage rather than a multivariate logit, because the former can
explicitly allow for the interdependence between the choice variables by capturing the fact that issuers are more
likely to be marketed to U.S. investors if they have hired a U.S. bank.19
The results of estimating Model 5 are reported in the penultimate column of Table 8. The hypothesis that the two
choice variables in the first stage are inter-related cannot be rejected (as indicated by the significant χ2 test), which
confirms the need to model them jointly. An estimate of the extent of inter-relatedness is provided by ρ, the
correlation coefficient of the joint distribution of the underlying latent variables generating the two binary choice
variables. The likelihood ratio test shows that our 78.7% estimate for ρ is significant at the 0.1% level. The

23
determinants of the choices in the first stage mirror the findings in Model 3. Larger issuers are ignificantly
more likely to hire U.S. banks and be marketed to U.S. investors, whilst privatizations are less likely to do so.
Using the predicted (joint) probabilities from the first stage to instrument the interaction variables in the second
stage, we find significant differences between Models 4 and 5. The negative effect on underpricing of U.S. bank-
backing when the IPO is not marketed to U.S. investors ceases to be significant when we allow for the endogeneity
and interdependence of the two choices. Interestingly, and in contrast to Model 3 which uses the entire sample, non-
U.S. banks marketing bookbuilding efforts to U.S. investors achieve only a marginally significant reduction in
underpricing when we account for endogeneity. Finally, the effect of employing a U.S. bank and marketing to U.S.
investors doubles in Model 5 compared to the simple least-squares estimate in Model 4. This choice now reduces
underpricing by 35 percentage points, compared to bookbuilding conducted by a non-U.S. bank and not involving
U.S. investors. This effect may seem large but it is in line with a univariate comparison of average underpricing.
Bookbuildings involving neither U.S. investors nor U.S. banks are underpriced by 32.5% on average, against 11.4%
for bookbuildings involving both U.S. investors and U.S. banks.
Finally, the spread regression R4 in Table 7 showed that U.S. banks charge a 57 basis point premium even when
they do not provide access to U.S. capital markets or U.S. investors. Do they deliver a corresponding reduction in
underpricing? Model 6 in Table 8 estimates a probit 2SLS regression in the bookbuilding subsample of deals not
marketed in the U.S. The first stage estimates the determinants of the probability of hiring a U.S. bank. The second
stage estimates the effect of choosing a U.S. bank using the predicted probability as an instrument.20 The estimated
effect is large. Choosing a U.S. bank to lead-manage a ‘domestic’ offering reduces underpricing by close to 27
percentage points (p=8.8%).21 This suggests U.S. banks can reduce underpricing not only by virtue of their
privileged access to U.S. investors, but also for some other reason: perhaps they possess superior valuation
technology, or can more easily certify the issue’s quality.
3.4 The total cost of IPOs
Our regression results suggest that issuers can reduce underpricing substantially by choosing between different IPO
strategies. The marginal benefit of combining bookbuilding with U.S. banks and investors appears considerable, but
we know from section 2 that such IPO strategies lead to higher costs too. The magnitude of the effects estimated in
24
our underpricing regressions suggests that the net benefit is almost certainly positive, but the estimated
coefficients are not directly comparable. In this section, we ask whether issuing firms would have been better off
choosing a different IPO strategy, in terms of the trade-off between underpricing and gross spreads.
To answer this question, we borrow the econometric intuition behind Lee’s (1978) two-stage switching model.22
Specifically, we
º use the second-stage coefficient estimates from Model 3 in Table 8 to predict what underpricing would have
been had issuers chosen differently (note that the 2SLS estimates of Model 3 are adjusted for self-selection; our
predictions would otherwise be biased),
º calculate the implied change in the offer price and gross proceeds,
º use the coefficient estimates from regression R1 in Table 7 to predict the spread the switching firms would have
paid, taking into account their new choices as well as changes in offer size given changes in offer prices,
º and calculate the change in net proceeds (after underwriting costs) associated with the alternative choice.
Switching regressions usually model the choice between two alternatives. In our case, we have many more. To keep
things simple, we continue to concentrate on the five alternatives analyzed in our underpricing regressions (see p.
20). We investigate two illustrative switches. The first supposes that all bookbuilding efforts continue to be
bookbuilding efforts but that any firm employing a U.S. bank switches to using a local bank and that any firm being
marketed in the U.S. chooses not to involve U.S. investors. This leaves two types of offerings: fixed-price ones and
bookbuilt offerings without the participation of U.S. banks or investors. The consequence of this switch would be to
increase the underpricing of the 698 switching firms from 11.3% on average to 27.8%, which in turn would reduce
gross proceeds substantially, by 11% on average.23 On the cost side, dropping U.S. banks and U.S. investors would
reduce the average spread amongst the switchers from 4.75% to 3.07%. The change in net proceeds would have
made 68% of the switchers worse off, with the median switcher suffering a reduction in net proceeds of US$8.2
million. On balance, therefore, the great majority of switchers would have been ill-advised to conduct a ‘domestic’
bookbuilding instead.
The second switch supposes that any bookbuilding effort not already led by a U.S. bank hires a U.S. bank. This
would reduce underpricing amongst the 743 companies concerned from 28.4% to 1.5%, leading to an average rise in
gross proceeds of 14.3%. The average spread would increase from 4.2% to 4.7%, reflecting the premium U.S. banks

25
charge. The change in net proceeds would have made 69% of the switchers better off, with the median
switcher enjoying an increase in net proceeds of US$4.4 million had it hired a U.S. bank. Half of the companies that
could have benefited from hiring a U.S. bank according to our estimates are in Germany, France, the United
Kingdom, Italy, and Belgium – countries where U.S. banks have not won much market share.
The results of the second switching model indicate that a substantial number of issuers could have reduced the
amount of money left on the table, net of underwriting fees, by hiring U.S. banks whose greater experience and
better investor networks generate keener offer prices. Would issuers also have benefited from switching from a
fixed-price to a bookbuilt offering? Benveniste and Busaba’s (1997) model of the issuer’s choice between the two
cautions against simulating the effects of this switch. Their model suggests that while bookbuilding efforts generate
greater expected offer prices, they do so at the ‘cost’ of subjecting the issuer to uncertainty about the proceeds of the
IPO. The choice therefore ultimately depends on the issuer’s inherent riskiness and risk tolerance, which we do not
observe.
4. Conclusions
We set out to consider the consequences of global integration on primary equity markets and the role played by U.S.
banks. One question that we address is whether the worldwide introduction of bookbuilding methods during the
1990s has promoted efficiency in the primary equity markets. If we define efficiency from the perspective of the
issuing firm, the answer appears to be a qualified ‘yes’. Compared to fixed-price offerings, bookbuilding efforts –
though more expensive – produce far less underpricing, but only in combination with U.S. banks and U.S. investors.
Interestingly, it seems sufficient to merely market – not list – in the U.S. This may suggest that the benefits of global
integration arise due to differences in the nature of primary-market investors more than the microstructure of
secondary trading markets. U.S. banks clearly benefit from their access to U.S. investors, but we also find evidence
that U.S. banks deliver reductions in underpricing even in bookbuilding efforts that are not marketed to U.S.
investors. This may suggest that U.S. banks retain some advantage in the application of the bookbuilding
technology.
We leave for future research what this advantage may be. Curiously, we observe that non-U.S. banks almost
never set the final offer price outside the indicative price range established prior to a bookbuilding effort, and instead

26
price at the upper bound in almost half their offerings. U.S. banks, on the other hand, are many times
more likely to price outside the range. 24 If bookbuilding is an exercise in information production for the purpose of
establishing an offer price that more nearly reflects market demand conditions, any constraint on the offer price
might be expected to diminish its efficiency. Since we can find no obvious regulatory reasons for the difference in
behavior of U.S. and non-U.S. banks, we leave for future research why it is so pronounced, what impact it may have,
and whether continued market integration will diminish it in future.
Our conclusion that the diffusion of U.S. banking practices has been to the benefit of issuing firms should not be
interpreted to suggest that we have no reservations regarding bookbuilding methods. Rather, we contend that they
represent perhaps one of many possible second-best responses to the informational frictions present in taking
companies public in a world of relatively primitive information and communications technology. As the marginal
cost of communicating with virtually any interested party at one time and in one (virtual) place plummets, it may be
possible to approximate the benefits of the bookbuilding approach with an electronic auction similar to that being
promoted by W.R. Hambrecht + Co. In addition to reducing direct costs, a shift from the extraordinary discretion
bookbuilding methods rely on to a rules-based system might also promote confidence in the integrity of the primary
markets.

27
Endnotes
1 In some countries – including Belgium, France, the Netherlands, and the U.K. – auction-like tender offers were
sometimes used.
2 See Chen and Ritter (2000). For a contrasting view, see Hansen (2000).
3 Because 1992 and 1993 were the ‘coldest’ issue markets of the 1990s in Europe and many Asian countries, we do
not believe that the coverage bias is too severe. (In Germany, for instance, only eight companies floated in 1992 and
in 1993, compared to around twenty in each of the previous three years; see Ljungqvist (1997) for further details.)
4 We have investigated the robustness of our results to excluding IPOs from 1992/3 and found that they remained
qualitatively unchanged. We therefore use the entire sample in the analyses that follow.
5 We also compared Equityware’s coverage to that provided by the Securities Data Company’s Global New Issues
database. In the European markets, SDC covers only about 84% of the IPOs covered by Equityware. SDC frequently
misclassifies seasoned offerings as IPOs and double-counts IPOs under different names. In Asia, on the other hand,
SDC’s coverage clearly begins earlier than Equityware’s.
6 SDC’s databases contain no corresponding information. For that reason, we refrain from merging the Equityware
and SDC databases. What we thereby lose in coverage, we gain in information on the geography of IPO marketing.
7 We are grateful to François Derrien for helping to check our French sample.
8 By indicative price range, we mean a range set by the syndicate banks and disclosed in regulatory filings,
preliminary prospectuses, or investor marketing documents. This excludes price indications released by unaffiliated
investment banks and quoted in the business press, and press reports of the range of amounts (“$20m to $25m”) the
issuer plans to raise.
9 There is also a pronounced decline over time in the frequency of privatisations which, in turn, has much to do with
the decline in gross proceeds per offering. This is likely a consequence of both sampling bias associated with
Equityware’s overrepresentation of privatisations during the early part of the sample period and a time trend in the
rate of privatisations.

28
10 They are involved in a junior capacity in 970 deals, or after stripping out deals in which another top 25 banks is
senior, an additional 70 deals. Hence, at least one top 25 bank serves in a senior or junior capacity in 1,120 (52.5%)
of our sample of IPOs.
11 We estimated (but do not report) separate cost functions for U.S. and non-U.S. bank led offerings. We found
evidence of greater economies of scale in spreads charged by U.S. banks, largely because U.S. banks tend to
underwrite the larger offerings in our sample. All other inferences reported in this section were unaffected.
12 Exclusion of the industry, year, and country controls (not reported) suggests that the regression fit is not spurious.
Although R2 declines to 54.2%, the remaining coefficient estimates are quite stable (although the estimate of the
marginal cost of bookbuilding rises to 226 basis points). Specifically, cross-sectional variation in gross spreads still
shows evidence of scale economies in underwriting, and the premia for marketing to U.S. investors, listing in the
U.S., and engaging a U.S. bank in a senior capacity remain highly significant.
13 The two estimates sum only to 41 + 11 = 52 basis points, short of the 62 basis point premium U.S. banks charge
on average. The discrepancy arises because regression R3 does not separately control for the (rare) fixed-price
offerings in which U.S. banks are involved or for the 35 auction-IPOs.
14 Average underpricing for the 35 auction-IPOs is 12.7%. This is not statistically different from the average
underpricing experienced in bookbuilding or fixed-price offerings.
15 We do not include a dummy for listings in the U.S. because it was not associated with lower underpricing in the
simple OLS regression. This changes when the choice to list in the U.S. is treated as endogenous. However, U.S.
listings and U.S. marketing result in similar reductions in underpricing, so to avoid clutter we do not distinguish
between them.
16 As noted earlier, fixed-price offers rarely employ a U.S. bank and are equally rarely marketed in the U.S. Hence,
they can be thought of as a ‘plain vanilla’ benchmark against which the other IPO strategies can be judged. For the
purpose of generating the interaction terms, we treat the 35 auctions as though they were fixed-price offerings.
Including auction IPOs amongst bookbuildings instead or controlling for them separately does not change our
results.

29
17 Clearly offer size is not exogenous in the strict sense, as it is itself determined by factors such as financing
constraints and the desire to diversify the portfolios of the existing owners. However, in the context of the models
we construct, it can reasonably be regarded as exogenous with respect to underpricing. For U.S. evidence in favor of
treating is as exogenous, see Habib and Ljungqvist (2000).
18 Country dummies help control for local conditions. For instance, there might be regulatory or other constraints on
choices, such as in Japan where bookbuildings or hybrids have become compulsory. Time dummies help control for
the evolution of choice over time. For instance, in the early years of our sample hiring a U.S. bank was not always
possible in all countries. Industry dummies help control for valuation uncertainty if uncertainty over the ‘true’ value
of companies differs systematically across industries. The option value of employing ‘superior’ issue methods,
which should result in lower underpricing, would clearly increase in uncertainty. For instance, biotech companies
have more to gain from information-production.
19 This advantage implies that it would be desirable to replace the multinomial first stage of Model 3 with a
multivariate probit which allows for the interdependence of the three choice variables. Unfortunately, multivariate
probits have extremely non-linear likelihood functions, and we failed to achieve convergence.
20 The results are not sensitive to using Heckman’s (1979) lambda instead of the predicted probability in the second
stage.
21 Controlling for endogeneity makes a large difference here: the OLS estimate of the effect of U.S. bank-backing is
‘only’ 12.7 percentage points.
22 Applications in finance include Smith (1987) on the choice between competitive and negotiated underwriting and
Madhavan and Cheng (1997) on the choice in block trades between upstairs and downstairs markets.
23 The change in gross proceeds is calculated as implied over actual gross proceeds, minus one. The implied gross
proceeds is the number of shares actually sold times the implied offer price given the switch. The implied offer price
is calculated as the after-market price (assumed unaffected) divided by one plus the predicted underpricing given the
switch.

30
24 It is not the case that U.S. banks simply set narrower price ranges than non-U.S. banks and are therefore more
likely to have to price outside the range. Nor do we find support for the hypothesis that U.S. banks just ‘happened’
to lead-manage offerings which turned out to be ‘hot’.

31
References Benveniste, Lawrence M., and Walid Busaba, 1997, “Bookbuilding versus Fixed Price: An Analysis of
Competing Strategies for Marketing IPOs”, Journal of Financial and Quantitative Analysis 32, 383-403.
Benveniste, Lawrence M., and Paul A. Spindt, 1989, “How Investment Bankers Determine the Offer Price and
Allocation of New Issues”, Journal of Financial Economics 24(2), 343-61.
Biais, Bruno, and Anne Marie Faugeron-Crouzet, 2000, “IPO Auctions”, mimeo, Université de Toulouse.
Chemmanur, Thomas J., 1993, “The Pricing of Initial Public Offerings: A Dynamic Model with Information
Production”, Journal of Finance 48, 285–304.
Chen, Hsuan-Chi, and Jay R. Ritter, 2000, “The Seven Percent Solution”, Journal of Finance 55(3), 1105-1131.
Derrien, François, and Kent L. Womack, 2000, “Auctions vs. Bookbuilding and the Control of Underpricing in
Hot IPO Markets”, mimeo, Dartmouth College.
Dunbar, Craig G., 2000, “Factors Affecting Investment Bank Initial Public Offering Market Share”, Journal of
Financial Economics 55(1), 3-43.
Guney, Serhat E., and Enrico Perotti, 1993, “The Structure of Privatization Plans”, Financial Management 22,
84-98.
Habib, Michel A., and Alexander P. Ljungqvist, 2000, “Underpricing and Entrepreneurial Wealth Losses: Theory
and Evidence”, forthcoming, Review of Financial Studies.
Hanley, Kathleen Weiss, 1993, “The Underpricing of Initial Public Offerings and the Partial Adjustment
Phenomenon”, Journal of Financial Economics 34(2), 231-50.
Hansen, Robert S., 2000, “Do Investment Banks Compete in IPOs? The Advent of the ‘7% Plus Contract’”,
forthcoming in Journal of Financial Economics.
Heckman, James, 1979, “Sample Selection Bias as a Specification Error”, Econometrica 47, 153-61.
Henry, Peter B., 2000, “Stock Market Liberalization, Economic Reform, and Emerging Market Prices”, Journal
of Finance 55, 529–564.
Jones, Steven L., William L. Megginson, Robert C. Nash, and Jeffry M. Netter, 1999, “Share Issue Privatizations
as Financial Means to Political and Economic Ends”, Journal of Financial Economics 53, 217-253.

32
Karolyi, G. Andrew, 1998, “Why Do Companies List Shares Abroad? A Survey of the Evidence and
its Managerial Implications”, Journal of Applied Corporate Finance 11.
Koh, Francis and Terry Walter, 1989, “A Direct Test of Rock’s Model of the Pricing of Unseasoned Issues”,
Journal of Financial Economics 23(2), 251-272.
Lee, Lung-Fei, 1978, “Unionism and Wage Rates: A Simultaneous Equations Model with Qualitative and
Limited Dependent Variables”, International Economic Review 19, 415-433.
Ljungqvist, Alexander P., 1997, “Pricing Initial Public Offerings: Further Evidence from Germany”, European
Economic Review 41(7), 1309-1320.
Loughran, Tim, Jay R. Ritter, and Kristian Rydqvist, 1994, “Initial Public Offerings: International Insights”,
Pacific-Basin Finance Journal 2, 165-199.
Maddala, G.S., 1983, Limited-Dependent And Qualitative Variables In Econometrics, Cambridge University
Press.
Madhavan, Ananth and Minder Cheng, 1997, “In Search of Liquidity: Block Trades in the Upstairs and
Downstairs Markets”, Review of Financial Studies 10, 175-203.
Sherman, Ann E., 1999, “Global Trends in IPO Methods: Bookbuilding vs. Auctions”, mimeo, University of
Minnesota.
Sherman, Ann E. and Sheridan Titman, 2000, “Building the IPO Order Book: Underpricing and Participation
Limits With Costly Information”, NBER Working Paper No. W7786.
Smith, Richard L., 1987, “The Choice of Issuance Procedure and the Cost of Competitive and Negotiated
Underwriting: An Examination of the Impact of Rule 50”, Journal of Finance 42(3), 703-720.
Stulz, Rene M., 1999, “Globalization, Corporate Finance and the Cost of Capital”, Journal of Applied Corporate
Finance 12, 8-25.
Titman, Sheridan and Brett Trueman, 1986, “Information Quality and the Valuation of New Issues”, Journal of
Accounting and Economics 8, 159–72.
White, H., 1980, “A heteroskedasticity-consistent covariance matrix estimator and a direct test for
heteroskedasticity”, Econometrica 48, 817-838.

33
Table 1. Sample distribution and descriptive statistics.
total sample
1992 1993 1994 1995 1996 1997 1998 1999
Panel A: Sample distribution (number of firms)
Europe 1,432 16 29 161 133 219 287 341 246
Asia Pacific 491 15 30 48 31 47 143 123 54
North & South America 110 11 25 16 6 11 23 12 6
Africa/Middle East 99 6 9 8 6 18 12 30 10
Total sample 2,132 48 93 233 176 295 465 506 316
Panel B: Descriptive statistics
Gross proceeds (US$m) median 32.9 61.0 90.4 47.2 55.3 39.1 26.9 20.8 32.6 mean 156.1 203.1 201.9 176.7 212.6 164.5 144.6 129.4 140.9
Privatization (fraction %) 9.1 37.5 26.9 15.0 14.8 5.8 7.5 4.7 4.1
Listing and marketing (%) … listed domestically only 74.5 45.8 39.8 67.4 64.2 71.5 76.3 85.0 83.2 … listings include U.S. 17.8 45.8 49.5 24.9 25.6 21.0 14.8 9.3 9.5 … target market includes U.S. 31.4 64.6 67.7 38.2 43.8 35.3 28.6 18.4 25.3 … marketed abroad 55.7 100.0 98.9 52.8 63.6 51.5 48.6 46.6 63.0
Syndicate (fraction %) … U.S. bank (senior position) 28.4 52.1 57.0 36.1 35.8 33.6 24.9 17.2 24.7 … U.S. bank (junior position) 4.8 18.8 18.3 7.3 9.7 3.7 2.4 2.4 2.8
The 2,132 sample companies went public between January 1992 and July 1999. Panel A gives the sample distribution by region and year. North & South America excludes the United States. For a breakdown of the countries covered, see Table 3. Panel B lists several descriptive statistics, by year. Gross proceeds is expressed in million US$ converted using exchange rates on the pricing day. ‘Listings include U.S.’ refers to IPOs by non-U.S. companies which involve a listing in the U.S., either exclusively or in addition to a home-country or other foreign listing. ‘Target market includes U.S.’ refers to IPOs which are either S.E.C. registered, mention eligibility under Rule 144A, have a tranche labeled ‘U.S. tranche’ or are listed on a U.S. exchange. U.S. banks are U.S. investment banks such as Goldman, Sachs and Morgan Stanley & Co and any of their overseas offices, excluding the Wall Street offshoots of non-U.S. banks such as CIBC Wood Gundy Securities Inc and Deutsche Securities Inc. We classify Credit Suisse First Boston as a U.S. bank given its long Wall Street presence, despite its Swiss parentage. ‘Fraction using U.S. bank (senior position)’ refers to the presence of a U.S. bank in a senior syndicate position, i.e. global coordinator, bookrunner or (co-) lead manager. ‘Fraction using U.S. bank (junior position)’ refers to the presence of a U.S. bank in a junior syndicate position.
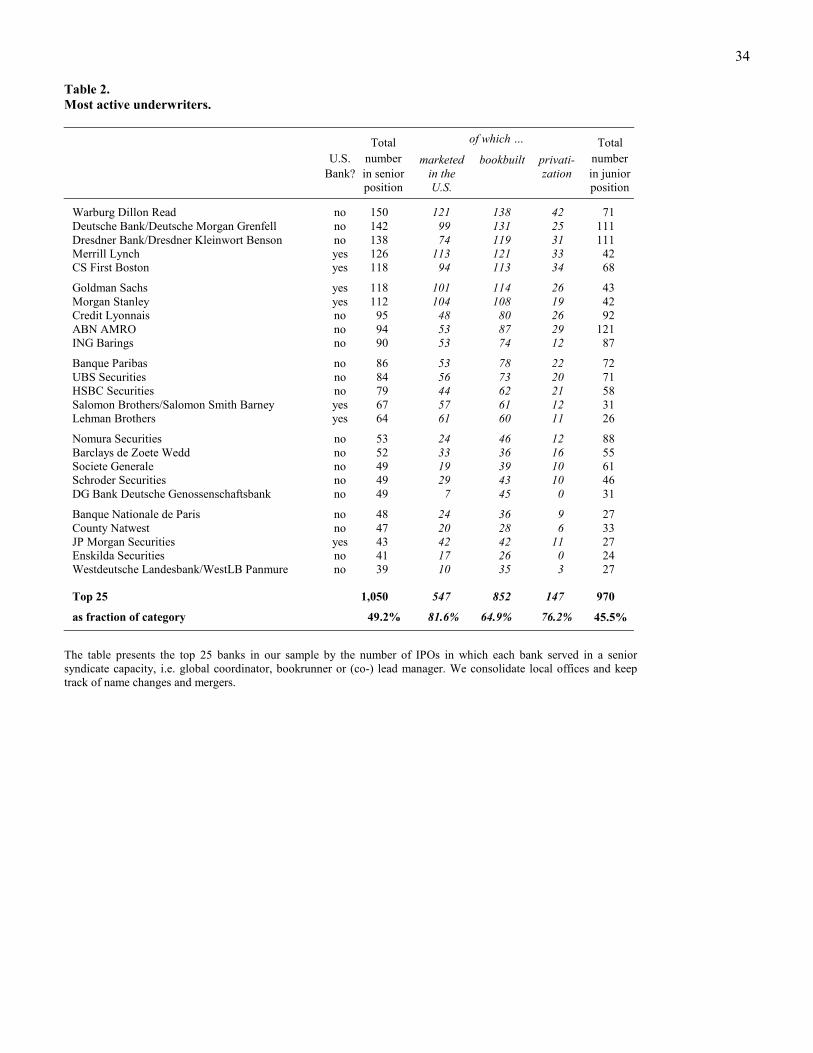
34
Table 2. Most active underwriters. Total of which … Total U.S. number marketed bookbuilt privati- number Bank? in senior
position in the
U.S. zation in junior
position
Warburg Dillon Read no 150 121 138 42 71 Deutsche Bank/Deutsche Morgan Grenfell no 142 99 131 25 111 Dresdner Bank/Dresdner Kleinwort Benson no 138 74 119 31 111 Merrill Lynch yes 126 113 121 33 42 CS First Boston yes 118 94 113 34 68
Goldman Sachs yes 118 101 114 26 43 Morgan Stanley yes 112 104 108 19 42 Credit Lyonnais no 95 48 80 26 92 ABN AMRO no 94 53 87 29 121 ING Barings no 90 53 74 12 87
Banque Paribas no 86 53 78 22 72 UBS Securities no 84 56 73 20 71 HSBC Securities no 79 44 62 21 58 Salomon Brothers/Salomon Smith Barney yes 67 57 61 12 31 Lehman Brothers yes 64 61 60 11 26
Nomura Securities no 53 24 46 12 88 Barclays de Zoete Wedd no 52 33 36 16 55 Societe Generale no 49 19 39 10 61 Schroder Securities no 49 29 43 10 46 DG Bank Deutsche Genossenschaftsbank no 49 7 45 0 31
Banque Nationale de Paris no 48 24 36 9 27 County Natwest no 47 20 28 6 33 JP Morgan Securities yes 43 42 42 11 27 Enskilda Securities no 41 17 26 0 24 Westdeutsche Landesbank/WestLB Panmure no 39 10 35 3 27
Top 25 1,050 547 852 147 970
as fraction of category 49.2% 81.6% 64.9% 76.2% 45.5%
The table presents the top 25 banks in our sample by the number of IPOs in which each bank served in a senior syndicate capacity, i.e. global coordinator, bookrunner or (co-) lead manager. We consolidate local offices and keep track of name changes and mergers.

35
Table 3. Descriptive statistics: Country distribution.
Gross proceeds (US$ m)
Privati- zation
Listing and marketing (fraction %)
Syndicate (fraction %)
Book-building
total no. of obs.
no. of obs w/ spread
info
median
mean fraction (%)
... listed domestically only
... listings include
U.S.
... target market
includes U.S.
... marketed
abroad
... using a senior
U.S. bank
... using a junior
U.S. bank
gross spread (mean
%)
fraction (%)
under pricing (mean
%)
Europe 1,432 1,001 31.9 148.4 6.5 81.7 12.0 24.1 50.9 22.4 2.7 3.61 62.4 19.1 France 222 63 11.2 144.4 4.5 89.2 7.7 14.4 34.2 16.7 1.4 4.52 77.9 14.0 Germany 238 174 35.5 137.9 1.3 92.0 5.9 18.9 68.1 13.9 4.2 4.67 91.2 46.4 Italy 62 54 79.1 322.5 12.9 62.9 27.4 45.2 98.4 40.3 1.6 4.34 96.8 7.5 Netherlands 66 54 67.1 250.3 6.1 59.1 31.8 50.0 92.4 50.0 3.0 4.55 95.5 13.7 Sweden 77 28 38.6 136.0 7.8 83.1 9.1 31.2 55.8 15.6 1.3 4.30 46.8 9.1 United Kingdom 449 414 18.4 90.0 0.9 90.2 8.0 15.1 18.0 14.0 0.2 2.49 19.6 15.0 rest of W Europe 273 178 54.3 198.2 13.2 68.9 16.5 35.5 74.4 35.5 5.1 4.12 78.4 13.4 rest of E Europe 45 36 52.5 135.5 48.9 40.0 33.3 40.0 93.3 46.7 13.3 4.21 93.3 16.0
Asia Pacific 491 445 29.6 178.6 17.5 74.9 13.2 33.2 55.6 28.3 10.4 3.12 48.5 27.5 China 103 87 57.9 121.8 57.3 43.7 15.5 42.7 100.0 34.0 11.7 3.65 68.9 45.7 Hong Kong 123 121 18.8 95.4 4.1 80.5 13.8 30.1 45.5 26.0 12.2 3.06 34.1 13.8 Japan 42 40 6.8 512.7 0.0 97.6 2.4 11.9 11.9 11.9 21.4 5.33 97.6 53.2 Malaysia 44 44 3.3 87.4 4.5 100.0 0.0 6.8 9.1 6.8 2.3 1.52 4.5 5.9 Singapore 60 56 8.3 45.5 1.7 93.3 5.0 10.0 15.0 11.7 1.7 1.82 10.0 35.5 rest of Asia/Pacific 119 97 109.9 296.6 16.0 69.7 23.5 57.1 80.7 47.9 10.9 3.30 63.9 20.8
N & S America 110 105 128.5 228.1 9.1 18.2 78.2 86.4 92.7 78.2 9.1 5.16 97.3 5.4 Canada 33 33 83.4 195.6 3.0 30.3 66.7 81.8 100.0 75.8 18.2 6.30 97.0 9.2 Mexico 27 24 142.5 193.2 0.0 11.1 81.5 88.9 88.9 81.5 0.0 4.76 96.3 4.8 rest of N/S America 50 48 128.0 268.3 18.0 14.0 84.0 88.0 90.0 78.0 8.0 4.57 98.0 3.2
Africa/Middle East 99 78 24.7 77.1 4.0 30.3 56.6 67.7 84.8 59.6 4.0 5.64 74.7 14.7 Israel 50 45 20.3 30.1 0.0 0.0 84.0 88.0 100.0 82.0 2.0 7.29 90.0 8.9 South Africa 19 13 3.6 172.4 0.0 78.9 15.8 21.1 21.1 15.8 0.0 2.08 21.1 35.5 rest of Africa/M East 30 20 45.3 95.0 13.3 50.0 36.7 63.3 100.0 50.0 10.0 4.23 83.3 11.3
Total sample 2,132 1,629 32.9 156.1 9.1 74.5 17.8 31.4 55.7 28.4 4.8 3.67 61.5 20.1 We have spread information for 1,629 of the 2,132 sample companies. Underpricing is the percentage return from the (institutional) offer price to the trading price one week after the IPO. All other variables are as defined in Table 1. IPOs by countries not shown are as follows. Rest of W Europe: Austria (29), Belgium (53), Denmark (29), Finland (28), Greece (12), Ireland (16), Luxembourg (4), Malta (1), Norway (16), Portugal (15), Spain (30), Switzerland (39). Rest of E Europe: Estonia (1), Hungary (21), Poland (19), Romania (2), Russia (2). Rest of N/S America: Argentina (15), Bermuda (8), Brazil (8), Cayman Islands (4), Chile (4), Colombia (2), Dominican Republic (1) Netherlands Antilles (2), Panama (1), Puerto Rico (1), Uruguay (1), Venezuela (3). Rest of Asia/Pacific: Australia (21), Indonesia (25), Kazakhstan (1), South Korea (1), New Zealand (6), Pakistan (1), Papua New Guinea (2), the Philippines (26), Taiwan (14), Thailand (22). Rest of Africa/Middle East: Bahrain (1), Cyprus (1), Egypt (4), Ghana (1), Kenya (1), Lebanon (3), Liberia (3), Malawi (1), Turkey (14), Zimbabwe (1).

36
Table 4. Descriptive statistics: Industry distribution.
Gross proceeds (US$ m)
Privati- zation
Listing and marketing (fraction %)
Syndicate (fraction %)
Book-building
total no. of obs.
no. of obs w/ spread
info
median
mean fraction (%)
... listed domestically only
... listings include
U.S.
... target market
includes U.S.
... marketed
abroad
... using a senior
U.S. bank
... using a junior
U.S. bank
gross spread (mean
%)
fraction (%)
under pricing (mean
%) Industry IT 294 209 20.1 41.3 0.7 75.9 19.0 26.2 54.8 24.8 2.0 4.69 73.1 32.6 Retailing/Consumer Goods 144 115 28.2 96.5 2.8 85.4 11.8 26.4 41.7 25.7 7.6 3.16 52.8 15.9 Electronics/Electrical Goods 139 103 23.3 47.0 2.2 79.1 12.9 21.6 48.2 20.1 2.2 3.88 61.9 17.6 Manufacturing 128 94 27.9 56.7 8.6 80.5 11.7 20.3 54.7 16.4 3.9 3.56 53.9 17.6 Telecoms 127 105 145.1 821.3 17.3 41.7 49.6 66.9 82.7 66.1 3.1 4.07 78.7 22.1
Food & Drink 102 70 31.1 60.8 4.9 85.3 8.8 24.5 57.8 22.5 9.8 3.45 67.6 11.6 Healthcare/Pharmaceuticals 94 67 28.8 65.5 4.3 72.3 22.3 31.9 52.1 27.7 6.4 4.51 57.4 14.0 Media & Publishing 87 72 30.4 119.4 3.4 78.2 16.1 25.3 48.3 25.3 1.1 3.79 58.6 36.6 Banking & Financial Svcs 84 62 75.9 293.6 21.4 65.5 21.4 40.5 67.9 39.3 4.8 3.30 66.7 25.0 Hotels & Leisure 82 62 19.4 85.3 3.7 93.9 3.7 8.5 32.9 9.8 1.2 2.96 45.1 31.4
Consultancies/Services 80 57 14.4 37.3 0.0 91.3 5.0 10.0 33.8 7.5 0.0 3.21 52.5 18.9 Real Estate 77 55 53.4 102.9 6.5 87.0 6.5 32.5 53.2 23.4 7.8 2.81 44.2 9.9 Engineering 73 58 46.5 142.3 13.7 65.8 23.3 38.4 57.5 30.1 4.1 3.66 56.2 11.9 Construction 65 56 22.8 109.9 6.2 80.0 10.8 29.2 46.2 21.5 12.3 2.58 46.2 6.4 Automotive 51 41 34.3 146.0 7.8 74.5 13.7 29.4 62.7 19.6 3.9 3.44 58.8 19.3
Transport & Shipping 50 42 32.0 55.0 10.0 68.0 16.0 34.0 52.0 24.0 12.0 3.40 48.0 17.2 Oil, Coal & Gas 48 38 81.8 300.5 22.9 58.3 39.6 54.2 66.7 50.0 0.0 4.17 64.6 12.9 Textiles & Clothing 44 33 26.9 52.0 9.1 77.3 6.8 20.5 59.1 18.2 9.1 3.16 65.9 21.2 Forest Products/Packaging 37 30 33.9 104.1 5.4 78.4 18.9 32.4 59.5 27.0 8.1 3.63 64.9 12.6 Energy/Utilities 33 29 207.6 402.4 48.5 54.5 30.3 63.6 78.8 60.6 6.1 3.59 81.8 20.1
other (23 classifications) 293 231 58.0 211.1 19.5 68.3 19.8 39.6 63.8 36.2 6.1 3.56 63.8 17.3 Total sample 2,132 1,629 32.9 156.1 9.1 74.5 17.8 31.4 55.7 28.4 4.8 3.67 61.5 20.1 IPOs are classified by the primary industry code assigned by Equityware. Equityware uses a total of 43 industry codes. This table shows the same information as Table 3 individually for the 20 industries with the most observations, and for the remaining firms as a group. All variables are as defined in Tables 1 and 3. Other industries are: Insurance (31), Industrials & Conglomerates (29), Rubber & Plastics (26), Chemicals (25), Biotechnology (22), Iron & Steel (21), Metals & Ores (20), Airlines (18), Glass & Ceramics (18), Mining (15), Luxury goods (12), Agribusiness (10), Financial corporate (9), Aerospace (8), Railways (6), Public Works/Public Services (6), Leasing companies (4), Investment Companies (4), Education (3), Tobacco (2), Building Societies (1), Local authority (1), Financial Trading & Dealing (1), and unclassified (1).

37
Table 5. Gross spreads on bookbuildings and fixed-price offers.
Book-buildings Fixed-price
offerings
no. of obs. w/ spread
info
gross spread (mean
%)
no. of obs. w/ spread
info
gross spread (mean
%)
t-test of difference in means
Europe 630 4.44 368 2.20 –22.31*** France 61 4.53 2 4.19 –0.26 Germany 164 4.70 10 4.09 –1.57 Italy 52 4.37 2 3.50 –1.15 Netherlands 52 4.59 2 3.55 –0.93 Sweden 25 4.46 2 2.92 –1.69 United Kingdom 82 4.45 332 2.01 –12.85*** rest of W Europe 160 4.15 16 3.83 –0.77 rest of E Europe 34 4.15 2 5.12 0.84
Asia Pacific 214 4.10 225 2.21 –14.41*** China 60 3.80 27 3.30 –1.40 Hong Kong 42 4.09 79 2.50 –6.34*** Japan 39 5.38 Malaysia 2 3.00 40 1.47 –4.22*** Singapore 5 5.07 50 1.51 –9.58*** rest of Asia/Pacific 66 3.57 29 2.65 –3.11*
N & S America 103 5.17 1 5.00 Canada 32 6.34 1 5.00 Mexico 24 4.75 rest of N/S America 47 4.58
Africa/Middle East 64 6.37 13 2.19 –6.07*** Israel 42 7.44 3 5.17 –2.05* South Africa 3 4.67 10 1.30 –5.01*** rest of Africa/M East 19 4.27
Total sample 1,011 4.56 607 2.21 –28.71*** Spread information is available for 1,011 bookbuildings and 607 fixed-price IPOs. Because of the small number, we drop the 11 auction-IPOs for which spread information is available. Their average spread is 2.98%. ***, **, * = significant at 0.1%, 1%, and 5% (two-sided), respectively.
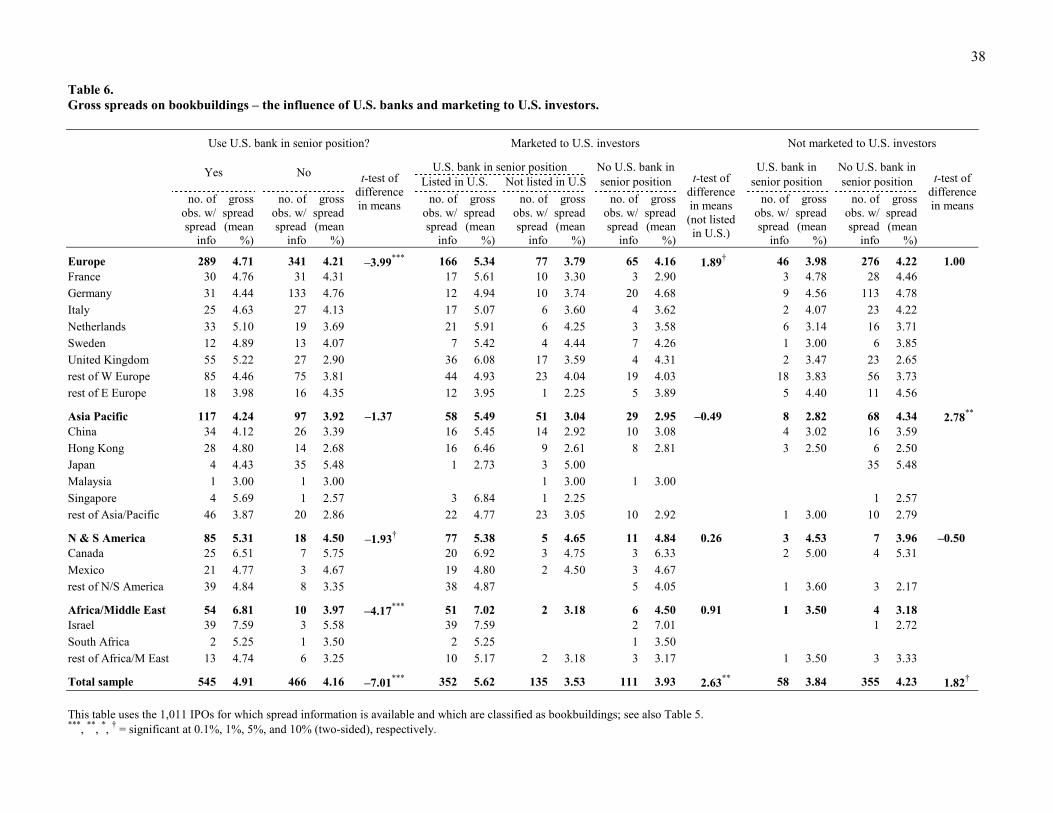
38
Table 6. Gross spreads on bookbuildings – the influence of U.S. banks and marketing to U.S. investors.
Use U.S. bank in senior position? Marketed to U.S. investors Not marketed to U.S. investors
U.S. bank in senior position No U.S. bank in U.S. bank in No U.S. bank in
Yes
No Listed in U.S. Not listed in U.S senior position senior position senior position
no. of obs. w/ spread
info
gross spread (mean
%)
no. of obs. w/ spread
info
gross spread (mean
%)
t-test of
difference in means
no. of obs. w/ spread
info
gross spread (mean
%)
no. of obs. w/ spread
info
gross spread (mean
%)
no. of obs. w/ spread
info
gross spread (mean
%)
t-test of
difference in means (not listed in U.S.)
no. of obs. w/ spread
info
gross spread (mean
%)
no. of obs. w/ spread
info
gross spread (mean
%)
t-test of
difference in means
Europe 289 4.71 341 4.21 –3.99*** 166 5.34 77 3.79 65 4.16 1.89† 46 3.98 276 4.22 1.00 France 30 4.76 31 4.31 17 5.61 10 3.30 3 2.90 3 4.78 28 4.46 Germany 31 4.44 133 4.76 12 4.94 10 3.74 20 4.68 9 4.56 113 4.78 Italy 25 4.63 27 4.13 17 5.07 6 3.60 4 3.62 2 4.07 23 4.22 Netherlands 33 5.10 19 3.69 21 5.91 6 4.25 3 3.58 6 3.14 16 3.71 Sweden 12 4.89 13 4.07 7 5.42 4 4.44 7 4.26 1 3.00 6 3.85 United Kingdom 55 5.22 27 2.90 36 6.08 17 3.59 4 4.31 2 3.47 23 2.65 rest of W Europe 85 4.46 75 3.81 44 4.93 23 4.04 19 4.03 18 3.83 56 3.73 rest of E Europe 18 3.98 16 4.35 12 3.95 1 2.25 5 3.89 5 4.40 11 4.56
Asia Pacific 117 4.24 97 3.92 –1.37 58 5.49 51 3.04 29 2.95 –0.49 8 2.82 68 4.34 2.78** China 34 4.12 26 3.39 16 5.45 14 2.92 10 3.08 4 3.02 16 3.59 Hong Kong 28 4.80 14 2.68 16 6.46 9 2.61 8 2.81 3 2.50 6 2.50 Japan 4 4.43 35 5.48 1 2.73 3 5.00 35 5.48 Malaysia 1 3.00 1 3.00 1 3.00 1 3.00 Singapore 4 5.69 1 2.57 3 6.84 1 2.25 1 2.57 rest of Asia/Pacific 46 3.87 20 2.86 22 4.77 23 3.05 10 2.92 1 3.00 10 2.79
N & S America 85 5.31 18 4.50 –1.93† 77 5.38 5 4.65 11 4.84 0.26 3 4.53 7 3.96 –0.50 Canada 25 6.51 7 5.75 20 6.92 3 4.75 3 6.33 2 5.00 4 5.31 Mexico 21 4.77 3 4.67 19 4.80 2 4.50 3 4.67 rest of N/S America 39 4.84 8 3.35 38 4.87 5 4.05 1 3.60 3 2.17
Africa/Middle East 54 6.81 10 3.97 –4.17*** 51 7.02 2 3.18 6 4.50 0.91 1 3.50 4 3.18 Israel 39 7.59 3 5.58 39 7.59 2 7.01 1 2.72 South Africa 2 5.25 1 3.50 2 5.25 1 3.50 rest of Africa/M East 13 4.74 6 3.25 10 5.17 2 3.18 3 3.17 1 3.50 3 3.33
Total sample 545 4.91 466 4.16 –7.01*** 352 5.62 135 3.53 111 3.93 2.63** 58 3.84 355 4.23 1.82†
This table uses the 1,011 IPOs for which spread information is available and which are classified as bookbuildings; see also Table 5. ***, **, *, † = significant at 0.1%, 1%, 5%, and 10% (two-sided), respectively.
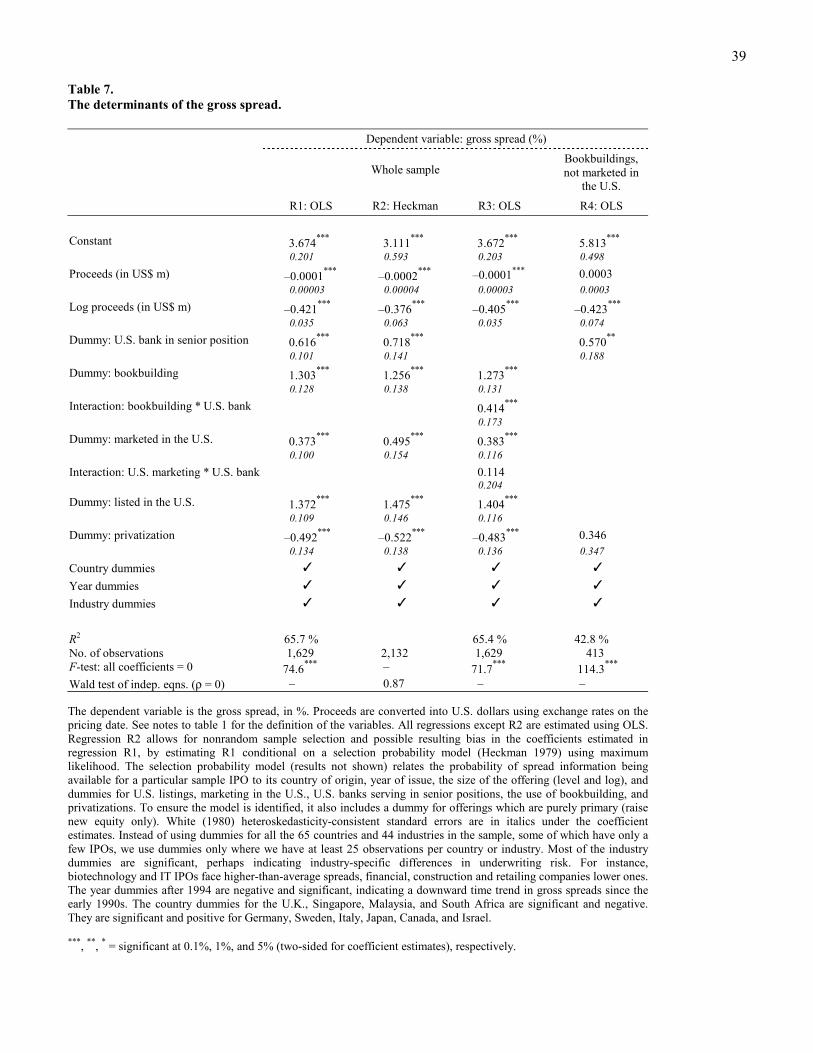
39
Table 7. The determinants of the gross spread.
Dependent variable: gross spread (%)
Whole sample
Bookbuildings, not marketed in
the U.S.
R1: OLS R2: Heckman R3: OLS R4: OLS
Constant 3.674*** 3.111*** 3.672*** 5.813*** 0.201 0.593 0.203 0.498
Proceeds (in US$ m) –0.0001*** –0.0002*** –0.0001*** 0.0003 0.00003 0.00004 0.00003 0.0003
Log proceeds (in US$ m) –0.421*** –0.376*** –0.405*** –0.423*** 0.035 0.063 0.035 0.074
Dummy: U.S. bank in senior position 0.616*** 0.718*** 0.570** 0.101 0.141 0.188
Dummy: bookbuilding 1.303*** 1.256*** 1.273*** 0.128 0.138 0.131
Interaction: bookbuilding * U.S. bank 0.414*** 0.173
Dummy: marketed in the U.S. 0.373*** 0.495*** 0.383*** 0.100 0.154 0.116
Interaction: U.S. marketing * U.S. bank 0.114 0.204
Dummy: listed in the U.S. 1.372*** 1.475*** 1.404*** 0.109 0.146 0.116
Dummy: privatization –0.492*** –0.522*** –0.483*** 0.346 0.134 0.138 0.136 0.347
Country dummies � � � � Year dummies � � � � Industry dummies � � � �
R2 65.7 % 65.4 % 42.8 % No. of observations 1,629 2,132 1,629 413 F-test: all coefficients = 0 74.6*** – 71.7*** 114.3*** Wald test of indep. eqns. (ρ = 0) – 0.87 – – The dependent variable is the gross spread, in %. Proceeds are converted into U.S. dollars using exchange rates on the pricing date. See notes to table 1 for the definition of the variables. All regressions except R2 are estimated using OLS. Regression R2 allows for nonrandom sample selection and possible resulting bias in the coefficients estimated in regression R1, by estimating R1 conditional on a selection probability model (Heckman 1979) using maximum likelihood. The selection probability model (results not shown) relates the probability of spread information being available for a particular sample IPO to its country of origin, year of issue, the size of the offering (level and log), and dummies for U.S. listings, marketing in the U.S., U.S. banks serving in senior positions, the use of bookbuilding, and privatizations. To ensure the model is identified, it also includes a dummy for offerings which are purely primary (raise new equity only). White (1980) heteroskedasticity-consistent standard errors are in italics under the coefficient estimates. Instead of using dummies for all the 65 countries and 44 industries in the sample, some of which have only a few IPOs, we use dummies only where we have at least 25 observations per country or industry. Most of the industry dummies are significant, perhaps indicating industry-specific differences in underwriting risk. For instance, biotechnology and IT IPOs face higher-than-average spreads, financial, construction and retailing companies lower ones. The year dummies after 1994 are negative and significant, indicating a downward time trend in gross spreads since the early 1990s. The country dummies for the U.K., Singapore, Malaysia, and South Africa are significant and negative. They are significant and positive for Germany, Sweden, Italy, Japan, Canada, and Israel. ***, **, * = significant at 0.1%, 1%, and 5% (two-sided for coefficient estimates), respectively.

40
Table 8. OLS and two-stage least squares underpricing regressions.
Whole sample Bookbuildings Domestic Model 1 Model 2 Model 3 Model 4 Model 5 Model 6 OLS OLS Multinomial logit 2SLS OLS Bivariate probit 2SLS Probit 2SLS
Stage 1: Multinomial logit Bivariate probit Probit Bookbuilding and U.S. … U.S. bank Marketed U.S. bank 1) bank ✕
investors ✕ 2) bank �
investors ✕ 3) bank ✕
investors � 4) bank �
investors � in senior
position? to U.S.
investors? in senior
position?
Constant –1.706*** –5.537*** –7.161*** –6.315*** –2.289*** –2.453*** –3.427*** 0.466 0.905 0.938 0.612 0.330 0.289 0.532 Proceeds (in US$ m) –0.003** –0.0008* –0.006*** –0.0007*** 0.0009* –0.0001* 0.001† 0.001 0.0004 0.002 0.0001 0.0004 0.00005 0.0006 Log proceeds (in US$ m) 0.778*** 1.496*** 1.952*** 1.847*** 0.534*** 0.621*** 0.481*** 0.099 0.162 0.209 0.107 0.063 0.047 0.125 Dummy: Privatization –0.012 –0.218 0.067 –1.033** –0.358* –0.316* 0.497* 0.350 0.485 0.400 0.337 0.163 0.157 0.214 Country/year/industry dummies � � � � � � �
Pseudo-R2: 44.3% bivariate? (χ2): 169.0*** Pseudo-R2: LR test (χ2): 2,547.1*** ρ = 78.7 %*** 31.6%

41
Stage 2: OLS with IV OLS with IV OLS with IV
Constant 0.283*** 0.270*** 0.394*** 0.274*** 0.384*** 0.347*** 0.057 0.057 0.088 0.066 0.089 0.113 Dummy: Bookbuilding 0.024 0.032 Dummy: U.S. bank (senior) –0.046* –0.273† 0.023 0.160 Dummy: Marketed to U.S. investors –0.128*** 0.027 Bookbuilding and U.S. … 1) … bank ✕ , investors ✕ 0.046 –0.072 0.036 0.105 2) … bank � , investors ✕ –0.096* –0.392 –0.142** –0.066 0.048 0.257 0.050 0.303 3) … bank ✕ , investors � –0.139*** –0.388* –0.188*** –0.499† 0.034 0.166 0.040 0.260 4) … bank � , investors � –0.121*** –0.261*** –0.169*** –0.348*** 0.028 0.062 0.034 0.088 Dummy: Privatization 0.094* 0.090* 0.113* 0.062 0.069 –0.047 0.042 0.042 0.045 0.047 0.048 0.107 Price revision 0.541* 0.540* 0.578* 0.523* 0.566* 1.497***
0.251 0.251 0.280 0.251 0.278 0.427 Country/year/industry dummies � � � � � �
R2 13.4 % 13.4 % 13.5 % 15.5 % 15.4 % 20.2 % No. of observations 2,132 2,132 2,132 1,312 1,312 685 The dependent variable in all OLS regressions and in the second stages of the 2SLS regressions is underpricing, the percentage return from the (institutional) offer price to the trading price one week after the IPO. Price revision is the percentage change between the midpoint of the initial price range and the offer price. White (1980) heteroskedasticity-consistent standard errors are reported in italics under the coefficient estimates. Model 1 estimates an OLS regression of underpricing on the full set of explanatory variables. Model 2 replaces the dummies for bookbuilding, choice of U.S. bank, and marketing to U.S. investors in Model 1 with four interaction terms equal to one if a bookbuilding involves 1) neither a U.S. bank nor U.S. investors, 2) a U.S. bank but no U.S. investors, 2) U.S. investors but no U.S. bank, and 4) both a U.S. bank and U.S. investors. The regression constant captures fixed-price (and auction) offerings. Model 3 allows for the possible endogeneity of the choice between fixed-price offerings and the four alternatives 1)-4) in Model 2 using a two-stage methodology to obtain consistent estimates. Stage 1 estimates a multinomial logit of the probability of a firm choosing any of alternatives 1)-4) rather than a fixed-price offering. The explanatory variables are the level and natural log of gross proceeds (in million US$), a dummy equal to one for privatizations, and a full set of country, year and industry dummies. Stage 2 uses the predicted probabilities from stage 1 as instrumental variables for alternatives 1)-4) in a least-squares regression with underpricing as the dependent variable. Model 4 re-estimates Model 2 for the sub-sample of bookbuildings. Model 5 again allows for the endogeneity of the choice variables using two-stage estimates. Stage 1 estimates a bivariate probit which allows for the interdependence of a firm’s choice of hiring a U.S. bank and having its IPO marketed to U.S. investors. Stage 2 uses the predicted probabilities from stage 1 as instrumental variables for alternatives 2)-4) in an OLS regression with underpricing as the dependent variable. Model 6 is a probit 2SLS model estimated over the subsample of bookbuildings which are not marketed in the U.S. Stage 1 estimates the probability of hiring a U.S. bank in such offerings. ***, **, *, † = significant at 0.1%, 1%, 5% or 10% (two-sided), respectively.